Abstract
Accurately recognizing student classroom behaviors is essential for analyzing teacher–student interactions and enabling intelligent educational assessment. Although deep learning offers promising solutions, existing methods often perform poorly in complex classroom environments due to occlusions and subtle, overlapping actions. To address these issues, this article proposes a robust and efficient method for behavior recognition by enhancing the You Only Look Once version 8 (YOLOv8) architecture with a Multi-Head Self-Attention (MHSA) module, termed YOLOv8-MHSA. The integration of MHSA allows the model to capture contextual relationships between distant spatial features, which is critical for distinguishing similar behaviors. For a comprehensive evaluation, we also implement a model with Coordinate Attention (CA). Experimental results on a standard dataset demonstrate the superiority of our YOLOv8-MHSA model, which achieves a precision of 0.86, recall of 0.807, mAP50 of 0.855, and mAP50-95 of 0.677, delivering competitive performance compared to the state-of-the-art SBD-Net. These findings validate that explicit contextual modeling via self-attention significantly boosts performance in fine-grained behavior recognition. Consequently, this research has direct potential applications in providing automated, data-driven tools for teacher training, classroom quality assessment, and, ultimately, supporting the development of personalized education systems.
1. Introduction
The rapid advancement of information technology has significantly transformed various sectors [1,2], including education. Among the most notable developments is the integration of Artificial Intelligence (AI) into educational environments, particularly for recognizing classroom behaviors [3,4,5]. Student behavior in the classroom not only reflects the effectiveness of teaching practices but also provides critical insights for evaluating instructional quality [6]. By systematically observing classroom behaviors, teachers can assess students’ levels of engagement and implement timely, targeted interventions to support those facing learning challenges. Traditional approaches to classroom observation and assessment rely heavily on manual recording and subjective judgment. These methods are now considered inadequate for providing real-time, comprehensive, and accurate analyses of student behavior [7,8,9]. As a result, the application of image processing and AI technologies to classroom behavior recognition has become a prominent area of research in education [10]. Leveraging advances in computer vision, deep learning, image restoration [11,12,13,14], and image enhancement [15], it is now possible to automatically identify diverse classroom behaviors. These innovations provide educators with more scientific, efficient, and effective tools for teaching evaluation.
Research on classroom student behavior is not only important for improving teaching quality, but it also has broader implications for personalized education and instructional optimization [16]. Real-time behavior recognition and analysis enable teachers to adjust teaching strategies, refine instructional content and methods, and ultimately enhance classroom efficiency [17,18,19,20]. Furthermore, systematic behavior recognition technologies provide students with more precise feedback, fostering self-directed learning and encouraging active participation [21]. The integration of big data and AI-driven analytics also offers evidence-based decision-making support for educational managers, thereby advancing educational reform and innovation [22,23].
Early research on student behavior analysis primarily relied on video-based action recognition techniques [24], which used temporal cues from sequential frames to infer dynamic behaviors. For example, Sharma et al. [25] combined eye movement, head pose, and facial emotion analysis to evaluate student engagement in e-learning environments. Similarly, Delgado et al. [26] developed a video dataset categorizing student engagement into three classes: Looking at paper, Looking at screen, and Wandering. Traditional approaches often used optical flow and spatiotemporal interest points to capture motion patterns. However, their high computational complexity and sensitivity to background noise limited their real-time use in crowded classroom environments.
Current approaches for detecting persistent classroom behaviors still rely heavily on video action recognition. However, this strategy faces practical challenges because it depends on large-scale annotated datasets. For instance, the Atomic Visual Actions (AVA) dataset [27] supports advanced frame-works such as SlowFast [28]. However, it requires labor-intensive labeling of more than 1.58 million samples, which creates major barriers to scalability and real-world deployment. Additionally, video-based recognition systems continue to struggle with action discernment. Benchmark datasets such as Charades [29] and Kinetics-400 [30] highlight critical limitations of existing methods. Actions are often misclassified because models rely too much on contextual or environmental cues instead of precise motion features. The emergence of deep learning has significantly transformed student behavior recognition by enabling end-to-end feature learning and improved generalization. Convolutional Neural Networks (CNNs) and transformer-based architectures now form the core of modern solutions. For example, Jisi et al. [31] enhanced feature extraction efficiency by combining spatial affine transforms with CNNs, achieving a recognition accuracy of 92.4% on the UCF-101 dataset. Lu Shi et al. [32] extracted discriminative spatiotemporal features for online English classroom behavior recognition, reporting a comprehensive recognition rate of 0.95 for different learning behaviors. Recently, Li et al. [33] proposed a method for student behavior analysis based on YOLOv5 and OpenPose. They detected the key points of the student’s body, and the key points of the key parts of the body by introducing coordinates for each student. The experimental results showed an average behavior recognition accuracy of 84.23%, and an overall location accuracy approximately of 79.6% on their constructed CQStu dataset. To detect student behaviors in complex and variable classroom environments, Sheng et al. [34] developed a framework based on an improved YOLOv8s. It incorporates a multi-scale large kernel convolution module and a progressive feature optimization module. Their model achieved mean Average Precision (mAP) values of 76.5% and 95.0% on the SCB-Dataset3-S and SCB-Dataset3-U datasets, respectively.
While video-based analysis has thrived, image-based recognition has received comparatively less attention, despite its importance for real-time monitoring. Rashmi et al. [35] pioneered this direction by deploying YOLOv3 on Closed-Circuit Television (CCTV) images to detect single-frame actions such as sleeping, eating, and phone usage. Similarly, Ali et al. [36] classified seven student actions using YOLOv3 and introduced a new image dataset, SUST_S_Act, for classroom behavior recognition. However, these early efforts struggled with challenges such as cluttered backgrounds and the detection of small objects. Recent research has sought to address these limitations. Li et al. [8] proposed an attention-based relational reasoning model that emphasized interactions between students and contextual objects (e.g., desks, devices). By dynamically weighting salient regions, their approach enhanced the recognition of human–object interactions in complex classroom environments, achieving a mAP of 30.59% on their collected video data from classes of different sizes. Zhang et al. [37] designed a dilated convolutional network for hand-raising gesture detection, which demonstrated high robustness to partial occlusions and achieved an mAP of 87.34%. The demand for deployable, real-time solutions also spurred advancements in model efficiency. Wang et al. [38] enhanced YOLOv7 by embedding attention mechanisms and augmenting training data, which substantially improved recognition accuracy, yielding an mAP 96.7% at 80 Frames Per Second (FPS). Chen et al. [39] further optimized YOLOv8 by integrating multi-head self-attention (MHSA) and Res2Net modules to enable multi-scale feature extraction in classroom scenarios. The framework, SBD-Net [17], achieved a balance between accuracy and computational efficiency. It incorporated focal modulation for multi-level feature fusion and ESLoss to address class imbalance. The model reached 82.4% mAP on the SCBehavior dataset with a lightweight computational cost of 9.8 Giga Floating-point Operations Per Second (GFLOPs).
Despite these advances, AI-based classroom behavior analysis still faces critical challenges, including limited algorithmic accuracy, real-time performance constraints, and scalability issues. Overcoming these challenges is essential to fully realize the potential of AI in education. To address these problems, this study proposes a new approach for classroom behavior recognition by integrating MHSA and Coordinate Attention (CA) modules into the YOLOv8 architecture. The integration produces two enhanced variants: YOLOv8-MHSA and YOLOv8-CA. A dedicated dataset of student classroom behaviors was first constructed, covering six common categories: raising hands, reading, leaning on the table, writing, using mobile phones, and bowing heads. The proposed models were then trained and systematically evaluated on this dataset.
The key contribution of this research lies in the fusion strategy that effectively embeds attention mechanisms into the YOLOv8 framework, leading to significant improvements in detection accuracy. Additional attention modules were also investigated, with comparative results showing that YOLOv8-MHSA consistently achieved the best performance. To ensure comprehensive evaluation, our models were further benchmarked against the recently proposed SBD-Net method. The novelty of YOLOv8-MHSA is its explicit global context modeling via MHSA. The approach effectively addresses the key challenges of fine-grained student behavior recognition, thereby outperforming models limited to local feature processing.
2. Dataset
2.1. Dataset Overview
The Student Classroom Behavior Dataset provides a fundamental basis for analyzing and modeling classroom interaction patterns, offering valuable empirical support for this research [4]. The dataset comprises approximately 2000 images, each capturing distinct student behaviors in real classroom environments. To ensure comprehensiveness and accuracy, the dataset is categorized into six representative behavior classes: raising hands, reading, using mobile phones, writing, bowing heads, and leaning against desks. These categories encompass common patterns of classroom activity and engagement. For effective model training and evaluation, the dataset is partitioned into training, validation, and test subsets in a 7:2:1 ratio. The training set, which constitutes the majority of the data, is used to develop the object detection model’s capacity to learn and recognize classroom behaviors. The validation set supports iterative fine-tuning by facilitating hyperparameter optimization, while the test set is reserved for assessing the model’s generalization ability in real-world classroom environments.
2.2. Dataset Annotation
Conducting essential statistical analyses, such as distribution assessments and visualizations, enables a clear understanding of the dataset’s characteristics. These analyses form the basis for selecting appropriate models and hyperparameters, thereby improving training efficiency and enhancing generalization performance. The dataset has approximately 2000 images with 24,929 annotated examples of student behaviors. These include: Hand-raising (1652 samples), Reading (10,067 samples), Writing (3746 samples), Using phone (7400 samples), Bowing the head (979 samples), and Leaning over the table (1085 samples), as shown in Figure 1. Although the sample sizes vary across categories, the dataset achieves comprehensive coverage of diverse classroom behaviors, ensuring robust support for model training and evaluation in real-world educational contexts. Figure 2 presents the spatial distribution of bounding box centers across the dataset. The coordinates reveal that most behaviors happen near the center of the image—the x-axis values mostly between 0.4 and 0.6, while the y-axis values between 0.1 and 0.3. This indicates that most student behaviors occur in central regions of the classroom scene, providing critical insight into the positional characteristics of the dataset. Figure 3 illustrates the distribution of bounding box sizes. Both widths and heights are predominantly concentrated around 0.2 relative to image dimensions, with a consistent range of target scales. It also highlights the distribution of aspect ratios (height-to-width ratios), offering valuable information about the geometric properties of annotated objects. Such insights are essential for guiding anchor box selection, improving model convergence, and optimizing detection accuracy.
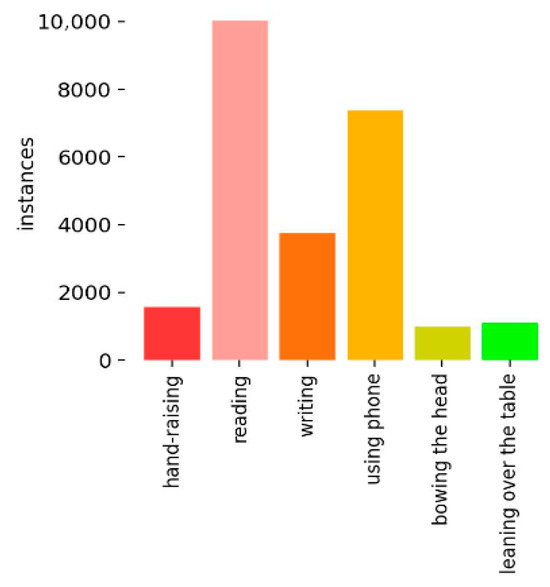
Figure 1.
Distribution of Categories in the Dataset.
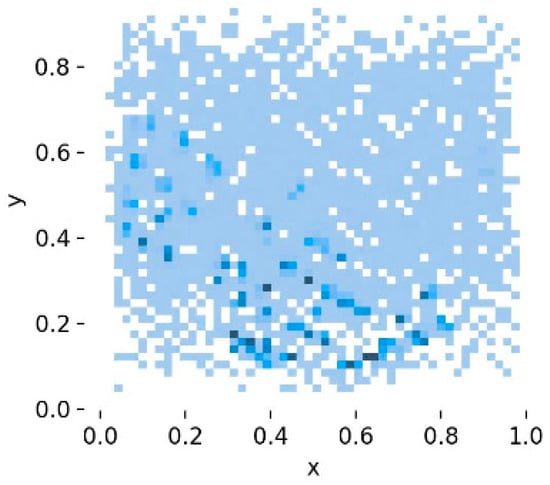
Figure 2.
Bounding Box Center Coordinates in the Dataset. The deeper the blue, the more data points there are at that location, indicating a higher density.
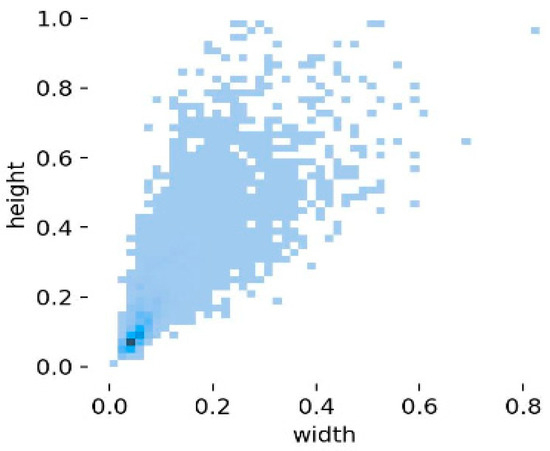
Figure 3.
Distribution of Bounding Box Dimensions (Height/Width). The deeper the blue, the more data points there are at that location, indicating a higher density.
3. Methods
3.1. YOLOv8 and Its Network Structure
YOLOv8 (v8.2.103) is a state-of-the-art real-time object detection algorithm that extends the remarkable progress achieved by earlier models in the YOLO series. It incorporates a more sophisticated network architecture, an optimized training strategy, and enhanced feature extraction mechanisms, thereby substantially improving detection accuracy while maintaining high processing speed. One of the key innovations of YOLOv8 lies in its improved multi-scale prediction mechanism and adaptive anchor box optimization, which enable the model to effectively detect objects of varying sizes and achieve more precise localization. These advancements ensure robustness in handling complex detection scenarios without compromising efficiency. Furthermore, YOLOv8 retains the hallmark advantage of the YOLO family, real-time detection performance, and delivers high frame rates even on low-end hardware platforms, making it highly deployable in practical applications. In summary, YOLOv8 stands out for its real-time efficiency, high detection accuracy, multi-scale prediction capability, and adaptive anchor box design. Owing to these advantages, it is widely adopted in diverse industries for tasks like object detection and localization, quality inspection, and automated process control.
The network structure of YOLOv8 is mainly composed of the following three key components:
Backbone: It employs a series of convolutional and deconvolutional layers to extract multi-level features, incorporating residual connections and bottleneck structures to reduce computational complexity while preserving high accuracy. At its core, the architecture adopts the C2f module as the primary building block. Compared with the C3 module used in YOLOv5, the C2f module offers fewer parameters while enhancing feature extraction efficiency. The backbone of YOLOv8 is composed of five convolutional blocks, four C2f modules, and one Spatial Pyramid Pooling-Fast (SPPF) module (Figure 4). This design enables the backbone to capture both fine-grained and high-level semantic information, thereby laying a strong foundation for robust object detection.

Figure 4.
Backbone part.
Neck: The Neck module employs a multi-scale feature fusion mechanism to aggregate feature maps from different hierarchical layers of the Backbone, thereby enhancing the model’s overall representational capacity. In YOLOv8, the Neck integrates three key components: the SPPF module for efficient multi-scale context aggregation, the Probability Anchor Assignment module for dynamic and adaptive anchor allocation, and two Path Aggregation Network (PAN) modules for bidirectional feature propagation. These components strike a balance between feature extraction granularity and fusion efficiency, enabling the model to maintain high accuracy when detecting objects across diverse scales. The workflow schematic of the Neck module is illustrated in Figure 5a–c.
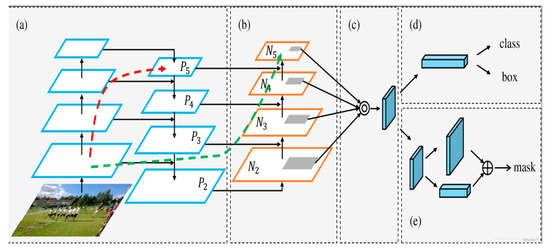
Figure 5.
Schematic flow chart of part of Neck. (a) Feature Pyramid Network (FPN) structure; (b) Path Aggregation Network (PAN) structure; (c) Fused feature layers; (d) Detection Head (class: classification prediction branch, box: bounding box prediction branch); (e) Mask prediction branch (mask: mask prediction result).
The operations of the Neck module proceed as follows: the outputs P3, P4, and P5 from the Backbone are first fed into the PAN-FPN architecture to facilitate multi-scale feature fusion. Specifically, P5 is upsampled and fused with P4 to generate feature map F1. F1 then passes through a C2f layer, after which it is upsampled again and fused with P3, resulting in T1. T1 is further processed by a convolutional layer and fused with F1 to produce F2. Passing F2 through a C2f layer yields T2, which is then processed by another convolutional layer and fused with P5 to form F3. Finally, F3 passes through a C2f layer to generate T3. The outputs T1, T2, and T3 together constitute the final results of the Neck module.
Head: The Head module is responsible for the final object detection and classification tasks. It comprises two dedicated components: A detection head and a classification head. The detection head, consisting of convolutional and deconvolutional layers, performs bounding box regression and generates detection outputs. The classification head summarizes feature maps to predict the object categories. While the Backbone and Neck function primarily as feature extraction and preparation stages, the Head acts as the task-specific module that delivers the ultimate detection results. The hierarchical feature maps (T1, T2, and T3) output from the Neck are fed into the Head, where they undergo task-specific operations (e.g., bounding box localization and class probability estimation) to produce the final detection outcomes. The network architecture of the YOLOv8 Head is illustrated in Figure 6.
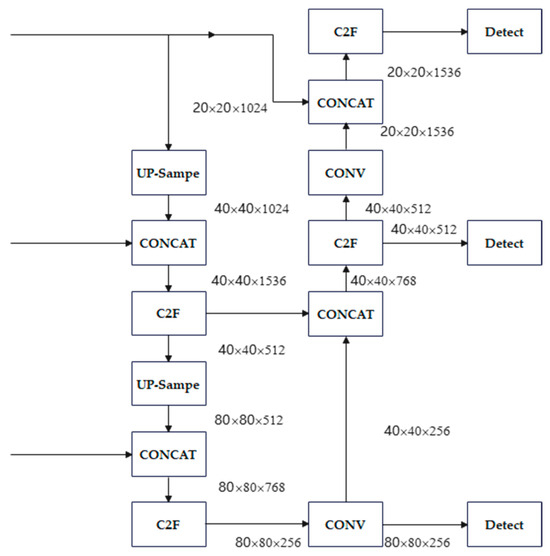
Figure 6.
Head layer schematic.
3.2. Attention Mechanism
The attention mechanism is a computational paradigm inspired by the human visual system. Its fundamental principle is to enable models to selectively focus on the most task-relevant information within a large volume of input data. Just as human vision prioritizes salient regions of a scene rather than processing all visual stimuli equally, attention mechanisms emulate this selectivity by assigning varying importance (weights) to different features. By incorporating this selective weighting process, machine learning models can dynamically highlight informative features while suppressing less relevant ones. This not only enhances the efficiency of information processing but also improves accuracy, particularly in complex tasks such as machine translation, image recognition, and natural language processing (NLP). As a result, attention mechanisms have become a critical tool in modern deep learning, widely recognized for their ability to significantly boost model performance. In this study, we enhance classroom behavior recognition by embedding two complementary attention mechanisms (e.g., CA and MHSA) into the YOLOv8 architecture. These modules allow the model to capture both spatially aware and context-rich representations, thereby improving the detection accuracy of subtle and complex student behaviors in real-world classroom environments.
3.3. MHSA Mechanism
MHSA, first introduced by Vaswani et al. [40], is a pivotal attention mechanism in deep learning. Its core strength lies in its ability to automatically capture dependencies within sequences, thereby enhancing contextual understanding and overall model performance. The mechanism operates by projecting the input data into multiple feature subspaces through linear transformations. Each projection is then processed in parallel by independent attention heads, with each head focusing on different aspects or relationships within the data. This parallel attention process enables the model to learn diverse contextual representations, which are subsequently aggregated to form a comprehensive understanding of the input. By integrating multiple perspectives, MHSA improves model flexibility and expressiveness. It has demonstrated remarkable effectiveness in NLP applications such as machine translation, sentiment analysis, and document classification, and has also been extended to vision tasks for capturing long-range dependencies and complex spatial relationships.
3.4. Construction of the YOLOv8-MHSA Model
By incorporating the attention mechanism, the model can dynamically reweight feature representations, effectively distinguishing between informative target features and background noise. This enhances the network’s ability to extract meaningful information from feature maps, improving detection accuracy. In this study, we integrate the MHSA block into the YOLOv8 architecture, resulting in an enhanced detection model, termed YOLOv8-MHSA. The network architecture of YOLOv8-MHSA is illustrated in Figure 7. As shown, the MHSA block (highlighted with a red rectangular border) is positioned between the C2f block and the Up-Sample block.
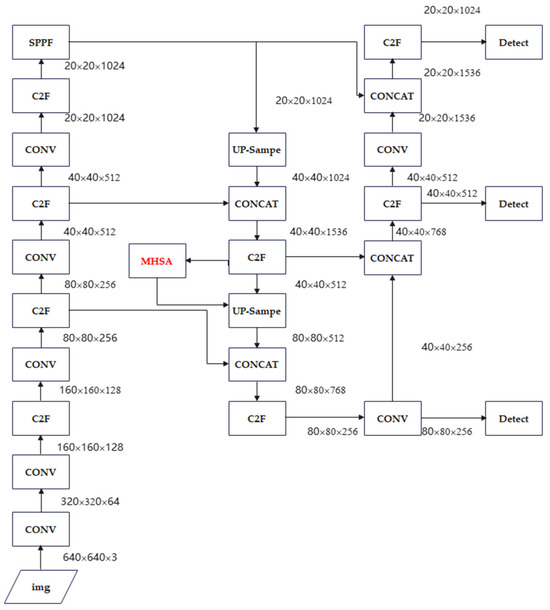
Figure 7.
YOLOv8-MHSA network structure.
The MHSA block is applied in the Head module after multi-scale feature fusion. It receives feature maps with C = 512 channels, following the concatenation of P3, P4, and P5 features. The block computes queries (Q), keys (K), and values (V) through linear projections. The input is then split into h = 4 attention heads, each with a dimension of dₕ = C/h = 128. The attention for each head is subsequently calculated as
The outputs from all attention heads are concatenated and projected back to C = 512 channels. This head-level MHSA block provides global contextual information across the fused multi-scale features, enhancing the model’s ability to detect objects with complex shapes or in crowded scenes. Because the block operates on high-level feature maps with relatively low spatial resolution, the additional computational overhead is modest, while the network benefits from significantly improved modeling of long-range dependencies.
3.5. CA Attention Mechanism
The Channel Attention (CA) mechanism is an advanced deep learning attention approach that incorporates spatial location information into channel-wise feature weighting. It operates in two main steps: first, spatial information is embedded by aggregating features along the vertical and horizontal directions using 1D global pooling; second, an attention map with spatial orientation awareness is generated and applied to the original feature map, emphasizing salient representations. The CA mechanism is illustrated in Figure 8. Specifically, given an input feature map of size [C, H, W], the spatial information is decomposed along the height and width dimensions through separate average pooling operations. Pooling along the width generates a C × H × 1 feature map, while pooling along the height yields a C × 1 × W feature map. These directional features are concatenated to form a C × 1 × (H + W) feature map, which is then processed through a shared 1 × 1 convolutional layer with channel reduction (C/r), followed by batch normalization and a non-linear activation. The processed feature map is split back into height (C/r × 1 × H) and width (C/r × 1 × W) components. Each branch undergoes an independent 1 × 1 convolution, followed by a sigmoid activation, producing attention weights for the height dimension ([C, H, 1]) and width dimension ([C, 1, W]). Finally, these attention weights are multiplied with the original feature map, effectively implementing the CA mechanism and enhancing the network’s ability to selectively focus on important features across both spatial dimensions during the recognition process.
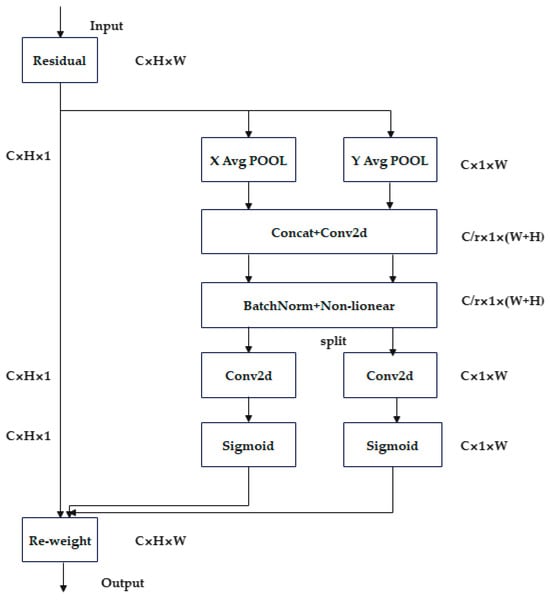
Figure 8.
CA mechanism.
3.6. Construction of the YOLOv8-CA Model
The CA mechanism effectively enhances deep learning model performance by adaptively integrating spatial and channel-wise information. Its key advantages lie in location sensitivity and flexibility, allowing seamless integration into diverse network architectures while improving both feature representation and detection accuracy. In this study, the CA module is incorporated into the YOLOv8 network, resulting in an enhanced model termed YOLOv8-CA.
The standard CA module is inserted after the deepest C2f block and before the SPPF block, as illustrated in Figure 9. The CA block receives an input feature map
and first performs pooled encodings along the height and width dimensions. These pooled features are projected via a 1 × 1 convolution into a bottleneck with size
= ⌊C/reduction⌋ (here, reduction = 32). The module then decodes two separate attention maps for the height and width dimensions, which are gated using a sigmoid activation and applied to the original feature map. Mathematically, this process can be expressed as
where
and
are the learned mapping functions that produce
and
the attention maps.
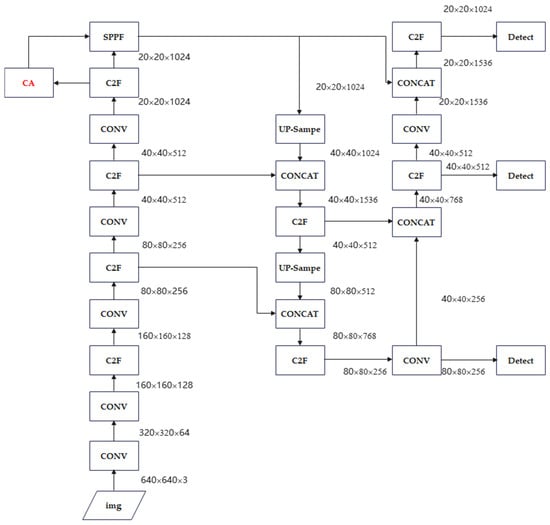
Figure 9.
YOLOv8-CA network structure.
This module introduces approximately
additional parameters (around 98 k parameters for C = 1024 and reduction = 32), representing a lightweight computational overhead. Empirically, it enhances object localization while keeping FLOPs modest. The design follows the canonical CA structure, which includes pooling along the height and width dimensions, 1 × 1 convolutional projection, ReLU activation, two 1 × 1 decoding layers, and sigmoid gating to generate the attention maps.
The YOLOv8-CA model dynamically adjusts feature weights between target and background (noise) information by integrating the CA mechanism. This optimization strategy significantly enhances the network’s ability to identify and extract relevant target features from the feature map, leading to improved detection accuracy, particularly for small or challenging objects in complex classroom scenes.
3.7. Loss Function
In our models, the overall training loss is formulated as a weighted sum of box regression loss, classification loss, and distribution focal loss (DFL). Specifically, the CIoU loss is adopted for bounding box regression, binary cross-entropy (BCE) loss for classification, and DFL for precise distribution-based localization. The loss function is expressed as
where the default weights are set as
,
following the official YOLOv8 configuration.
The bounding box regression loss is formulated based on the Intersection over Union (IoU) metric. Given a predicted bounding box
and its corresponding ground truth
, the loU is defined as the ratio between the intersection and union areas of the two boxes. Formally, the bounding box loss is expressed as
Let b and
denote the coordinates of the predicted and ground-truth bounding boxes, respectively, and let
represent the Euclidean distance between their center points. The term c denotes the diagonal length of the smallest enclosing box covering both b and
. To account for aspect ratio consistency, we define
where
and
correspond to the width and height of the predicted and ground-truth boxes, respectively. A weighting factor
is then computed as
This formulation jointly considers the box center distance, scale, and aspect ratio consistency, thereby improving the accuracy of bounding box regression.
The distribution focal loss (DFL) guides the network to accurately predict bounding box coordinates by comparing the predicted discrete distributions
with the ground truth soft labels
. It is implemented as a focal-style cross-entropy loss over
discrete bins for each predicted box, emphasizing bins closer to the true target and penalizing deviations, thereby improving localization precision. Formally, the distribution focal loss is expressed as
where
denotes the predicted coordinate distribution probability, represented as a discrete distribution of length
. Let
represent the ground-truth soft label distribution, generated via distance-based interpolation. Here,
denotes the number of predicted bounding boxes. This formulation allows the loss to capture the discrepancy between the predicted and true coordinate distributions for all bounding boxes.
For multi-class object detection, the classification loss supervises the network to predict accurate class probabilities for each object. It is formulated as a binary cross-entropy (BCE) function between the predicted class probabilities
and the ground-truth labels
over
classes, effectively penalizing discrepancies and encouraging correct classification. Formally, the classification loss is expressed as
where
denotes the ground-truth label for the
-th class, and
represents the predicted probability. Here,
denotes the total number of classes. This formulation allows the classification loss to measure the discrepancy between the predicted probabilities and the true binary labels across all classes.
3.8. Implementation Details
The YOLOv8-based detection models are implemented in PyTorch 1.11. and trained for 200 epochs on an NVIDIA RTX 3090 GPU. Training is conducted with a batch size of 16 and 8 data-loading workers, ensuring efficient GPU utilization while maintaining stable memory consumption. Stochastic Gradient Descent is used for optimization, with an initial learning rate (lr0) of 0.01 and a final learning rate factor (lrf) of 0.01, following a linear learning rate schedule to gradually reduce the step size during training. To enhance model generalization and robustness, several data augmentation strategies are employed. Mosaic augmentation is applied with a probability of 1.0, enriching the diversity of training samples by combining multiple images. Additionally, color-space augmentations are performed using HSV transformations, where the hue, saturation, and value components are randomly adjusted with magnitudes of 0.015, 0.7, and 0.4, respectively. Spatial augmentations include a horizontal flip with a probability of 0.5, while vertical flipping is disabled (flipud = 0.0) to better match the distribution of the target dataset.
4. Results
To evaluate the performance of our proposed methods in recognizing students’ classroom behaviors, YOLOv8-MHSA and YOLOv8-CA are tested on the reserved test dataset. The performance of these enhanced models is compared not only with the baseline YOLOv8 but also with several state-of-the-art variants, including YOLOv8-CBAM, YOLOv8-SimAM, YOLOv8-ECA, and YOLOv8-SE, to comprehensively assess their effectiveness in classroom behavior recognition.
4.1. Comparison with the Benchmark YOLOv8 Model
After 200 training epochs, all models exhibit clear performance convergence. The convergence behavior of the YOLOv8-CA model is illustrated in Figure 10, where key evaluation metrics demonstrate stable and consistent trends. Accordingly, all results reported in this study were obtained after completing 200 training epochs.
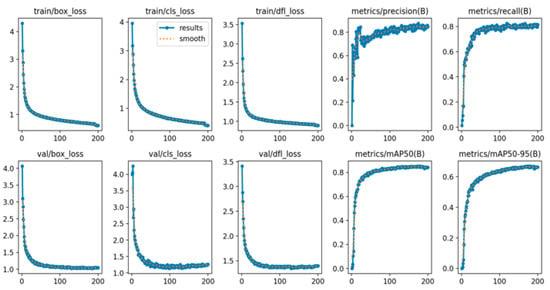
Figure 10.
The results of YOLOv8-CA based on 200 epochs.
In this study, we employ three primary evaluation metrics, Precision, Recall, and mean Average Precision (mAP), to assess model performance. Precision, also known as the positive predictive value, measures the accuracy of positive predictions. Recall, also referred to as the true positive rate, evaluates the model’s ability to identify all actual positive instances. mAP is a comprehensive metric commonly used in object detection tasks, integrating both localization and classification performance into a single score. Based on these metrics, the performance results of the evaluated models on the test dataset are presented in Table 1.

Table 1.
Comparison of YOLOv8, YOLOv8-MHSA and YOLOv8-CA.
The baseline YOLOv8 model achieves a precision of 84% on the test dataset, indicating that 84% of its detections are correct. Its recall rate reaches 80.7%, demonstrating the model’s ability to successfully identify 80.7% of all actual positive instances. Additionally, the mAP50 (mAP at an IOU threshold of 0.5) attains 84.2%, reflecting robust overall detection performance across all categories. After incorporating CA or MHSA attention mechanisms, all metrics show measurable improvement. For YOLOv8-MHSA, precision increases from 0.84 to 0.86, and mAP50 rises from 0.842 to 0.855. For YOLOv8-CA, precision improves slightly from 0.84 to 0.843, while mAP50 increases from 0.842 to 0.850. These results highlight the effectiveness of attention mechanisms in enhancing feature extraction, improving detection accuracy, and optimizing overall model performance. While the standard convolutional layers in YOLOv8 have a limited receptive field, the Multi-Head Self-Attention (MHSA) module enables the model to weigh the importance of all pixels in a feature map against each other. This global contextual view is crucial for interpreting complex behaviors.
The detection results of YOLOv8-CA and YOLOv8-MHSA are presented in Figure 11 and Figure 12, respectively. The majority of student classroom behaviors are accurately identified, demonstrating the effectiveness of the enhanced attention mechanisms in capturing diverse and complex student actions. However, the models frequently fail to detect several students who are partially or completely occluded by objects or other students. For example, in images such as 40030210.jpg and 40020097.jpg, students sitting in back rows or behind classroom obstructions often remain undetected, especially when only small body parts (e.g., heads or shoulders) are visible. Detecting distant, small-scale students remains a significant challenge for the models. In cases such as 3001359.jpg and 1257022.jpg, students with minimal pixel area are missed, especially when they exhibit subtle behaviors. Non-standard postures (e.g., students leaning down, turning sideways, or adopting unusual sitting positions) in images like 3005164.jpg are sometimes misclassified or missed entirely. This indicates that the models fail to generalize to highly diverse human poses.
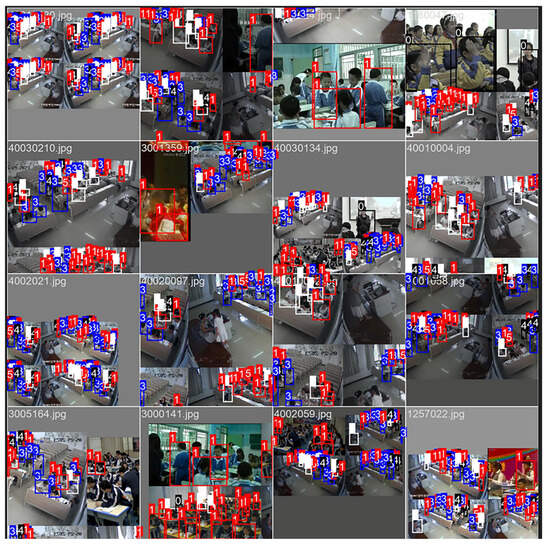
Figure 11.
The detection results of YOLOv8-CA model. The numbers in the image indicate the action categories the model has predicted for the students.
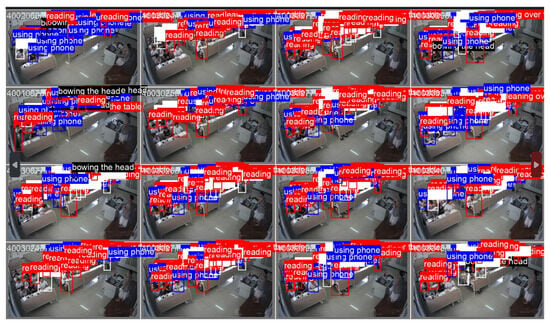
Figure 12.
The detection results of YOLOv8-MHSA model.
For practical deployment in educational environments, a model must balance accuracy with computational efficiency. We evaluate some essential metrics for real-world application, such as Frames Per Second (FPS), GPU memory usage, and latency. All metrics are measured on an NVIDIA RTX 3090 GPU with an input size of 640 × 640. YOLOv8-MHSA achieves 105 FPS, consumes 2.4 GB of GPU memory, and has a latency of 9.6 ms. In comparison, YOLOv8-CA performs better with 120 FPS, 1.6 GB memory usage, and 8.2 ms latency. Consequently, YOLOv8-MHSA achieves the higher accuracy but at a larger computational cost. Its FPS is less than that of YOLOv8-CA, and its memory footprint is significantly larger.
4.2. Comparison with Other Models
In this study, in addition to the CA and MHSA attention mechanisms, we also integrate Convolutional Block Attention Module (CBAM), Simple Attention Module (SimAM), Efficient CA (ECA), and Squeeze-and-Excitation (SE) attention mechanisms into the YOLOv8 model to evaluate their effects. Theoretically, incorporating these attention mechanisms enables the models to focus more effectively on critical aspects of the task, thereby enhancing both accuracy and efficiency. The resulting models are named YOLOv8-CBAM, YOLOv8-SimAM, YOLOv8-ECA, and YOLOv8-SE, respectively. The evaluation results, summarized in Table 2, indicate that models integrated with CA and MHSA achieve significant performance improvements, whereas the other attention mechanisms produced only marginal gains.

Table 2.
Comparison with other models.
Furthermore, we compared our models with the recent SBD-Net method proposed by Wang et al. [17], a lightweight and efficient framework for detecting student behaviors in classroom environments. SBD-Net leverages advanced computer vision techniques, including the FocalModulation module for multi-level feature fusion, the ESLoss function to address class imbalance, and the Dyhead structure to integrate multiple attention mechanisms without substantially increasing computational complexity. The comparison results, summarized in Table 2, indicate that YOLOv8-MHSA slightly outperforms SBD-Net in terms of the mAP metric.
These findings underscore the varying effectiveness of different attention mechanisms across evaluation metrics, suggesting that the choice of mechanism should be tailored to specific task requirements and dataset characteristics. Moreover, compared with this state-of-the-art method, our models continue to achieve competitive and robust performance in classroom behavior recognition.
5. Discussion
By introducing the MHSA mechanism, the YOLOv8-MHSA model successfully reconfigures feature weights for target and noise information in the feature map. This enhances the algorithm’s ability to extract relevant features, particularly improving the precision of small object detection. The model achieves the highest mAP, showing a significant improvement of 1.5% compared with the baseline YOLOv8. Additionally, YOLOv8-MHSA demonstrates modest gains in precision and mAP50-95 metrics. Similarly, after integrating the CA mechanism in YOLOv8-CA, the model’s mAP increases from 84.2% to 85%, representing a 0.8 percentage point improvement. This enhancement effectively mitigates YOLOv8′s limitations in detecting small and densely occluded targets, highlighting the significant role of attention mechanisms in optimizing model performance. While MHSA strengthens the model’s capability to capture global contextual relationships, resulting in higher precision and mAP, it introduces additional computational overhead. In contrast, the CA mechanism provides a lighter-weight design by emphasizing positional information, although the performance gains are comparatively modest. These differences indicate that the choice of attention module should be based on specific application needs. MHSA is better suited for accuracy-focused tasks, while CA is more appropriate for scenarios with limited computational resources.
Importantly, the improved recognition accuracy has significant implications for educational effectiveness. In smart classrooms, the recognition and analysis of classroom behaviors are particularly important. The dynamic assessment reports are generated through the real-time algorithmic recognition of behaviors such as classroom interaction, student participation, and attention focus. For example, cameras can capture behaviors such as the frequency of hand-raising, questioning and answering, or using mobile phones. When combined with knowledge graphs to analyze students’ interests and cognitive trajectories, this approach allows teachers to obtain immediate instructional feedback. If a student is detected rarely raising a hand or participating verbally, the teacher can provide immediate feedback to encourage more active involvement in class discussions. Thus, the models can serve as an instrument for formative assessment and teacher reflection. In summary, automated and precise behavior recognition can provide objective data for analyzing classroom interaction patterns, evaluating teaching strategies, and supporting personalized instruction [41]. However, accurately assessing educational impact requires interdisciplinary collaboration. It involves combining pedagogical theories with long-term empirical studies to connect behavioral insights with learning outcomes.
It should be noted, however, that the current study is constrained by the relatively small scale of the dataset used for training and evaluation. This limitation may reduce the model’s generalizability to more diverse educational environments and behavioral scenarios. To overcome this issue, future efforts will prioritize dataset expansion by incorporating more varied classroom environments, teaching styles, and interaction patterns. In addition, more data augmentation techniques and cross-institutional collaborations will be explored to increase both the quantity and diversity of training samples. These efforts are expected to enhance the model’s scalability and robustness across different educational scenarios.
A major limitation of this study is the lack of validation for real-time inference efficiency and model lightweighting, which are critical for practical deployment in classroom environments. Future work should focus on model compression via pruning, quantization, or knowledge distillation to facilitate deployment on edge devices. Additionally, exploring adaptive attention mechanisms through attention or neural architecture search could achieve a better balance between accuracy and computational cost.
6. Conclusions
This research introduces a novel approach for student action recognition using YOLOv8 enhanced with CA or MHSA modules. By integrating these attention mechanisms, the model can dynamically weight input features, thereby improving both the efficiency and accuracy of information processing. Additionally, we incorporated several other attention mechanisms into YOLOv8 to evaluate their effectiveness in classroom behavior recognition. The results demonstrate that YOLOv8-MHSA achieves the best overall performance in terms of Precision, Recall, and mAP, followed by YOLOv8-CA. Specifically, YOLOv8-MHSA attains a Precision of 0.86, Recall of 0.807, mAP50 of 0.855, and mAP50-95 of 0.677. To comprehensively evaluate our models, we compared them with the state-of-the-art SBD-Net method. The results indicate that the proposed algorithm framework significantly enhances the precision and efficiency of classroom interaction behavior analysis, providing technical support for intelligent teaching evaluation and personalized education. In practical teaching scenarios, teachers can receive real-time feedback, better understand students’ learning status, monitor classroom dynamics, and flexibly adjust teaching strategies using an AI-assisted system based on automatic behavior recognition.
Despite its promising performance, there remains room for improvement. While the proposed model effectively identifies basic classroom behaviors, detecting and analyzing students’ mental health issues, such as anxiety, depression, or autism, remains an open challenge. Several research directions could enhance the model’s practicality and impact: Lightweight deployment: Techniques such as model pruning, quantization, and neural architecture search could reduce computational cost and model size, facilitating real-time inference on edge devices. Hyperparameter optimization: Bayesian search or automated machine learning frameworks could further improve model robustness and generalization. Privacy-preserving training: Federated learning can enable model training across multiple institutions without sharing sensitive raw data, addressing privacy concerns in educational contexts. Multi-modal integration: Combining visual and audio signals to recognize emotional and mental states may provide a more comprehensive understanding of student engagement. Through continuous optimization of model architecture and parameters, the framework can achieve higher detection accuracy while reducing computational complexity and resource consumption. This makes it increasingly suitable for practical deployment in smart classrooms.
By pursuing these actionable pathways, future research can not only enhance technical performance but also expand the educational applicability of AI-driven behavior recognition, ultimately supporting intelligent teaching assessment and personalized learning in real-world classroom environments.
Author Contributions
Conceptualization, J.Z. and X.W.; methodology, L.G.; software, X.W.; validation, X.W. and L.G.; formal analysis, J.Z.; investigation, J.Z.; resources, X.W.; data curation, X.W.; writing—original draft preparation, L.G.; writing—review and editing, J.Z.; visualization, X.W.; supervision, J.Z.; project administration, J.Z.; funding acquisition, L.G. All authors have read and agreed to the published version of the manuscript.
Funding
This research was funded by Henan Provincial Research and Practice Project on Higher Education Teaching Reform grant number [2024JGLX0469].
Institutional Review Board Statement
Not applicable.
Informed Consent Statement
Not applicable.
Data Availability Statement
The data presented in this study are openly available in Figshare at https://doi.org/10.6084/m9.figshare.29979148, (accessed on 25 August 2025).
Conflicts of Interest
The authors declare no conflicts of interest.
References
- Wang, Z.; Yao, J.; Zeng, C.; Li, L.; Tan, C. Students’ Classroom Behavior Detection System Incorporating Deformable DETR with Swin Transformer and Light-Weight Feature Pyramid Network. Systems 2023, 11, 372. [Google Scholar] [CrossRef]
- Messeri, L.; Crockett, M.J. Artificial Intelligence and Illusions of Understanding in Scientific Research. Nature 2024, 627, 49–58. [Google Scholar] [CrossRef]
- Jiang, L.; Lu, X. Analyzing and Optimizing Virtual Reality Classroom Scenarios: A Deep Learning Approach. Trait. Signal 2023, 40, 2553–2563. [Google Scholar] [CrossRef]
- Yang, F. SCB-dataset: A dataset for detecting student classroom behavior. arXiv 2023, arXiv:2304.02488. [Google Scholar] [CrossRef]
- Dey, A.; Anand, A.; Samanta, S.; Sah, B.K.; Biswas, S. Attention-Based AdaptSepCX Network for Effective Student Action Recognition in Online Learning. Procedia Comput. Sci. 2024, 233, 164–174. [Google Scholar] [CrossRef]
- Perkins, C.J. Evidence-Based Classroom Observation Technique: An Interdisciplinary, Structured Approach to Classroom Observation. Nurs. Educ. Perspect. 2024, 45, 120–121. [Google Scholar] [CrossRef]
- Lu, Z.; Nishimura, Y. Telepresence Observation for Kindergarten Classroom Rating: A Pilot Study. IEEE Access 2024, 12, 32181–32191. [Google Scholar] [CrossRef]
- Li, Y.; Qi, X.; Saudagar, A.K.J.; Badshah, A.M.; Muhammad, K.; Liu, S. Student Behavior Recognition for Interaction Detection in the Classroom Environment. Image Vis. Comput. 2023, 136, 104726. [Google Scholar] [CrossRef]
- De Lima, J.Á.; Silva, M.J.T. Resistance to Classroom Observation in the Context of Teacher Evaluation: Teachers’ and Department Heads’ Experiences and Perspectives. Educ. Assess. Eval. Account. 2018, 30, 7–26. [Google Scholar] [CrossRef]
- Zhong, Z.; Guo, H.; Qian, K. Deciphering the impact of machine learning on education: Insights from a bibliometric analysis using bibliometrix R-package. Educ. Inf. Technol. 2024, 29, 16. [Google Scholar] [CrossRef]
- Jin, Z.; Qiu, Y.; Zhang, K.; Li, H.; Luo, W. MB-TaylorFormer V2: Improved Multi-Branch Linear Transformer Expanded by Taylor Formula for Image Restoration. IEEE Trans. Pattern Anal. Mach. Intell. 2025, 47, 5990–6005. [Google Scholar] [CrossRef]
- Wang, T.; Zhang, K.; Shao, Z.; Luo, W.; Stenger, B.; Lu, T.; Kim, T.-K.; Liu, W.; Li, H. GridFormer: Residual Dense Transformer with Grid Structure for Image Restoration in Adverse Weather Conditions. Int. J. Comput. Vis. 2024, 132, 4541–4563. [Google Scholar] [CrossRef]
- Zhang, K.; Li, D.; Luo, W.; Ren, W.; Liu, W. Enhanced Spatio-Temporal Interaction Learning for Video Deraining: A Faster and Better Framework. IEEE Trans. Pattern Anal. Mach. Intell. 2023, 45, 1287–1293. [Google Scholar] [CrossRef] [PubMed]
- Zhang, K.; Li, R.; Yu, Y.; Luo, W.; Li, C. Deep Dense Multi-Scale Network for Snow Removal Using Semantic and Depth Priors. IEEE Trans. Image Process. 2021, 30, 7419–7431. [Google Scholar] [CrossRef]
- Wang, T.; Zhang, K.; Shao, Z.; Luo, W.; Stenger, B.; Kim, T.-K.; Liu, W.; Li, H. LLDiffusion: Learning Degradation Representations in Diffusion Models for Low-Light Image Enhancement. Pattern Recogn. 2025, 166, 111628. [Google Scholar] [CrossRef]
- Holmes, J.; Guy, J.; Kievit, R.A.; Bryant, A.; Mareva, S.; Gathercole, S.E. Cognitive dimensions of learning in children with problems in attention, learning, and memory. J. Educ. Psychol. 2021, 113, 1454–1480. [Google Scholar] [CrossRef]
- Wang, Z.; Wang, M.; Zeng, C.; Li, L. SBD-Net: Incorporating Multi-Level Features for an Efficient Detection Network of Student Behavior in Smart Classrooms. Appl. Sci. 2024, 14, 8357. [Google Scholar] [CrossRef]
- Hou, J.; Xu, Y.; He, W.; Zhong, Y.; Zhao, D.; Zhou, F.; Zhao, M.; Dong, S. A Systematic Review for the Fatigue Driving Behavior Recognition Method. J. Intell. Fuzzy Syst. 2024, 46, 1407–1427. [Google Scholar] [CrossRef]
- Saqlain, M. Revolutionizing Political Education in Pakistan: An AI-Integrated Approach. Educ. Sci. Manag. 2023, 1, 122–131. [Google Scholar] [CrossRef]
- Lohaus, T.; Rogalla, S.; Thoma, P. Use of Technologies in the Therapy of Social Cognition Deficits in Neurological and Mental Diseases: A Systematic Review. Telemed. E-Health 2023, 29, 331–351. [Google Scholar] [CrossRef]
- Tang, L.; Xie, T.; Yang, Y.; Wang, H. Classroom Behavior Detection Based on Improved YOLOv5 Algorithm Combining Multi-Scale Feature Fusion and Attention Mechanism. Appl. Sci. 2022, 12, 6790. [Google Scholar] [CrossRef]
- Mo, J.; Zhu, R.; Yuan, H.; Shou, Z.; Chen, L. Student Behavior Recognition Based on Multitask Learning. Multimed. Tools Appl. 2023, 82, 19091–19108. [Google Scholar] [CrossRef]
- Zong, L.; Fang, J. Deep Visual Computing of Behavioral Characteristics in Complex Scenarios and Embedded Object Recognition Applications. Sensors 2024, 24, 4582. [Google Scholar] [CrossRef]
- Yin Albert, C.C.; Sun, Y.; Li, G.; Peng, J.; Ran, F.; Wang, Z.; Zhou, J. Identifying and Monitoring Students’ Classroom Learning Behavior Based on Multisource Information. Mob. Inf. Syst. 2022, 2022, 9903342. [Google Scholar] [CrossRef]
- Sharma, P.; Joshi, S.; Gautam, S.; Maharjan, S.; Khanal, S.R.; Reis, M.C.; Barroso, J.; De Jesus Filipe, V.M. Student Engagement Detection Using Emotion Analysis, Eye Tracking and Head Movement with Machine Learning. In Technology and Innovation in Learning, Teaching and Education; Reis, A., Barroso, J., Martins, P., Jimoyiannis, A., Huang, R.Y.-M., Henriques, R., Eds.; Communications in Computer and Information Science; Springer Nature: Cham, Switzerland, 2022; Volume 1720, pp. 52–68. ISBN 978-3-031-22917-6. [Google Scholar]
- Delgado, K.; Origgi, J.M.; Hasanpoor, T.; Yu, H.; Allessio, D.; Arroyo, I.; Lee, W.; Betke, M.; Woolf, B.; Bargal, S.A. Student Engagement Dataset. In Proceedings of the IEEE/CVF International Conference on Computer Vision (ICCV) Workshops, Montreal, BC, Canada, 11–17 October 2021; pp. 3628–3636. [Google Scholar]
- Gu, C.; Sun, C.; Ross, D.A.; Vondrick, C.; Pantofaru, C.; Li, Y.; Vijayanarasimhan, S.; Toderici, G.; Ricco, S.; Sukthankar, R.; et al. Ava: A Video Dataset of Spatio-Temporally Localized Atomic Visual Actions. In Proceedings of the IEEE Conference on Computer Vision and Pattern Recognition, Salt Lake City, UT, USA, 18–23 June 2018; pp. 6047–6056. [Google Scholar]
- Feichtenhofer, C.; Fan, H.; Malik, J.; He, K. Slowfast Networks for Video Recognition. In Proceedings of the IEEE/CVF International Conference on Computer Vision, Seoul, Republic of Korea, 27 October–2 November 2019; pp. 6202–6211. [Google Scholar]
- Sigurdsson, G.A.; Varol, G.; Wang, X.; Farhadi, A.; Laptev, I.; Gupta, A. Hollywood in Homes: Crowdsourcing Data Collection for Activity Understanding. In Proceedings of the Computer Vision–ECCV 2016: 14th European Conference, Amsterdam, The Netherlands, 11–14 October 2016; Proceedings, Part I 14. Springer: Cham, Switzerland, 2016; pp. 510–526. [Google Scholar]
- Carreira, J.; Zisserman, A. Quo Vadis, Action Recognition? A New Model and the Kinetics Dataset. In Proceedings of the IEEE Conference on Computer Vision and Pattern Recognition, Honolulu, HI, USA, 21–26 July 2017; pp. 6299–6308. [Google Scholar]
- Jisi, A.; Yin, S. A New Feature Fusion Network for Student Behavior Recognition in Education. J. Appl. Sci. Eng. 2021, 24, 133–140. [Google Scholar]
- Shi, L.; Di, X. A Recognition Method of Learning Behaviour in English Online Classroom Based on Feature Data Mining. Int. J. Reason.-Based Intell. Syst. 2023, 15, 8–14. [Google Scholar] [CrossRef]
- Li, X.; Ji, Y.; Yang, J.; Li, M. Student Behavior Analysis using YOLOv5 and OpenPose in Smart Classroom Environment. AMIA Annu. Symp. Proc. 2025, 2024, 674–683. [Google Scholar] [PubMed]
- Sheng, X.; Li, S.; Chan, S. Real-time classroom student behavior detection based on improved YOLOv8s. Sci. Rep. 2025, 15, 14470. [Google Scholar] [CrossRef]
- Rashmi, M.; Ashwin, T.; Guddeti, R.M.R. Surveillance Video Analysis for Student Action Recognition and Localization inside Computer Laboratories of a Smart Campus. Multimed. Tools Appl. 2021, 80, 2907–2929. [Google Scholar] [CrossRef]
- Ali, M.Y.; Zhang, X.-D.; Harun-Ar-Rashid, M. Student Activities Detection of SUST Using YOLOv3 on Deep Learning. Indones. J. Electr. Eng. Inform. IJEEI 2020, 8, 757–769. [Google Scholar]
- Zhang, G.; Wang, L.; Wang, L.; Chen, Z. Hand-Raising Gesture Detection in Classroom with Spatial Context Augmentation and Dilated Convolution. Comput. Graph. 2023, 110, 151–161. [Google Scholar] [CrossRef]
- Wang, Z.; Li, L.; Zeng, C.; Yao, J. Student Learning Behavior Recognition Incorporating Data Augmentation with Learning Feature Representation in Smart Classrooms. Sensors 2023, 23, 8190. [Google Scholar] [CrossRef] [PubMed]
- Chen, H.; Zhou, G.; Jiang, H. Student Behavior Detection in the Classroom Based on Improved YOLOv8. Sensors 2023, 23, 8385. [Google Scholar] [CrossRef]
- Vaswani, A.; Shazeer, N.; Parmar, N.; Uszkoreit, J.; Jones, L.; Gomez, A.N.; Kaiser, Ł.; Polosukhin, I. Attention is all you need. In Proceedings of the 31st International Conference on Neural Information Processing Systems, Long Beach, CA, USA, 4–9 December 2017; pp. 6000–6010. [Google Scholar]
- Chi, M.T.; Wylie, R. The ICAP framework: Linking cognitive engagement to active learning outcomes. Educ. Psychol. 2014, 49, 219–243. [Google Scholar] [CrossRef]
Disclaimer/Publisher’s Note: The statements, opinions and data contained in all publications are solely those of the individual author(s) and contributor(s) and not of MDPI and/or the editor(s). MDPI and/or the editor(s) disclaim responsibility for any injury to people or property resulting from any ideas, methods, instructions or products referred to in the content. |
© 2025 by the authors. Licensee MDPI, Basel, Switzerland. This article is an open access article distributed under the terms and conditions of the Creative Commons Attribution (CC BY) license (https://creativecommons.org/licenses/by/4.0/).