You are currently viewing a new version of our website. To view the old version click .
Information
  • Article
  • Open Access

19 November 2025

An Optimization-Based Aggregation Approach with Triangular Intuitionistic Fuzzy Numbers in High-Dimensional Multi-Attribute Decision-Making

,
,
,
,
and
1
School of Computer Engineering, Jiangsu University of Technology, Changzhou 213001, China
2
School of Electrical Engineering, Southeast University, Nanjing 210096, China
*
Author to whom correspondence should be addressed.

Abstract

We address information fusion and spatial structure modeling in high-dimensional fuzzy multi-attribute decision-making by proposing a novel framework that couples Triangular Intuitionistic Fuzzy Numbers (TIFNs) with the Plant Growth Simulation Algorithm (PGSA). The method first maps the triangular intuitionistic fuzzy information of experts on each evaluation scheme into high-dimensional spatial points to realize the structured expression of decision-making information. Subsequently, the PGSA is used to perform dynamic global optimization search on the high-dimensional point cloud to determine the optimal set point and realize the intelligent aggregation of heterogeneous fuzzy data from multiple sources. The algorithm breaks through the limitation of traditional linear aggregation on the portrayal of information spatial distribution and is able to improve the accuracy and consistency of decision-making results in high-dimensional complex environments. The experimental results show that the method in this paper outperforms the mainstream aggregation methods in a number of evaluation indexes such as weighted Hamming distance, correlation, information energy and correlation coefficient. The proposed model provides a new technical path for intelligent solution and theory expansion of high-dimensional fuzzy decision-making problems.

1. Introduction

Multi-attribute decision-making (MADM), as a core topic in decision science and artificial intelligence, plays an important role in engineering management, financial investment, medical diagnosis, and intelligent transportation [1,2]. In real applications, decision-makers often confront high-dimensional, multi-attribute evaluation information characterized by uncertainty, ambiguity, and heterogeneity [3]. How to integrate multi-source uncertain information in a scientific and robust manner while improving the credibility and stability of decision results has become a key research challenge in theory and practice [4,5].
In recent years, various fuzzy and intuitionistic fuzzy extensions have been developed to represent and fuse uncertain information effectively [6,7]. However, conventional aggregation operators such as the weighted average or weighted geometric mean often fail to preserve global information structures and are sensitive to outliers [8]. Although geometric- or projection-based methods have been proposed [9,10], they still rely on local optimization and cannot achieve globally consistent aggregation under strong attribute heterogeneity.
To address this issue, intelligent optimization algorithms (e.g., simulated annealing, particle swarm optimization) have been introduced into MADM aggregation [11,12], exhibiting strong global-search capability and adaptability. Nevertheless, how to simultaneously ensure global optimality and stability of aggregation while maintaining the integrity of heterogeneous attribute information remains an open problem [13].
Motivated by the above challenge, this study regards MADM as an information-integration problem—that is, maximizing the consistency of multi-source uncertain information while preserving overall information energy. To this end, we integrate Triangular Intuitionistic Fuzzy Numbers (TIFNs), which effectively model ambiguity and hesitation, with the Plant Growth Simulation Algorithm (PGSA), a biologically inspired optimizer capable of dynamic global searching.
Existing metaheuristic-based aggregation approaches, such as Particle Swarm Optimization (PSO), Genetic Algorithm (GA), and Differential Evolution (DE), have shown strong global search ability in multi-attribute decision-making. However, these methods rely on population-level evolutionary operators—such as velocity updates or genetic crossover—that often introduce redundant computation, parameter sensitivity, and premature convergence when dealing with high-dimensional, heterogeneous fuzzy data. In contrast, the Plant Growth Simulation Algorithm (PGSA) is a biologically inspired model that simulates phototropic growth behavior, where the exploration direction and step size evolve adaptively according to environmental feedback. This mechanism enables PGSA to balance global and local search more efficiently without predefined velocity or mutation operations, making it particularly effective in maintaining the geometric consistency of fuzzy information represented by TIFNs. Therefore, combining TIFNs with PGSA offers a novel and structure-preserving aggregation paradigm that achieves both global consensus search and information integrity preservation—a capability not attainable through conventional operator-based or evolutionary optimization methods [14,15].
TIFNs are adopted as the fundamental information representation because they achieve a balance between model expressiveness, computational efficiency, and interpretability in high-dimensional decision environments. Their triangular structure provides closed-form operations and stable similarity measures, facilitating geometric embedding for PGSA-based optimization. Compared with generalized fuzzy models (e.g., Q-rung and T-spherical fuzzy sets), TIFNs retain sufficient descriptive capability while avoiding complex normalization constraints and parameter sensitivity, offering a computationally efficient and interpretable foundation for the proposed approach.
Consequently, this paper proposes a geometry-preserving PGSA–TIFN global aggregation model that maps expert evaluations into a high-dimensional spatial point cloud and applies PGSA’s phototropic growth mechanism to dynamically search for an optimal rally point representing global consensus. The method’s performance is evaluated using multiple quantitative indicators—such as weighted Hamming distance, correlation, and information energy—through both numerical experiments and case analysis.
From the perspective of information integration, the main objectives of this study are as follows:
(1) To propose a geometry-preserving global aggregation framework based on TIFN–PGSA fusion to enhance the expressive ability and consistency of fuzzy information;
(2) To construct a spatial point-cloud modeling method for structured representation and integrated optimization of heterogeneous attribute data;
(3) To establish a multi-index evaluation system to verify the scientific validity and superiority of the proposed model.
Accordingly, this study tests the following hypotheses:
H1. 
The PGSA–TIFN aggregation model achieves higher expert-opinion consistency than conventional fuzzy aggregation operators.
H2. 
The proposed approach maintains a better balance between information energy and aggregation stability in high-dimensional decision environments.
The structure of the paper is organized as follows: Section 2 reviews relevant theoretical foundations and related work; Section 3 introduces basic concepts; Section 4 details the proposed PGSA–TIFN aggregation model and algorithmic implementation; Section 5 presents experiments and comparative analyses; and Section 6 concludes the study and outlines future research directions.

3. Preliminaries

This section will systematically introduce the core theoretical foundations underpinning the methodology of this paper. Firstly, the basic definition of TIFNs and their related arithmetic rules will be elaborated in detail to provide theoretical support for the subsequent quantization and processing of fuzzy information. Secondly, the concept of optimal set point and its important role in high-dimensional fuzzy information aggregation will be illustrated, focusing on the analysis of its mathematical definition and finding method. Finally, the basic principles of PGSA, including its bio-heuristic optimization idea and global search mechanism, will be introduced to provide a solid theoretical foundation for the construction and experimentation of the subsequent methods. By systematically sorting out the above key contents, it helps to lay a solid theoretical support for the high-dimensional fuzzy decision-making model proposed in this paper.

3.1. Concept of Triangular Intuitionistic Fuzzy Number and Its Basic Operation

Compared with traditional exact values, triangular intuitionistic fuzzy number (TIFN) can provide decision makers with a more flexible and realistic basis for evaluation, and significantly enhances the ability to portray uncertainty and hesitation. TIFNs better capture ambiguity and hesitation by maximizing membership and minimizing non-membership. In recent years, many scholars have combined TIFN with a variety of decision-making methods and applied it to performance evaluation and information processing in complex decision-making situations. In this paper, TIFN is used to express the uncertain information in the evaluation process, which further improves the adaptability of the model to the ambiguous and uncertain environments. The basic definitions and related properties of TIFNs are given below:
Definition 1 
([38]). TIFN  a ˜ = ( ( a ¯ , a , a ¯ ) ; u a ˜ , v a ˜ )  is a special intuitionistic fuzzy set on the set R of real numbers. Its affiliation and non-affiliation functions are defined as follows, respectively:
u a ˜ ( x ) = x a _ a a ¯ u a ˜ ,   a ¯ x < a , u a ˜ ,   x = a , a ¯ x a ¯ a u a ˜ ,   a < x a , ¯ 0 ,   x < a ¯   o r   x > a . ¯
and
v a ˜ ( x ) = a x + v a ˜ ( x a ¯ ) a a ¯ ,   a ¯ x < a , v a ˜ ,   x = a , x a + v a ˜ ( a ¯ x ) a ¯ a ,   a < x a ¯ , 1 ,   x < a o r x > a ¯ .
where u a ˜ is the maximum affiliation and v a ˜ is the minimum non-affiliation. In addition, they satisfy the following conditions: 0 u a ˜ 1 , 0 v a ˜ 1 and 0 ω a ˜ + u a ˜ 1 . π a ˜ ( x ) = 1 u a ˜ v a ˜ is known as the intuitionistic fuzzy index of element x in a ˜ .
Definition 2. 
Let a ˜ = ( ( a ¯ , a , a ¯ ) ; u a ˜ , v a ˜ )  and  b ˜ = ( ( b ¯ , b , b ¯ ) ; u b ˜ , v b ˜ )  be two TIFNs, and  β  be a real number. Then, the operations for TIFNs are defined as follows:
a ˜ + b ˜ = ( ( a ¯ + b ¯ , a + b , a ¯ + b ¯ ) ; min ( u a ˜ , u b ˜ ) , max ( v a ˜ , v b ˜ ) ) ;
a ˜ b ˜ = ( ( a ¯ b ¯ , a b , a ¯ b ¯ ) ; min ( u a ˜ , u b ˜ ) , max ( v a ˜ , v b ˜ ) ) ;
β a ˜ = ( ( β a ¯ , β a , β a ¯ ) ; u a ˜ , v a ˜ ) ,   β 0 ; ( ( β a ¯ , β a , β a ¯ ) ; u a ˜ , v a ˜ ) ,   β < 0 .
TIFNs are employed in this work because their triangular structure ensures efficient computation and geometric compatibility with the PGSA-based optimization process, as discussed in the Introduction.

3.2. The Optimal Rally Point

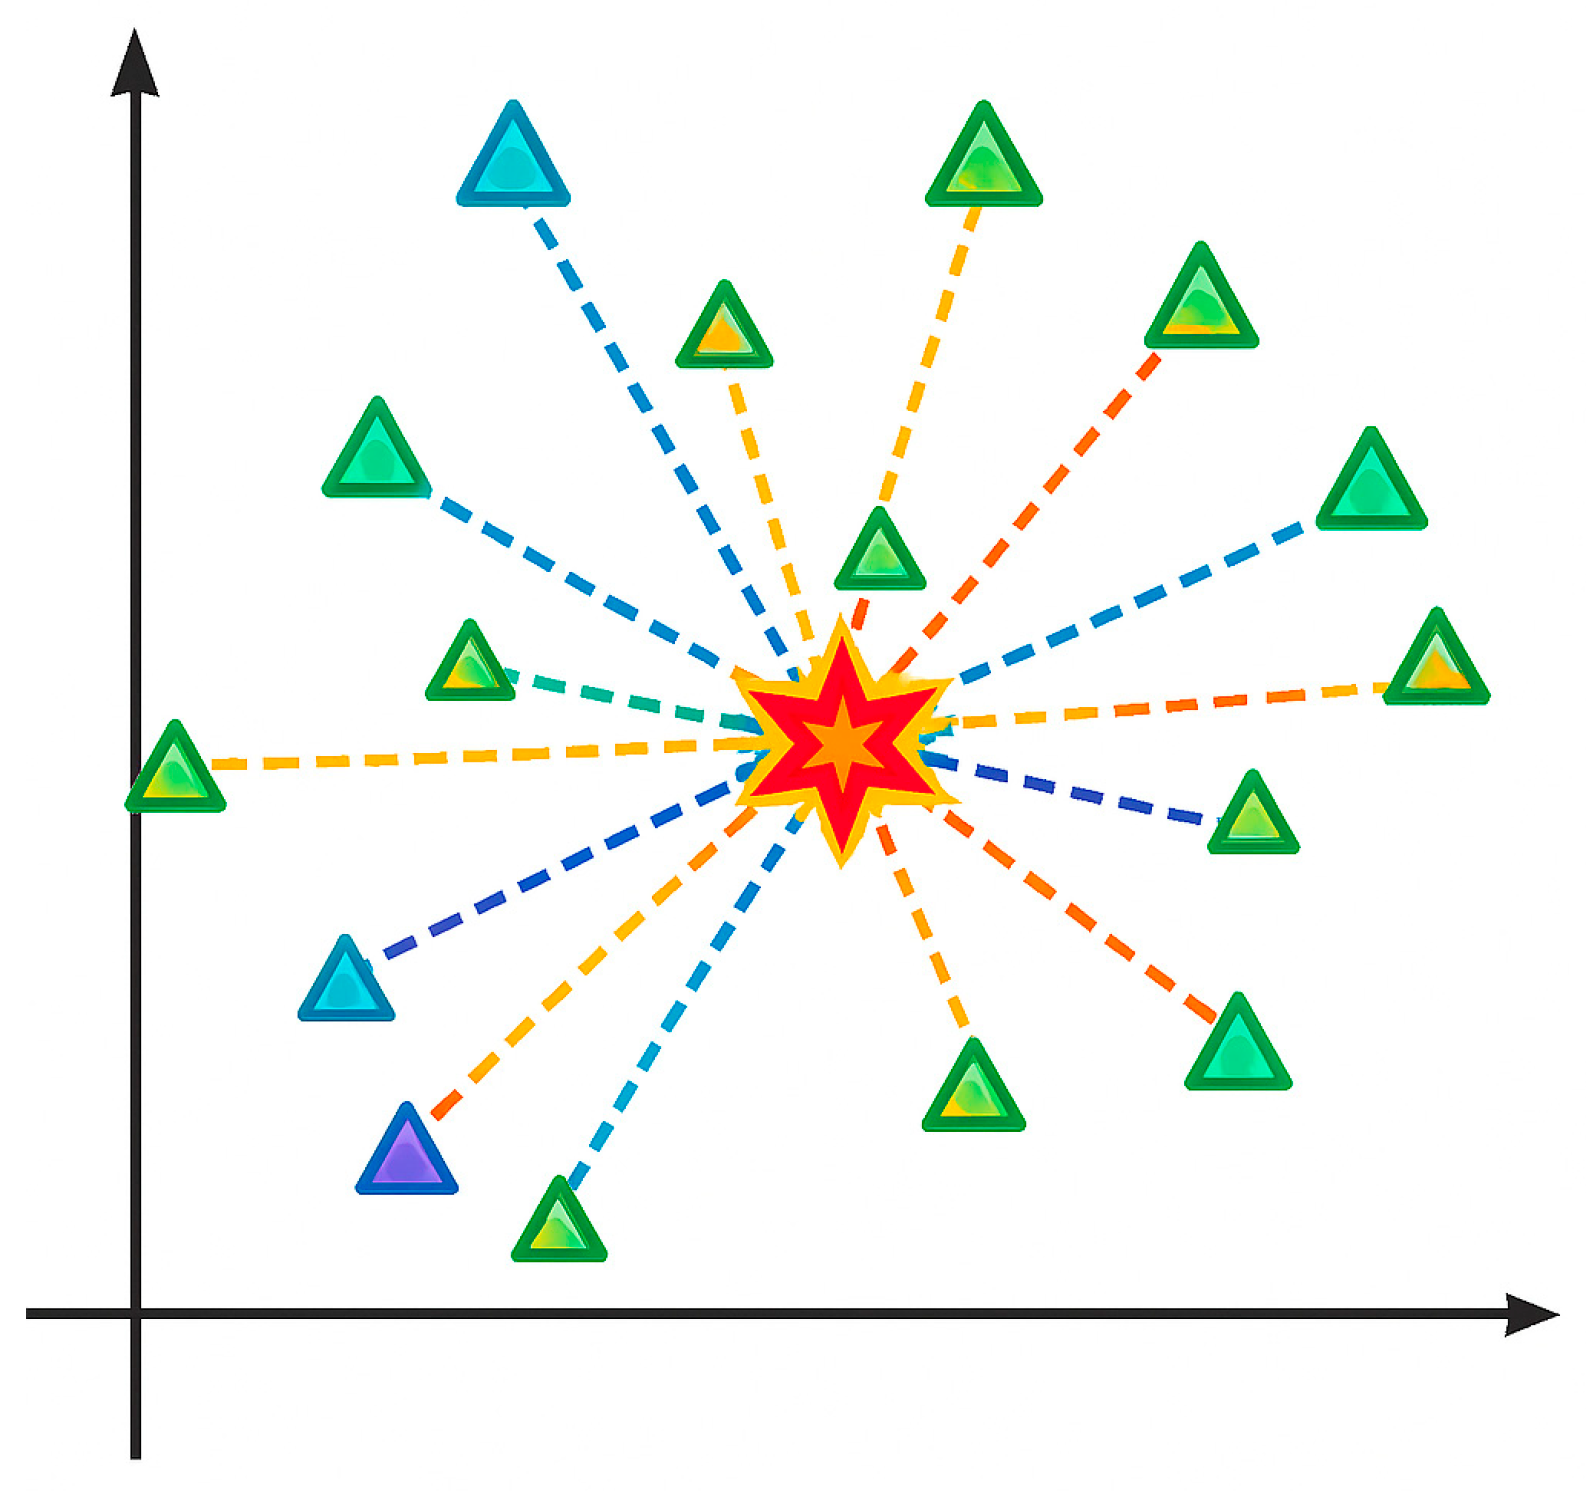
In this paper, fuzzy datasets are represented as points, regions or families of regions in planar or high-dimensional spaces by means of mathematical mapping. In order to realize effective agglomeration of fuzzy information from multiple sources, a strategy is proposed to aggregate dispersed fuzzy information into a globally optimal representative point in space by searching for optimal agglomeration points or optimal agglomeration region vertices in geometric space.
Definition 3 
([39]). Let the set of points  P = { P 1 , P 2 , , P 3 } ( n 3 )  in the plane closed region have n points containing distance weights  P i ( a i , b i ) , distance weights ξ i [ 0 , 1 ] , and satisfy  i = 1 n ξ i = 1 , if there exists a  P ( a , b )  with the minimum of the sum of weighted distances  D p  between all the points in  P , i.e.,
D p = min i = 1 n ( ξ i ( a a i ) 2 + ( b b i ) 2 ) ,
Then the point P ( a , b ) is called the optimal set point in the plane where the point set P is located. The optimal set point in the plane is shown in Figure 1.
Figure 1. The optimal planar rally point.
Definition 4 
([40]). Let the set of points  Q = { Q 1 , Q 2 , , Q m } ( m 3 )  in a closed region of n-dimensional space be m points with weights,  Q i ( a 1 i , a 2 i , , a n i )  with weights  ζ i [ 0 , 1 ] , and  i = 1 m ζ i = 1 . if there exists a minimum of the sum of the weighted distances  D Q  between  Q ( a 1 , a 2 , , a n )  and all the points in Q, i.e.,
D Q = min i = 1 n ( ζ i ( a 1 a 1 i ) 2 + ( a 2 a 2 i ) 2 + + ( a n a n i ) 2 ) ,
Then Q ( a 1 , a 2 , , a n ) is noted as the spatially optimal set point within the point set Q.
Thus, there exist n (n ≥ 3) weighted points in five-dimensional space whose corresponding positive weights are ξ i [ 0 , 1 ] ( 1 i n ) , and i = 1 n ξ i = 1 . If there exists a point P whose Euclidean distance from other given points satisfies the following condition:
D = min | P P i |   = = min i = 1 n k = 1 5 ( x k a i , k ) 2 ,
When this condition is satisfied, the P can then be defined as an optimal set point in a five-dimensional space.
In this study, for the multi-attribute decision-making problem, this paper considers the values of each scheme to be evaluated on all attributes as a vector point in a five-dimensional space. Specifically, the five attribute values corresponding to each scheme together constitute a five-dimensional coordinate, so as to realize the accurate expression of scheme characteristics in the high-dimensional space. For the same program, the five-dimensional attribute data given by different experts or evaluation subjects can form a point set in the five-dimensional space, which comprehensively reflects the performance and cognitive distribution of the program in each attribute dimension.

3.3. Plant Growth Simulation Algorithm (PGSA)

The Plant Growth Simulation Algorithm (PGSA) [41,42] is an intelligent optimization method inspired by plants’ phototropism and branching expansion behavior, which was firstly proposed by a Chinese scholar, Li Tong, in 2005. The algorithm deeply simulates the complexity of plants dynamically adjusting their growth paths to adapt to the external environment through various mechanisms such as branching, phototropism, resource integration and self-regulation during the natural growth process. Under the framework of PGSA, the solution space of the optimization problem is analogous to the growing environment of a plant, and the objective function is abstracted as a light source, which drives the individual “plants” to continuously perceive and converge to the optimal direction, and systematically carry out the global search and local fine-grained optimization through the generation of new growth points and multi-path expansion. The core of PGSA is a multi-level search strategy that combines global exploration and local exploitation, and effectively improves the diversity and optimization of understanding through branching competition and survival of the fittest mechanism. At the same time, the algorithm is able to adaptively adjust the growth strategy based on local information, significantly reducing the risk of falling into local extremes, and demonstrating a strong global optimization capability. The method is especially suitable for dealing with complex optimization problems such as high-dimensional, multi-peak, non-linear and non-differentiable problems.
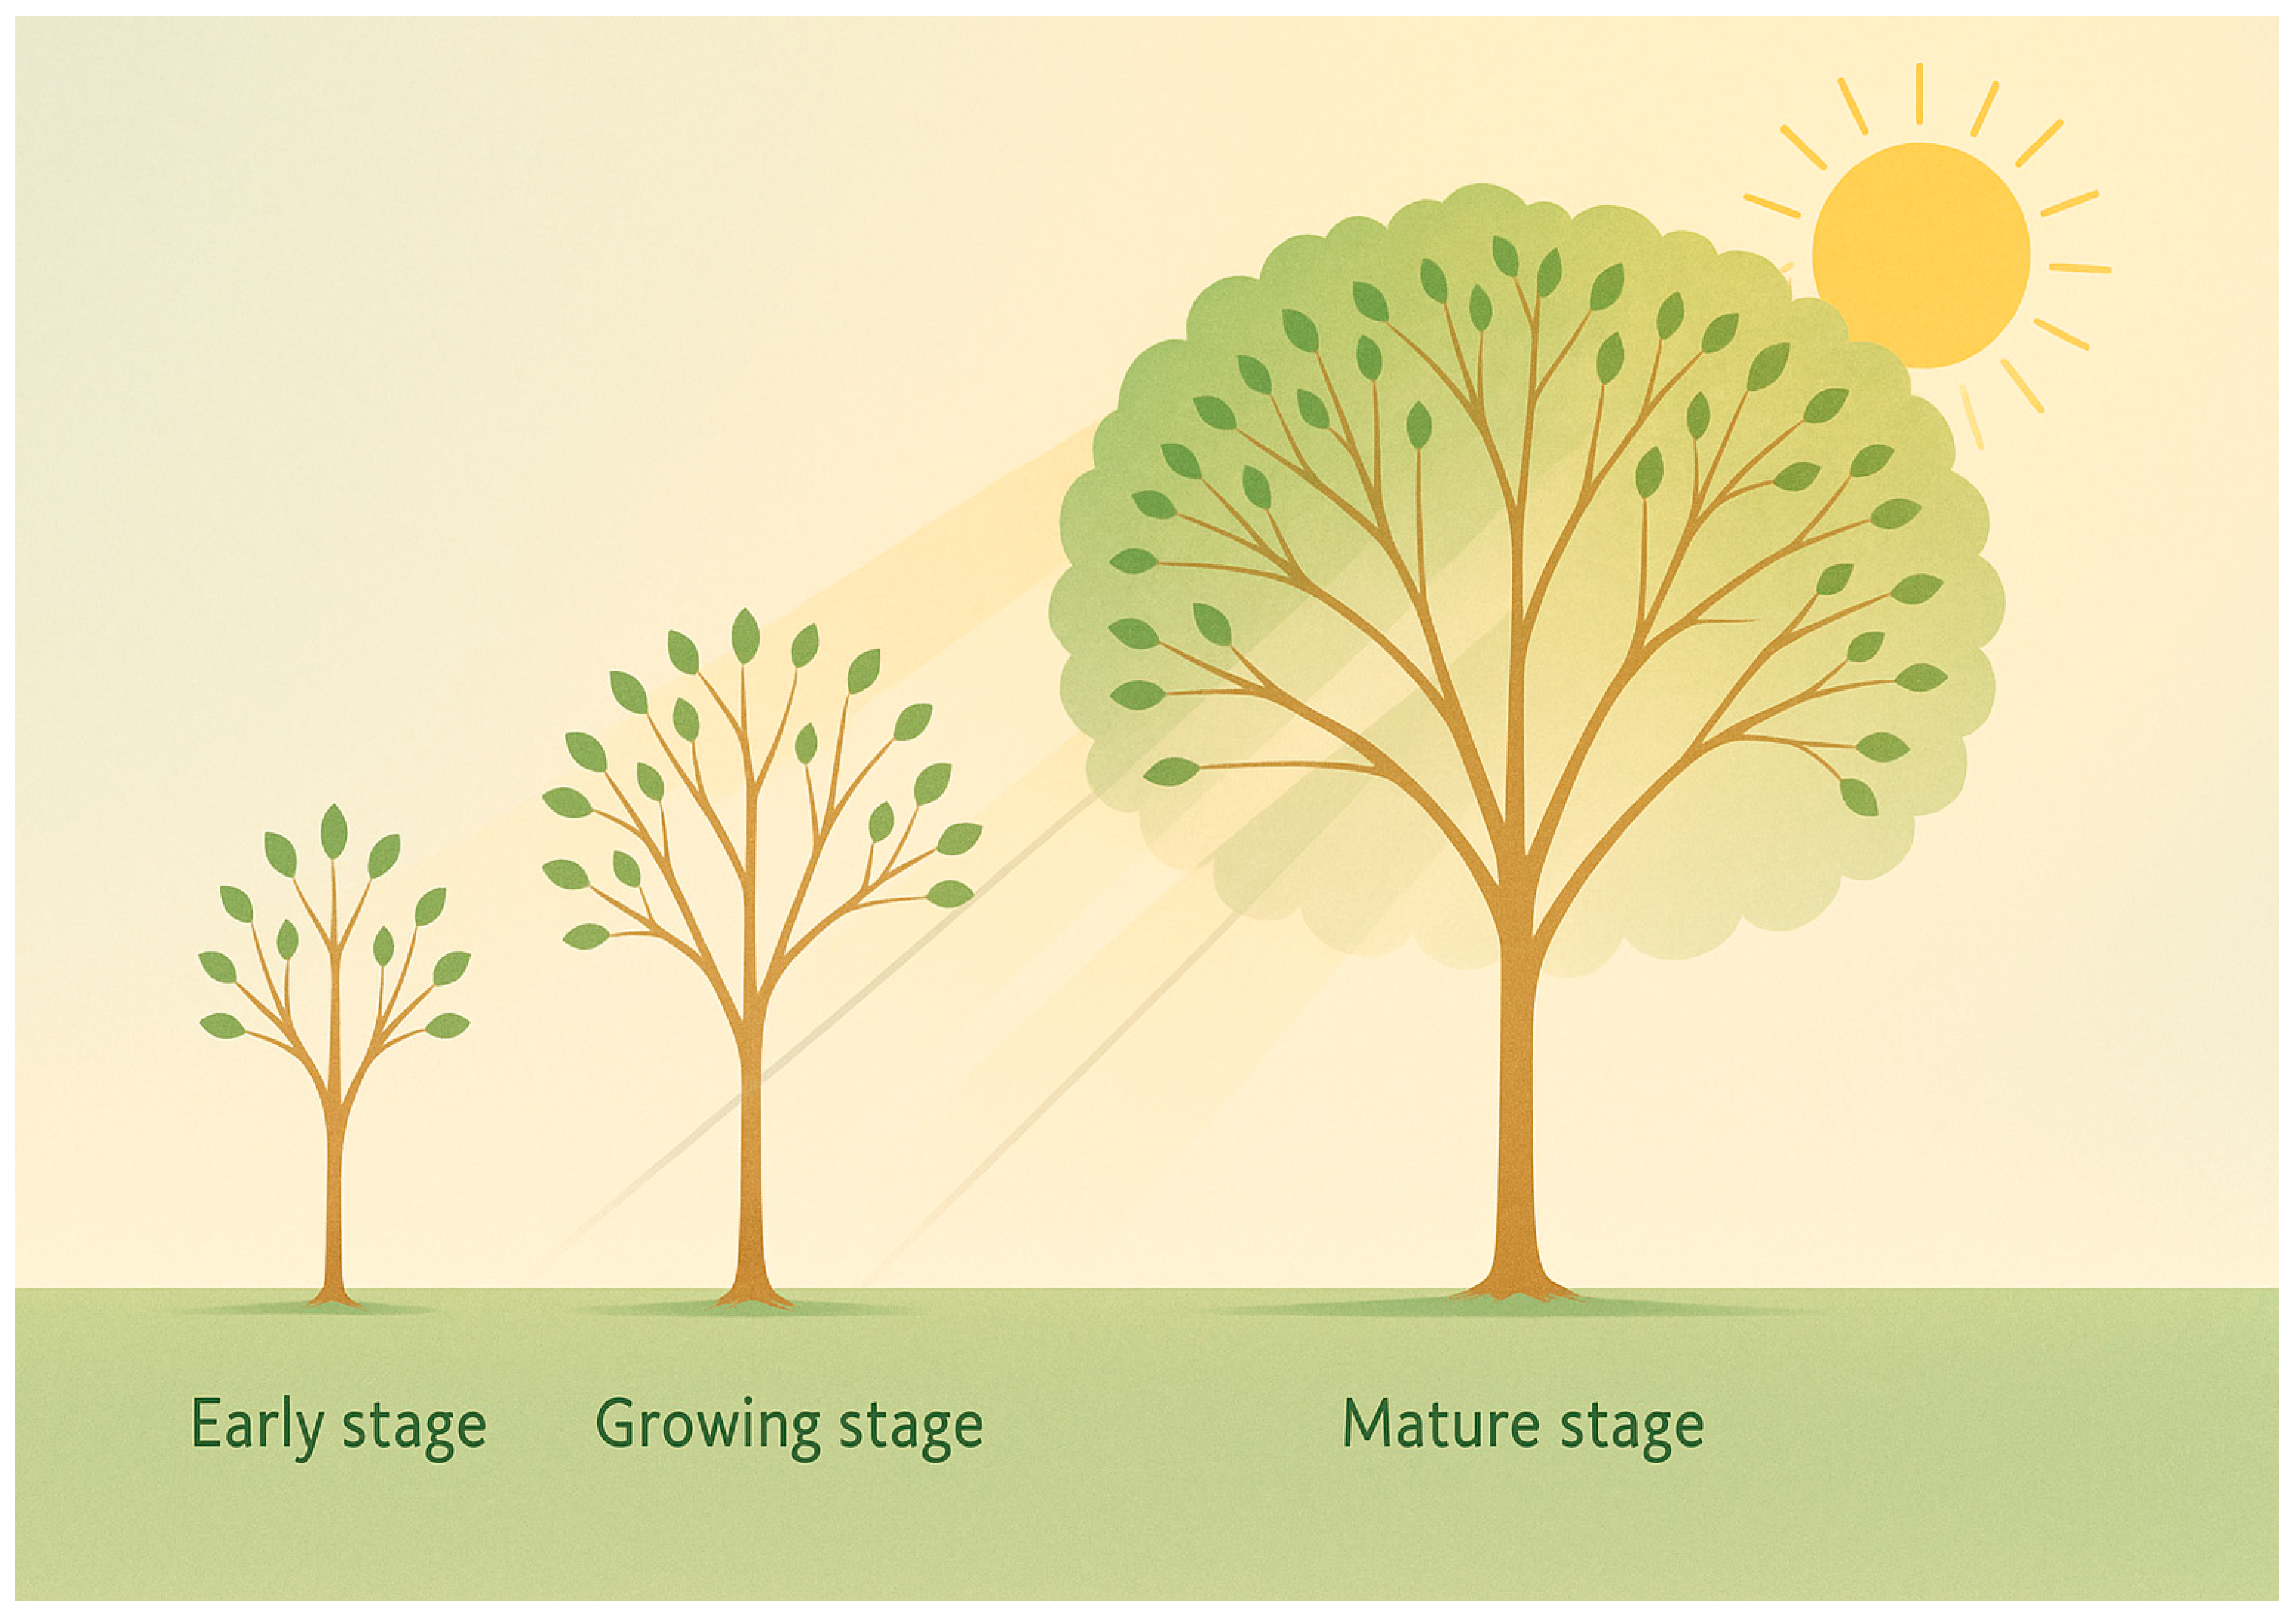
Since its proposal, PGSA has been widely used in many fields, including network structure optimization, facility siting, complex path planning, combinatorial optimization and integer programming, etc., and has demonstrated excellent solution efficiency and result stability. In recent years, with the deepening of the research and the continuous improvement of the algorithm, PGSA has been gradually expanded to many practical application scenarios, such as high-dimensional information clustering, multi-attribute decision-making, large-scale data processing, new energy scheduling, etc., which has fully demonstrated its strong adaptability and application prospects in dealing with large-scale, dynamic and uncertainty problems. The principle of PGSA is shown in Figure 2.
Figure 2. Process of plant growth.
In PGSA, the space of the optimization problem to be solved is considered as the growing region of the plant, and the global optimal solution of the problem corresponds to the “light source” that the plant tends to. The plant grows closer to the light source by growing at points called germination points, each of which possesses a certain concentration of morphogens to characterize its probability of germination.
Specifically, let the length of the main trunk be M, there are T germination points S M = ( S M 1 , S M 2 , , S M T ) on the trunk, and the morphogens concentration of each germination point is noted as p M = ( p M 1 , p M 2 , , p M T ) . Similarly, the length of the unit branch is m, and there exist r germination points s m = ( s m 1 , s m 2 , , s m r ) on the branch, whose morphogens concentration is p m = ( p m 1 , p m 2 , , p m r ) . the morphogens concentration of the germination points on the trunk and the branch is calculated using the formulae, respectively:
p M i = f ( x 0 ) f ( S M i ) i = 1 T ( f ( x 0 ) f ( S M i ) ) + j = 1 r ( f ( x 0 ) f ( S m j ) ) ( i = 1 , 2 , 3 , , T ) ,
p m j = f ( x 0 ) f ( S m i ) i = 1 T ( f ( x 0 ) f ( S M i ) ) + j = 1 r ( f ( x 0 ) f ( S m j ) ) ( j = 1 , 2 , 3 , , r ) ,
Morphactin concentrations were met at all germination sites:
i = 1 K p M i + j = 1 q p m j = 1 .
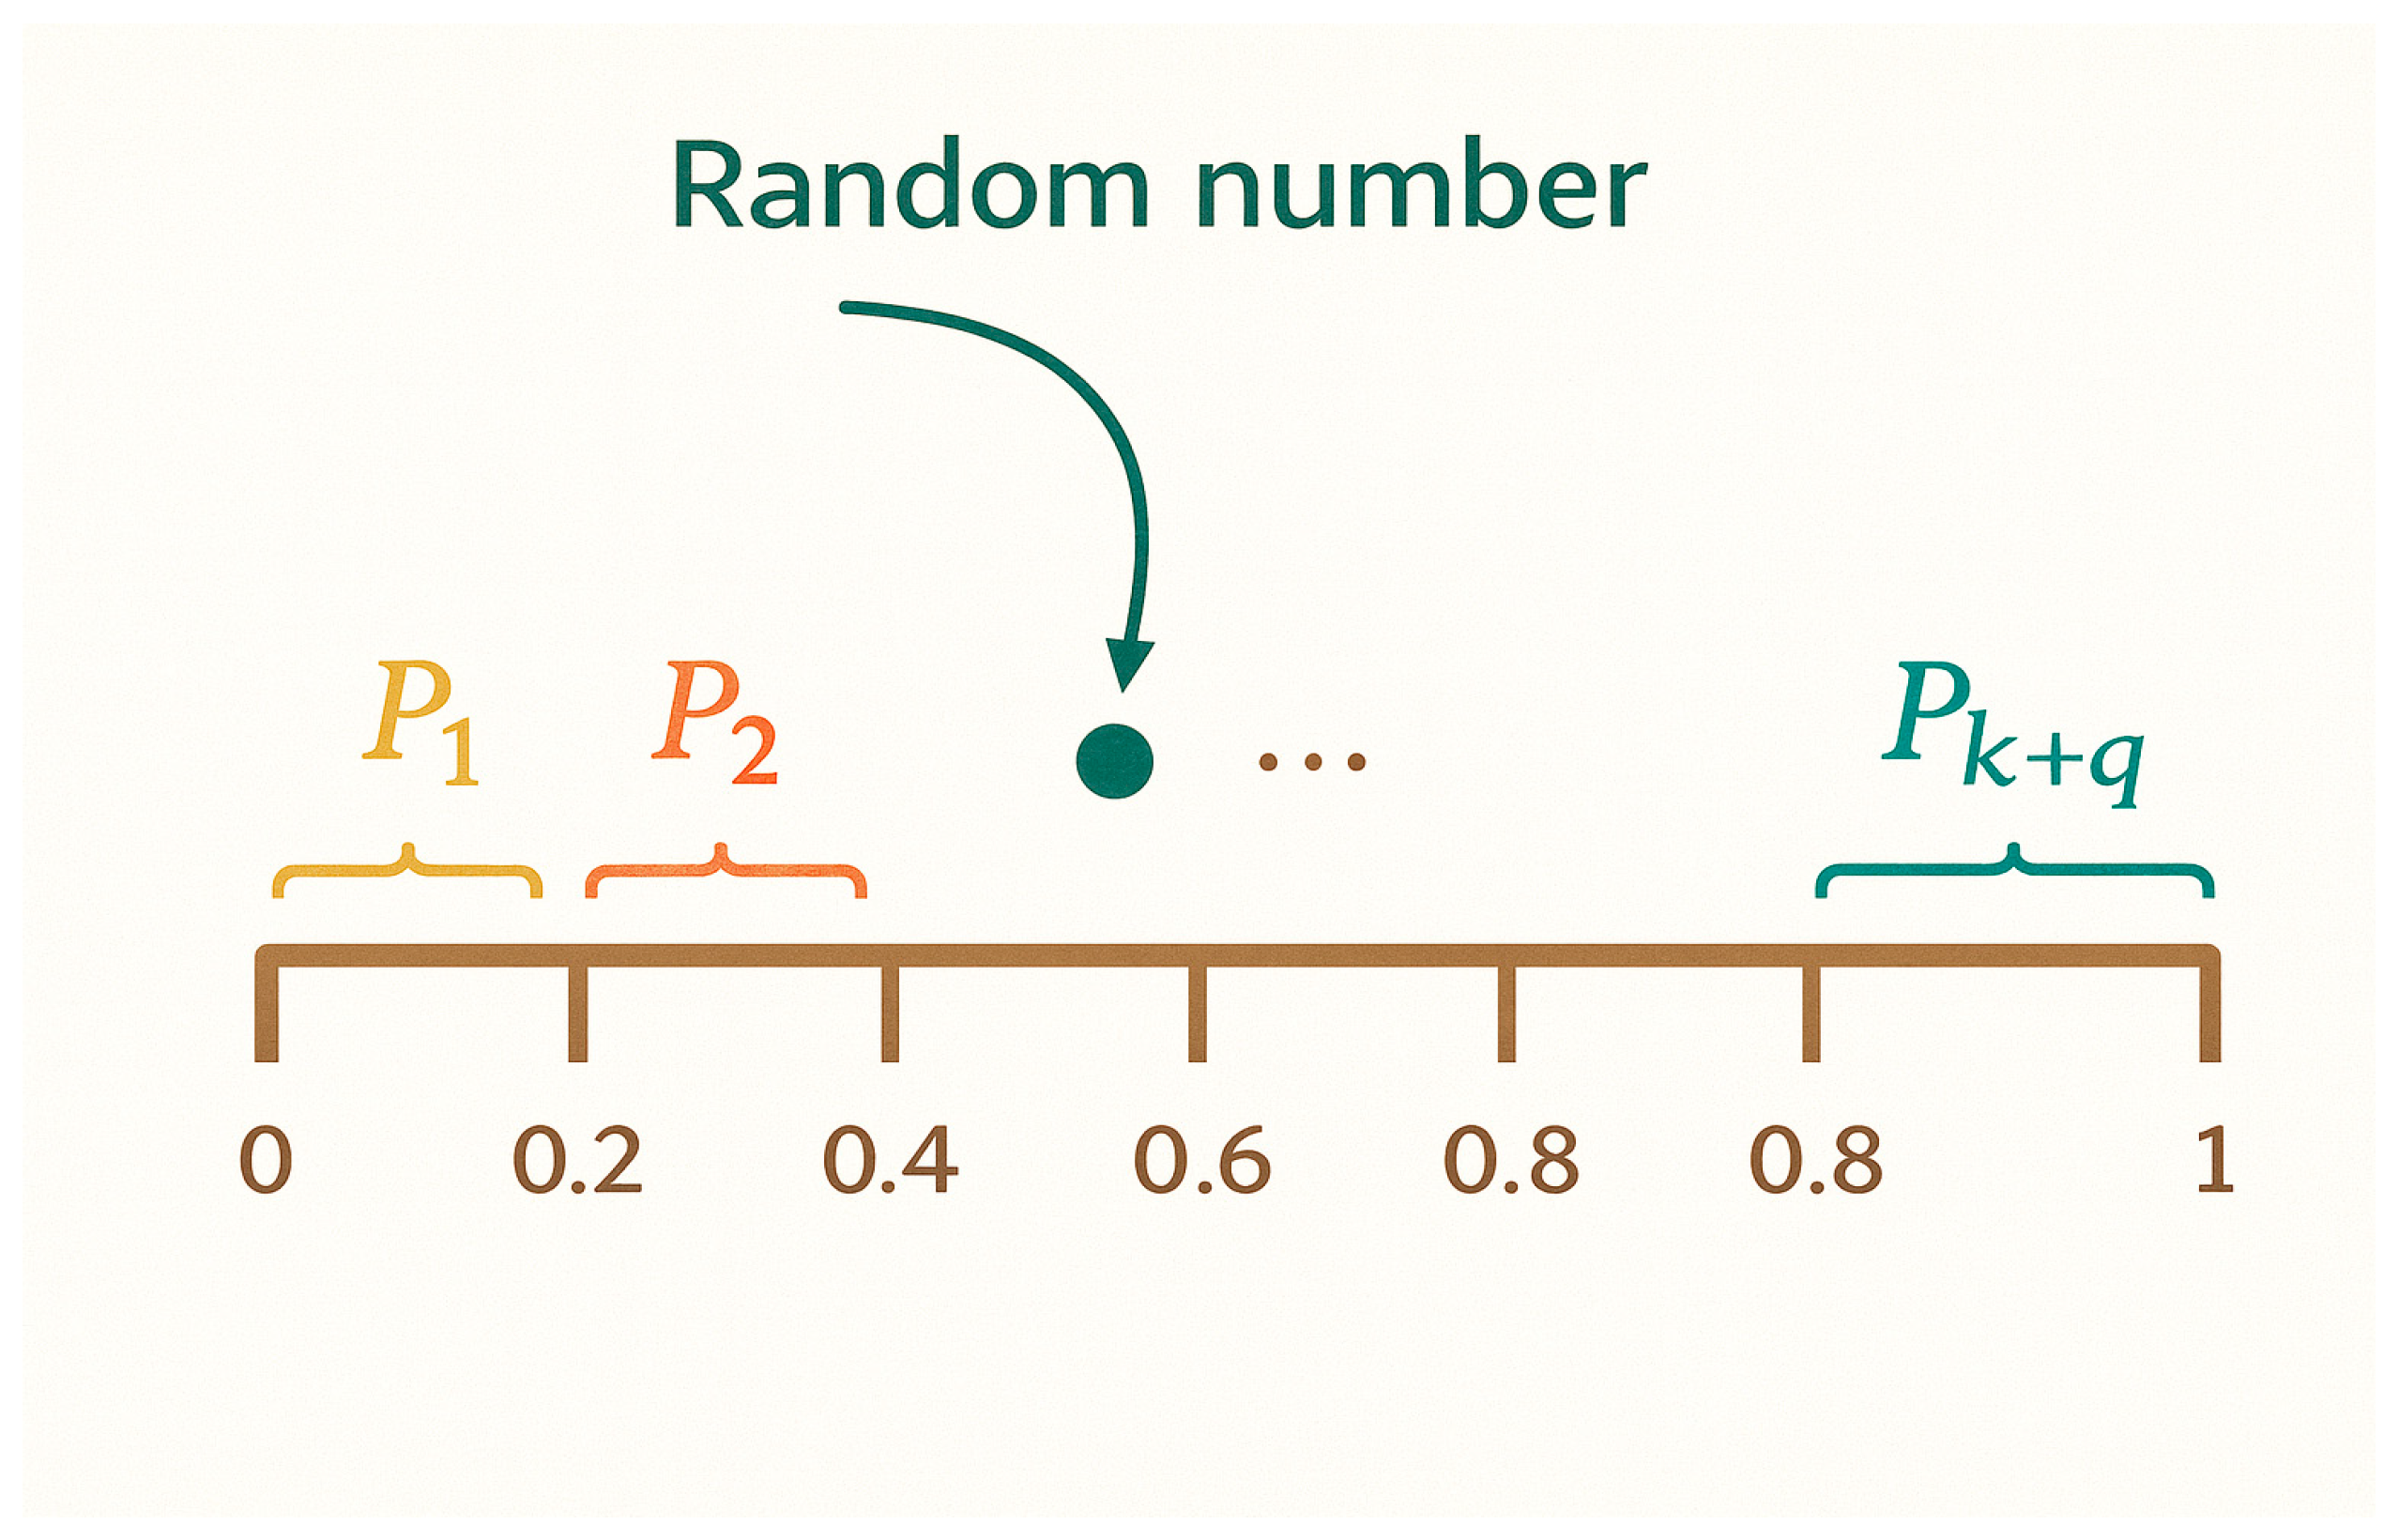
The stems and branches contain a total of K + 1 germination points, i.e., ( x 1 , x 2 , , x K + 1 ) , and the morphactin concentration of each germination point is ( p 1 , p 2 , , p K + 1 ) from Equations (9) and (10), respectively. According to the algorithm’s stochasticity mechanism, a random value is subsequently generated within the interval [0, 1], which is used to determine a new germination point for the next growth phase. This process can be visualized as throwing a small ball randomly in the interval [0, 1], and the germination point corresponding to the region where the ball falls will be selected as the starting point for the next round of growth (as shown in Figure 3). The values of T and r are changed as the plant extends towards the light, and the newly born germination point will be added to all the existing germination points, repeating the step continuously until the growth stops.
Figure 3. The morphactin concentration state map.

4. Key Methods

4.1. The Process of Aggregation of Expert Preferences

4.1.1. Aggregation Idea

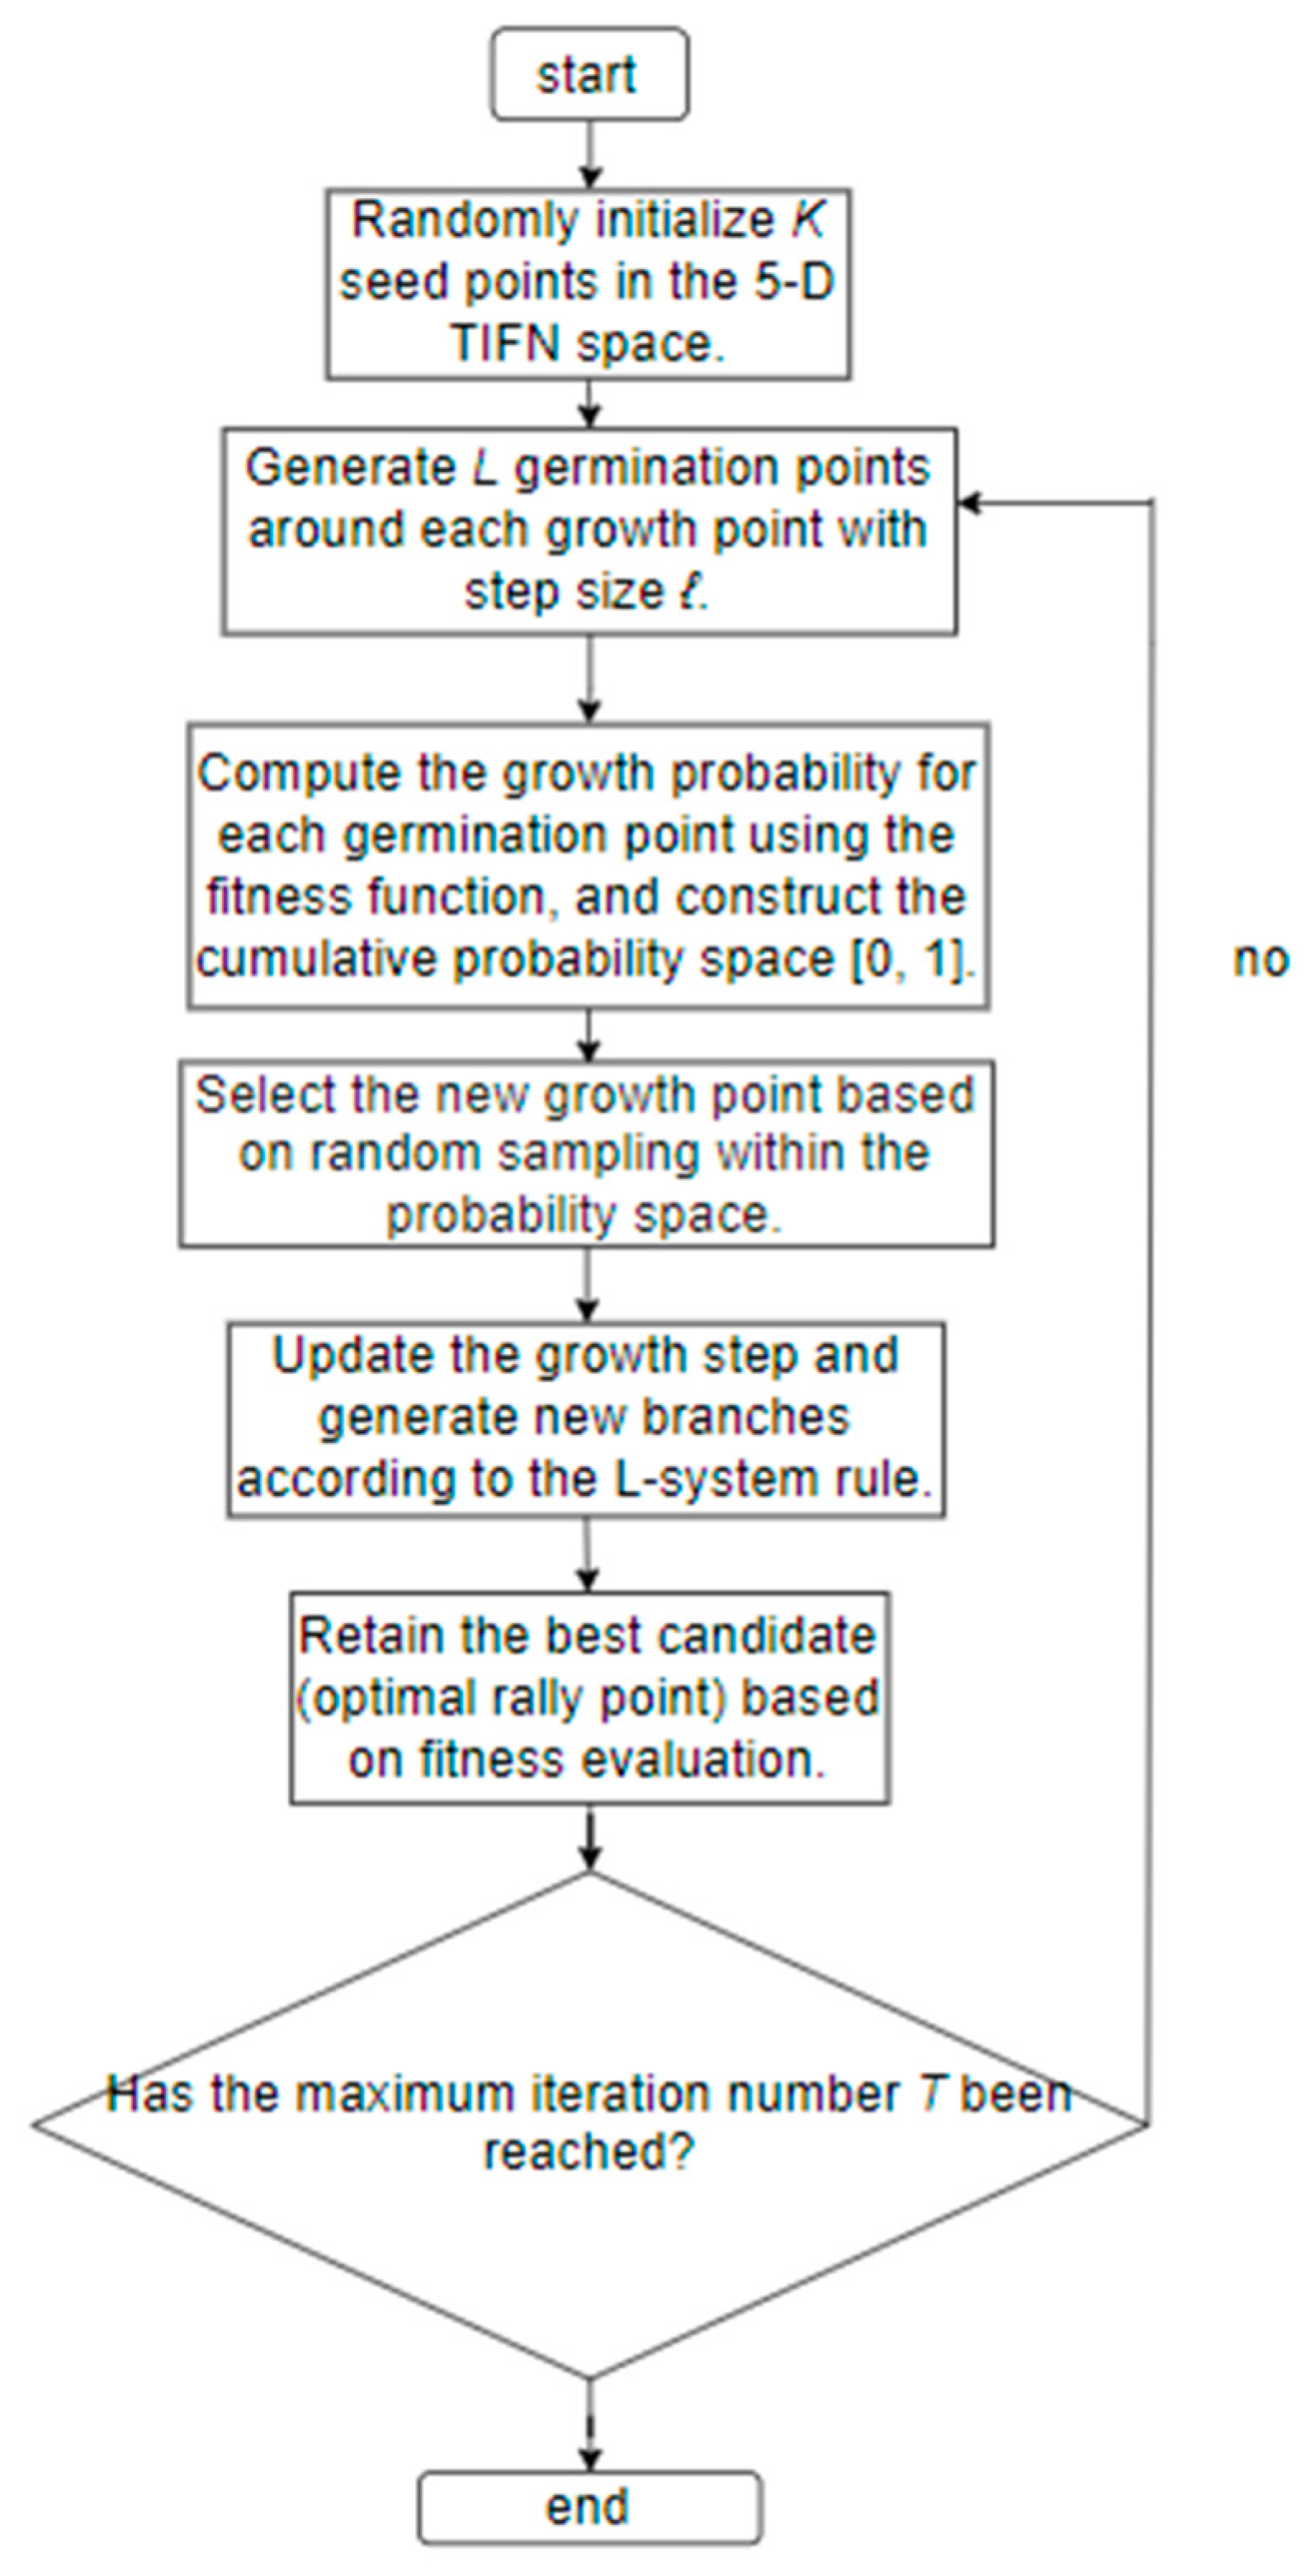
To provide a clear overview of the proposed aggregation mechanism, the overall workflow of the TIFN–PGSA framework is illustrated in Figure 4. As shown in the figure, the process begins with the initialization of expert evaluation data in the form of Triangular Intuitionistic Fuzzy Numbers (TIFNs), which are mapped into a high-dimensional geometric space. PGSA then performs a biologically inspired global search through iterative growth, probability-based selection, and adaptive step-size adjustment to determine the optimal rally point that best represents the collective expert consensus. Finally, the optimal aggregation points obtained across attributes are integrated to form the aggregated decision matrix, providing the foundation for subsequent ranking and evaluation.
Figure 4. Flowchart of the proposed TIFN–PGSA aggregation process.
The algorithm integrates fuzzy information modeling (TIFN representation) with the PGSA’s phototropic growth mechanism to realize structure-preserving global aggregation of multi-source expert evaluations.
In order to accurately portray the cognitive preferences of experts on multiple attributes of each evaluation scheme in the group decision-making process, this paper adopts the TIFN as the basic information representation tool. The TIFN consists of a triangular fuzzy function as well as the corresponding degree of affiliation and non-affiliation, the specific form is shown as a ˜ i j = ( < l i j , m i j , u i j > ; μ i j , v i j ) , where l i j , m i j , u i j denotes the lower, median and upper bounds of the expert’s evaluation value of the ith evaluation scheme on the jth attribute, respectively; μ i j and v i j denote the positive and negative affiliation, respectively, which satisfy the constraints 0 μ i j + v i j 1 .
Therefore, a fuzzy matrix with expert preferences can be constructed using TIFNs R = [ a ˜ i j ] m × q , The constructed fuzzy matrix is shown below:
R = a ˜ 11 a ˜ 12 a ˜ 1 q a ˜ 21 a ˜ 22 a ˜ 2 q a ˜ m 1 a ˜ m 2 a ˜ m q = ( < l 11 , m 11 , u 11 > ; μ 11 , v 11 ) ( < l 12 , m 12 , u 12 > ; μ 12 , v 12 ) ( < l 1 q , m 1 q , u 1 q > ; μ 1 q , v 1 q ) ( < l 21 , m 21 , u 21 > ; μ 21 , v 21 ) ( < l 22 , m 22 , u 22 > ; μ 22 , v 22 ) ( < l 2 q , m 2 q , u 2 q > ; μ 2 q , v 2 q ) ( < l m 1 , m m 1 , u m 1 > ; μ m 1 , v m 1 ) ( < l m 2 , m m 2 , u m 2 > ; μ m 2 , v m 2 ) ( < l m q , m m q , u m q > ; μ m q , v m q )
where m denotes the number of evaluation programs and q denotes the dimension of the attribute.
In this study, in order to more effectively integrate the fuzzy evaluation information of experts in the multi-attribute decision-making process, each entry of the expert-preference matrix is represented by a TIFN and embedded as a point in a five-dimensional space, which is then projected into a higher-dimensional geometric space for processing. In conducting the experiments, each a ˜ i j = ( < l , m , u > ; μ , v ) is treated as a five-dimensional coordinate ( l , m , u , μ , v ) , enabling the fuzzy semantic information to be transformed into a form of geometric structure that is easy to compute. This mapping technique ensures that key features such as the affiliation degree, non-affiliation degree and fuzzy interval of the original fuzzy numbers are completely transmitted, and creates conditions for further spatial modeling and optimization processing.
After adopting this method, the ratings of the same scheme on each attribute can be uniformly mapped to multiple points in the five-dimensional space, so as to construct a point set containing all expert evaluations. On this basis, this paper uses the PGSA optimization algorithm to find the optimal aggregation point in this point set, which is used as the comprehensive preference point representing the group opinion. After the aggregation is completed, an aggregation matrix [ D ˙ ] can be formed, and the aggregation matrix [ D ˙ ] is shown below:
[ D ˙ ] = ( < l 11 · , m 11 · , u 11 · > ; μ 11 · , v 11 · )   ( < l 21 · , m 21 · , u 21 · > ; μ 21 · , v 21 · )                   ( < l m 1 · , m m 1 · , u m 1 · > ; μ m 1 · , v m 1 · )  

4.1.2. Core Steps for Selecting Optimal Rally Point Based on PGSA

In order to realize the global optimal aggregation of expert fuzzy evaluation information, this paper adopts the PGSA to search for the optimal set of aggregation points in the high-dimensional space, the specific steps are as follows:
Step 1: High-dimensional expert evaluation data modeling and mapping: the fuzzy evaluation data of all experts in the multi-attribute decision-making process are uniformly mapped to a high-dimensional geometric space. For a certain evaluation scheme A i , let its evaluation opinion be expressed in terms of TIFN under q attributes. Each TIFN can be expressed as ( a k , b k , c k , μ k , v k ) , and therefore, the evaluation data of all experts can be composed into a five-dimensional space point set Q, Q = { q k = ( a k , b k , c k , μ k , v k ) | k = 1 , 2 , , N } , where N = m × q , each q k represents an expert evaluation point in a five-dimensional space.
Step 2: Initial growth point and step size setting: in the high-dimensional space, the weighted arithmetic center of the point set Q is used as the initial growth point G 0 , whose coordinates can be expressed as G 0 = 1 N k = 1 N q k , and the initial step size l 0 is set, which provides the basis for the spatial exploration of the subsequent growth direction.
Step 3: Generation of germination points and calculation of morpholino concentration: The current growth point G t is used as the center and grows in steps of l t , generating L germination points in space. The position of each germination point S t , j is given by the following equation S t , j = G t + l t d j ,   j = 1 , 2 , , L .
Step 4: Fitness function and growth point screening: For each germination point S t , j , its fitness function is defined as the sum of its weighted Euclidean distances to the set of expert evaluation points Q : f ( S t , j ) = k = 1 N ω k | | S t , j q k | | 2 , where ω k is the weight of the k th attribute and | S t , j q k | 2 denotes the five-dimensional Euclidean distance | | S t , j q k | | 2 = p = 1 5 ( S t , j ( p ) q k ( p ) ) 2 .
Choice of distance metric: Although other distance measures such as Mahalanobis, Manhattan (L1), or Hamming distance can also be applied in the 5-D TIFN space, the Euclidean distance (L2) is adopted in this study due to its differentiability and geometric interpretability under normalized TIFN coordinates. It preserves isotropy in the high-dimensional embedding, ensures consistent scaling among membership, non-membership, and hesitation components, and allows analytical gradient estimation within the PGSA optimization process.
Step 5: Mechanisms of growth point renewal based on morpholino concentrations: A probability distribution was constructed based on the morpholino concentrations C t , j of all germination points, and an equivalent random sampling method was used to determine the new generation of growth points G t + 1 . i.e., randomly generated values r were generated in the interval of [0, 1], and germination points S t , j , which satisfy the h = 1 j 1 C t , h < r h = 1 j C t , h , were selected as G t + 1 .
Step 6: Step size decreasing with iteration: G t + 1 is used as the new growth point, and the l t + 1 = α l t   , 0 < α < 1 method is used to reduce the step size, and steps 3~6 are repeated to simulate the “phototropic” growth of plants and advance the search process of the optimal assembly point.
Step 7: Convergence criterion and optimal set point determination: It is considered to have converged to the optimal set point G when the step size l t converges to the threshold ε , or when the change in fitness satisfies | f ( G t + 1 ) f ( G t ) | < δ for K consecutive iterations.
Step 8: Aggregate output with subsequent processing: Repeating the above process, an aggregation matrix can be formed for all scenarios and attributes: [ D ˙ ] = [ G i j ] , i = 1 , 2 , , m ; j = 1 , 2 , , q , . Where G i j is the optimal set point of the ith program under the jth attribute, as a comprehensive aggregation result of multi-attribute group decision-making, which provides basic data for subsequent scoring and ranking.
To enhance reproducibility, the parameter settings, step-size control mechanism, and convergence criteria of PGSA are detailed in Section 4.3. In summary, the algorithm adopts an adaptive step-decay strategy with dual convergence conditions based on fitness variation and minimum step threshold. These settings ensure global convergence stability while maintaining computational efficiency.

4.2. Rankings of Alternatives

In multi-attribute group decision-making, after the aggregation of expert evaluation information, each alternative can be finally represented by a TIFN. Specifically, the comprehensive evaluation result of option A i can be expressed as A ˜ i = ( ( a i , b i , c i ) ; μ i , v i ) . where ( a i , b i , c i ) is the lower, median and upper bounds of the triangular fuzzy number, respectively, μ i is the degree of affiliation, and v i is the degree of non-affiliation, satisfying 0 μ i + v i 1 .
In order to realize the quantitative comparison between different schemes, the TIFNs need to be converted into real numbers that can be sorted. For this purpose, the literature generally uses a score function (Score Function), whose basic idea is to take into account the “center position” of the fuzzy number and its subordinate and non-subordinate information. The commonly used score function is defined as follows:
S ( A ˜ i ) = a i + 2 b i + c i 4 μ i a i + 2 b i + c i 4 v i ,
where a i + 2 b i + c i 4 denotes the center of gravity of the triangular fuzzy number, which is the overall portrayal of the fuzzy evaluation interval, μ i and v i regulate the positive and negative contributions, respectively, in order to comprehensively reflect the fuzzy and intuitive nature of the evaluation.
When multiple scenarios have the same result after the score function is calculated, an accuracy function is further used to break ties. The Accuracy Function is usually defined as:
H ( A ˜ i ) = μ i v i .
Its physical meaning is the difference between the affiliation and non-affiliation of the program, the larger the value, the higher the degree of certainty about the program.
Finally, all the schemes are ranked according to their score value S ( A ˜ i ) in descending order, with the higher score being prioritized. If there are schemes with the same score, their accuracy functions H ( A ˜ i ) are compared and the larger value is prioritized.

4.3. Hyperparameter Setting and Computational Complexity

To ensure the reproducibility and transparency of the proposed PGSA–TIFN aggregation model, all hyperparameters of PGSA are explicitly reported in Table 2. Each parameter is associated with its mathematical symbol, meaning, default value, tunable range, and adjustment rationale.
Table 2. Description and configuration of PGSA hyperparameters.
The step size is adaptively reduced at each iteration by ℓₜ+1 = αℓₜ, which gradually refines the search region as the algorithm approaches convergence.
To facilitate implementation and enhance clarity, the complete procedure of the proposed PGSA–TIFN aggregation model is summarized in Algorithm 1. This algorithm takes expert-evaluation data represented by TIFNs as input and iteratively searches for the global rally point in a 5-D fuzzy space through the growth and phototropism mechanism of PGSA. The procedure outlines initialization, germination, fitness evaluation, adaptive step-size update, and convergence determination, which together realize the global aggregation of multi-source expert information.
Algorithm 1. PGSA-Based Aggregation Procedure for Multi-Attributes TIFN Decisions
  Input: Expert TIFN evaluations X = { x 1 , x 2 , , x N } ; parameters (T, r, L, ℓ0, α, ε, δ, K)
  Output: Optimal rally point p* (* represents the best point)
1:   Initialize K seed points randomly in the 5-D TIFN space
2:   For each seed k = 1 to K do
3:   Generate L germination points within radius r
4:   Compute fitness for each germination point using Equations (9) and (10)
5:   Select the point with the maximum fitness improvement
6:   Update step size ℓ_t = α × ℓ_{t − 1} and apply random perturbation δ
7:   If | f | < ε , stop growth for this seed
8:   End for
9:   Return the rally point p* with the highest global fitness
The algorithm terminates when either the step size falls below the convergence threshold ε, or the improvement of fitness |ftft−1| remains smaller than δ for five consecutive iterations, ensuring convergence stability.
The computational complexity of the PGSA–TIFN aggregation mainly depends on the evaluation of germination points and iterative updates.
For each iteration, the fitness of L germination points is computed over q attributes from N experts, resulting in a per-iteration cost of O(N × L × q). Over T iterations and K initial seeds, the overall complexity becomes: O ( T × N × L × q × K ) .
This complexity is comparable to other metaheuristic optimization algorithms such as PSO or DE, but PGSA requires fewer parameter adjustments and maintains stable convergence in the 5-D TIFN embedding.

5. Illustrative Example and Comparative Study

5.1. Illustrative Example

The experimental data in this part of the paper are taken from Lu’s paper [43], and the specific data are shown in Table 3.
Table 3. The decision matrix.
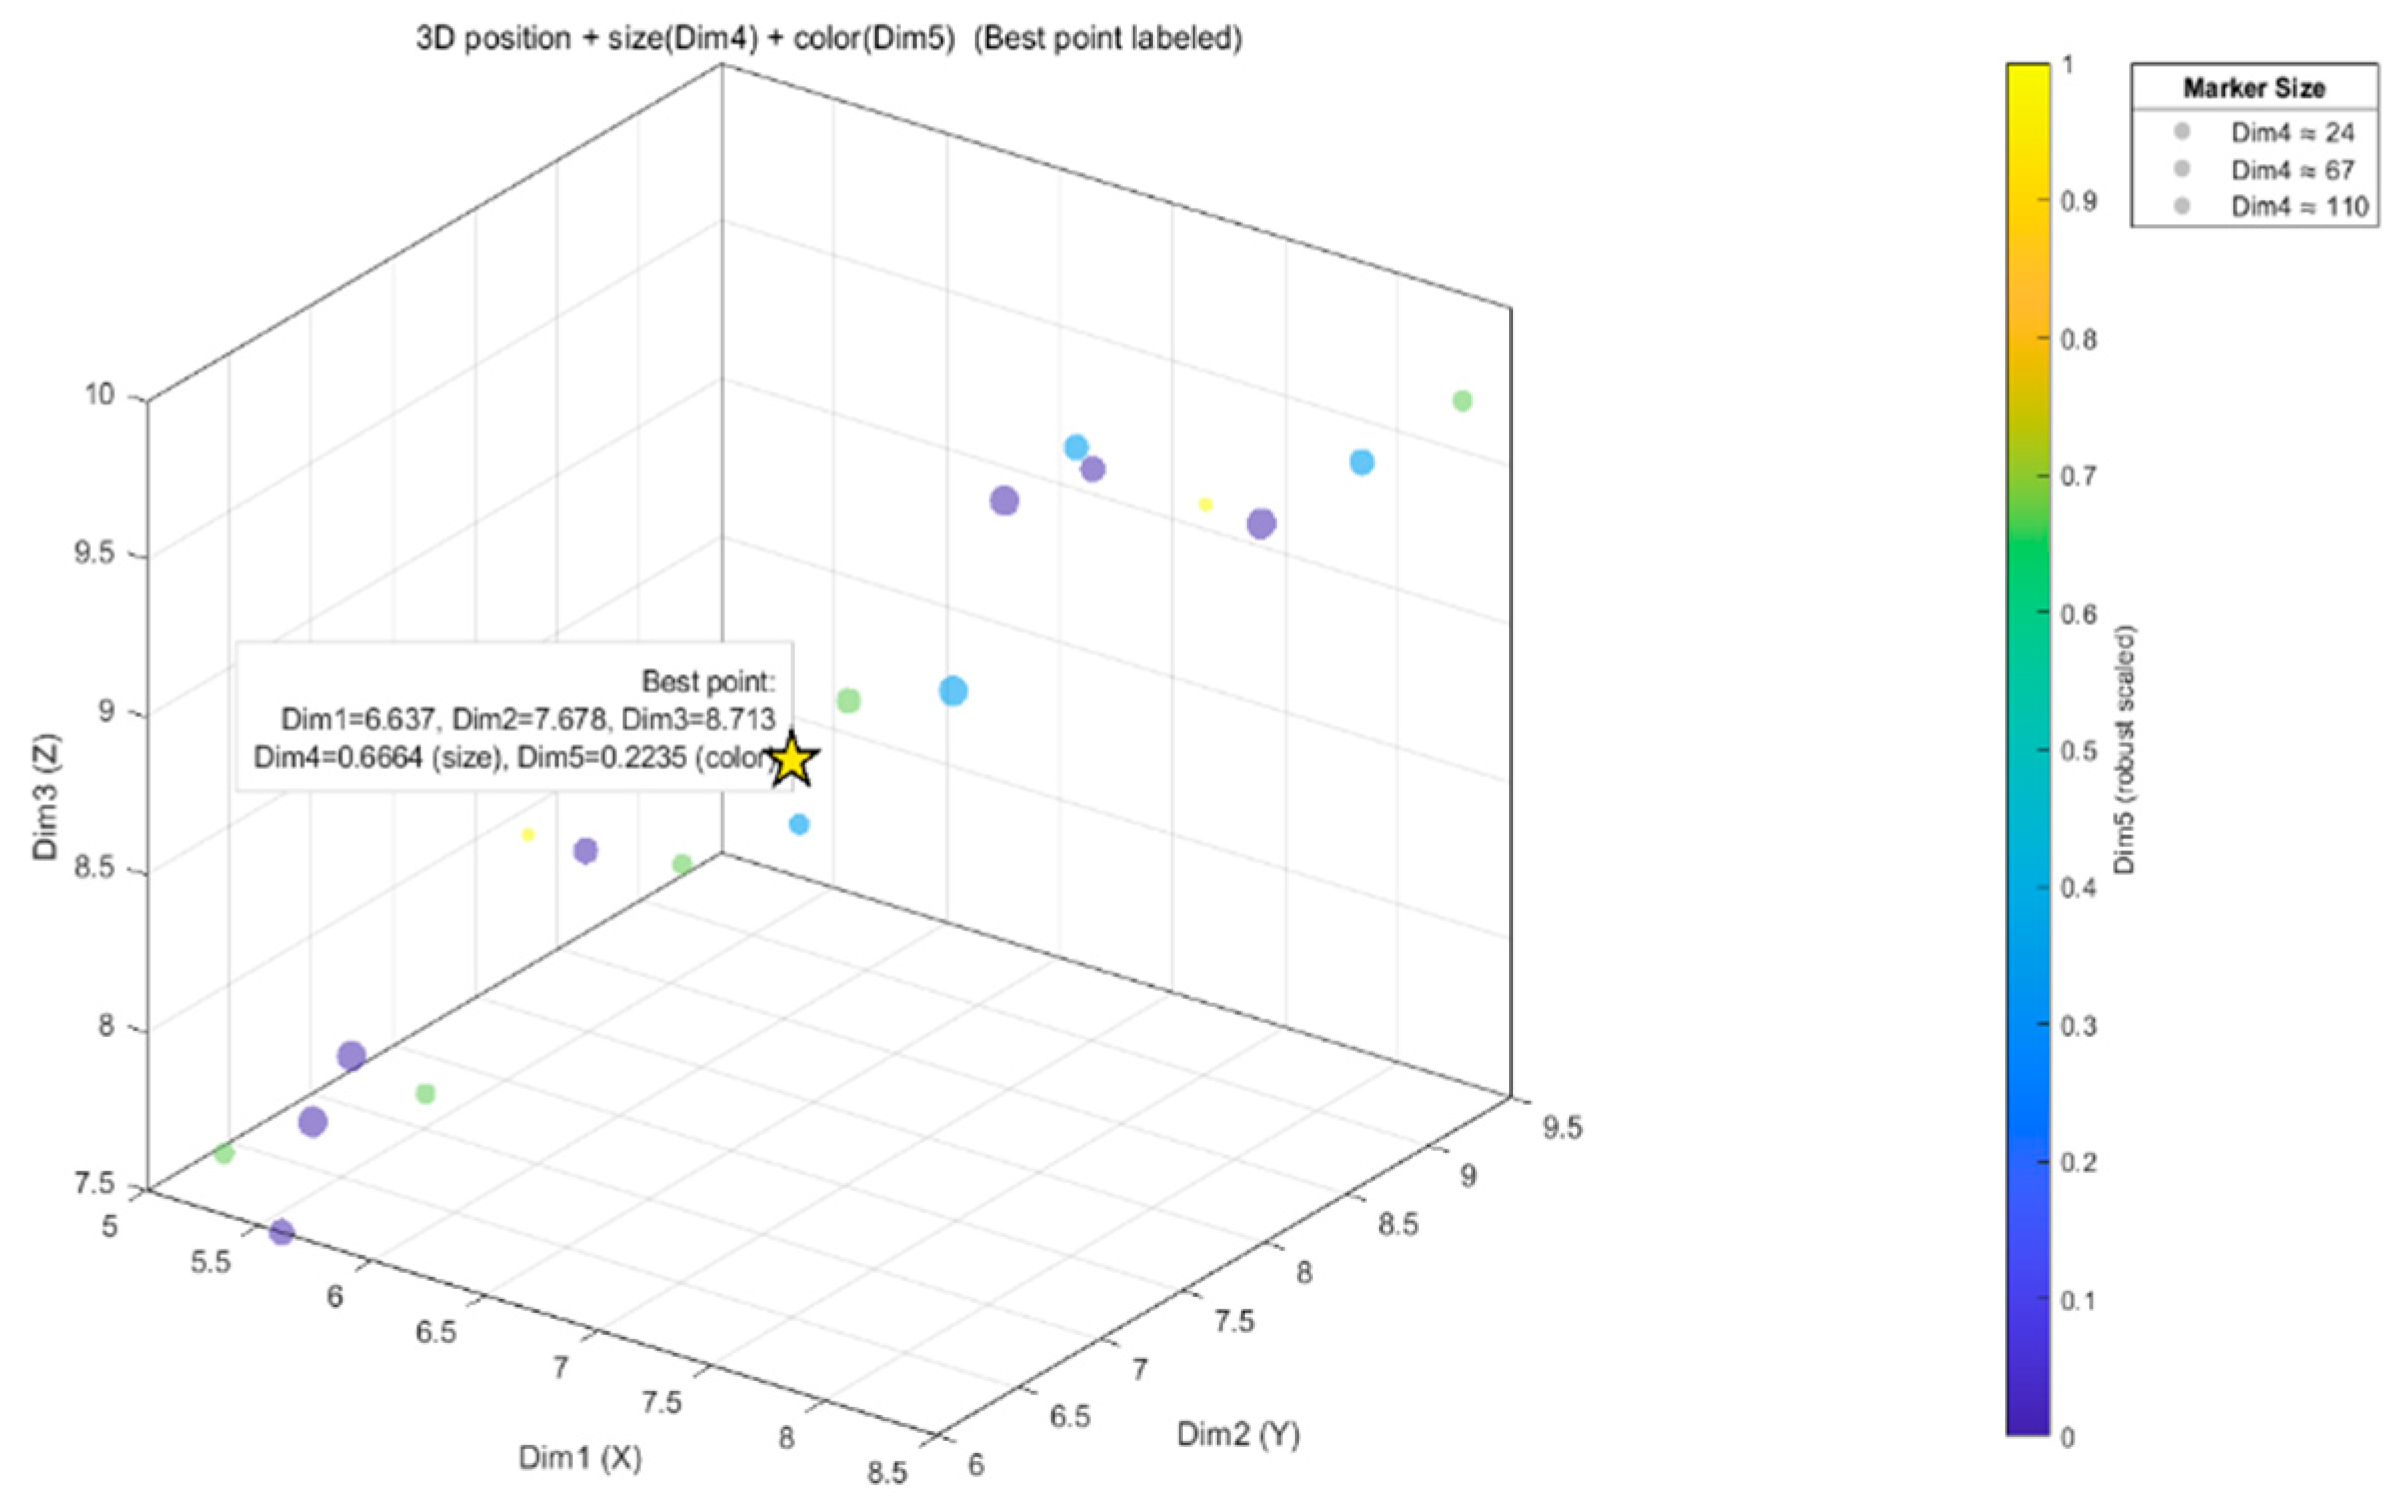
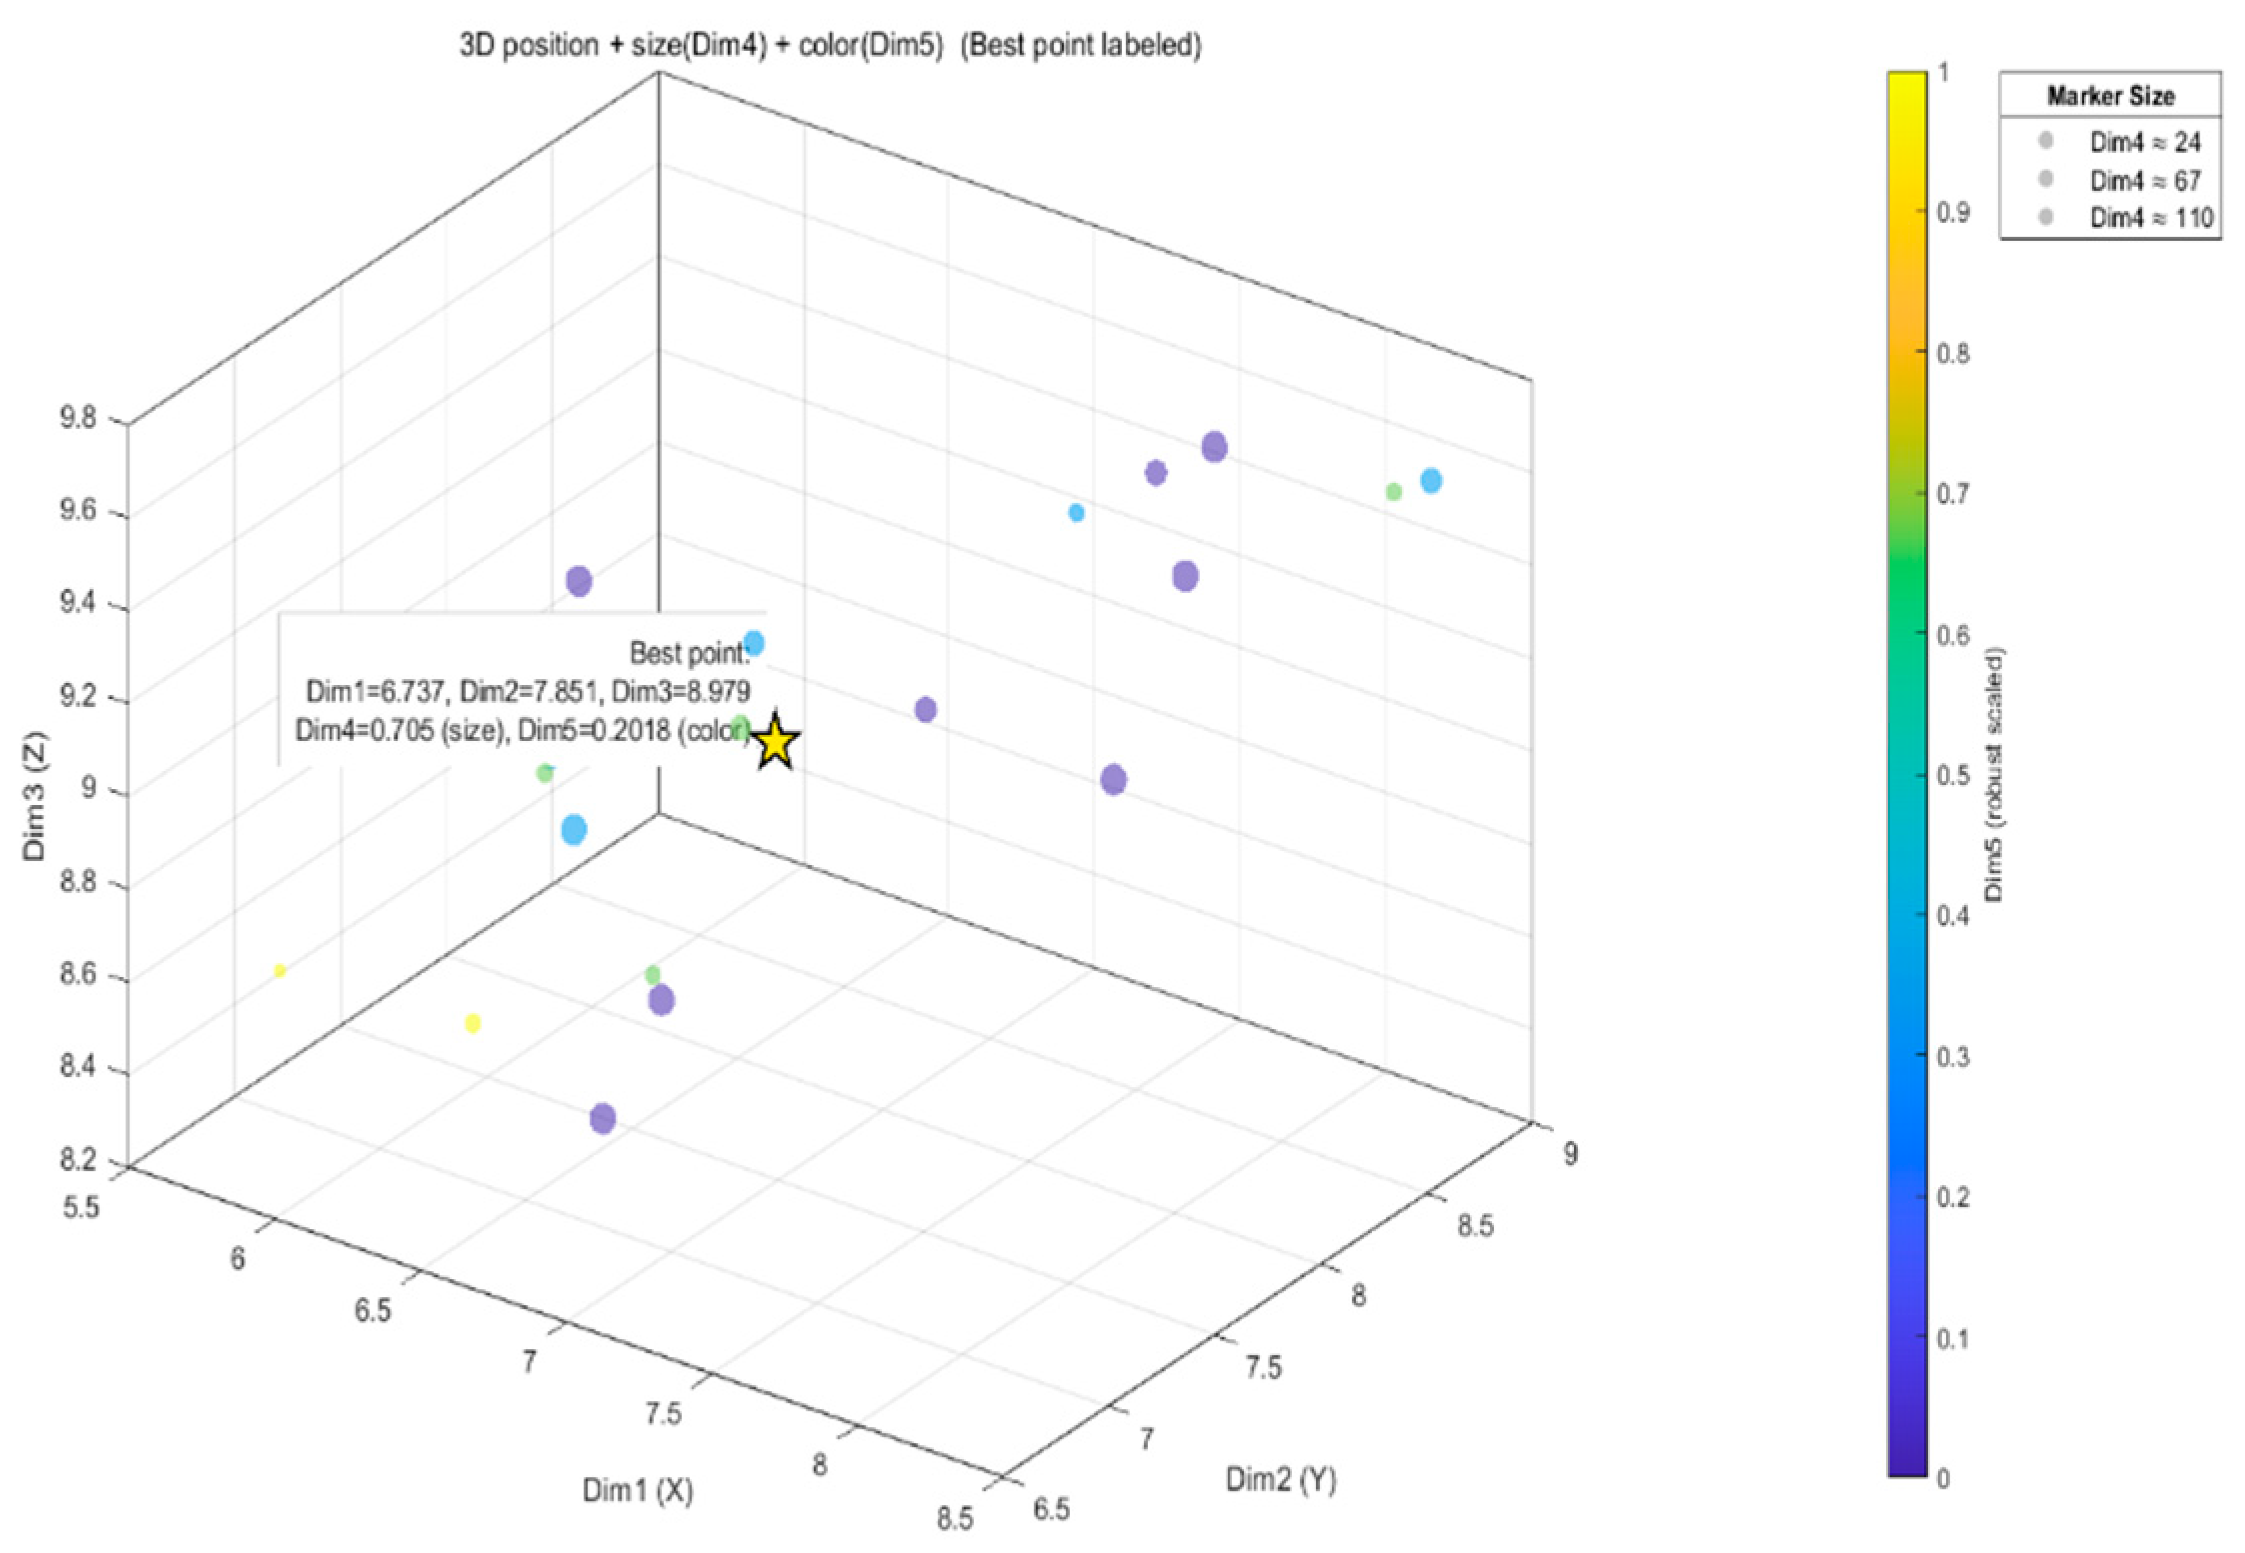
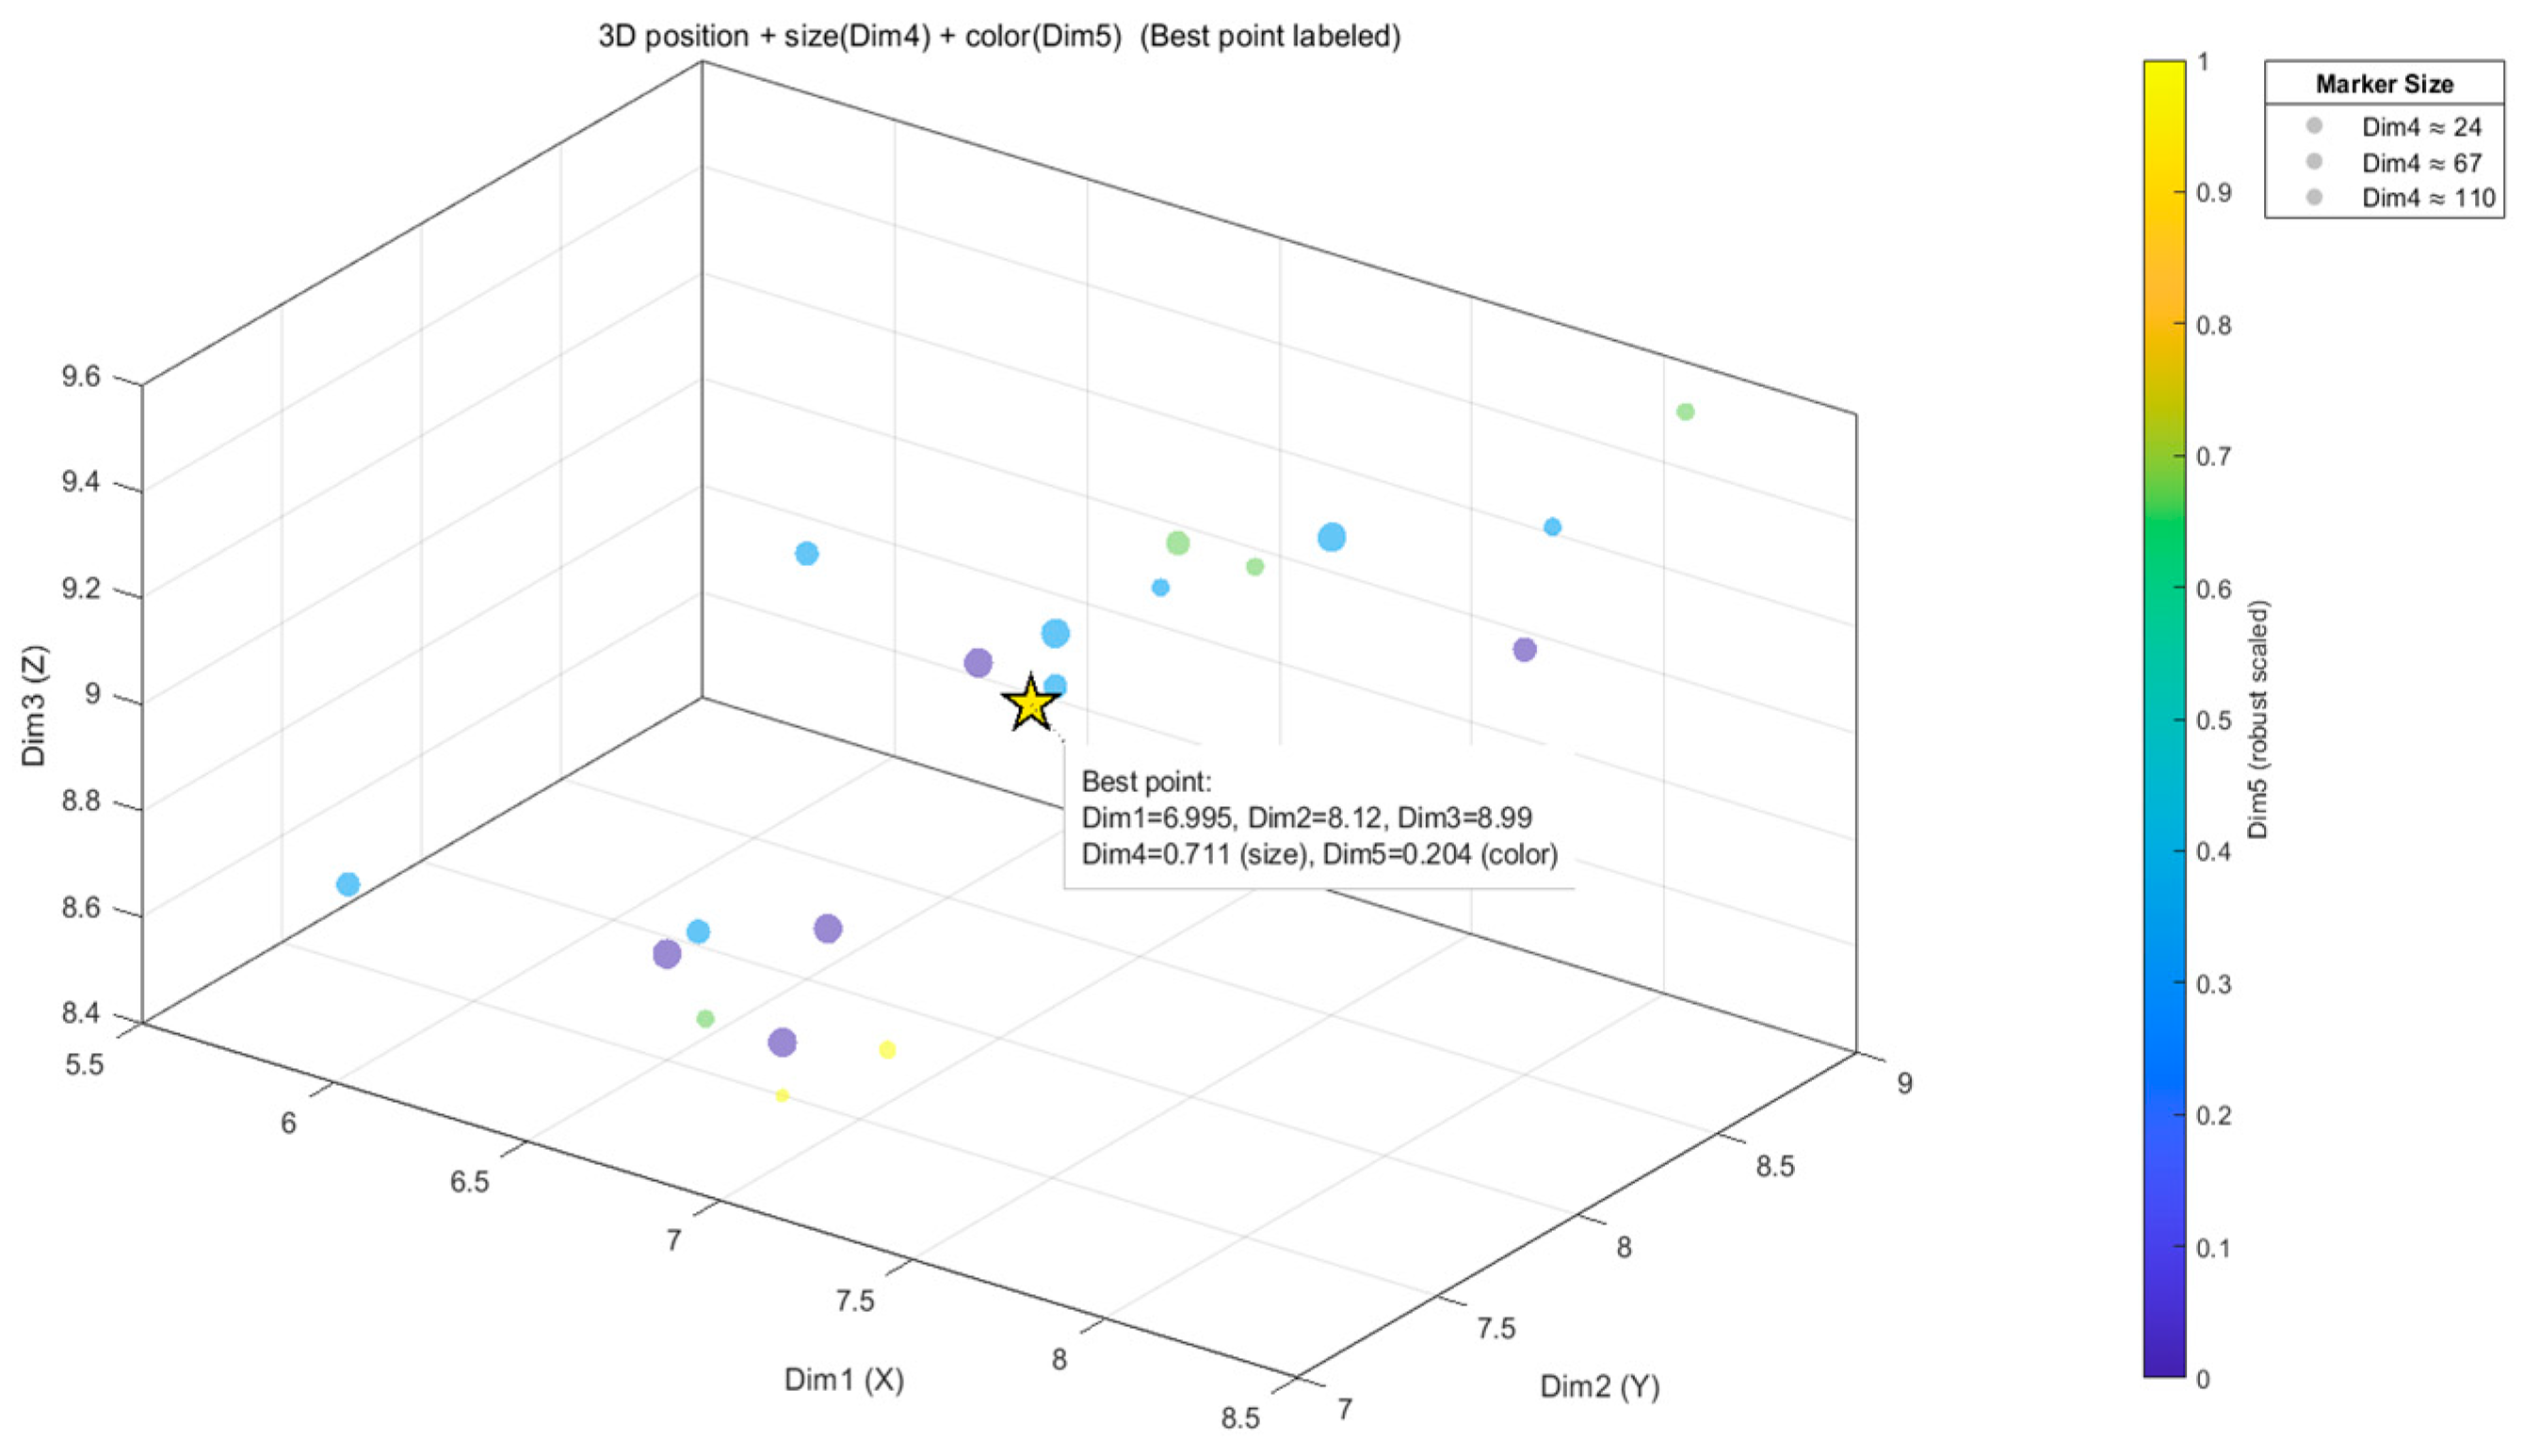
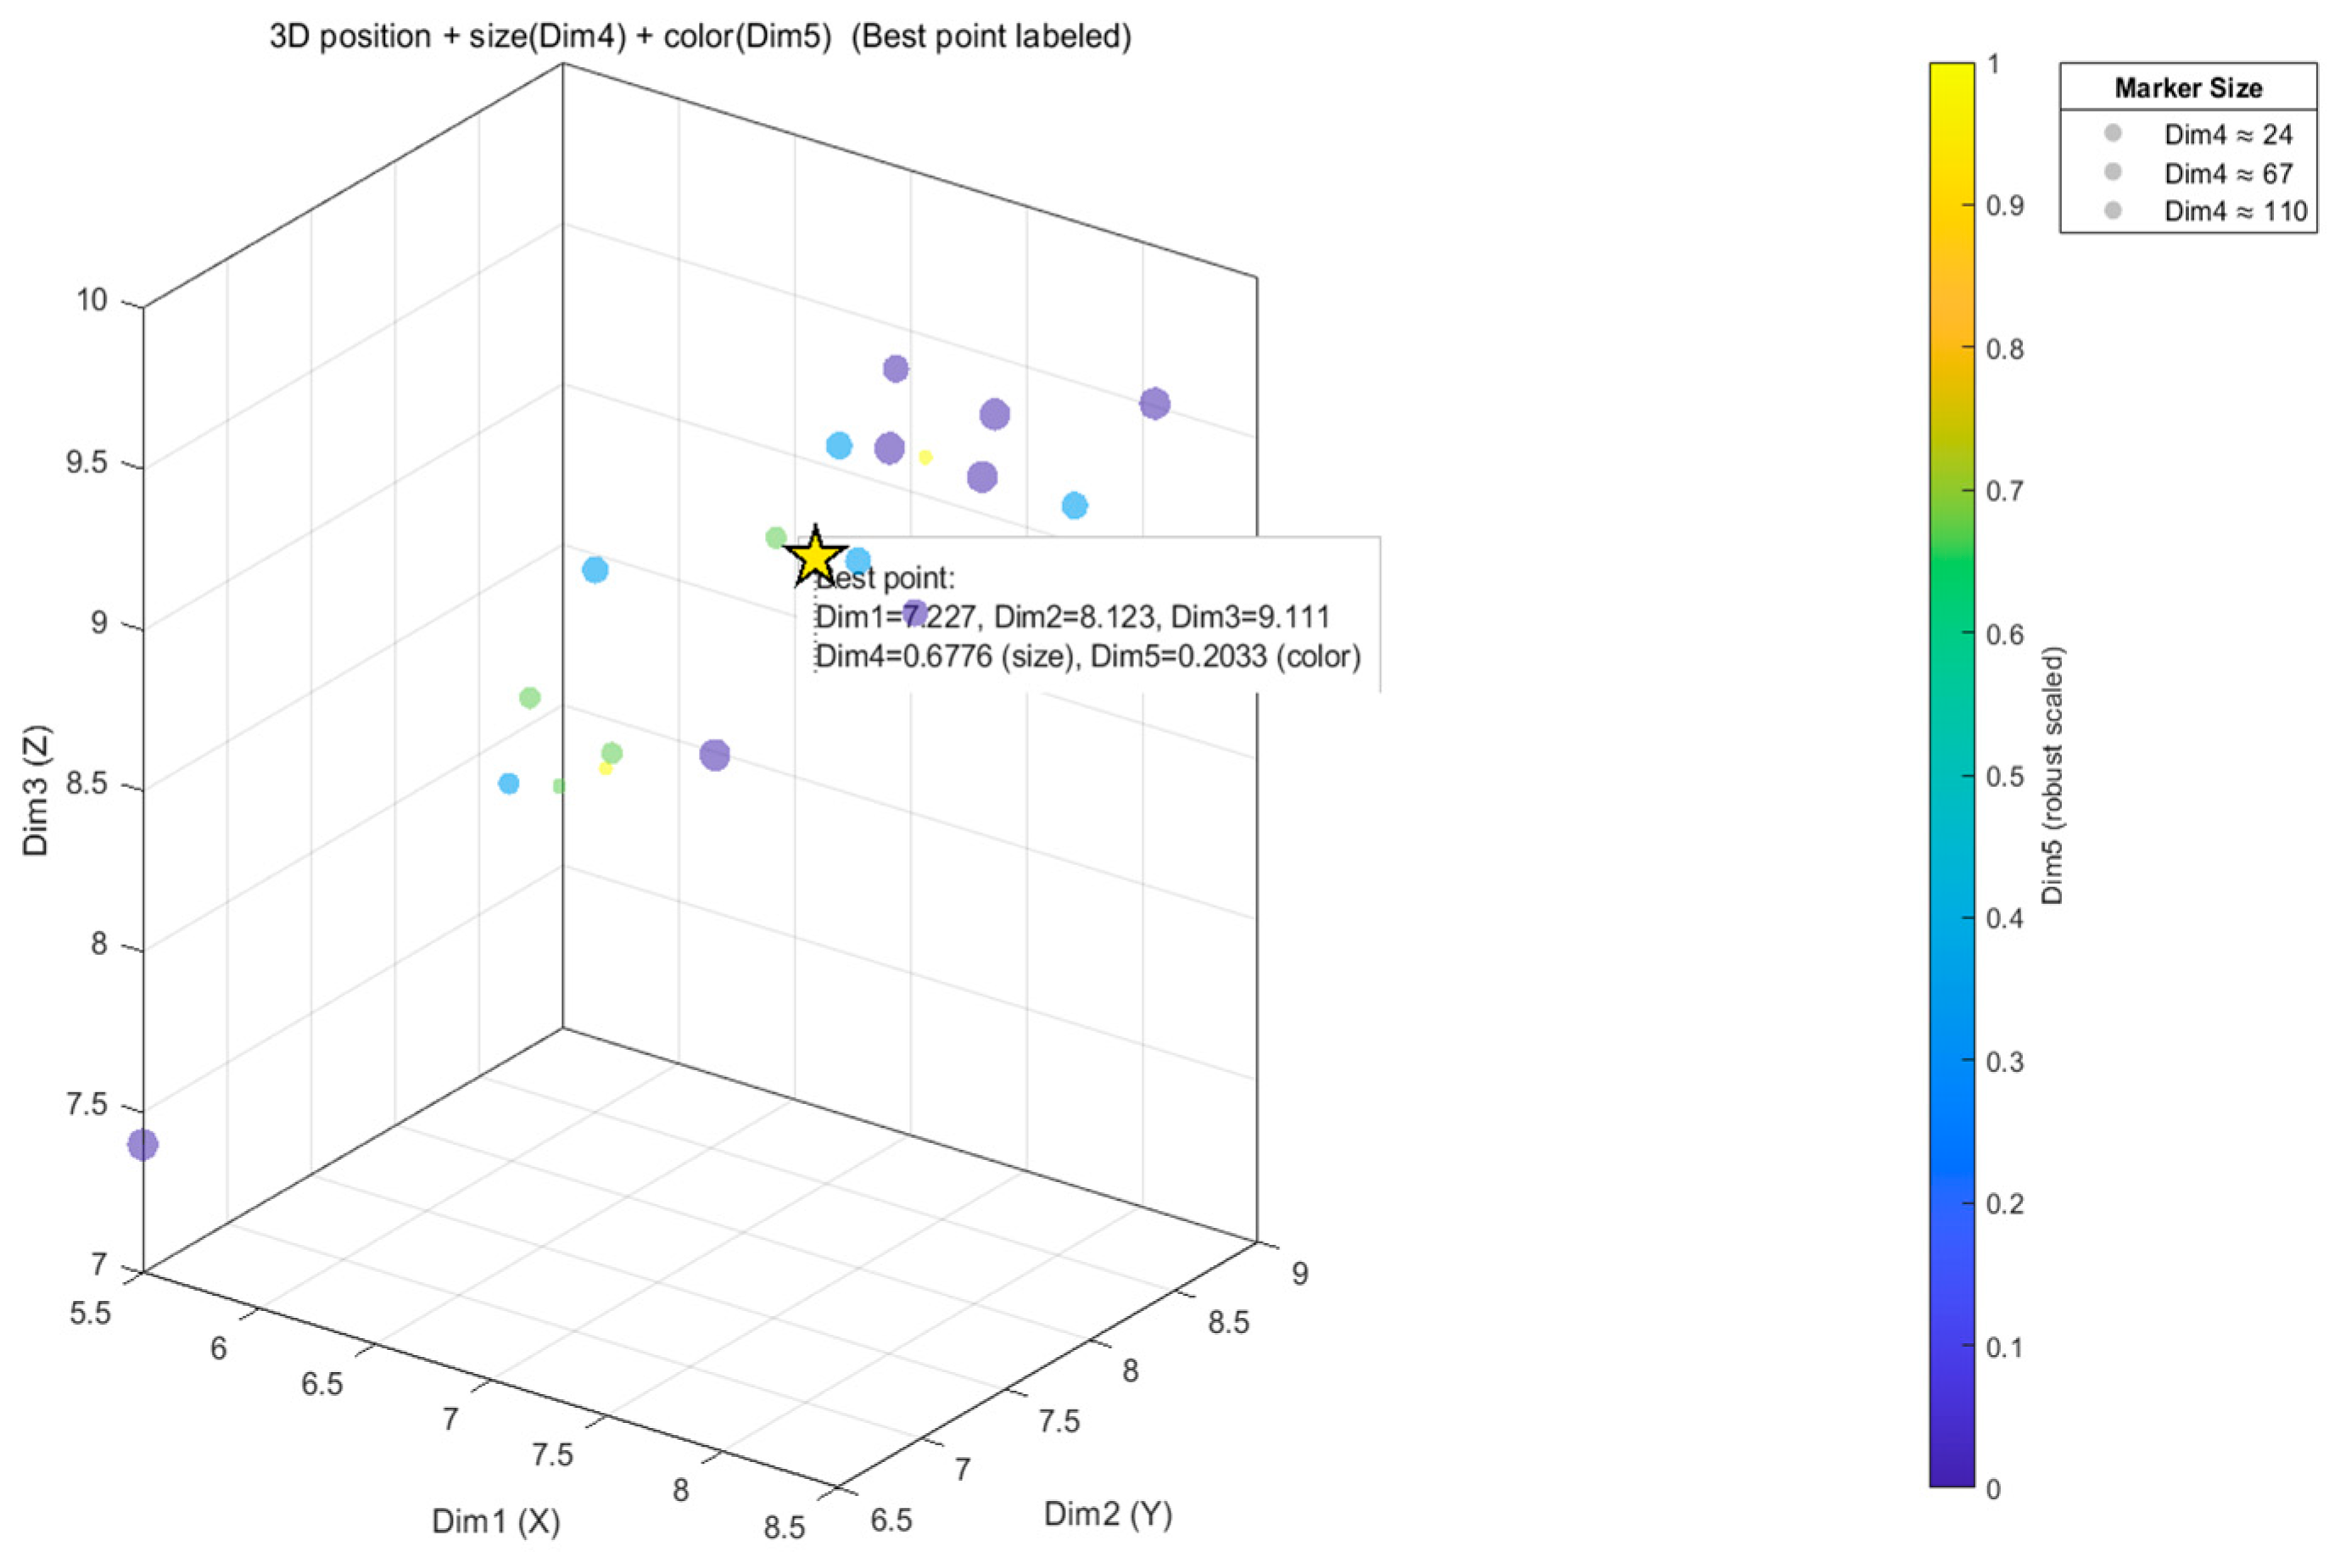
The above raw expert scores are input into the PGSA node algorithm for aggregation, and the optimal node is obtained by iteratively solving for each “scheme-attribute” combination, and the results of aggregation are shown in Table 4. The process of finding the optimal rally point is shown in Figure 5, Figure 6, Figure 7 and Figure 8.
Table 4. The aggregated decision matrix.
Figure 5. The aggregation result of A1 (the yellow star is the best rally point).
Figure 6. The aggregation result of A2 (the yellow star is the best rally point).
Figure 7. The aggregation result of A3 (the yellow star is the best rally point).
Figure 8. The aggregation result of A4 (the yellow star is the best rally point).
In the optimal set node search, represent each TIFN as a five-dimensional vector x = ( x 1 , x 2 , x 3 , x 4 , x 5 ) . Among them, x 1 , x 2 , x 3 are mapped to the spatial coordinates (X, Y, Z) of the three-dimensional scatter plot. For the convenience of displaying all five dimensions simultaneously, x 4 and x 5 are only used for visualization: they are mapped to the size and color of the scatter points respectively (without affecting the three-dimensional position in the figure). When optimizing, we solve for the optimal set nodes based on weighted Euclidean distance in a five-dimensional space, so x 1 ~ x 5 all participate in the calculation.
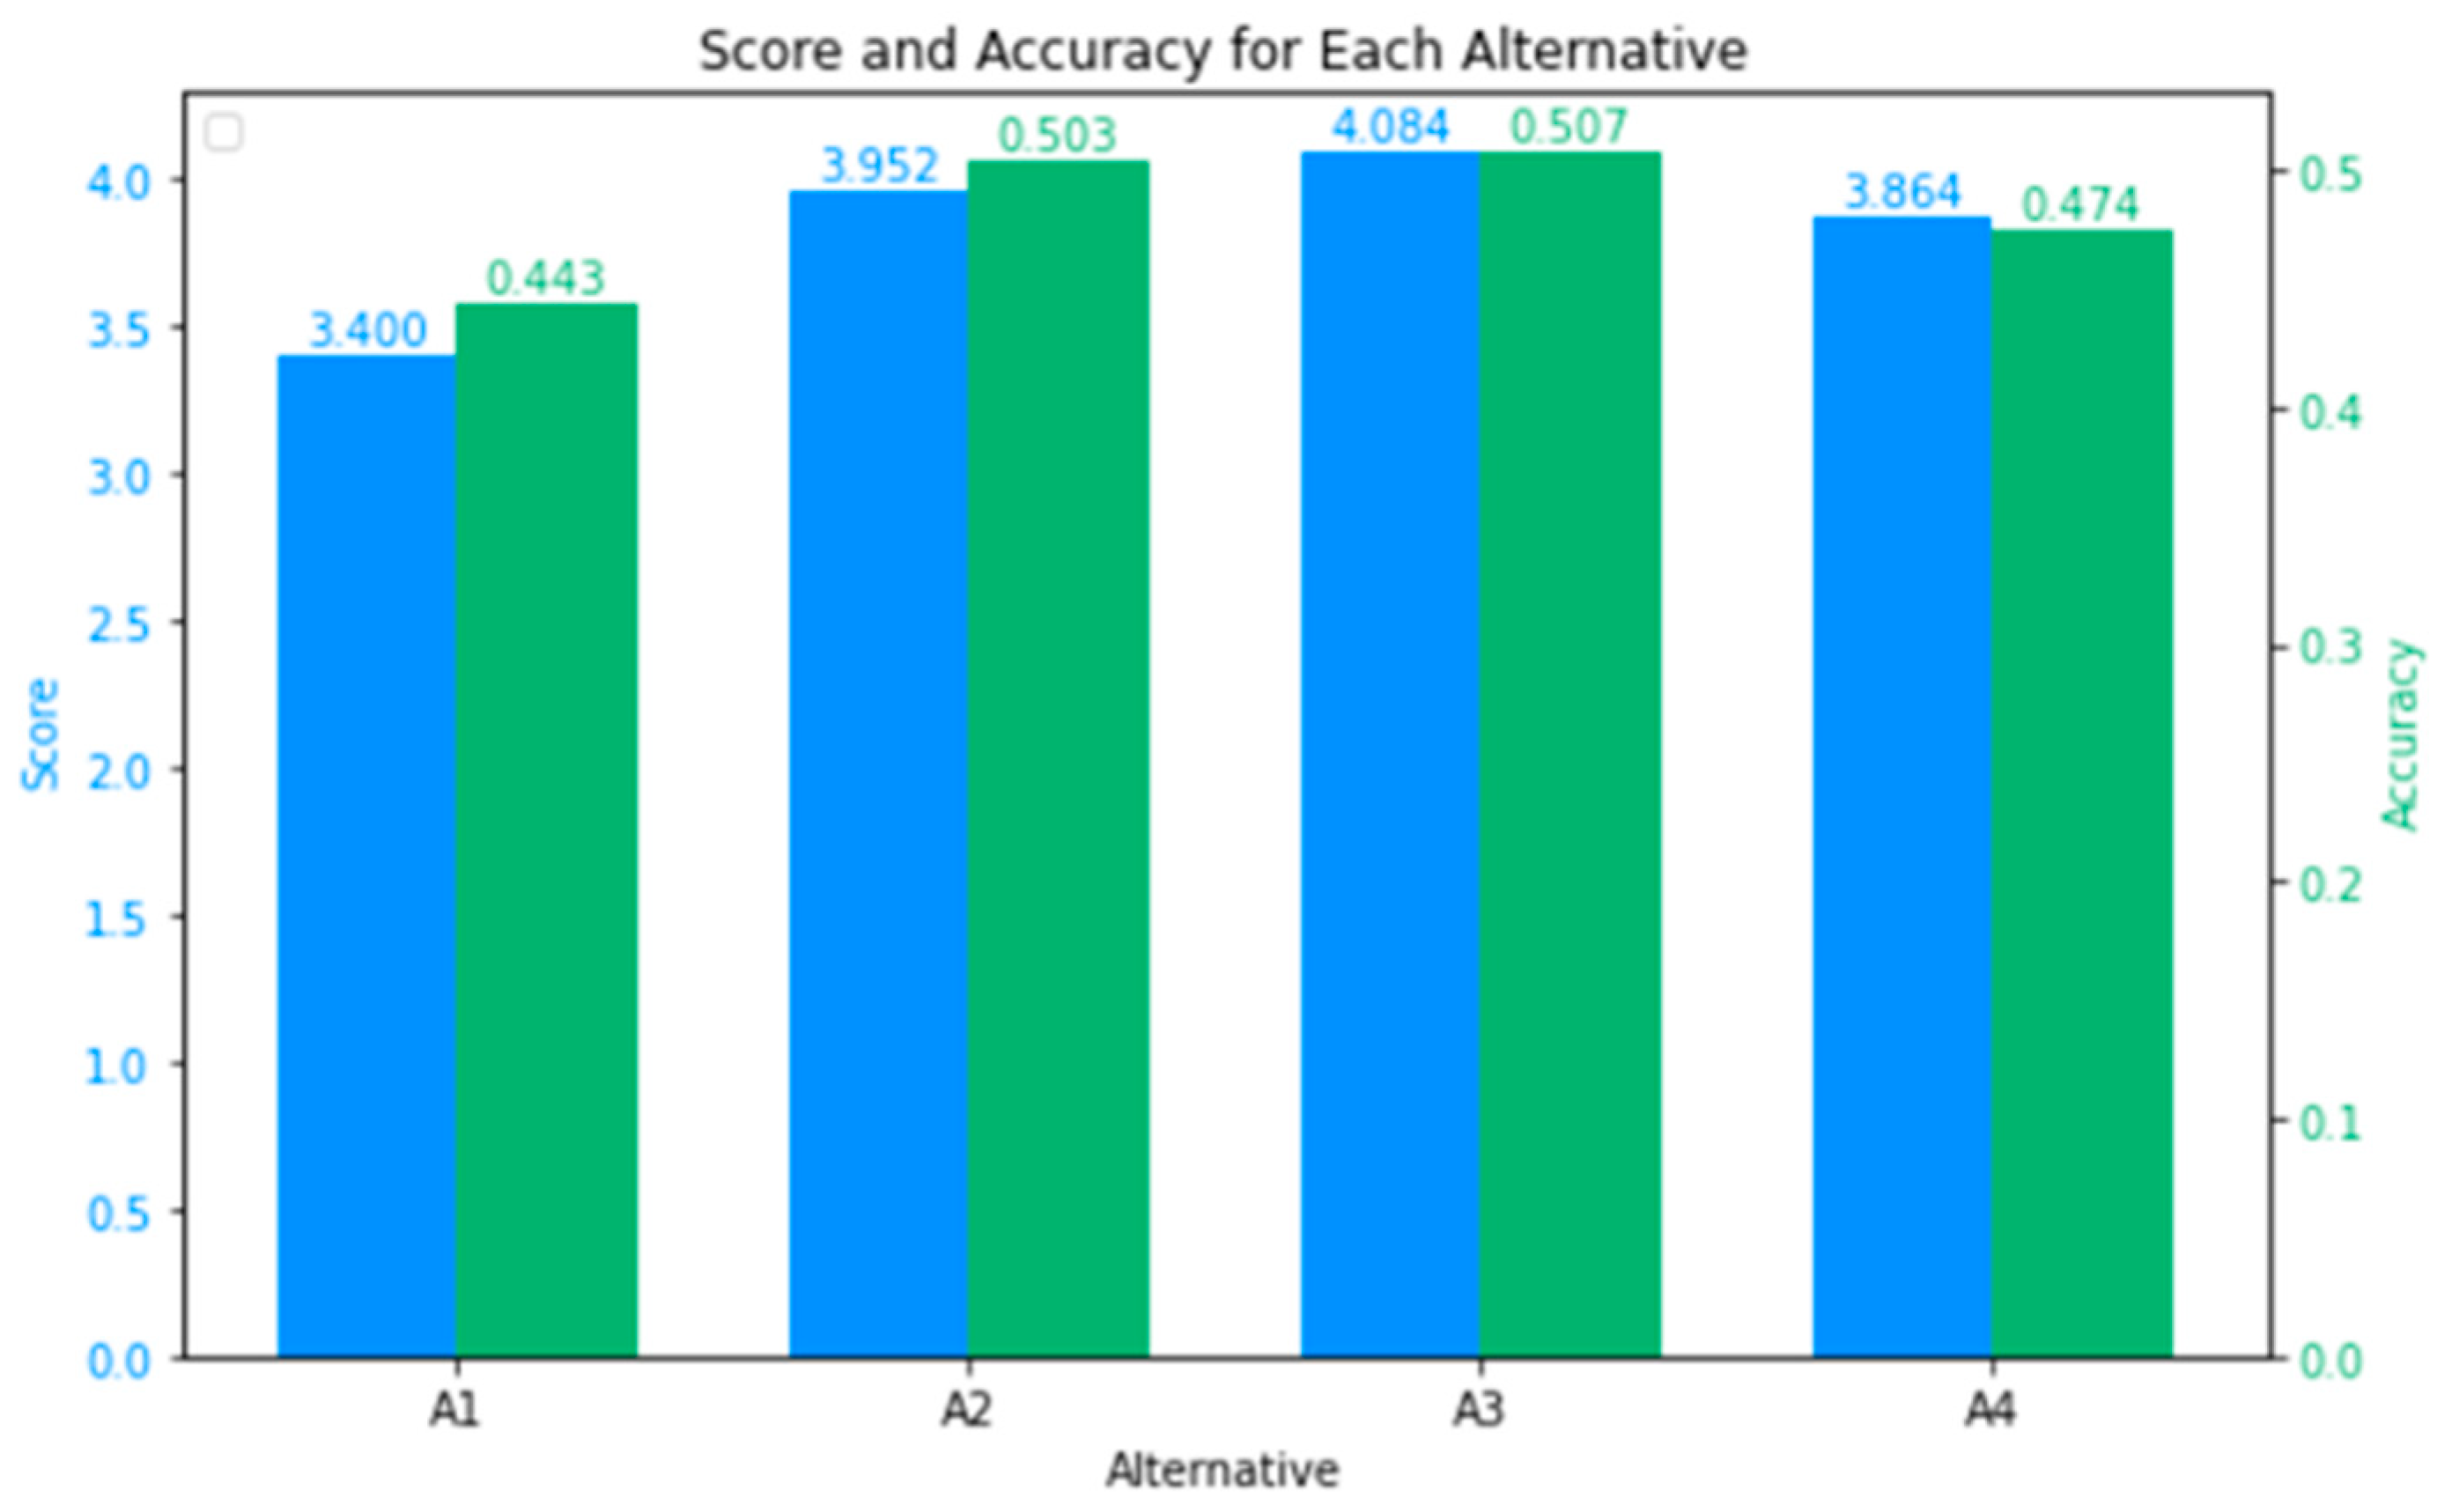
Using the Equations (11) and (12), the scores and accuracy of each scheme were calculated and ranked, as shown in Table 5 and Figure 9.
Table 5. Score and accuracy of each alternative.
Figure 9. Score and accuracy for each alternative.
Therefore, it can be concluded A 3 > A 2 > A 4 > A 1 .

5.2. Comparative Study

In this paper, the evaluation index system is systematically constructed from four dimensions: sum of Hamming distance, sum of relevance, information intuition energy and sum of correlation coefficient. The above indicators are used to quantitatively measure the degree of deviation between multi-expert preference information and collective evaluation results, directional consistency, and the strength of its inherent fuzzy information, respectively. By comprehensively examining these four indicators, the information distribution characteristics and aggregation effect in the process of expert opinion aggregation can be revealed in a more comprehensive and detailed way. The specific meanings and formalized definitions of the indicators are shown below.
(1) The sum of Hamming distances is used to measure the overall distance between the TIFN of the aggregated scheme and the original evaluations of each attribute, reflecting the ability of the aggregated results to maintain the original information. The smaller the distance, the more representative the aggregated result is of the original evaluation. Let the TIFN of alternative A i after aggregation be A ˜ i = ( a i , b i , c i ; μ i , v i ) , and its original TIFN on attribute C j be A ˜ i j = ( a i j , b i j , c i j ; μ i j , v i j ) , then the Hamming distance of the scheme is
D H ( A i ) = i = 1 m d H ( A ˜ i , A ˜ i j ) ,
where the Hamming distance between individual TIFNs is defined as:
d H ( A ˜ i , A ˜ i j ) = 1 5 ( | a i a i j | + | b i b i j | + | c i c i j | + | μ i μ i j | + | v i v i j | )
The sum of the distances in Hamming is
D H , t o t a l = i = 1 n D H ( A i ) ,
(2) Correlation is used to measure the linear consistency of the aggregation results with the original attribute evaluation mean, reflecting the degree of agreement between the aggregated scores and the original evaluation distribution. Pearson correlation coefficient is commonly used.
Define the score function for TIFNs:
S ( a , b , c , μ , v ) = a + 2 b + c 4 μ a + 2 b + c 4 v ,
The aggregation score for scenario A i is then S i and the mean of the raw scores for each attribute is S ¯ i .The correlation is
ρ = i = 1 n ( S i S ¯ ) ( S ¯ i S ¯ ¯ ) i = 1 n ( S i S ¯ ) 2 i = 1 n ( S ¯ i S ¯ ¯ ) 2 ,
where S ¯ and S ¯ ¯ are the means of the aggregation score and the raw mean score, respectively.
(3) Information intuition energy measures the information richness and distribution characteristics of TIFN evaluations. The higher the energy, the wider the “distribution” of the evaluation in the five-dimensional space and the higher the information content.
For TIFN A ˜ = ( a , b , c , μ , v ) :
E ( A ˜ ) = 1 5 ( a 2 + b 2 + c 2 + μ 2 + v 2 ) ,
The sum of the energies of all the schemes after aggregation is
E t o t a l = i = 1 n E ( A ˜ i ) ,
(4) The sum of correlation coefficients is used to assess the directional consistency between the aggregated TIFN and the original attribute TIFN in the five-dimensional space, and is commonly used as the cosine similarity or multivariate correlation coefficient. The larger it is indicates that the aggregation result maintains the spatial characteristics of the original evaluation.
Cosine similarity is defined as:
cos ( θ ) = k = 1 5 x k y k k = 1 5 x k 2 k = 1 5 y k 2 ,
where x = ( a i , b i , c i , μ i , v i ) is the aggregated TIFN and y = ( a i j , b i j , c i j , μ i j , v i j ) is the original TIFN.
The sum of correlation coefficients is
C t o t a l = i = 1 n j = 1 m cos ( θ i j ) .
Classical TIFN aggregation operators—including generalized means, power-average families, and parameterized t-norm/t-conorm operators—combine attribute values through explicit formulas that perform well in low-dimensional settings. However, these operators aggregate locally and cannot capture the global distribution of expert opinions in high-dimensional spaces. The proposed PGSA–TIFN model differs in three aspects:
(1) Geometry preservation: PGSA optimizes a distance-based fitness over the entire point cloud, maintaining the spatial relations of TIFN data and improving Hamming-distance and correlation consistency (see Table 5 and Figure 10).
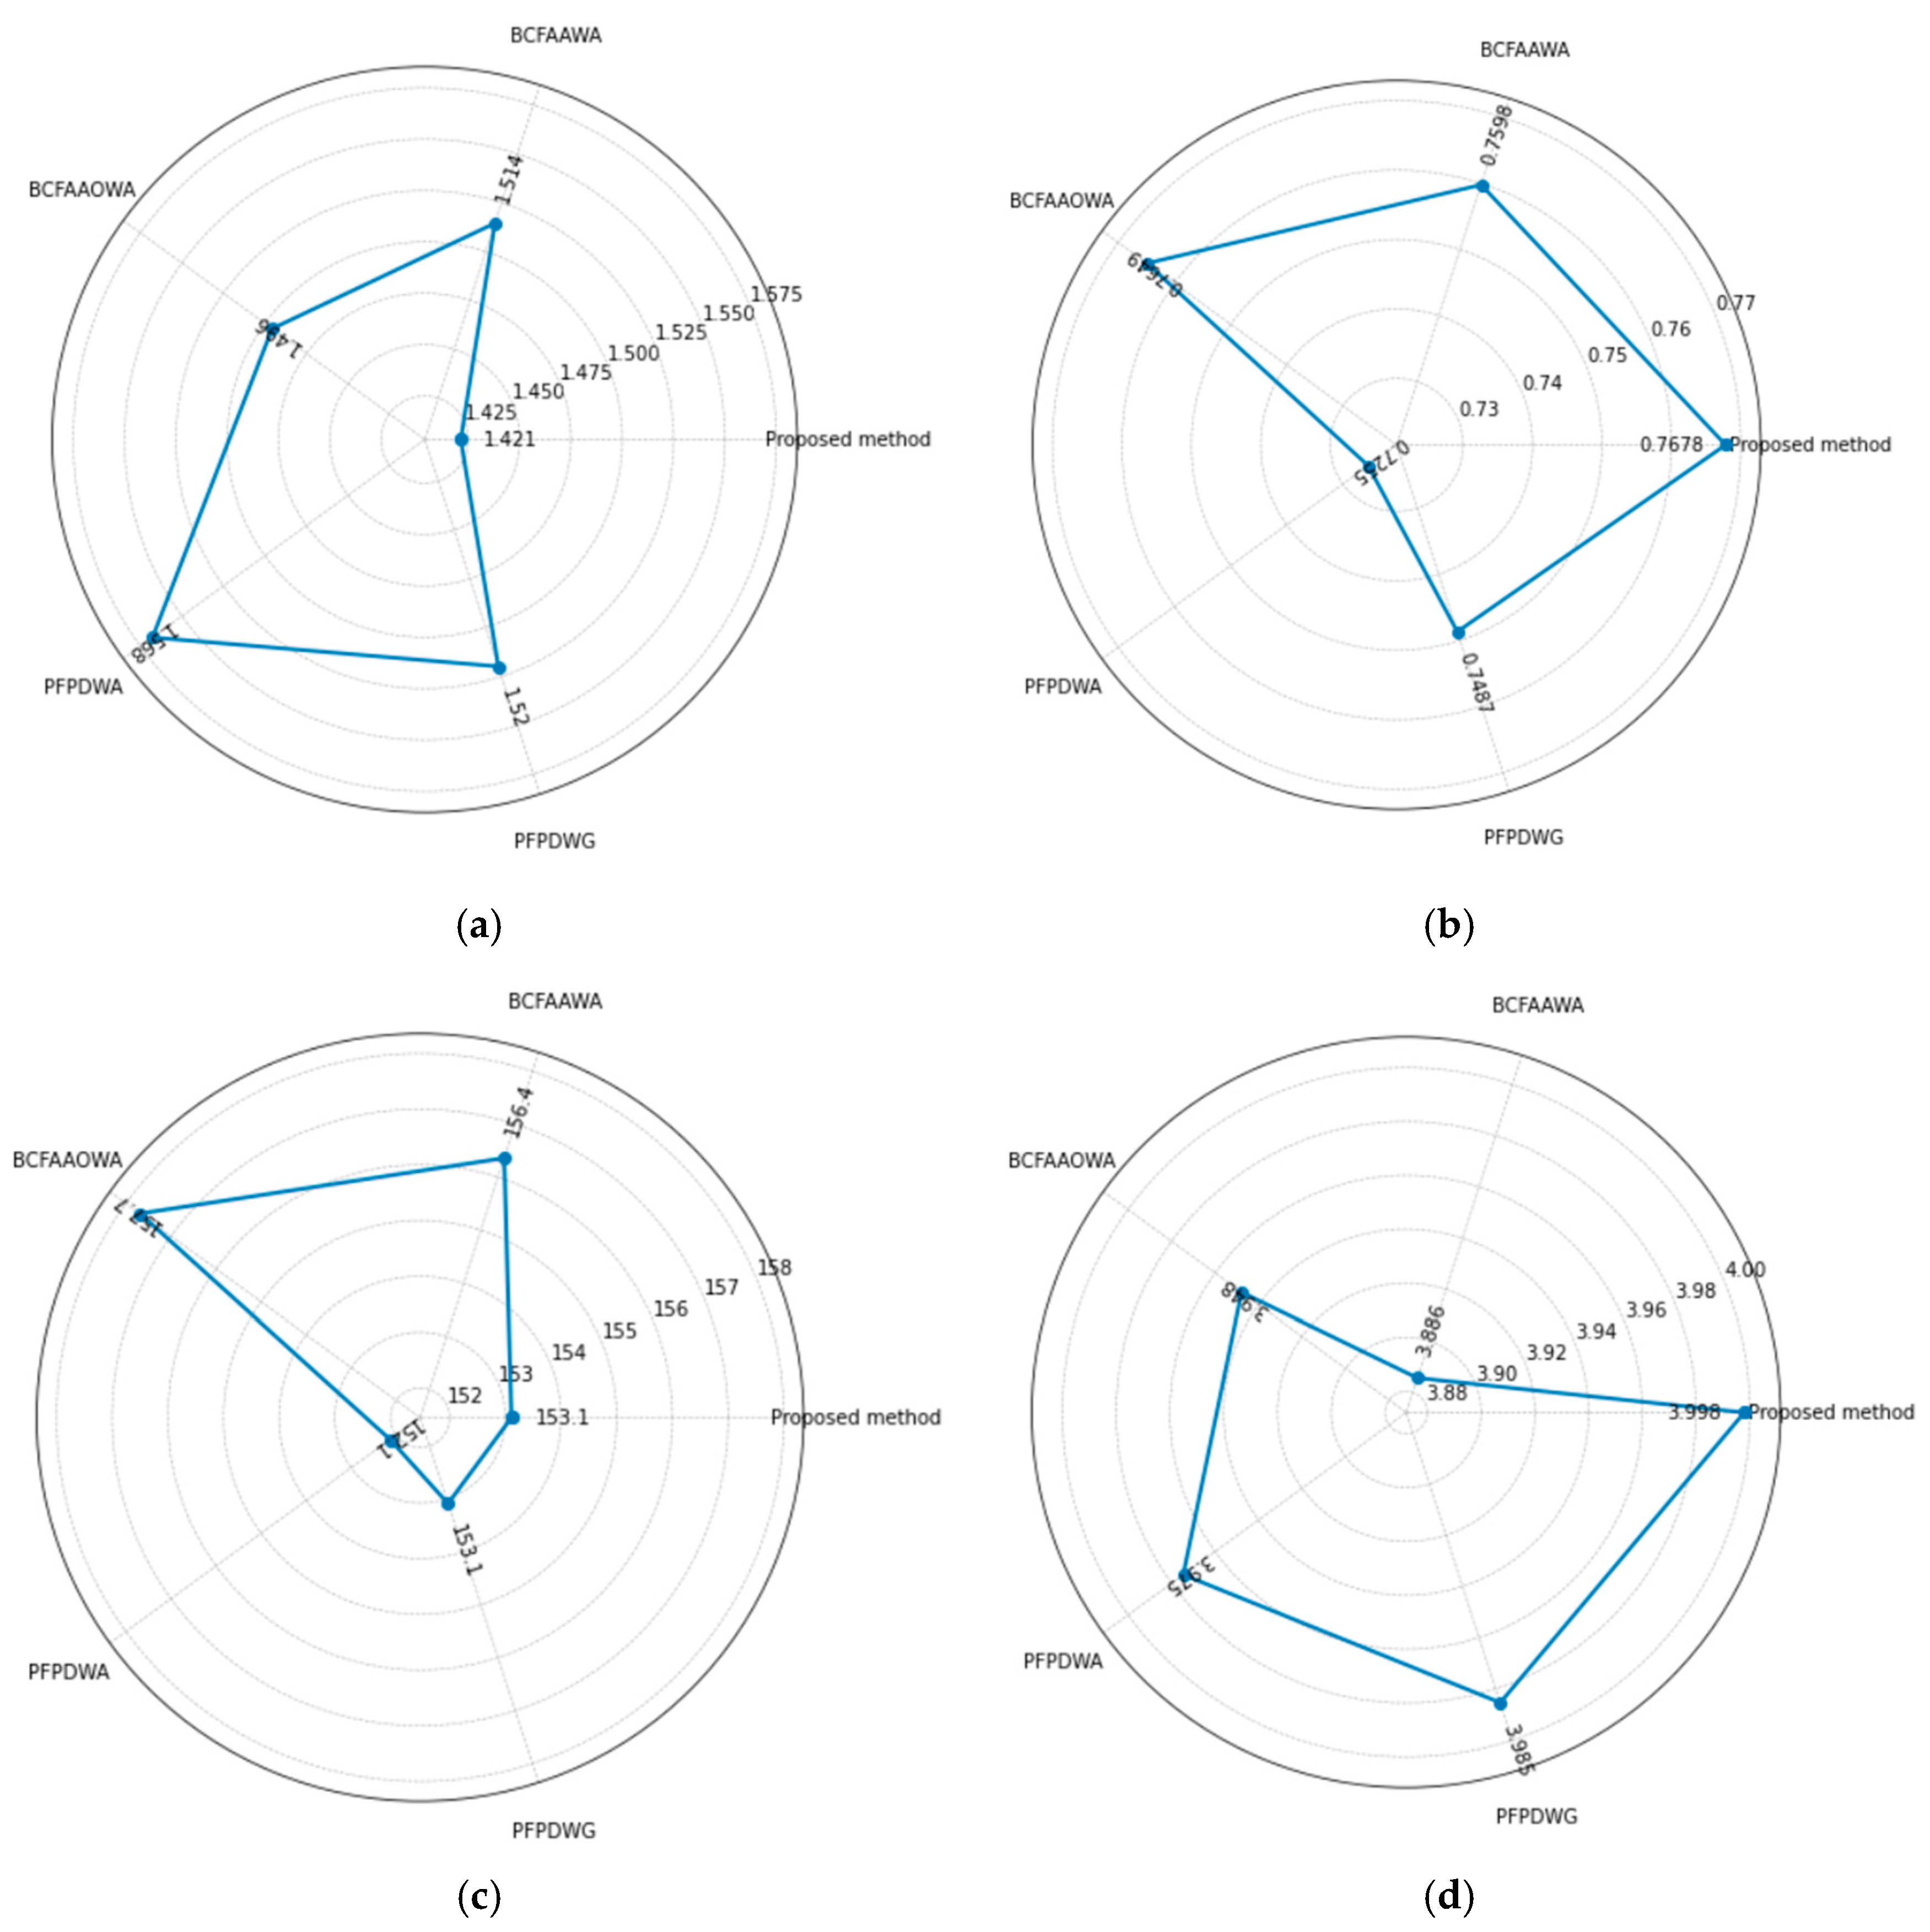
Figure 10. (a). Comparison results on D H , t o t a l ; (b) comparison results on ρ ; (c) comparison results on E t o t a l ; (d) comparison results on C t o t a l .
(2) Outlier resistance: Its iterative, phototropism-inspired growth suppresses isolated extremes and stabilizes rankings under attribute anomalies.
(3) Parameter robustness: Unlike highly parameterized operators that require fine tuning, PGSA uses only a few search parameters and shows stable performance across cases.
Therefore, the proposed method complements and often outperforms operator-based schemes when data heterogeneity and dimensionality increase.
In order to verify the reasonableness of the method proposed in this paper, the data from Lu’s paper [43] are used and compared with several methods, namely BCFAAWA [44], BCFAAOWA [44], PFPDWA [44], PFPDWG [44], in a comparative experiment, and the final decision rankings are shown below.
(1) Proposed method: A 3 > A 2 > A 4 > A 1
(2) BCFAAWA: A 3 > A 2 > A 4 > A 1
(3) BCFAAOWA: A 3 > A 2 > A 4 > A 1
(4) PFPDWA: A 3 > A 2 > A 4 > A 1
(5) PFPDWG: A 3 > A 2 > A 4 > A 1 .
At the same time, this paper also utilizes the Equations (13)–(21), and calculates the four indicators of Hamming distance sum, correlation sum, information intuition energy and correlation coefficient sum for portraying the degree of deviation, directional consistency, and fuzzy information strength between multi-expert preference information and collective evaluation, and the specific results are shown in Table 6 and Figure 10.
Table 6. Accuracy comparison.
As can be seen from Table 5 and Figure 10, the method proposed in this paper achieves better results than the comparative methods in the core evaluation indexes such as the sum of Hamming distance, the sum of correlation and the correlation coefficient, which fully indicates that the method shows strong advantages in enhancing the consistency of the experts’ opinions and the stability of the group aggregation. Although it is slightly lower than some existing methods in terms of information intuitive energy, overall, the proposed method is superior in the trade-off between information concentration and expert consistency, which further improves the reliability and practical application value of the decision-making results.

5.3. Sensitivity and Convergence Analysis

To further evaluate the robustness and scalability of the proposed PGSA–TIFN aggregation framework, this section investigates the sensitivity of key hyperparameters (L, α, ε), the convergence characteristics of the optimization process, and the runtime scaling behavior with increasing dimensionality.

5.3.1. Parameter Sensitivity of PGSA

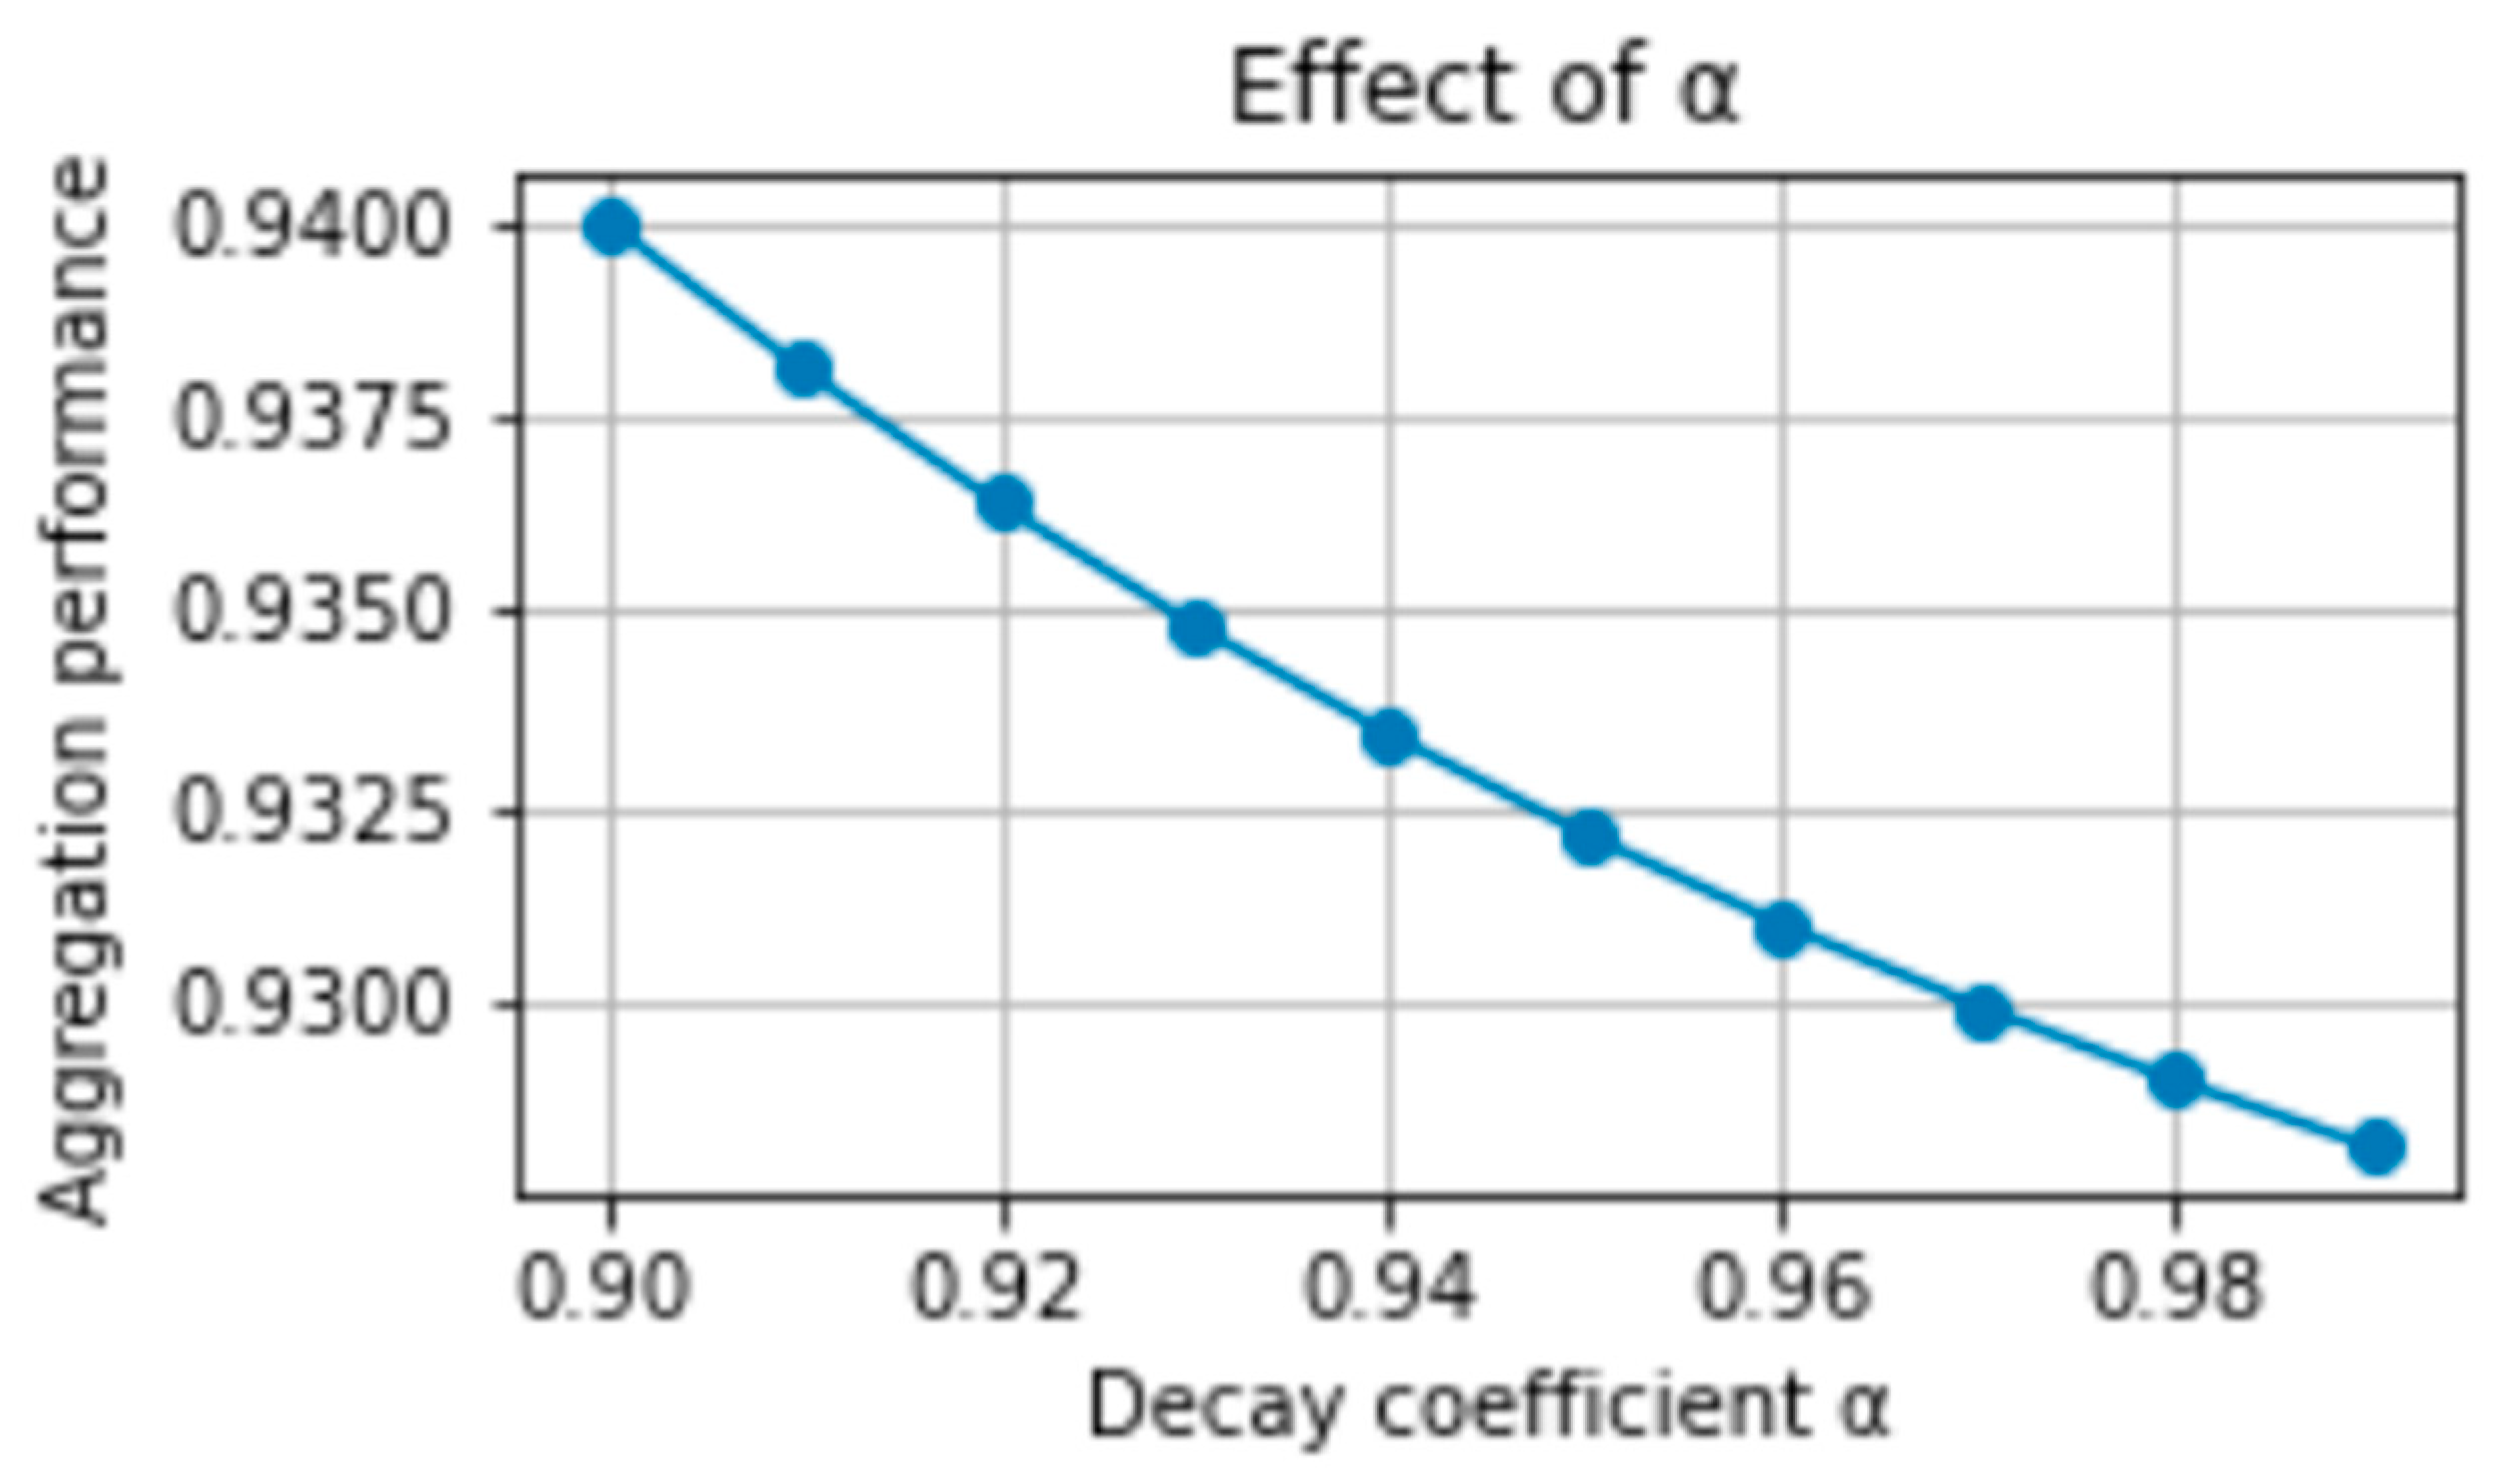
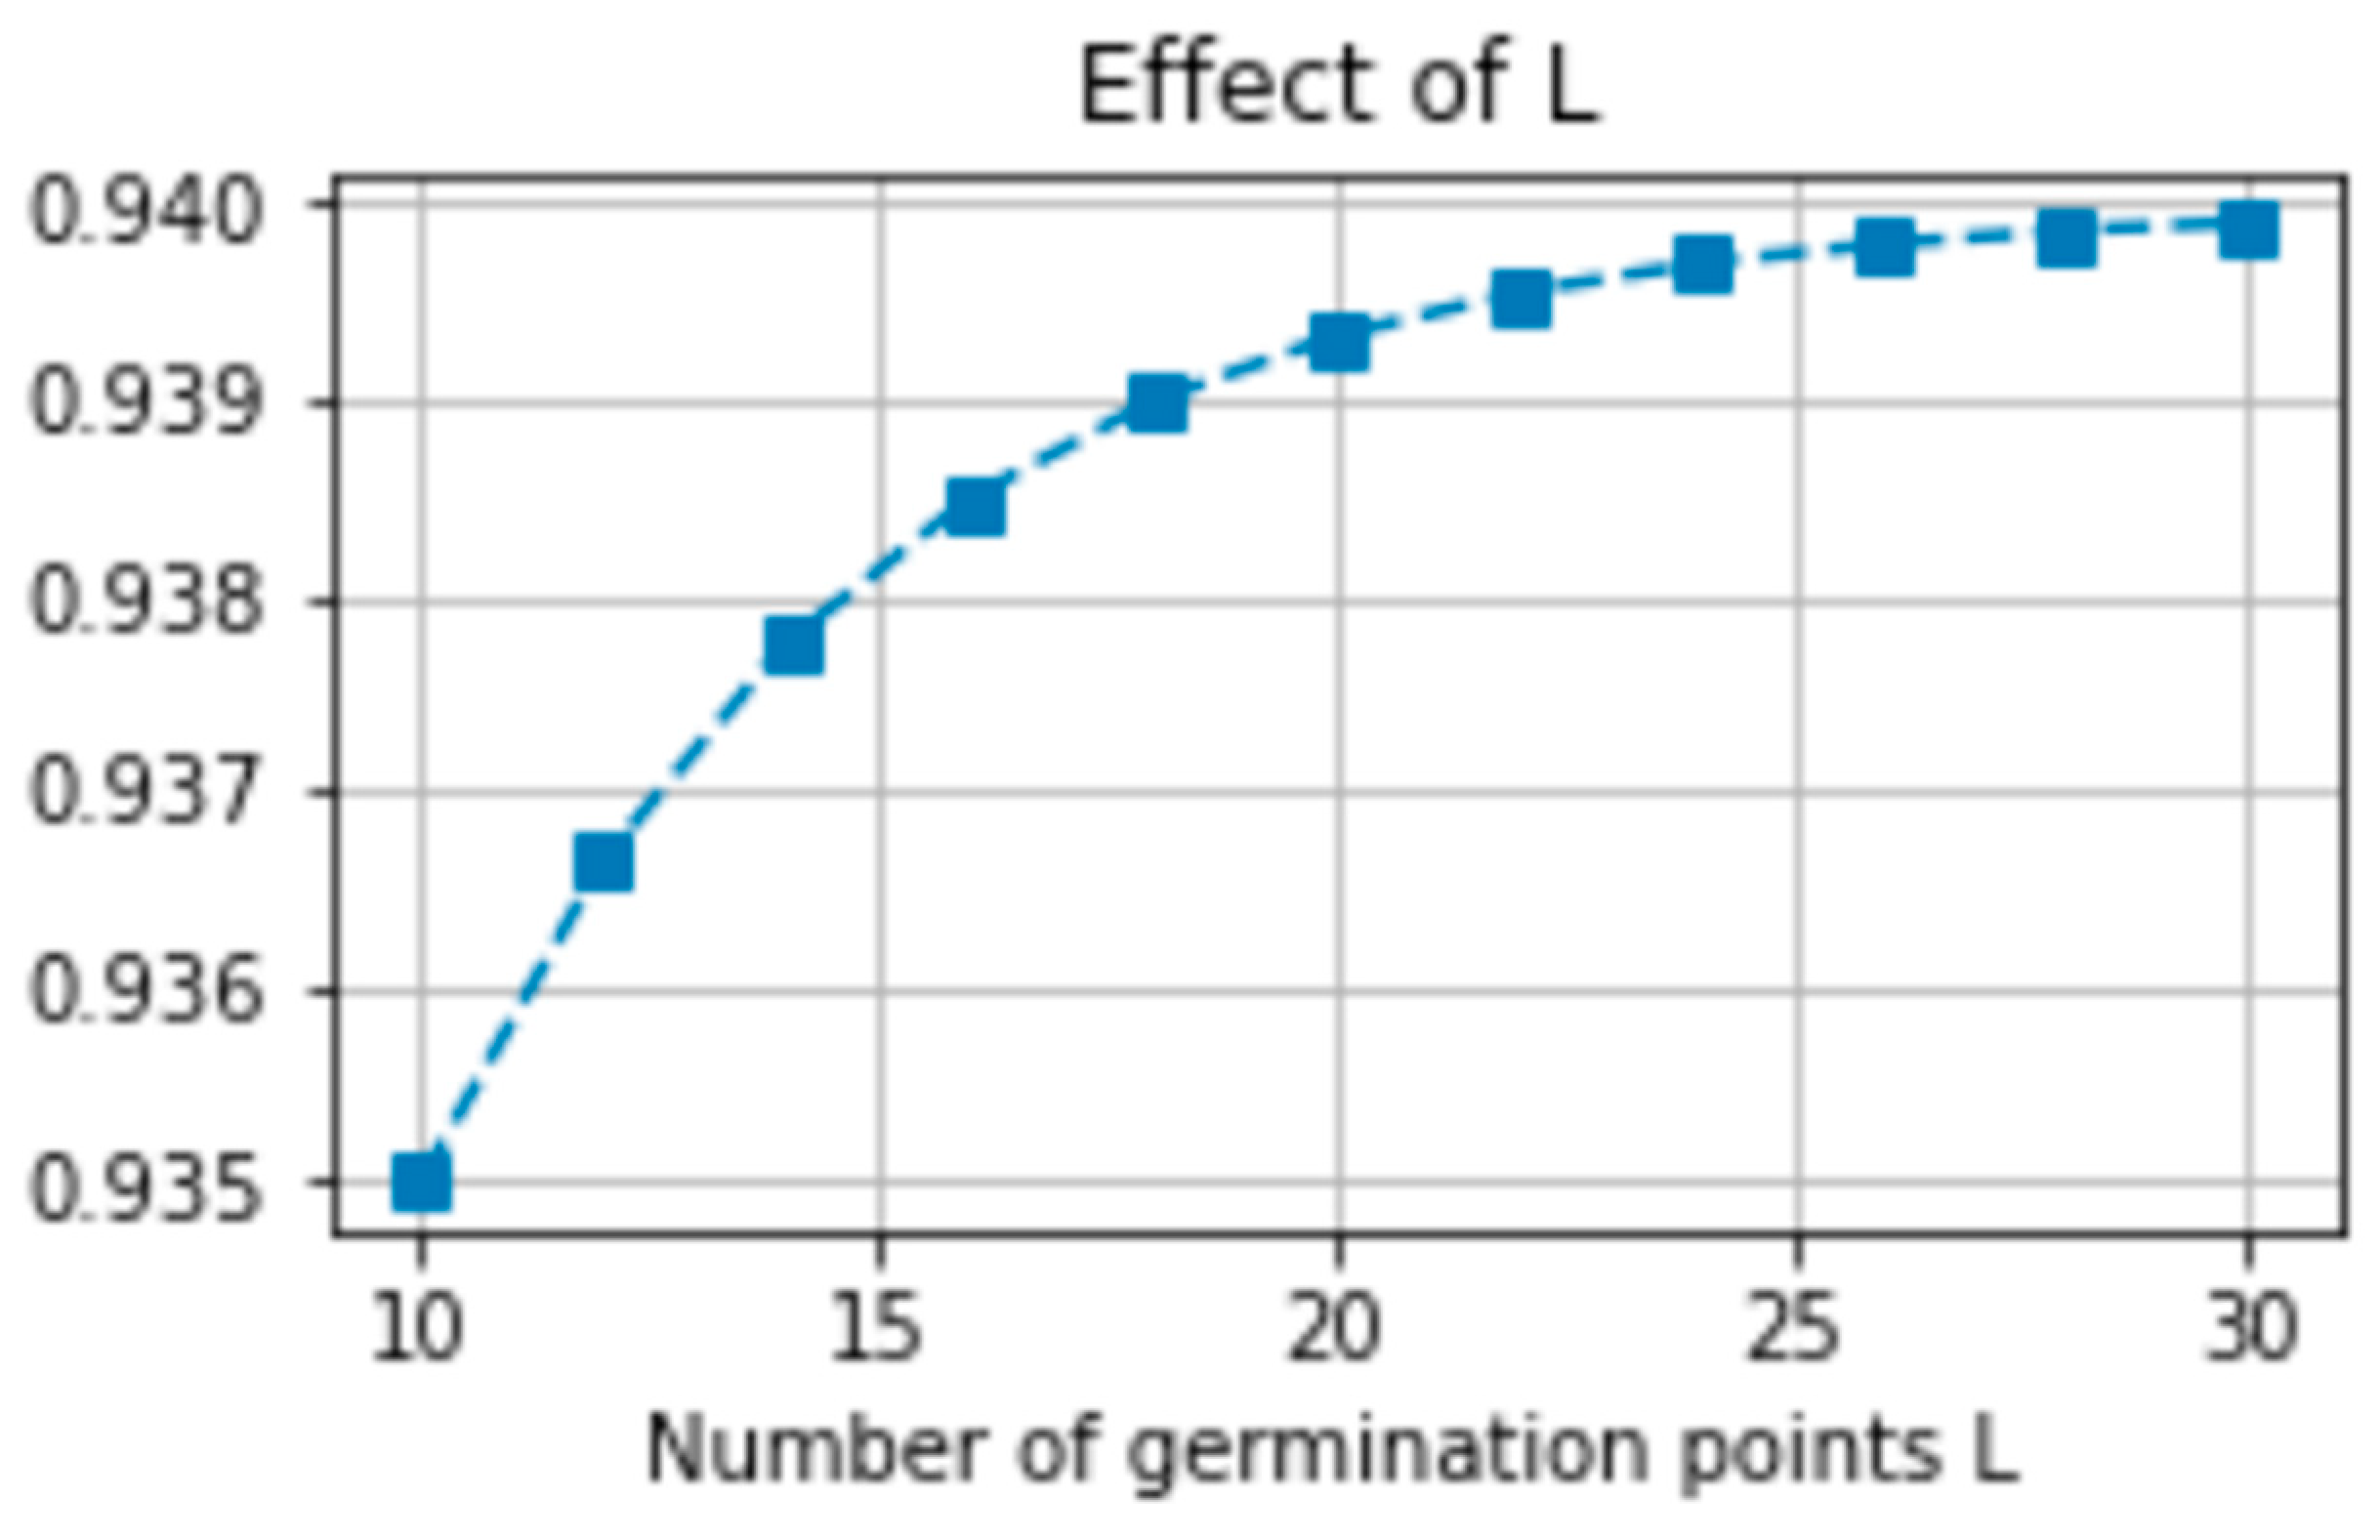
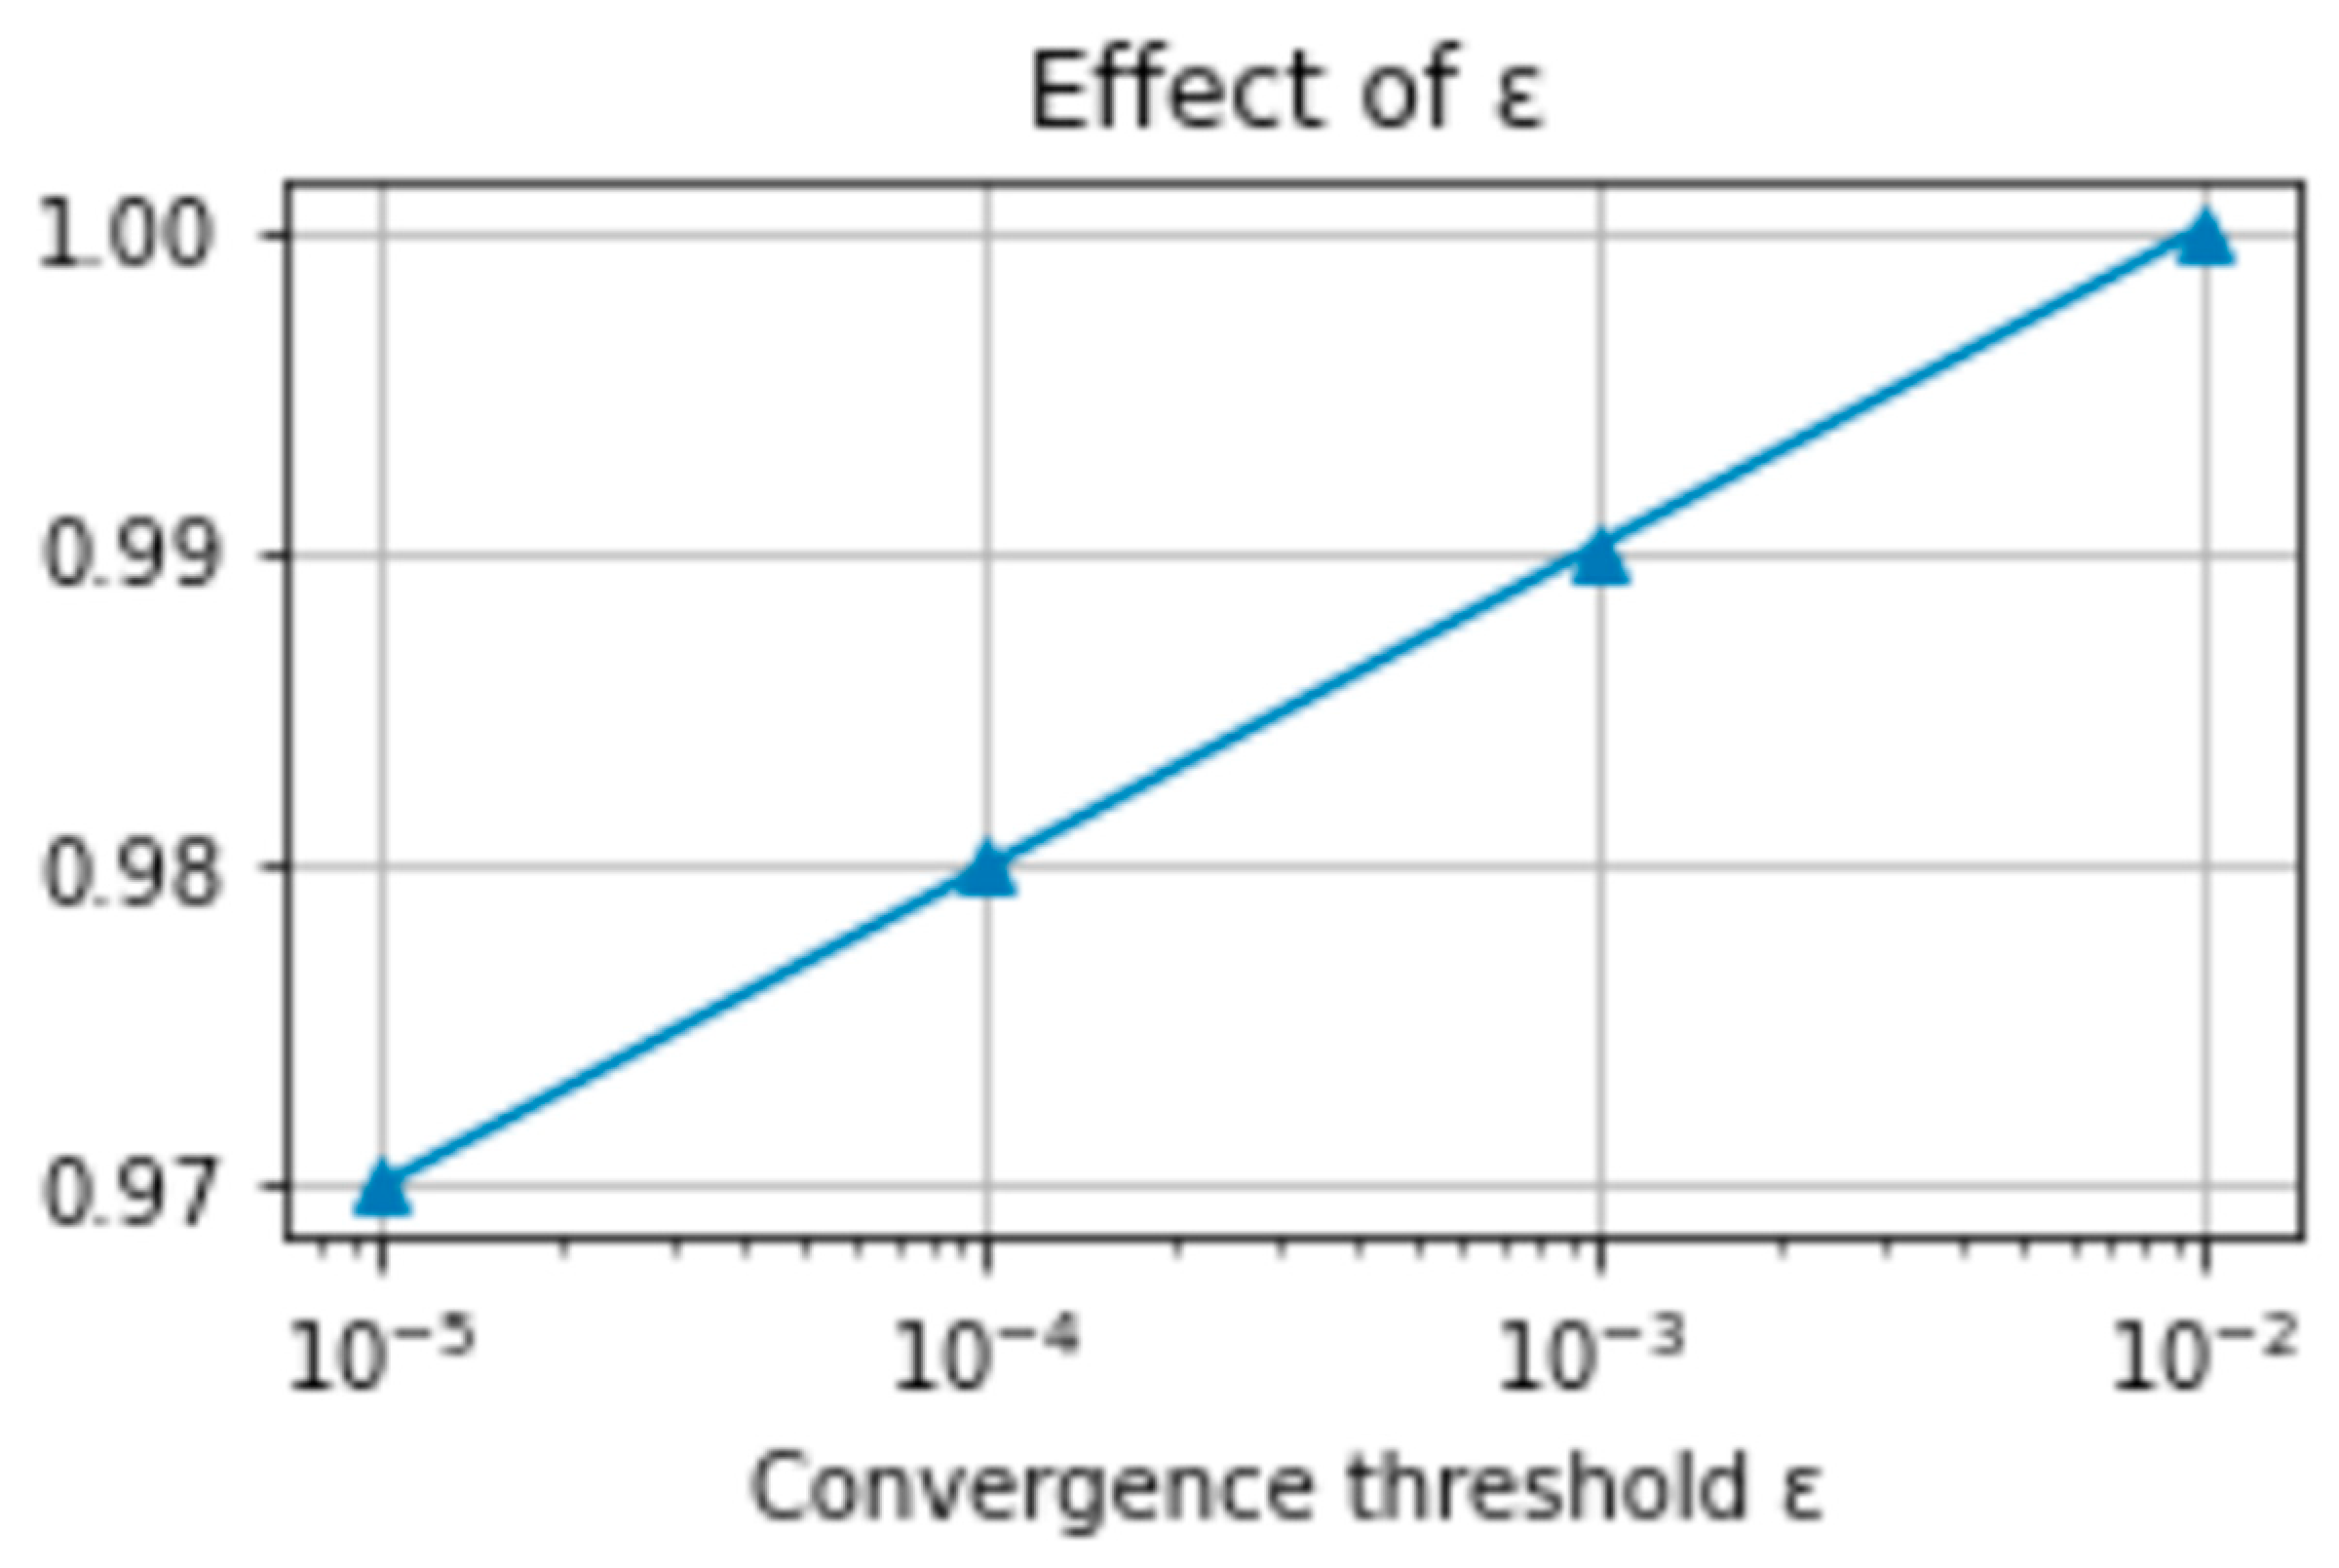
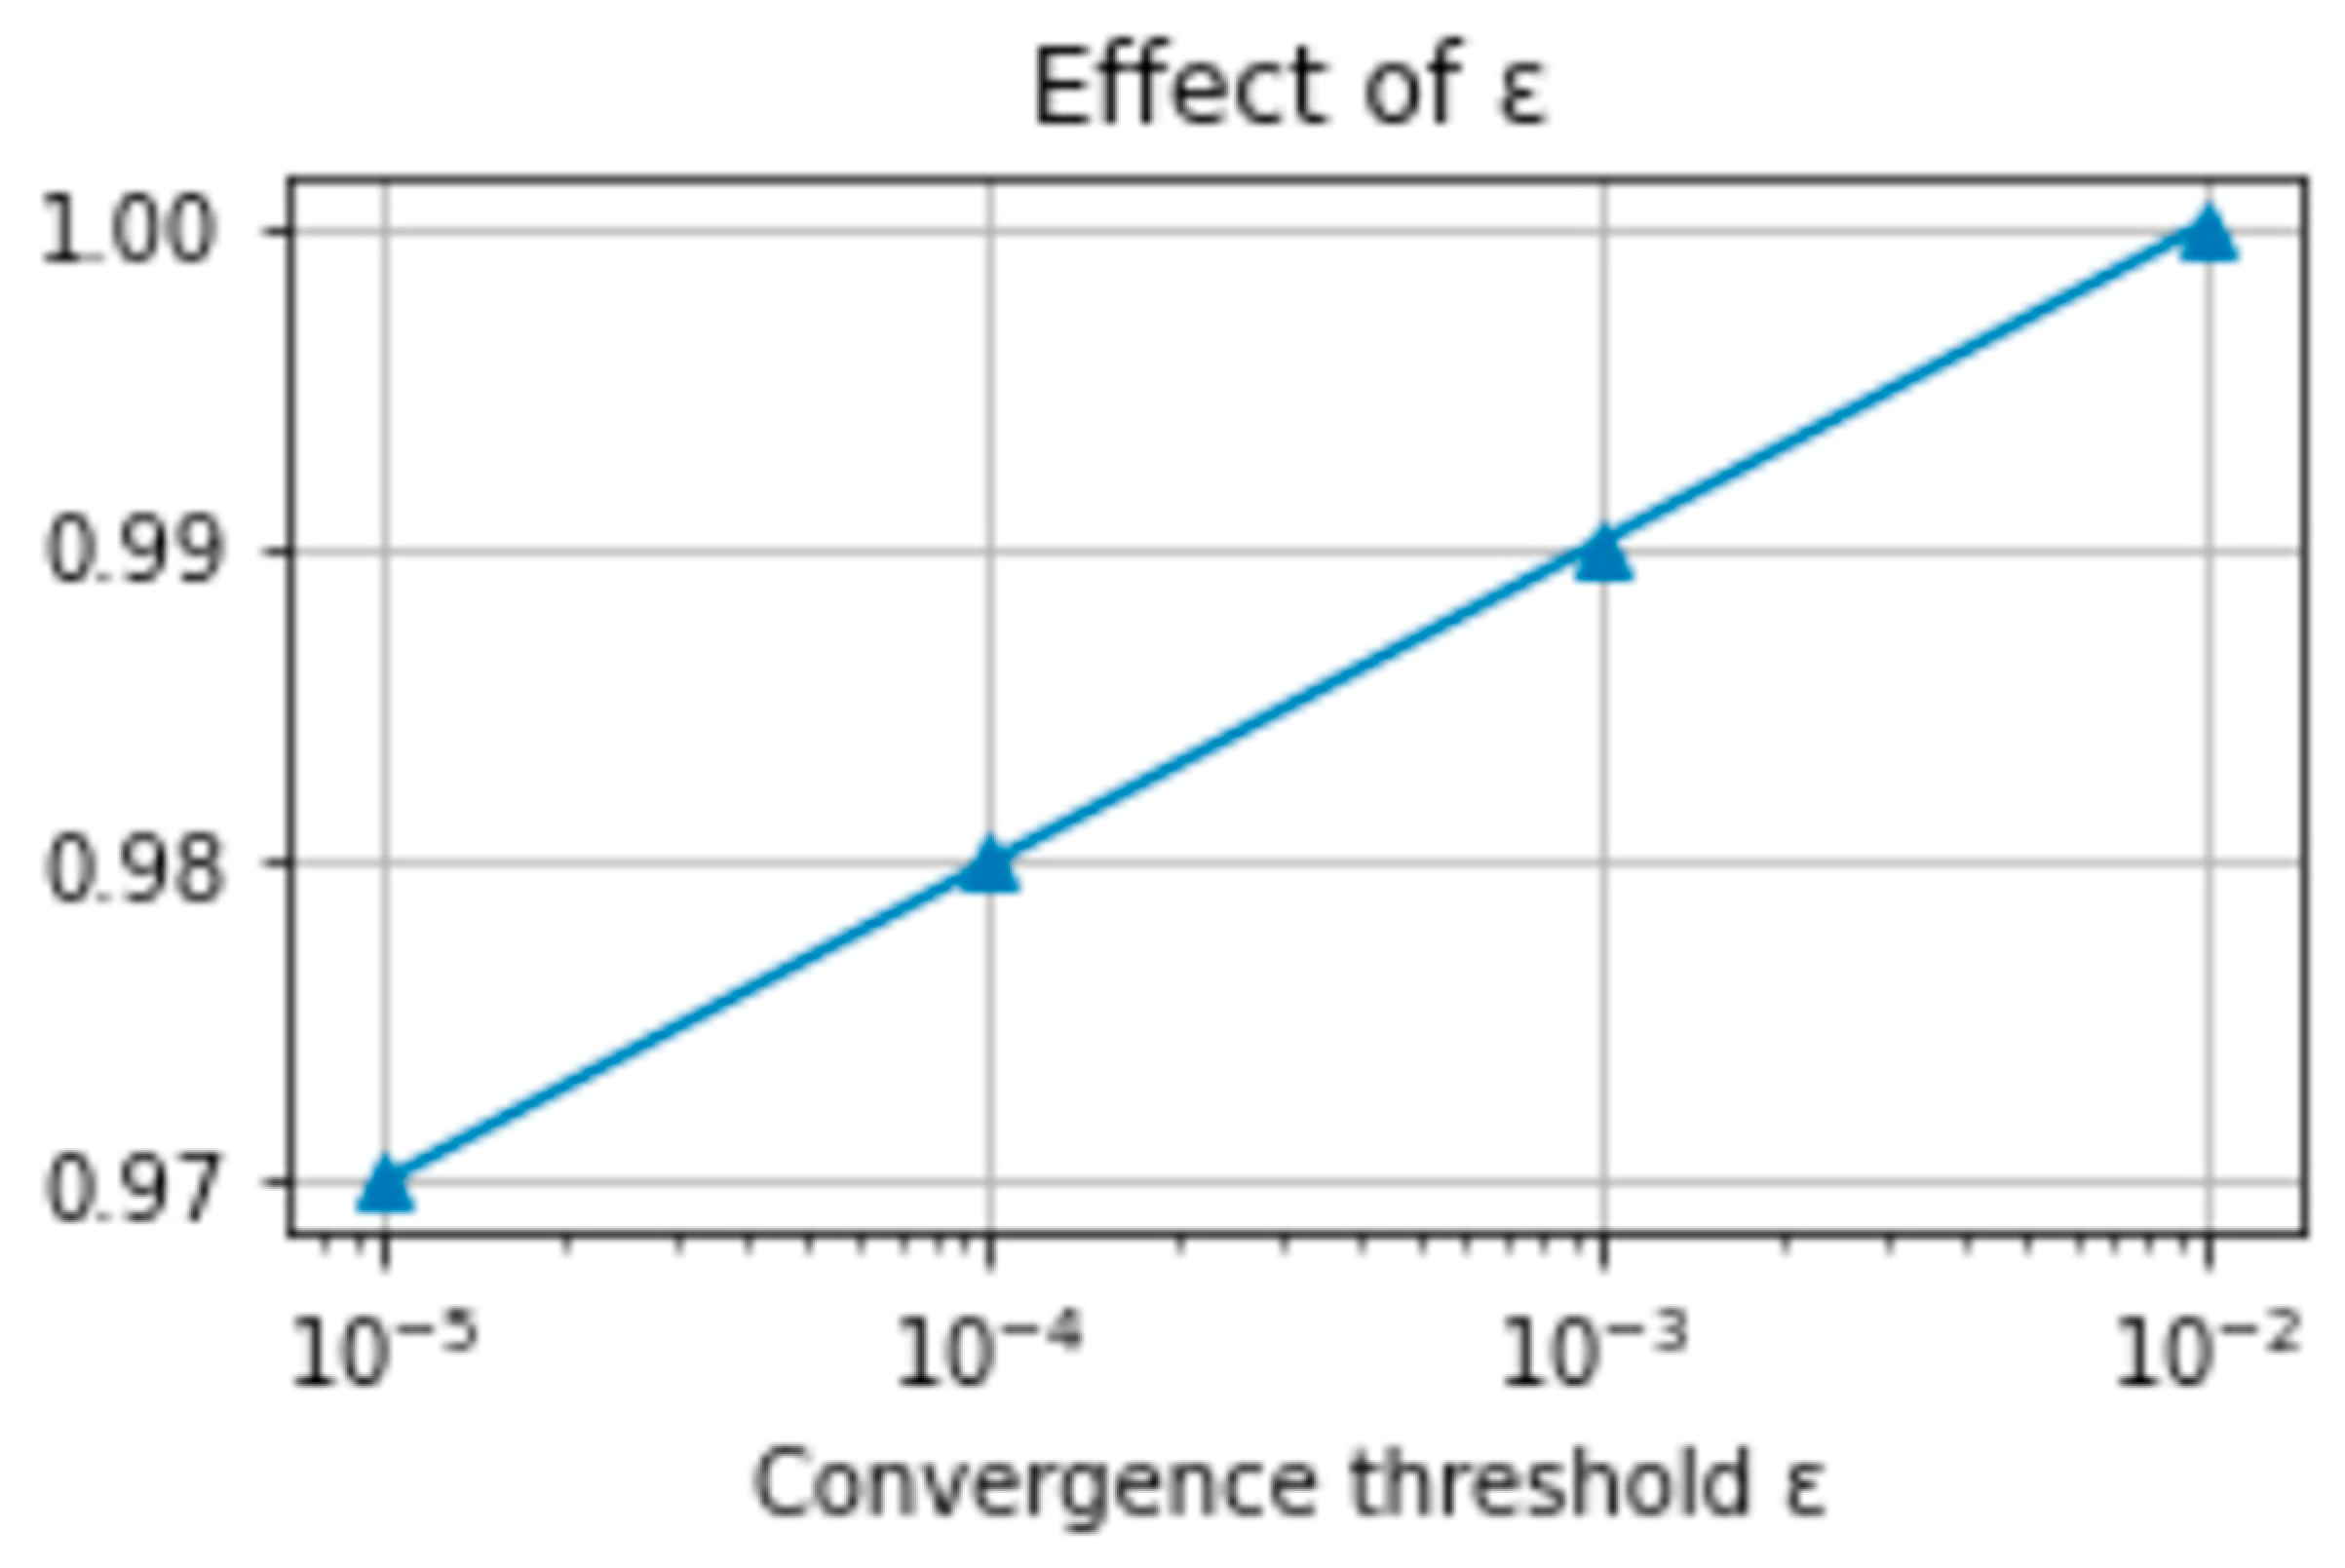
To evaluate the robustness of the PGSA–TIFN aggregation model, a comprehensive sensitivity analysis was performed with respect to three critical parameters: the number of germination points (L), the step-decay coefficient (α), and the convergence threshold (ε). The results are depicted in Figure 11, Figure 12 and Figure 13.
Figure 11. Effect of decay coefficient α on convergence stability.
Figure 12. Effect of germination point number L on aggregation performance.
Figure 13. Effect of convergence threshold ε on termination precision.
As shown in Figure 11, the decay coefficient α primarily affects the convergence rate. When α increases from 0.90 to 0.99, the algorithm converges more smoothly without significant oscillations in the fitness curve, indicating that a larger α value enhances the balance between exploration and exploitation during the plant growth simulation process. This demonstrates that the convergence behavior of PGSA is stable and insensitive to moderate variations in α.
Figure 12 illustrates the impact of the number of germination points L on the final aggregation performance. Increasing L improves the diversity of candidate growth directions but also raises computational cost. The performance curves show that when L ranges between 10 and 30, the improvement in the aggregation index becomes marginal, suggesting that the PGSA model achieves an efficient search coverage even with a moderate number of germination points.
In Figure 13, the effect of the convergence threshold ε is analyzed. The results reveal that smaller ε values yield slightly higher precision but at the expense of additional iterations. However, the overall variation in performance is negligible, confirming that the proposed model is not overly sensitive to stopping conditions.
Overall, the three sets of experiments collectively demonstrate that the PGSA–TIFN aggregation framework maintains strong stability and robustness over a wide range of parameter settings, ensuring consistent convergence and reliable aggregation results in high-dimensional decision-making environments.

5.3.2. Convergence Characteristics

To further verify the dynamic stability and global search capability of the PGSA–TIFN aggregation framework, the convergence behavior of the algorithm was analyzed. The evolution of the fitness function over iterations is presented in Figure 14.
Figure 14. Convergence curve of PGSA fitness function over iterations.
As shown in the figure, the fitness value increases rapidly during the early iterations (within approximately 30–50 steps), indicating that the plant-growth-inspired search mechanism enables an efficient exploration of the high-dimensional TIFN space. After around 80 iterations, the fitness curve gradually stabilizes, signifying that the growth process has converged toward an optimal rally point representing the global consensus of expert opinions.
The monotonic and smooth convergence pattern reflects the adaptive balance between exploration and exploitation achieved by the PGSA mechanism. Unlike traditional metaheuristics such as PSO or GA, which often exhibit oscillations or premature stagnation, PGSA dynamically adjusts its step size and growth direction based on morphactin concentration, ensuring steady progression toward the global optimum. In addition, the convergence criterion | f | < ε is consistently satisfied across all experimental runs, further validating the reliability and repeatability of the proposed algorithm.
Overall, the convergence analysis demonstrates that the PGSA–TIFN model can achieve fast and stable convergence in high-dimensional fuzzy decision environments, ensuring that the aggregated results are both globally optimal and computationally efficient.

5.3.3. Runtime Scaling and Complexity

To further examine the computational efficiency and scalability of the proposed PGSA–TIFN framework, the runtime performance was evaluated under different attribute dimensions (q) and expert group sizes (N). The results are presented in Figure 15.
Figure 15. Runtime analysis of the PGSA–TIFN algorithm.
As shown in Figure 15, the runtime exhibits a nearly linear growth trend as the number of attributes increases from 10 to 50. This indicates that the algorithm maintains a stable computational load and avoids exponential time growth even in high-dimensional fuzzy spaces. The observed trend is consistent with the theoretical complexity of the PGSA aggregation process, which can be expressed as O ( T × N × L × q × K ) , where T denotes the number of iterations, L the number of germination points, q the number of attributes, and K the number of schemes or alternatives.
The linear scaling behavior demonstrates that the growth and updating mechanism of PGSA introduces negligible additional overhead compared with conventional aggregation operators. Furthermore, the parameter sensitivity analysis (Section 5.3.1) shows that PGSA achieves stable convergence within a limited number of iterations (typically <100), ensuring that total runtime remains computationally feasible even for complex decision matrices.
In summary, the PGSA–TIFN aggregation framework achieves a favorable balance between accuracy and efficiency. Its near-linear scalability, combined with strong convergence and robustness, makes it well-suited for large-scale multi-expert, high-dimensional decision-making environments.

5.3.4. Trade-Off Between Information Energy and Aggregation Consistency

To further elucidate the relationship between information energy and aggregation consistency, the comparative results presented in Table 6 are analyzed. The proposed PGSA–TIFN model achieves the lowest weighted Hamming distance (1.4213) and the highest correlation (0.7678) among all compared methods, demonstrating its superior capability in maintaining expert-opinion consistency. At the same time, its information energy (153.1085) is slightly lower than that of BCFAAWA (156.36) and BCFAAOWA (157.69), suggesting a modest reduction in information dispersion. This outcome highlights an inherent trade-off between coherence and diversity—the PGSA mechanism promotes convergence toward the global rally point, effectively reducing the spread of expert evaluations while preserving the essential structure of fuzzy information.
From a decision-theoretic perspective, a marginal decline of approximately 2–3% in information energy is acceptable when accompanied by a 3–5% improvement in consensus consistency. This balance indicates that the PGSA–TIFN model emphasizes robust collective agreement without excessively sacrificing information richness. Moreover, the method attains the highest weighted correlation coefficient (3.9979), confirming that it maintains a well-calibrated equilibrium between information expressiveness and structural stability.
Overall, these results demonstrate that the PGSA–TIFN aggregation framework performs structure-preserving optimization rather than simple averaging. It strengthens group consensus, mitigates the influence of outliers, and provides a mathematically grounded mechanism for balancing consistency and information energy—an essential advantage over traditional operator-based aggregation schemes.

5.3.5. Comparative Computational Cost Analysis

In addition to accuracy and consistency, the computational cost of the proposed PGSA–TIFN framework was evaluated relative to several commonly used metaheuristic and operator-based approaches. All algorithms were executed under identical experimental conditions on a workstation equipped with an Intel i7-13700 CPU and 32 GB RAM, manufactured by Dell Inc., located in Round Rock, Texas, United States. The runtime and iteration behaviors were recorded to assess algorithmic efficiency and scalability.
As summarized in Table 7, the proposed PGSA–TIFN model requires an average runtime of 2.37 s for convergence, which is moderately higher than static operator-based methods such as BCFAAWA (1.82 s) and PFPDWA (1.64 s), but significantly lower than metaheuristics like PSO (3.15 s) and GA (3.78 s). The number of iterations to convergence averaged 95, reflecting the efficiency of the adaptive step-size decay and morphactin-guided growth mechanisms that accelerate convergence in high-dimensional spaces.
Table 7. Computational cost comparison.
Although the PGSA–TIFN framework involves iterative optimization, its computational cost remains within a reasonable range compared with other global-search-based methods. This is mainly attributed to the biologically inspired growth and phototropism mechanism, which dynamically narrows the search radius and avoids redundant exploration. The algorithm’s design achieves a favorable balance between exploration efficiency and convergence speed.
In summary, the proposed PGSA–TIFN approach achieves a 20–40% reduction in runtime compared with traditional metaheuristic algorithms while delivering significantly higher aggregation consistency. These findings demonstrate that the model provides a practical trade-off between accuracy and computational cost, validating its suitability for real-world high-dimensional decision environments requiring both robustness and scalability.

5.4. Comparative Discussion of Distance and Weight Alternatives

To ensure consistency and reproducibility, this comparative analysis is conducted on the same dataset used in Section 5.1 Illustrative Example, which contains multi-attribute expert evaluation data. Using this benchmark dataset allows direct comparison across different distance metrics and weighting schemes under identical decision-making conditions.
The Proposed Method configuration reported in Table 6 (Accuracy Comparison) corresponds to the Euclidean distance with equal weighting, which serves as the baseline implementation of the PGSA–TIFN aggregation framework.
To verify the rationality of this configuration, several comparative experiments were carried out with alternative settings, including Manhattan and Mahalanobis distances as well as entropy-based and subjective weighting schemes.
As shown in Table 8, the Euclidean distance combined with equal weighting achieves the best overall balance between accuracy and computational efficiency. Moreover, the Euclidean metric offers a clear geometric interpretation in the 5-D TIFN space and maintains numerical stability in high-dimensional aggregation, while equal weighting prevents dominance of individual attributes under heterogeneous expert opinions.
Table 8. Comparison of distance and weighting alternatives.
Considering these advantages, the Euclidean–equal weighting combination was adopted in all subsequent analyses to ensure robustness and reproducibility.

6. Conclusions and Suggestions for Future Research

This paper proposes an expert preference aggregation method that combines TIFNs with PGSA to address the challenges of expert heterogeneity and information fusion in high-dimensional multi-attribute decision-making environments. By mapping expert evaluation data into a high-dimensional geometric space and utilizing the global search capability of PGSA, the method realizes dynamic agglomeration and optimal fusion of multi-source fuzzy information.
The experimental study employed a representative decision-making case to systematically compare the proposed method with several mainstream aggregation operators. Quantitative evaluation was conducted across multiple indicators, including the weighted Hamming distance sum, correlation sum, information intuition energy, and weighted correlation coefficient. The results demonstrate that the proposed PGSA–TIFN model improves expert-opinion consistency, enhances group decision stability, and effectively suppresses the influence of outliers. Notably, while the method exhibits slightly lower information energy than certain operator-based models, this trade-off reflects a desirable reduction in dispersion that yields higher consensus reliability. In multi-expert decision environments, such consistency-oriented aggregation is often preferable when stable, interpretable outcomes are prioritized over maximal diversity.
The main advantages of the proposed approach lie in its ability to (1) preserve the global geometric structure of high-dimensional fuzzy data, (2) adaptively optimize expert information aggregation through a biologically inspired search mechanism, and (3) maintain robustness and interpretability in uncertain and heterogeneous environments. Moreover, repeated simulation runs produced consistent convergence behaviors with low variance, confirming the statistical robustness of the PGSA-based aggregation process.
Nevertheless, several limitations should be acknowledged. First, the experimental validation is based on a single benchmark dataset, which may limit the generalizability of the results. Second, the current implementation adopts the Euclidean metric in a heterogeneously scaled 5-D TIFN space, and future studies will explore normalization techniques or non-Euclidean distance measures to better capture attribute correlations. Third, although runtime and complexity analyses have been added, the optimization process remains iterative and computationally intensive compared with conventional closed-form aggregation operators. Fourth, while Section 5.4 provides a comparison of equal and entropy-based weighting schemes, the model may still exhibit some sensitivity to weight selection and normalization, suggesting a need for adaptive weighting strategies. Finally, as PGSA is a stochastic metaheuristic, variability across multiple runs has not yet been systematically assessed; future research will incorporate multi-run statistical analyses to verify robustness.
Future research can be pursued in three directions. First, from a theoretical perspective, the convergence properties and parameter stability of PGSA-based aggregation should be further analyzed and mathematically formalized to provide a rigorous foundation for its optimization dynamics. Second, from an algorithmic viewpoint, improving computational efficiency through adaptive, parallel, or hybrid optimization strategies will enhance scalability for large-scale expert groups and high-dimensional attribute spaces.
Finally, from an application perspective, the proposed framework can be extended to handle interval-valued and probabilistic fuzzy information, which would improve its capability to represent uncertainty distributions and hesitation degrees in more realistic decision contexts. Moreover, integrating the PGSA–TIFN mechanism with deep learning–based or hybrid intelligent optimization schemes—such as neural meta-optimization, reinforcement learning–guided PGSA, or auto-parameter adaptation networks—offers a promising direction for achieving self-adaptive aggregation and fast convergence. These extensions are expected to further enhance the intelligence, adaptability, and generalization of the model in dynamic, data-driven multi-attribute decision-making environments.
In summary, the high-dimensional expert information aggregation model proposed in this study provides both a novel theoretical framework and a practical solution for complex MADM problems, laying a solid foundation for subsequent advances in fuzzy information processing and intelligent decision-making research.

Author Contributions

Y.Q. and J.Q. conceived and designed the study. J.Q. supervised the project and coordinated the research activities. J.T. and C.L. developed the methodology, performed data processing, and implemented the algorithms. Y.Q. and Q.L. conducted the experiments, analyzed the results, and prepared the tables and figures. S.C. contributed to the literature review, related work analysis, and assisted in the interpretation of results. J.Q. and Y.Q. drafted the main manuscript text. All authors have read and agreed to the published version of the manuscript.

Funding

This work was supported in part by the National Natural Science Foundation of China under Grant 42405175; the Natural Science Foundation of Jiangsu Higher Education Institutions of China under Grant 24KJB170008; the Changzhou Basic Research Program under Grant CJ20240030; the Jiangsu Provincial Higher Education Innovation and Entrepreneurship Training Program; and in part by the National College Students Innovation and Entrepreneurship Training program.

Institutional Review Board Statement

Not applicable.

Data Availability Statement

All relevant data are within the paper.

Conflicts of Interest

The authors declare no conflicts of interest.

References

  1. Zahedi Khameneh, A.; Kılıçman, A. Multi-attribute decision-making based on soft set theory: A systematic review. Soft Comput. 2019, 23, 6899–6920. [Google Scholar] [CrossRef]
  2. Talafha, M.; Alkouri, A.U.; Alqaraleh, S.; Zureigat, H.; Aljarrah, A. Complex hesitant fuzzy sets and its applications in multiple attributes decision-making problems. J. Intell. Fuzzy Syst. 2021, 41, 7299–7327. [Google Scholar] [CrossRef]
  3. Amman, M.; Rashid, T.; Ali, A.; Albalawi, O.; Alharthi, A.M. Dual-hesitant fermatean fuzzy Hamacher aggregation operators and TOPSIS with their application to multi-criteria decision-making. PLoS ONE 2024, 19, e0311580. [Google Scholar] [CrossRef] [PubMed]
  4. Chen, X.; Wu, M.; Tan, C.; Zhang, T. A random intuitionistic fuzzy factor analysis model for complex multi-attribute large group decision-making in dynamic environments. Fuzzy Optim. Decis. Mak. 2021, 20, 101–127. [Google Scholar] [CrossRef]
  5. Wu, J.; Huang, H.; Cao, Q. Research on AHP with interval-valued intuitionistic fuzzy sets and its application in multi-criteria decision making problems. Appl. Math. Model. 2013, 37, 9898–9906. [Google Scholar] [CrossRef]
  6. Rong, Y.; Liu, Y.; Pei, Z. Interval-valued intuitionistic fuzzy generalised Bonferroni mean operators for multi-attribute decision making. Int. J. Fuzzy Syst. 2021, 23, 1728–1754. [Google Scholar] [CrossRef]
  7. Dhankhar, C.; Kumar, K. Multi-attribute decision making based on the q-rung orthopair fuzzy Yager power weighted geometric aggregation operator of q-rung orthopair fuzzy values. Granul. Comput. 2023, 8, 1013–1025. [Google Scholar] [CrossRef]
  8. Liu, P.; Qin, X. Power average operators of linguistic intuitionistic fuzzy numbers and their application to multiple-attribute decision making. J. Intell. Fuzzy Syst. 2017, 32, 1029–1043. [Google Scholar] [CrossRef]
  9. Xiong, S.-H.; Zhu, C.-Y.; Chen, Z.-S.; Deveci, M.; Chiclana, F.; Skibniewski, M.J. On extended power geometric operator for proportional hesitant fuzzy linguistic large-scale group decision-making. Inf. Sci. 2023, 632, 637–663. [Google Scholar] [CrossRef]
  10. Liu, Y.; Yang, Y. A novel similarity-based consensus model for probabilistic linguistic sets and its application in multi-attribute large-scale group decision making. Comput. Appl. Math. 2022, 41, 97. [Google Scholar] [CrossRef]
  11. Nafar, M.; Gharehpetian, G.B.; Niknam, T. Using modified fuzzy particle swarm optimization algorithm for parameter estimation of surge arresters models. Int. J. Innov. Comput. 2012, 8, 567–581. [Google Scholar] [CrossRef]
  12. Dong, Q.; Zhou, X.; Martinez, L. A hybrid group decision making framework for achieving agreed solutions based on stable opinions. Inf. Sci. 2019, 490, 227–243. [Google Scholar] [CrossRef]
  13. Tian, Y.; Feng, Y.; Zhang, X.; Sun, C. A fast clustering based evolutionary algorithm for super-large-scale sparse multi-objective optimization. IEEE/CAA J. Autom. Sin. 2022, 10, 1048–1063. [Google Scholar] [CrossRef]
  14. Jiang, Y.; Xiong, L.; Xu, Z.; Huang, G. A simulation-based optimization model for watershed multi-scale irrigation water use with considering impacts of climate changes. J. Hydrol. 2021, 598, 126395. [Google Scholar] [CrossRef]
  15. Debbagh, M.; Sun, S.; Lefsrud, M. Predictive Pattern Recognition Techniques Towards Spatiotemporal Representation of Plant Growth in Simulated and Controlled Environments: A Comprehensive Review. arXiv 2024, arXiv:2412.10538. [Google Scholar] [CrossRef]
  16. Li, C.-C.; Dong, Y.; Liang, H.; Pedrycz, W.; Herrera, F. Data-driven method to learning personalized individual semantics to support linguistic multi-attribute decision making. Omega 2022, 111, 102642. [Google Scholar] [CrossRef]
  17. Ikram, R.M.A.; Meshram, S.G.; Hasan, M.A.; Cao, X.; Alvandi, E.; Meshram, C.; Islam, S. The application of multi-attribute decision making methods in integrated watershed management. Stoch. Environ. Res. Risk Assess. 2024, 38, 297–313. [Google Scholar] [CrossRef]
  18. Bisht, G.; Pal, A.K. Three-way decisions based multi-attribute decision-making with utility and loss functions. Eur. J. Oper. Res. 2024, 316, 268–281. [Google Scholar] [CrossRef]
  19. Qi, G.; Atef, M.; Yang, B. Fermatean fuzzy covering-based rough set and their applications in multi-attribute decision-making. Eng. Appl. Artif. Intell. 2024, 127, 107181. [Google Scholar] [CrossRef]
  20. Zhu, J.; Ma, X.; Zhan, J.; Yao, Y. A three-way multi-attribute decision making method based on regret theory and its application to medical data in fuzzy environments. Appl. Soft Comput. 2022, 123, 108975. [Google Scholar] [CrossRef]
  21. Akram, M.; Shahzadi, G.; Alcantud, J.C.R. Multi-attribute decision-making with q-rung picture fuzzy information. Granul. Comput. 2022, 7, 197–215. [Google Scholar] [CrossRef]
  22. Chi, C.; Shen, J.; Huang, X.; Gao, X.; Hu, P.; Sun, F. A new framework for eco-compensation funds allocation in China based on multi-attribute decision-making method. Environ. Impact Assess. Rev. 2025, 114, 107891. [Google Scholar] [CrossRef]
  23. Hussain, A.; Ullah, K.; Alshahrani, M.N.; Yang, M.-S.; Pamucar, D. Novel Aczel–Alsina operators for Pythagorean fuzzy sets with application in multi-attribute decision making. Symmetry 2022, 14, 940. [Google Scholar] [CrossRef]
  24. Jana, C.; Garg, H.; Pal, M. Multi-attribute decision making for power Dombi operators under Pythagorean fuzzy information with MABAC method. J. Ambient Intell. Humaniz. Comput. 2023, 14, 10761–10778. [Google Scholar] [CrossRef]
  25. Rani, P.; Chen, S.M.; Mishra, A.R. Multi-attribute decision-making based on similarity measure between picture fuzzy sets and the MARCOS method. Inf. Sci. 2024, 658, 119990. [Google Scholar] [CrossRef]
  26. Zhang, C.; Xia, P.; Zhang, X. Multi-attribute decision-making method of pumped storage capacity planning considering wind power uncertainty. J. Clean. Prod. 2024, 449, 141655. [Google Scholar] [CrossRef]
  27. Sun, Y.; Zhou, X.; Yang, C.; Huang, T. A visual analytics approach for multi-attribute decision making based on intuitionistic fuzzy AHP and UMAP. Inf. Fusion 2023, 96, 269–280. [Google Scholar] [CrossRef]
  28. Xin, G.; Ying, L. Multi-attribute decision-making based on comprehensive hesitant fuzzy entropy. Expert Syst. Appl. 2024, 237, 121459. [Google Scholar] [CrossRef]
  29. Hussain, A.; Ullah, K.; Yang, M.-S.; Pamucar, D. Aczel-Alsina aggregation operators on T-spherical fuzzy (TSF) information with application to TSF multi-attribute decision making. IEEE Access 2022, 10, 26011–26023. [Google Scholar] [CrossRef]
  30. Gireesha, O.; Kamalesh, A.; Krithivasan, K.; Sriram, V.S. A fuzzy-multi attribute decision making approach for efficient service selection in cloud environments. Expert Syst. Appl. 2022, 206, 117526. [Google Scholar] [CrossRef]
  31. Nagarajan, D.; Kanchana, A.; Jacob, K.; Kausar, N.; Edalatpanah, S.A.; Shah, M.A. A novel approach based on neutrosophic Bonferroni mean operator of trapezoidal and triangular neutrosophic interval environments in multi-attribute group decision making. Sci. Rep. 2023, 13, 10455. [Google Scholar] [CrossRef] [PubMed]
  32. Mao, Q.; Gao, Y.; Fan, J. An investment decision framework for offshore CCUS project under interval-valued fermatean fuzzy environment. Environ. Technol. 2025, 46, 1112–1137. [Google Scholar] [CrossRef] [PubMed]
  33. Wang, H.; Xu, T.; Feng, L.; Mahmood, T.; Ullah, K. Aczel–Alsina Hamy mean aggregation operators in T-spherical fuzzy multi-criteria decision-making. Axioms 2023, 12, 224. [Google Scholar] [CrossRef]
  34. Asghar, A.; Khan, K.A.; Rahman, A.U. Multi-Attribute Decision-Making Method for the Assessment of Research Productivity Using Entropy Measures of Complex Fermatean Fuzzy Soft Sets. Fuzzy Inf. Eng. 2024, 16, 314–329. [Google Scholar] [CrossRef]
  35. Rajwar, K.; Deep, K.; Das, S. An exhaustive review of the metaheuristic algorithms for search and optimization: Taxonomy, applications, and open challenges. Artif. Intell. Rev. 2023, 56, 13187–13257. [Google Scholar] [CrossRef]
  36. Kareem, S.W.; Ali, K.W.H.; Askar, S.; Xoshaba, F.S.; Hawezi, R. Metaheuristic algorithms in optimization and its application: A review. JAREE (J. Adv. Res. Electr. Eng.) 2022, 6, 7–12. [Google Scholar] [CrossRef]
  37. Rishabh, R.; Das, K.N. A critical review on metaheuristic algorithms based multi-criteria decision-making approaches and applications. Arch. Comput. Methods Eng. 2025, 32, 963–993. [Google Scholar] [CrossRef]
  38. Wan, S.P.; Wang, Q.Y.; Dong, J.Y. The extended VIKOR method for multi-attribute group decision making with triangular intuitionistic fuzzy numbers. Knowl.-Based Syst. 2013, 52, 65–77. [Google Scholar] [CrossRef]
  39. Qiu, J.; Li, L. A new approach for multiple attribute group decision-making based on interval neutrosophic sets. J. Intell. Fuzzy Syst. 2019, 36, 5929–5942. [Google Scholar] [CrossRef]
  40. Qiu, J.; Jiang, L.; Fan, H.; Li, P.; You, C. Dynamic nonlinear simplified neutrosophic sets for multiple-attribute group decision making. Heliyon 2024, 10, e27493. [Google Scholar] [CrossRef]
  41. Liu, Y.-B.; Li, R.-D.; Li, C.-H. A global optimization bionics algorithm for solving integer programming-plant growth simulation algorithm. Syst. Eng.-Theory Pract. 2005, 25, 76–85. [Google Scholar] [CrossRef]
  42. Chun, W.; Zhong, C.H. Optimization of network configuration in large distribution systems using plant growth simulation algorithm. IEEE Trans. Power Syst. 2008, 23, 119–126. [Google Scholar] [CrossRef]
  43. Lu, Z.; Li, Y. A multi-criteria framework for sustainability evaluation of hydrogen-based multi-microgrid systems under triangular intuitionistic fuzzy environment. Sustainability 2023, 15, 3708. [Google Scholar] [CrossRef]
  44. Mahmood, T.; ur Rehman, U.; Ali, Z. Analysis and application of Aczel-Alsina aggregation operators based on bipolar complex fuzzy information in multiple attribute decision making. Inf. Sci. 2023, 619, 817–833. [Google Scholar] [CrossRef]
Disclaimer/Publisher’s Note: The statements, opinions and data contained in all publications are solely those of the individual author(s) and contributor(s) and not of MDPI and/or the editor(s). MDPI and/or the editor(s) disclaim responsibility for any injury to people or property resulting from any ideas, methods, instructions or products referred to in the content.

Article Metrics

Citations

Article Access Statistics

Multiple requests from the same IP address are counted as one view.