
NATCA YOLO-Based Small Object Detection for Aerial Images

Abstract
1. Introduction
2. Related Work
2.1. Generalized Small Object Detection Methods
2.2. Aerial Image Small Object Detection Method
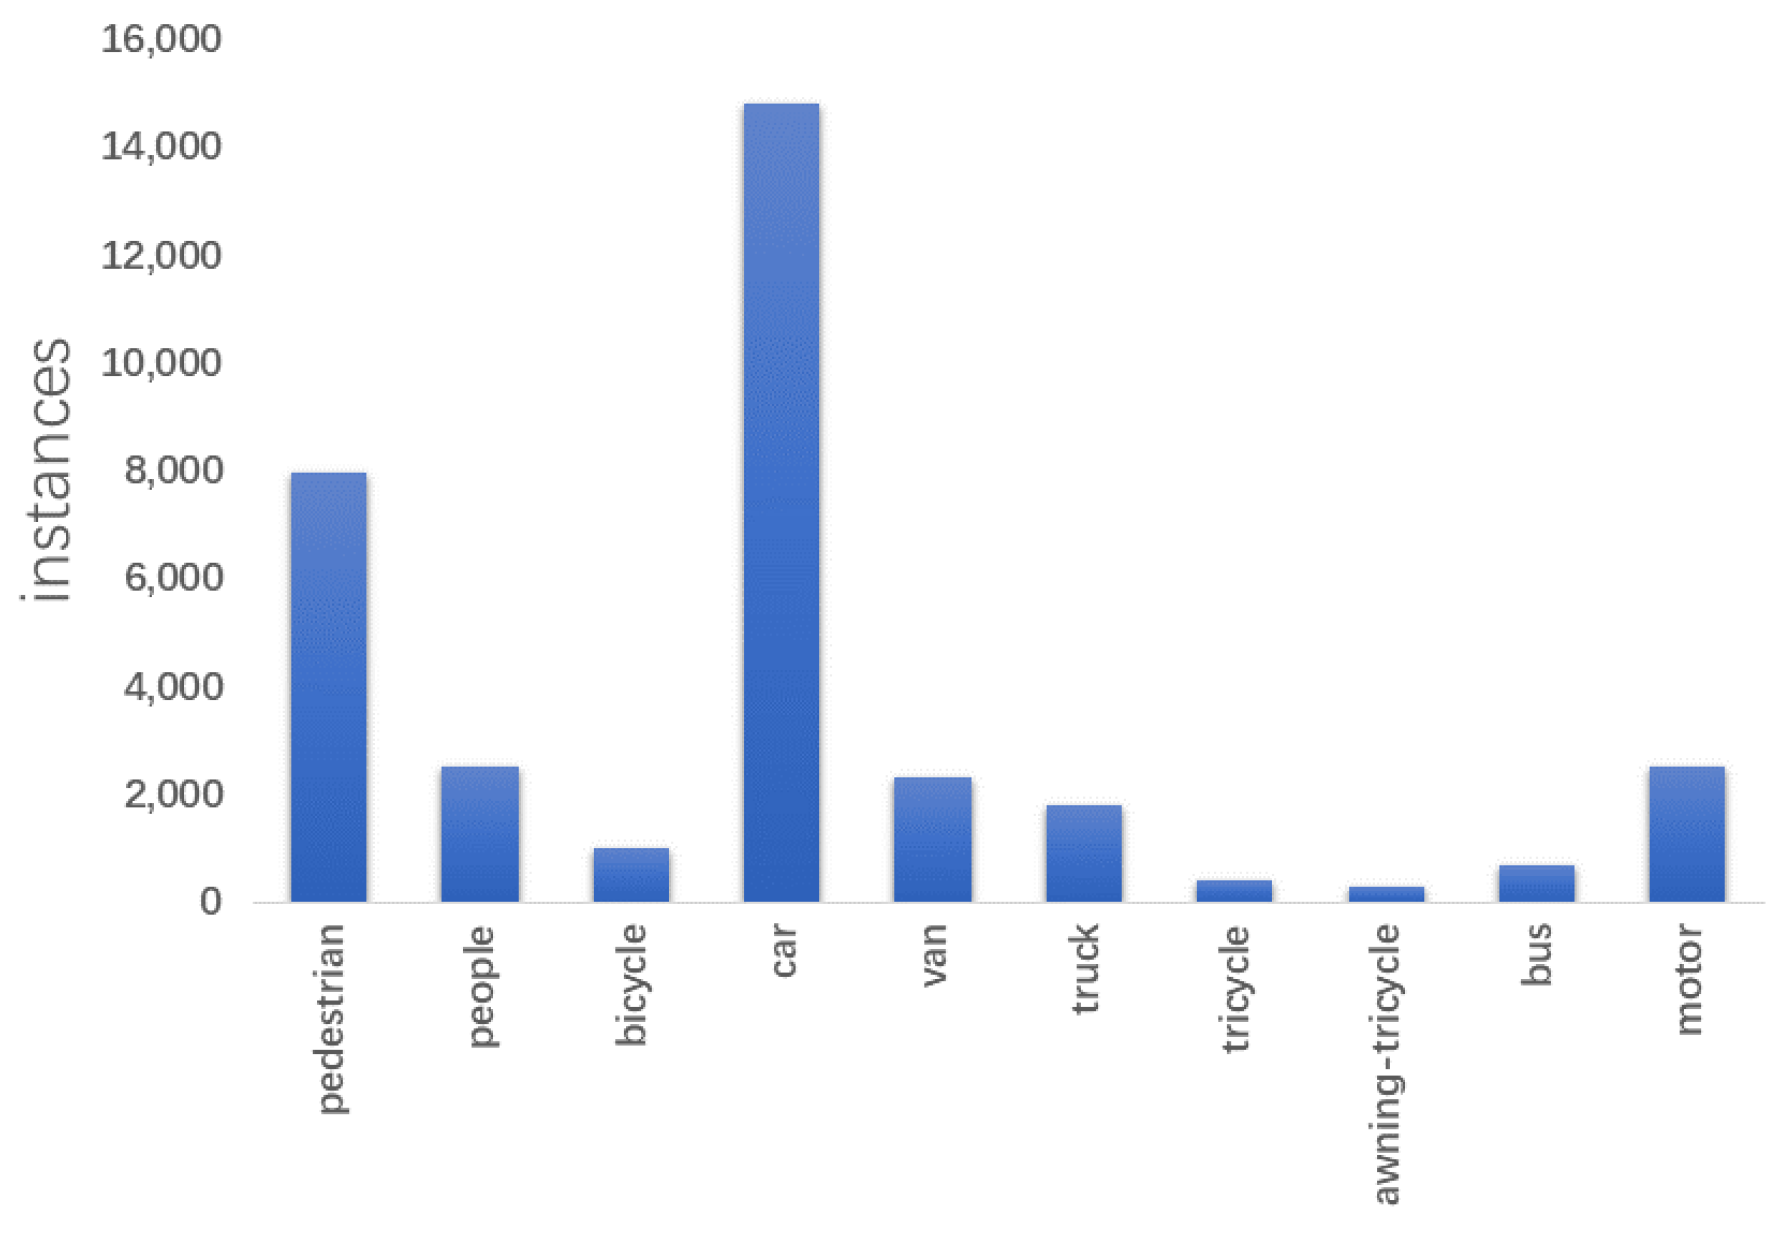
2.2.1. Dense Small Objects, Uneven Distribution of Objects
2.2.2. Very Small Object Detection in Large-Scale Scenes
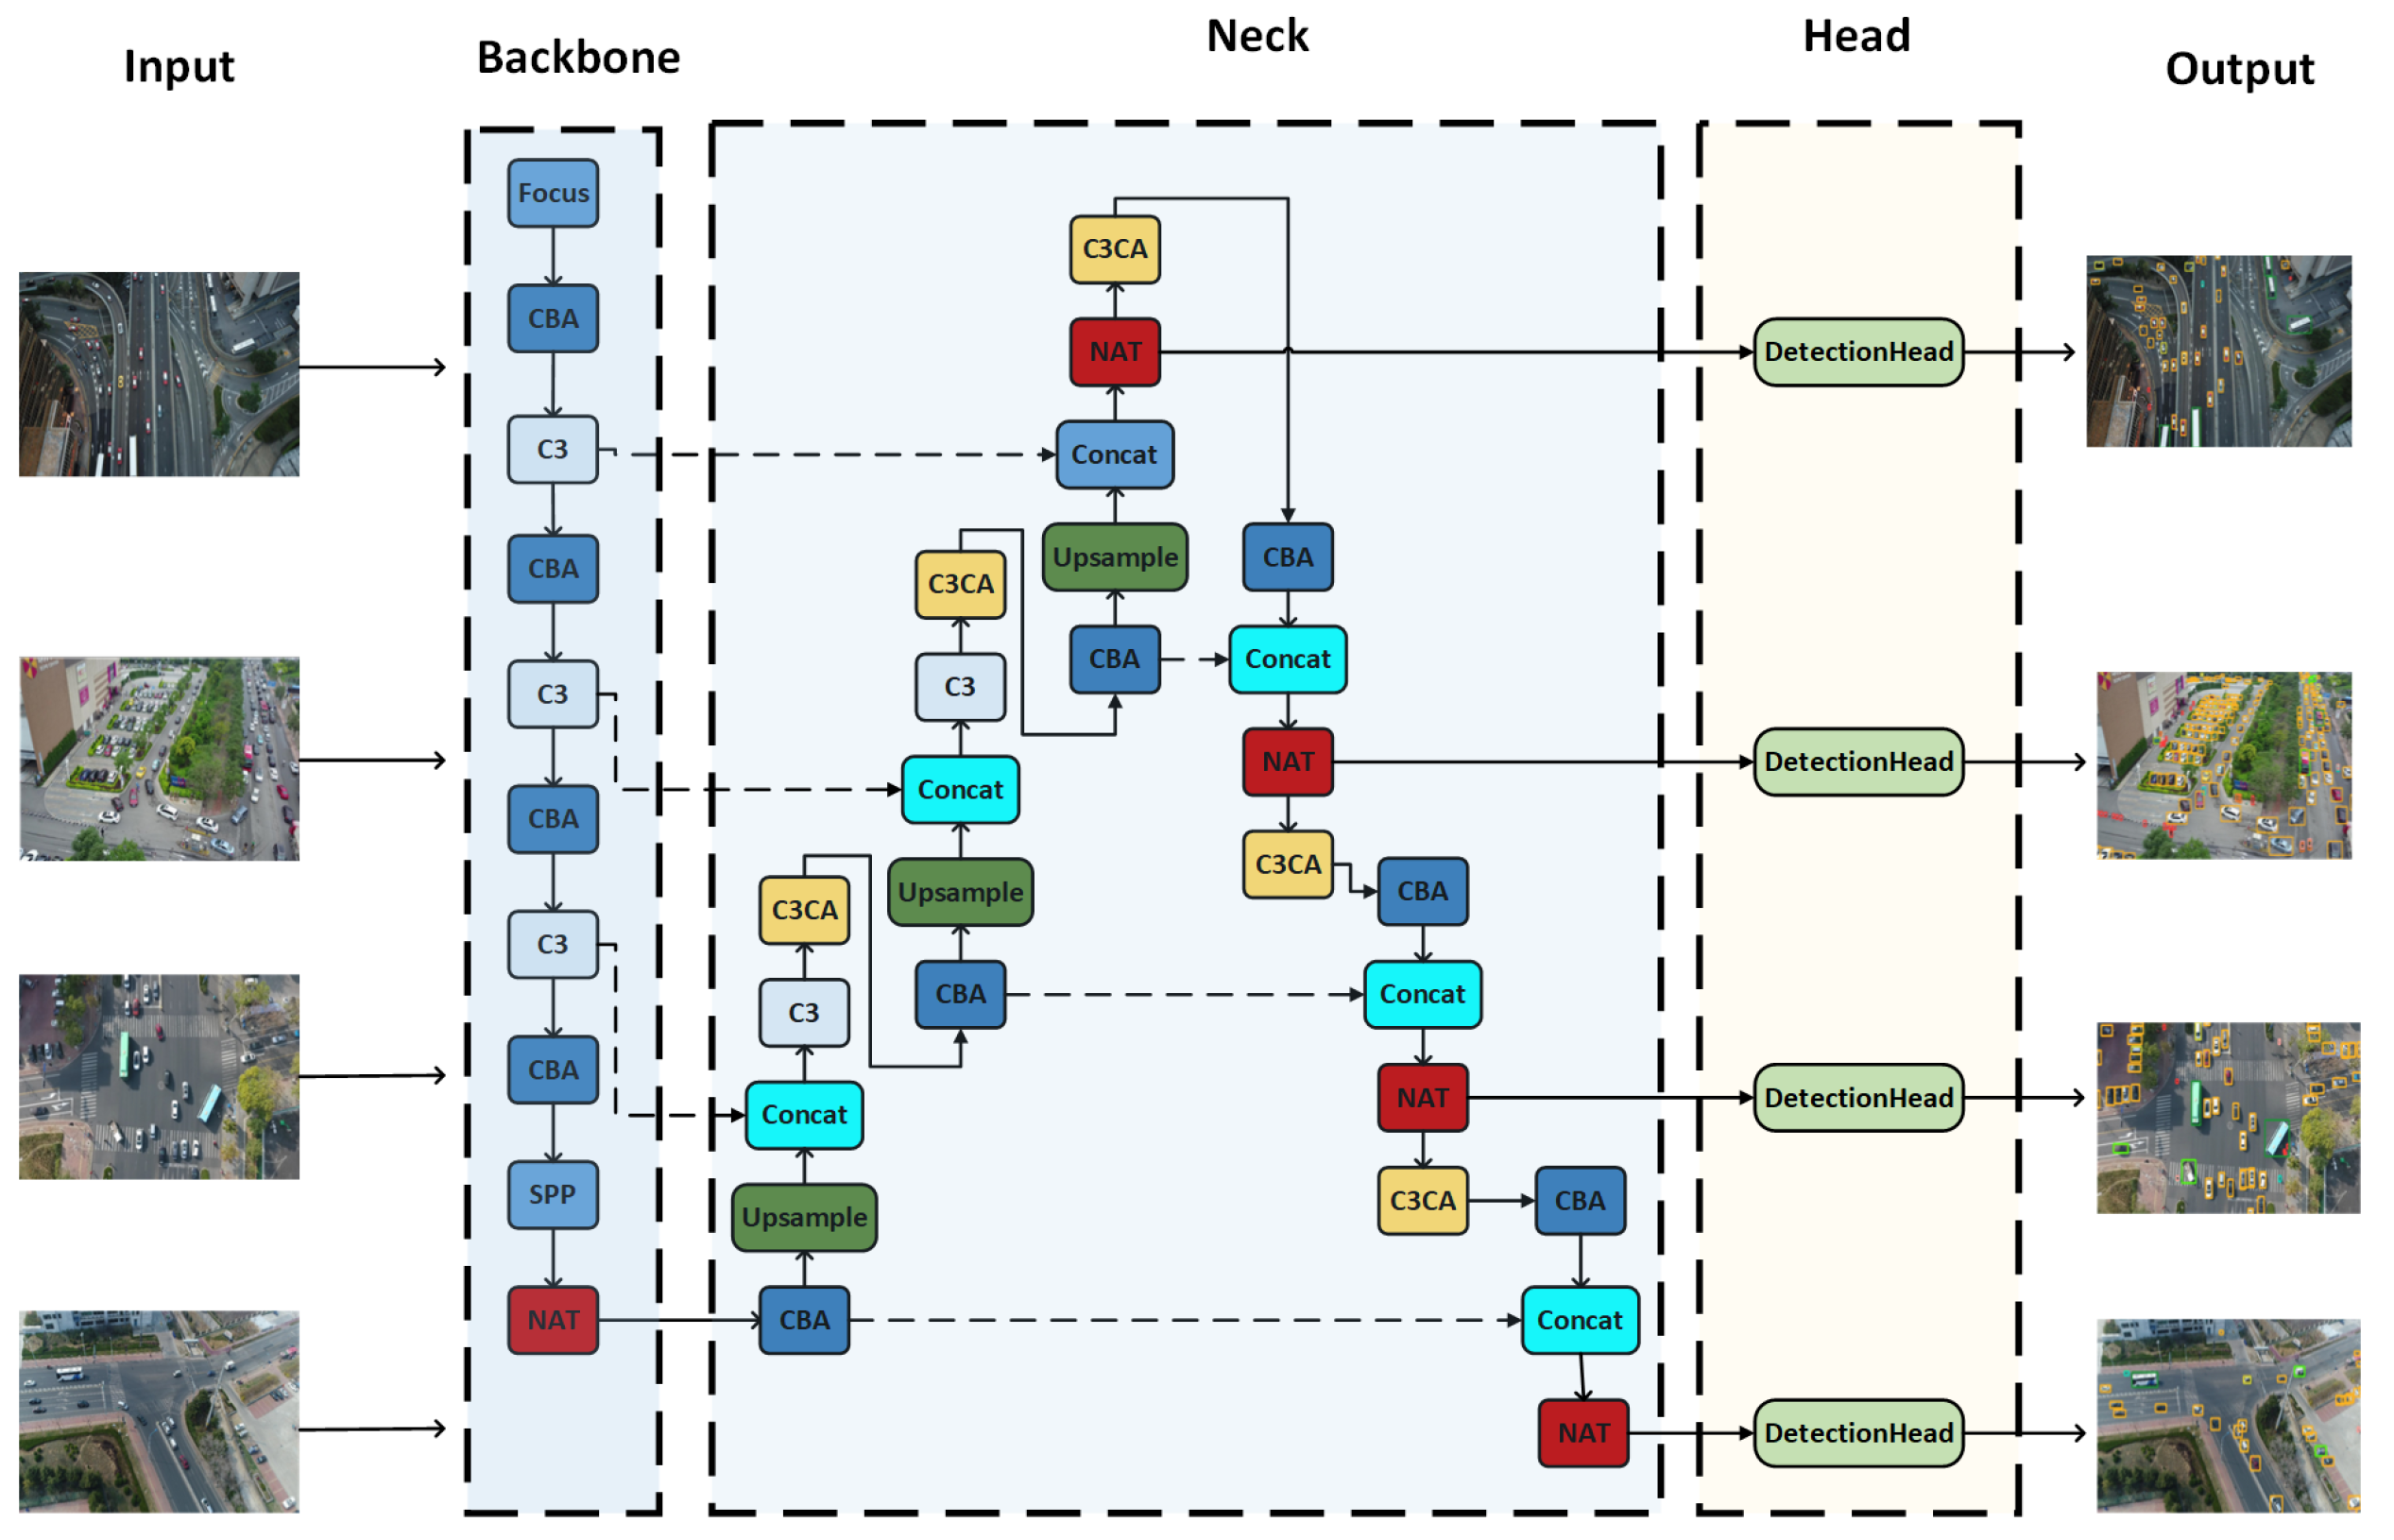
3. Proposed Method
3.1. Overall Network Architecture
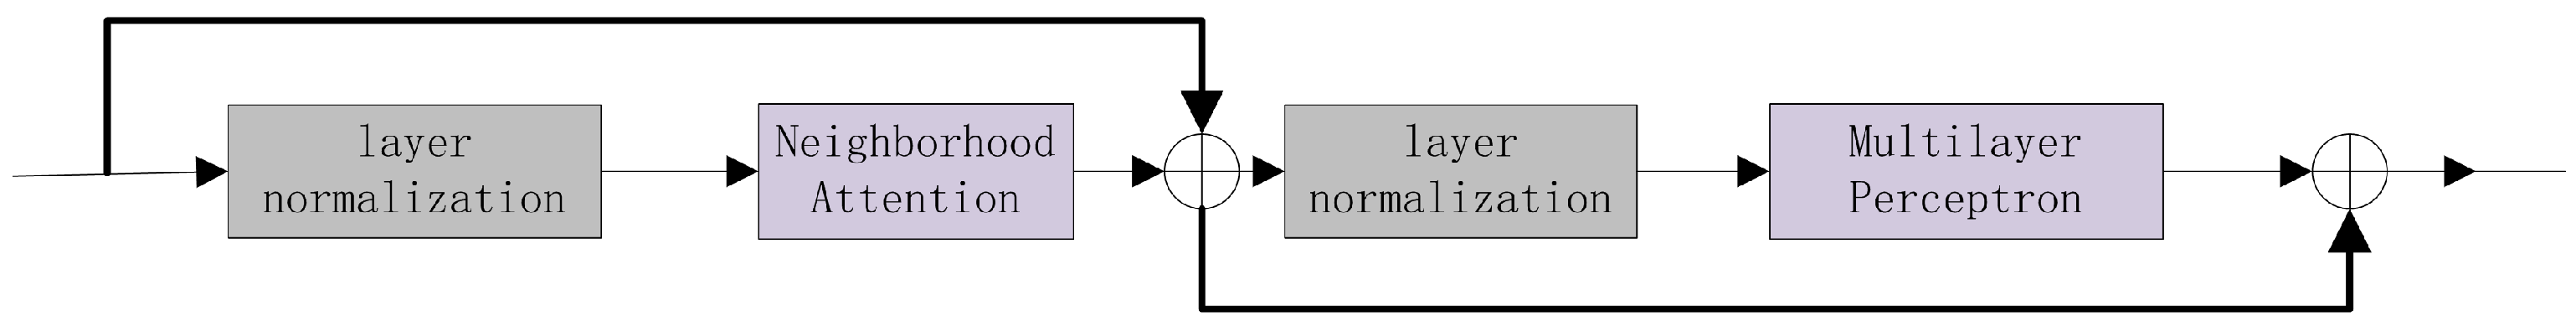
3.2. Neighborhood Attention Converter
3.3. Coordinate Attention Mechanism
3.4. Activation Function
4. Experimental Results and Analysis
4.1. Activation Function
4.2. Evaluation Indicators
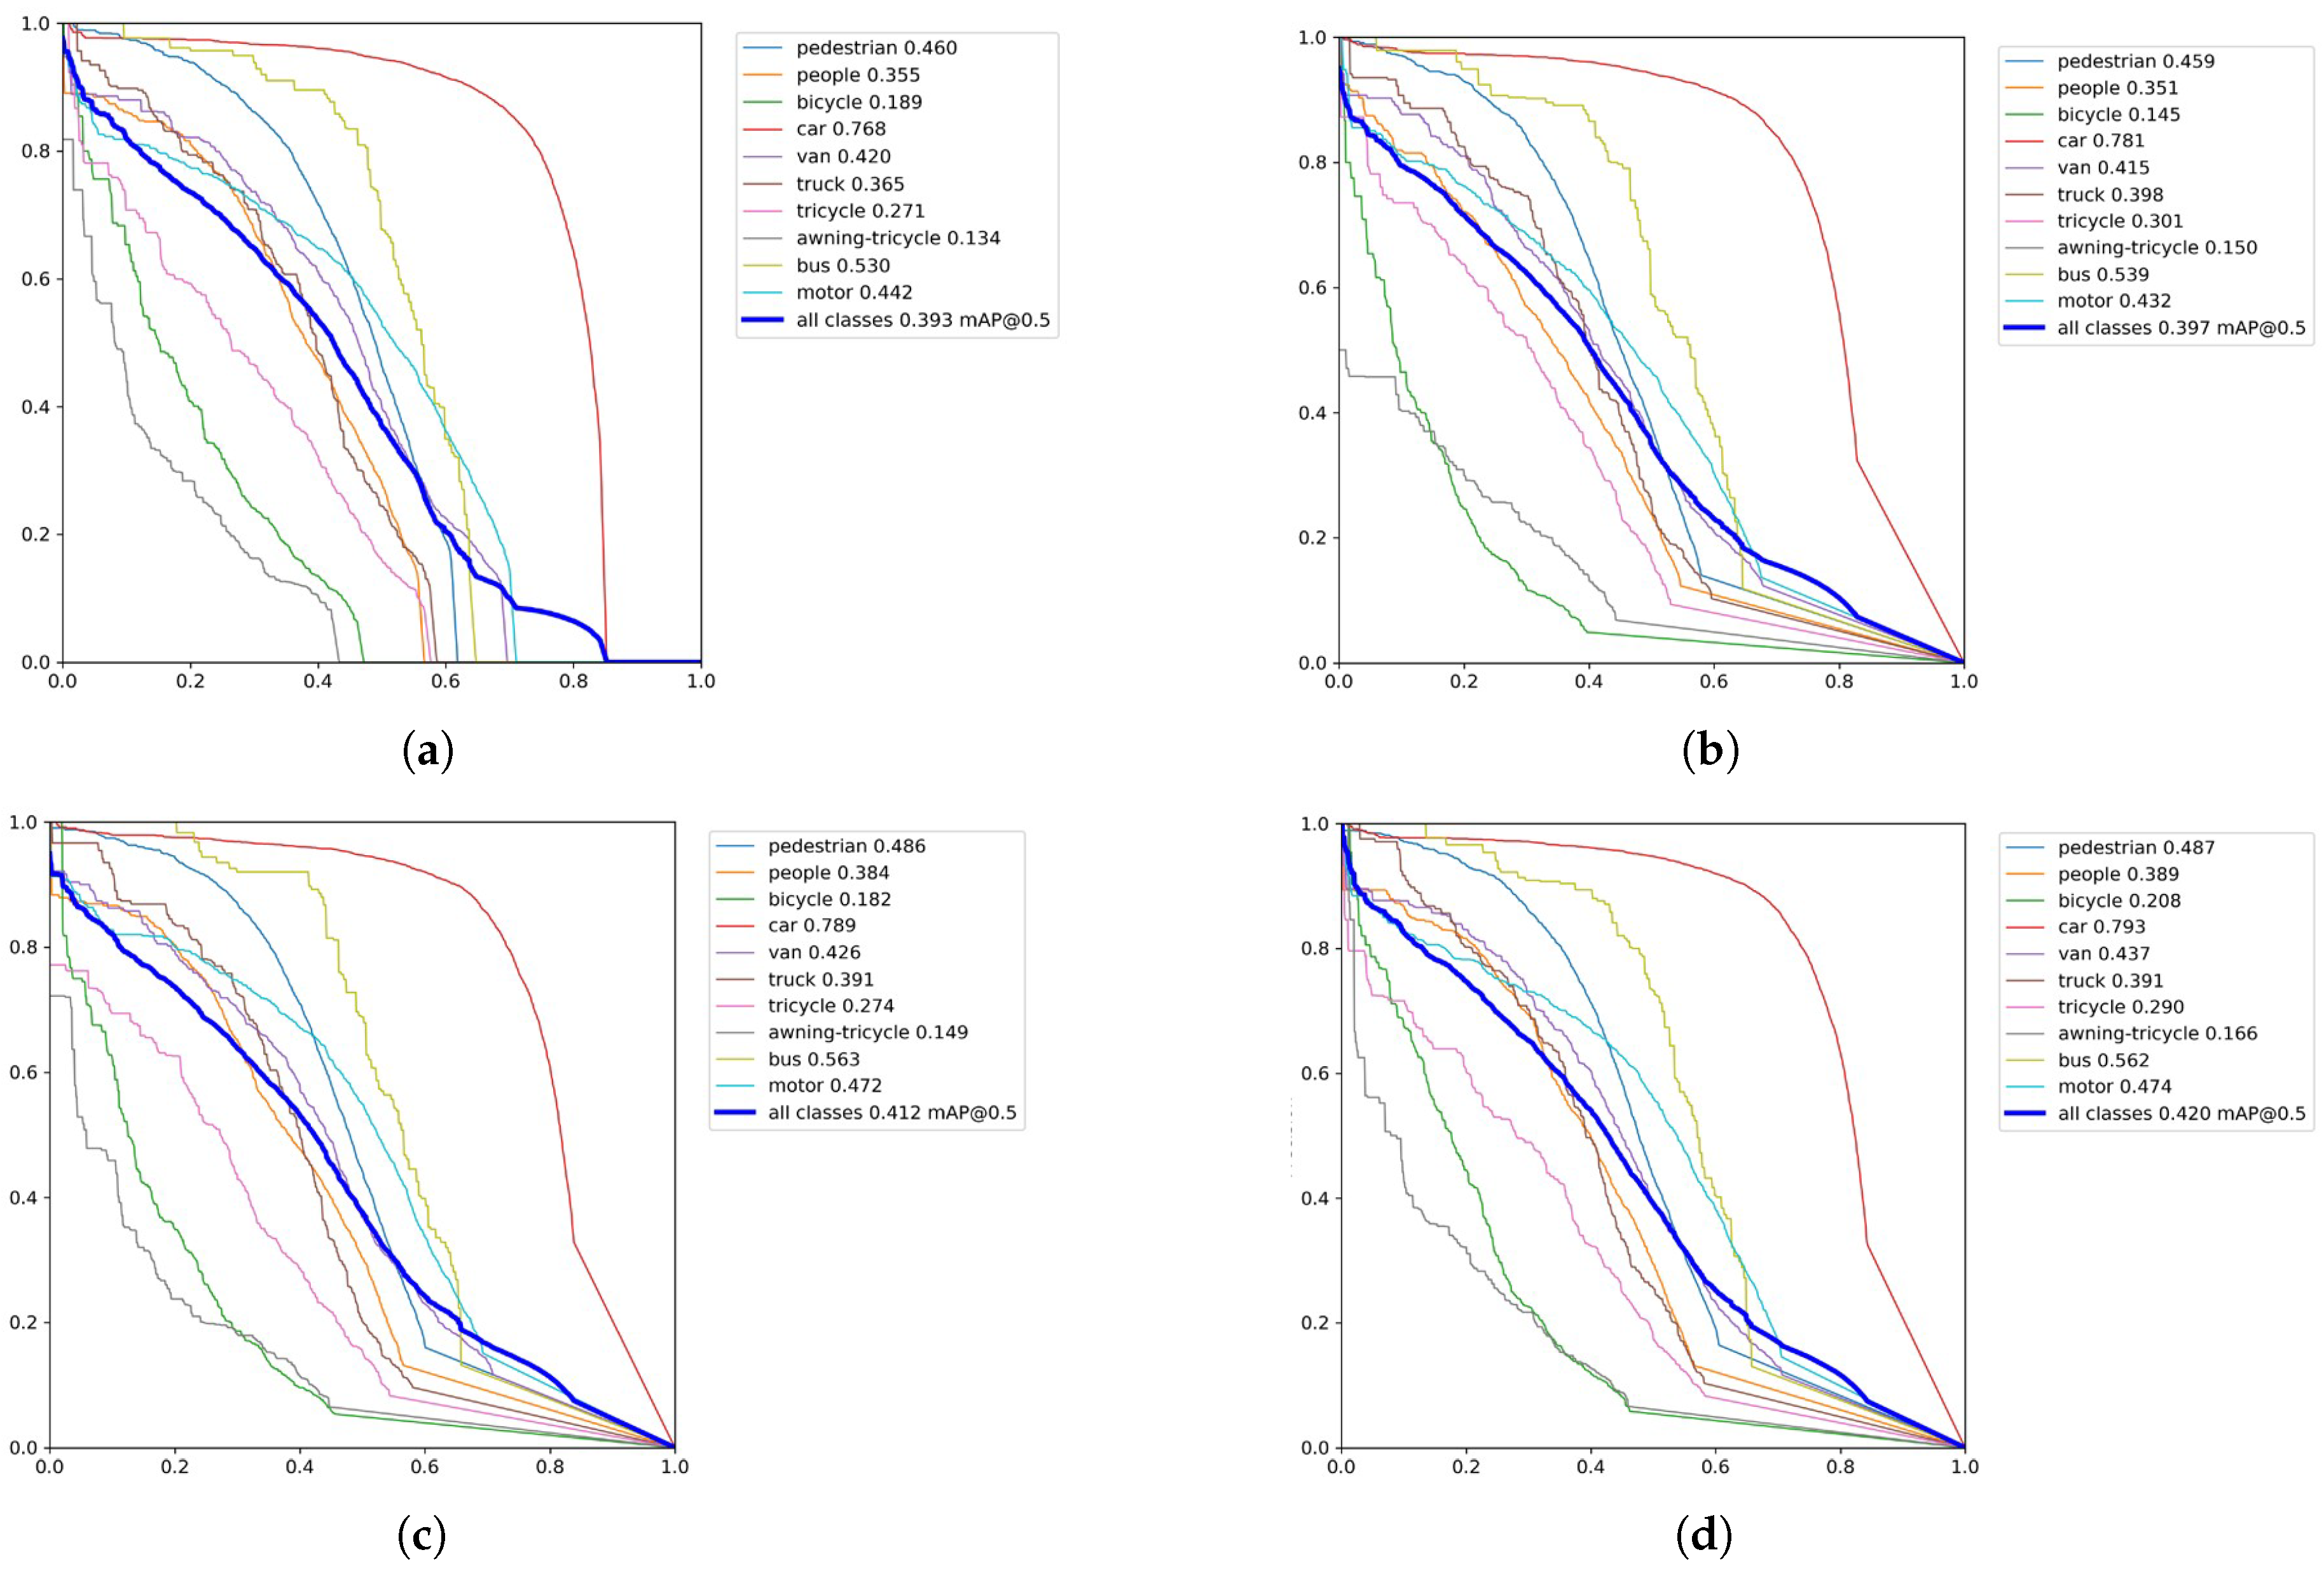
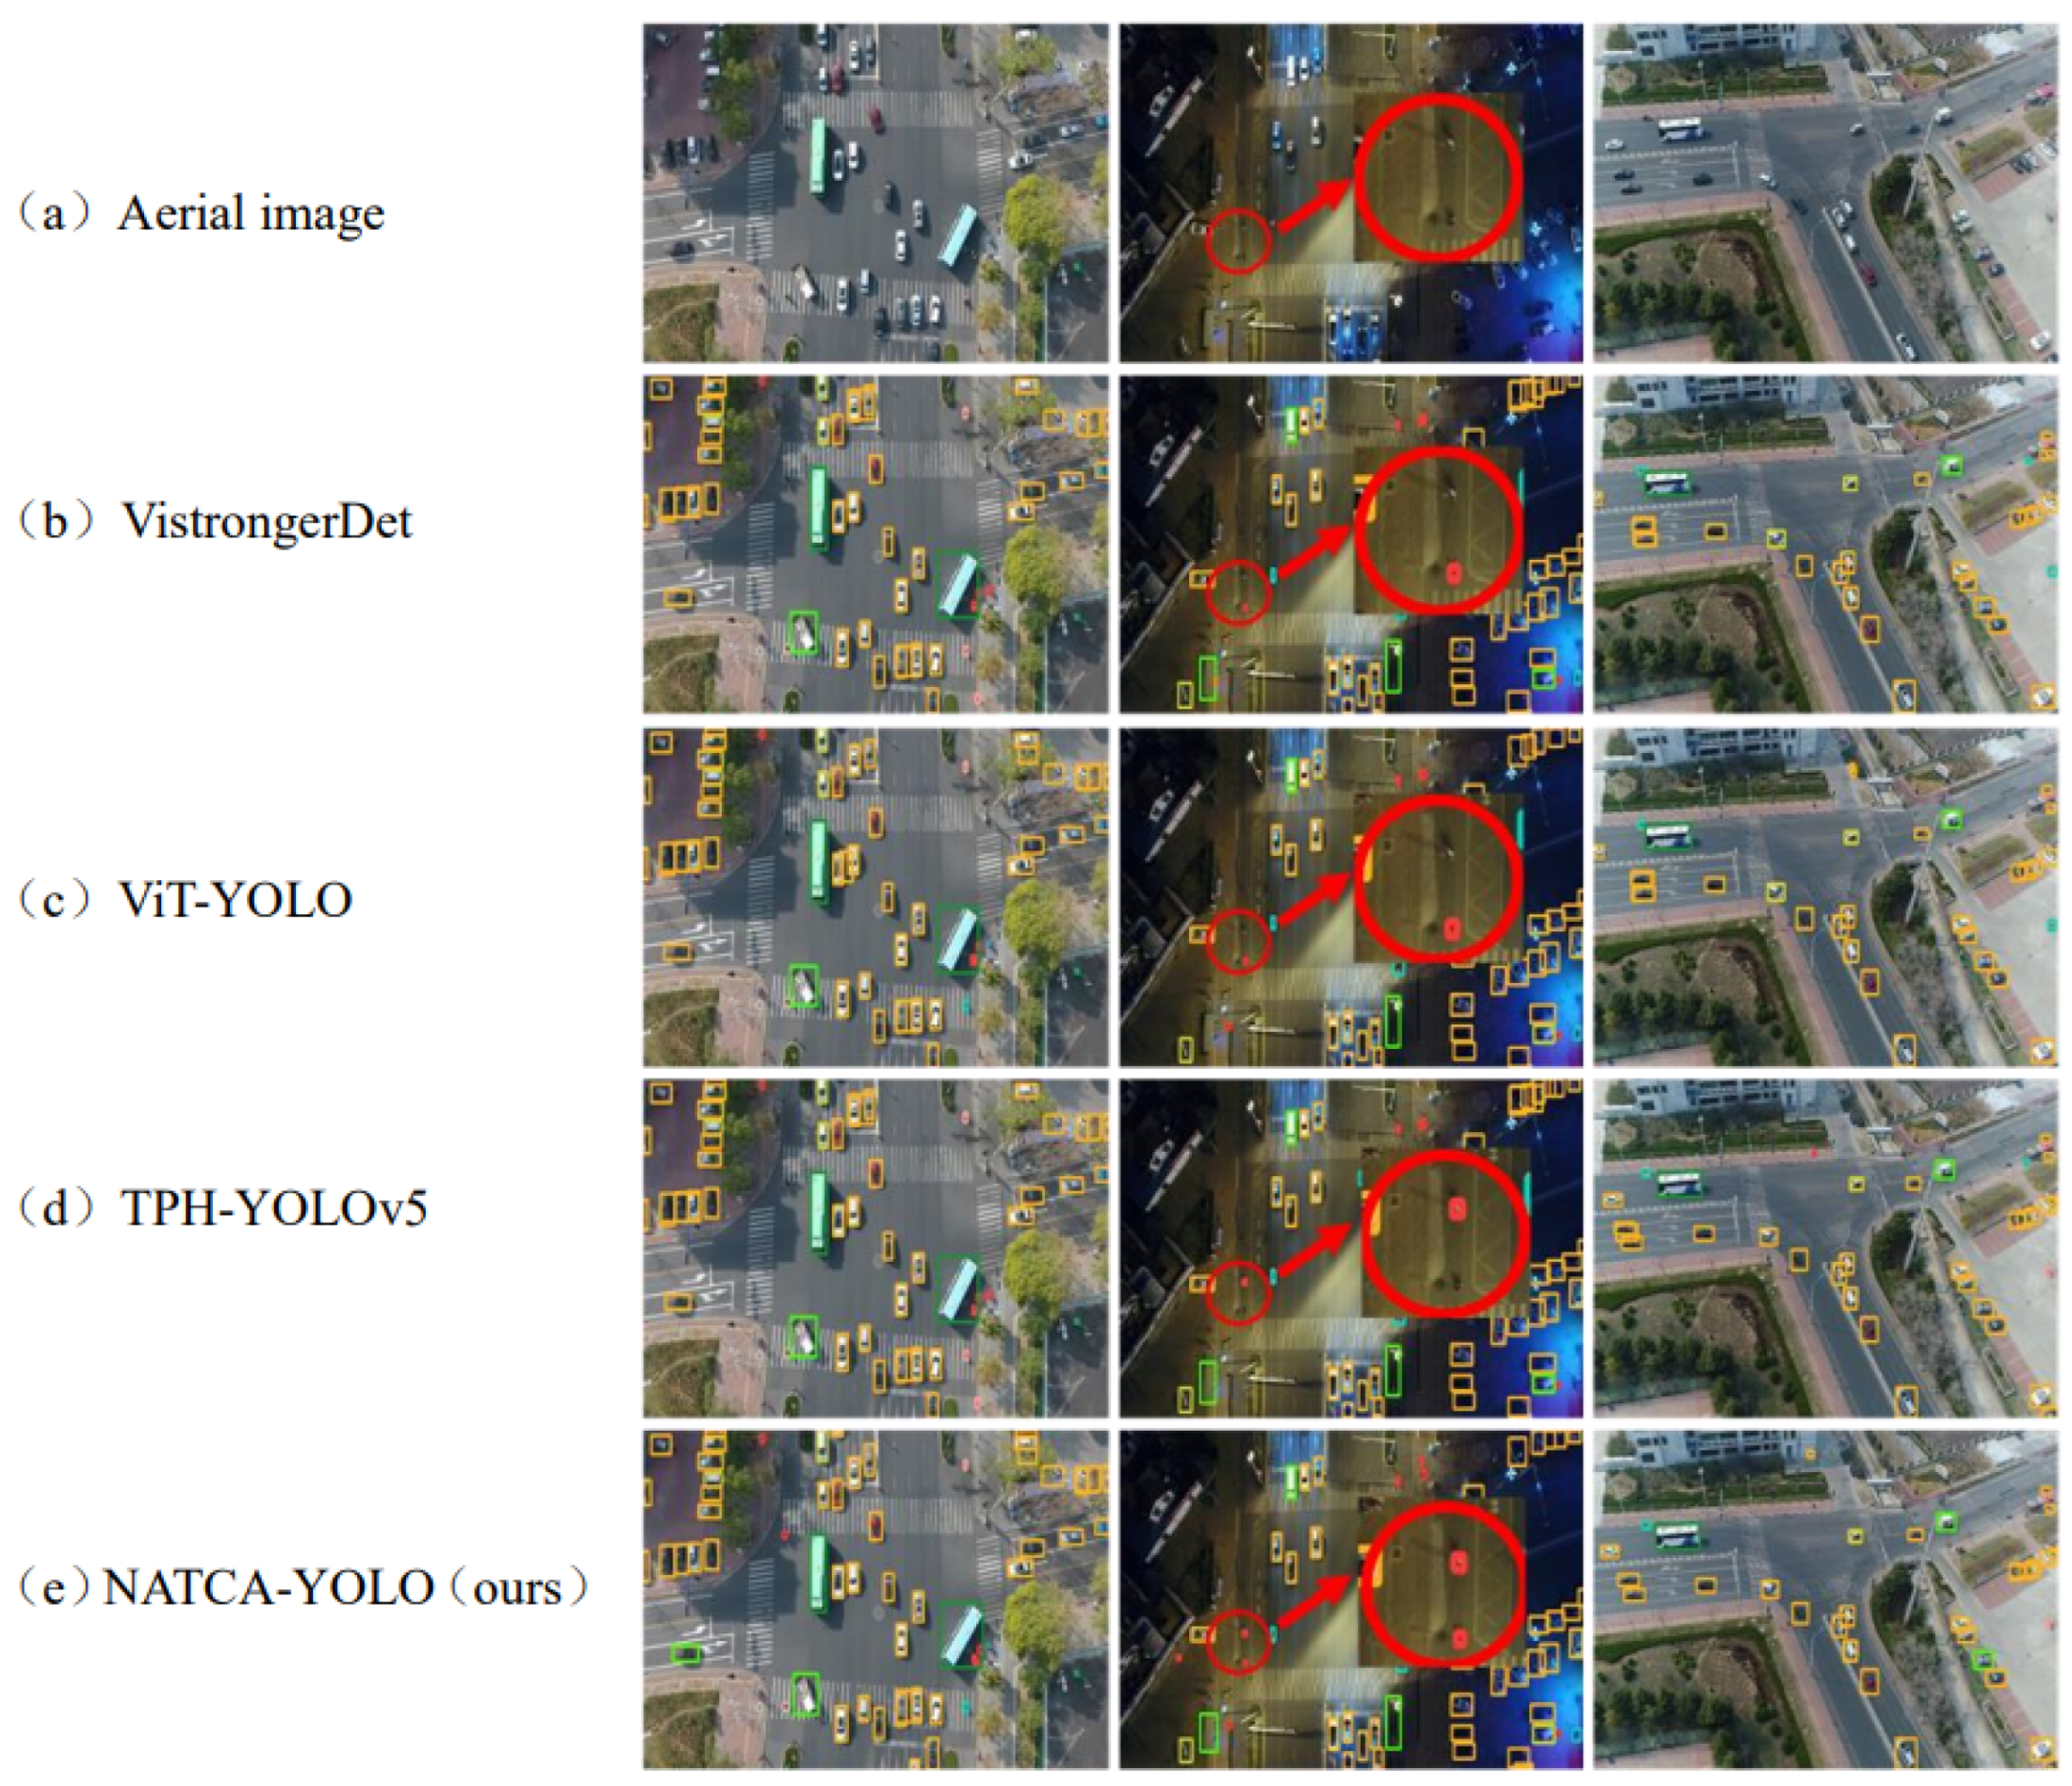
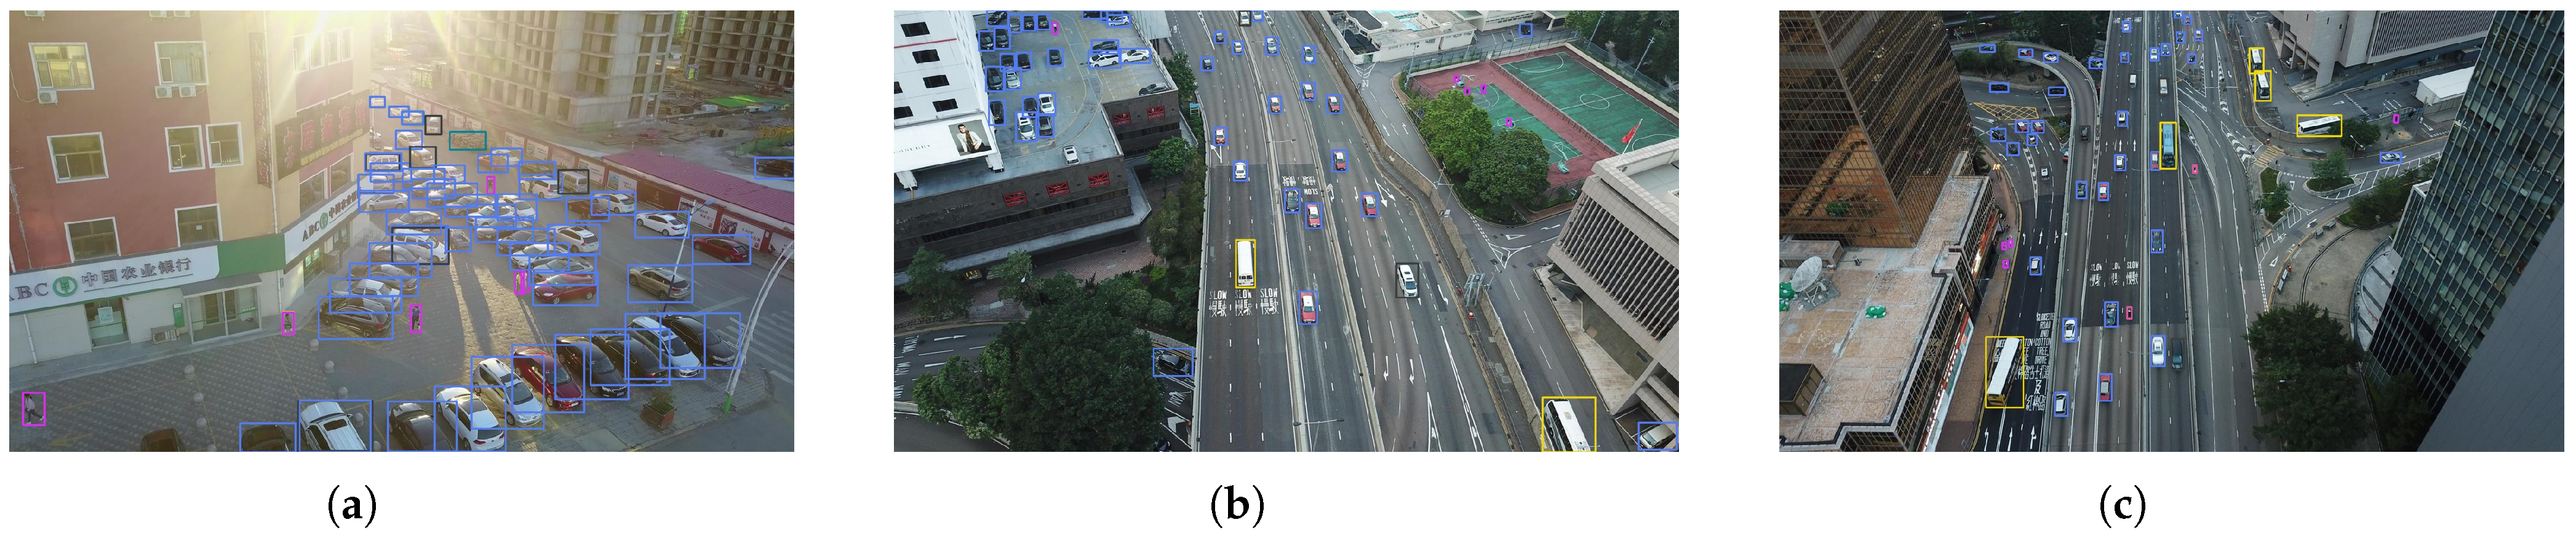
4.3. Contrast Test and Ablation Test
5. Limitation and Future Work
6. Conclusions
Author Contributions
Funding
Institutional Review Board Statement
Informed Consent Statement
Data Availability Statement
Conflicts of Interest
Abbreviations
| NAT | Neighborhood Attention Transformer |
| SA | Self-Attention |
| CBAM | Convolutional Block Attention Module |
| CA | Coordinate Attention |
References
- Liu, F.; Wu, Z.; Yang, A.; Han, X. Adaptive UAV object detection based on multi-scale feature fusion. J. Opt. 2020, 40, 133–142. [Google Scholar]
- Liu, W.; Anguelov, D.; Erhan, D.; Szegedy, C.; Reed, S.; Fu, C.Y.; Berg, A.C. Ssd: Single shot multibox detector. In Proceedings of the Computer Vision—ECCV 2016: 14th European Conference, Amsterdam, The Netherlands, 11–14 October 2016; Proceedings, Part I 14. Springer: Amsterdam, The Netherlands, 2016; pp. 21–37. [Google Scholar]
- Redmon, J.; Divvala, S.; Girshick, R.; Farhadi, A. You only look once: Unified, real-time object detection. In Proceedings of the IEEE Conference on Computer Vision and Pattern Recognition, Las Vegas, NV, USA, 27–30 June 2016; IEEE: Piscataway, NJ, USA, 2016; pp. 779–788. [Google Scholar]
- Puyi, S.; Hong, C.; Haobo, G. Improved UAV object detection algorithm for YOLOv5s. Comput. Eng. Appl. 2023, 59, 108–116. [Google Scholar]
- Qi, J.; Wu, L.; Lu, F.; Shi, H.; Xu, F. UAV object detection based on improved YOLOv4 algorithm. J. Weapons Equip. Eng. 2022, 43, 210–217. [Google Scholar]
- Ren, S.; He, K.; Girshick, R.; Sun, J. Faster R-CNN:Towards real-time object detection with region proposal networks. Trans. Pattern Anal. Mach. Intell. 2017, 39, 1137–1149. [Google Scholar] [CrossRef] [PubMed]
- Jun, S.; Pei, G.; Zhili, X. Faster-RCNN for car model identification analysis. J. Chongqing Univ. 2017, 40, 32–36. [Google Scholar]
- Cai, Z.; Vasconcelos, N. Cascade R-CNN:Delving into high quality object detection. In Proceedings of the IEEE Conference on Computer Vision and Pattern Recognition, Salt Lake City, UT, USA, 18–22 June 2018; IEEE: Piscataway, NJ, USA, 2018; pp. 6154–6162. [Google Scholar]
- Duan, K.; Bai, S.; Xie, L.; Qi, H.; Huang, Q.; Tian, Q. Centernet: Keypoint triplets for object detection. In Proceedings of the IEEE/CVF International Conference on Computer Vision, Seoul, Republic of Korea, 27–28 October 2019; IEEE/CVF: Piscataway, NJ, USA, 2019; pp. 6569–6578. [Google Scholar]
- Law, H.; Deng, J. Cornernet:Detecting objects as paired keypoints. In Proceedings of the European Conference on Computer Vision (ECCV), Munich, Germany, 8–14 September 2018; Springer: Berlin/Heidelberg, Germany, 2018; pp. 734–750. [Google Scholar]
- Lin, T.Y.; Maire, M.; Belongie, S.; Hays, J.; Perona, P.; Ramanan, D.; Dollár, P.; Zitnick, C.L. Microsoft coco: Common objects in context. In Proceedings of the European Conference on Computer Vision, Zürich, Switzerland, 6–12 September 2014; Springer: Berlin/Heidelberg, Germany, 2014; pp. 740–755. [Google Scholar]
- Everingham, M.; Van Gool, L.; Williams, C.K.; Winn, J.; Zisserman, A. The pascal visual object classes (voc) challenge. Int. J. Comput. Vis. 2010, 88, 303–338. [Google Scholar] [CrossRef]
- Deng, J.; Dong, W.; Socher, R.; Li, L.J.; Li, K.; Li, F.-F. Imagenet: A large-scale hierarchical image database. In Proceedings of the 2009 IEEE Conference on Computer Vision and Pattern Recognition, Miami, FL, USA, 20–25 June 2009; IEEE: Piscataway, NJ, USA, 2009; pp. 248–255. [Google Scholar]
- Du, D.; Zhu, P.; Wen, L.; Bian, X.; Lin, H.; Hu, Q.; Peng, T.; Zheng, J.; Wang, X.; Zhang, Y.; et al. VisDrone-DET2019: The vision meets drone object detection in image challenge results. In Proceedings of the IEEE/CVF International Conference on Computer Vision Workshops, Seoul, Republic of Korea, 27–28 October 2019; IEEE/CVF: Piscataway, NJ, USA, 2019. [Google Scholar]
- Du, D.; Qi, Y.; Yu, H.; Yang, Y.; Duan, K.; Li, G.; Zhang, W.; Huang, Q.; Tian, Q. The unmanned aerial vehicle benchmark: Object detection and tracking. In Proceedings of the European Conference on Computer vision (ECCV), Munich, Germany, 8–14 September 2018; Springer: Berlin/Heidelberg, Germany, 2018; pp. 370–386. [Google Scholar]
- Zhou, Q.; Shi, H.; Xiang, W.; Kang, B.; Wu, X.; Latecki, L.J. DPNet: Dual-Path Network for Real-time Object Detection with Lightweight Attention. arXiv 2022, arXiv:abs/2209.13933. [Google Scholar] [CrossRef]
- Xie, S.; Girshick, R.; Dollár, P.; Tu, Z.; He, K. Aggregated residual transformations for deep neural networks. In Proceedings of the IEEE Conference on Computer Vision and Pattern Recognition, Honolulu, HI, USA, 21–26 July 2017; pp. 1492–1500. [Google Scholar]
- Huang, G.; Liu, Z.; Van Der Maaten, L.; Weinberger, K.Q. Densely connected convolutional networks. In Proceedings of the IEEE Conference on Computer Vision and Pattern Recognition, Honolulu, HI, USA, 21–26 July 2017; pp. 4700–4708. [Google Scholar]
- Hassani, A.; Walton, S.; Li, J.; Li, S.; Shi, H. Neighborhood attention transformer. In Proceedings of the IEEE/CVF Conference on Computer Vision and Pattern Recognition, Vancouver, BC, Canada, 18–22 June 2023; pp. 6185–6194. [Google Scholar]
- Yu, X.; Gong, Y.; Jiang, N.; Ye, Q.; Han, Z. Scale match for tiny person detection. In Proceedings of the IEEE/CVF Winter Conference on Applications of Computer Vision, Snowmass Village, CO, USA, 13–19 June 2020; pp. 1257–1265. [Google Scholar]
- Kisantal, M.; Wojna, Z.; Murawski, J.; Naruniec, J.; Cho, K. Ugmentation for small object detection. arXiv 2019, arXiv:1902.07296. [Google Scholar]
- Chen, C.; Zhang, Y.; Lv, Q.; Wei, S.; Wang, X.; Sun, X.; Dong, J. Rrnet: A hybrid detector for object detection in drone-captured images. In Proceedings of the IEEE/CVF International Conference on Computer Vision Workshops, Seoul, Republic of Korea, 27–28 October 2019. [Google Scholar]
- Simonyan, K.; Zisserman, A. Very deep convolutional networks for large-scale image recognition. arXiv 2014, arXiv:1409.1556. [Google Scholar]
- Yu, F.; Koltun, V. Multi-scale context aggregation by dilated convolutions. arXiv 2015, arXiv:1511.07122. [Google Scholar]
- Dai, J.; Qi, H.; Xiong, Y.; Li, Y.; Zhang, G.; Hu, H.; Wei, Y. Deformable convolutional networks. In Proceedings of the IEEE International Conference on Computer Vision, Venice, Italy, 22–29 October 2017; pp. 764–773. [Google Scholar]
- Cai, Z.; Fan, Q.; Feris, R.S.; Vasconcelos, N. A unified multi-scale deep convolutional neural network for fast object detection. In Proceedings of the IEEE International Conference on Computer Vision, Amsterdam, The Netherlands, 11–14 October 2016; Proceedings, Part IV 14. Springer International Publishing: Berlin/Heidelberg, Germany, 2016; pp. 354–370. [Google Scholar]
- Liang, Z.; Shao, J.; Zhang, D.; Gao, L. Small object detection using deep feature pyramid networks. In Proceedings of the Advances in Multimedia Information Processing-PCM 2018: 19th Pacific-Rim Conference on Multimedia, Hefei, China, 21–22 September 2018; Proceedings, Part III 19. Springer International Publishing: Berlin/Heidelberg, Germany, 2018; pp. 554–564. [Google Scholar]
- Cao, G.; Xie, X.; Yang, W.; Liao, Q.; Shi, G.; Wu, J. 0 Feature-fused SSD: Fast detection for small objects. In Proceedings of the Ninth International Conference on Graphic and Image Processing (ICGIP 2017), Qingdao, China, 14–16 October 2018; Volume 10615, pp. 381–388. [Google Scholar]
- Li, Z.; Zhou, F. FSSD: Feature fusion single shot multibox detector. arXiv 2017, arXiv:1712.00960. [Google Scholar]
- Yang, F.; Fan, H.; Chu, P.; Blasch, E.; Ling, H. Clustered object detection in aerial images. In Proceedings of the IEEE/CVF International Conference on Computer Vision, Seoul, Republic of Korea, 27 October–2 November 2019; pp. 8311–8320. [Google Scholar]
- Wang, Y.; Yang, Y.; Zhao, X. Object detection using clustering algorithm adaptive searching regions in aerial images. In Proceedings of the Computer Vision—ECCV 2020 Workshops, Glasgow, UK, 23–28 August 2020; Proceedings, Part IV 16. Springer International Publishing: Berlin/Heidelberg, Germany, 2020; pp. 651–664. [Google Scholar]
- Deng, S.; Li, S.; Xie, K.; Song, W.; Liao, X.; Hao, A.; Qin, H. A global-local self-adaptive network for drone-view object detection. IEEE Trans. Image Process. 2020, 30, 1556–1569. [Google Scholar] [CrossRef] [PubMed]
- Li, C.; Yang, T.; Zhu, S.; Chen, C.; Guan, S. Density map guided object detection in aerial images. In Proceedings of the IEEE/CVF Conference on Computer Vision and Pattern Recognition Workshops, Seattle, WA, USA, 14–19 June 2020; pp. 190–191. [Google Scholar]
- Jiang, N.; Yu, X.; Peng, X.; Gong, Y. SM+: Refined scale match for tiny person detection. In Proceedings of the ICASSP 2021–2021 IEEE International Conference on Acoustics, Speech and Signal Processing (ICASSP), Toronto, ON, Canada, 6–11 June 2021; pp. 1815–1819. [Google Scholar]
- Xu, C.; Wang, J.; Yang, W.; Yu, L. Dot distance for tiny object detection in aerial images. In Proceedings of the IEEE/CVF Conference on Computer Vision and Pattern Recognition, Virtual, 19–25 June 2021; pp. 1192–1201. [Google Scholar]
- Xu, C.; Wang, J.; Yang, W.; Yu, H.; Yu, L.; Xia, G.S. A normalized Gaussian Wasserstein distance for tiny object detection. arXiv 2021, arXiv:2110.13389. [Google Scholar]
- Ma, N.; Zhang, X.; Liu, M.; Sun, J. Ctivate or not: Learning customized activation. In Proceedings of the IEEE/CVF Conference on Computer Vision and Pattern Recognition, Virtual, 19–25 June 2021; pp. 8032–8042. [Google Scholar]
- Dosovitskiy, A.; Beyer, L.; Kolesnikov, A.; Weissenborn, D.; Zhai, X.; Unterthiner, T.; Dehghani, M.; Minderer, M.; Heigold, G.; Gelly, S.; et al. An image is worth 16 × 16 words: Transformers for image recognition at scale. arXiv 2020, arXiv:2010.11929. [Google Scholar]
- Lin, T.Y.; Goyal, P.; Girshick, R.; He, K.; Dollár, P. Focal loss for dense object detection. In Proceedings of the IEEE International Conference on Computer Vision, Venice, Italy, 22–29 October 2017; IEEE: Piscataway, NJ, USA, 2017; pp. 2980–2988. [Google Scholar]
- Tian, Z.; Shen, C.; Chen, H.; He, T. Fcos: Fully convolutional one-stage object detection. In Proceedings of the IEEE/CVF International Conference on Computer Vision, Seoul, Republic of Korea, 27 October–2 November 2019; IEEE/CVF: Piscataway, NJ, USA, 2019; pp. 9627–9636. [Google Scholar]
- Carion, N.; Massa, F.; Synnaeve, G.; Usunier, N.; Kirillov, A.; Zagoruyko, S. End-to-end object detection with transformers. In Proceedings of the European Conference on Computer Vision, Glasgow, UK, 23–28 August 2020; Springer: Berlin/Heidelberg, Germany, 2020; pp. 213–229. [Google Scholar]
- Zhu, X.; Lyu, S.; Wang, X.; Zhao, Q. TPH-YOLOv5: Improved YOLOv5 based on transformer prediction head for object detection on drone-captured scenarios. In Proceedings of the IEEE/CVF International Conference on Computer Vision, Montreal, BC, Canada, 11–17 October 2021; IEEE: Piscataway, NJ, USA, 2021; pp. 2778–2788. [Google Scholar]
- Wan, J.; Zhang, B.; Zhao, Y.; Du, Y.; Tong, Z. Vistrongerdet: Stronger visual information for object detection in visdrone images. In Proceedings of the IEEE/CVF International Conference on Computer Vision, Montreal, BC, Canada, 10–17 October 2021; pp. 2820–2829. [Google Scholar]
- Zhang, Z.; Lu, X.; Cao, G.; Yang, Y.; Jiao, L.; Liu, F. ViT-YOLO: Transformer-based YOLO for object detection. In Proceedings of the IEEE/CVF International Conference on Computer Vision, Montreal, BC, Canada, 11–17 October 2021; pp. 2799–2808. [Google Scholar]


| Model | mAP% |
|---|---|
| Faster R-CNN | 19.32 |
| RetinaNet | 21.02 |
| SSD | 20.36 |
| FCOS | 21.14 |
| DETRZ | 38.02 |
| TPH-YOLOv5 | 39.10 |
| NATCA-YOLO(ours) | 42.00 |
| Model | mAP% |
|---|---|
| YOLOv5 | 28.9 |
| YOLOv5+NAT | 39.3 |
| YOLOv5+NAT+CBAM | 39.7 |
| YOLOv5+NAT+CA | 41.2 |
| Model | mAP% |
|---|---|
| NATCA-YOLO | 42.0 |
| Our-NAT | 39.3 (−2.7) |
| Our-ACON | 41.2 (−0.8) |
| Our-CA | 40.6 (−1.4) |
| Model | Model 1 | Model 2 | Model 3 |
|---|---|---|---|
| mAP% | 47.5 | 48.3 | 51.3 |
| Model | mAP% | AP50% |
|---|---|---|
| VistrongerDet [43] | 33.72 | 56.42 |
| ViT-YOLO [44] | 38.6 | 62.81 |
| TPH-YOLOv5 | 39.18 | 63.3 |
| NATCA-YOLO(ours) | 42 | 66.27 |
| Model | 320 × 320 | 640 × 640 | 960 × 960 |
|---|---|---|---|
| ViT-YOLO | 12.2 ms | 16.5 ms | 31.1 ms |
| (100 FPS) | (73 FPS) | (32 FPS) | |
| TPH-YOLOv5 | 8.4 ms | 12.5 ms | 26 ms |
| (124 FPS) | (97 FPS) | (45 FPS) | |
| NATCA-YOLO(ours) | 9.3 ms | 14.6 ms | 28.1 ms |
| (109 FPS) | (83 FPS) | (37 FPS) |
Disclaimer/Publisher’s Note: The statements, opinions and data contained in all publications are solely those of the individual author(s) and contributor(s) and not of MDPI and/or the editor(s). MDPI and/or the editor(s) disclaim responsibility for any injury to people or property resulting from any ideas, methods, instructions or products referred to in the content. |
© 2024 by the authors. Licensee MDPI, Basel, Switzerland. This article is an open access article distributed under the terms and conditions of the Creative Commons Attribution (CC BY) license (https://creativecommons.org/licenses/by/4.0/).
Share and Cite
Zhu, Y.; Ai, Z.; Yan, J.; Li, S.; Yang, G.; Yu, T. NATCA YOLO-Based Small Object Detection for Aerial Images. Information 2024, 15, 414. https://doi.org/10.3390/info15070414
Zhu Y, Ai Z, Yan J, Li S, Yang G, Yu T. NATCA YOLO-Based Small Object Detection for Aerial Images. Information. 2024; 15(7):414. https://doi.org/10.3390/info15070414
Chicago/Turabian StyleZhu, Yicheng, Zhenhua Ai, Jinqiang Yan, Silong Li, Guowei Yang, and Teng Yu. 2024. "NATCA YOLO-Based Small Object Detection for Aerial Images" Information 15, no. 7: 414. https://doi.org/10.3390/info15070414
APA StyleZhu, Y., Ai, Z., Yan, J., Li, S., Yang, G., & Yu, T. (2024). NATCA YOLO-Based Small Object Detection for Aerial Images. Information, 15(7), 414. https://doi.org/10.3390/info15070414