Abstract
Aiming at the difficulty in obtaining environmental parameters in dairy cattle breeding, this paper proposes and implements a dairy cattle breeding environment monitoring system based on Bluetooth and B/S architecture. In order to reduce the cost of cross-platform deployment, the overall system adopts the B/S architecture and introduces a Bootstrap responsive layout; in order to improve the human–computer interaction capabilities, the Echarts graphical plug-in is introduced; and in order to enhance the stability of Bluetooth communication, a time-sharing connection mechanism and sampling are designed along with a cycle adaptive adjustment mechanism. The experimental results show that the system has a good user experience on various smart terminal devices. The time-sharing connection mechanism solves the repeated disconnection problem under the Bluetooth one-master, multiple-slave star connection. The system can be used in the dairy cow growth environment. With real-time monitoring and accurate early warning, it reduces the deployment and use cost of the system and has broad application prospects.
1. Introduction
Animal husbandry accounts for more than 50% of global agricultural production [1]. According to the estimation of the Food and Agriculture Organization of the United Nations (FAO), there are about 750 million people in the world engaged in milk production related industries [2]. Although the milk output of each cow varies greatly among different regions and strictly depends on the use of relevant technologies [3], with increasingly fierce competition in the global market, the technological differences between developed countries and developing China are gradually narrowing [4]. Moreover, dairy producers all over the world face the same challenge: they need to use the latest technology to improve resource utilization efficiency [5].
In recent years, the use of multi-parameter fusion wireless sensor network monitoring of poultry’s growth environment has become a new research direction, and many scholars have conducted a lot of research on this. Li X et al. [6] developed a 5G-based intelligent Internet of Things poultry farming system, which enables managers to monitor the farming environment information anytime and anywhere, but the 5G communication method is charged, which greatly increases the deployment and use costs of the system. Zhang W et al. [7] developed a smart handheld terminal based on Android, which can monitor the environmental temperature, humidity, illuminance, and indoor harmful gas concentration of the farm in real time. However, Android-based clients have problems such as IOS system incompatibility and the need to install APP. Zeng Z et al. [8] developed a ZigBee-based wireless sensor network to monitor the environmental parameters of commercial pregnant sow houses in real time; Tang j et al. [9] developed a remote intelligent environment monitoring system for chicken house based on arm and ZigBee technology, which takes ZigBee as the core to realize real-time collection and monitoring of indoor temperature, humidity, carbon dioxide concentration and other environmental information. However, when sending a small amount of data in a short communication range, it is better to use Zigbee or Bluetooth instead of Wi-Fi because of their lower power consumption [10], thereby extending the battery life of the node [11].
In view of the existing problems, combined with the latest technology, this paper proposes a dairy farming environment monitoring system based on Bluetooth and B/S architecture. The system follows the three-tier architecture design principle of the Internet of things USN [12], integrates sensor, Bluetooth communication, Wi-Fi communication, database, network and other technologies, and divides the whole system into a terminal acquisition system, an information transmission system and a data visualization system. The terminal collection system consists of multiple Bluetooth-based multi-parameter collection nodes. The collection nodes can collect temperature, relative humidity, ammonia () concentration, hydrogen sulfide () concentration and carbon dioxide () in the dairy farming environment in real time. The five environmental parameters of concentration; the information transmission system is composed of a gateway based on Bluetooth and Wi-Fi to build a two-way communication link from the terminal collection system to the data visualization system; the data visualization system is composed of a database and a server, realize node management, parameter visualization and abnormal warning. The overall system architecture diagram is shown in Figure 1.
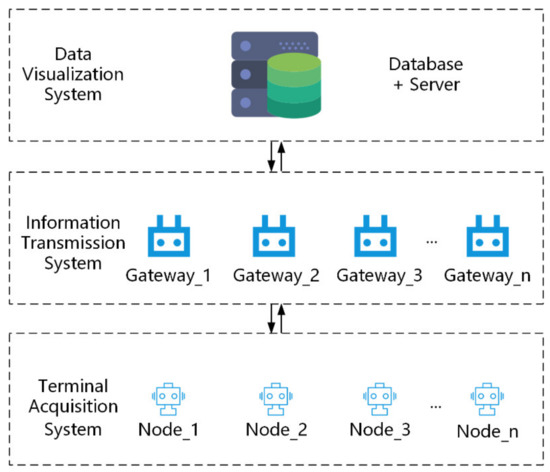
Figure 1.
Overall System Architecture Diagram.
Multiple terminal acquisition nodes upload the acquired environmental information to the regional gateway via Bluetooth. After the gateway receives the data, it forwards the data to the server via Wi-Fi. The server processes the data after receiving the data and feeds back information to the corresponding node. Users in the local area network can access the data visualization system through the browser of any smart terminal device.
The novelty of this article can be summarized as the following:
- A multi-parameter collection node and a Bluetooth gateway based on Bluetooth and Wi-Fi have been developed that can accurately collect the environmental parameters of dairy cattle farming.
- A data visualization system based on the B/S architecture has been developed. Users in the local area network can monitor the environment through the browser of any smart device (mobile phone, tablet, laptop, etc.) without installing specific applications, which reduces the system’s deployment cost.
- The data visualization system is designed with a time-sharing connection mechanism to control the gateway to actively disconnect the acquisition node, which enhances the stability of the Bluetooth connection under the star structure. The introduction of an autonomous control mechanism for the sampling period effectively reduces the energy consumption of the acquisition node.
The rest of this article is organized as follows. The Section 2 introduces the realization of each part of the system. In the Section 3, experiments were carried out on the system and the experimental results are shown. The Section 4 summarizes the work of this paper and makes suggestions for future work.
2. Materials and Methods
2.1. Acquisition Node
Heat stress is one of the most important factors limiting the production of dairy cows. It has far-reaching implications for the productivity, health, reproduction and overall impact of dairy cows [13]. For intensively farmed dairy cows, the temperature and humidity index (THI) has been widely used to assess the degree of heat stress in dairy cows [14]. The formula for determining THI using ambient temperature (T) and relative humidity (RH) is as follows [15]:
THI = (1.8 × T + 32) − [(0.55 − 0.0055 × RH) × (1.8 × T − 26)]
In addition, the harmful gases in the dairy barn mainly include , , , etc. [16]. Therefore, the terminal acquisition node introduced in this section includes a multi-sensor module (temperature and humidity, , , and sensors), a data processing unit, and a power supply module. The node is powered by a lithium battery. The overall architecture of the acquisition node is shown in Figure 2.
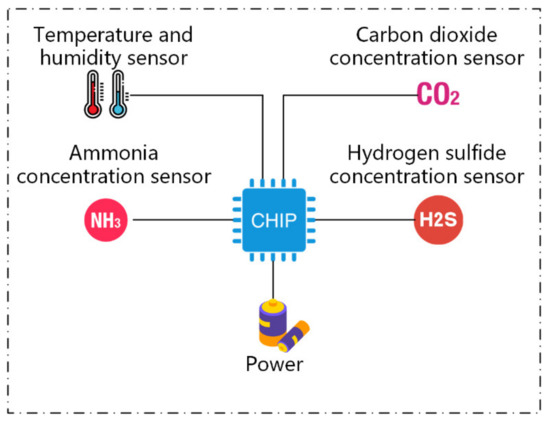
Figure 2.
Architecture diagram of acquisition node.
2.1.1. Multi Sensor Module
The multi-sensor module can acquire five types of environmental parameters at the same time, including temperature, relative humidity, , , and concentration. The temperature and humidity sensors use SHT21 produced by Sensirion. The sensor module has the characteristics of digital output, no debugging, no calibration, no external circuits and full interchangeability [17]; the sensor uses MG-811 produced by SUMIDA, the sensor has the characteristics of being less affected by changes in temperature and humidity [18]; the sensor uses MQ137, which has the characteristics of a simple test circuit, fast response recovery and high sensitivity [19]; the sensor, MQ136, has the same advantages as MQ137 [20]. The data processing unit uses the NRF52832 chip produced by Nordic Semiconductor. This is an ultra-low-power multi-protocol SOC (System-On-a-Chip) integrated with a 2.4 Ghz radio transceiver. It can support low-power Bluetooth and other wireless communication protocols. In terms of power consumption, NRF52832 shuts down in the state of retaining RAM (Random Access Memory), the quiescent current is as low as 0.3uA; standby in the state of retaining RAM, the quiescent current is as low as 1.5 uA [21]. The sensor component parameters are shown in Table 1.

Table 1.
Sensor component parameter table [17,18,19,20].
2.1.2. Power Management Module
The power management part uses the MAX17055 low-power current fuel gauge produced by Maxim, which integrates the ModelGauge m5 EZ algorithm provided by Maxim’s official company. It does not need to model a specific battery to achieve a high-precision measurement of lithium batteries. The operating current of MAX17055 is as low as 7uA. The host directly reads information related to the power supply through the 2-wire I^2 C communication interface, such as, battery charge status, remaining power (mAh), battery power status (SOC, %), battery voltage, etc. [22].
2.1.3. Data Storage Function
This system designs the Bluetooth gateway to poll the connection acquisition node; therefore, with the periodic sampling data of the queue storage node, when the Bluetooth gateway is connected in the next cycle, the stored data will be sent to the gateway, according to the FIFO principle, to ensure data continuity.
2.2. Gateway
The gateway of the information transmission system is responsible for building a two-way communication link between the acquisition node and the server side, and realizes the transmission and feedback of multi-parameter environmental information from the terminal collection node to the server side. The Bluetooth module uses the nRF52840 radio frequency chip [23] produced by Nordic that supports the BLE5.0 protocol, and the Wi-Fi module uses the ESP8266EX chip produced by Espressif. The functional design of the gateway is shown in Figure 3.
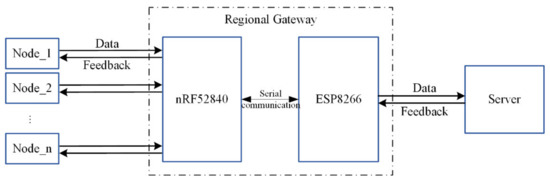
Figure 3.
Gateway function design diagram.
The collection node performs Bluetooth pairing with the Bluetooth host module in the regional gateway, and transmits the collected multi-parameter data to the gateway through the Bluetooth communication protocol. The Bluetooth host module in the gateway transmits data to the Wi-Fi module through the serial port. The Wi-Fi module realizes the remote transmission of data packets through the local area network formed with the server. The server sends feedback instructions after receiving and processing the data. After receiving the feedback instructions, the gateway accurately transmits them to the corresponding collection node according to the device name, thereby realizing the precise control of the acquisition node. The physical map of the gateway is shown in Figure 4.
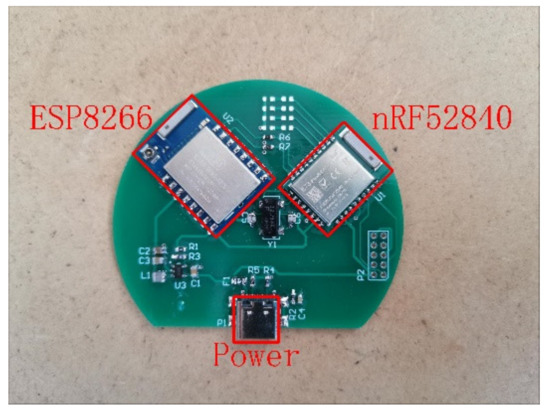
Figure 4.
Physical picture of regional gateway.
2.3. Data Visualization System
In order to further reduce the deployment costs, the data visualization system runs on the Windows platform, configures a JDK (java development kit) environment and installs the Tomcat server and MySQL database programs. Tomcat is a web server developed using Java language [24]. MySQL is a relational database. Compared with non-relational databases, a major advantage of MySQL is that the data are stored in different tables instead of in a large warehouse. This setting increases the speed and flexibility of operation [25,26]. The data visualization system development mainly includes the following two parts: database design and server development.
2.3.1. Database
The ER diagram of the database is shown in Figure 5. The database is composed of an administrator table, a node table, a single node history data table, and all the nodes’ latest data tables.
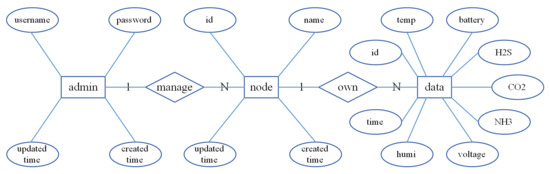
Figure 5.
Database ER diagram.
Among them, the administrator table is used to store the basic information of the administrator, and the node table is managed by the administrator. The administrator can add, delete and modify node attributes. According to different business requirements, two kinds of node data tables are designed to store data: “DATA” table is used to store the latest data of all nodes; The “DATAS” table is used to store all data of all nodes, including historical data and the latest data. Among them, “DATA” table only executions update operation, “DATAS” table only executions insert operation, and uses database trigger to update synchronously.
2.3.2. Server
In order to implement the idea of “high cohesion, low coupling”, we divide the server business applications into the following three levels: presentation layer (UI), business logic layer (BLL) and data access layer (DAL) [27], where the presentation layer is responsible for data visualization, the business logic layer combines the basic operations of the data access layer for specific businesses to form complex business operations; and the data access layer defines the DML (Data Manipulation Language) and DQL (Data Query Language) operations of the database [28], and directly manipulates the database data. The three-tier architecture of the server is shown in Figure 6.
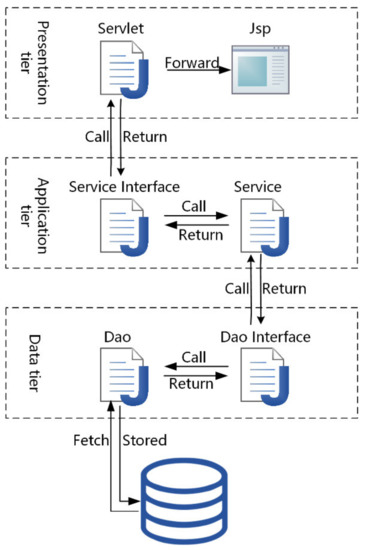
Figure 6.
Three tier architecture of server.
The human–computer interaction interface uses HTML to write the basic frame of the page, beautifies the HTML page through CSS [29] and writes the corresponding JS script to realize the response to the browser event. The page introduces Bootstrap’s responsive layout technology to realize the consistent layout of the visualization system on PC, Android and IOS. Additionally, with the help of Echarts’ component to draw a historical data line chart, the display interface is more intuitive and vivid [30].
As the core of the system, the server is responsible for data processing and request response. Aiming at the problem of frequent disconnection under Bluetooth-one-master-multi-slave star connection, a time-sharing connection mechanism is designed to enhance connection stability. In order to further save node energy consumption, a sampling period adaptive adjustment mechanism is introduced. The server workflow is shown in Figure 7.
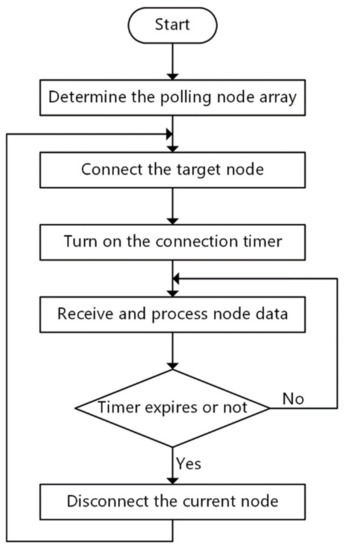
Figure 7.
Server work flow chart.
After the server starts to work, it first determines the polling node array according to the node table, and then controls the gateway to connect to the nodes in turn, receives and processes the node data, and returns the governing datagram to the acquisition node. After the timer expires, it disconnects the current node and connects to another. The data processing includes a data parity check, a meaningful check, and data abnormality analysis. The system designs five sampling periods for five environmental parameters. The corresponding relationship between the number of abnormal parameters and the sampling period is shown in Table 2.
Table 2.
Correspondence between parameters and period.
3. Results
This experiment is divided into two parts, deploying a gateway, and running ten collection nodes for 14 days in a laboratory environment and two days in a dairy farm environment. The screenshots of each interface of the data visualization system are shown below. The node’s latest data interface displays the latest data of the working node. A screenshot of the interface is shown in Figure 8.
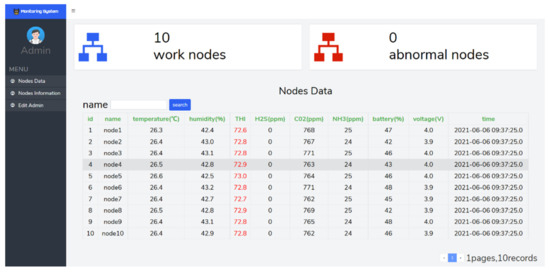
Figure 8.
Screenshot of the latest data of all nodes.
In order to enhance the human–computer interaction capabilities, the visualization system is designed to mark red warnings for abnormal parameters. When the environmental THI exceeds 70, milk production will decrease [31]. According to the standards designated by China for the environmental quality of the cowshed area, must not exceed 20 mg/m3, must not exceed 8 mg/m3, and must not exceed 1500 mg/m3. Therefore, the abnormal parameter is defined as THI, which is higher than 70, the concentration is higher than 28.8 ppm (20 mg/m3), the gas concentration is higher than 5.76 ppm (8 mg/m3), the gas concentration is higher than 840 ppm (1500 mg/m3), the electricity is lower than 20% and the voltage is lower than 3 V.
The single node historical data display interface displays all the data of a single node, and a screenshot of the interface is shown in Figure 9.
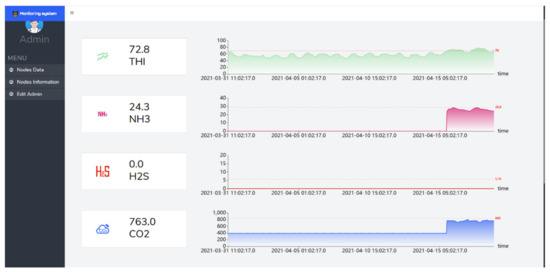
Figure 9.
Screenshot of the historical data interface of a single node.
The single node historical data display interface combines the Echarts component to display the node historical data to the administrator in the form of a line graph, and intuitively reflect the abnormal situation of the data through the warning line. When the amount of data is too much, the user can zoom in with the mouse wheel, the target area is convenient for detailed viewing.
Enlarge the 21:07:25 data of the THI history curve in 2021.6.4, and find that the THI of the farming environment is 70.45 greater than 70 at this time, and the system judges that the environment is abnormal. Adjust the sampling period to 30 min, and the environmental THI is 69.56 collected at 21:37:25 (shown in Figure 10). The system judges it to be normal and restores the default sampling period of 60 min. The node management interface provides the administrator with operations for adding, deleting, modifying and checking nodes. The administrator can manage the nodes through the corresponding buttons. The screenshot of the interface is shown in Figure 11.
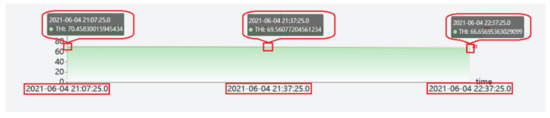
Figure 10.
Screenshot of the system’s adaptive adjustment sampling period interface.
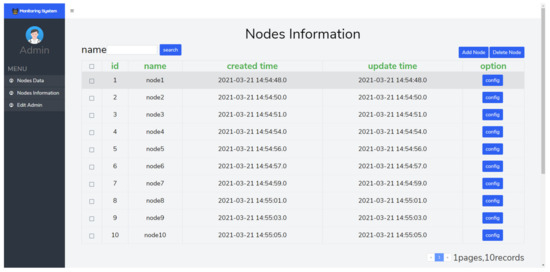
Figure 11.
Screenshot of the node management interface.
4. Discussion
This system proposes and implements a dairy cow farming environment monitoring system based on Bluetooth and B/S architecture, which has been tested in a laboratory environment for 14 consecutive days (2021.03.31 11:02:17–2021.04.15 15:32:17) and two consecutive days of testing at the farming site (2021.06.04 09:37.25–2021.06.06 09:37.25). A total of 4110 sets of data were collected, including 341 sets in a laboratory environment and 70 sets in a farming environment. During the test, no packet loss or repeated disconnection was found. The experimental results show that the acquisition node designed by this system can accurately acquire multi-parameter environmental information, the gateway can accurately transmit the environmental parameters uploaded by the node, and the management system based on the B/S architecture can save deployment costs while achieving environmental monitoring. This design the time-sharing connection mechanism proposed by the scheme solves the problem of repeated disconnection under the one-master and multiple-slave Bluetooth connection mode, and enhances the stability of communication. The self-regulating sampling period mechanism can adaptively adjust the sampling period when environmental parameters are abnormal. In addition, this system can be extended to the field of smart medical and smart home after the terminal is replaced. The future expandable research direction of this system is to add more environmental parameters that affect the growth of dairy cows, and control peripheral equipment to eliminate abnormal situations.
Author Contributions
For this research, Y.Q. and G.S. designed the concept of the research; B.Z. implemented the experimental design; Y.Q. and B.Z. conducted data analysis; Y.Q. wrote the draft paper; W.L. reviewed and edited the whole paper; G.S. acquired the funding. All authors have read and agreed to the published version of the manuscript.
Funding
This work was supported by the Tianjin Science and Technology Major Project and Engineering (No.18ZXRHNC00140) and Tianjin Key Laboratory of Optoelectronic Sensor and Sensor Network Technology.
Institutional Review Board Statement
Not applicable.
Informed Consent Statement
Not applicable.
Data Availability Statement
Data sharing not applicable.
Conflicts of Interest
The authors declare no conflict of interest.
References
- Herrero, M.; Henderson, B.; Havlik, P.; Thornton, P.K.; Conant, R.; Smith, P.; Wirsenius, S.; Hristov, A.N.; Gerber, P.; Gill, P.S.M.; et al. Greenhouse gas mitigation potentials in the livestock sector. Nat. Clim. Chang. 2016, 6, 452–461. [Google Scholar] [CrossRef] [Green Version]
- Dairy Production and Products: Social and Gender Issues. Available online: http://www.fao.org/dairy-production-products/socio-economics/social-and-gender-issues/en/ (accessed on 1 July 2021).
- Food and Agriculture Organization of the United Nations. Food Outlook Biannual Report on Global Food Markets |Policy Support and Governance. 2018. Available online: http://www.fao.org/policy-support/resources/resources-details/en/c/1169716/ (accessed on 1 July 2021).
- Milk and Milk Product Statistics—Statistics Explained. 2018. Available online: https://ec.europa.eu/eurostat/statistics-explained/index.php/Milk_and_milk_product_statistics#Milk_products (accessed on 1 July 2021).
- Fleming, K.; Waweru, P.; Wambua, M.; Ondula, E.; Samuel, L. Toward quantified small-scale farms in Africa. IEEE Internet Comput. 2016, 20, 63–67. [Google Scholar] [CrossRef]
- Li, X.; Zhang, J.; Jin, W.; Liu, W. Key technology implementation of poultry breeding system for 5G intelligent IOT. In Proceedings of the 2020 IEEE Conference on Telecommunications, Optics and Computer Science (TOCS), Shenyang, China, 11–13 December 2020; pp. 372–376. [Google Scholar]
- Zhang, W.; Chen, C. Design and implementation of an android-based broiler production environment monitoring system. In Proceedings of the 2020 IEEE 3rd International Conference on Automation, Electronics and Electrical Engineering (AUTEEE), Shenyang, China, 20–22 November 2020; pp. 125–128. [Google Scholar]
- Zeng, Z.; Zeng, F.; Han, X.; Hamza, E.; Yu, Q.; Lu, E. Real-time monitoring of environmental parameters in a commercial gestating sow house using a zigbee-based wireless sensor network. Appl. Sci. 2021, 11, 972. [Google Scholar] [CrossRef]
- Tang, J.; Dong, T.; Li, L.; Shao, L. Intelligent monitoring system based on internet of things. Wirel. Pers. Commun. 2018, 102, 1521–1537. [Google Scholar] [CrossRef]
- Putra, G.D.; Pratama, A.R.; Lazovik, A. Comparison of energy consumption in Wi-Fi and bluetooth communication in a smart building. In Proceedings of the 2017 IEEE 7th Annual Computing and Communication Workshop and Conference (CCWC), Las Vegas, NV, USA, 2–5 December 2017; pp. 1–6. [Google Scholar]
- Choi, M.; Han, J.; Lee, I. An efficient energy monitoring method based on bluetooth low energy. In Proceedings of the 2016 IEEE International Conference on Consumer Electronics (ICCE), Las Vegas, NV, USA, 9–11 January 2016; pp. 359–360. [Google Scholar]
- Han, J.; Zhang, Y. IoT USN system and hybrid architecture application. 2020 Chinese Automation Congress (CAC), Shanghai, China, 6–8 November 2020; pp. 514–518. [Google Scholar] [CrossRef]
- Tao, S.; Rivas, R.M.O.; Marins, T.N.; Chen, Y.-C.; Gao, J.; Bernad, J.K. Impact of heat stress on lactational performance of dairy cows. Theriogenology 2020, 150, 437–444. [Google Scholar] [CrossRef] [PubMed]
- Li, G.; Chen, J.; Peng, D.; Gu, X. Short communication: The lag response of daily milk yield to heat stress in dairy cows. J. Dairy Sci. 2021, 104, 981–988. [Google Scholar] [CrossRef] [PubMed]
- Dikmen, S.; Hansen, P.J. Is the temperature-humidity index the best indicator of heat stress in lactating dairy cows in a subtropical environment? J. Dairy Sci. 2009, 92, 109–116. [Google Scholar] [CrossRef] [PubMed] [Green Version]
- Miranda, C.; Soares, A.S.; Coelho, A.C.; Trindade, H.; Teixeira, C.A. Environmental implications of stored cattle slurry treatment with sulphuric acid and biochar: A life cycle assessment approach. Environ. Res. 2021, 194, 110640. [Google Scholar] [CrossRef] [PubMed]
- SHT21 Semiconductor Sensor for Temperature and Humidity. 2021. Available online: http://www.farnell.com/datasheets/1780639.pdf (accessed on 1 July 2021).
- MG811 Semiconductor Sensor for Carbon Dioxide. 2021. Available online: https://sandboxelectronics.com/files/SEN-000007/MG811.pdf (accessed on 1 July 2021).
- MQI37 Semiconductor Sensor for Ammonia. 2020. Available online: https://cdn.datasheetspdf.com/pdf-down/M/Q/1/MQI37-Hanwei.pdf (accessed on 1 July 2021).
- MQ136 Semiconductor Sensor for Sulfur Dioxide. 2020. Available online: http://www.china-total.com/Product/meter/gas-sensor/MQ136.pdf (accessed on 1 July 2021).
- nRF52832. 2021. Available online: https://www.mouser.com/datasheet/2/297/nRF52832%20Product%20Brief%20v1.2-890472.pdf (accessed on 1 July 2021).
- Juteau, N.; Gosselin, B. Wearable wireless-enabled oscillometric sphygmomanometer: A flexible ambulatory tool for blood pressure estimation. IEEE Trans. Biomed. Circuits Syst. 2020, 14, 1287–1298. [Google Scholar] [CrossRef] [PubMed]
- Semiconductor, N. nRF52840 Product Specification v1. 0. nRF52840 Datasheet. Available online: https://infocenter.nordicsemi.com/pdf/nRF52840_PS_v1.0.pdf (accessed on 1 July 2021).
- Parsons, D. Java Web Servers and the HttpClient; Springer: Berlin, Germany, 2020; pp. 565–585. [Google Scholar]
- Jose, B.; Abraham, S. Performance analysis of NoSQL and relational databases with MongoDB and MySQL. Mater. Today Proc. 2020, 24, 2036–2043. [Google Scholar] [CrossRef]
- Patil, M.M.; Hanni, A.; Tejeshwar, C.H. A qualitative analysis of the performance of MongoDB vs MySQL database based on insertion and retriewal operations using a web/android application to explore load balancing—Sharding in MongoDB and its advantages. In Proceedings of the 2017 International Conference on I-SMAC (IoT in Social, Mobile, Analytics and Cloud), Palladam, India, 10–11 February 2017; pp. 325–330. [Google Scholar]
- Abdelrahman, M.M.; Zhan, S.; Chong, A. A three-tier architecture visual-programming platform for building lifecycle data management. SimAUD 2020. [Google Scholar] [CrossRef]
- Permpool, T.; Nalintippayawong, S.; Atchariyachanvanich, K. Interactive SQL learning tool with automated grading using MySQL sandbox. In Proceedings of the 2019 IEEE 6th International Conference on Industrial Engineering and Applications (ICIEA), Tokyo, Japan, 26–29 April 2019; pp. 928–932. [Google Scholar]
- Ashley, D. Foundation Dynamic Web Pages with Python; Apress: Berkeley, CA, USA, 2020; pp. 29–69. [Google Scholar]
- Li, D.; Mei, H.; Shen, Y.; Su, S.; Zhang, W.; Wang, J.; Zu, M.; Chen, W. ECharts: A declarative framework for rapid construction of web-based visualization. Vis. Inform. 2018, 2, 136–146. [Google Scholar] [CrossRef]
- Pinto, S.; Hoffmann, G.; Ammon, C.; Amon, T. Critical THI thresholds based on the physiological parameters of lactating dairy cows. J. Therm. Biol. 2020, 88, 102523. [Google Scholar] [CrossRef] [PubMed]
Publisher’s Note: MDPI stays neutral with regard to jurisdictional claims in published maps and institutional affiliations. |
© 2021 by the authors. Licensee MDPI, Basel, Switzerland. This article is an open access article distributed under the terms and conditions of the Creative Commons Attribution (CC BY) license (https://creativecommons.org/licenses/by/4.0/).