
UGRansome1819: A Novel Dataset for Anomaly Detection and Zero-Day Threats


Abstract
:1. Introduction
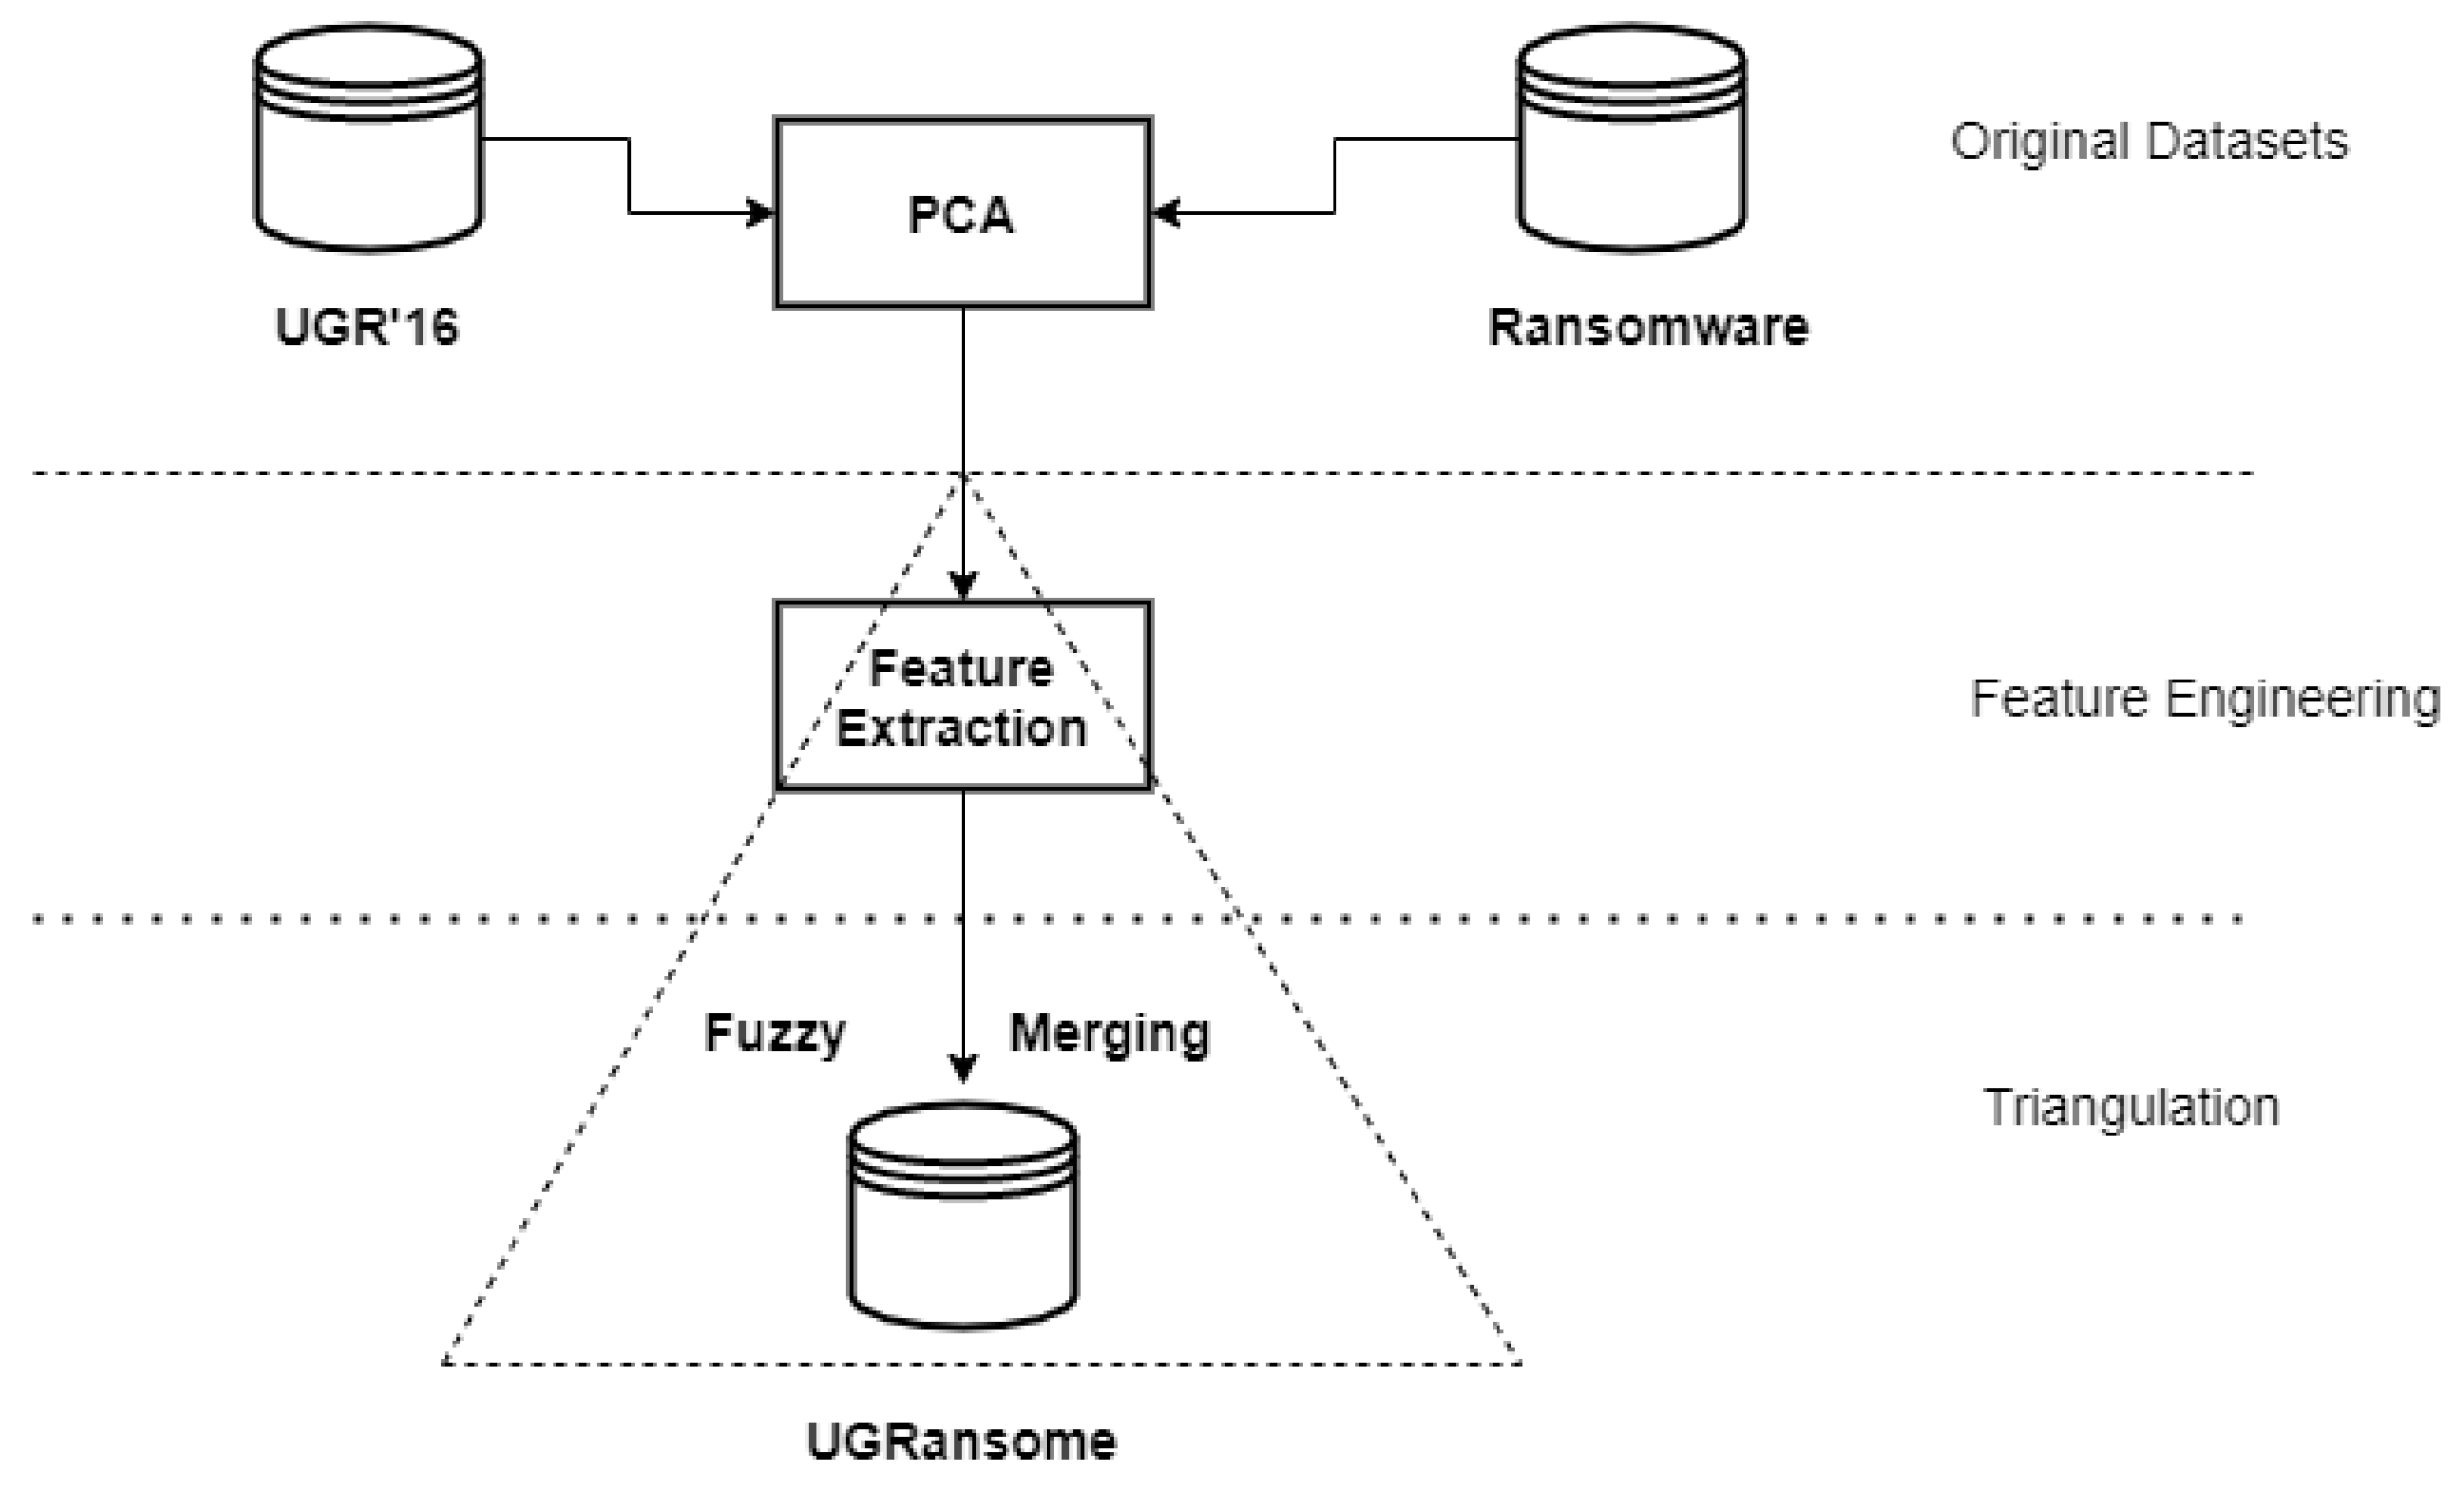
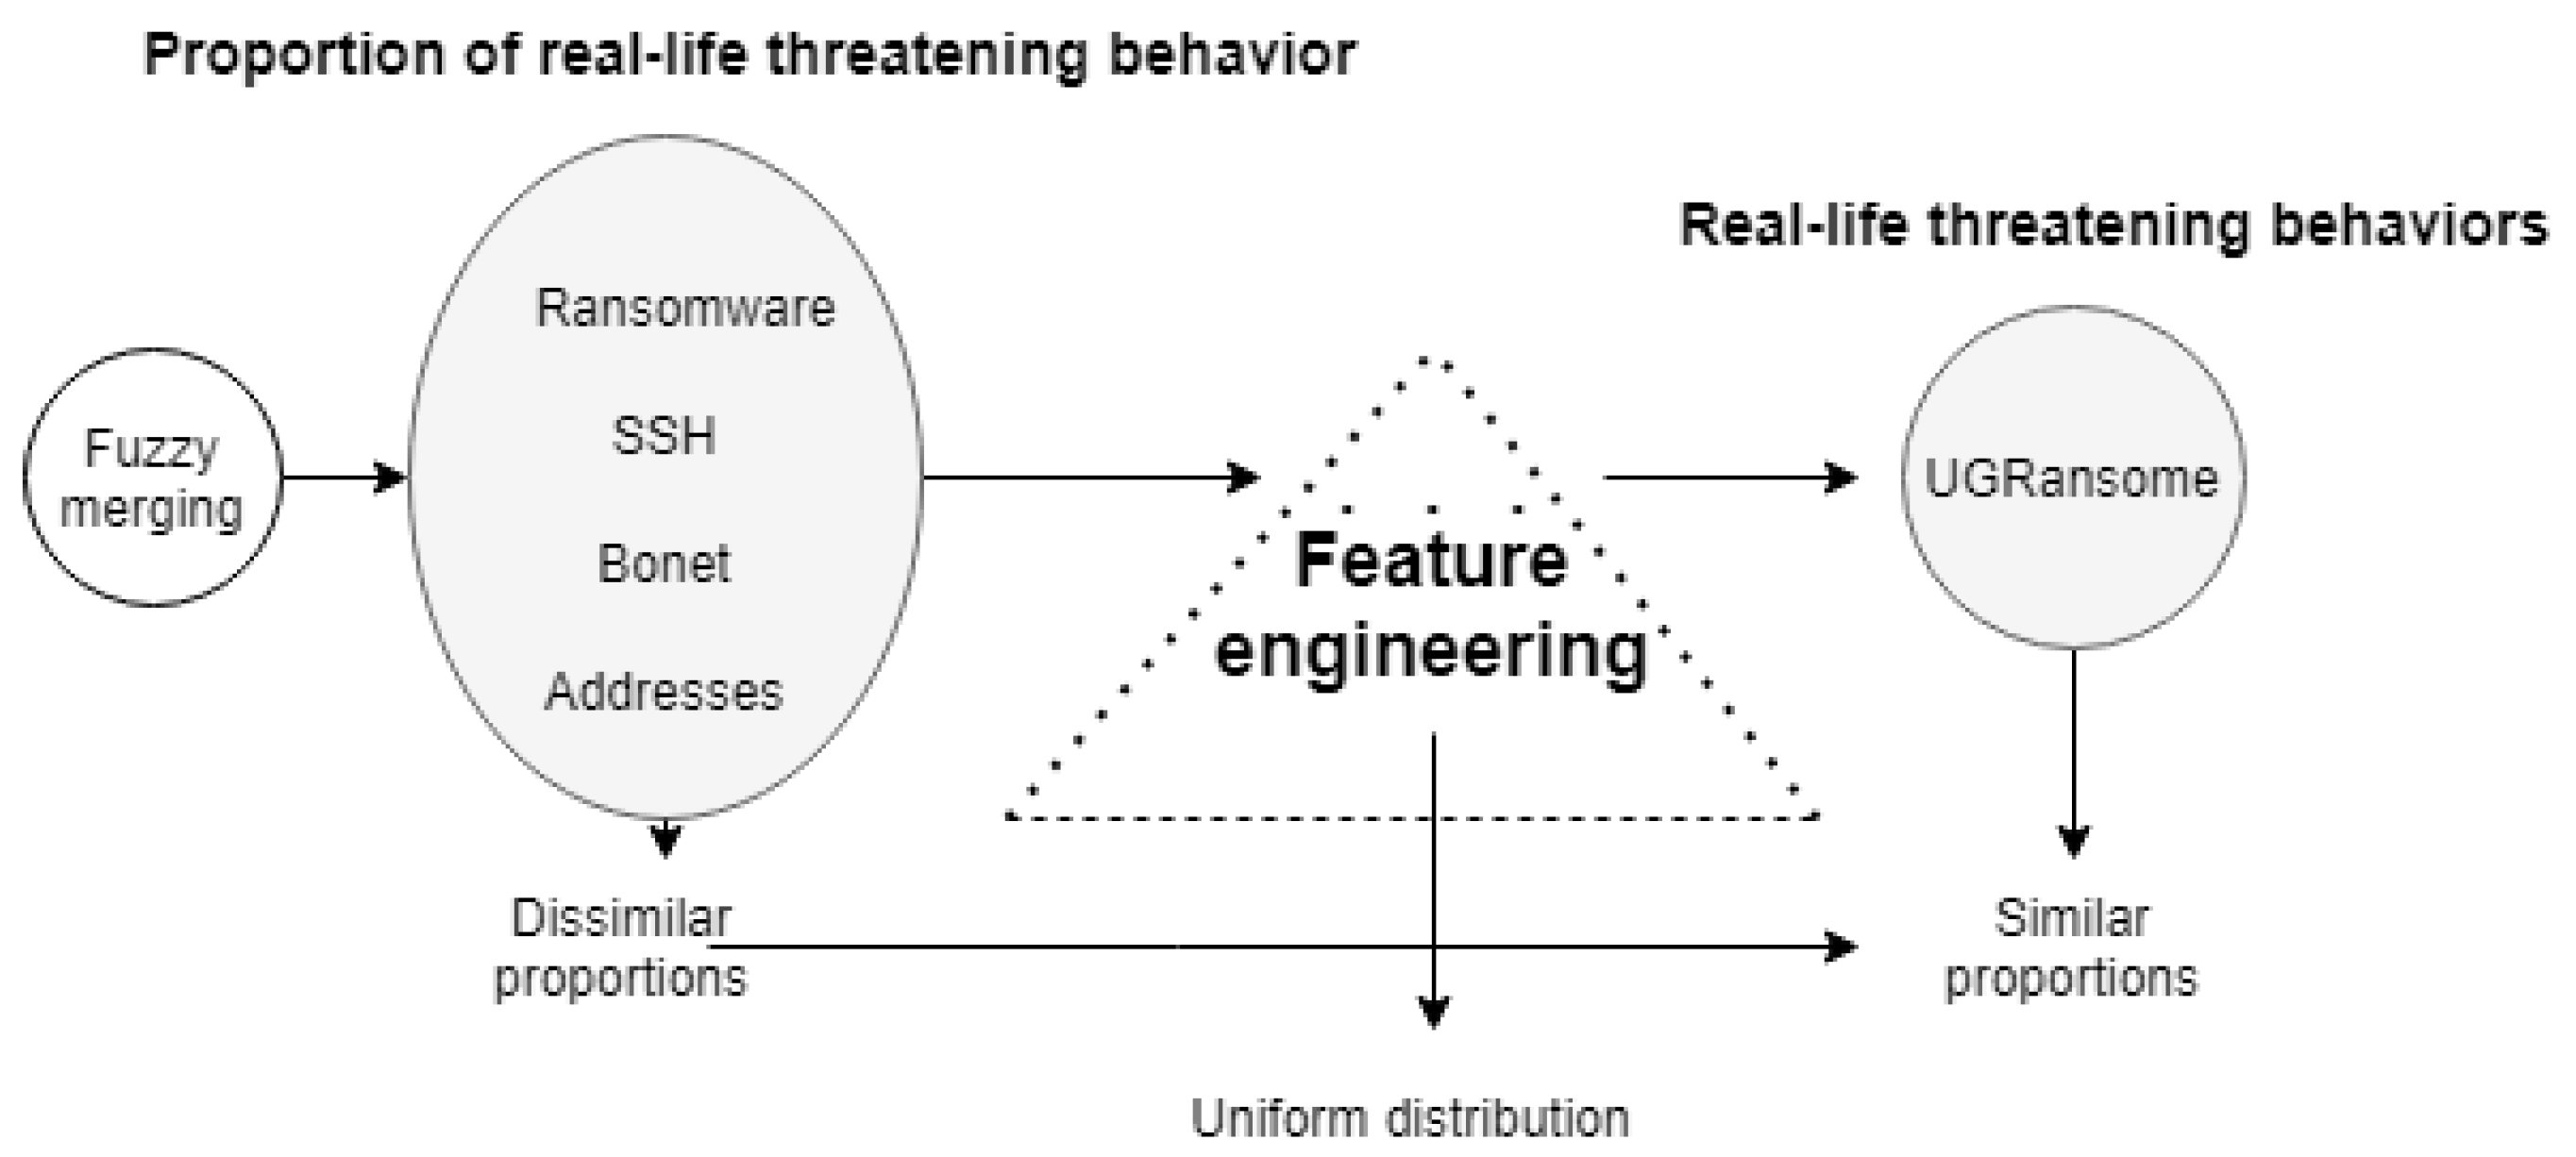
- A new dataset production methodology using fuzzy merging.
- The proposition and introduction of a new dataset that contains modern network flow (netflow) and zero-day attacks.
2. Related Works
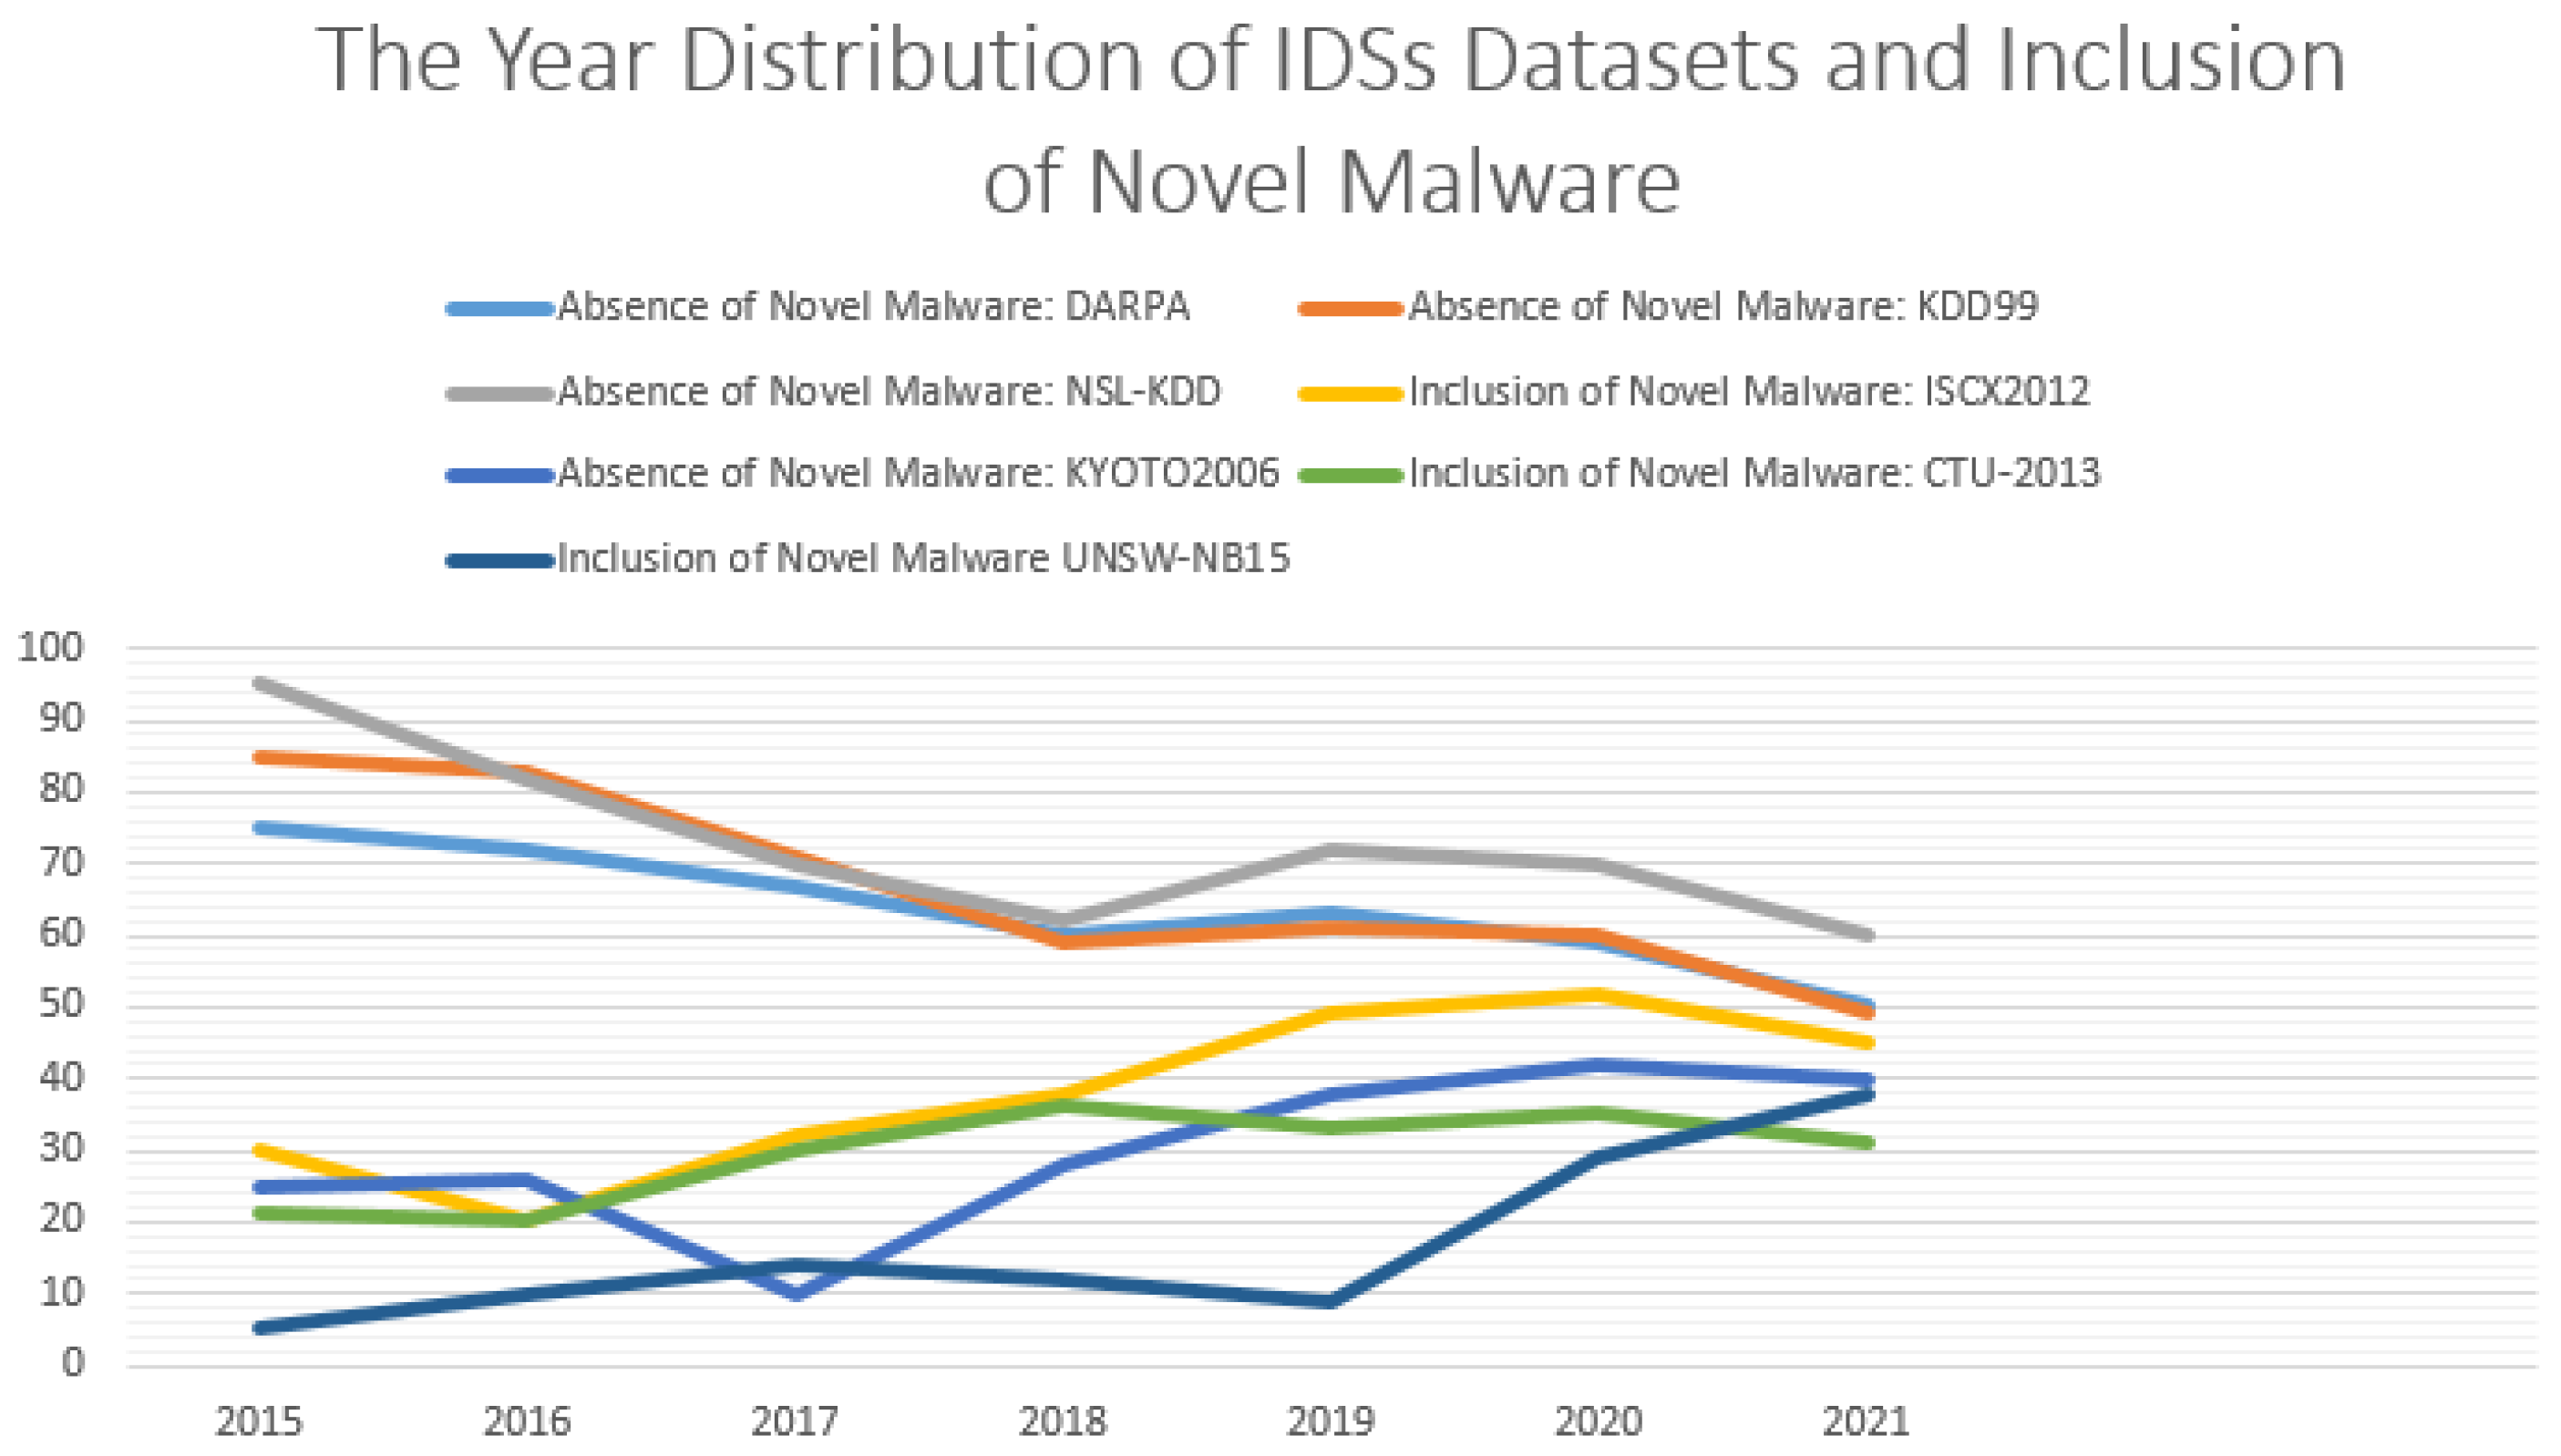
- The Defense Advanced Research Projects Agency (DARPA) dataset. This dataset is compressed into binary and is four GB in size and includes synthetic netflow having approximately 7 M of connection features—where 2 M represents the testing corpus [10]. The DARPA 1999 incorporates tcpdump netflow files extracted from a synthetic network system. One outside the network and the other inside. Additional host-based features have been retrieved from four victimized network systems that include various network threats between Internet Protocols (IPs) [10]. This dataset is outdated because it was created in 1998.
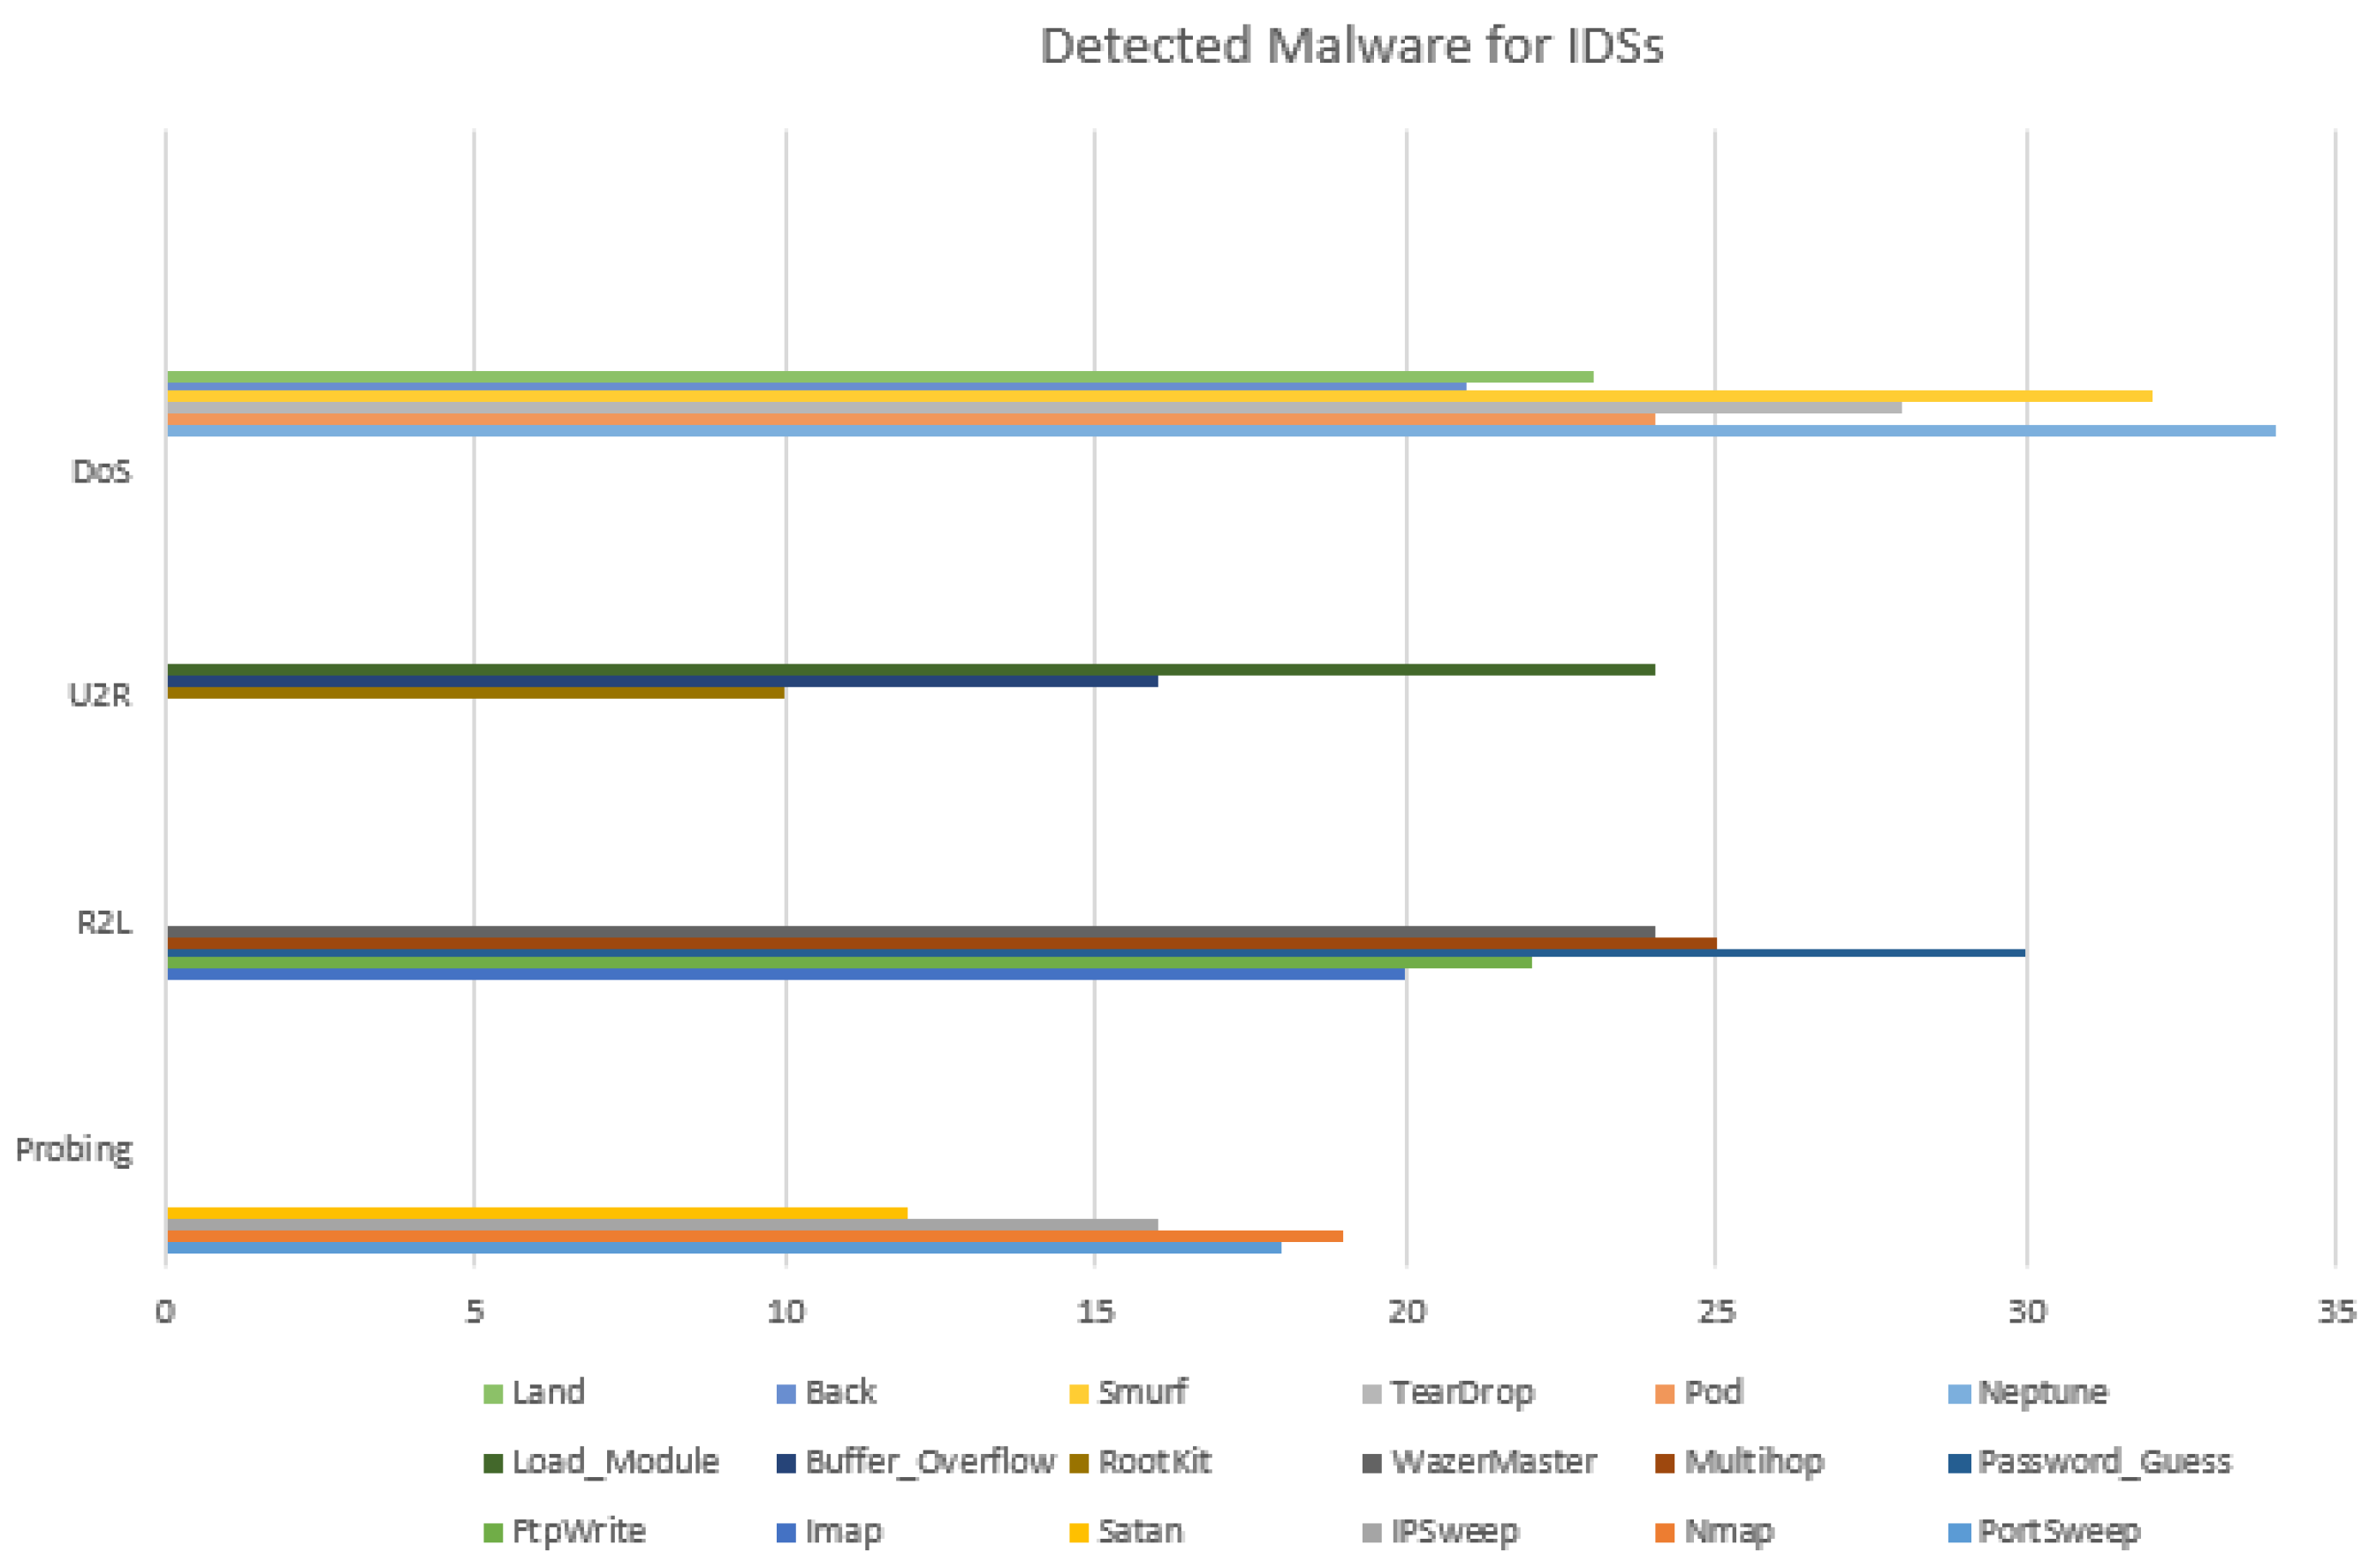
- The KDD99 dataset. It has been derived from the DARPA98 dataset and it is made of 49 M of single connection features with 41 attributes [10,11]. These features are labelled as normal network threats or not. Mohd et al. [12] stated that they have been classified into User to Root (U2R), Denial of Service (DoS), Probing, and Remote to Local (R2L). Similarly, the testing corpus also includes 14 attacks and features that have been stratified into (i) network traffic and basic connection of Transmission Control Protocols (TCPs) [12]. (ii) Content of features collected from the payload information and (iii) number of logins that failed. This dataset is also outdated because it was fabricated in 1999 by the DARPA.
2.1. Requirements to Evaluate IDS Datasets
- The year of creation. This requirement represents the date or year in which malware, as well as netflow, were collected. It is more relevant than the year of publication since netflow and novel intrusions appear daily. The UGRansome dataset is created in 2021.
- Availability. With this requirement, one can determine if datasets are publicly available to enable a third party to utilise and assess them. The UGRansome is available on ResearchGate.
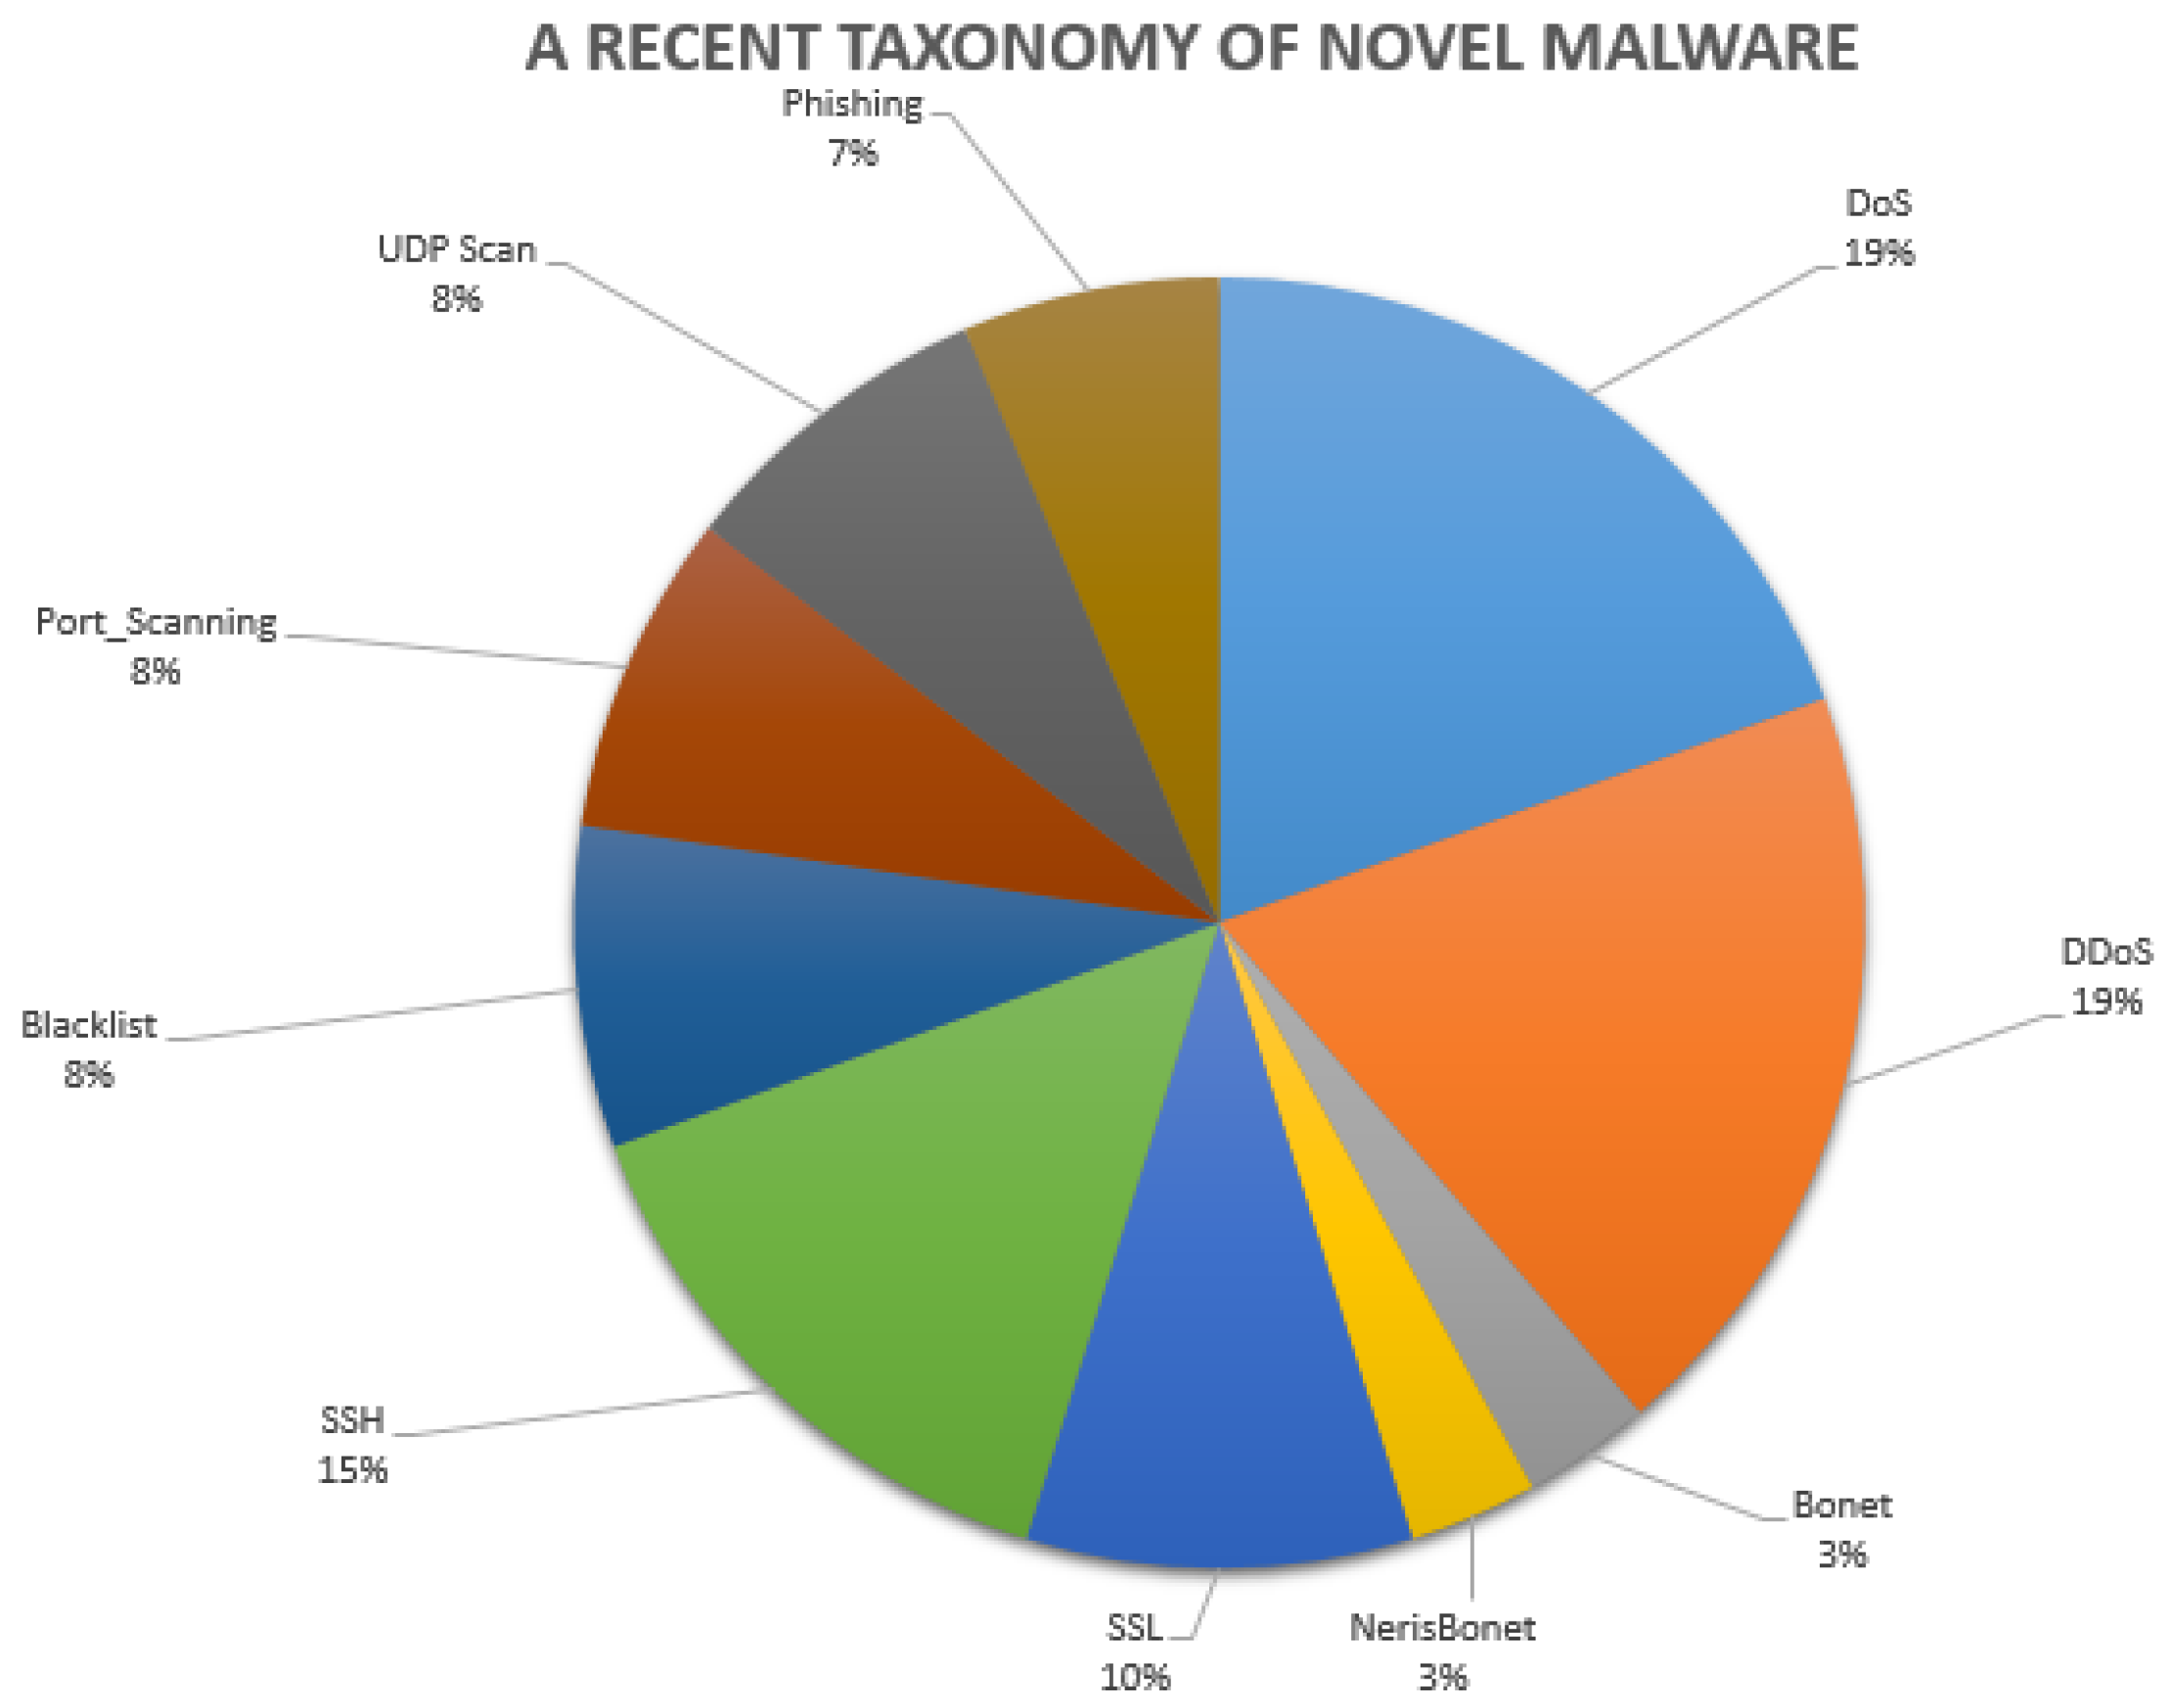
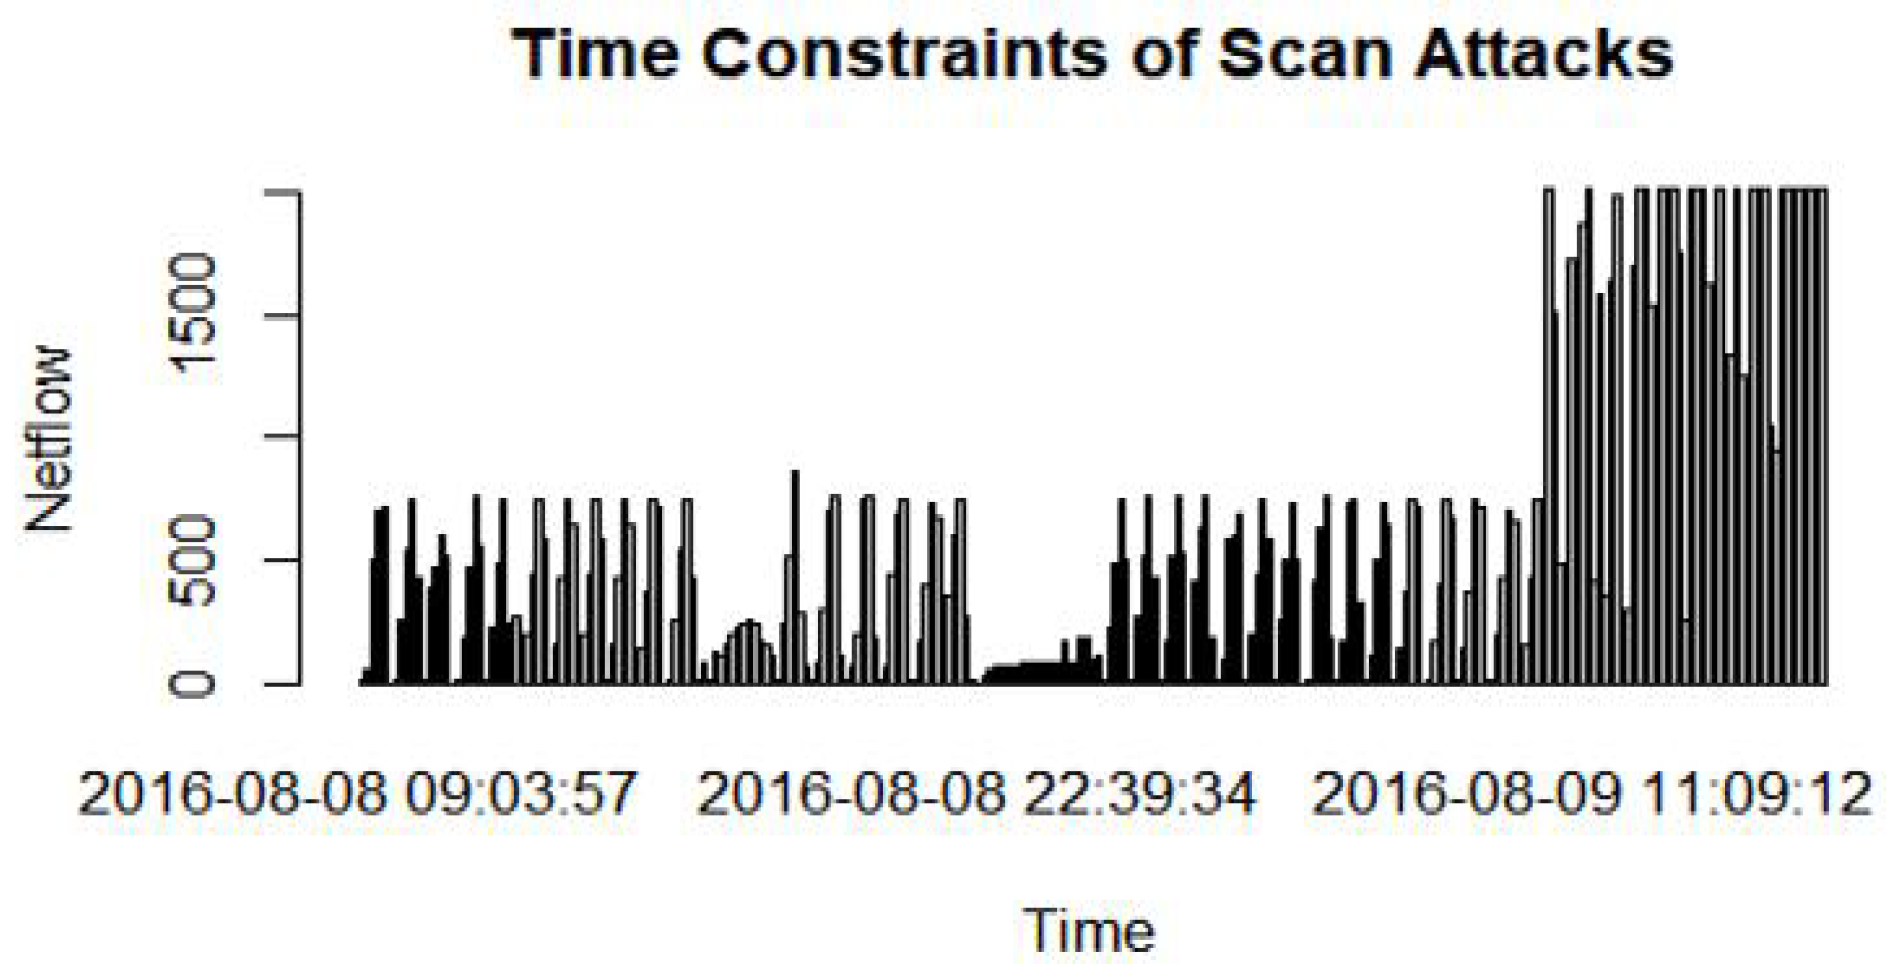
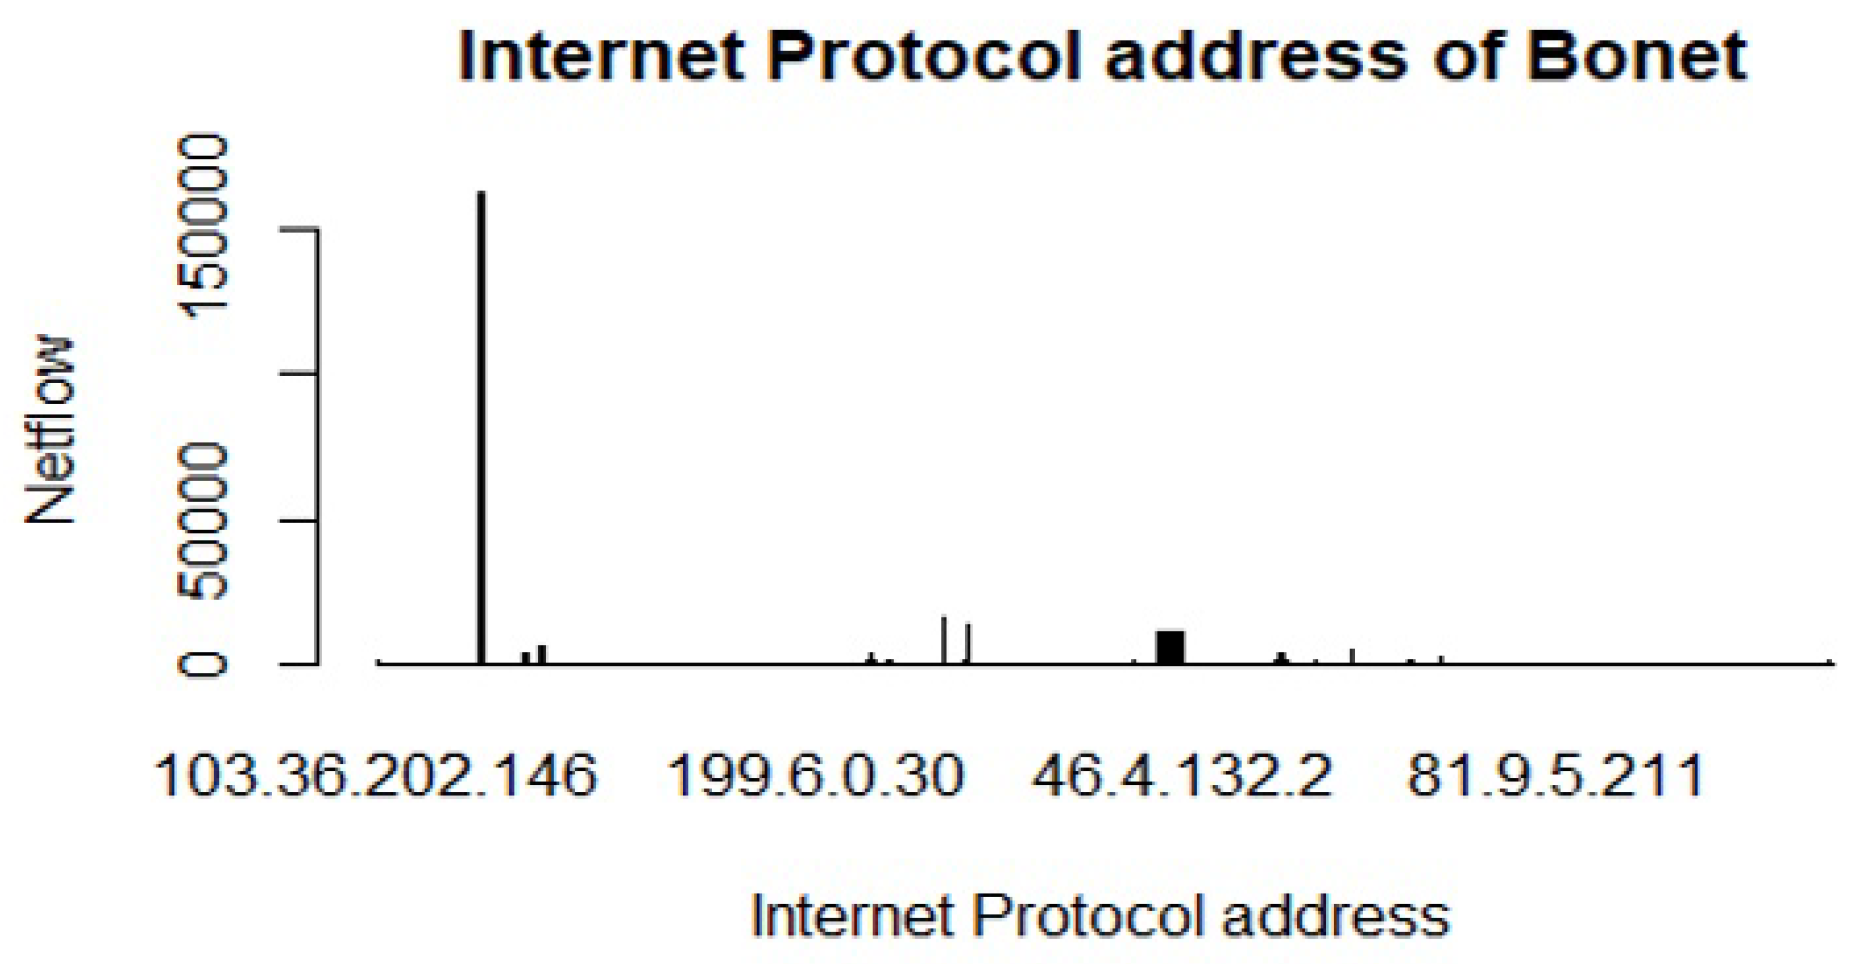
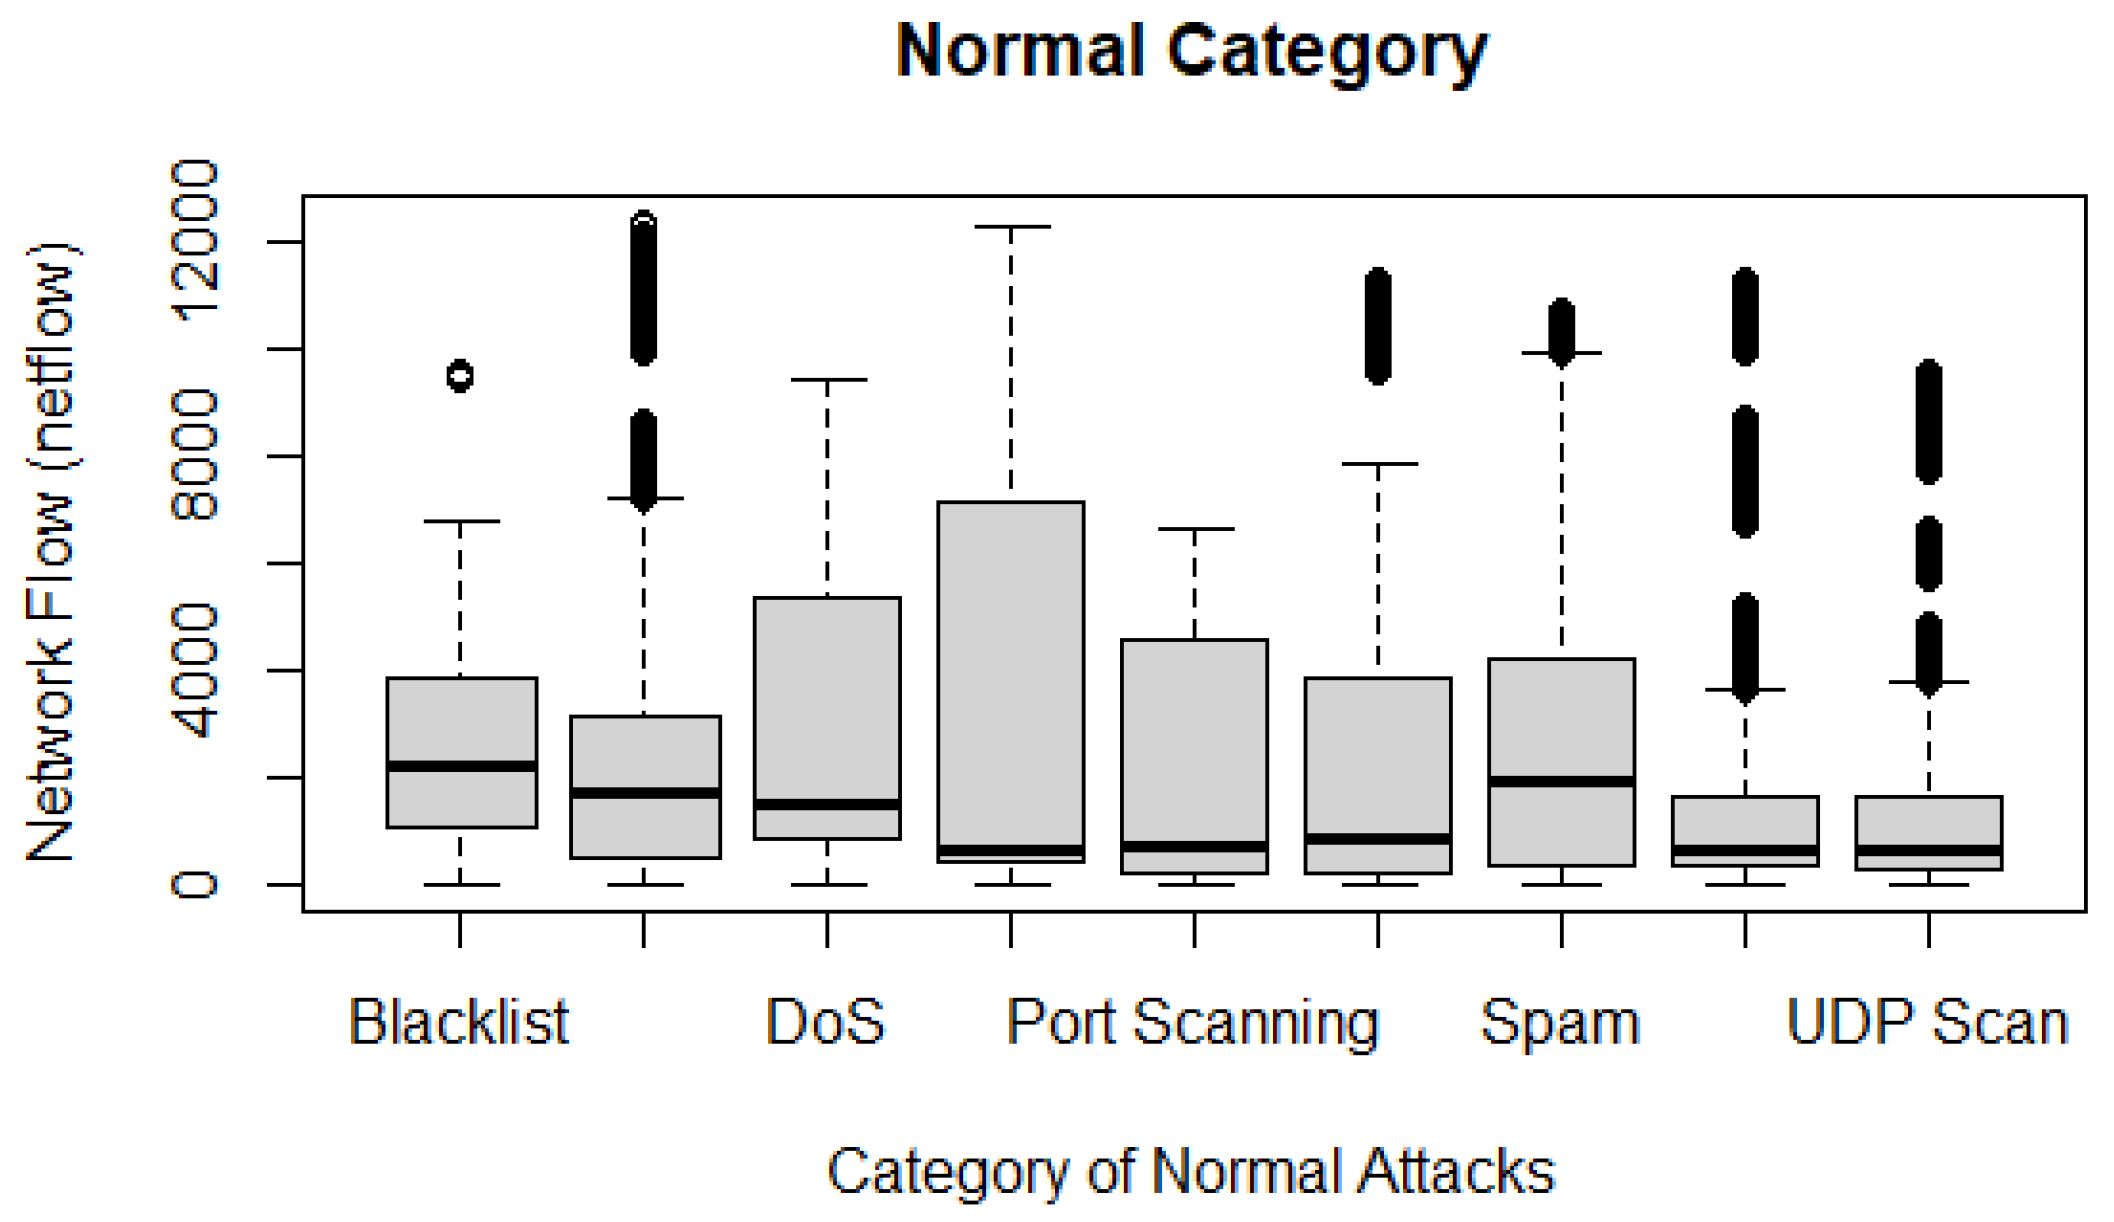
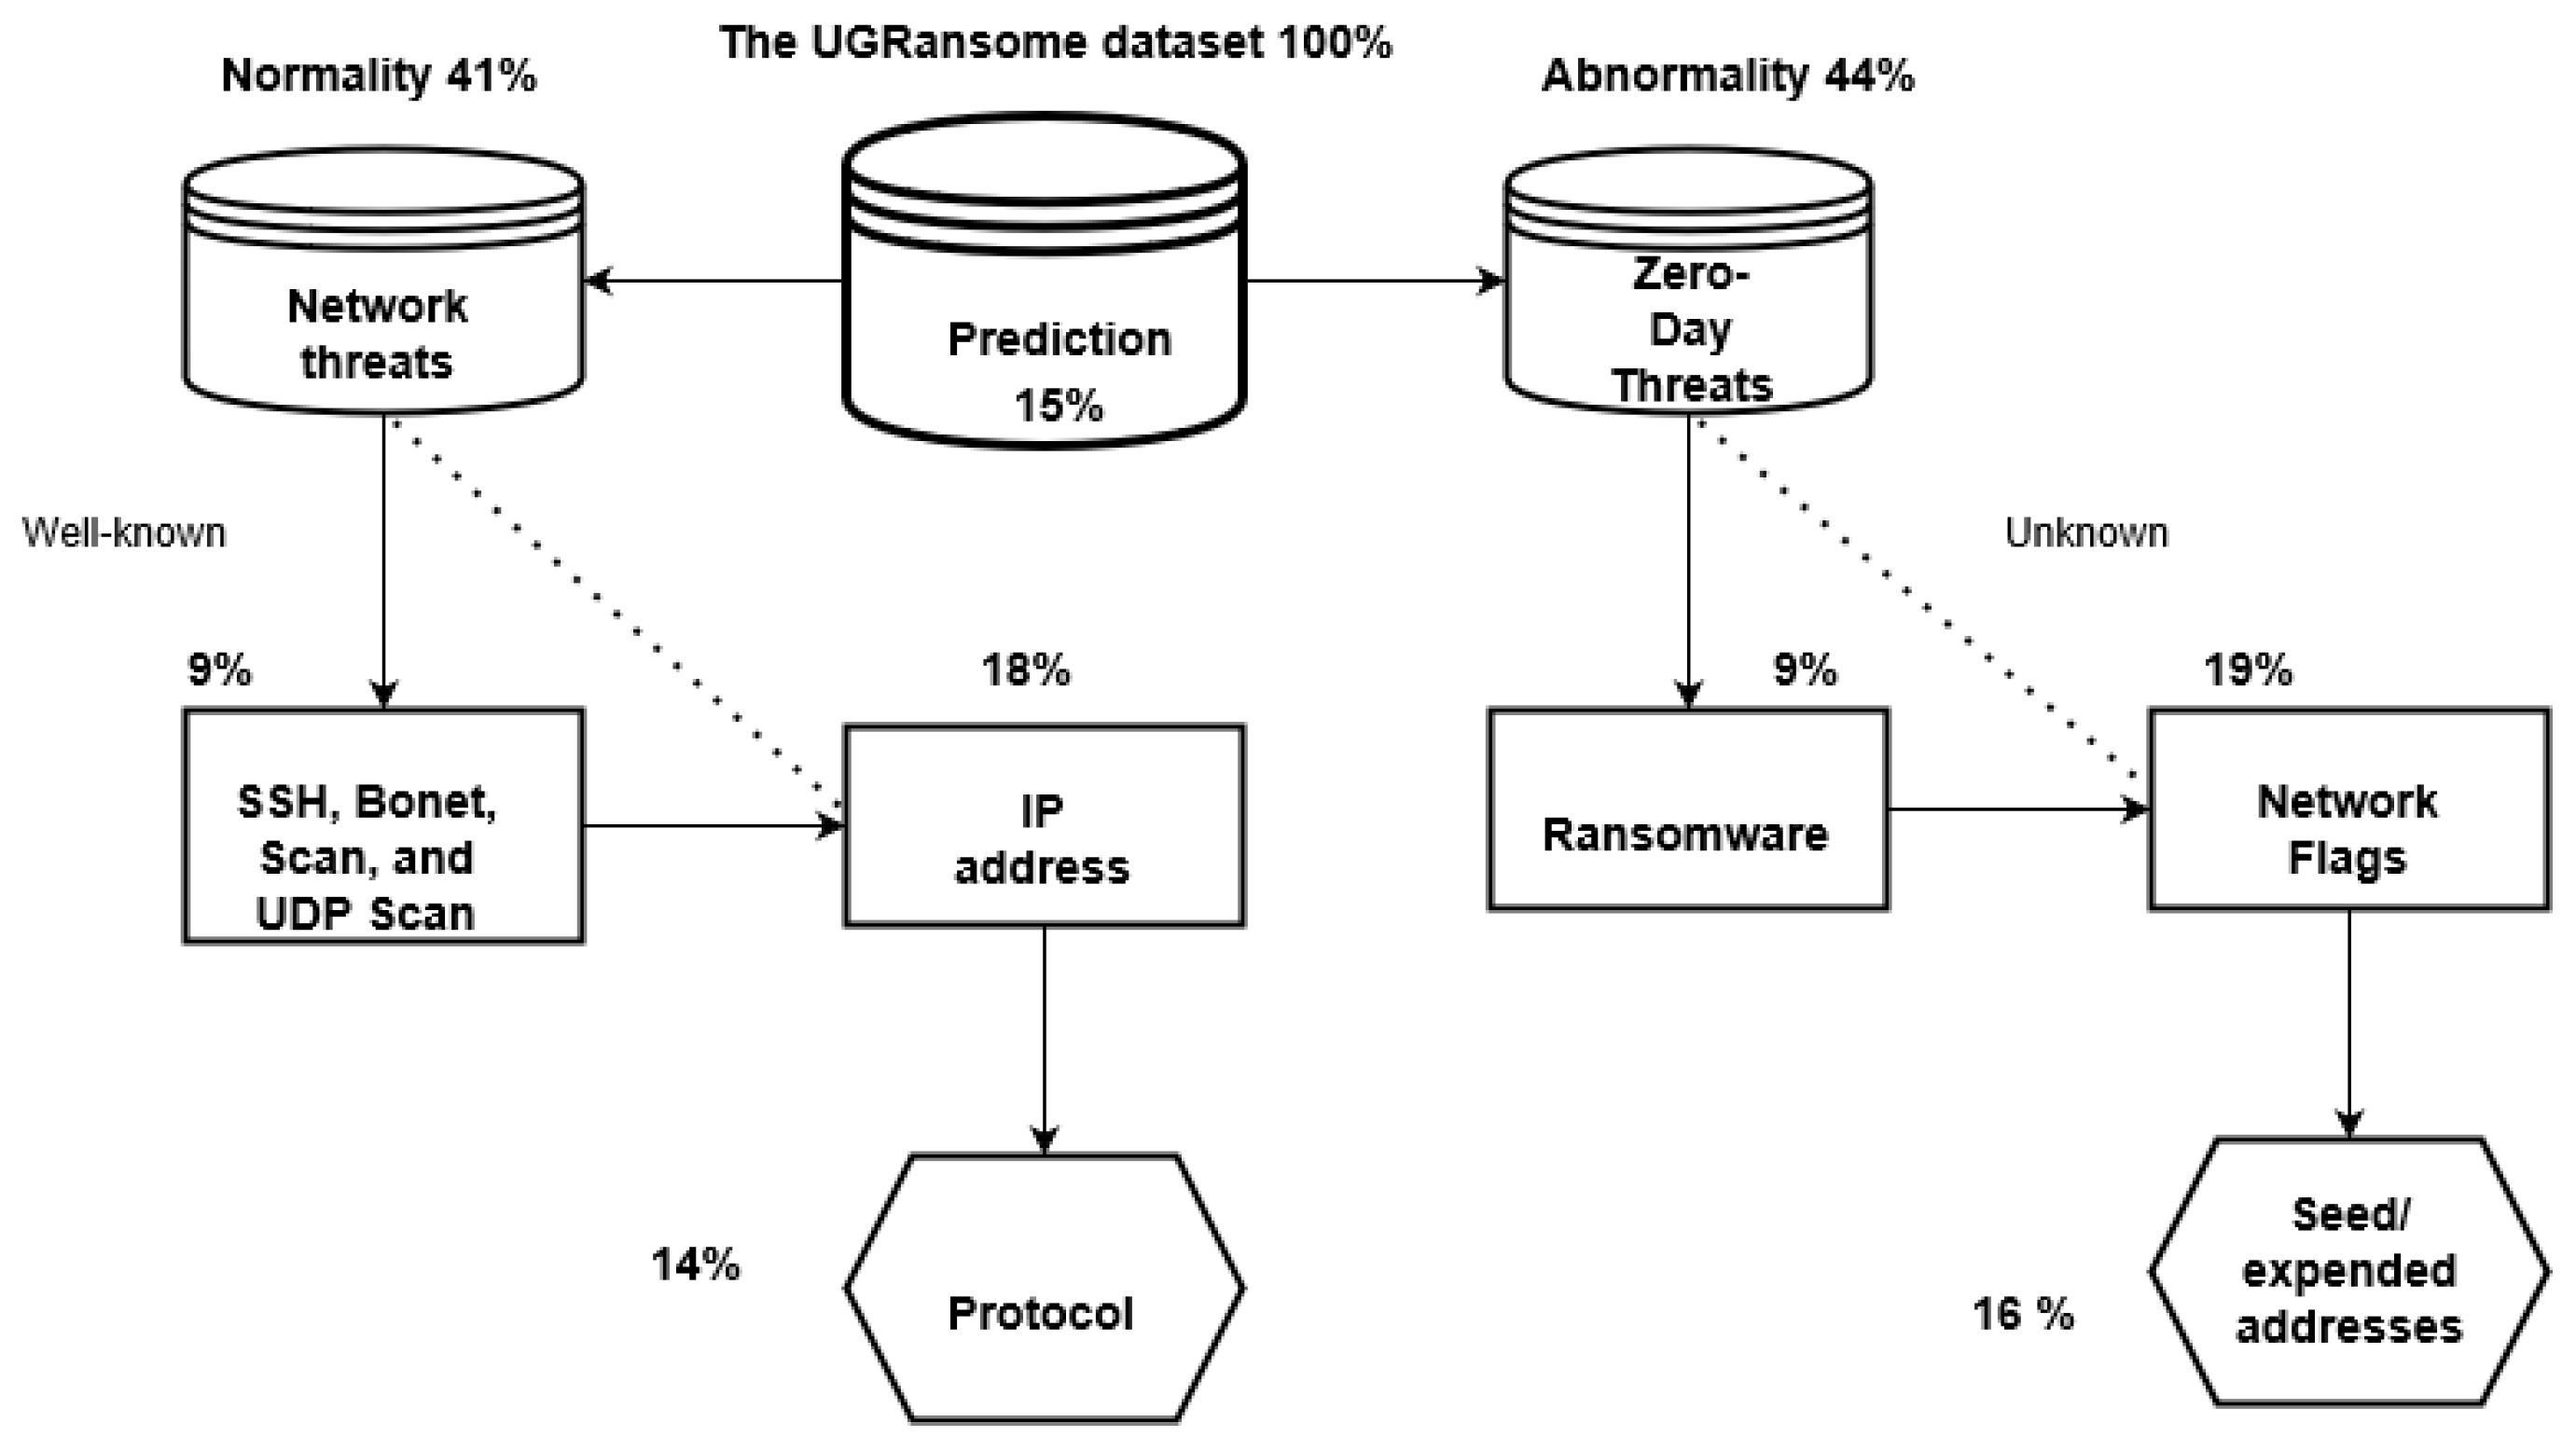
- Normal behaviour. This requirement determines if the dataset is made of abnormal and/or normal behaviours. The UGRansome includes normal and anomalous behaviours because it has been built for anomaly detection. If UGRansome does not include instances of normal behaviours, this will represent a severe methodological bias because any dataset intended to support research on anomaly detection must also include instances of normal behaviours. The category of normal behaviour is made of various well-known threats such as SSH, Port Scanning, Bonet, DoS, UDP Scan, and NerisBonet. The authors refer to “well-known” threats as to normal behaviour because these types of network attacks are known by the network administrator and they can also be detected in the current intrusion detection landscape [23,24,25]. The dataset does not incorporate instances of non-threatening behaviour.
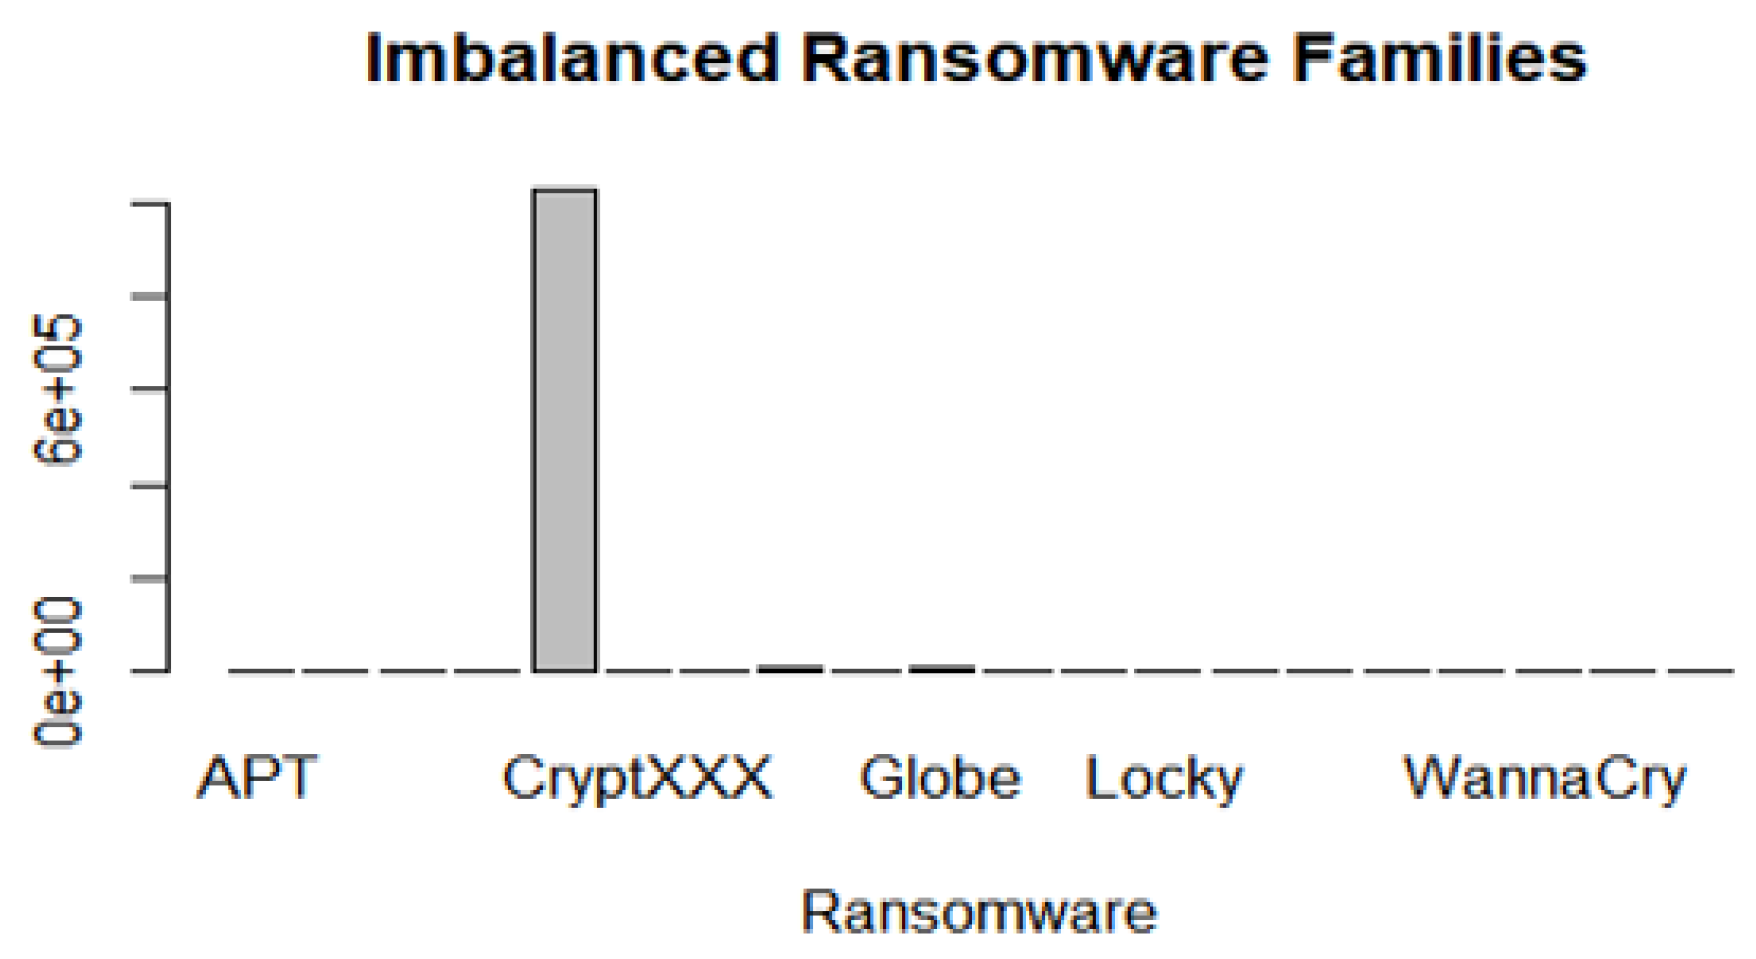
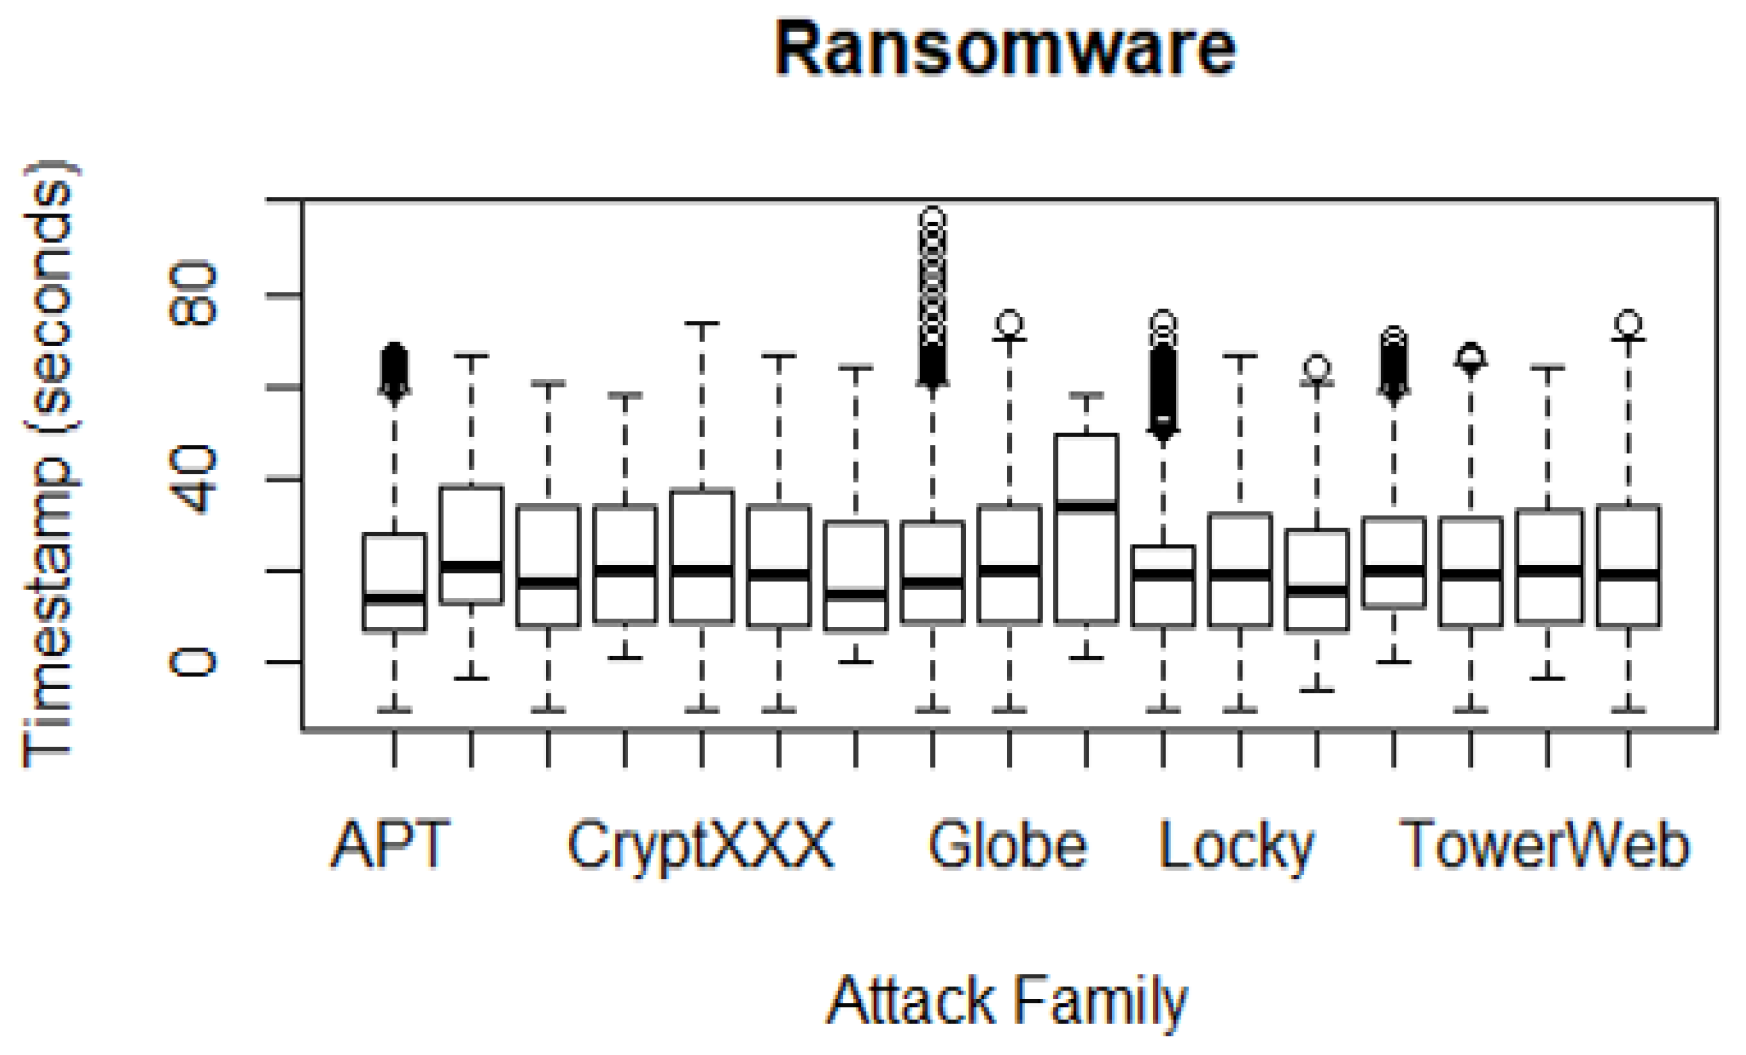
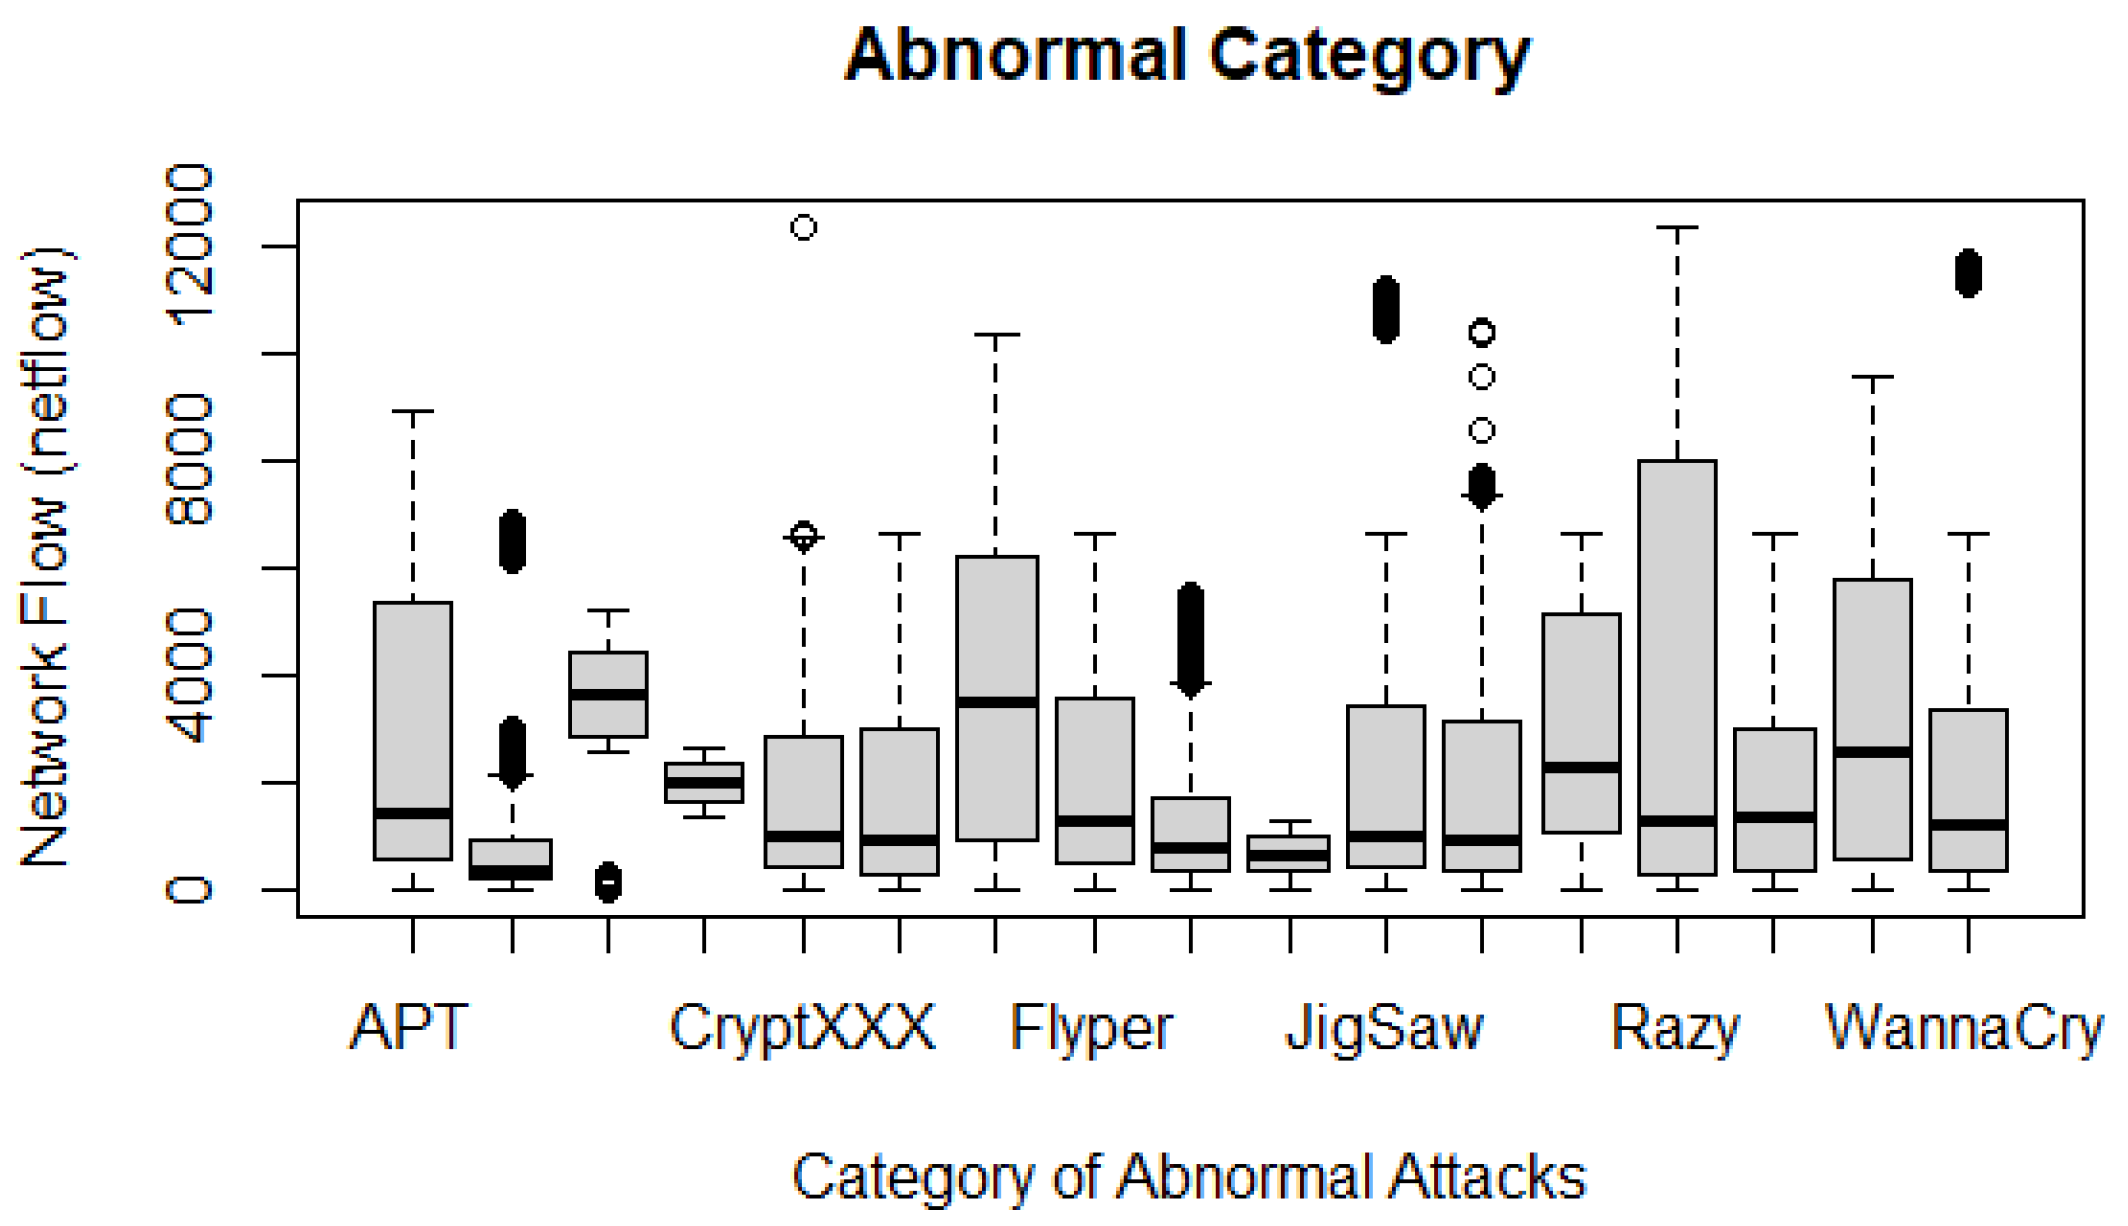
- Abnormal behaviour. The requirement specifies the inclusion of abnormality within the dataset. The UGRansome incorporates abnormal netflow patterns. The category of abnormal behaviour includes zero-day threats such as JigSaw, APT, EDA2, Flyper, TowerWeb, NoobCrypt, DMALockerv3, and Globe. The authors refer to “unknown” threats as to abnormal behaviour because these types of network attacks are by the network administrator and they cannot also be easily recognised in the current intrusion detection landscape [26].
- Features. This requirement is relevant to train or test the NIDS. The category consists of 91,360 patterns, whereas the abnormal stands at 56,598. The remaining category (59,576) represents the total of cyclostationary feature patterns in the UGRansome. These patterns are recorded in the normal and abnormal categories.
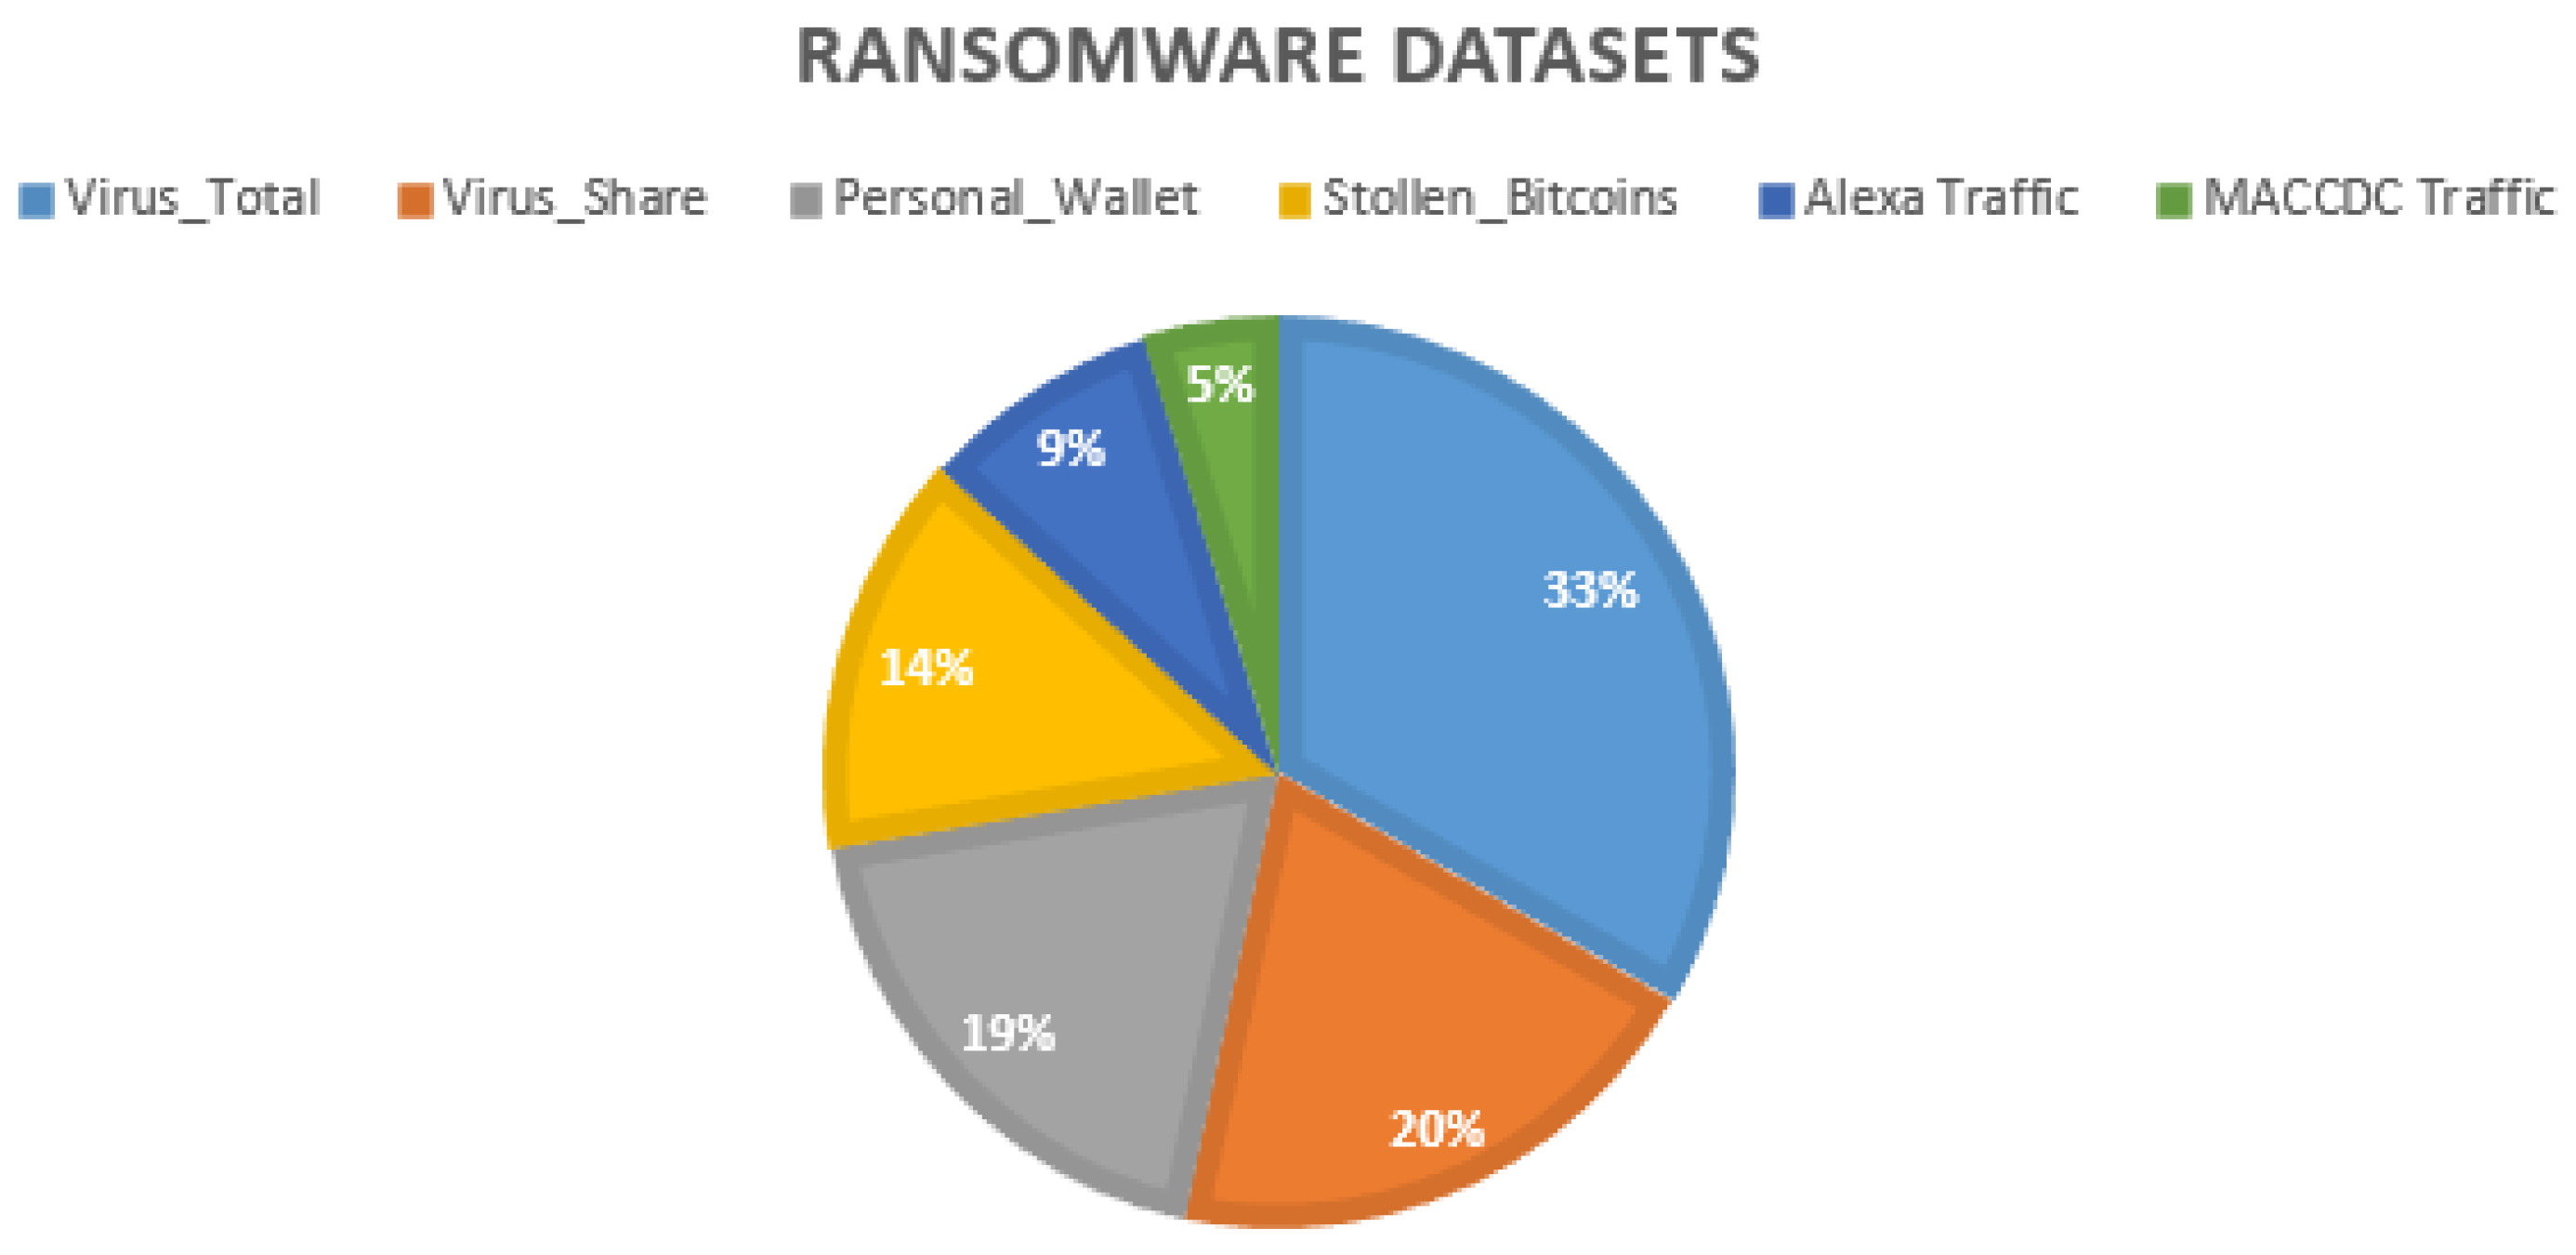
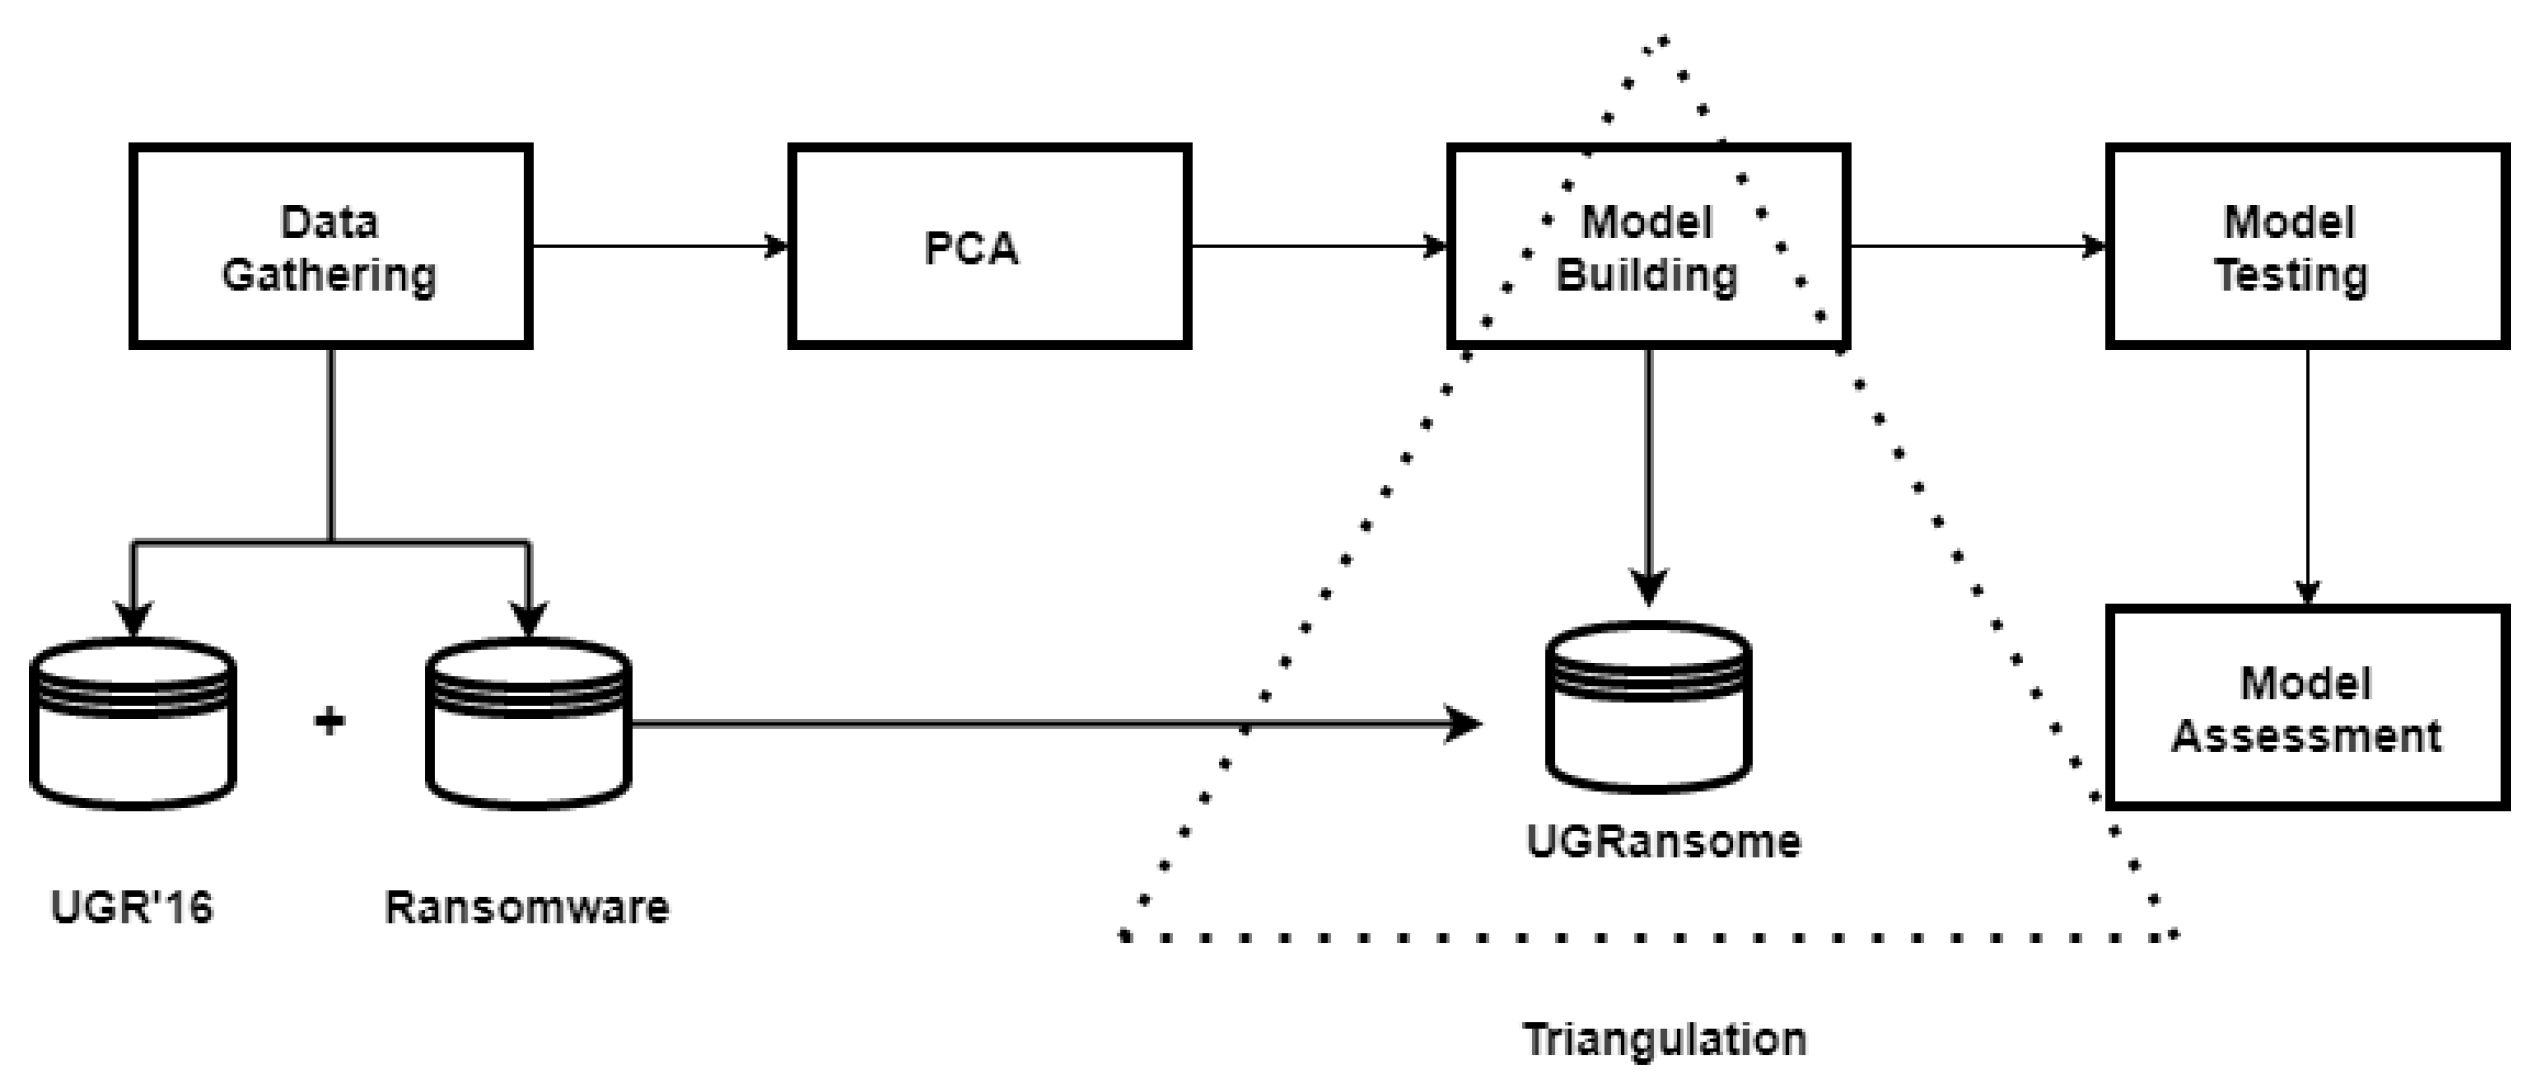
- Updated attack-flow. A NIDS dataset should at least incorporate real network features updated with a methodology such as Deep Packet Inspection (DPI) that focuses on network traffic management. Managed traffic of the DPI can be extracted and stored in a repository to build the IDS dataset that will include various anomalies detected by the DPI. The UGRansome incorporates real malware and netflow patterns extracted from publicly available datasets. The University of Granada 16 (UGR’16) dataset was used because it was designed in 2018 [27]. The ransomware dataset built in 2019 was also utilised to retrieve salient malware patterns [28].
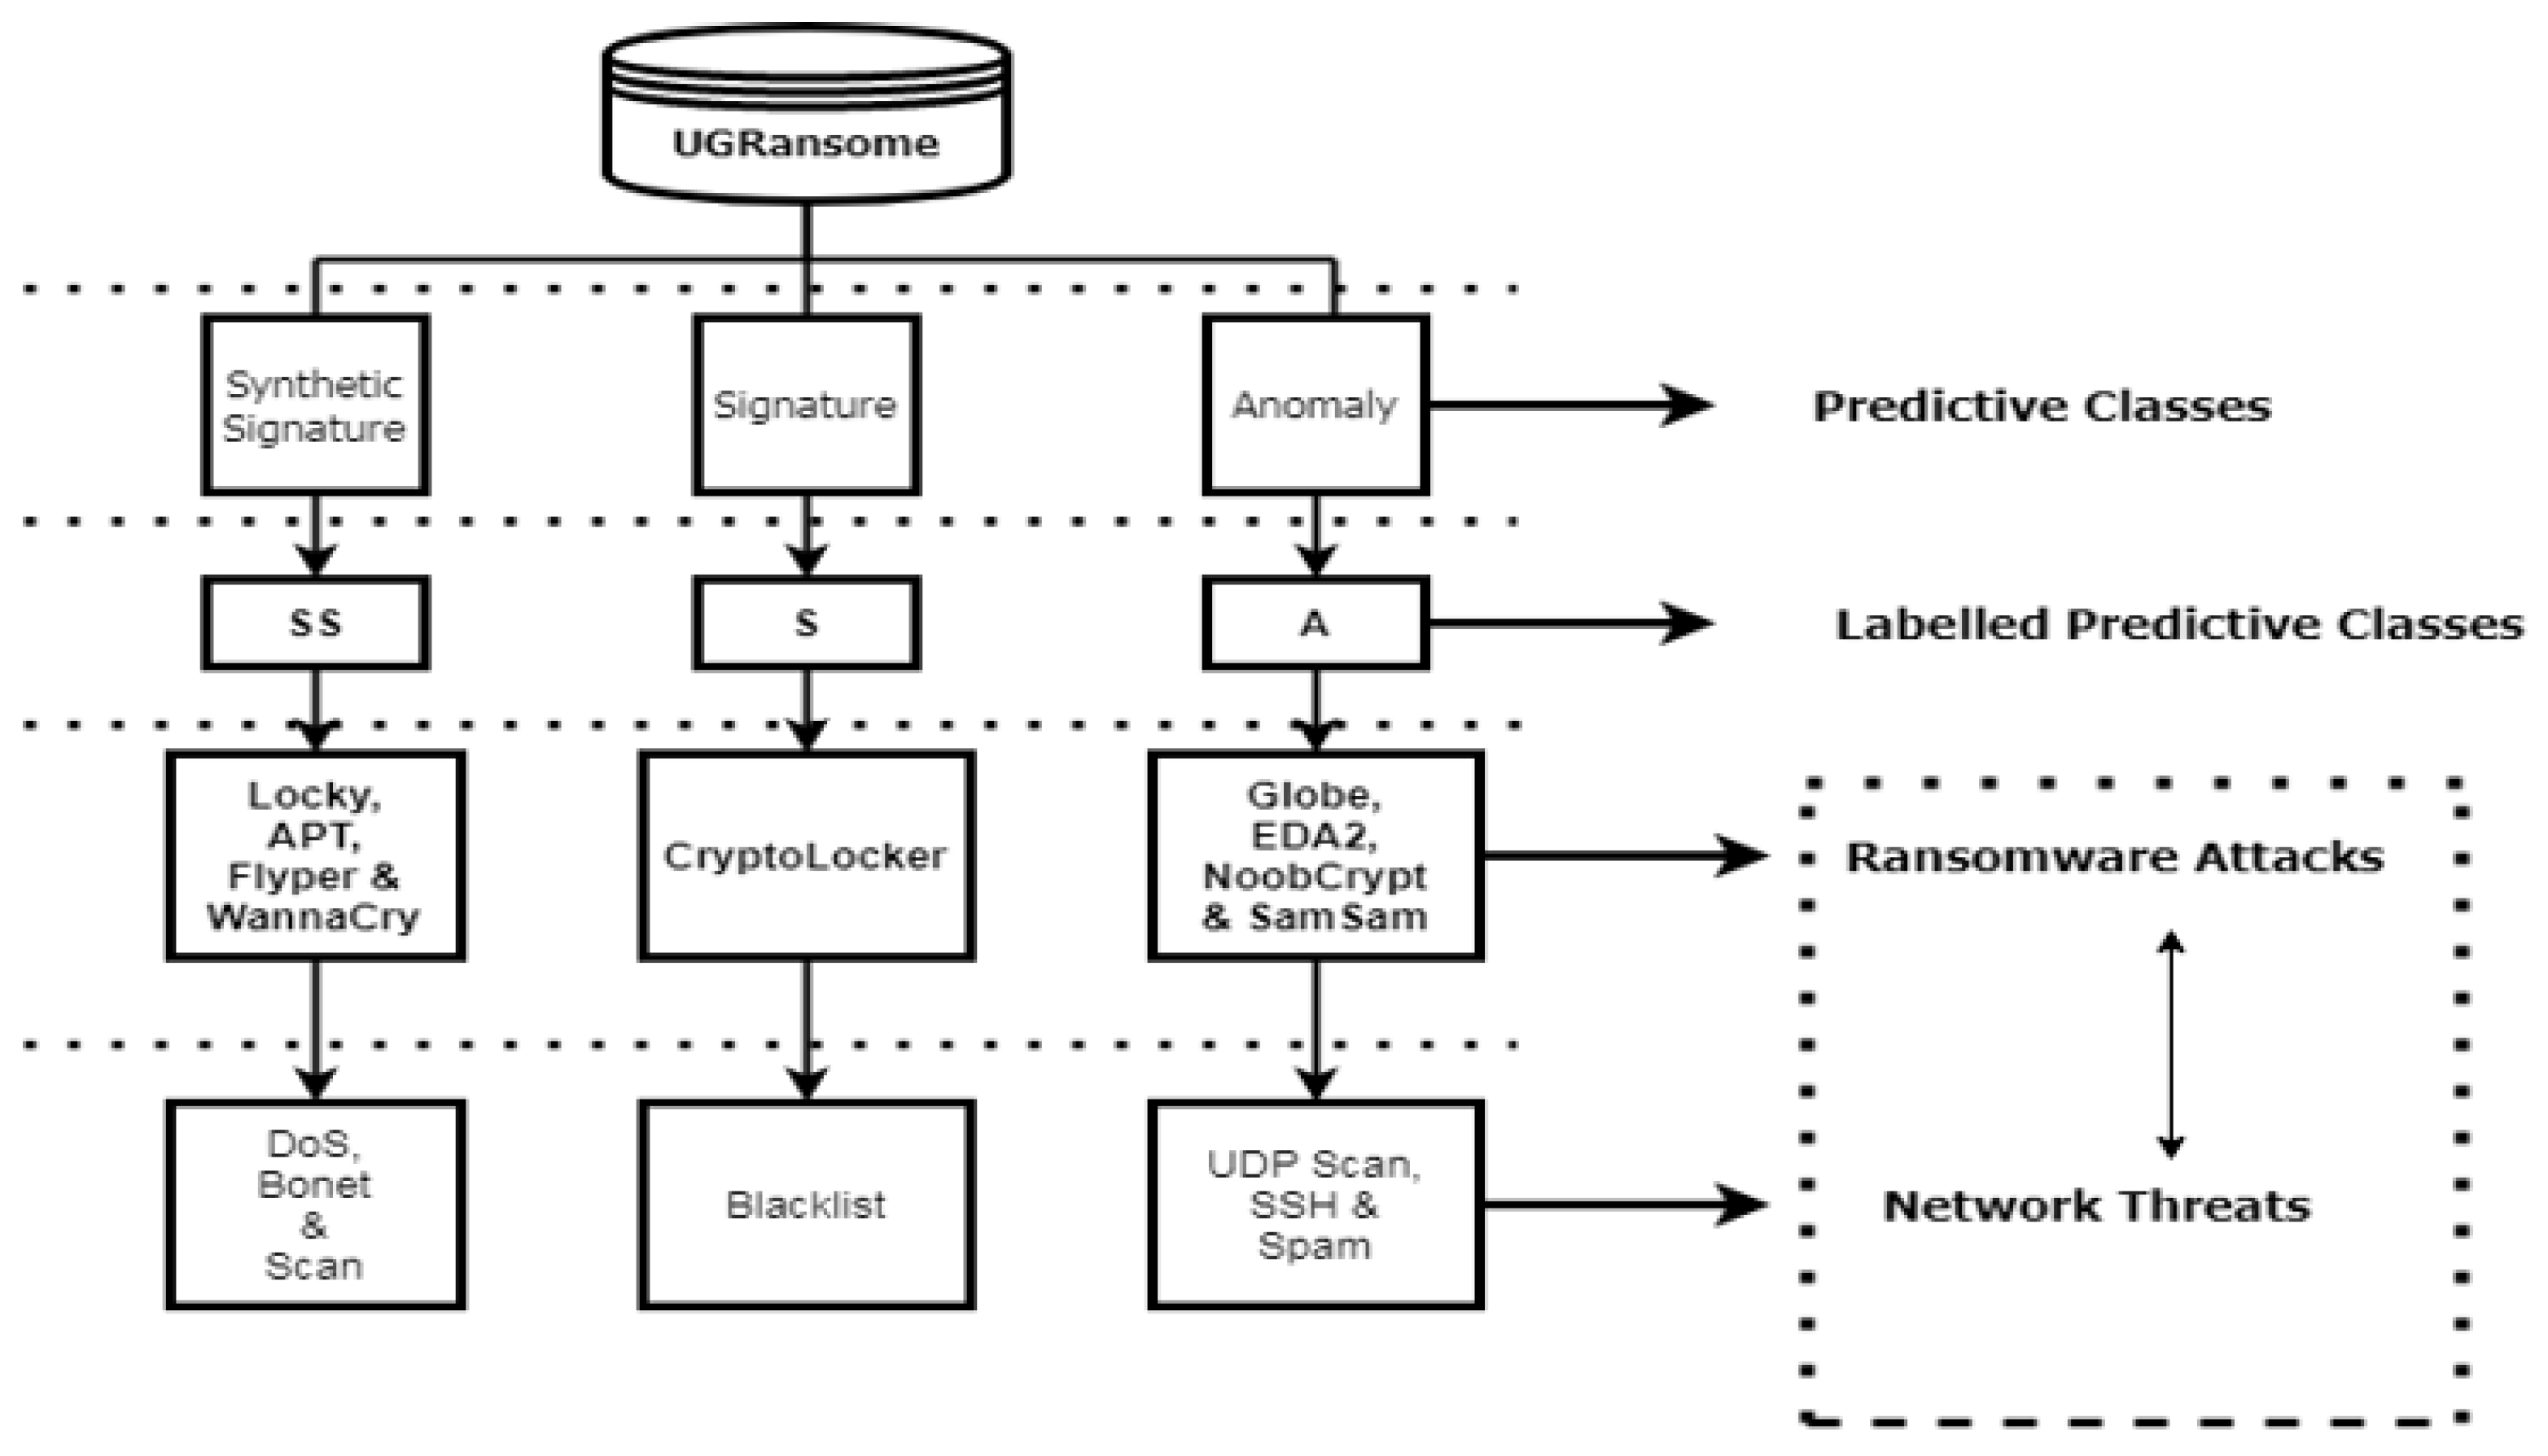
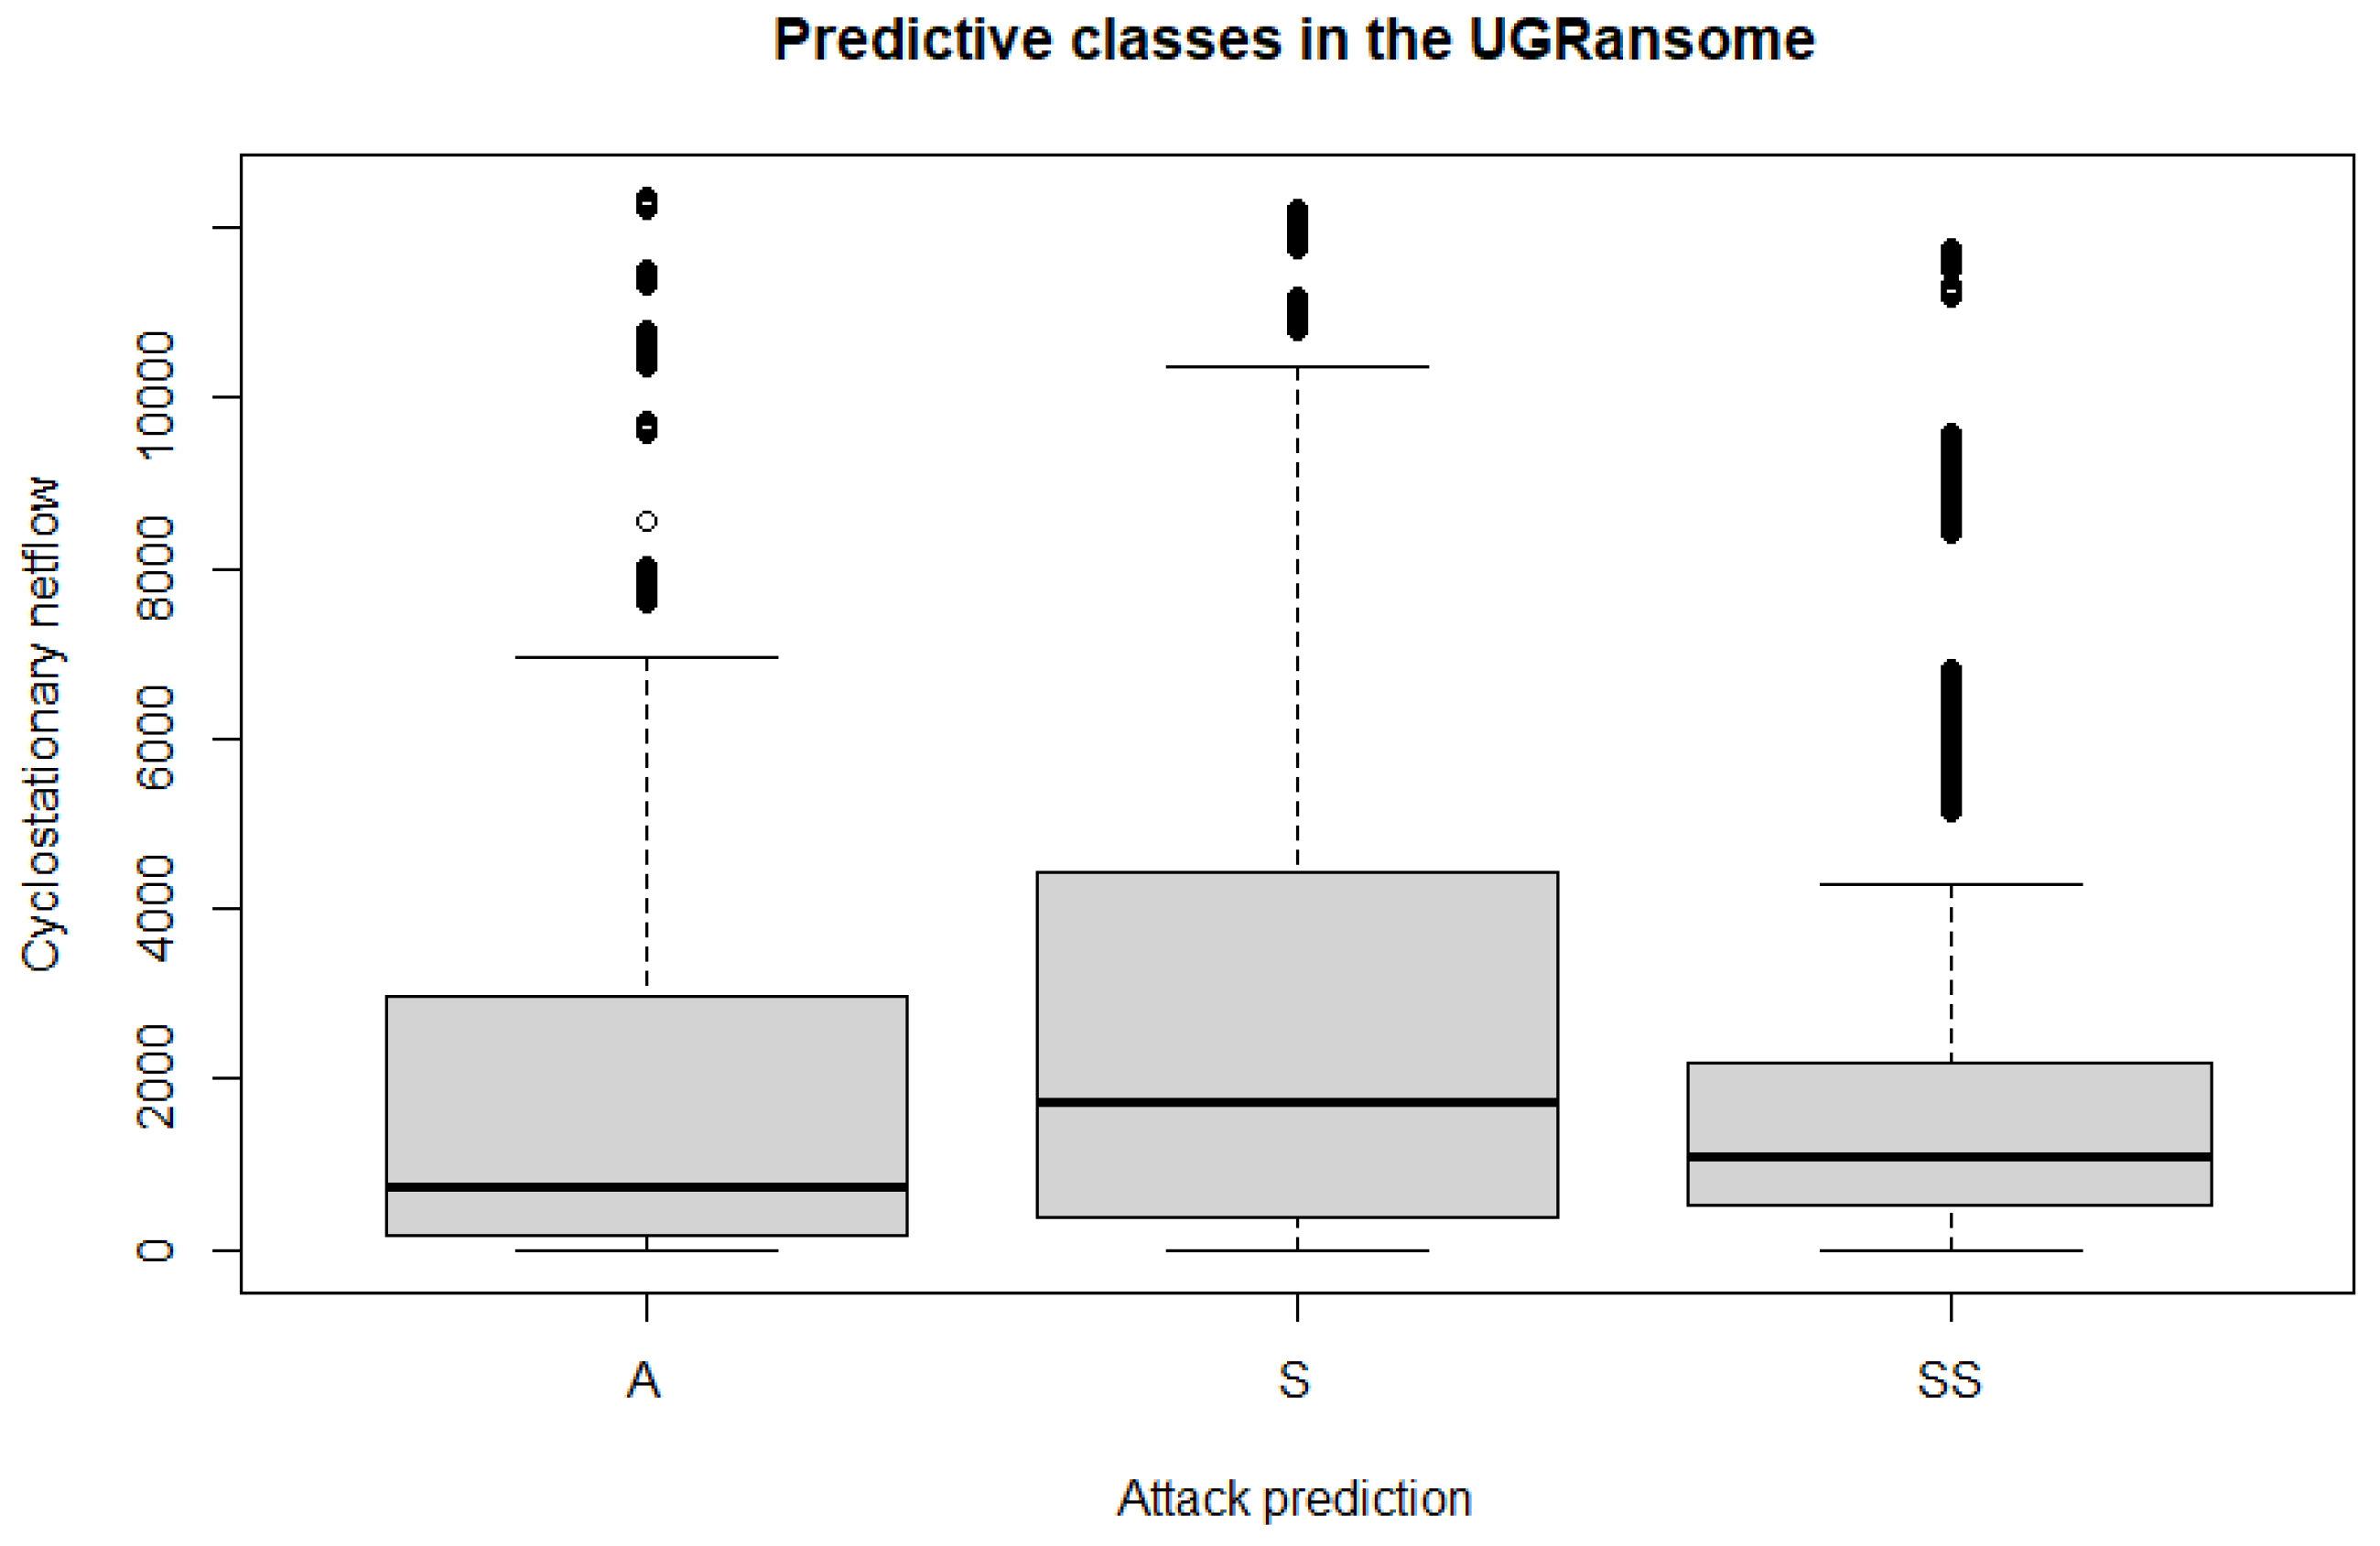
- Labelling. Records should be accurately labelled as normal or not and the malware category is an important requirement for classification and prediction. The UGRansome features are accurately labelled into three predictive categories such as anomaly (abnormal), signature (normal), and synthetic signature (abnormal and normal). Ransomware families represent abnormal classes while well-known network threats are recorded as a normal category.
- Duration. Datasets are created during a specific period (hours, days, weeks, months, and years). This requirement can also represent the time taken to record a specific network pattern. The UGRansome was produced using extracted malware and netflow patterns from publicly available datasets relinquished in 2018 and 2019.
- Documentation. A dataset description is an important requirement to understand its characteristics, merits, and demerits. This article serves as the UGRansome documentation.
- Format. Usually, datasets have been built into different formats such as csv, pcap, and tcpdump [9]. The UGRansome is formatted in a csv format.
2.2. Novel Network Threats
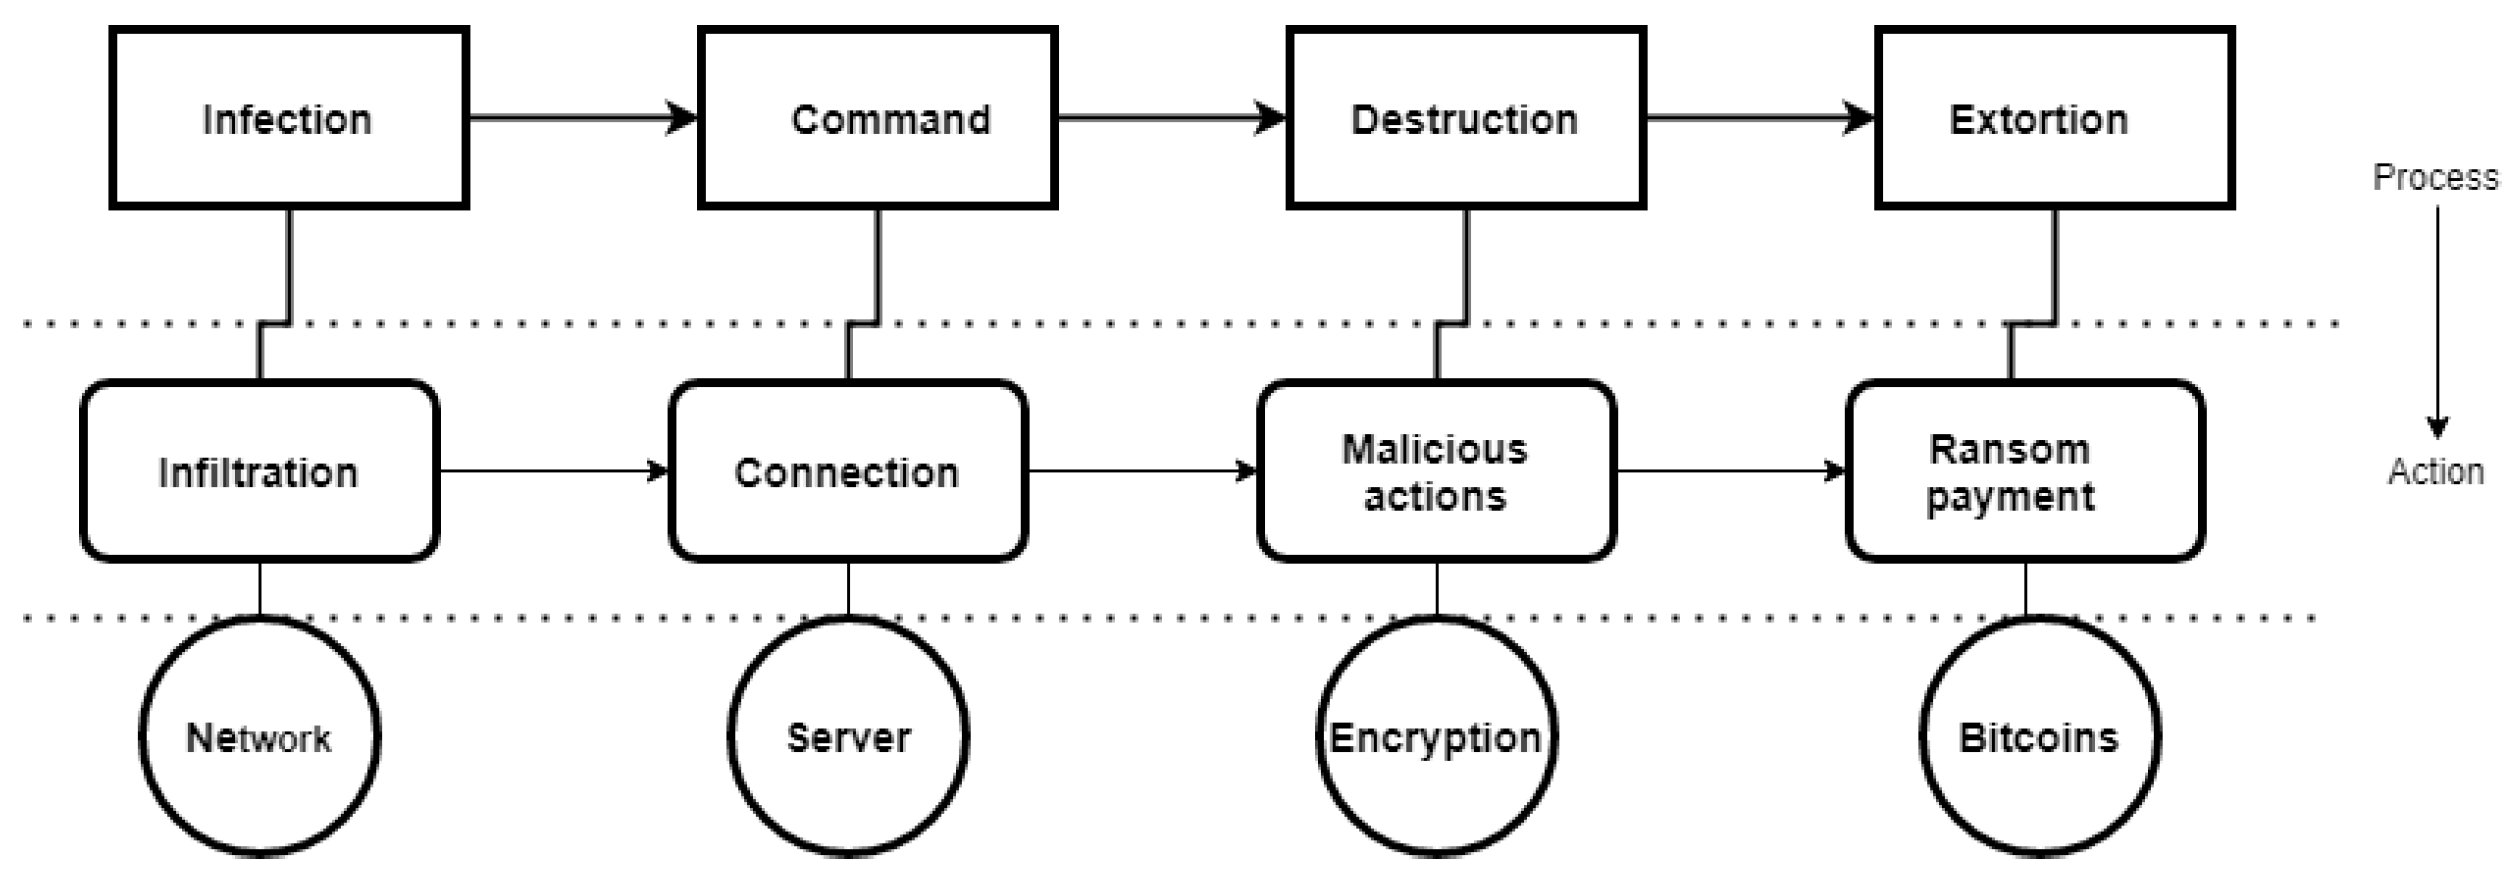
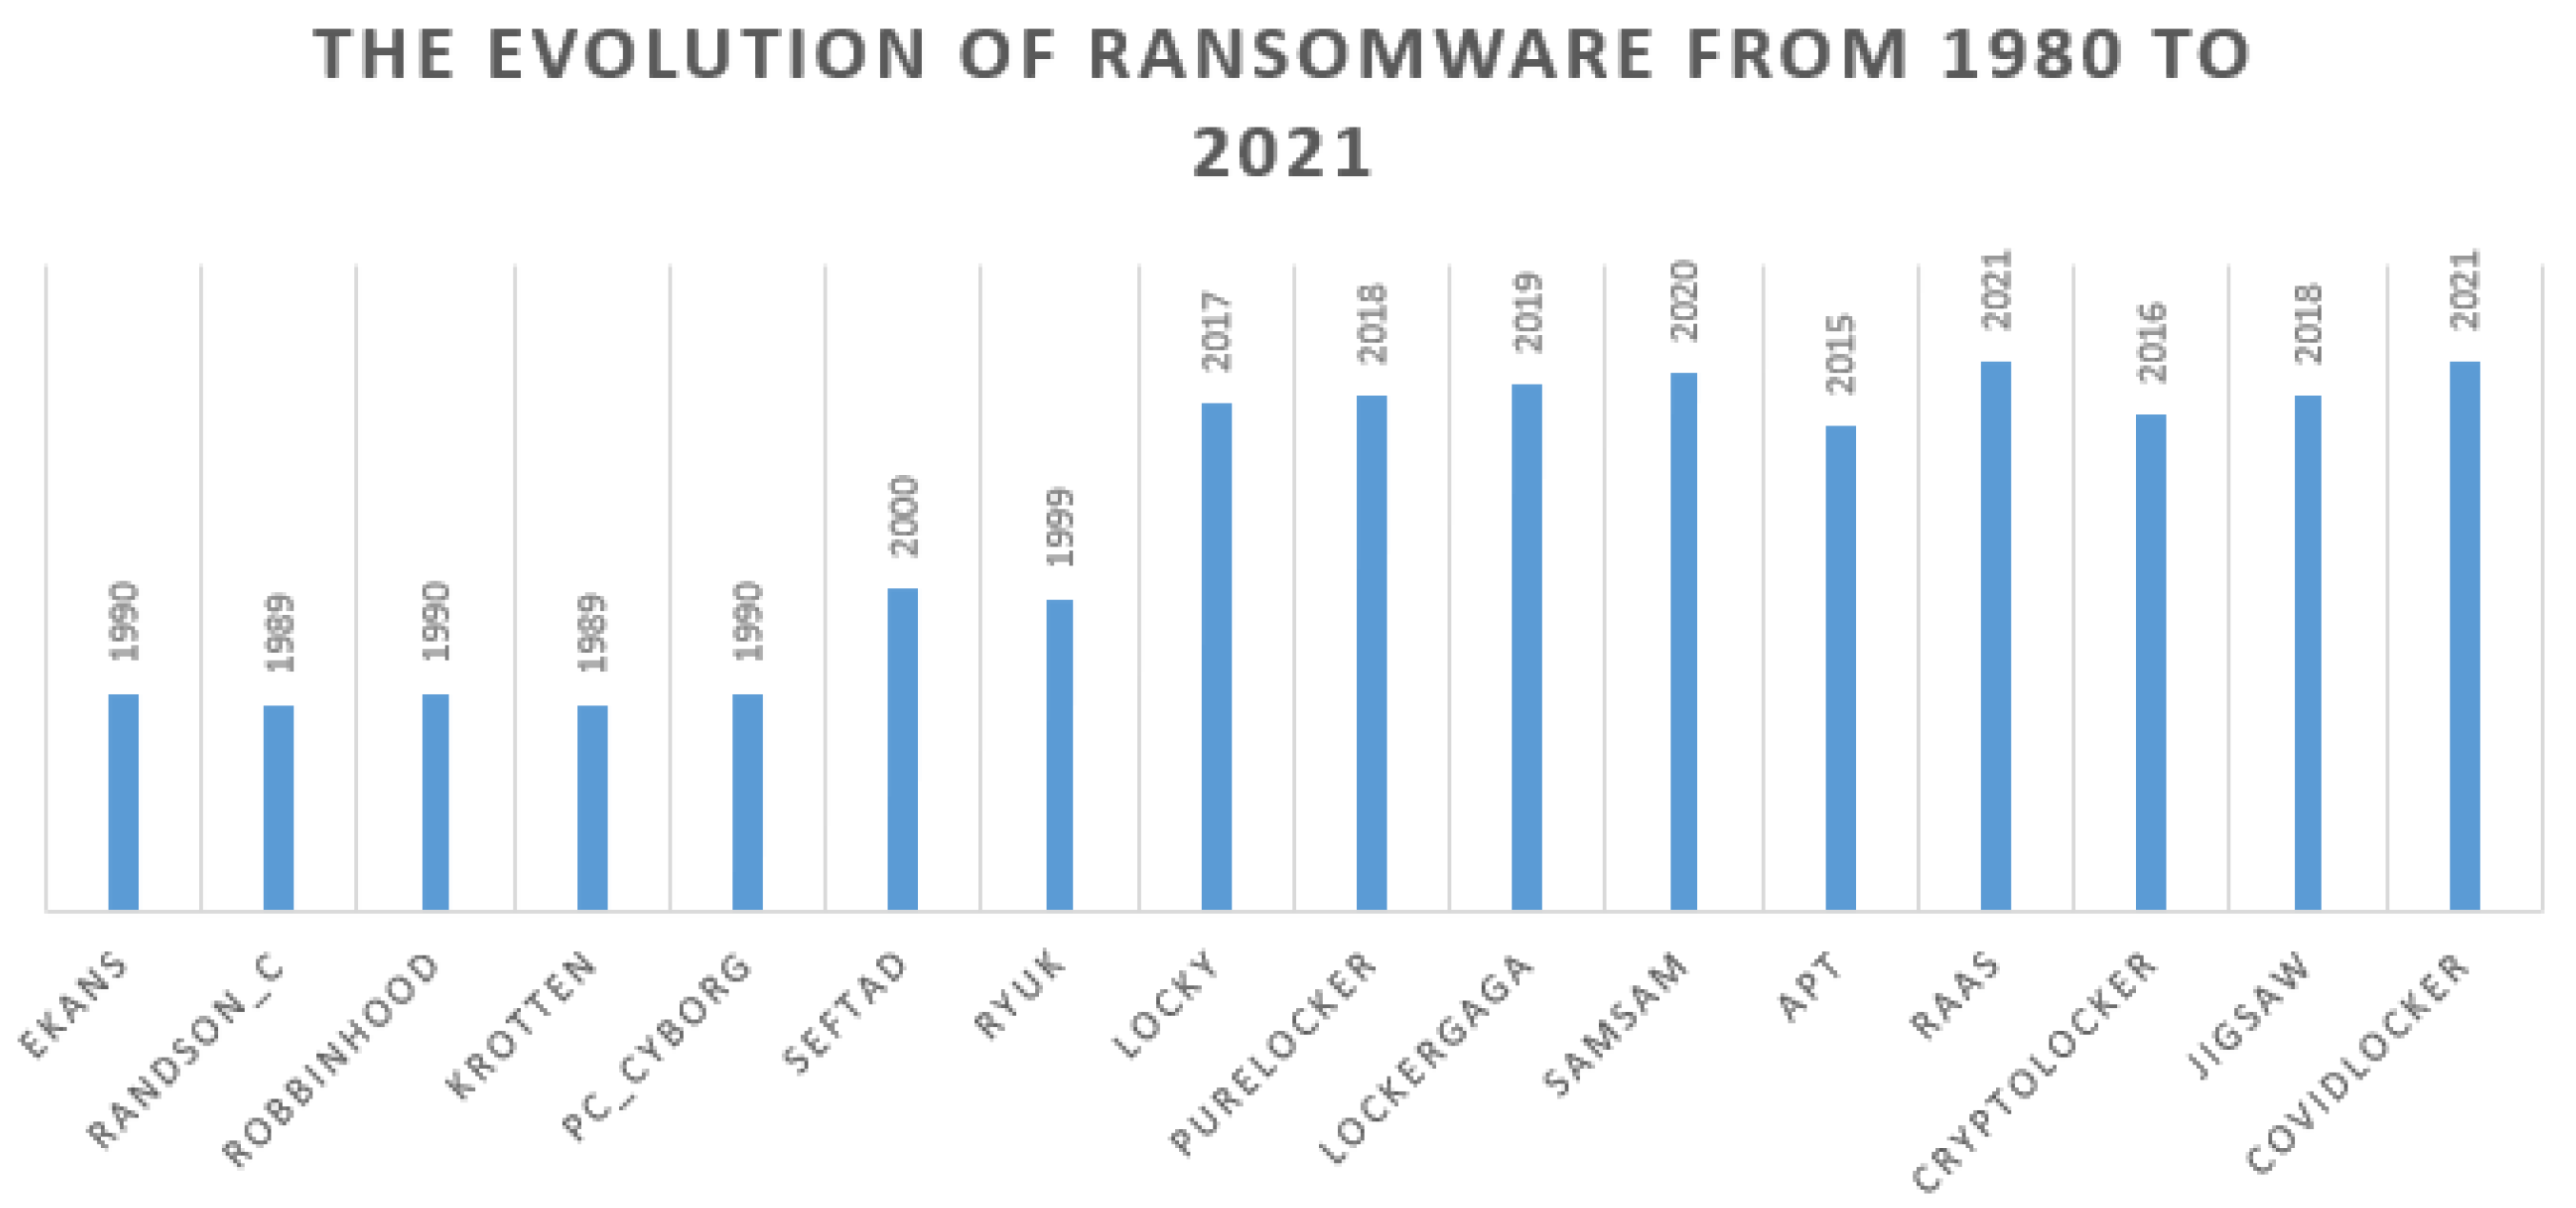
2.3. The Evolution of Ransomware
2.4. Cyclostationarity of Zero-Day Threats
- The category of synthetic and signature malware. It represents characteristics of well-known as well as unknown attacks. A considerable number of signatures have been implemented to detect well-known malware, but there is still ongoing work towards the design of signatures or keys detecting unknown ones. This category exhibits both normality and abnormality.
- The category of signature malware. It depicts well-known malware with available keys that have been released and updated regularly. This type of malware can be effectively detected using specific signatures because their behaviours are known. The signature category portrays normality.
- The category of anomaly malware. It is a set of unknown malware for which signatures or keys do not yet exist. Abnormality is illustrated by this category that includes the most zero-day attacks.
3. Materials and Methods
3.1. Data Gathering
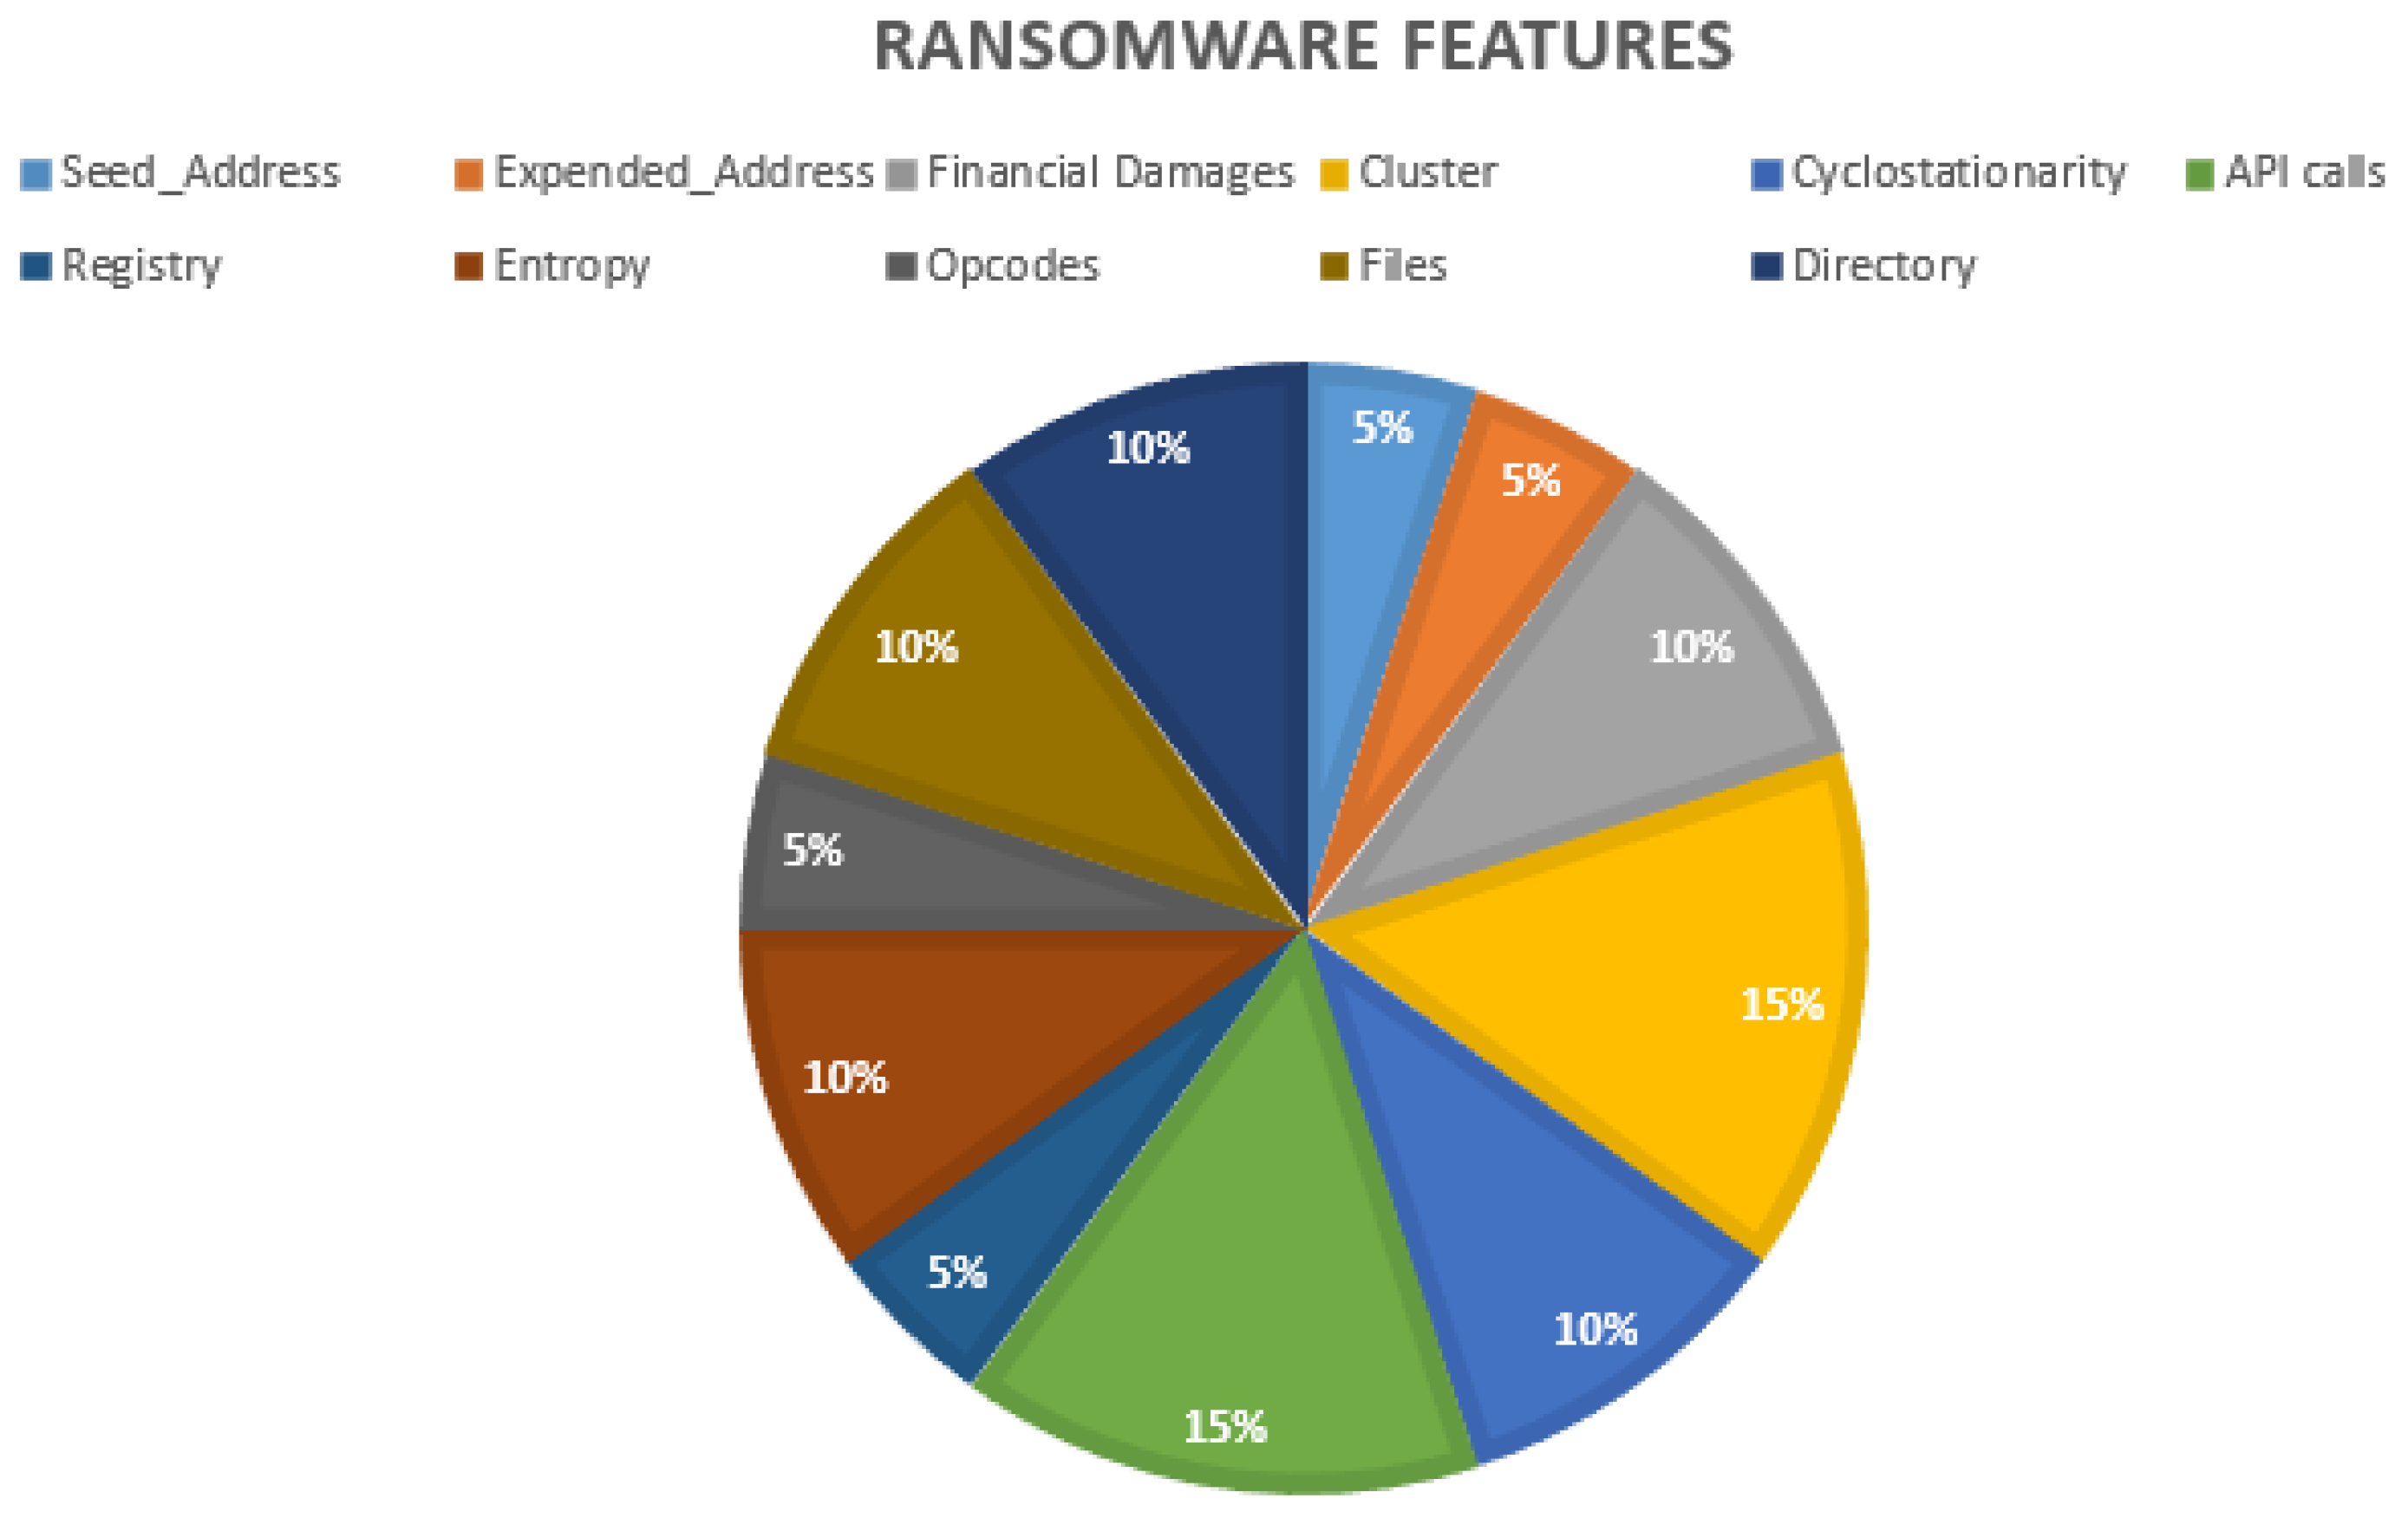
- BTC: this refers to the total amount of Bitcoins paid for the ransomware.
- USD: this is also the total amount of USD paid for the ransomware.
- Cluster: this represents the cluster assigned per ransomware. This cluster is a numerical value that has been assigned for each ransomware.
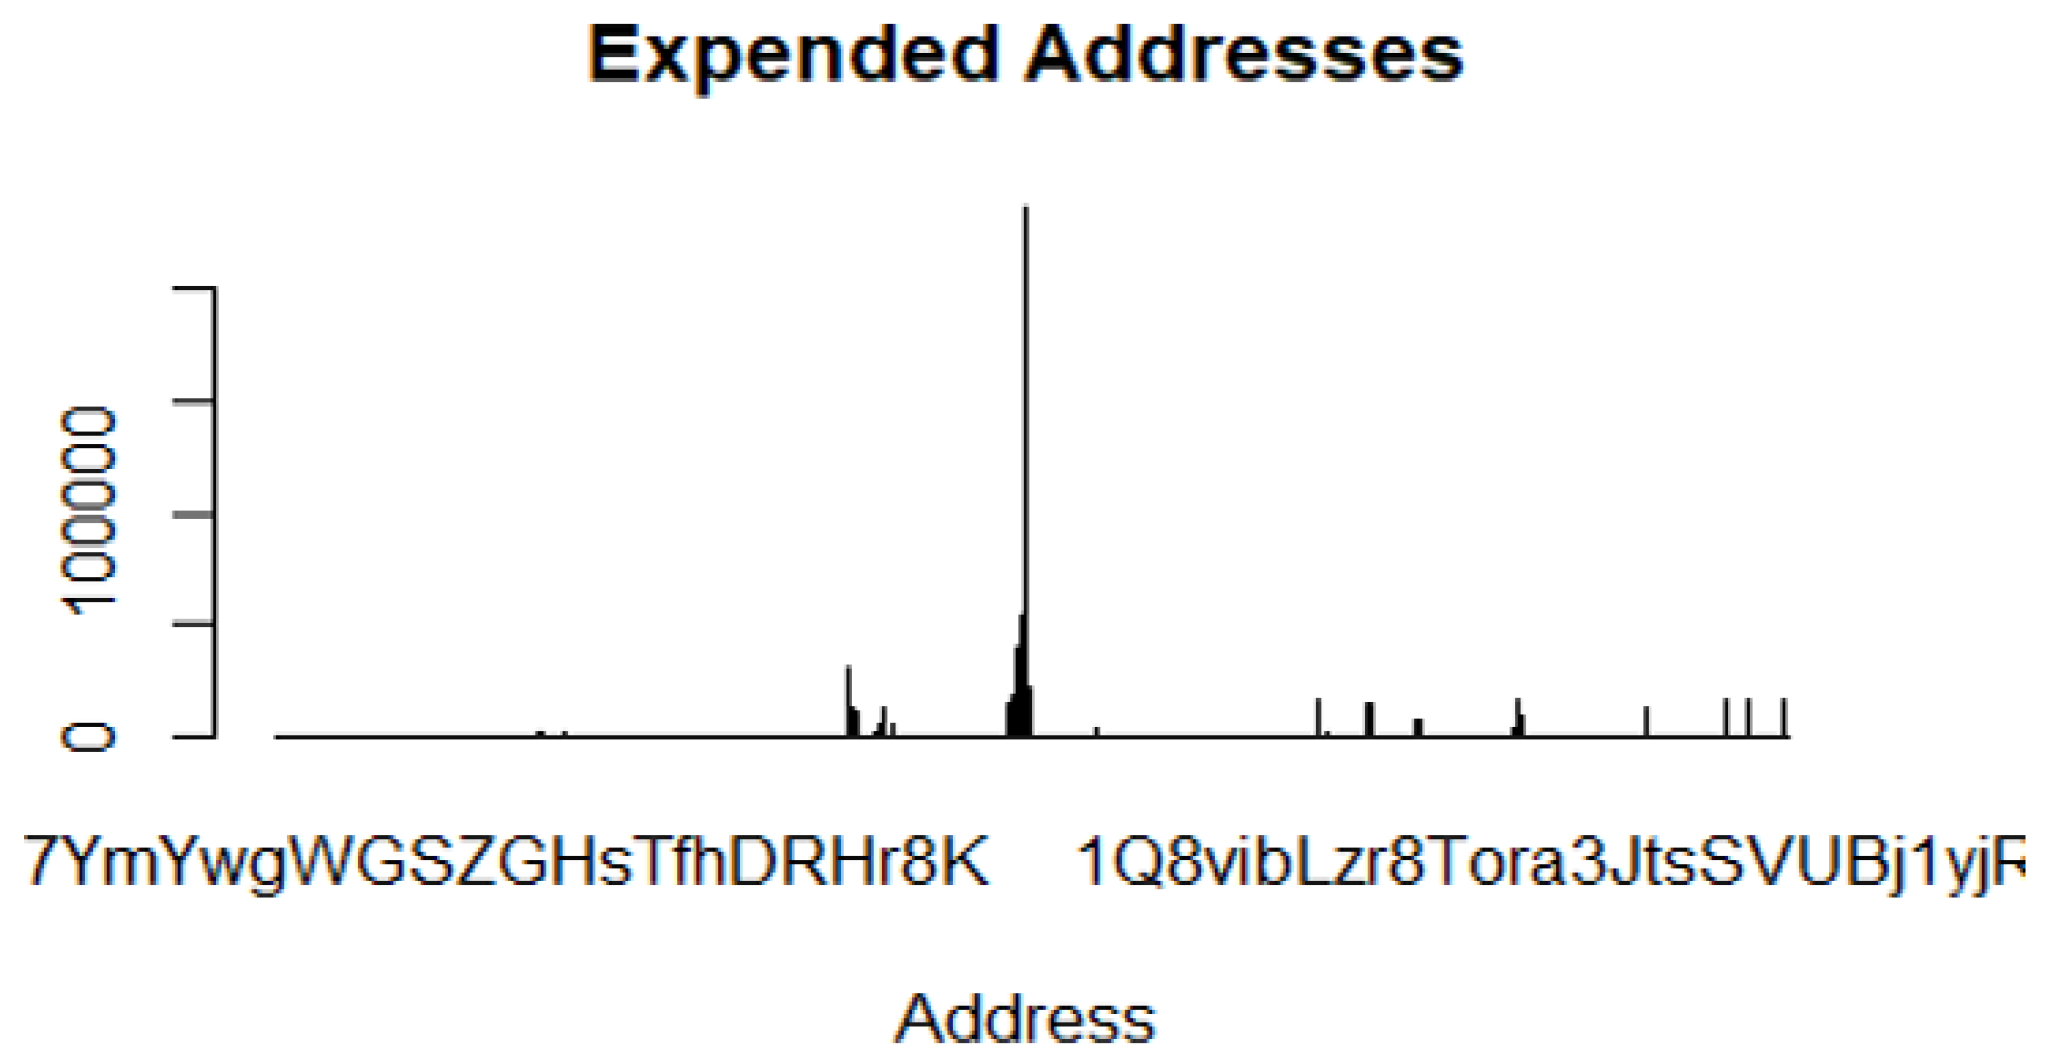
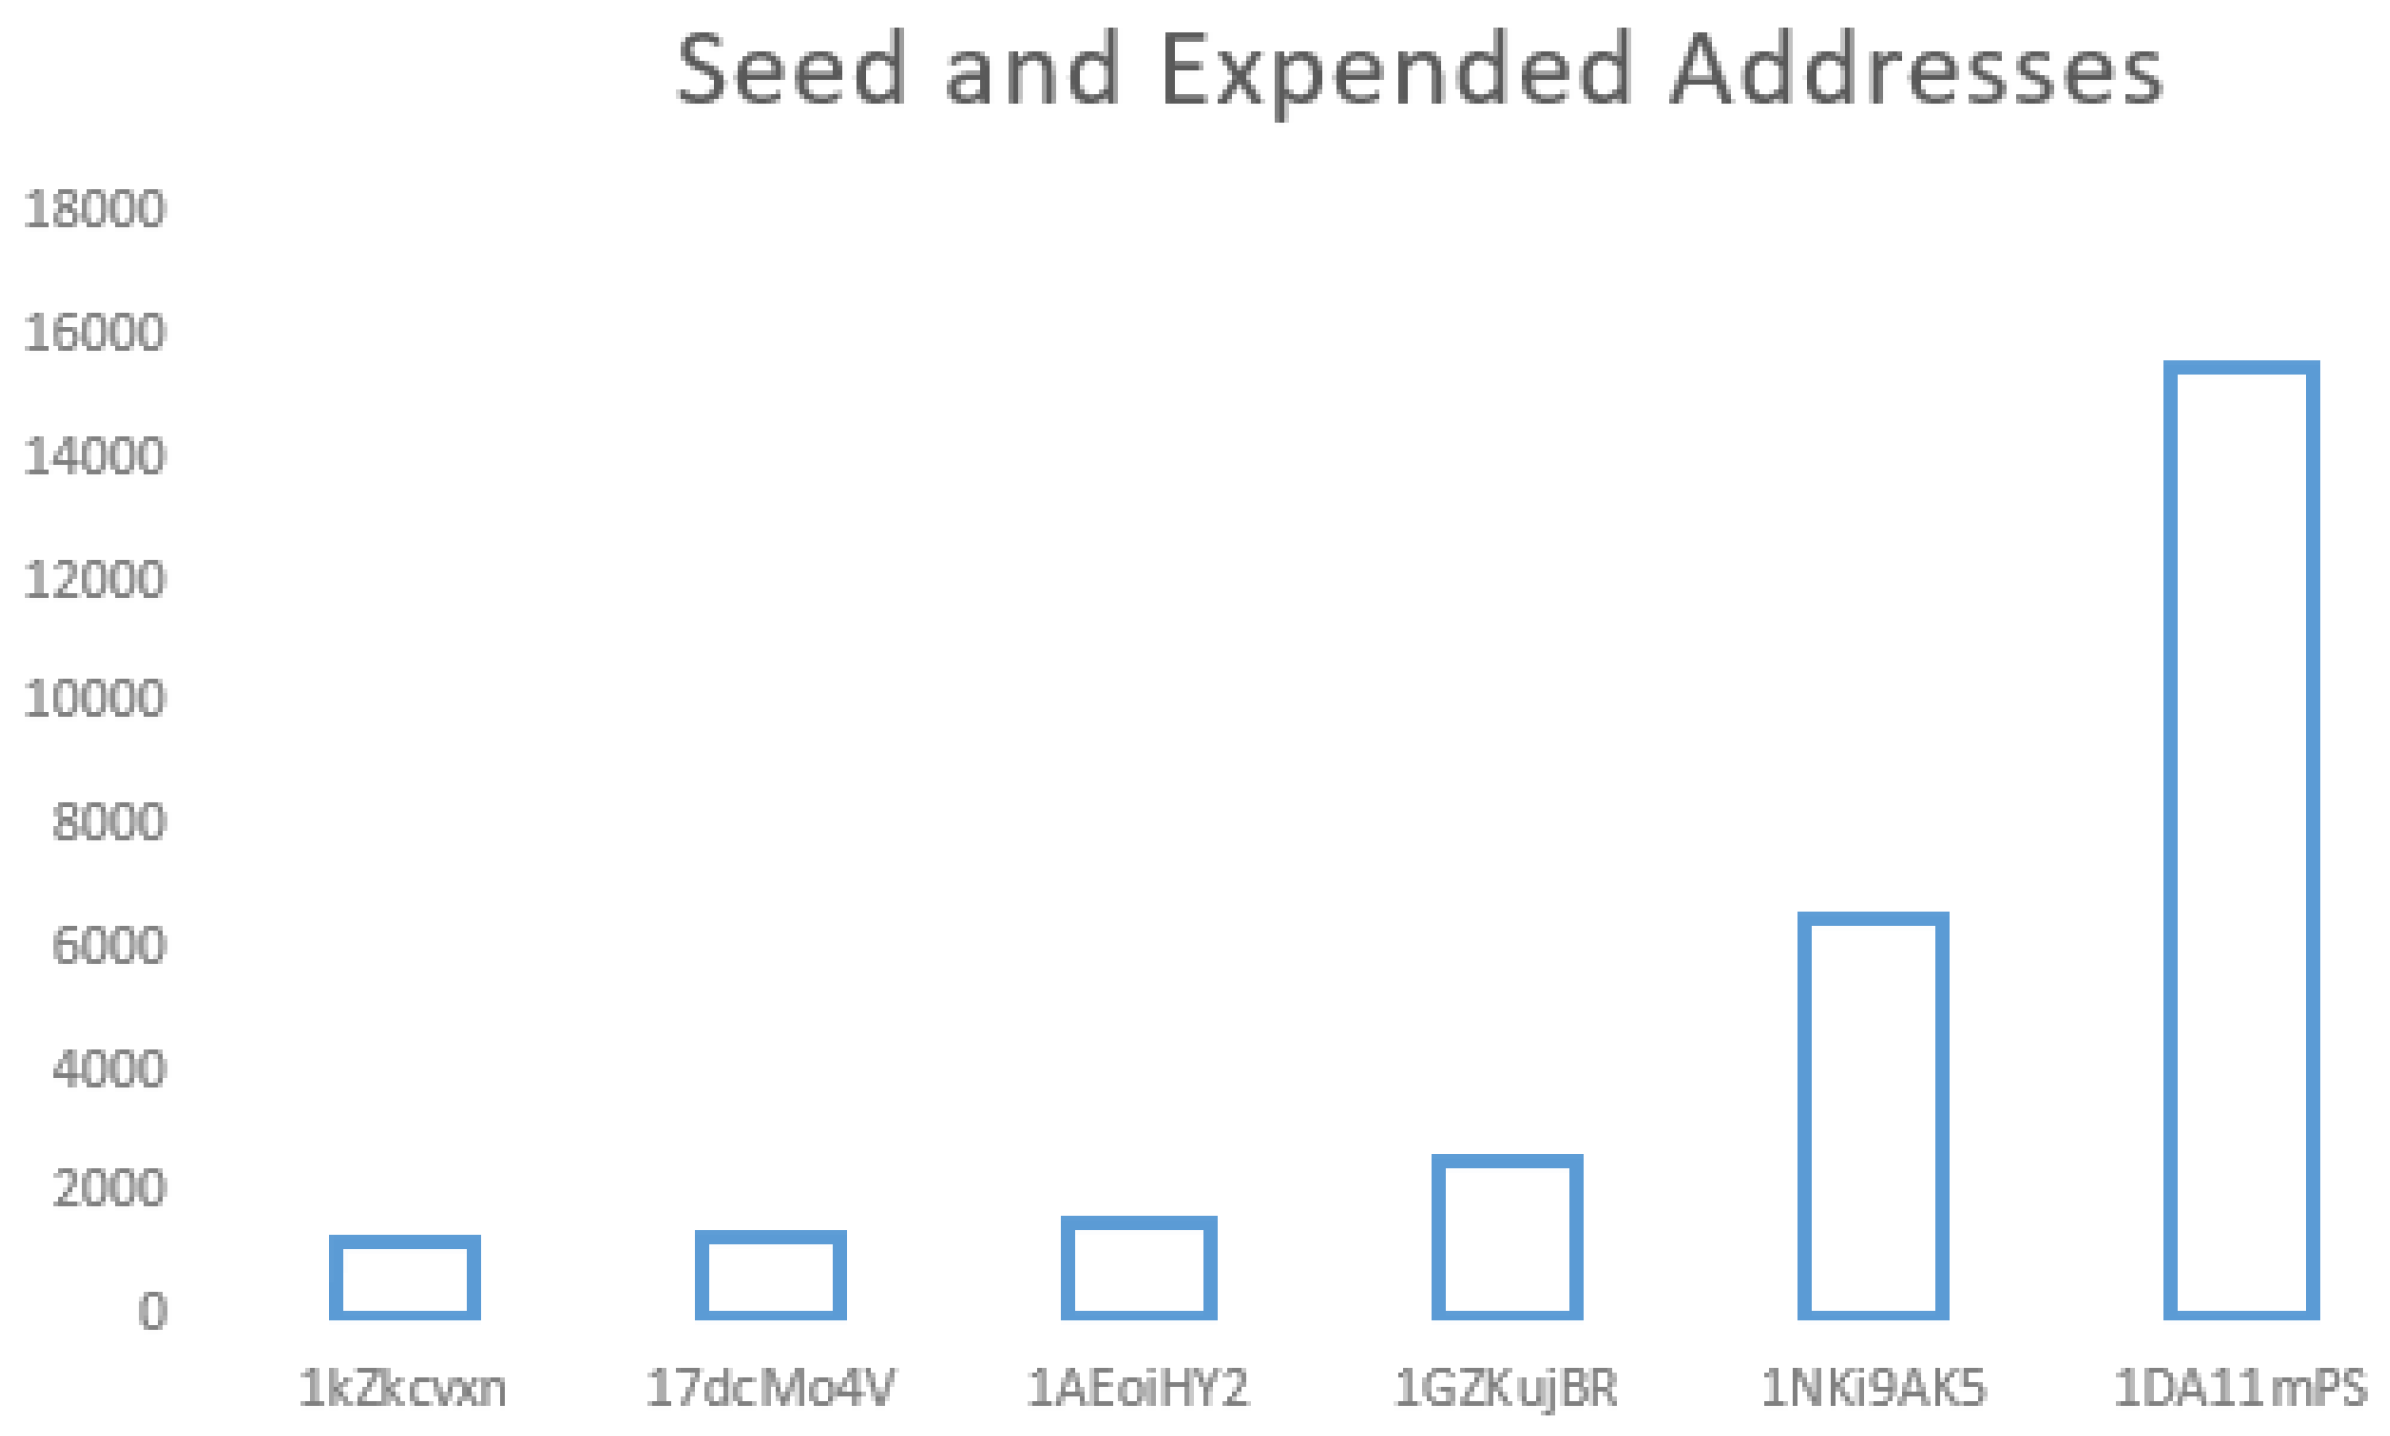
- Seed and expended addresses. An address used by the ransomware to anonymously receive bitcoins or USD. This address is a string with an alphanumeric.
- Ransomware. The name of the zero-day threat. For instance, WannaCry, Locky, APT, Globe, JigSaw, EDA2, and SamSam.
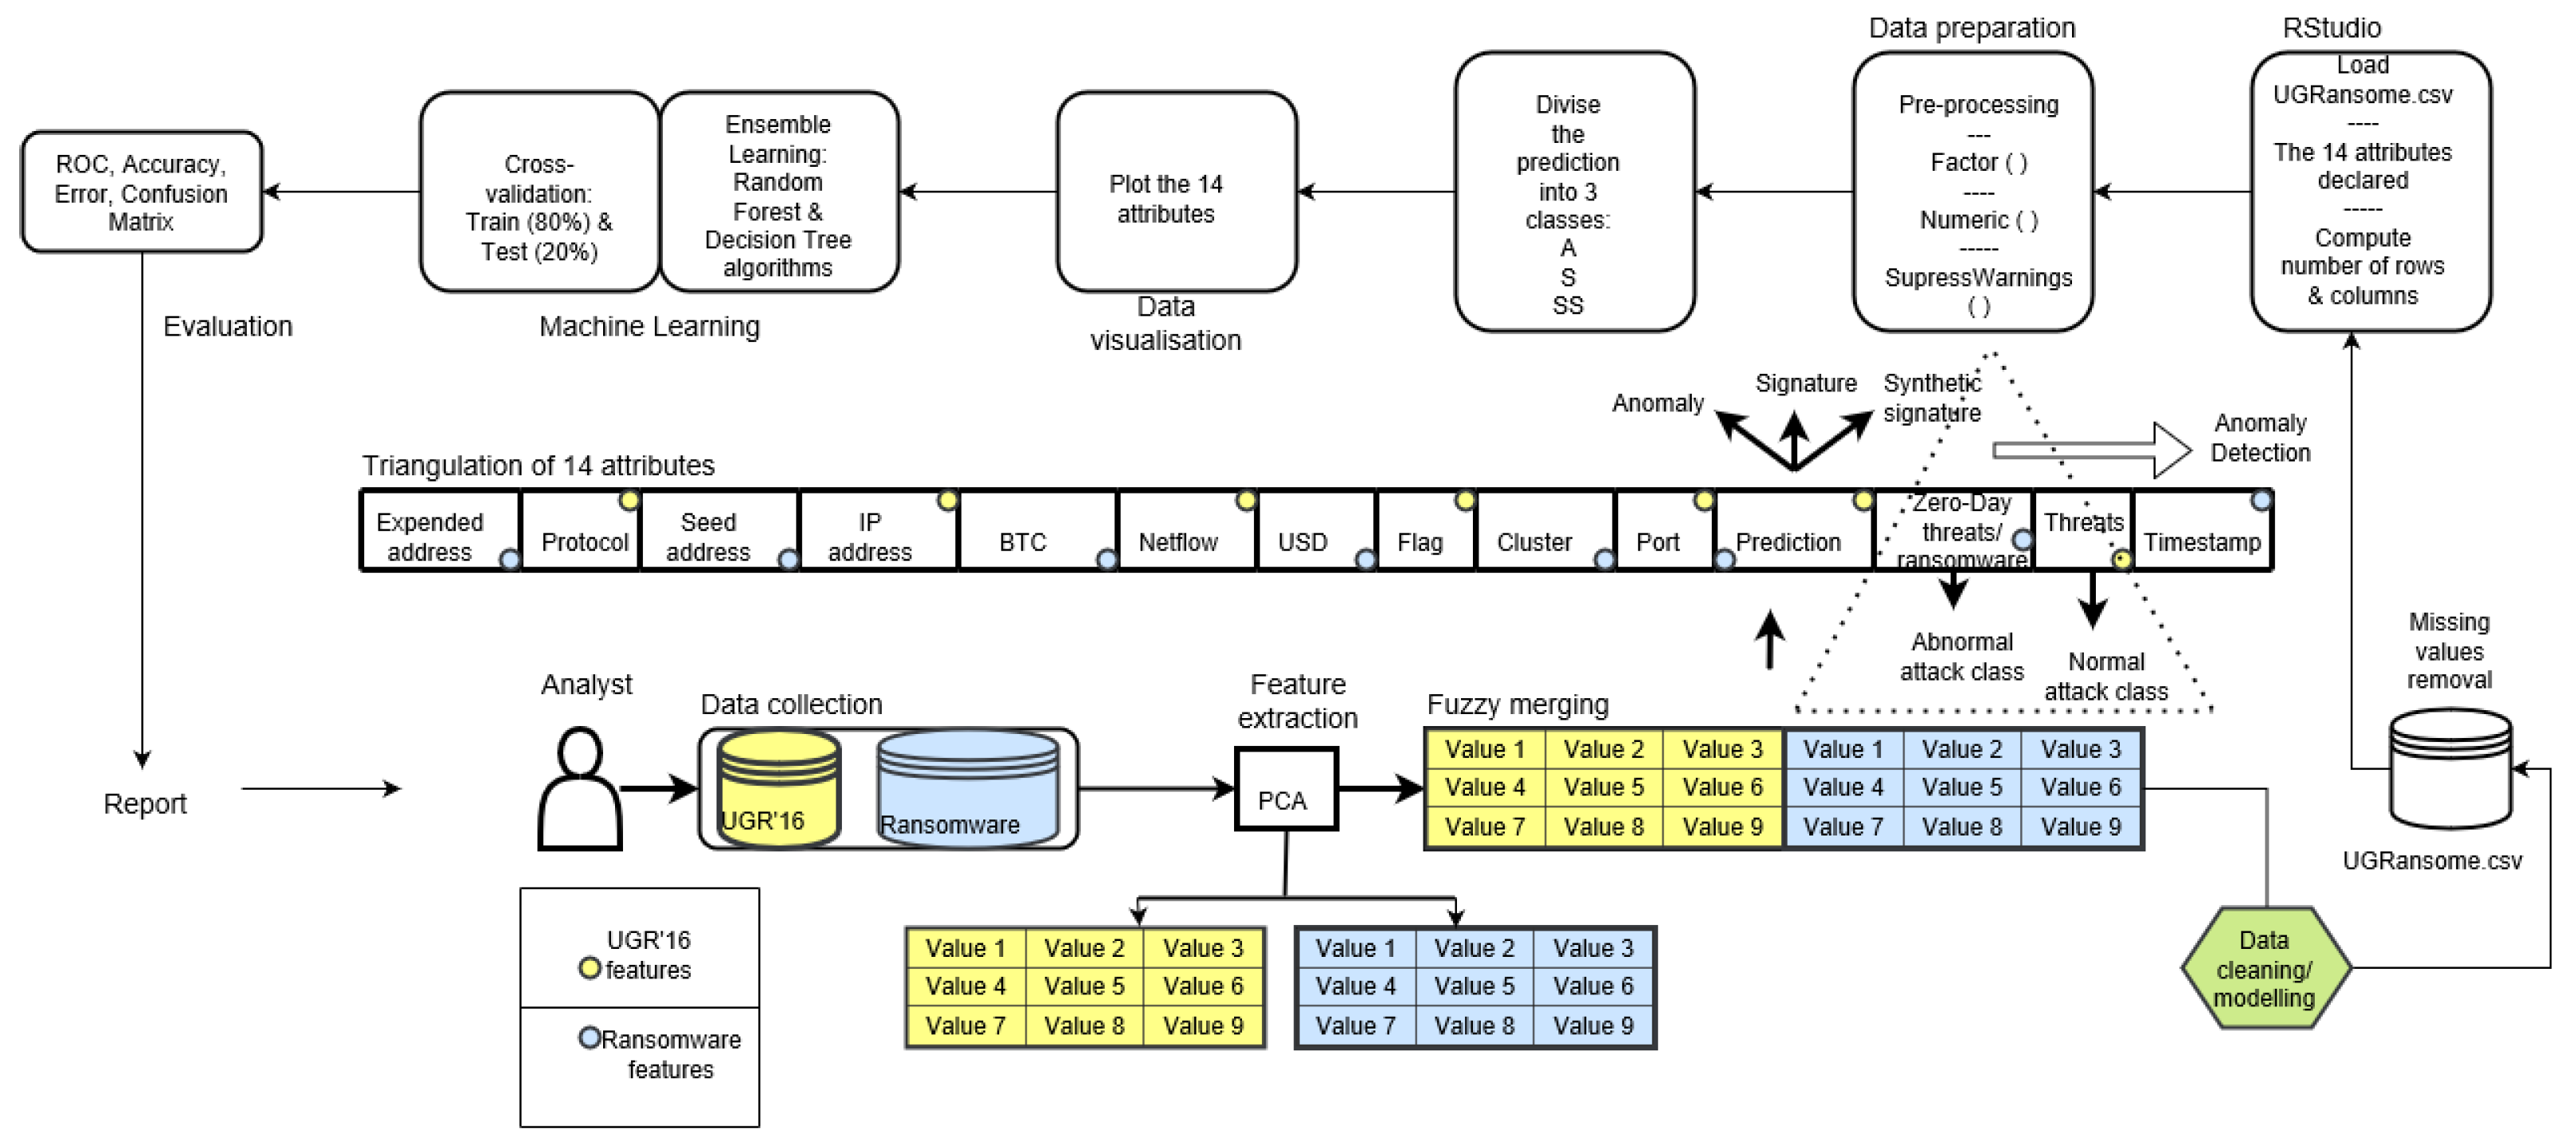
3.2. Principal Component Analysis
3.3. UGRansome Model
3.4. Data Cleaning
3.5. Data Modelling
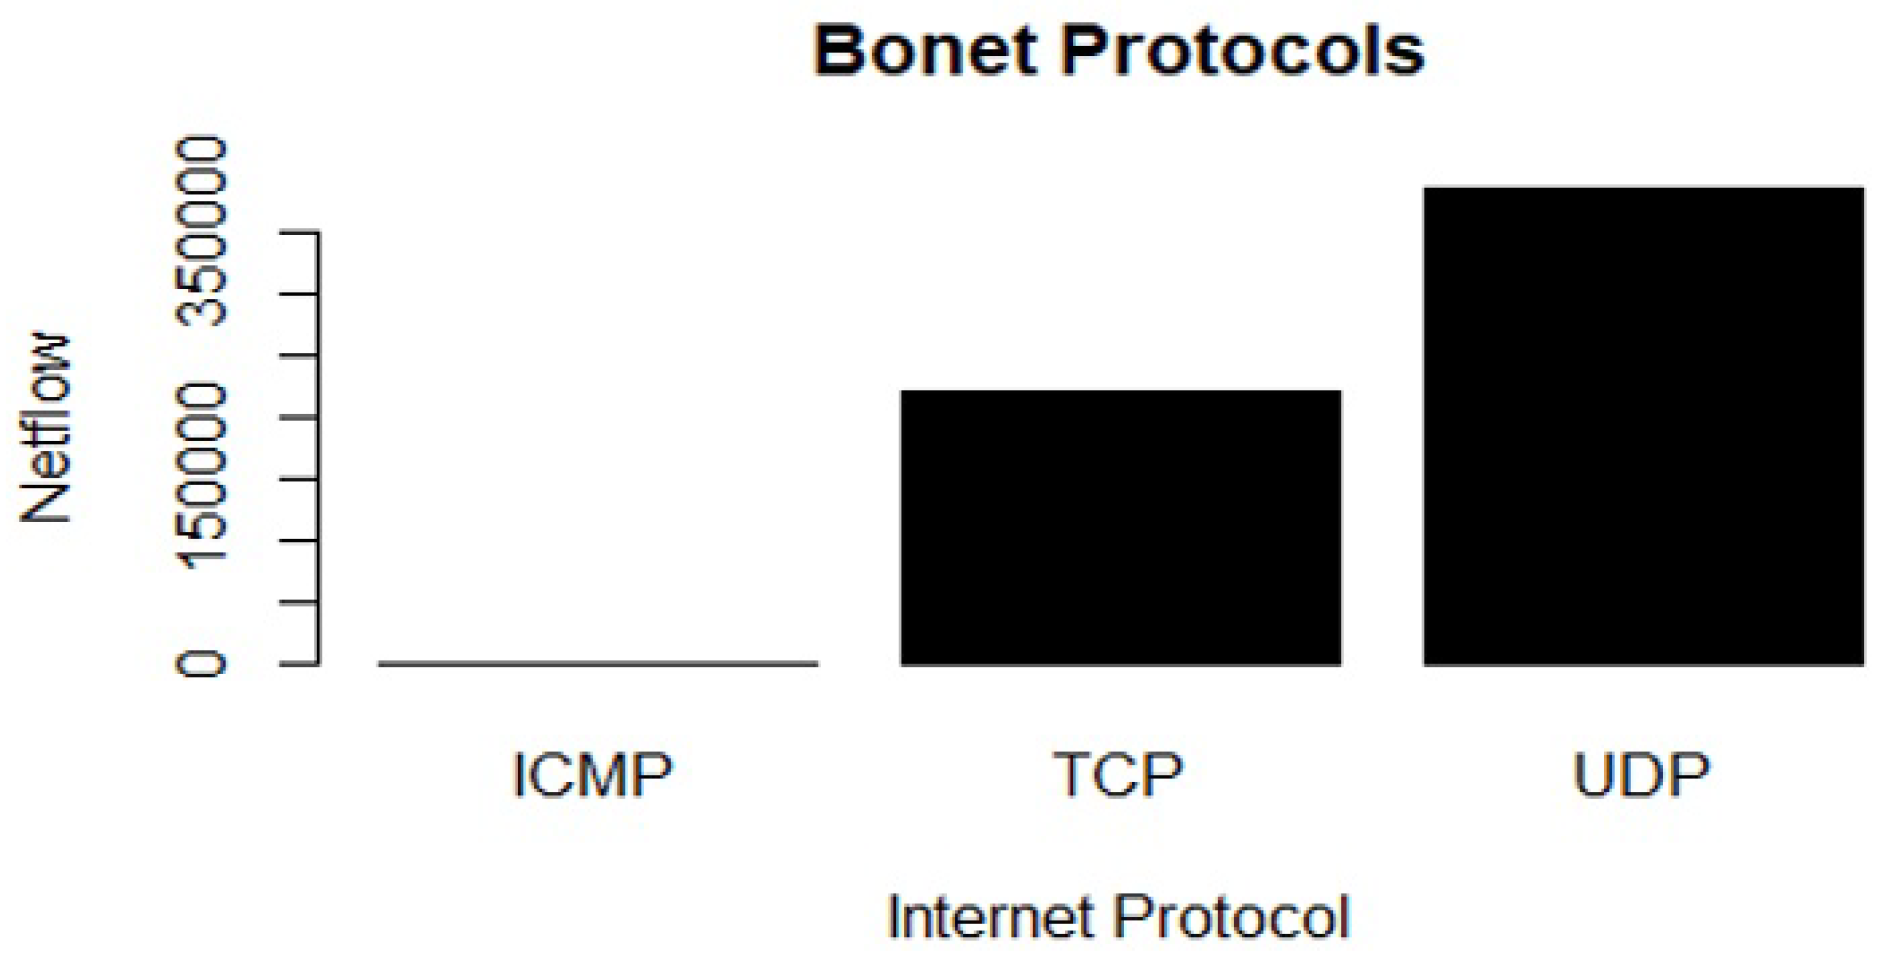
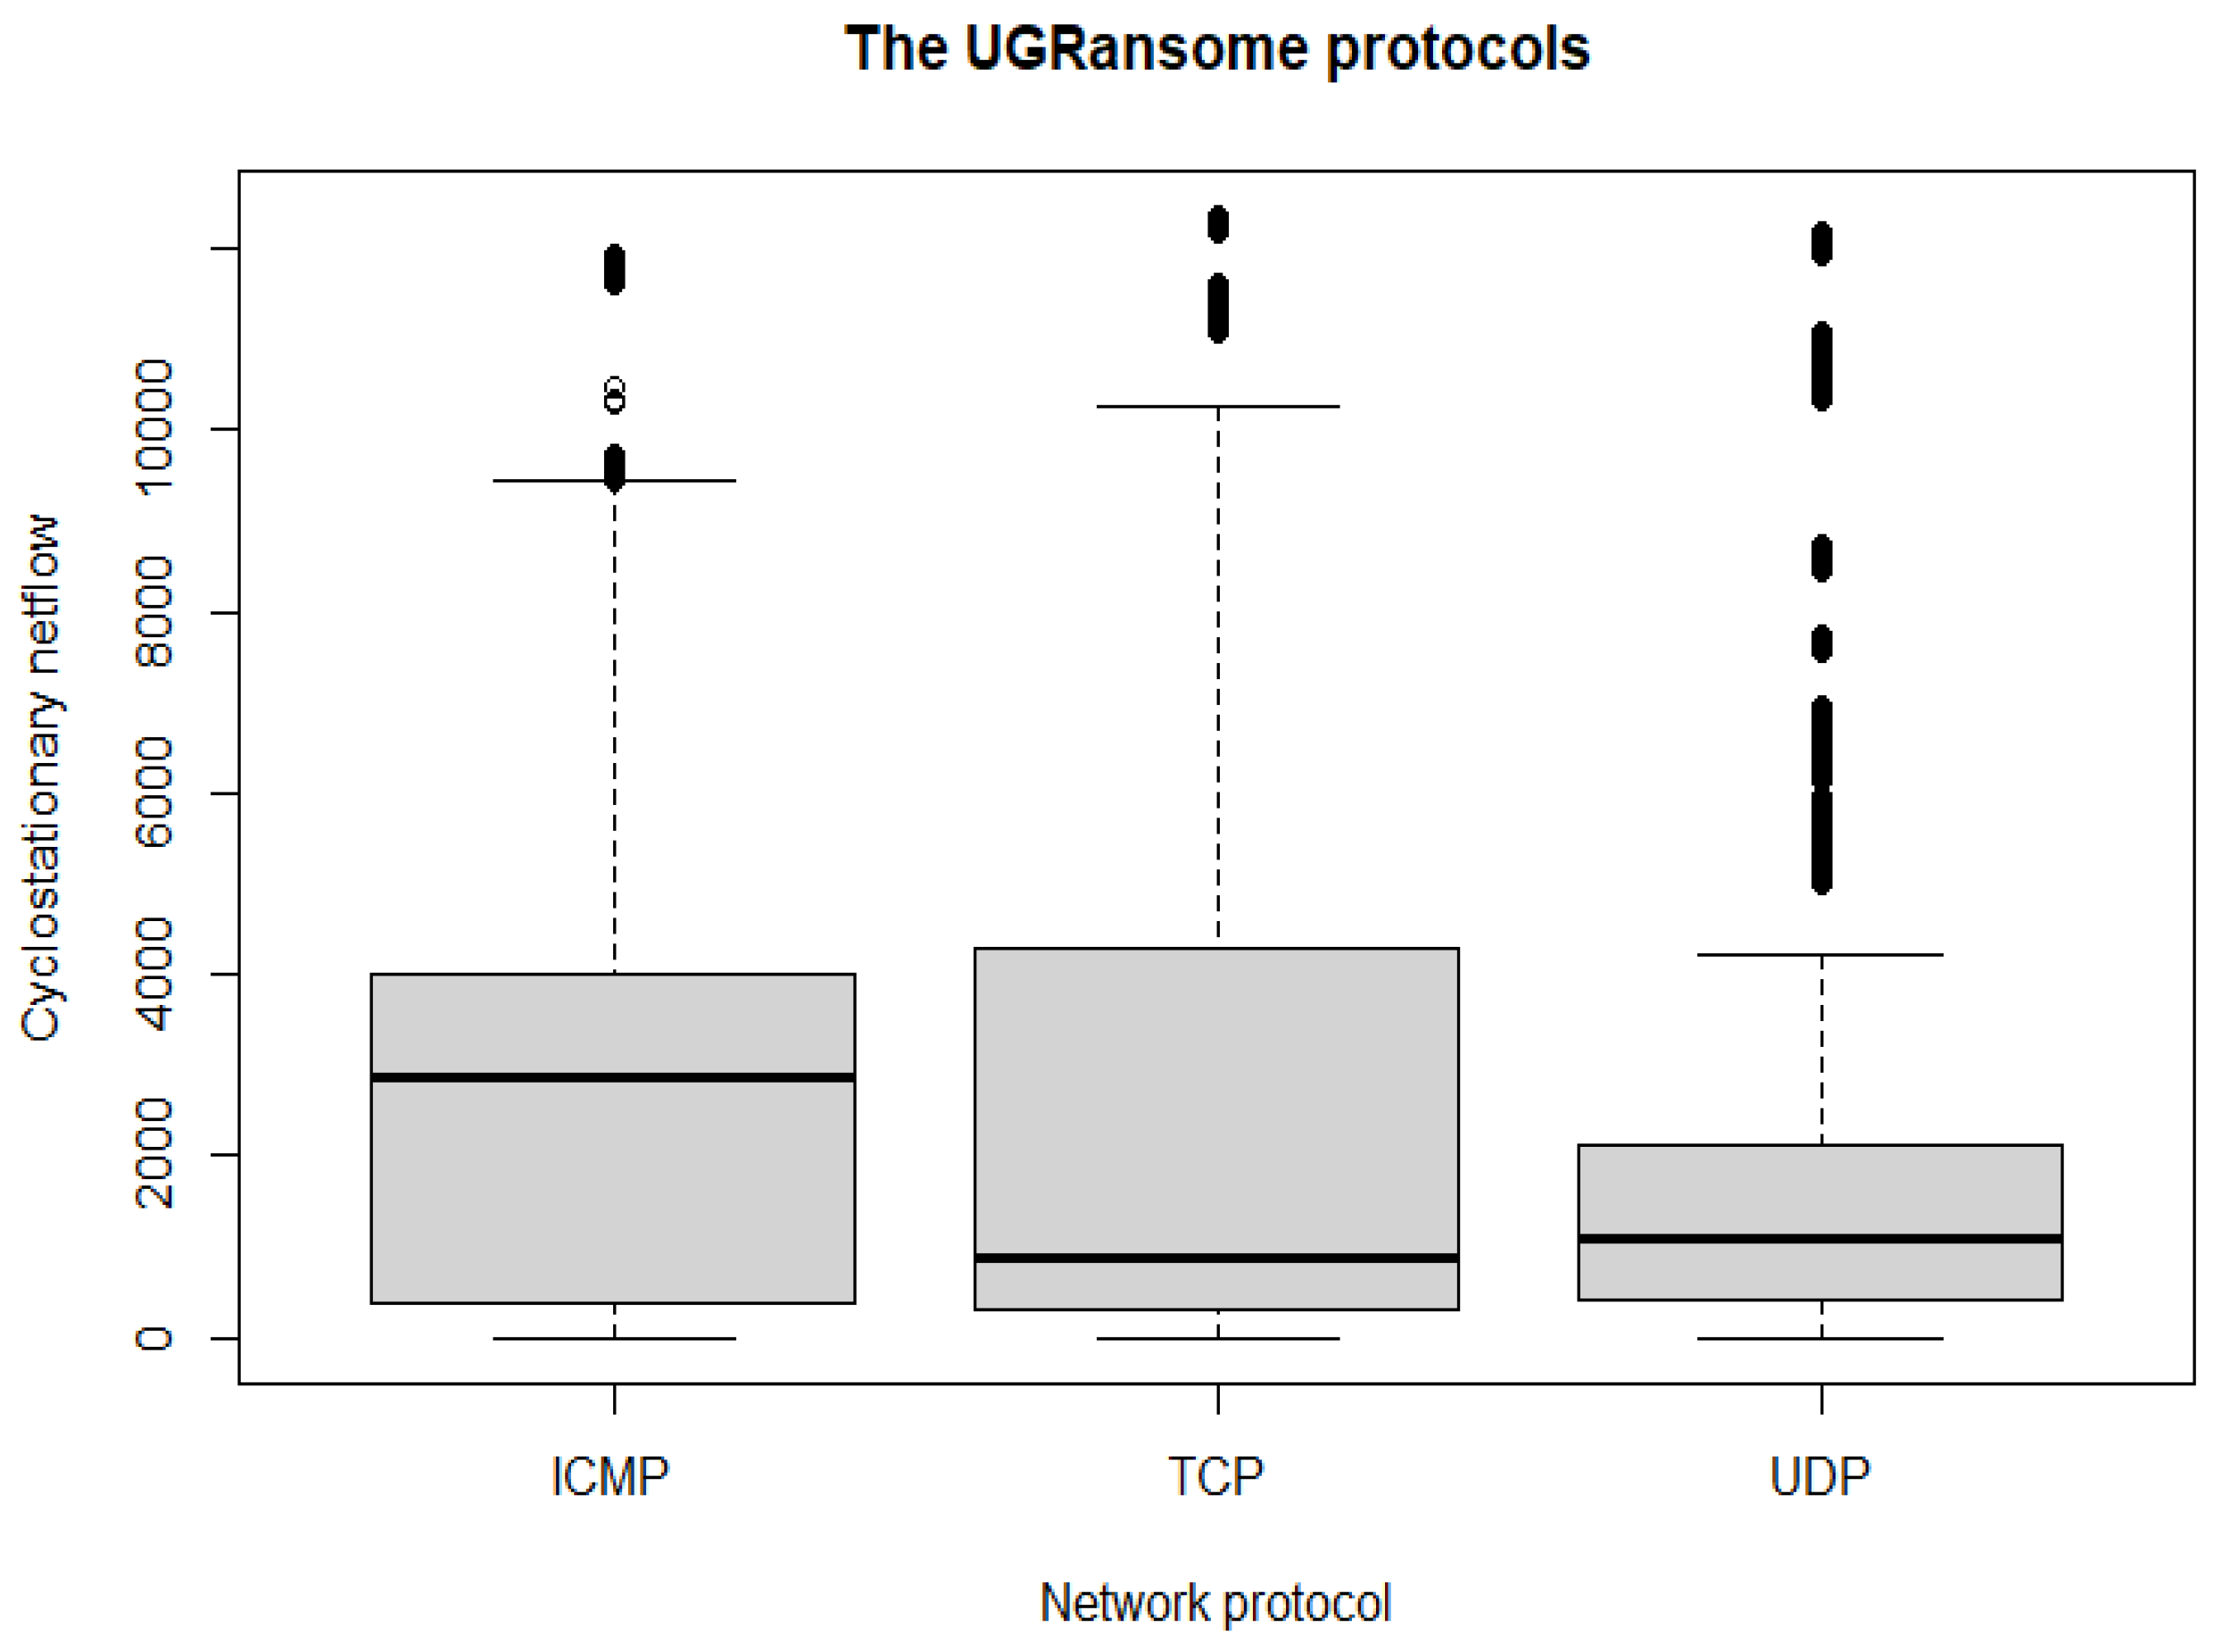
- The TCP has the highest number of features (92,157) in terms of network protocols.
- AF has the highest number of features (72,814) in terms of network flags.
- Locky has the highest number of features (33,870) in terms of ransomware.
- The address type 1DA11mPS has the highest number of features (82,048) in terms of seed/expended addresses.
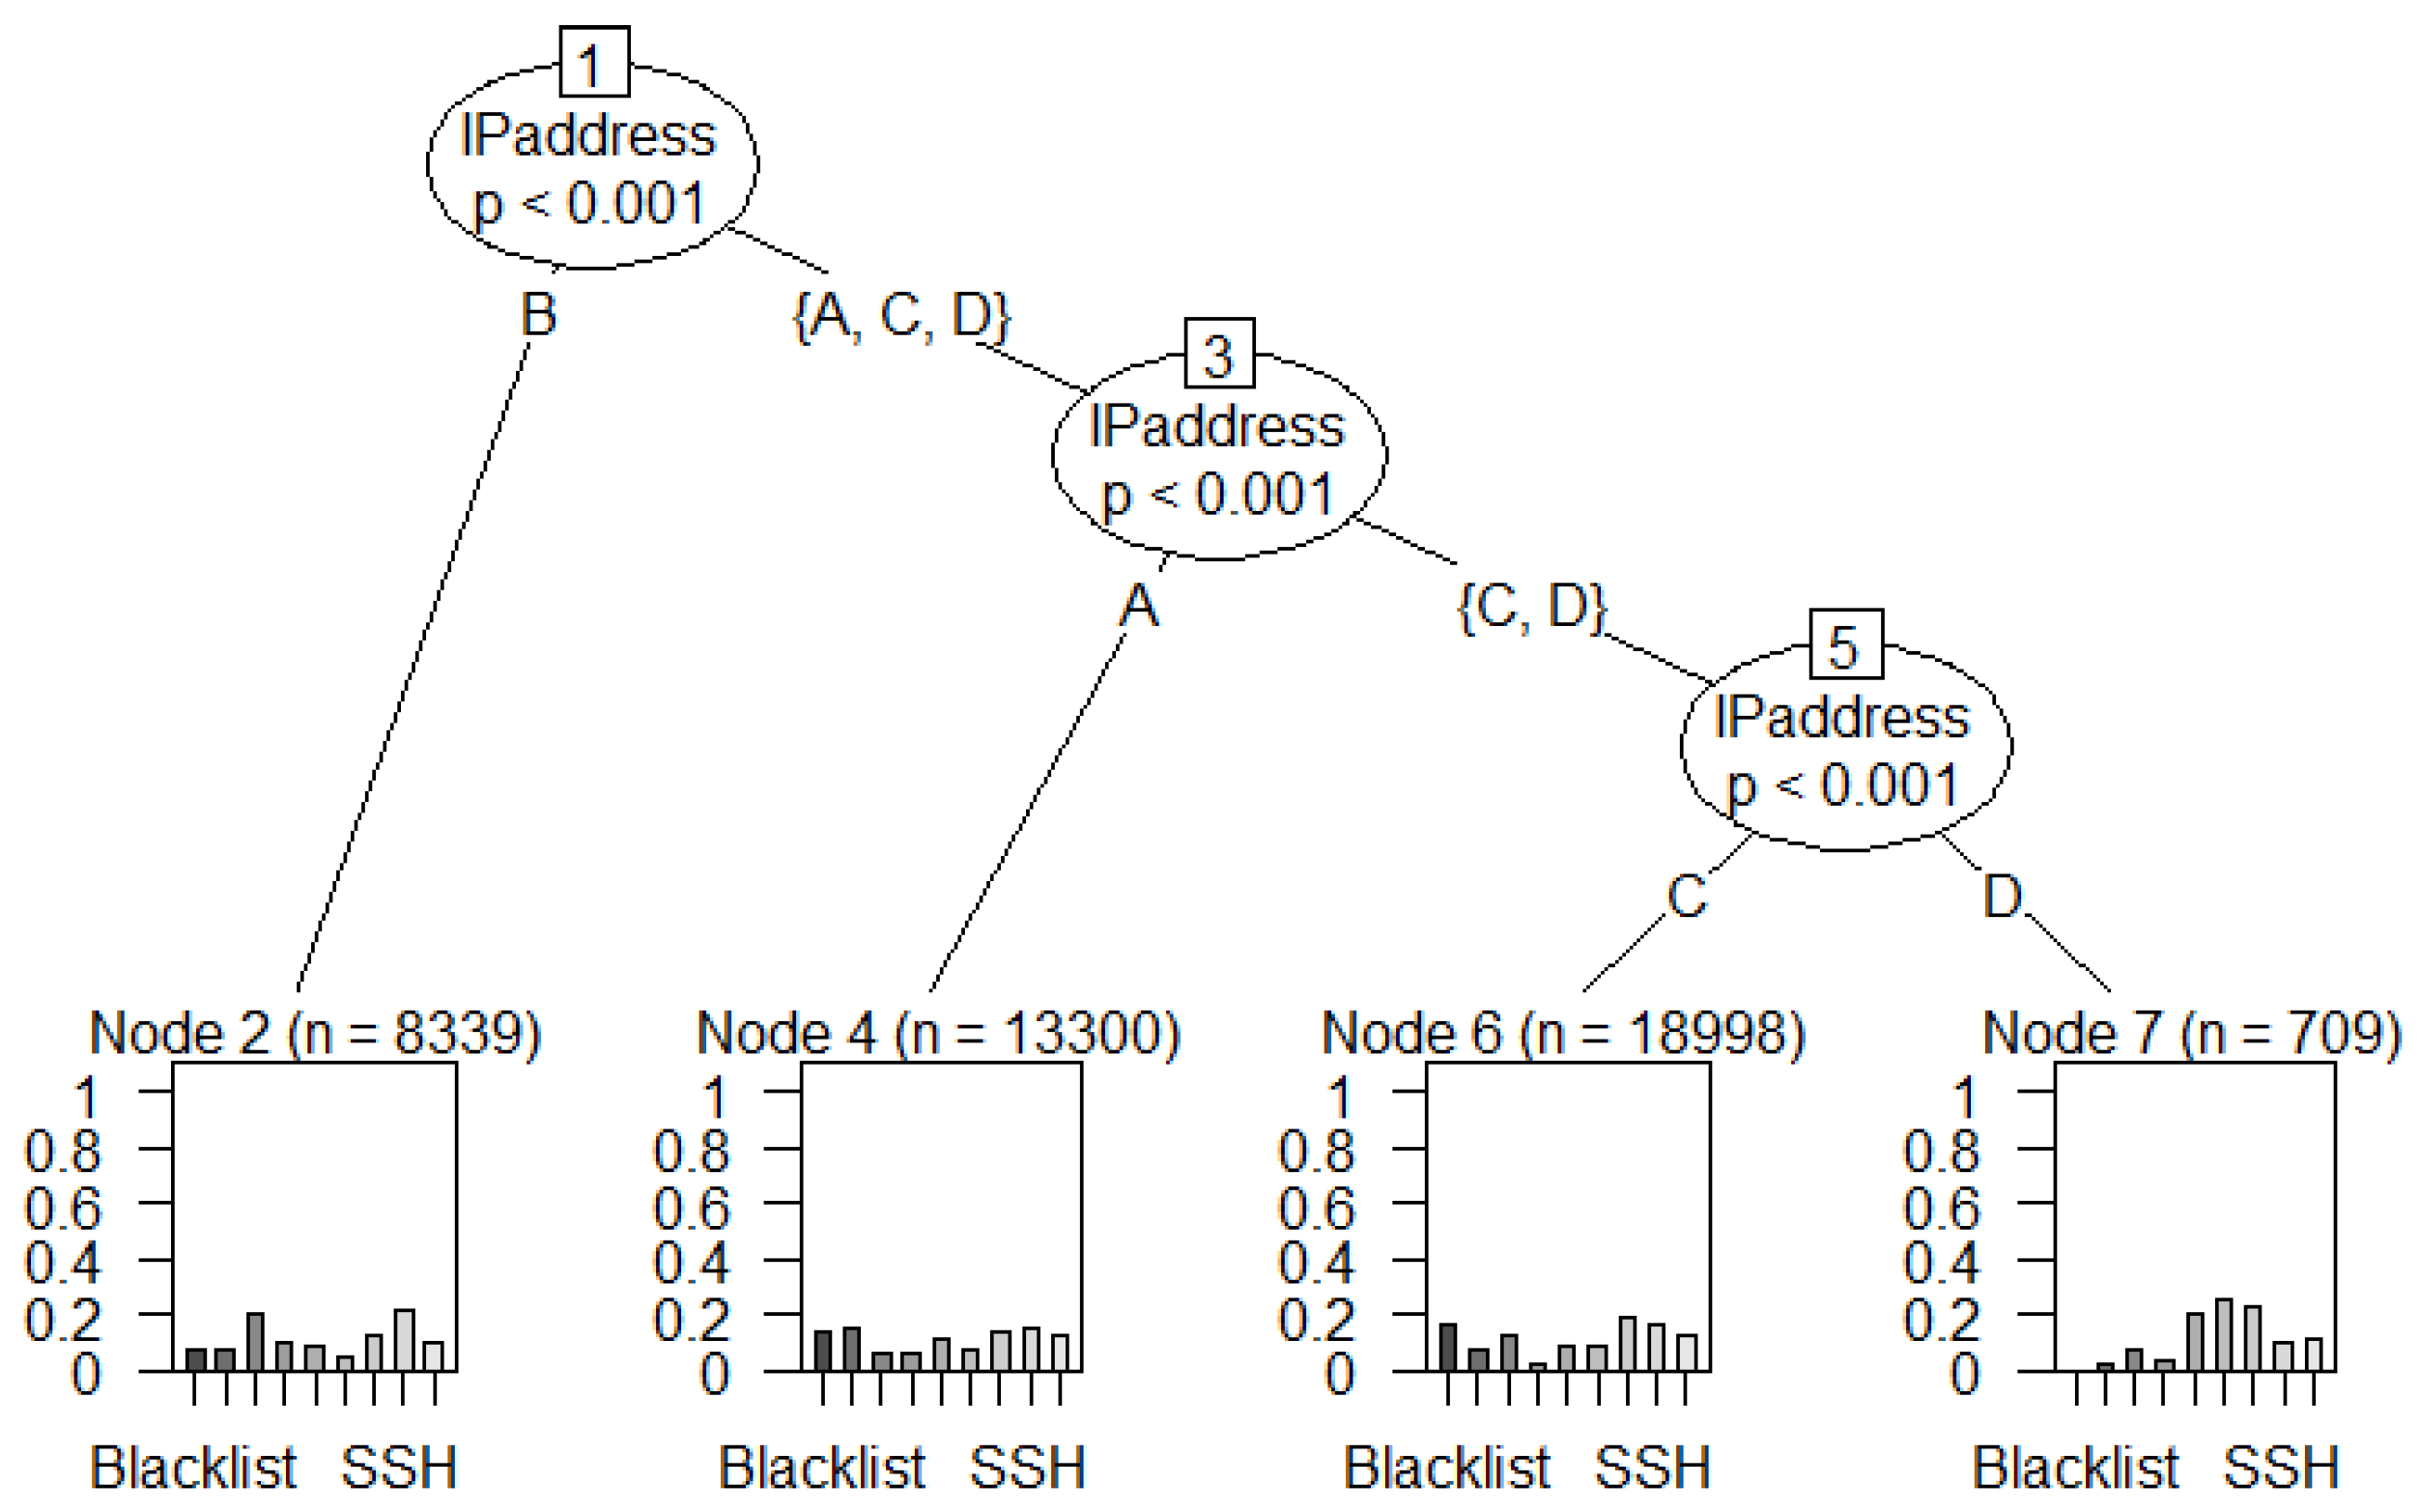
- IP addresses of class C have the highest number of features (95,508) compared to class A, B, and D.
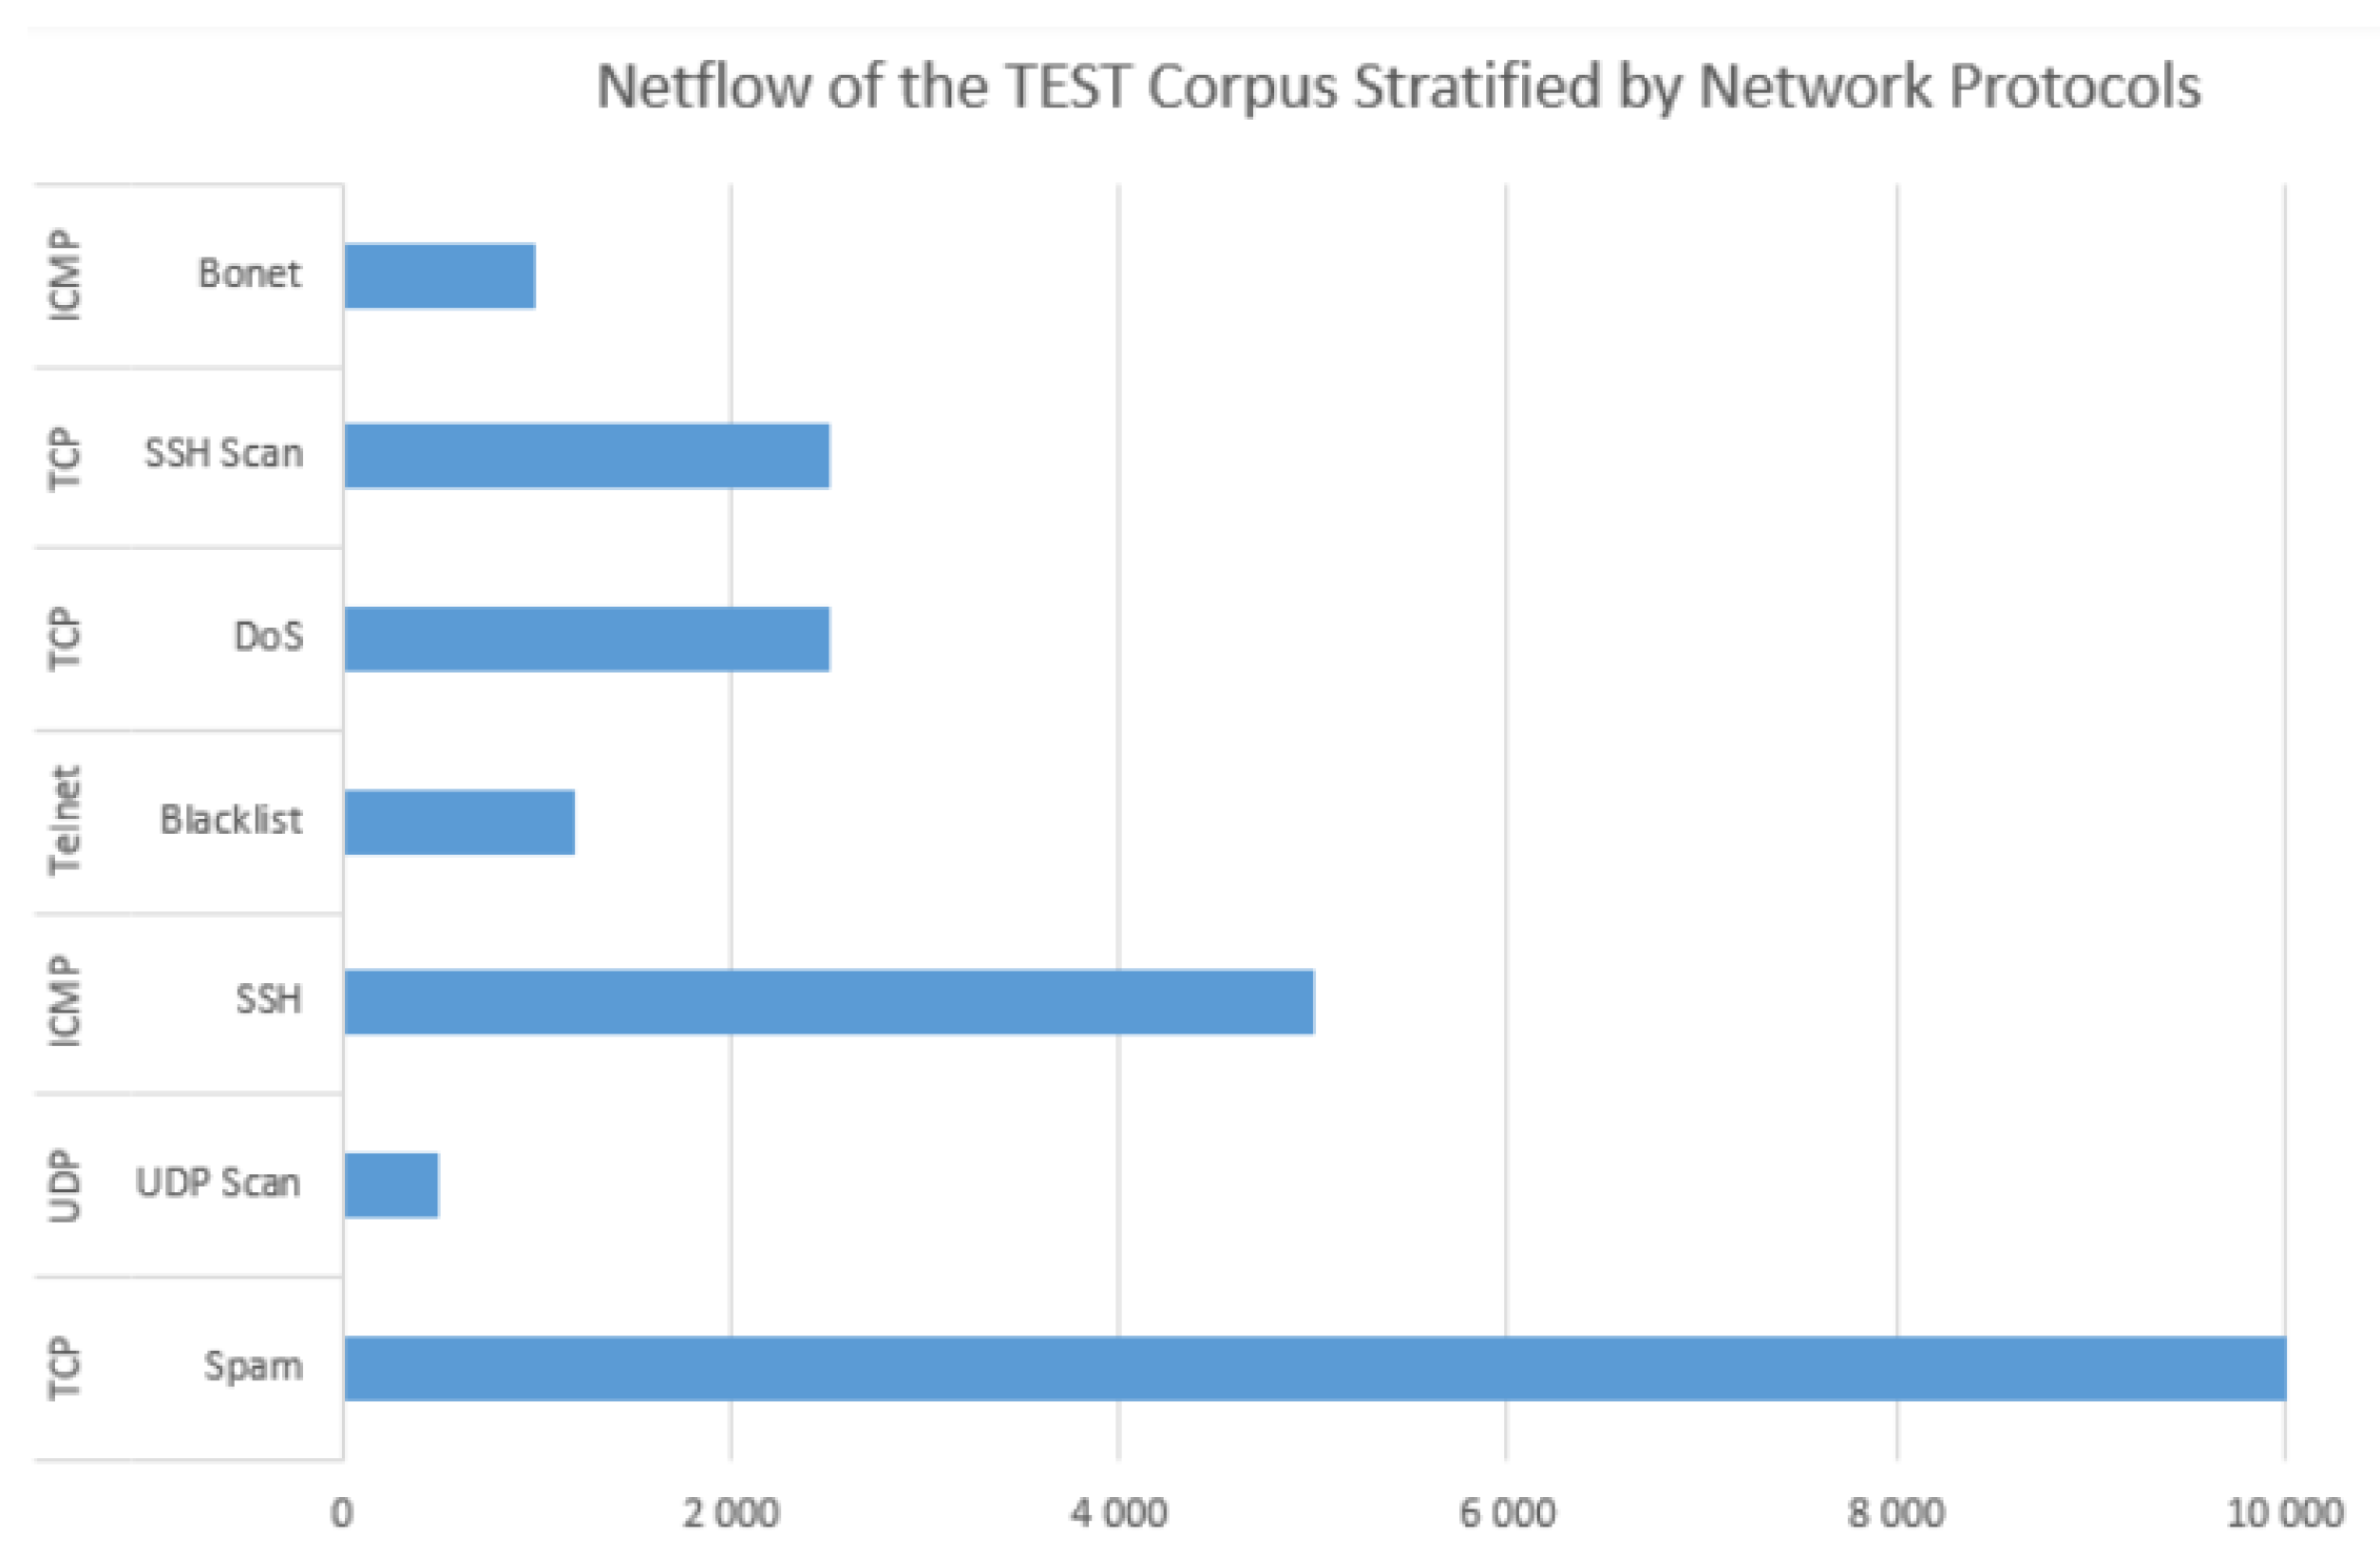
- The SSH attack has the highest number of features (34,972) compared to Spam, Blacklist, UDP Scan, DoS, and Bonet attacks.
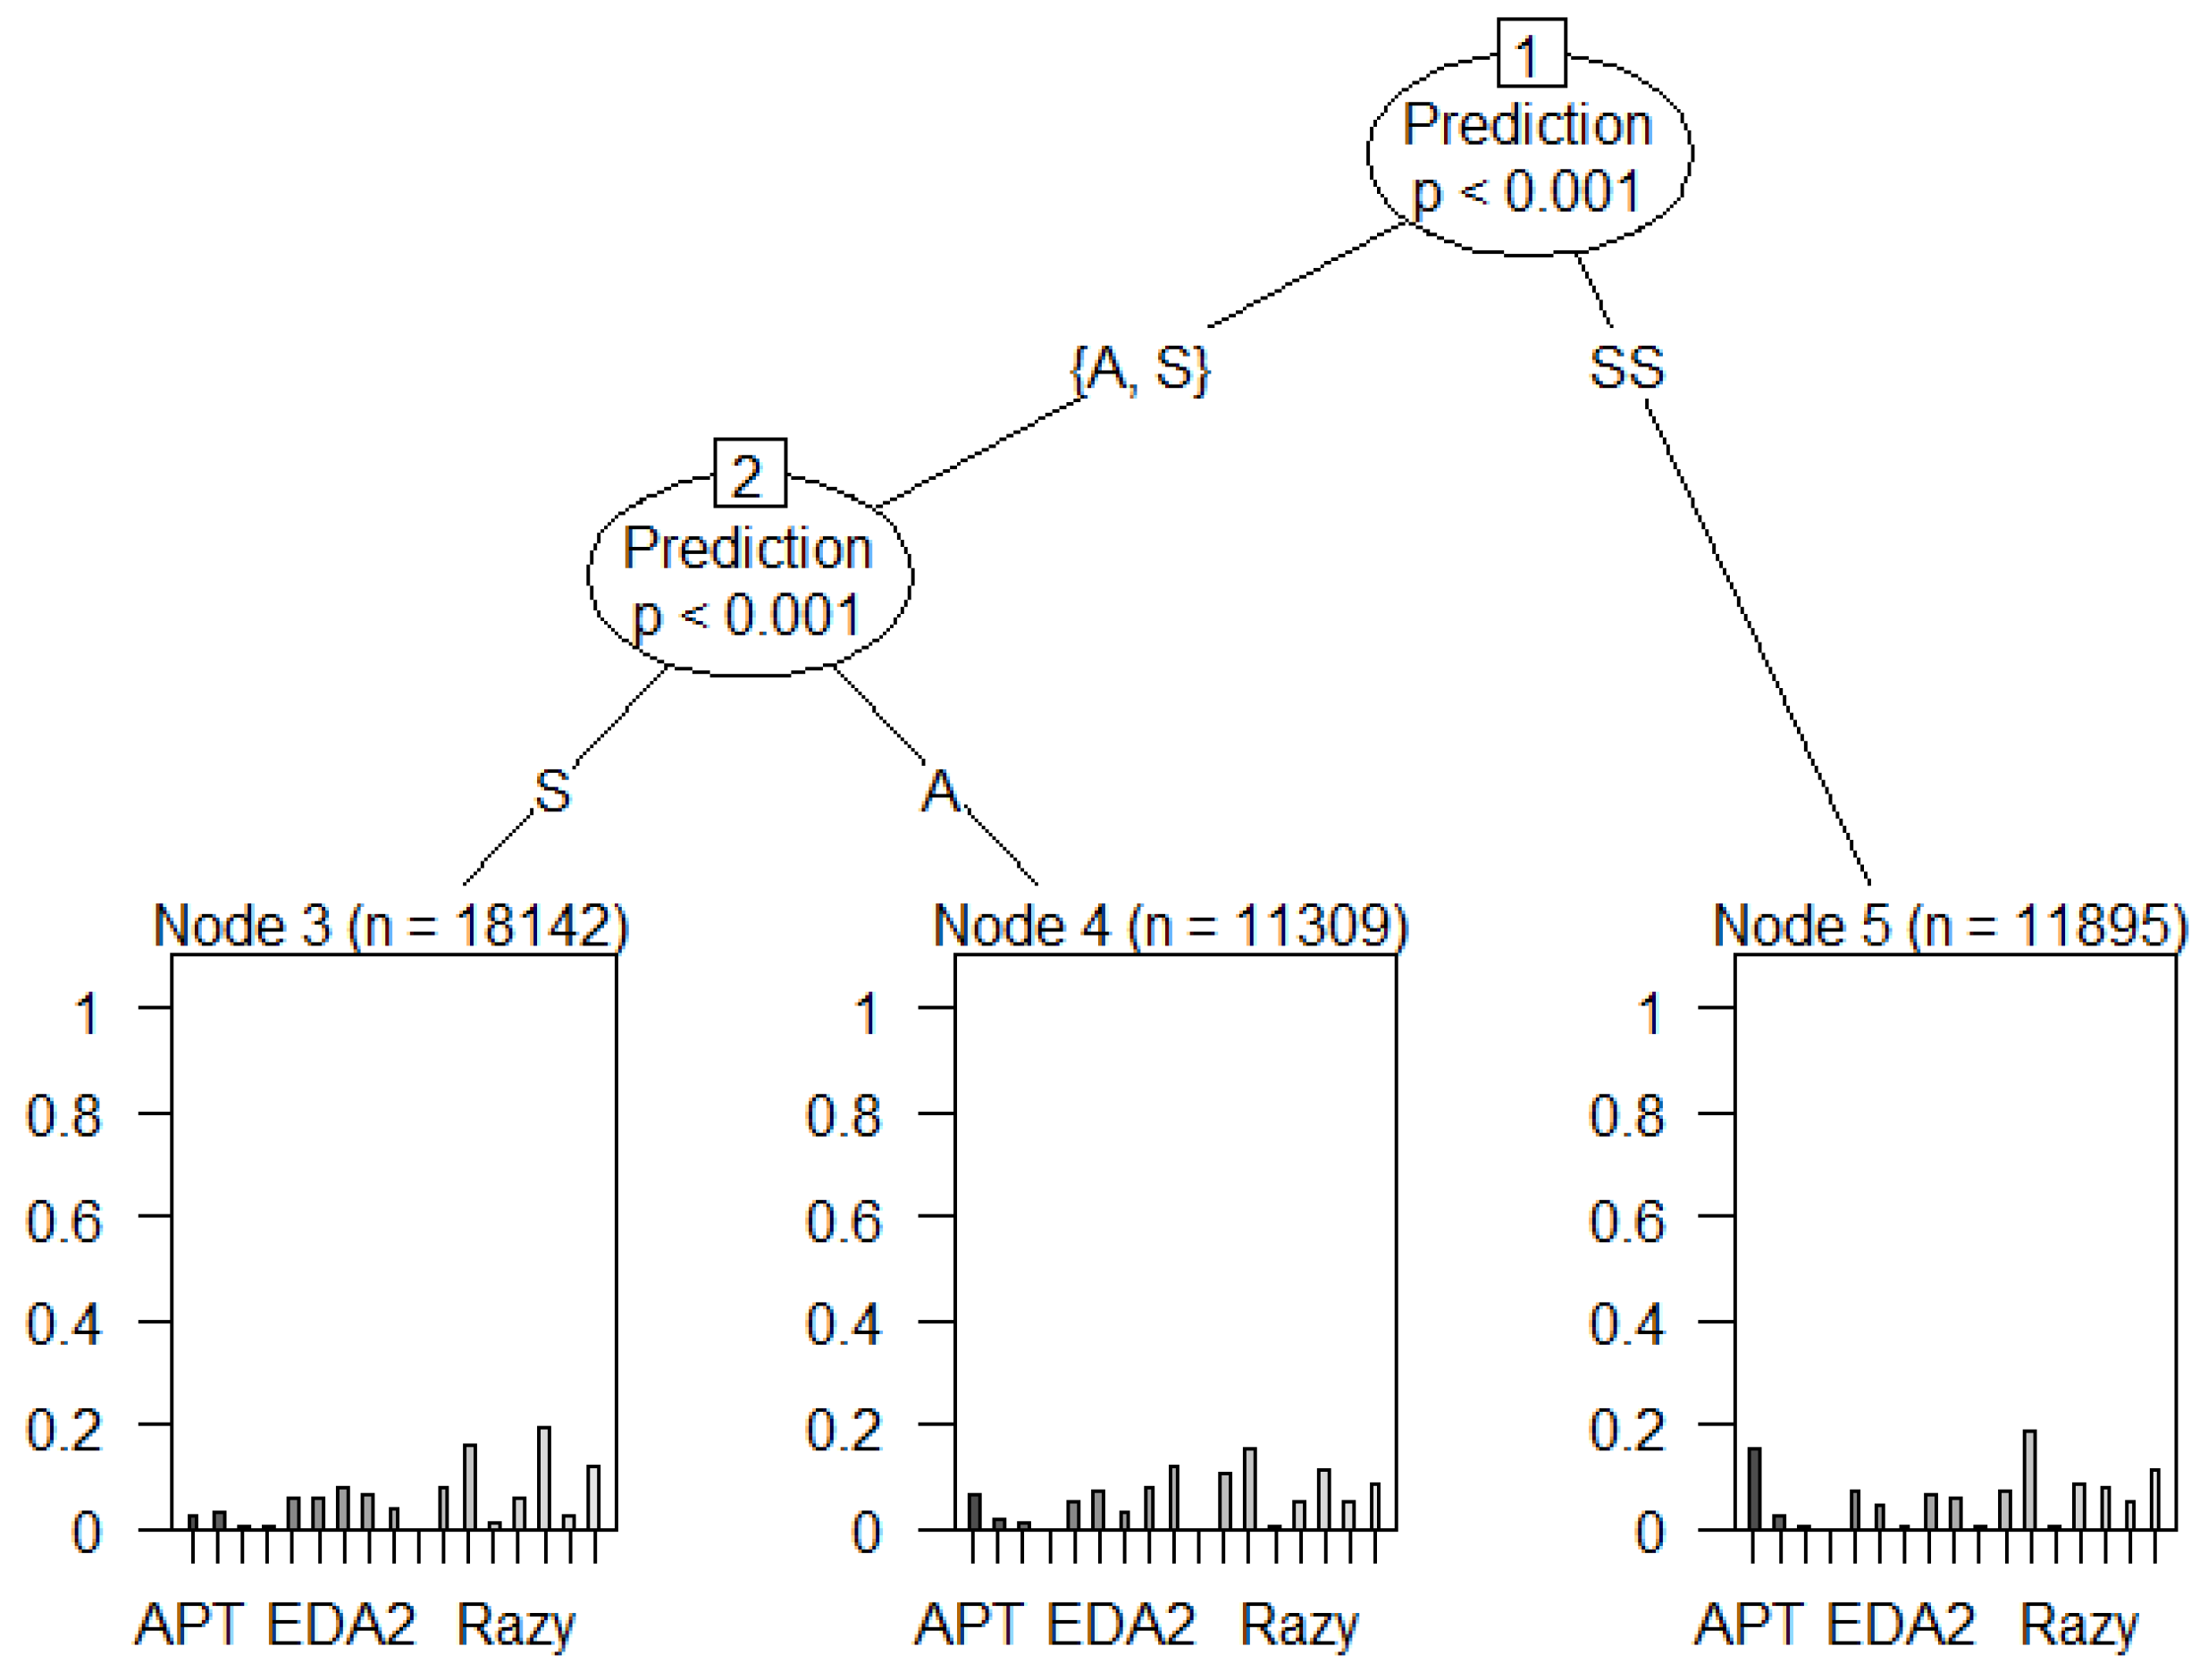
- The signature (S) attack prediction has the highest number of features (91,360) compared to the anomaly (A), and synthetic signature (SS). This can be seen in Figure 24.
3.6. The Final Construction of the UGRansome Dataset
3.7. The Balance of the UGRansome
3.8. Testing UGRansome
3.9. Evaluation of the Machine Learning Method
4. Results
4.1. Computing Environment
Results of the Ensemble Learning Algorithms
4.2. Decision Tree Results
4.3. A Deeper Comparison of the UGRansome Dataset
5. Conclusions
Author Contributions
Funding
Institutional Review Board Statement
Informed Consent Statement
Data Availability Statement
Conflicts of Interest
References
- Edwards, S. Network Intrusion Detection Systems: Important ids Network Security Vulnerabilities. White Paper Top Layer Networks, Inc. Available online: http://www.toplayer.com/pdf/WhitePapers/wp_network_intrusion_system (accessed on 16 August 2021).
- Abdelrahman, A.M.; Rodrigues, J.J.; Mahmoud, M.M.; Saleem, K.; Das, A.K.; Korotaev, V.; Kozlov, S.A. Software-defined networking security for private data center networks and clouds: Vulnerabilities, attacks, countermeasures, and solutions. Int. J. Commun. Syst. 2021, 34, e4706. [Google Scholar] [CrossRef]
- Sharafaldin, I.; Gharib, A.; Lashkari, A.H.; Ghorbani, A.A. Towards a reliable intrusion detection benchmark dataset. Softw. Netw. 2018, 2018, 177–200. [Google Scholar] [CrossRef]
- Cordero, C.G.; Vasilomanolakis, E.; Wainakh, A.; Mühlhäuser, M.; Nadjm-Tehrani, S. On generating network traffic datasets with synthetic attacks for intrusion detection. ACM Trans. Priv. Secur. 2021, 24, 1–39. [Google Scholar] [CrossRef]
- Dang, Q.V.; Vo, T.H. Studying the Reinforcement Learning techniques for the problem of intrusion detection. In Proceedings of the 2021 4th International Conference on Artificial Intelligence and Big Data (ICAIBD), Chengdu, China, 28–31 May 2021; pp. 87–91. [Google Scholar]
- Kasongo, S.M.; Sun, Y. A deep learning method with wrapper based feature extraction for wireless intrusion detection system. Comput. Secur. 2020, 92, 101752. [Google Scholar] [CrossRef]
- Otoum, Y.; Nayak, A. AS-IDS: Anomaly and Signature Based IDS for the Internet of Things. J. Netw. Syst. Manag. 2021, 29, 1–26. [Google Scholar] [CrossRef]
- Ashoor, A.S.; Gore, S. Importance of intrusion detection system (IDS). Int. J. Sci. Eng. Res. 2011, 2, 1–4. [Google Scholar]
- Hindy, H.; Brosset, D.; Bayne, E.; Seeam, A.K.; Tachtatzis, C.; Atkinson, R.; Bellekens, X. A taxonomy of network threats and the effect of current datasets on intrusion detection systems. IEEE Access 2020, 8, 104650–104675. [Google Scholar] [CrossRef]
- Kilincer, I.F.; Ertam, F.; Sengur, A. Machine learning methods for cyber security intrusion detection: Datasets and comparative study. Comput. Netw. 2021, 188, 107840. [Google Scholar] [CrossRef]
- Larriva-Novo, X.; Villagrá, V.A.; Vega-Barbas, M.; Rivera, D.; Sanz Rodrigo, M. An IoT-Focused Intrusion Detection System Approach Based on Preprocessing Characterization for Cybersecurity Datasets. Sensors 2021, 21, 656. [Google Scholar] [CrossRef]
- Mohd, N.; Singh, A.; Bhadauria, H. Intrusion Detection System Based on Hybrid Hierarchical Classifiers. Wirel. Pers. Commun. 2021, 1–28. [Google Scholar] [CrossRef]
- Panwar, S.S.; Raiwani, Y. Performance analysis of NSL-KDD dataset using classification algorithms with different feature selection algorithms and supervised filter discretization. In Intelligent Communication, Control and Devices; Springer: Singapore, 2020; pp. 497–511. [Google Scholar] [CrossRef]
- Pacheco, Y.; Sun, W. Adversarial Machine Learning: A Comparative Study on Contemporary Intrusion Detection Datasets. In Proceedings of the Information Systems Security and Privacy, Vienna, Austria, 11–13 February 2021; pp. 160–171. [Google Scholar] [CrossRef]
- Noorbehbahani, F.; Fanian, A.; Mousavi, R.; Hasannejad, H. An incremental intrusion detection system using a new semi-supervised stream classification method. Int. J. Commun. Syst. 2017, 30, e3002. [Google Scholar] [CrossRef]
- Chockwanich, N.; Visoottiviseth, V. Intrusion detection by deep learning with tensorflow. In Proceedings of the 21st International Conference on Advanced Communication Technology, PyeongChang, Korea, 17–20 February 2019; pp. 654–659. [Google Scholar] [CrossRef]
- Yavanoglu, O.; Aydos, M. A review on cyber security datasets for machine learning algorithms. In Proceedings of the 2017 IEEE International Conference on Big Data, Boston, MA, USA, 11–14 December 2017; pp. 2186–2193. [Google Scholar] [CrossRef]
- Mighan, S.N.; Kahari, M. A novel scalable intrusion detection system based on deep learning. Int. J. Inf. Secur. 2021, 20, 387–403. [Google Scholar] [CrossRef]
- Al-Hadhrami, Y.; Hussain, F.K. Real time dataset generation framework for intrusion detection systems in IoT. Future Gener. Comput. Syst. 2020, 108, 414–423. [Google Scholar] [CrossRef]
- Kasongo, S.M.; Sun, Y. Performance analysis of intrusion detection systems using a feature selection method on the UNSW-NB15 dataset. J. Big Data 2020, 7, 1–20. [Google Scholar] [CrossRef]
- Stiawan, D.; Idris, M.Y.B.; Bamhdi, A.M.; Budiarto, R. CICIDS-2017 dataset feature analysis with information gain for anomaly detection. IEEE Access 2020, 8, 132911–132921. [Google Scholar]
- Sarica, A.K.; Angin, P. A Novel SDN Dataset for Intrusion Detection in IoT Networks. In Proceedings of the 2020 16th International Conference on Network and Service Management (CNSM), Vitual Online, 2–6 November 2020; pp. 1–5. [Google Scholar] [CrossRef]
- Wang, H.; Zhang, D.; Shin, K.G. Change-point monitoring for the detection of DoS attacks. IEEE Trans. Dependable Secur. Comput. 2004, 1, 193–208. [Google Scholar] [CrossRef]
- Najafabadi, M.M.; Khoshgoftaar, T.M.; Calvert, C.; Kemp, C. Detection of ssh brute force attacks using aggregated netflow data. In Proceedings of the 2015 IEEE 14th International Conference on Machine Learning and Applications (ICMLA), Miami, FL, USA, 9–11 December 2015; pp. 283–288. [Google Scholar]
- Zaidi, R.A.; Tanveer, S. Reviewing Anatomy of Botnets and Botnet Detection Techniques. Int. J. Adv. Res. Comput. Sci. 2017, 8. [Google Scholar]
- McIntosh, T.; Kayes, A.; Chen, Y.P.P.; Ng, A.; Watters, P. Dynamic User-Centric Access Control for Detection of Ransomware Attacks. Comput. Secur. 2021, 111, 102461. [Google Scholar] [CrossRef]
- Maciá-Fernández, G.; Camacho, J.; Magán-Carrión, R.; García-Teodoro, P.; Therón, R. UGR’16: A new dataset for the evaluation of cyclostationary-based network IDSs. Comput. Secur. 2018, 73, 411–424. [Google Scholar] [CrossRef] [Green Version]
- Paquet-Clouston, M.; Haslhofer, B.; Dupont, B. Ransomware Payments in the Bitcoin Ecosystem; Oxford University Press: Oxford, UK, 2019; Volume 5, p. tyz003. [Google Scholar] [CrossRef]
- Moustafa, N.; Hu, J.; Slay, J. A holistic review of network anomaly detection systems: A comprehensive survey. J. Netw. Comput. Appl. 2019, 128, 33–55. [Google Scholar] [CrossRef]
- Oz, H.; Aris, A.; Levi, A.; Uluagac, A.S. A Survey on Ransomware: Evolution, Taxonomy, and Defense Solutions. arXiv 2021, arXiv:2102.06249. [Google Scholar]
- Kumar, P.R.; Ramlie, R.E.B.H. Anatomy of Ransomware: Attack Stages, Patterns and Handling Techniques. In International Conference on Computational Intelligence in Information System; Springer: Cham, Switzerland, 2021; pp. 205–214. [Google Scholar] [CrossRef]
- Hofstede, R.; Čeleda, P.; Sadre, R.; Sperotto, A.; Pras, A. Flow monitoring explained: From packet capture to data analysis with netflow and ipfix. IEEE Commun. Surv. Tutor. 2014, 16, 2037–2064. [Google Scholar] [CrossRef] [Green Version]
- Sahu, S.; Mehtre, B.M. Network intrusion detection system using J48 Decision Tree. In Proceedings of the 2015 International Conference on Advances in Computing, Communications and Informatics (ICACCI), Kerala, India, 10–13 August 2015; pp. 2023–2026. [Google Scholar]
- Subba, B.; Biswas, S.; Karmakar, S. Enhancing performance of anomaly based intrusion detection systems through dimensionality reduction using principal component analysis. In Proceedings of the 2016 IEEE International Conference on Advanced Networks and Telecommunications Systems (ANTS), Bangalore, India, 6–9 November 2016; pp. 1–6. [Google Scholar]
- Hajisalem, V.; Babaie, S. A hybrid intrusion detection system based on ABC-AFS algorithm for misuse and anomaly detection. Comput. Netw. 2018, 136, 37–50. [Google Scholar] [CrossRef]
- Kayacık, H.G.; Zincir-Heywood, N. Analysis of three intrusion detection system benchmark datasets using machine learning algorithms. In International Conference on Intelligence and Security Informatics; Springer: Berlin/Heidelberg, Germany, 2005; pp. 362–367. [Google Scholar] [CrossRef]
- Parsazad, S.; Saboori, E.; Allahyar, A. Fast feature reduction in intrusion detection datasets. In Proceedings of the 35th International Convention MIPRO, Opatija, Croatia, 21–25 May 2012; pp. 1023–1029. [Google Scholar]
- Khammassi, C.; Krichen, S. A GA-LR wrapper approach for feature selection in network intrusion detection. Comput. Secur. 2017, 70, 255–277. [Google Scholar] [CrossRef]
- Moustafa, N.; Slay, J.; Creech, G. Novel geometric area analysis technique for anomaly detection using trapezoidal area estimation on large-scale networks. IEEE Trans. Big Data 2017, 5, 481–494. [Google Scholar] [CrossRef]
- Wang, C.R.; Xu, R.F.; Lee, S.J.; Lee, C.H. Network intrusion detection using equality constrained-optimization-based extreme learning machines. Knowl.-Based Syst. 2018, 147, 68–80. [Google Scholar] [CrossRef]
- Raman, M.G.; Somu, N.; Jagarapu, S.; Manghnani, T.; Selvam, T.; Krithivasan, K.; Sriram, V.S. An efficient intrusion detection technique based on support vector machine and improved binary gravitational search algorithm. Artif. Intell. Rev. 2019, 53, 3255–3286. [Google Scholar] [CrossRef]
- Panigrahi, R.; Borah, S. A detailed analysis of CICIDS2017 dataset for designing Intrusion Detection Systems. Int. J. Eng. Technol. 2018, 7, 479–482. [Google Scholar]
- Ranga, V. On Evaluation of Network Intrusion Detection Systems: Statistical Analysis of CIDDS-001 Dataset Using Machine Learning Techniques; Universiti Putra Malaysia Press: Serdang, Selangor, Malaysia, 2018; pp. 1–35. [Google Scholar]
- Carrasco, R.S.M.; Sicilia, M.A. Unsupervised intrusion detection through skip-gram models of network behavior. Comput. Secur. 2018, 78, 187–197. [Google Scholar] [CrossRef]
- Cepheli, Ö.; Büyükçorak, S.; Karabulut Kurt, G. Hybrid intrusion detection system for ddos attacks. J. Electr. Comput. Eng. 2016. [Google Scholar] [CrossRef] [Green Version]
- Lee, J.; Park, K. GAN-based imbalanced data intrusion detection system. Pers. Ubiquitous Comput. 2019, 1–8. [Google Scholar] [CrossRef]
- Balasaraswathi, V.R.; Sugumaran, M.; Hamid, Y. Feature selection techniques for intrusion detection using non-bio-inspired and bio-inspired optimization algorithms. J. Commun. Inf. Netw. 2017, 2, 107–119. [Google Scholar] [CrossRef] [Green Version]
- Mehmod, T.; Rais, H.B.M. Ant colony optimization and feature selection for intrusion detection. In Advances in Machine Learning and Signal Processing; Springer: Cham, Switzerland, 2016; pp. 305–312. [Google Scholar] [CrossRef]
- Rampure, V.; Tiwari, A. A rough set based feature selection on KDD CUP 99 data set. Int. J. Database Theory Appl. 2015, 8, 149–156. [Google Scholar] [CrossRef]
- Janarthanan, T.; Zargari, S. Feature selection in UNSW-NB15 and KDDCUP’99 datasets. In Proceedings of the 2017 IEEE 26th International Symposium on Industrial Electronics (ISIE), Edinburgh, UK, 19–21 June 2017; pp. 1881–1886. [Google Scholar] [CrossRef]
- Dang, Q.V. Studying machine learning techniques for intrusion detection systems. In International Conference on Future Data and Security Engineering; Springer: Cham, Switzerland, 2019; pp. 411–426. [Google Scholar]
- Meira, J.; Andrade, R.; Praça, I.; Carneiro, J.; Bolón-Canedo, V.; Alonso-Betanzos, A.; Marreiros, G. Performance evaluation of unsupervised techniques in cyber-attack anomaly detection. J. Ambient. Intell. Humaniz. Comput. 2020, 11, 4477–4489. [Google Scholar] [CrossRef]
- Ahmad, A.; Harjula, E.; Ylianttila, M.; Ahmad, I. Evaluation of machine learning techniques for security in SDN. In Proceedings of the 2020 IEEE Globecom Workshops, Virtual Online, 7–11 December 2020; pp. 1–6. [Google Scholar] [CrossRef]
- Maseer, Z.K.; Yusof, R.; Bahaman, N.; Mostafa, S.A.; Foozy, C.F.M. Benchmarking of machine learning for anomaly based intrusion detection systems in the CICIDS2017 dataset. IEEE Access 2021, 9, 22351–22370. [Google Scholar] [CrossRef]
- Azeez, N.A.; Odufuwa, O.E.; Misra, S.; Oluranti, J.; Damaševičius, R. Windows PE Malware Detection Using Ensemble Learning. Informatics 2021, 8, 10. [Google Scholar] [CrossRef]
- Aljawarneh, S.; Aldwairi, M.; Yassein, M.B. Anomaly-based intrusion detection system through feature selection analysis and building hybrid efficient model. J. Comput. Sci. 2018, 25, 152–160. [Google Scholar] [CrossRef]
- Cvitić, I.; Peraković, D.; Periša, M.; Husnjak, S. An overview of distributed denial of service traffic detection approaches. Promet-Traffic Transp. 2019, 31, 453–464. [Google Scholar] [CrossRef]
- HaddadPajouh, H.; Khayami, R.; Dehghantanha, A.; Choo, K.K.R.; Parizi, R.M. AI4SAFE-IoT: An AI-powered secure architecture for edge layer of Internet of things. Neural Comput. Appl. 2020, 32, 16119–16133. [Google Scholar] [CrossRef]
- Cvitić, I.; Peraković, D.; Gupta, B.; Choo, K.K.R. Boosting-based DDoS Detection in Internet of Things Systems. IEEE Internet Things J. 2021. [Google Scholar] [CrossRef]
- Cvitić, I.; Peraković, D.; Periša, M.; Gupta, B. Ensemble machine learning approach for classification of IoT devices in smart home. Int. J. Mach. Learn. Cybern. 2021, 1–24. [Google Scholar] [CrossRef]
- He, H.; Garcia, E.A. Learning from imbalanced data. IEEE Trans. Knowl. Data Eng. 2009, 21, 1263–1284. [Google Scholar] [CrossRef]


| Name | Dataset Type | Disadvantage |
|---|---|---|
| Sperotto [15] | Netflow | A single host extracted features. |
| MAWI working lab [16] | Tcpdump | False Alarms generation. |
| CTU-13 [17] | Tracing flow | Short netflow. |
| UNB ISCX [18] | Netflow | Limited to Windows XP. |
| ADFA-LD12 [19] | IDS | Limited to normal tracing. |
| UNSW-NB15 [20] | Tcpdump & netflow | Uncorrelated synthetic netflow. |
| CICIDS [21] | Netflow | Lack of triangulated features. |
| SDN [22] | Static & dynamic IoT | Limited to SDN & IoT. |
| Features | Description |
|---|---|
| Protocol | Communication rules. |
| Flag | Netflow states. |
| Forwarding status | The states of outgoing netflow. |
| Type of service | A service provided by a netflow. |
| Packet exchanged | The packets exchanged between hosts. |
| Port | Communication endpoints between hosts. |
| IP address | Unique string that identifies each host. |
| Duration | Netflow duration. |
| Timestamp | Netflow termination. |
| References | Drawbacks |
|---|---|
| [3] | The time complexity was not considered. |
| [51] | Lack of robust validation methods. |
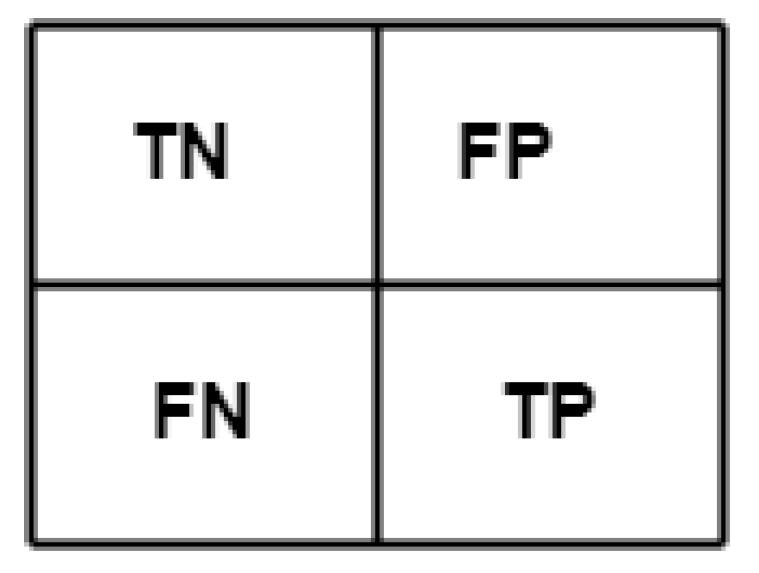
| [52] | The confusion matrix was not considered. |
| [53] | Binary stratification was considered without confusion matrix. |
| [54] | The time complexity and confusion matrix are not considered. |
| Filename | Period | Week | Size | Features | Status |
|---|---|---|---|---|---|
| Spam | May | 3 | 32,358 KB | Spam malware | Normal attack |
| Scan 44 | August | 2 | 2020 KB | Scan malware | Normal attack |
| Scan 11 | August | 2 | 527 KB | Scan malware | Normal attack |
| Bonet | July | 5 | 5284 KB | Bonet malware | Normal attack |
| Blacklist | May | 4 | 37,962 KB | Blacklist malware | Normal attack |
| File | Rows | Variables | Relevant Feature | Total |
|---|---|---|---|---|
| Blacklist | 3,311,559 | 13 | Timestamp | 2761 |
| Spam | 203,693 | 13 | IP address | 377,425 |
| Scan 44 | 547,468 | 13 | TCP | 3,311,559 |
| Scan 11 | 140,541 | 13 | Flag | 2,087,293 |
| Bonet | 607,036 | 13 | Date | 2759 |
| Ransomware | Cluster | Total | Status |
|---|---|---|---|
| Locky | 1 | 27,423 | Abnormal |
| CryptXXX | 2 | 352 | Abnormal |
| CryptoLocker20 | 3 | 124 | Abnormal |
| CryptoLocker | 5 | 40 | Abnormal |
| DMALocker | 6 | 22 | Abnormal |
| Others | None | 71 | - |
| Column | Attribute | Example | Format |
|---|---|---|---|
| 1 | Prediction | SS | Categorical |
| 2 | Ransomware | EDA2 | Categorical |
| 3 | Bitcoins (BTC) | 60 BTC | Numeric |
| 4 | Dollars (USD) | 400 USD | Numeric |
| 5 | Cluster | 1 | Numeric |
| 6 | Seed Address | 1dice6yg | Categorical |
| 7 | Expended Address | 4ePEyKtk | Categorical |
| 8 | Port | 5062 | Numeric |
| 9 | Malware | SSH | Categorical |
| 10 | Network traffic | 918,919,000 bytes | Numeric |
| 11 | IP address | Class A | Categorical |
| 12 | Flag | AF | Categorical |
| 13 | Protocol | TCP | Categorical |
| 14 | Timestamp | 40 s | Numeric |
| Abnormal Attack | Normal Attack | Prediction | Labelled |
|---|---|---|---|
| Locky | DoS | SS | Synthetic Signature |
| APT | DoS | SS | Synthetic Signature |
| WannaCry | Bonet | SS | Synthetic Signature |
| Flyper | Nerisbonet | SS | Synthetic Signature |
| TowerWeb | Spam | A | Anomaly |
| SamSam | Spam | A | Anomaly |
| JigSaw | Scan | A | Anomaly |
| CryptoLocker types | Blacklist | S | Signature |
| Globe | UDP Scan | A | Anomaly |
| DMALocker | Port Scanning | A | Anomaly |
| A | S | SS | Error | |
|---|---|---|---|---|
| A | 49,884 | 389 | 166 | 0.011003390 |
| S | 648 | 80,490 | 265 | 0.011215803 |
| SS | 84 | 182 | 52,830 | 0.005009794 |
| A | S | SS | |
|---|---|---|---|
| A | 50,633 | 465 | 16 |
| S | 254 | 81,602 | 114 |
| SS | 51 | 157 | 53,488 |
| A | S | SS | |
|---|---|---|---|
| A | 99.06 | 0.91 | 0.03 |
| S | 0.31 | 99.55 | 0.14 |
| SS | 0.09 | 0.29 | 99.61 |
| Dataset | Random Forest | Decision Tree | Final Ensemble Learning |
|---|---|---|---|
| KDD99 | 99% | 99% | 99% |
| NSL-KDD | 100% | 98% | 100% |
| UGRansome | 99% | 44% | 99% |
| Research | Algorithms | Accuracy | Dataset |
|---|---|---|---|
| [56] | RandomTree & DecisionStump | 99% | NSL-KDD |
| [57] | Network traffic anomalies detection | 99% | Legacy datasets |
| [58] | AI4SAFE-IoT | 100% | IOT |
| [59] | Boosting method of logistic model trees | 99% | DDoS traffic |
| [60] | Logistic Regression | 99% | IOT & Netflow |
Publisher’s Note: MDPI stays neutral with regard to jurisdictional claims in published maps and institutional affiliations. |
© 2021 by the authors. Licensee MDPI, Basel, Switzerland. This article is an open access article distributed under the terms and conditions of the Creative Commons Attribution (CC BY) license (https://creativecommons.org/licenses/by/4.0/).
Share and Cite
Nkongolo, M.; van Deventer, J.P.; Kasongo, S.M. UGRansome1819: A Novel Dataset for Anomaly Detection and Zero-Day Threats. Information 2021, 12, 405. https://doi.org/10.3390/info12100405
Nkongolo M, van Deventer JP, Kasongo SM. UGRansome1819: A Novel Dataset for Anomaly Detection and Zero-Day Threats. Information. 2021; 12(10):405. https://doi.org/10.3390/info12100405
Chicago/Turabian StyleNkongolo, Mike, Jacobus Philippus van Deventer, and Sydney Mambwe Kasongo. 2021. "UGRansome1819: A Novel Dataset for Anomaly Detection and Zero-Day Threats" Information 12, no. 10: 405. https://doi.org/10.3390/info12100405
APA StyleNkongolo, M., van Deventer, J. P., & Kasongo, S. M. (2021). UGRansome1819: A Novel Dataset for Anomaly Detection and Zero-Day Threats. Information, 12(10), 405. https://doi.org/10.3390/info12100405