1. Introduction
The exploration results of marine mineral resources continuously prove its promising development [
1,
2]. Many developed countries in the world have incorporated deep-sea resource development into their national development strategies. So far, only KSB of Germany, Ebara of Japan, India, and China have a preliminary grasp of manufacturing technology of deep-sea multi-stage centrifugal pumps [
3,
4]. Nautilus has received the world’s first international license to develop an undersea mine in 2009 [
5]. China, the UK, Japan, and other countries have obtained the global exclusive mining area authorization contract involving three different mineral resources. It is worth mentioning that China has the most seabed mineral species and the most mining areas [
6,
7]. In the exploitation of marine mineral resources, a multi-stage centrifugal pump, as a vital component of the hydraulic transport system, directly impacts the life and efficiency of the hydraulic mining deep-sea lifting system [
8].
In exploring centrifugal pumps, the computational fluid dynamic method (CFD) has been widely adopted as an effective method for the simulation of pumps in clear water conditions [
9,
10,
11,
12]. However, the CFD method can only calculate the characteristics of the fluid. The DPM solves the problem of the dynamics of small particles in the liquid. Still, this model ignores the volume of the particle and reduces the particle to a Lagrangian mass point and particle-to-particle collisions are completely ignored [
13]; therefore, it does not apply to large diameter particle dynamics [
14]. The discrete element method (DEM) based on the Lagrangian approach was proposed by Cundall [
15], which had been widely used in multiphase simulation in many areas for particle dynamics [
16,
17,
18]. DEM is realized by the soft spheres approach, the particle-to-particle collisions and particle volume fractions are taken into calculation.
The coupling of CFD and DEM calculations allows the fluid and particle characteristics of solid–liquid two-phase flows to be obtained very accurately, which is very useful in slurry conveying simulation. Chen [
19] used the CFD-DEM coupling method to simulate the working conditions of horizontal pipelines conveying different shapes of particles and different concentrations to obtain the relationship between the influence of particle characteristics on slurry conveying efficiency and flow characteristics. Cheng [
19] used the CFD-DEM coupling method to analyze the contact forces and particle velocity characteristics of non-spherical particles of different shapes and spherical particles of different particle sizes with a single-channel centrifugal pump.
In terms of experimental research, Choi et al. [
20,
21,
22] used laboratory models to conduct experimental research in hydraulic performance studies and proposed some design methods to improve pump efficiency and head. However, it is rare to find a six-stage centrifugal pump designed and manufactured on such a large scale for deep-sea mineral development, and there are hardly any large-flow slurry transfer tests.
This paper will investigate the hydrodynamic and coarse particle kinetic behavior of the pump in slurry transfer from two aspects: a large-scale slurry test study and coupled CFD-DEM simulation. A six-stage centrifugal pump suitable for actual marine mining tests work was built, and a large-scale land laboratory was constructed and modified; slurry transfer tests were carried out at flow rates over 400 m3/h. CFD-DEM was used as the simulation method, and other rich data were analyzed after validation with the test data.
2. Structure of Six-Stage Centrifugal Pump
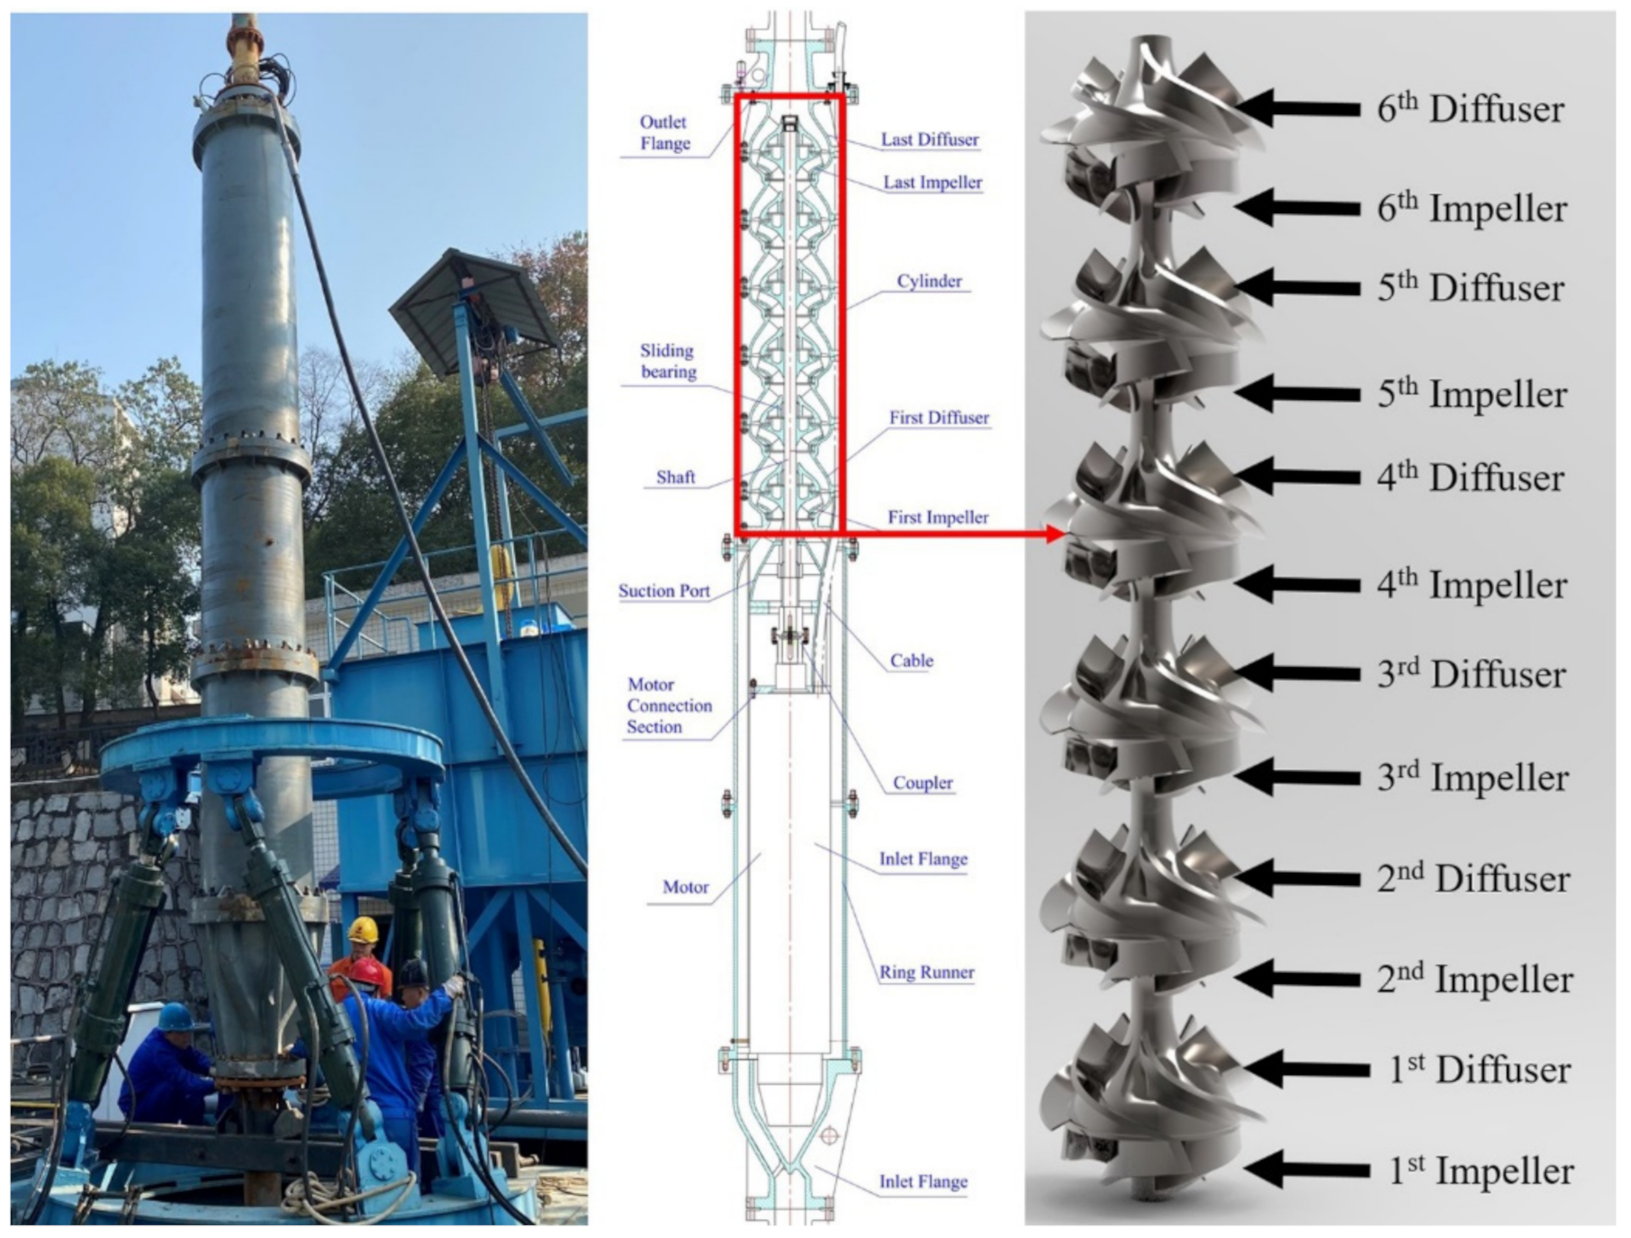
The research object is a six-stage centrifugal pump designed by Central South University for a deep-sea mining lifting system, which is shown in
Figure 1. The pump design adopted the increased flow design method and equal power design principle, whose rated power was 680 kW, rated flow rate was 420 m
3/h and rated rotational speed was 1450 rpm. The rated head was 270 m and the efficiency underrated conditions was 52%.
2.1. Design Parameters and Principles
Six-stage centrifugal pumps are used as conveying components in deep-sea mining lifting systems and transfer slurries containing large quantities of coarse particles. To ensure that polymetallic coarse particles can pass through the pump without blockage in the pump, the flow path cross-section of components in the main flow path needs to be large enough in cross-section. The pump is designed to pass a maximum of 20 mm coarse particles and the minimum flow channel size is found in the impeller outlet width, which is designed to be 60 mm according to the wide flow channel design guideline and amplified flow design method, which is three times the maximum overflow coarse particle diameter and has good coarse particle pass-through capability. The impeller outlet width can only be increased to 60 mm by enlarging the design flow rate from 420 m
3/h to 720 m
3/h. To ensure that flow fluctuations do not bring about excessive electrical load fluctuations, the pumps are designed with equal power to avoid power fluctuations. Some important design parameters are shown in
Table 1.
2.2. Impeller and Diffuser
The flow channel section of the impeller should change smoothly, and the flow velocity change should be uniform. At the same time, the design of the impeller also needs to consider: energy conversion capacity, pass flow and return flow capacity, and distortion degree. The diffuser design needs to be combined with the design of the pump body structure, considering the structure, flow velocity variation, return capacity, and axial scramble. Some key parameters of the impeller and diffuser are shown in
Table 2.
The shaft profile of the pump is shown in
Figure 2, and the colored area is the main flow path of the pump, which is the computational domain in this study.
3. Methodology
The six-stage centrifugal pump in mining operations works installed in a water depth of more than one kilometer, and it is impossible to cavitate in that condition. Therefore, the following basic assumptions are proposed: the particles are spherical, there is no fragmentation or degradation in the pump, there is no phase change in the pump, and temperature changes are ignored.
3.1. Governing Equation
The fluid is considered as a continuous phase and solved in Fluent, which is governed by the continuity equation and momentum of the Navier–Stokes equation [
23], viscous incompressible fluid in the inertial reference frame is described as follows [
24]:
where
is the static pressure;
and
are the velocity vector and the density;
is the outside force which comes from wall and particles;
is the stress tensor (described below):
is the unit tensor, is dynamic viscosity, and the second term on the right-hand side is the effect of volume dilation.
The RNG
turbulence model is derived from the instantaneous N-S equations by the “Renormalization Group” mathematical method [
25]. The turbulent kinetic energy
equation is:
where,
;
,
,
,
,
,
,
,
,
[
26].
is the generation of turbulence kinetic energy caused by mean velocity gradients, while
is that generated by buoyancy, which is 0 for zero temperature gradient field;
is the contribution of the fluctuating dilatation incompressible turbulence to the overall dissipation rate;
is the inverse effective Prandtl numbers for
, while
is that for
;
and
are user-defined source terms.
DEM is realized by the softball approach, the particles are evaluated by Newton’s law of translational and rotational motion [
15]:
where
and
are the mass and moment of the particle
;
and
are the translational and rotational velocity of the particle
;
is the net torque.
and
are the normal and tangential contact forces between particle
and particle
;
is the contact forces of wall-to-particle
;
is the lift force due to fluid shear;
is the lift force due to the rotation of particles in the flow field;
is the Gravitational force;
is interaction force between the particle and fluid, including pressure gradient force and fluid drag force
, where it is [
2,
27]
where
is the local density of fluid;
is the mean diameter of contacting particles;
is the local velocity of the liquid;
is the Reynold’s number.
As there might be more than one particle contacting particle
simultaneously,
is the total force from contacting particles. In the Hertz-Mindlin (no-slip) model [
28], for particles of the same diameter and material, the following applies:
Where
is the equivalent Young’s modulus;
is the diameter of particles;
is the equivalent Shear modulus;
is the normal overlap distance between particles;
is the tangential component of relative velocity between contacting particles [
29,
30].
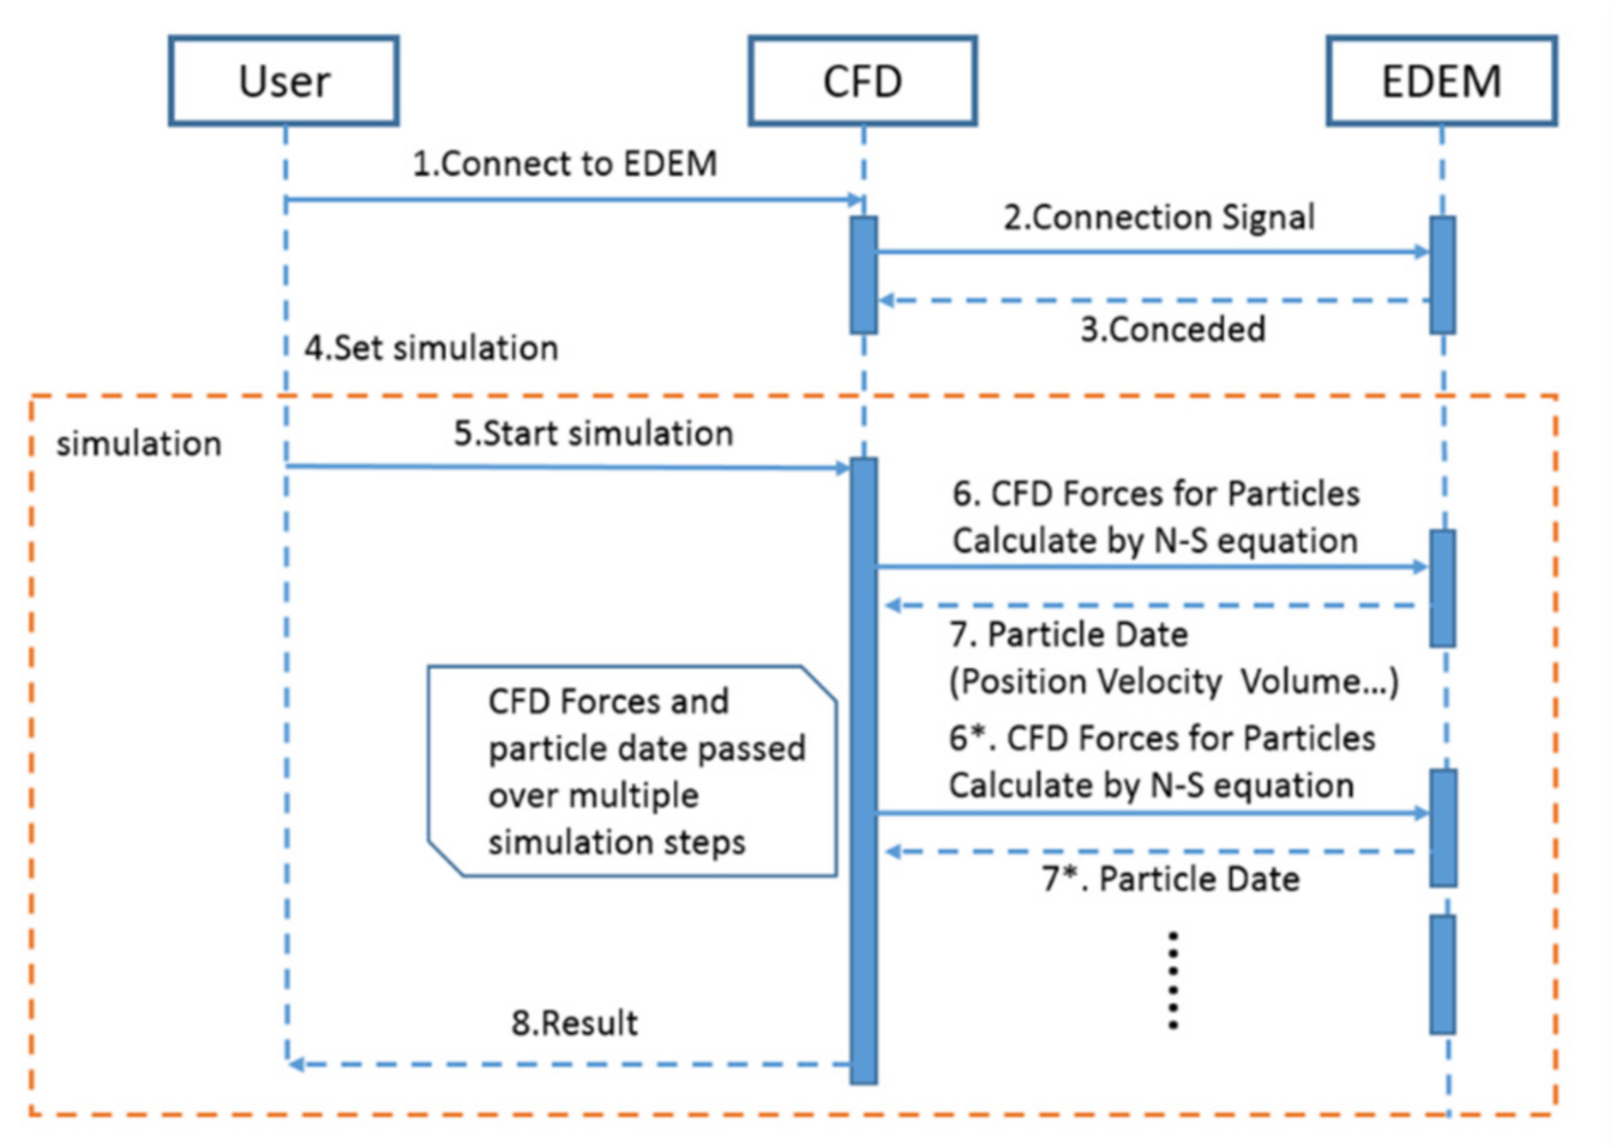
3.2. CFD-DEM Coupling Method
The CFD-DEM coupling is based on the Euler–Lagrange method and was realized on FLUENT-EDEM platforms. The flow field information of the fluid in the computational domain is firstly calculated in Fluent within a time step. When the convergence condition is reached, the drag and lift force of the particles will be calculated and the information will be transmitted to EDEM. EDEM will calculate the position, velocity, volume and other information of the particles and then transfer it back to Fluent. The theory of the coupling method is shown in
Figure 3. In this way, the information of particles and flow field in the next time step is circularly updated.
The particles were set to be spherical with a density of 1910 kg/m
3 and a fixed diameter of 10 mm, consistent with the properties of the clay-fired simulated nodule particles used in the slurry conveying experiment. The material of the impeller and diffuser of the multi-stage centrifugal pump and other over-flow components is duplex stainless steel with a density of 7850 kg/m
3, a Poisson’s ratio of 0.33, and a shear modulus of
. The particles’ contact forces are calculated by the Hertz–Mindlin (no-slip) model. The Saffman and Magnus lift models are adopted for the lift model, and the particle–particle and particle–pump interaction settings are shown in
Table 3.
3.3. Computational Settings
Given the consistency of EDEM and Fluent data at the inlet and outlet would facilitate stabilization and convergence, predefined pressure outlet and velocity inlet are preferably used as boundary conditions for Fluent data. The particle factory of EDEM is set to an unlimited number model, generating particles randomly on the same inlet plane as Fluent according to the particle mass flow rate, giving the particles the same velocity as the fluid. The data between different sub-computational domains were passed by interfaces.
The physical properties of water were set at what it is in 20 , the density is 0.9982 g/cm3, and the viscosity is Pa·s. RNG was chosen as a turbulence model for the refinement in swirl effect on turbulence, and this refinement enhances the accuracy for swirling flow in a multi-stage centrifugal pump. The standard wall treatment, which can effectively handle most industrial flow that y+ is 15~100 near the solid wall, was set as the wall function. The computational domain of the impeller was set at a relative rotational speed of 1450 rpm, which is the rated rotational speed of a multi-stage centrifugal pump. The walls of the impeller were set as moving walls at relative rotational speed to the adjacent cell zone of 0 rpm.
The pressure-velocity coupling method was SIMPLEC, while moment, turbulent kinetic energy, and turbulent dissipation rate were promoted to second-order upwind to improve the accuracy of the simulation. Time step size was fixed to the time elapsed for every 4 degrees of pump revolution, s of 1450 rpm and s of 900 rpm. The convergence rules for all residuals were set to .
The head of the pump was measured by Equation (13).
where
and
are the total pressure of outlet and inlet,
is equal to the axial distance between two planes.
3.4. Computational Domain and Meshing
The solid models of the impeller and diffuser were created in SolidWorks, and then the fluid computational domain was obtained by extracting the internal cavity, which was shown in
Figure 4, then the impeller and the computational diffuser domains were divided by segmentation. By reassembling those domains, the computational domains of a multi-stage centrifugal pump with a different number of stages could be obtained. The computational stability of the boundary can be improved by extending the length of the pump inlet and outlet pipe, so that two pipelines of 750 mm, exactly five times the hydraulic diameter, are attached to the pump before the first impeller and after the last diffuser.
The volume of a cell should be larger than the particle volume to avoid unphysical and unsmooth numerical results and improve numerical calculations’ stability. The computational domain model was divided into unstructured meshes in ICEM, five meshes with different grid qualities, and their simulation results were shown in
Table 4. The grid-independence simulation test showed that a satisfying result could be guaranteed when the grids reach 14 million.
The mesh of the two-stage centrifugal pump and the six-stage centrifugal pump was shown in
Figure 5. The mesh details are shown in
Table 5, where the worst quality found in the impeller is 0.31, y
+ considered in this work is about 50, which is suitable for the k-epsilon turbulence model.
Given the limitations of computing resources, the six-stage centrifugal pump can be simplified to two-stage with a perfectly acceptable accuracy of the simulation data. A feasible approach to convert data will be further clarified.
4. Slurry Conveying Experiment
The hydraulics test of the slurry conveying experiment of the six-stage centrifugal pump was carried out in the State Key Laboratory of Deep-sea Mineral Resources Development (China).
4.1. Experimental System
As shown in
Figure 6, the pump was installed in a water pool with a maximum depth of 20 m to avoid cavitation, fixed to a six-degree-of-freedom derrick by pipeline. The maximum flow load of the test system was 1000 m
3/h. A diesel generator powers the system with a maximum power load of 1000 kW. The particles are fed through a hydraulic pump-controlled feeder to a slurry mixer, where they are mixed to a Y-shaped elbow and then absorbed into the pump. The maximum continuous feeding capacity of the slurry feeder is 50 kg/s. All power and valve control and data acquisition can be achieved through the control and data acquisition system. The pressure sensors are installed at the inlet and outlet of the pump with the precision of ±0.25% in full scale and the range of 0–3 MPa. Two LDY-200S electromagnetic flowmeters are installed at the horizontal and vertical pipe with the precision of ±0.5% and in the range of 100–1000 m
3/h.
As the slurry flows back into the slurry separation and recycling device, it scours the screens. The coarse particles are separated and recovered before being fed into the hydraulic feeder. All the pressure at the outlet of the pipe is converted into kinetic energy, and the excessive slurry velocity can damage the screen, where the slurry velocity is
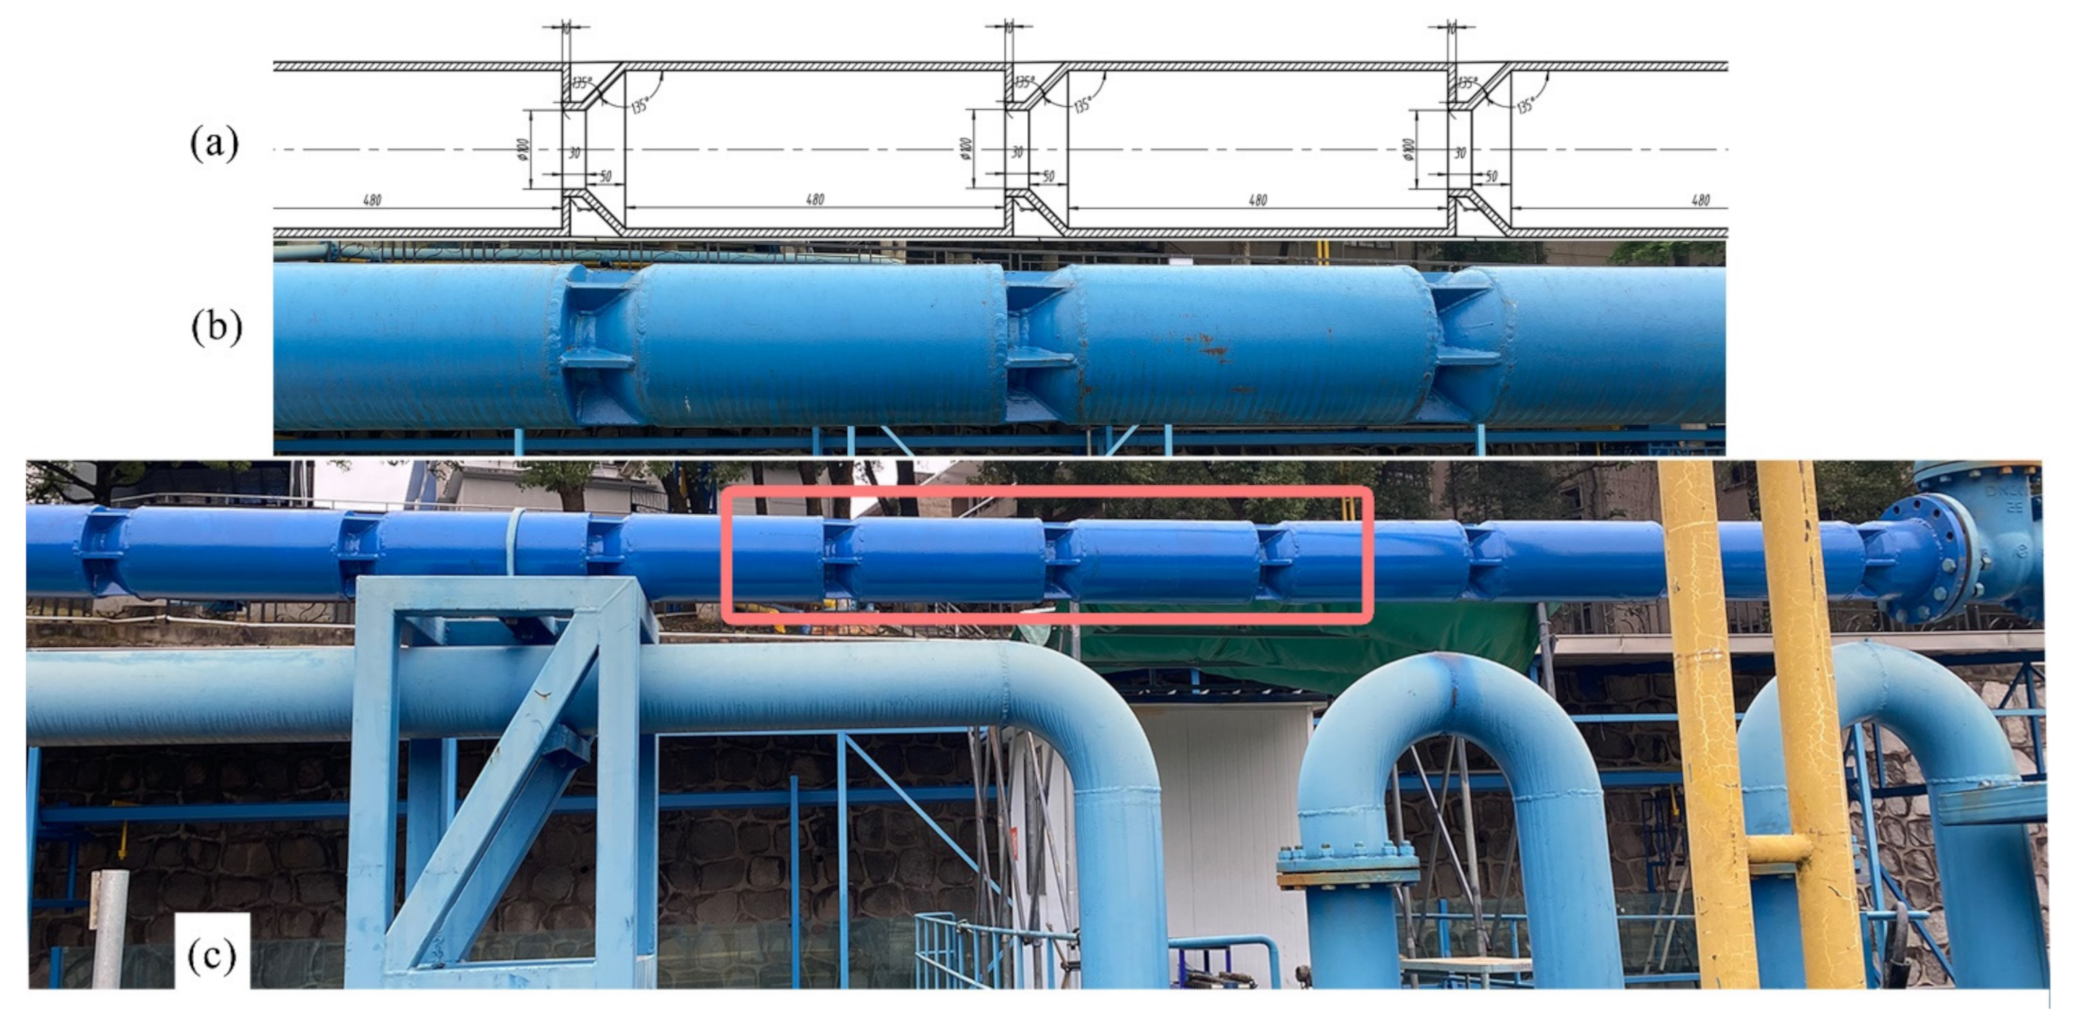
It can be regulated by adjusting the electrical ball valve when conducting the clean water test, but the slurry transport test contains a large number of coarse particle inflow, which would block ball valves, and makes the original test system unavailable in a slurry test. To reduce the pressure of the slurry in the pipeline and to prevent the slurry from being over-pressurized during recovery, a multi-stage taper reducer (
Figure 7) was installed in the pipe system. The local pressure loss of pressure in a multi-stage reducer can be expressed as
is the number of the stage; is local loss factor, which is about 0.06 in this reducer; is the average velocity in the small section.
The reducer was designed with sufficient distance between each stage to allow sufficient space for the slurry to spread and generate sufficient pressure loss. When it is necessary to make adjustments to the pipe load pressure, it can be regulated by adjusting the electrical pinch valve when conducting the slurry conveying test. The type of electrical pinch valve was TG941X-16C-DN200, with a maximum pressure load of 1.6 MPa. The experimental system site is shown in
Figure 8.
The experiment was conducted with clay-fired simulated nodule particles, which were shown in
Figure 9, 88.86% mass of which were between 8 and 13 mm in diameter, the statistical mean of the diameter of the particles is approximately 10 mm, the maximum diameter of particles is 25 mm. The density of simulated nodules is 1.91 g/cm
3, which is approximately equal to natural nodules.
Given that the pipeline pressure tolerance limit of the test pipeline system is 1.6 MPa when conveying slurry, through the frequency converter, the slurry conveying experiment was carried out under 30 Hz working condition, which was 900 rpm. The slurry experiment ran steadily for more than ten minutes each time.
4.2. Experiment Results and Validation
There were four groups of experimental data; under 900 rpm of slurry conveying is shown in
Table 6, which includes different slurry concentration experimental results.
Two cases of simulations with the same slurry conveying experimental conditions were calculated using the coupled CFD-DEM method, and the relevant data comparisons are shown in
Table 7.
The simulation was consistent with the test results. Even at a mass concentration of 15.92%, no conveying blockage was found in the pump neither in test nor in simulation. The maximum relative difference of the six-stage centrifugal pump head between slurry conveying experiment and simulation was 2.04%, the simulation results show a very high degree of consistency with the experiment, which proved the feasibility and reliability of the CFD-DEM coupling simulation.
The pump kept working for three hours before it shut down, and such an operation checked whether the pump would fail due to some accidental factors and verified the stability of the pump when transporting the slurry. The pump remains stable when the slurry feed rate boomed from 0 to 18 kg/s and when the feeder was suddenly switched off. In actual deep-sea mining, mining trucks would experience rich and poor ore zones, which will lead to sudden feed breaks and sudden large feeds. The tests have proven that the six-stage centrifugal pump can cope with such conveying conditions.
5. Results and Discussion
A series of monitoring points and surfaces were set up by fluent and several monitoring functions were defined. The relevant data were exported to a text file every several time steps depending on the requirements. All data are averaged over at least the last two rotation periods to eliminate the effect of pressure pulsations.
The flow field was post-processed by Fluent, the particles were post-processed by EDEM, and the composite area was post-processed by Ensight.
5.1. External Characteristics of Slurry Conveying
The External characteristics were obtained by two-stage simulation for limited computational resources. Considering extreme conditions, the simulations and tests are carried out in the flow rate range of 200–700 m3/h. Given the complex flow, two data converting methods were compared with testes to find a better algorithm.
Converted data
and
were given by
where
was the head of first stage;
was the head of second stage; which were obtained by total pressure monitors.
The comparisons of converted data from two algorithms were shown in
Table 8, the relative error was obtained by compared converted data with the experiment, of which
showed a better accuracy. The first stage head was usually larger than the second stage head. The reason for this difference was due to the different flow field conditions. The inlet velocity of the first stage of the pump was relatively lower, and at rated working conditions, the average velocity of the slurry at the inlet of the first stage impeller was 4.01 m/s. In comparison, the average velocity of the slurry at the outlet section of the first diffuser outlet was 8.21 m/s.
Considering the second-stage simulation took only 22% time and 40% memory of that for the six-stage pump simulation, within 1% the difference between the two-stage and the six-stage pump, the two-stage simplified simulation was feasible and reliable.
Figure 10 showed the overall trend of slurry with a particle volume concentration of 5% and had clear water, with the volume-flow rate being roughly parallel, and the head of the centrifugal pump was slightly higher in clear water than in slurry.
5.2. Distribution of Coarse Particles
The particles in the pump exhibit pulsating transport characteristics due to the finite impeller vanes; the slurry was not homogeneous but was transported in a non-uniform distribution in the pump due to a complex combination of forces.
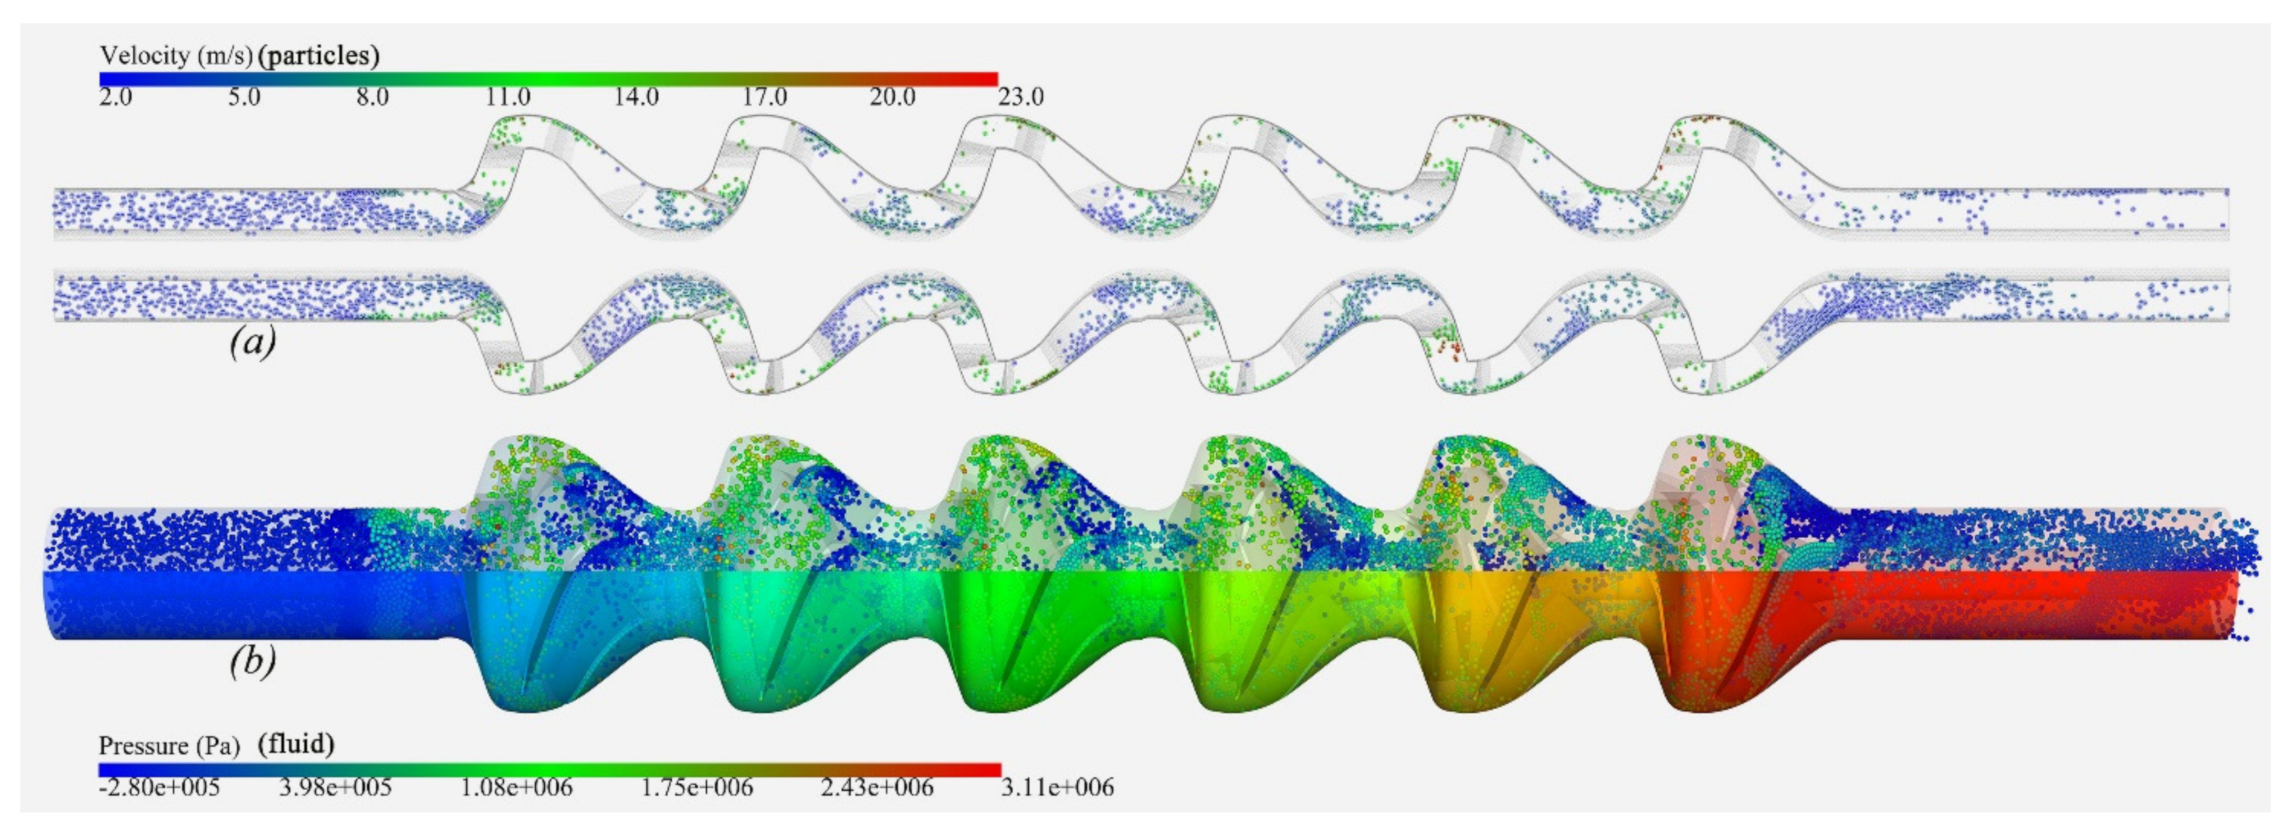
Figure 11 is the result of a slurry simulation of a six-stage pump at a rated flow rate and a rated rotational speed. The particles are conveyed in the impeller in an agglomerated transport model. The slurry acquires a high velocity in the impeller due to centrifugal action and decelerates in the diffuser. After entering the diffuser, the particles slide along the upper cover of the diffuser and the agglomeration phenomenon is more pronounced. Such a high concentrated transport area may lead to the adhesion of silt containing seabed silt in actual mining and leading to transport blockage near the outlet of the diffuser blade channel. After leaving the last diffuser, most of the particles again slide along the outside wall of the pipe due to the tailspin effect.
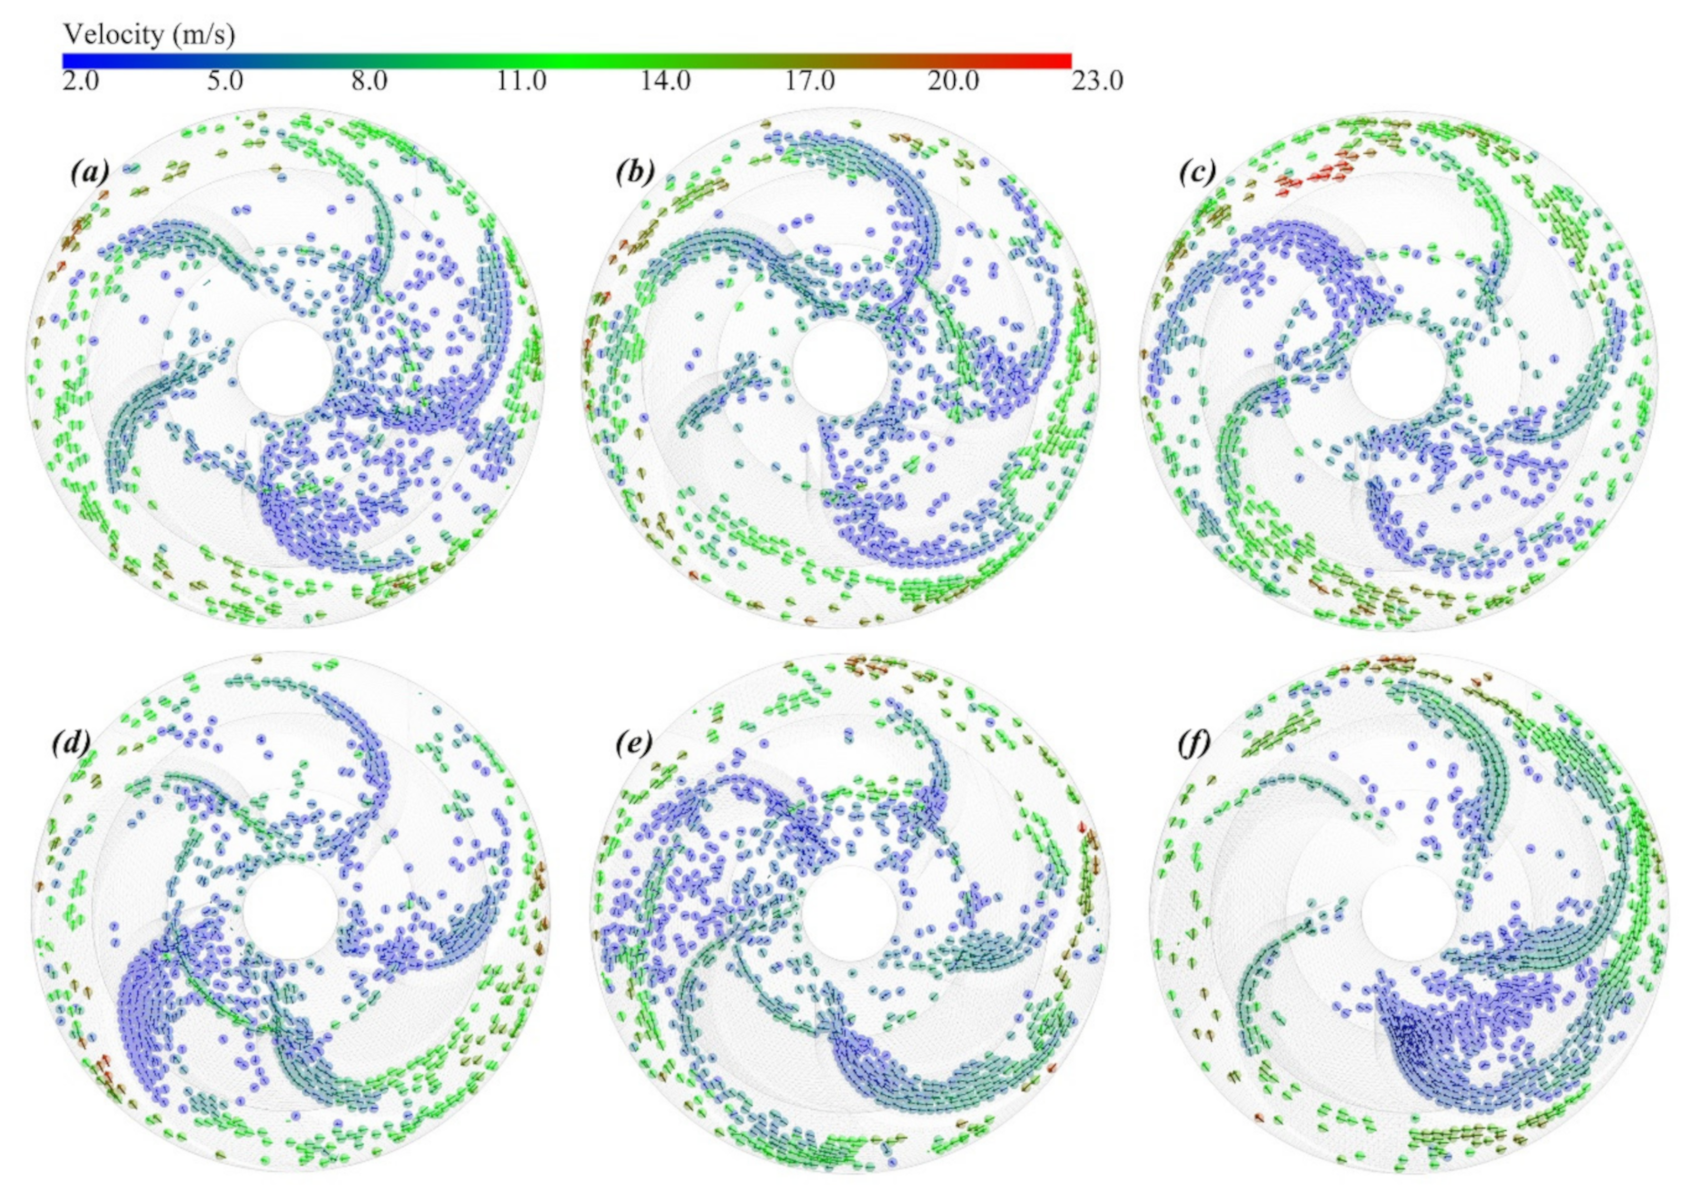
Figure 12 showed the particle distribution in all diffusers of the six-stage centrifugal pump, with the analysis of
Figure 11. It can be known that the slurry in the impeller is an accelerated high-speed rotation and centrifugal force, the maximum speed of the particles in underrated conditions can usually reach about 24 m/s at the outlet of the impeller.
In
Figure 12d,f, a large number of particles had collected at the outlet of two blade channels. Aggregated particles had lower velocities, resulting in a backflow that could not overcome the pressure gradient forces and flow disturbances. In contrast, some blade channels had just a few particles with a relatively high velocity at the exit. Uneven conveying leads to more particles in some of the blade channels, making the outlet pressure and velocity of such blade channels lower, and then the slurry in the adjacent flow channel flows back towards it at the outlet area.
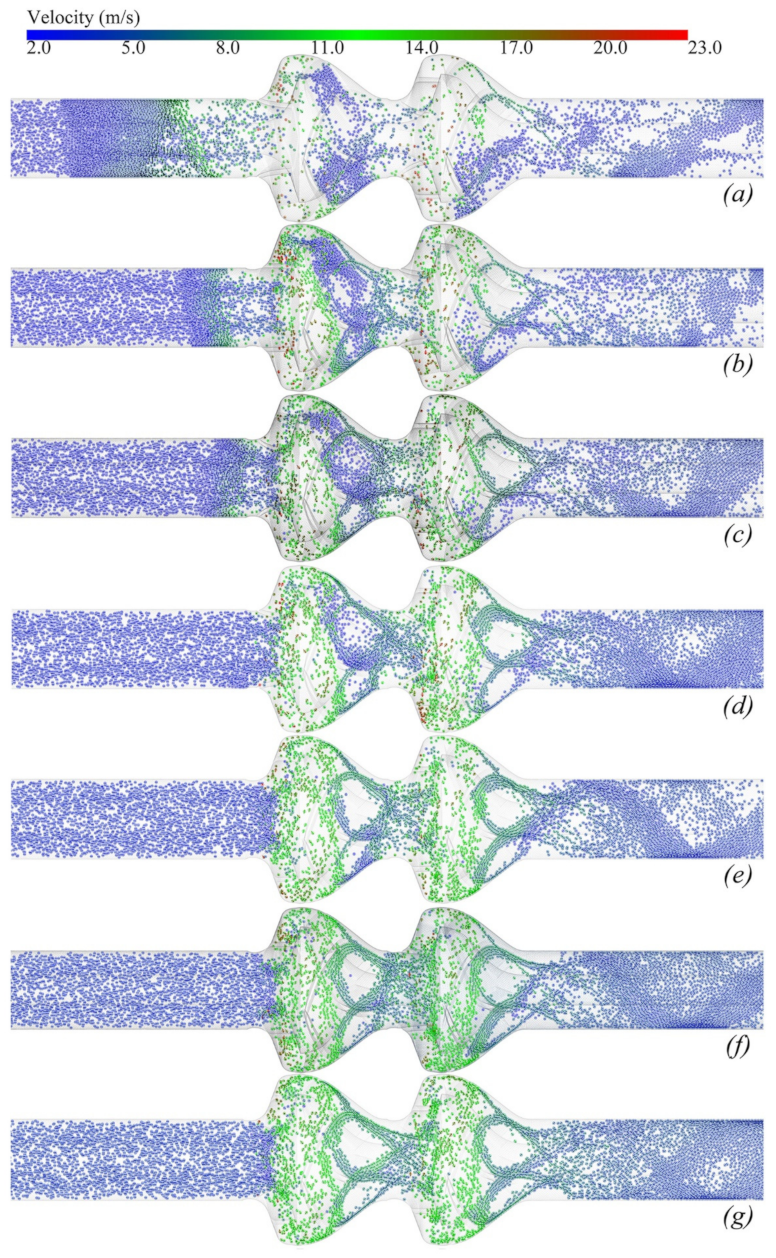
As can be seen from
Figure 13, at low flow rates in
Figure 13a–c, the first impeller of the pump will act on the fluid at the inlet for a longer time due to the slower velocity in the pipeline, creating a strong pre-spin flow field and driving the particles into a complex pre-spin motion, which is also the area where blockages are likely to occur at low flow rates. Particles rotate close to the pipe wall before the first impeller stage due to the centrifugal force, creating a rotating backflow. In contrast, the fluid and particles near the center of the pipe are closer to the center bottom of the impeller, making this the low-pressure zone of the impeller, where the slurry is drawn into the impeller from the centre of the pipe. Particles in the impeller maintain a relatively dispersed and uniform transport in a stream in diffusers.
As the flow rate gradually increases in
Figure 13d,e, the flow velocity in the pipe also gradually increases, the time of pre-action of the first stage impeller on the previous section of fluid shortens, and the pre-rotation return flow becomes very weak. However, the particles will still receive the centrifugal force from the pre-spin flow field and will be closer to the pipe wall, at which point the particles will be drawn into the impeller from the middle of the first stage impeller. The difference between the first and second stage heads stabilises at around 5 m at this flow rate range.
When the flow rate increases to more than 50% of the rated point, in
Figure 13f,g, the velocity of the mixture flow in the pipe is so fast that the pre-circulation effect almost disappears, and the fluid and particles are evenly drawn into the impeller.
As the flow rate increases, the conveying of particles in the pump shows a more obvious conveying pattern, particles are conveyed in strands, the particles’ velocity is more uniform, and the uneven conveying of different flow channels gradually disappears. Because the flow field is more uniform, the velocity of the particles varies more evenly, and fewer particle velocities exceed 20 m/s, reducing the inter-phase dissipation in slurry transport, which is also a reason for the increased pump efficiency in a high flow rate. Another reason is that the speed of the slurry increased to sufficient velocity to overcome inverse pressure gradients.
5.3. Conveying Motion of Coarse Particle
Figure 14 shows the particle trajectories and velocity of a representative particle that most particles resemble in slurry conveying. The particle was accelerated to peaks of approximately 20 m/s at the outlet of the impeller, corresponding to the six peaks in
Figure 14b, and normal particles decelerate to approximately 8 m/s near the outlet of the diffuser.
Figure 14c corresponds to the situation of particle aggregation shown in
Figure 12d,f, where a large number of particles aggregate, and the random collisions with each other cause dramatic deceleration of the particles, reducing velocity to less than 4 m/s. Such a low velocity allowed the particle to be subjected to the flow field force and random collision between particles, resulting in a large accumulation of particles in the outlet of blade channels. The collision of particles may also cause the particles to break away from the transport stream and be subjected to more complex flow field forces leading to backflow.
Representative particle movement in a single stage has three stages, which are shown in
Figure 15. In the first stage, particles enter the impeller domain from the pipeline or the last diffuser. The pressure surface of the impeller will hit the particles at least once, and the particles will be accelerated by centrifugal force. There are fewer collisions between particles, which have little effect on velocity. At the outlet of the impeller, the velocities of particles usually peak at 18–22 m/s.
In the second stage, the particles will pass through the annular bladeless area and then enter the diffuser blade channels. The direction of particle velocity changes axially through the collisions and drag forces, and then the particles move along the diffuser runners. The particles slide on the upper cover of the diffuser and the pressure surface of the diffusers. The deceleration effect is highly obvious, near the end of the diffuser blade channel, the particles typically decelerate to around 8 m/s.
In the third stage, most particles are ejected from the end of the blade before sliding along the outlet of the diffuser blade with very few slowing down. Most of them enter the impeller domain of the next stage and are accelerated again by centrifugation. However, some particles are carried back into the blade channels of the diffuser, so that a localized particle aggregation was formed near the outlet of the diffuser, which can be found in
Figure 12d,f.
The velocity and total force of particle K were shown in
Figure 15b, and many irregular peaks could be found, mainly from the wall and particle and particle–particle collisions, which can lead to sudden changes in the direction of particle velocity and sudden increases or decreases in the velocity gradient.
5.4. Uneven Transport of Particles
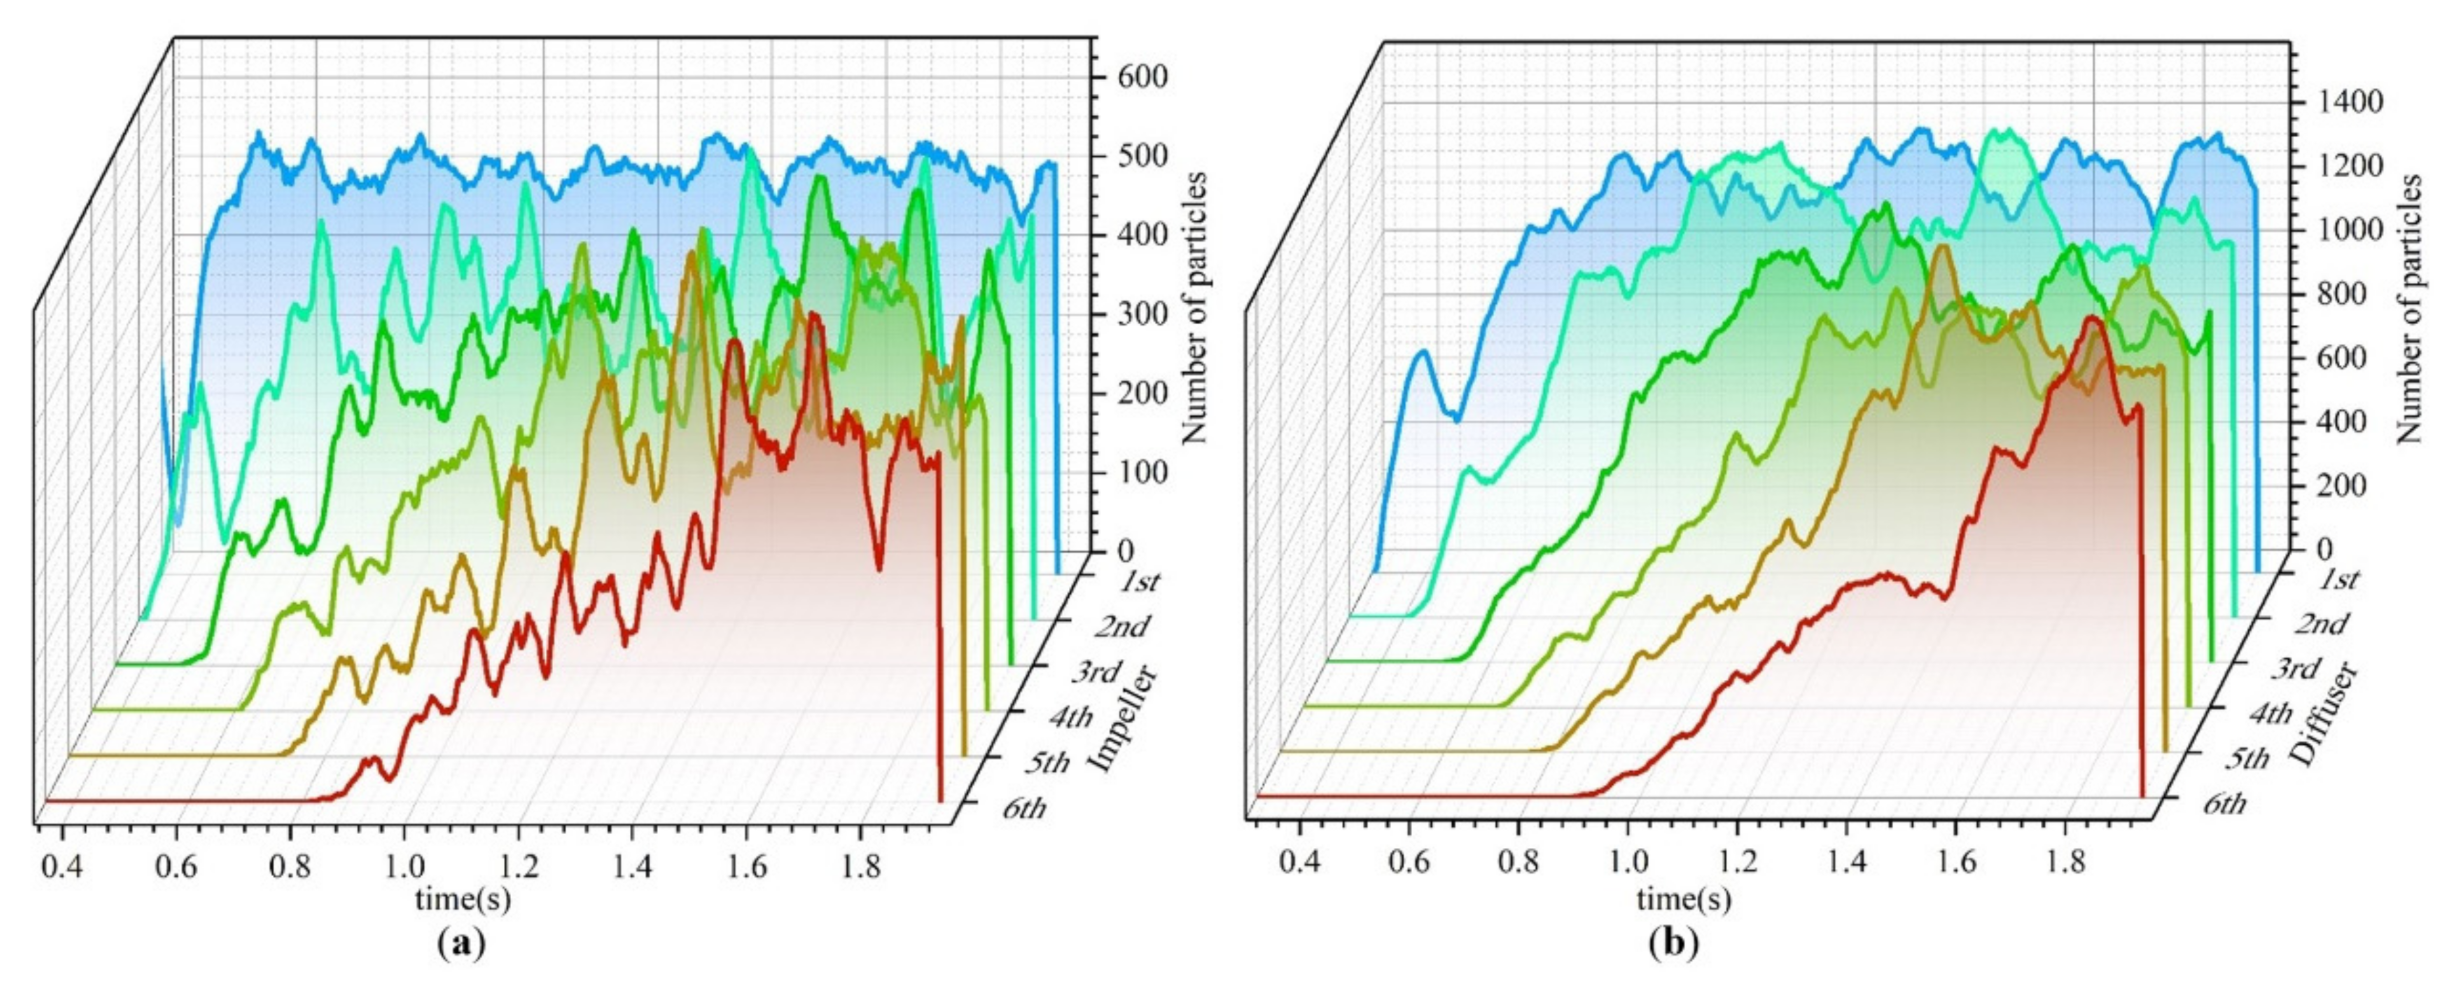
As shown in
Figure 16, the total number of impellers and diffusers change greatly over time. The transport of particles is pulsating and uneven, and numerous peaks were found in the total particle number variation for both the impellers and diffusers and the latter stage’s number peaks were found to show similarity and hysteresis to the previous stage’s peaks.
After all the numbers of particles in the domains reach the peaks, the average number of particles in impellers is 459, while during the conveying process, the maximum number of particles in the impeller is 638, while the minimum number is 273. The fluctuation rate of particles in impellers is −40.58%~+38.86%, in which the fluctuation rate of particles was given by
where
and
are the minimum and maximum number; and
is the average number.
In terms of diffusers, the average number of particles in diffusers is 1232, the maximum number of particles in the diffuser is 1589, while the minimum number is 966. The fluctuation rate of particles in impellers is −21.58%~+28.99%.
The more significant particle fluctuations are due to strand conveying in impellers and localized agglomeration in diffusers. At the same time, the variations of particle peaks also indicate that the pump can dislodge agglomerated particles.
6. Conclusions
In this article, a series of numerical researches based on the CFD-DEM coupling method of the six-stage centrifugal pump were presented. A large test system was constructed and modified for the slurry test. Comparisons of the simulation results with the test results show a maximum head error of 2.04%, and simplified models show a maximum relative error with the test of 2.86%, which verifies the feasibility of the coupled CFD-DEM simulation method. From the analysis of simulations and experiments shown, the main conclusions could be summarized as follows:
(1) The test results and simulation results consistently show that the pump has an excellent slurry transfer performance. CFD-DEM can accurately predict the head and efficiency of multi-stage centrifugal pumps under coarse particle slurry conveying conditions. At the same rotational speed and flow rate, the head of slurry conveying is approximate 3% lower than that of the clear water.
(2) The study of particle distribution found that particles are transported in strands and become more obvious with increasing flow rates. Particles are more concentrated in the diffuser and move near the pressure surface and the upper cover plate in the diffuser blade channel. The local agglomeration phenomenon is caused by local backflow and low local flow velocity, diminishing with increasing flow rates. The uneven transport of particles will be weaker at larger flow rates, making the transport of particles steadier.
(3) Particles are accelerated and decelerated multiple times with the fluid in a multi-stage pump mainly by fluid drag forces and collision forces. With the exception of the first impeller stage, particles are transported in a pulse-like manner within the pump. The latter stage shows similar particle characteristics to those transported in the previous pump stage.
In actual mining operations, the particles in the slurry are in various diameters and shapes. Future research will focus on practical engineering. More experimental studies and even trials of actual deep-sea mining systems will be listed in the plan.
Author Contributions
Conceptualization, L.D. and Q.H.; Methodology, L.D.; software, L.D. and J.C.; validation, Q.H., Y.K. and S.L.; formal analysis, L.D.; investigation, L.D. and Y.K.; resources, Q.H. and S.L.; data curation, L.D.; writing—original draft preparation, L.D.; writing—review and editing, L.D. and Q.H.; visualization, L.D.; supervision, Q.H. and S.L.; project administration, S.L.; funding acquisition, S.L. All authors have read and agreed to the published version of the manuscript.
Funding
This work was supported by National Key Research and Development Project of China (2016YFC0304103), the National Key Research and Development Program of China (2019YFC0312405), and Open Fund of the State Key Laboratory of Deep-sea Mineral Resources Development and Utilization Technology (SH-2020-KF-A02).
Acknowledgments
The authors would like to thank the anonymous reviewers for their constructive suggestions which comprehensively improved the quality of the paper.
Conflicts of Interest
The authors declare no conflict of interest.
References
- Sharma, R. Deep-sea mining: Economic, technical, technological, and environmental considerations for sustainable development. Mar. Technol. Soc. J. 2011, 45, 28–41. [Google Scholar] [CrossRef]
- Hu, Q.; Zou, L.; Lv, T.; Guan, Y.J.; Sun, T.Z. Experimental and Numerical Investigation on the Transport Characteristics of Particle-Fluid Mixture in Y-Shaped Elbow. J. Mar. Sci. Eng. 2020, 8, 675. [Google Scholar] [CrossRef]
- Kang, Y.J.; Liu, S.J.; Hu, X.Z.; Dai, Y. Numerical and Experimental Investigation of a Multistage Electric Lifting Pump for Deep-Sea Mining. In Proceedings of the 2018 3rd International Conference on Smart City and Systems Engineering (ICSCSE), Xiamen, China, 29–30 December 2018; pp. 457–462. [Google Scholar]
- Dai, Y.; Xue, C.; Su, Q. An Integrated Dynamic Model and Optimized Fuzzy Controller for Path Tracking of Deep-Sea Mining Vehicle. J. Mar. Sci. Eng. 2021, 9, 249. [Google Scholar] [CrossRef]
- Filer, C.; Gabriel, J. How could Nautilus Minerals get a social licence to operate the world’s first deep sea mine. Mar. Policy 2018, 95, 394–400. [Google Scholar] [CrossRef]
- Miller, K.A.; Thompson, K.F.; Johnston, P.; Santillo, D. An overview of seabed mining including the current state of development, environmental impacts, and knowledge gaps. Front. Mar. Sci. 2018, 4, 418. [Google Scholar] [CrossRef]
- Kang, Y.J.; Liu, S.J.; Zou, W.S.; Zhao, H.; Hu, X.Z. Design and analysis of an innovative deep-sea lifting motor pump. J. Appl. Ocean Res. 2019, 82, 22–31. [Google Scholar] [CrossRef]
- Wen, H.; Liu, S.J.; Zou, W.S.; Hu, X.Z.; Dong, Z. Effects of Particle Diameter on Erosion Wear Characteristic of Deep-Sea Mining Pump. In Proceedings of the 2019 International Conference on Intelligent Transportation, Big Data & Smart City (ICITBS), Changsha, China, 12–13 January 2019; pp. 507–512. [Google Scholar]
- Casimir, N.; Zhu, X.Y.; Hundshagen, M.; Ludwig, G.; Skoda, R. Numerical Study of Rotor-Stator Interaction of a Centrifugal Pump at Part Load With Special Emphasis on Unsteady Blade Load. J. Fluids Eng. Trans. ASME 2020, 142, 14. [Google Scholar] [CrossRef]
- Qiu, J.T.; Yang, C.J.; Dong, X.Q.; Wang, Z.L.; Li, W.; Noblesse, F. Numerical Simulation and Uncertainty Analysis of an Axial-Flow Waterjet Pump. J. Mar. Sci. Eng. 2018, 6, 71. [Google Scholar] [CrossRef] [Green Version]
- Wang, L.; Liu, H.L.; Wang, K. Numerical Simulation of the Sound Field of a Five-Stage Centrifugal Pump with Different Turbulence Models. Water 2019, 11, 1777. [Google Scholar] [CrossRef] [Green Version]
- Zhao, H.; Liu, S.J.; Hu, X.Z. Study on radial Force of unsteady flow in deep-sea uplift pump. J. Cent. South Univ. 2019, 50, 829–836. [Google Scholar]
- Safaei, M.; Mahian, O.; Garoosi, F.; Hooman, K.; Karimipour, A.; Kazi, S.; Gharehkhani, S. Investigation of micro-and nanosized particle erosion in a 90 pipe bend using a two-phase discrete phase model. Sci. World J. 2014, 2014, 740578-90. [Google Scholar] [CrossRef] [PubMed] [Green Version]
- Rashidi, S.; Esfahani, J.A.; Ellahi, R. Convective heat transfer and particle motion in an obstructed duct with two side by side obstacles by means of DPM model. Appl. Sci. 2017, 7, 431. [Google Scholar] [CrossRef] [Green Version]
- Cundall, P.A.; Strack, O.D. A discrete numerical model for granular assemblies. Geotechnique 1979, 29, 47–65. [Google Scholar] [CrossRef]
- Zhang, A.; Jiang, M.; Thornton, C. A coupled CFD-DEM method with moving mesh for simulating undrained triaxial tests on granular soils. Granul. Matter 2020, 22, 1–13. [Google Scholar] [CrossRef]
- Yao, L.; Xiao, Z.; Liu, J.; Zhang, Q.; Wang, M. An optimized CFD-DEM method for fluid-particle coupling dynamics analysis. Int. J. Mech. Sci. 2020, 174, 105503. [Google Scholar] [CrossRef]
- Liu, M.; Wen, Y.; Liu, R.; Liu, B.; Shao, Y. Investigation of fluidization behavior of high density particle in spouted bed using CFD–DEM coupling method. Powder Technol. 2015, 280, 72–82. [Google Scholar] [CrossRef]
- Chen, Q.; Xiong, T.; Zhang, X.; Jiang, P. Study of the hydraulic transport of non-spherical particles in a pipeline based on the CFD-DEM. Eng. Appl. Comp. Fluid Mech. 2020, 14, 53–69. [Google Scholar] [CrossRef]
- Choi, J.S.; McLaughlin, D.K.; Thompson, D.E. Experiments on the unsteady flow field and noise generation in a centrifugal pump impeller. J. Sound Vibrat. 2003, 263, 493–514. [Google Scholar] [CrossRef]
- Shi, W.D.; Zhou, L.; Lu, W.G.; Pei, B.; Lang, T. Numerical Prediction and Performance Experiment in a Deep-well Centrifugal Pump with Different Impeller Outlet Width. Chin. J. Mech. Eng. 2013, 26, 46–52. [Google Scholar] [CrossRef]
- Namazizadeh, M.; Gevari, M.T.; Mojaddam, M.; Vajdi, M. Optimization of the Splitter Blade Configuration and Geometry of a Centrifugal Pump Impeller using Design of Experiment. J. Appl. Fluid Mech. 2020, 13, 89–101. [Google Scholar] [CrossRef]
- Girault, V.; Raviart, P.-A. Finite Element Approximation of the Navier-Stokes Equations; Lecture Notes Math; Springer Verlag: Berlin, Germany, 1979; Volume 749, pp. 1–199. [Google Scholar]
- Batchelor, C.K.; Batchelor, G. An Introduction to Fluid Dynamics; Cambridge University Press: Cambridge, UK, 2000. [Google Scholar]
- Yakhot, V.; Orszag, S.A. Renormalization group analysis of turbulence. Basic Theory. 1986, 1, 3–51. [Google Scholar] [CrossRef] [PubMed] [Green Version]
- Chen, J.; Shi, W.; Zhang, D. Influence of blade inlet angle on the performance of a single blade centrifugal pump. Eng. Appl. Comp. Fluid Mech. 2021, 15, 462–475. [Google Scholar]
- Tang, C.; Kim, Y.-J. CFD-DEM Simulation for the Distribution and Motion Feature of Solid Particles in Single-Channel Pump. Energies 2020, 13, 4988. [Google Scholar] [CrossRef]
- Emeriault, F.; Cambou, B. Micromechanical modelling of anisotropic non-linear elasticity of granular medium. Int. J. Solids 1996, 33, 2591–2607. [Google Scholar] [CrossRef]
- Hertz, H. On the contact of elastic solids. J. Reine Angew. Math. 1882, 92, 156–171. [Google Scholar]
- Mindlin, R.D. Elastic spheres in contact under varying oblique forces. J. Appl. Mech. 1953, 20, 327–344. [Google Scholar] [CrossRef]
Figure 1.
Overall structural design of the six-stage centrifugal pump.
Figure 1.
Overall structural design of the six-stage centrifugal pump.
Figure 2.
Axial section of impeller and diffuser.
Figure 2.
Axial section of impeller and diffuser.
Figure 3.
Schematic diagram of CFD-DEM coupling method.
Figure 3.
Schematic diagram of CFD-DEM coupling method.
Figure 4.
Computational domain of the six-stage centrifugal pump.
Figure 4.
Computational domain of the six-stage centrifugal pump.
Figure 5.
Mesh of six-stage centrifugal pump and two-stage centrifugal pump.
Figure 5.
Mesh of six-stage centrifugal pump and two-stage centrifugal pump.
Figure 6.
Experimental system layout.
Figure 6.
Experimental system layout.
Figure 7.
Multi-stage taper reducer in the pipeline; (a) CAD layout; (b) Manufactured product; (c) Installation layout in the pipeline.
Figure 7.
Multi-stage taper reducer in the pipeline; (a) CAD layout; (b) Manufactured product; (c) Installation layout in the pipeline.
Figure 8.
Experimental system site.
Figure 8.
Experimental system site.
Figure 9.
(a) Clay-fired simulated nodule particles; (b) calibrated nodules for sampling in tests.
Figure 9.
(a) Clay-fired simulated nodule particles; (b) calibrated nodules for sampling in tests.
Figure 10.
Total head comparisons of simulation and an experiment of the six-stage centrifugal pump at 1450 rpm.
Figure 10.
Total head comparisons of simulation and an experiment of the six-stage centrifugal pump at 1450 rpm.
Figure 11.
Slurry simulation of a six-stage pump at a rated flow rate and 1450 rpm: (a) central axis slice of particle distribution; (b) composite diagram of static pressure and particle distribution.
Figure 11.
Slurry simulation of a six-stage pump at a rated flow rate and 1450 rpm: (a) central axis slice of particle distribution; (b) composite diagram of static pressure and particle distribution.
Figure 12.
Particle distribution in diffusers of six-stage centrifugal pump at 420 m3/h and 1450 rpm: (a) first stage; (b) second stage; (c) third stage; (d) fourth stage; (e) fifth stage; (f) sixth stage.
Figure 12.
Particle distribution in diffusers of six-stage centrifugal pump at 420 m3/h and 1450 rpm: (a) first stage; (b) second stage; (c) third stage; (d) fourth stage; (e) fifth stage; (f) sixth stage.
Figure 13.
Particle distribution and velocity vector synthesis at different flow rates: (a) Q = 200 m3/h; (b) Q = 300 m3/h; (c) Q = 360 m3/h; (d) Q = 420 m3/h; (e) Q = 480 m3/h; (f) Q = 540 m3/h; (g) Q = 600 m3/h.
Figure 13.
Particle distribution and velocity vector synthesis at different flow rates: (a) Q = 200 m3/h; (b) Q = 300 m3/h; (c) Q = 360 m3/h; (d) Q = 420 m3/h; (e) Q = 480 m3/h; (f) Q = 540 m3/h; (g) Q = 600 m3/h.
Figure 14.
(a) Particle trajectory of a representative particle; (b) Velocity of the particle; (c) Partial zoom of particle trajectory.
Figure 14.
(a) Particle trajectory of a representative particle; (b) Velocity of the particle; (c) Partial zoom of particle trajectory.
Figure 15.
Particle trajectories: (a) Trajectories in the diffuser of four typical particles; (b) The velocity and total force of particle K.
Figure 15.
Particle trajectories: (a) Trajectories in the diffuser of four typical particles; (b) The velocity and total force of particle K.
Figure 16.
Total number of particles: (a) in six impellers; (b) in six diffusers.
Figure 16.
Total number of particles: (a) in six impellers; (b) in six diffusers.
Table 1.
Six-stage centrifugal pump design parameters.
Table 1.
Six-stage centrifugal pump design parameters.
| Parameter | Value | Parameter | Value |
|---|
| Designed flow rate | 720 m3/h | Rated flow rate | 420 m3/h |
| Designed head | 237 m | Rated head | 270 m |
| Designed efficiency | 70% | Rated efficiency | 52% |
| Designed shift power | 680 kW | Rated shift power | 640 kW |
| Rotational speed | 1450 r/min | specific speed | 150 |
Maximum particle
diameter | 20 mm | Rated slurry
concentration | 5%Cv |
Table 2.
Main design parameters of the impeller.
Table 2.
Main design parameters of the impeller.
| Structure of Impeller | Parameter | Structure of Diffuser | Parameter |
|---|
| Inlet diameter | 235 mm | Maximum inlet diameter | 516 mm |
| Maximum outside diameter | 425 mm | Minimum inlet diameter | 395 mm |
| Minimum outside diameter | 395 mm | Maximum outside diameter | 260 mm |
| Outlet width | 60 mm | Minimum outside diameter | 95 mm |
| Number of blades | 4 | Number of blades | 5 |
| Inlet installing angle | 35° | Inlet installing angle | 12° |
| Outlet installing angle | 32.5° | Outlet installing angle | 85° |
| Blade angle | 110° | Blade wrap angle | 95.5° |
Table 3.
Contact interaction settings in the EDEM.
Table 3.
Contact interaction settings in the EDEM.
| Interaction | Coefficient of Restitution | Coefficient of Static Friction | Coefficient of Rolling Friction |
|---|
| Particle–Particle | 0.45 | 0.28 | 0.01 |
| Particle–Pump | 0.48 | 0.10 | 0.01 |
Table 4.
Grid-independence simulation test.
Table 4.
Grid-independence simulation test.
| Simulation Conditions | Grids
Number | Total Head (m) | Error Compared to test (%) |
|---|
six-stage model at 900 rpm;
volume rate 425 m3/s;
particle mass concentration 15.92%. | 6,126,594 | 106.86 | 7.48 |
| 8,127,158 | 105.16 | 5.77 |
| 11,754,546 | 102.77 | 3.40 |
| 14,151,978 | 101.45 | 2.04 |
| 19,315,792 | 101.34 | 1.93 |
| Experiment | - | 99.42 | - |
Table 5.
Detailed information of meshes.
Table 5.
Detailed information of meshes.
| Pump | Grids for an
Impeller Domain | Grids for a
Diffuser Domain | Grids for a Pipeline | Total Number of Grids |
|---|
| Two-stage | 496,087 | 1,575,356 | 861,660 | 5,866,200 |
| Six-stage | 496,087 | 1,575,356 | 861,660 | 14,151,978 |
Table 6.
Slurry conveying experimental results.
Table 6.
Slurry conveying experimental results.
| Total Volume Flow (m3/h) | Particle Mass Concentration (%) | Head (m) | Particle Conveying Capacity (T/h) |
|---|
| 468.31 | 10.01 | 97.14 | 49.35 |
| 425.42 | 15.92 | 99.42 | 73.19 |
Table 7.
Comparisons of experimental and simulation results.
Table 7.
Comparisons of experimental and simulation results.
| Total Volume Flow (m3/h) | Particle Mass Concentration (%) | Head of
Experiment (m) | Head of Simulation (m) | Difference
between Heads (%) |
|---|
| 468.31 | 10.01 | 97.14 | 98.24 | 1.13 |
| 425.42 | 15.92 | 99.42 | 101.45 | 2.04 |
Table 8.
Comparisons of converted results from two-stage simulation.
Table 8.
Comparisons of converted results from two-stage simulation.
| Total Volume Flow (m3/h) | | Relative Error (%) | | Relative Error (%) |
|---|
| 468.31 | 98.90 | 1.81 | 101.14 | 4.12 |
| 425.42 | 102.26 | 2.86 | 105.85 | 6.47 |
| Publisher’s Note: MDPI stays neutral with regard to jurisdictional claims in published maps and institutional affiliations. |
© 2021 by the authors. Licensee MDPI, Basel, Switzerland. This article is an open access article distributed under the terms and conditions of the Creative Commons Attribution (CC BY) license (https://creativecommons.org/licenses/by/4.0/).


