Article

Development and Application of STORMTOOLS Design Load (SDL) Maps

1
Civil and Environmental Engineering, University of South Florida, Tampa, FL 33613, USA
2
GEI Consultants, Inc., Westerly, RI 02891, USA
3
Ocean Engineering, University of RI, Narragansett, RI 02882, USA
4
Manson Construction Corp, Jacksonville, FL 32202, USA
5
Kessman Engineering, Mahopac, NY 10541, USA
6
AR Building Co., Providence, RI 02903, USA
7
Electric Boat, Groton, CT 06340, USA
8
Harbor Engineering, Barrington, RI 02806, USA
9
Civil and Environmental and Ocean Engineering, University of RI, Narragansett, RI 02882, USA
10
Swanson Environmental Associates LLC, Saunderstown, RI 02874, USA
11
Civil and Environmental Engineering, University of RI, Kingston, RI 02881, USA
*
Author to whom correspondence should be addressed.
J. Mar. Sci. Eng. 2021, 9(7), 715; https://doi.org/10.3390/jmse9070715
Submission received: 2 June 2021 / Revised: 21 June 2021 / Accepted: 25 June 2021 / Published: 29 June 2021

Abstract

:
Under the STORMTOOLS initiative, maps of the impact of sea level rise (SLR) (0 to 12 ft), nuisance flooding (1–10 yr), 25, 50, and 100 yr storms, and hindcasts of the four top ranked tropical storms have been developed for the coastal waters of Rhode Island (RI). Estimates of the design elevations, expressed in terms of the Base Flood Elevation (BFE) and thus incorporating surge and associated wave conditions, have also been developed, including the effects of SLR to facilitate structural design. Finally, Coastal Environmental Risk Index (CERI) maps have been developed to estimate the risk to individual structures and infrastructure. CERI employs the BFE maps in concert with damage curves for residential and commercial structures to make estimates of damage to individual structures. All maps are available via an ArcGIS Hub. The objective of this senior design capstone project was to develop STORMTOOLS Design Load maps (SDL) with a goal of estimating the hydrostatic, hydrodynamic, wave, and debris loading, based on ASCE/SEI 7–16 Minimum Design Standards methods, on residential structures in the RI coastal floodplain. The resulting maps display the unitized loads and thus can be scaled for any structure of interest. The goal of the maps is to provide environmental loads that support the design of structures, and reduce the time and cost required in performing the design and the permitting process, while also improving the accuracy and consistency of the designs. SDL maps were generated for all loads, including the effects of SLR for a test case: the Watch Hill/Misquamicut Beach, Westerly, along the southern RI coast. The Autodesk Professional Robot Structural Analysis software, along with SDL loading, was used to evaluate the designs for selected on-grade and pile-elevated residential structures. Damage curves were generated for each and shown to be consistent with the US Army Corps of Engineers empirical damage curves currently used in CERI.

1. Introduction

The STORMTOOLS initiative was started in 2015 to demonstrate the impacts of various SLR and storm surge scenarios for 100 yr storm events on structures and infrastructure along the coast of Rhode Island (RI) [1]. STORMTOOLS provides access to design tools for coastal and riverine flooding, available as a Geographic Information System (GIS)-based web service, that allows the user to select coastal areas of interest and assess damage on a high-resolution (3 ft, horizontal) grid for the state. Maps of flooding from nuisance storms (1, 3, 5, and 10 yr), 50 and 100 yr return period storms, historical storms (1938, 1956 (Carol), 1991 (Bob), and 2012 (Sandy)) and sea level rise (SLR) maps (1 to 10 ft) were generated for RI.
In 2016 STORMTOOLs was extended to include a Coastal Environmental Risk Index (CERI) [2,3,4,5] and the supporting STORMTOOLS Design Elevation (SDE) maps [6]. CERI was developed to provide estimates of the damage to individual structures in coastal areas affected by inundation and waves [2]. The state emergency E-911 database and records from the tax assessor’s office for individual communities were used to provide information on building locations and types. Inundation and wave structural damage, by building type, were obtained from the US Army Corps of Engineers (USACE), North Atlantic Coastal Comprehensive Study (NACCS) [7,8]. In CERI, the flooding environment is specified in terms of the Base Flood Elevation (BFE) for the 100 yr storm event, with the associated SLR value of interest. The use of BFE was selected since it is consistent with the Federal Emergency Management Agency (FEMA) methods used in generating the Flood Insurance Rate Maps (FIRMs) and those embedded in the ASCE/SEI 7–16 Minimum Design Standards [9] and FEMA P-55, Coastal Construction Manual [10]. Unlike the FEMA FIRMs, the BFE maps explicitly include the impact of SLR and are called STORMTOOLS Design Elevation (SDE) Maps. SDE maps have been generated using state of the practice modeling methods (ADCIRC, STWAVE, and XBeach) for the entire state [6]. XBeach, an integrated hydrodynamic and geomorphological model, was used in developing the SDE maps to represent storm induced erosion and breaching of the dune/barrier systems that characterize the southern RI shoreline. CERI has been applied to all communities located along the southern RI shoreline [5] as well as selected communities in Narragansett Bay, RI [4], and is currently being extended to all coastal communities in the state. The southern RI shoreline communities are characterized by a wave exposed shoreline with significant coastal erosion [11], while those in the bay experience a more limited wave environment and little coastal erosion, but an amplification of the storm surge as it progresses up the bay [12]. The SDE maps have been compared in depth to the FEMA FIRMs for each area [11,12] to highlight the similarities and differences between the two.
CERI and the SDE maps have recently been integrated into the RI Coastal Resources Management Council’s (CRMC) Coastal Hazard Application that is required for all permit applications for coastal structures (RI CRMC Coastal Hazards Application. Accessed on 13 May 2021) [13]. Given its wide-spread use as part of the permitting process and community planning in the state, STORMTOOLS has been migrated to an ArcGIS Hub: (http://www.beachsamp.org/stormtools/, Accessed on 13 May 2021) [14].
In applying and evaluating the results of CERI’s application, it was noted that the damage functions from the US Army Corps of Engineers, North Atlantic Comprehensive Coastal Study (USACE NACCS) displayed significant uncertainty for the various structural types. The uncertainty was sufficiently large, such that an expert panel was used to develop the final damage curves [8]. As an example, Figure 1 shows the damage functions generated during the NACCS study [8] for a single-story house with no basement (Prototype 5A). The upper panel shows the structural damage vs. flood elevation relative to the first (finished) floor elevation (FFE), while the lower panel shows the wave damage. This is one of the most common structures located in the coastal flood plain in RI [4]. In this application the damage curve that gives the greatest damage is selected. The solid lines in the figure are the expert panel’s recommendation for minimum, most likely, and maximum damage, and the points are observations based on the post hurricane Sandy 2012 survey data from structures located along the coastlines of New York and New Jersey. The scatter in the data required the use of an expert panel and clearly highlights the weak observational basis for linking flooding water level/wave heights relative to FFE to the actual damage. It is also noted that the damage, based on the field observations, may be non-structural, especially for the lower end of the damage curve, but can be attributed to the loss of portions of the structure (e.g., windows, doors, shutters, gutters and down spouts, building siding, etc.).
As it is currently formulated, CERI does not explicitly include debris and wind loads or the associated damage. It also does not address hydrodynamic loads resulting from storm induced flows, since these are dependent on the flow speeds during the surge event. The flow velocities generated by the storms are not provided by FEMA FIRMs (BFE) maps or their equivalents, in this case the SDE maps. Wave induced hydrodynamic loads can be estimated using the shallow water wave speeds.
The broad focus of the present study is to provide estimates of the loads on structures in the coastal zone (flood) using STORMTOOLS Design Load (SDL) maps, and to replace the use of the USACE NACCS damage functions with a methodology that has a more solid engineering foundation; namely to use the loads to model the structural response. The proposed methodology is based on determining the engineering loads (flood), using the methods outlined in ASCE/SEI 7–16 Minimum Design Loads [9] and FEMA P-55-Coastal Construction Manual (CCM) [10] for residential structures. These standards are widely used throughout the United States and by all communities in RI. Advantages in creating the SDL maps include the following: establishing a consistent, statewide method to assess loads for structures using the most current design standards in support of engineering design professionals, a reduction in the design cost and time required in the permitting process, and improvements in design consistency across the state.
The specific objectives of this study are to:
  • Develop a methodology to generate design flood loads, including hydrodynamic, hydrostatic, wave, and debris loads for residential structures in the RI coastal flood plain, including the effects of SLR.
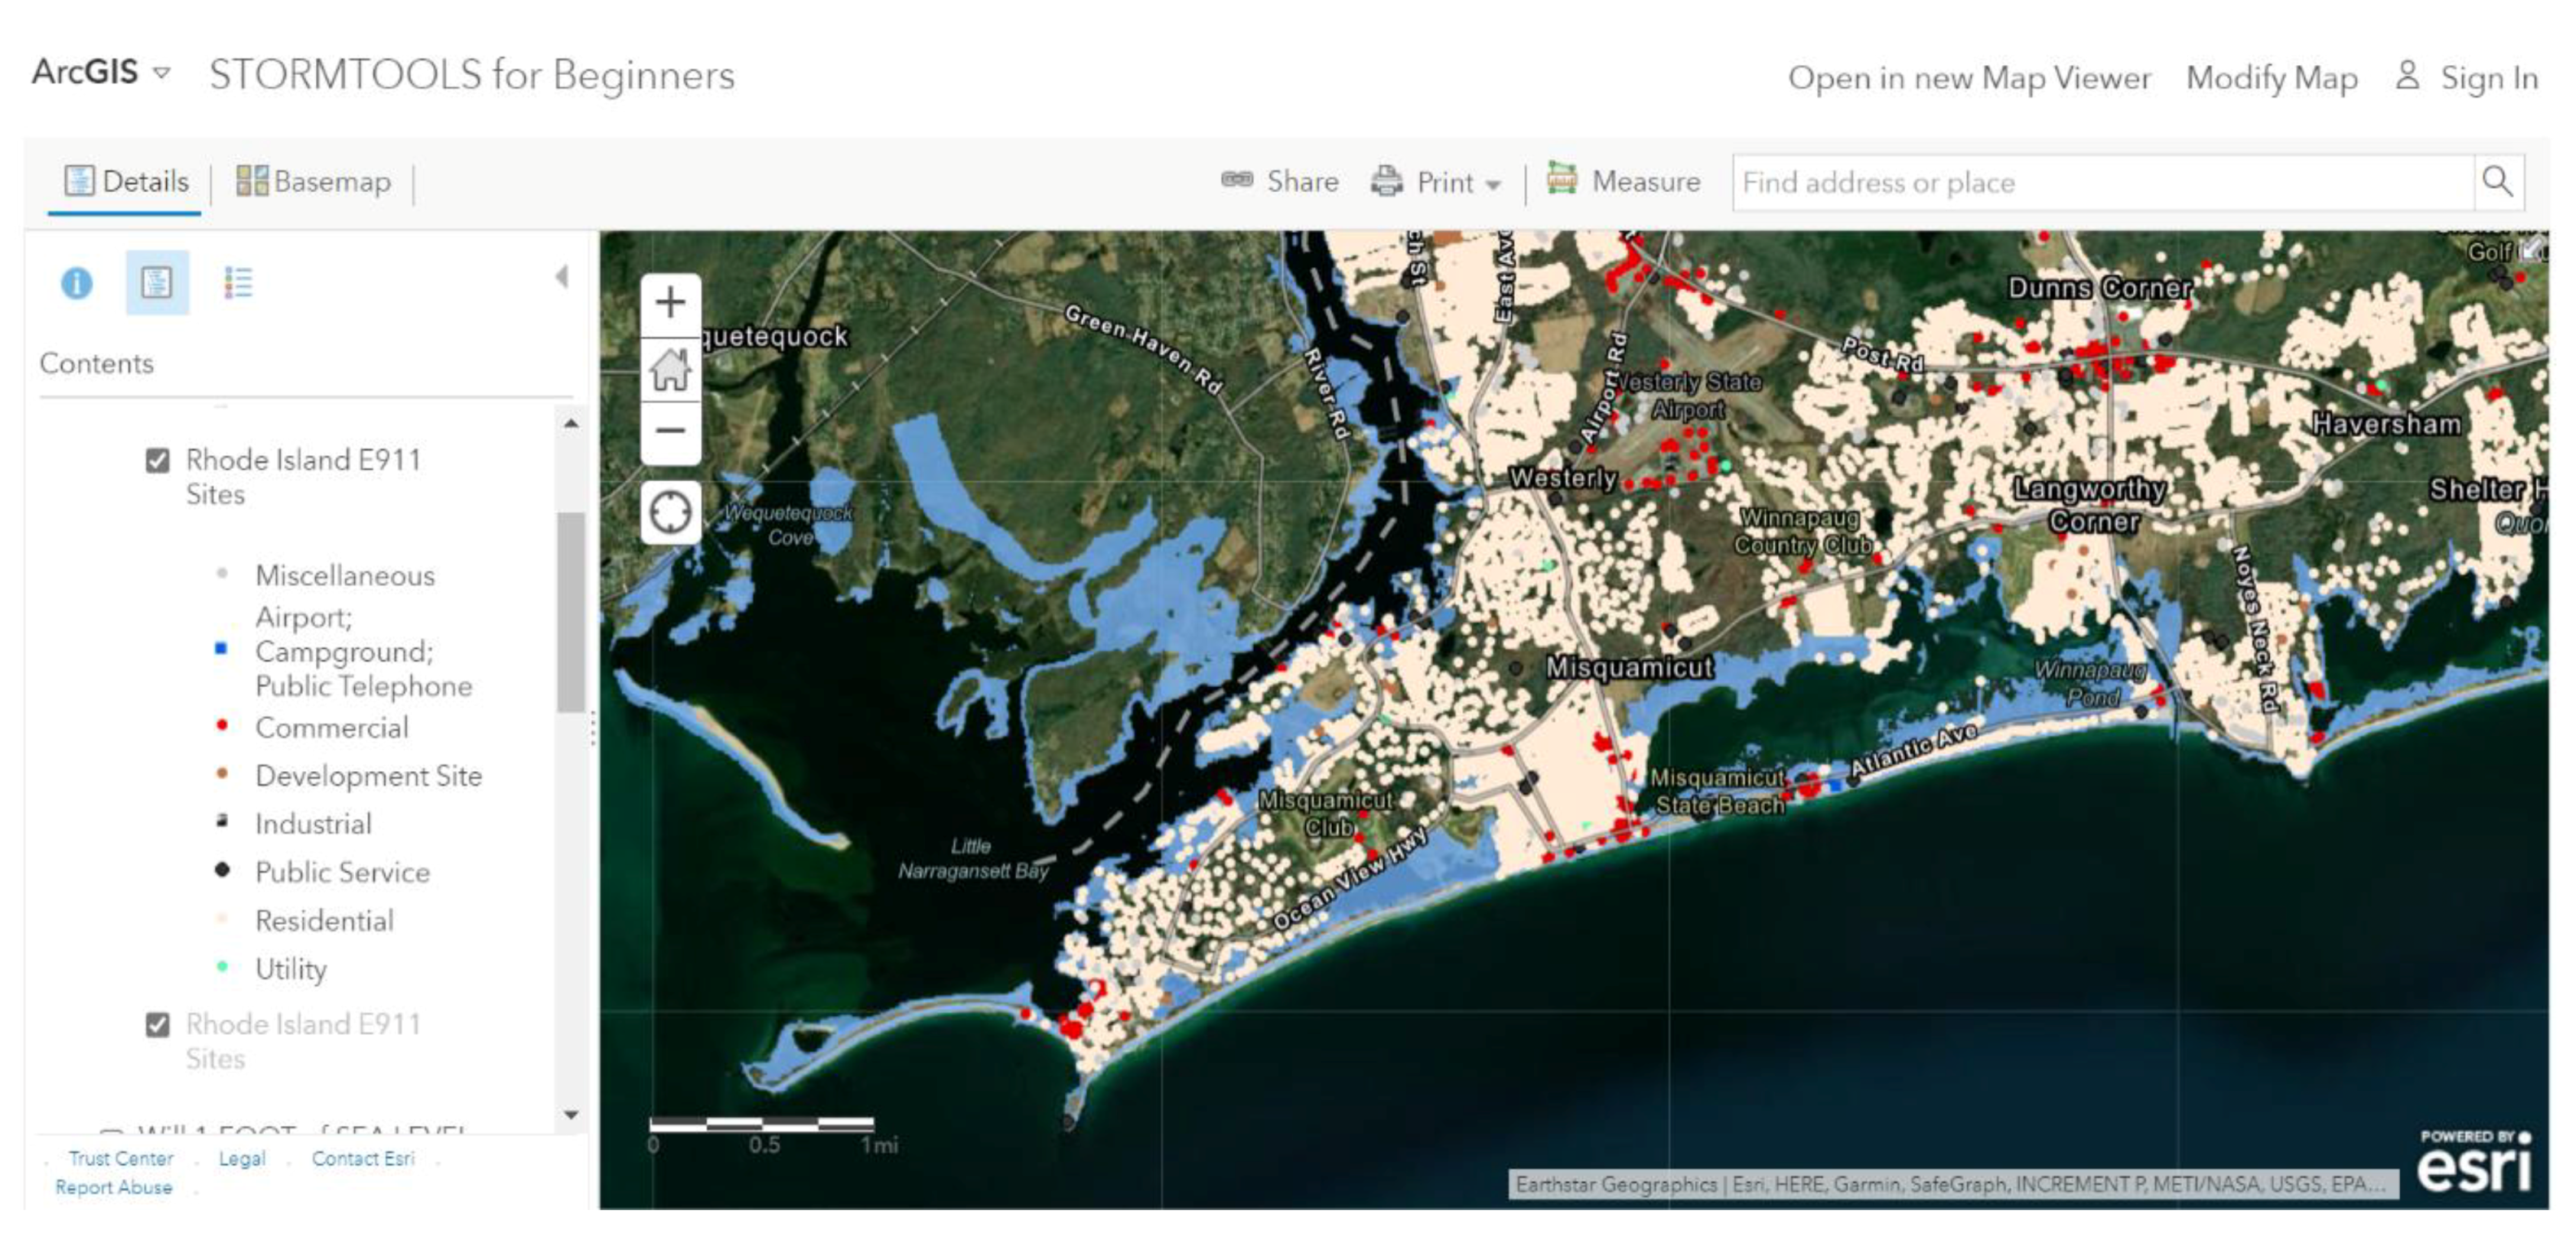
  • Develop an SDL index to help identify areas of risk by comparing and contrasting the SDL maps to CERI risk maps.
  • Test the method by applying it to the design of one-/two-story residential structures, without basements, on grade or elevated on open piles, in the coastal flood plain.
Section 2 of this paper presents the methods used in the analysis. Results and discussions are presented in Section 3. The study summary and conclusions are presented in Section 4. This paper summarizes work performed by a senior design class in Ocean and Civil and Environmental Engineering at the University of RI [15].
To illustrate the development of the SDL maps, a study area located in the south west corner of the state (Westerly, RI) encompassing a section of the southern RI shoreline from Winnapaug Pond to Napatree Point, including Misquamicut Beach was selected. The study area also included Little Narragansett Bay (Watch Hill, RI, USA), a semi enclosed bay on the lower Pawcatuck River. The study area is shown in Figure 2. The figure also shows the location of residential and commercial structures from the E911 database (emergency response database) validated by a review of the Town of Westerly, tax assessor’s database. The study area is typical of other southern RI shoreline communities (Charlestown, South Kingstown, and Narragansett) in terms of the density and types of residential structures in the flood zone). The figure also shows the area impacted by 5 ft of SLR, to help the reader put the topography of the area likely to be flooded into perspective.
To allow the SDL maps to be applicable to a wide variety of structures, the maps are unitized by the structure’s dimensions. This allows the user to scale the loads from the maps for a selected structure. The focus is on residential structures that predominate in the area, namely single- and two-story structures, without and with basements (NACCS prototypes: 5A (single story) and B (two story) without a basement, and 6A and B, single and two story with basements), and those elevated on piles (NACCS prototype: 7A (open piles) and B (enclosed piles)). The residential structures comprise about 95% of the structures in the flood hazard area shown in Figure 2. Commercial structures make up the remaining 5% of the total. Most of the residential structures are Types 5 and 6 (82%), with less than 13% elevated on piles (Type 7). Details on the structures at risk from flooding according to prototype, including the effects of SLR, are provided in Figure 4, shown in [5] for all southern RI shoreline communities. Structures at risk of flooding increase substantially with SLR. For the 100 yr storm with 2 and 5 ft of SLR, the residential structures damaged increase by approximately 30% and 50%, respectively compared to the equivalent 100 yr storm without SLR [5]. Details on the USACE NACCS prototype classification and associated inundation and wave damage curves are provided in Simms et al. [8].
To help put the flooding hazard in perspective, SDE maps for the study area are provided in the Supplemental Section, Figure S1 is for the 100 yr flood case with 0 ft of SLR and Figure S2 is for the 100 yr flood, 5 ft SLR case. The maps include the total inundation depth (ft, relative to grade elevation), the surge depth (ft, relative to NAVD88), the wave crest height (ft), and the BFE (ft, relative to NAVD88). SDE maps for other SLR cases (2, 3, 7, and 10 ft) are available via the STORMTOOLS ArcGIS Hub [14], but given space limitations, are not shown here. Figure S3 shows a table of contents for the ArcGIS Hub system. Figure S4 shows CERI predictions for the damage to individual structures (left panel) and structural damage risk (right panel) for the 100 yr flood, with no SLR (upper) and 5 ft of SLR (lower). Maps for the other SLR cases (2, 3, 7, and 10 ft) are available but not shown here [14]. The individual structure risk maps show the projected damage to each structure. The general damage risk maps on the other hand are generated by assuming that the structure that experiences the greatest damage (Prototype 5A, single-story house without a basement and with a 2 ft FFE) is located at each grid point in the study area, with rankings from moderate to extreme. These maps were requested by the communities to help understand the relative risk at a given location in the absence of a structure at a particular location. The structures that are projected to be inundated with SLR are noted by a special contour line.

2. Methods

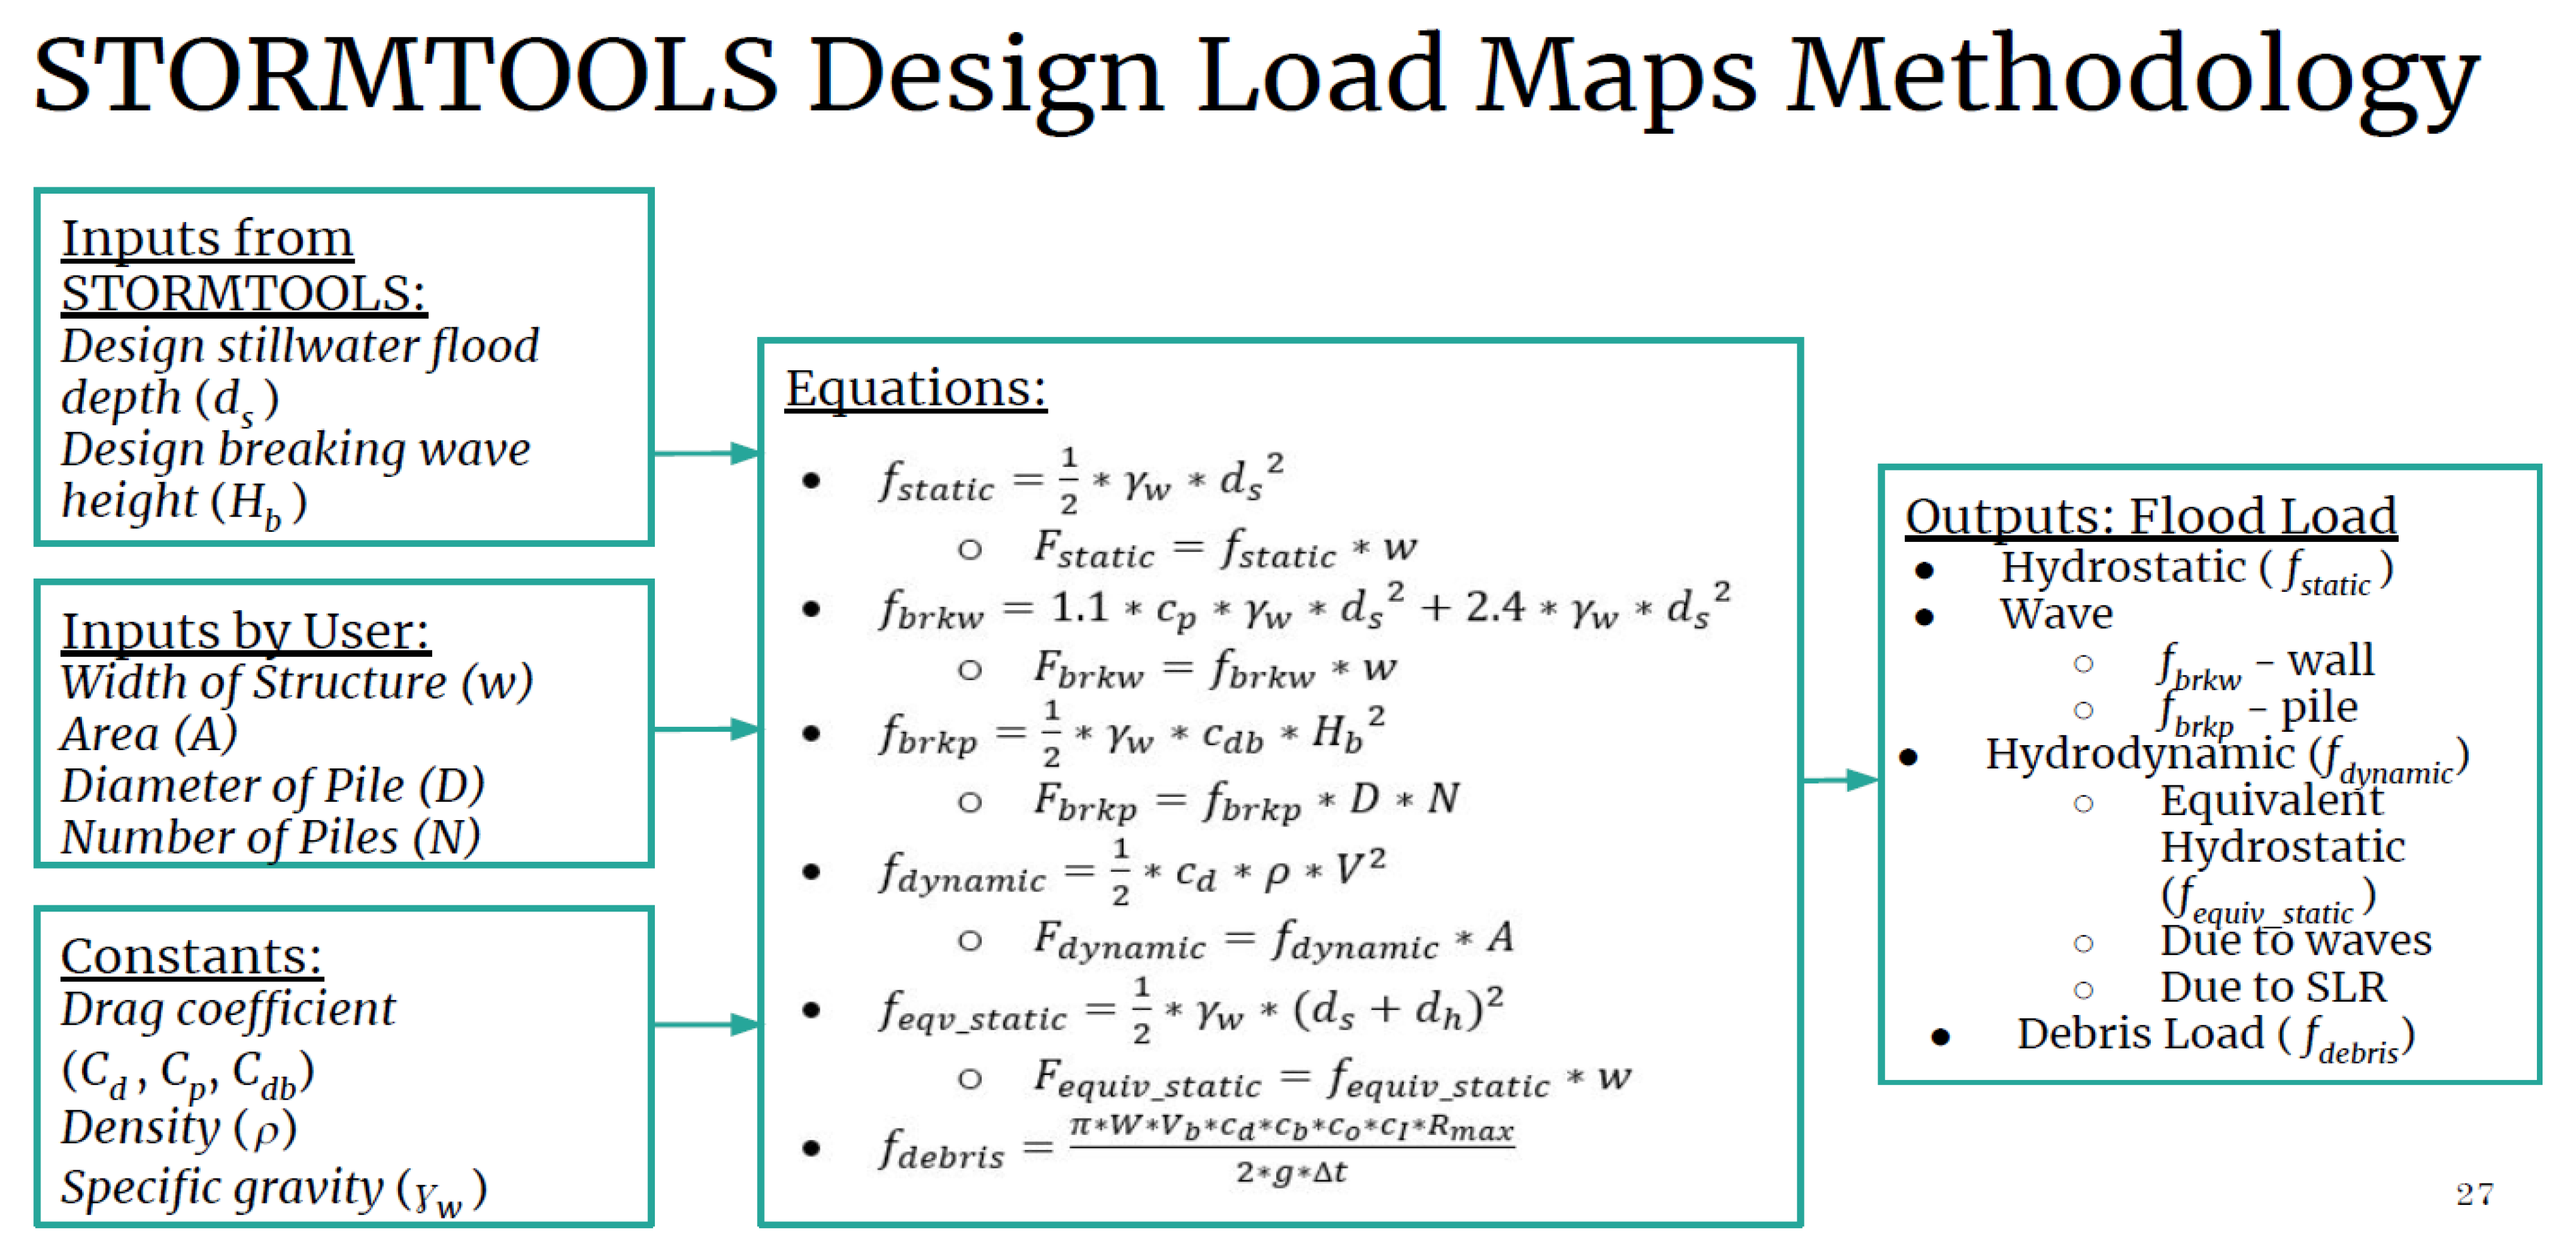
2.1. Flood and Debris Loads

The methods used to estimate the flood loads are taken from the ASCE/SEI 7–16 guidelines [9] and FEMA Coastal Construction Manual (CCM) [10] and are summarized in Figure 3. The equations for each are provided in the guidelines/manual and provided in Figure 3 (center section). A list of variables in the equations is also provided in the figure, as well as at the end of the paper. The figure also shows the inputs from STORMTOOLS SDE maps (ds and Hb) and from the user, specifically the structure description and model constants (left side), and flood loads predicted by the model for hydrostatic, wave, hydrodynamic, and debris loads (right side). The digital elevation model (DEM) for the study area is based on US Geological Survey (USGS) maps with a horizontal resolution of 3 ft. The vertical resolution of the elevation has a Root Mean Square Error (RMSE) of 6 in. The DEM maps are available via the RI Geographic Information System (RIGIS).
The coefficients for each load and guidance on their selection are provided in both the ASCE and CCM manuals [9,10]. The location where the loads are applied depends on the load type: 0.67ds for the hydrostatic loads, 0.1ds below design surge level, ds for the wave loads, and mid-depth for hydrodynamic loads (0.5ds). The hydrodynamic loads, fdynamic which depend on the flood flow velocities, can be converted to equivalent hydrostatic loads fequiv_static, provided that the current speeds are below 10 ft/sec, and added to the hydrostatic loads (fstatic) [9]. It is noted that all the loads have been unitized by the width of the structure, w, with the goal of making the load maps (load per unit width) simple to use for any structure of interest. Width is defined as the longest horizontal dimension of the structure. The hydrodynamic loads are provided in terms of the cross-sectional area of the structure, A, which is defined as A = ds ∗ w. If the flow speeds are sufficiently low, then these loads can be converted to equivalent static loads and scaled by the structure width. The values of ds and Hb are provided by the SDE maps for the 100 yr return period and selected sea level rise value of interest (see Figures S1 and S2 as examples for the 0 and 5 ft SLR cases). The user needs to provide the structure type (on grade or elevated on piles and associated FFE), structure width (w), and for elevated structures, the number of piles (N) and their diameters (D). Pile spacing is nominally 10 ft. If the user wishes to use alternate estimates of the various coefficients used in the analysis, the estimates from the maps need to be scaled accordingly.
The debris loads were estimated using ASCE/SEI 7–16 Eq. C5.4-3 [9]. The total debris impact force is fdebris. The variables, shown in Figure 3 (center panel), with the recommended nominal values in parentheses include: W—the weight of the debris (1000 lbs), Vb—the velocity of the debris (½ ∗ (g ∗ ds)1/2), Ci- importance coefficient (1), Co-orientation coefficient (0.8), Cd—depth coefficient(1.0), Cb—blockage coefficient (1.0) (the blockage coefficient decreases when the structure spacing goes below 30 ft), Δt—duration of debris impact (0.03 s), Rmax—maximum response ratio for impulsive loads (0.6), T -structural period (0.2 s), and g—gravity (32.2 ft/s2). The debris loads are applied at the water line for the side of the structure that is facing the flow. The debris loads are the highest possible and assume the presence of debris at all locations.
To obtain estimates of the hydrodynamic loads due to the storm surge, the ADCIRC hydrodynamic model was applied to RI with a high-resolution, triangular finite-element grid in the study area. Figure 4 shows the grid for RI and the area immediately offshore (left panel). The grid has been substantially refined to capture the details of the coastal ponds and associated inlets. The USACE NACCS storm #492 was selected since it represents the 100 yr storm event for the state. Simulations were performed for the 0, 3.2, and 6.6 ft SLR cases. Linear interpolation was used to determine the current speeds for the selected values of SLR between these values. Details on the hydrodynamic model application are provided in the SDE paper [6]. The right panel of the figure shows the peak surge currents for the 3.2 ft SLR case at the grid points in the study area. The figure clearly shows that the strongest currents are in the inlet into Winnapaug Pond. There is no impact on structures or overtopping of the dune system at this location.
Figure 5 shows a contour map of the model-predicted currents for the 100 yr storm with 3.2 ft of SLR. Maps for the remaining SLR cases are provided in [13]. The currents are predicted to be highest along the barrier-dune system south of Winnapaug Pond where surge overtopping and the development of surge channels occur and decrease substantially as one moves inland. Current speeds increase with increasing SLR and scale approximately linearly with the inundation depth. It is noted that the surge induced current speeds are typically well below 10 ft/s and the hydrodynamic loads are typically converted to equivalent hydrostatic loads and added to base hydrostatic loads.

2.2. Structural Response

The Autodesk Professional Robot Structural Analysis (structural load analysis software that verifies code compliance and uses building information modeling (BIM) integrated workflows). It was applied to the two most common residential structures in the study area [5]: single-story homes without a basement (5A) and an elevated structure on open piles (7A) (https://www.autodesk.com/education/free-software/featured) (accessed 15 March 2020) [16], to determine the response to flood loading. This software was selected since it is widely used, extensively documented, and available on line to students. The two structures are shown in Figure 6. This figure also shows the dimensions of the structures and associated typical wood frame construction details, following local building code requirements. The walls were constructed with either 2 in by 4 in or 2 in by 6 in studs, 16 in on center, with 0.5 in plywood sheathing. Floors were constructed with 12 in floor joists, 16 in on center, with 0.75 in plywood underlayment. The structures are both assumed to be partially open, meaning that they have windows, doors, or both, on each side of the structure. Internal bending stresses due to moments in the key members (studs and floor joists) were used to determine structure failure. Details on the application are provided in Silverman et al. [15].

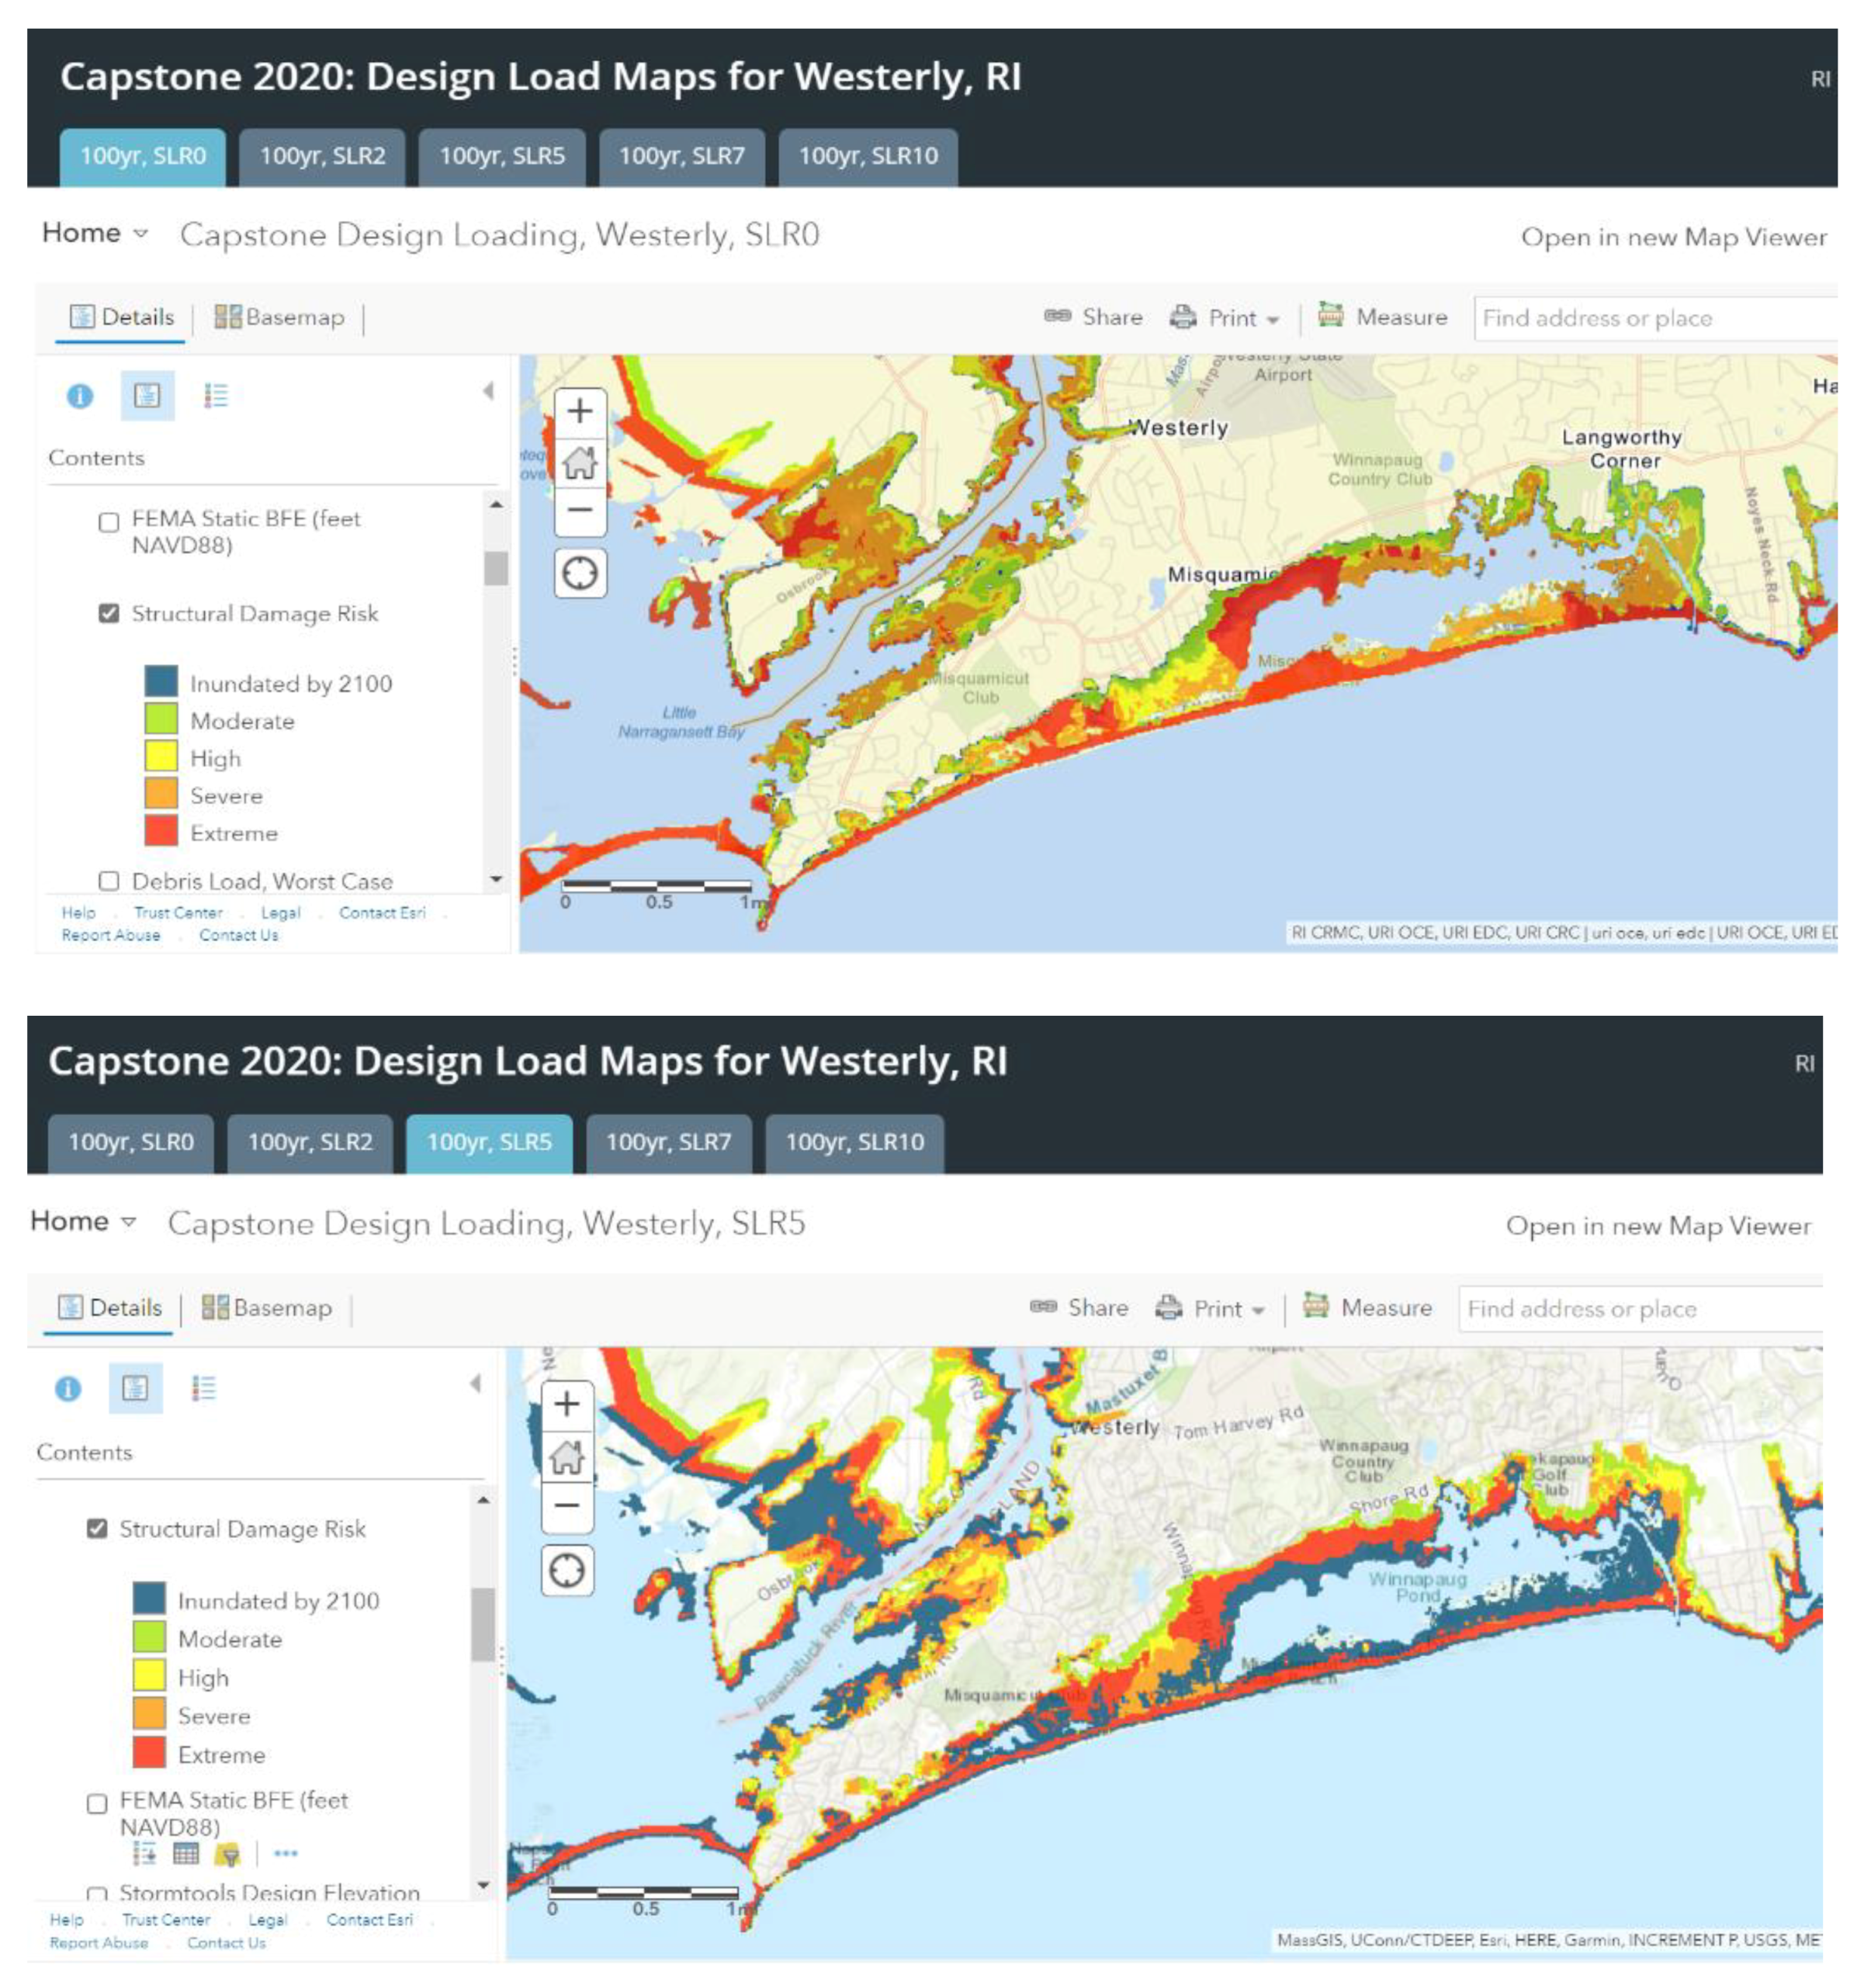
3. Results/Discussion

3.1. Flood Loads

Figure S3 shows a table of contents (pull down menu) for the SDL-GIS-based mapping system. The SDL maps are available at https://crc-uri.maps.arcgis.com/apps/MapSeries/index.html?appid=cd7c1dc499a64434b6b55ab34522794 (Accessed on 15 May 2021) [17] The table of contents shows the maps that are available, including access to the SDE maps [18] for varying SLR cases and the results of the SDL mapping. The figures provided below are taken from this mapping system.
The flood loads are summarized below for each load of interest. Graphics highlighting the loads and their location are available from the CCM [9].

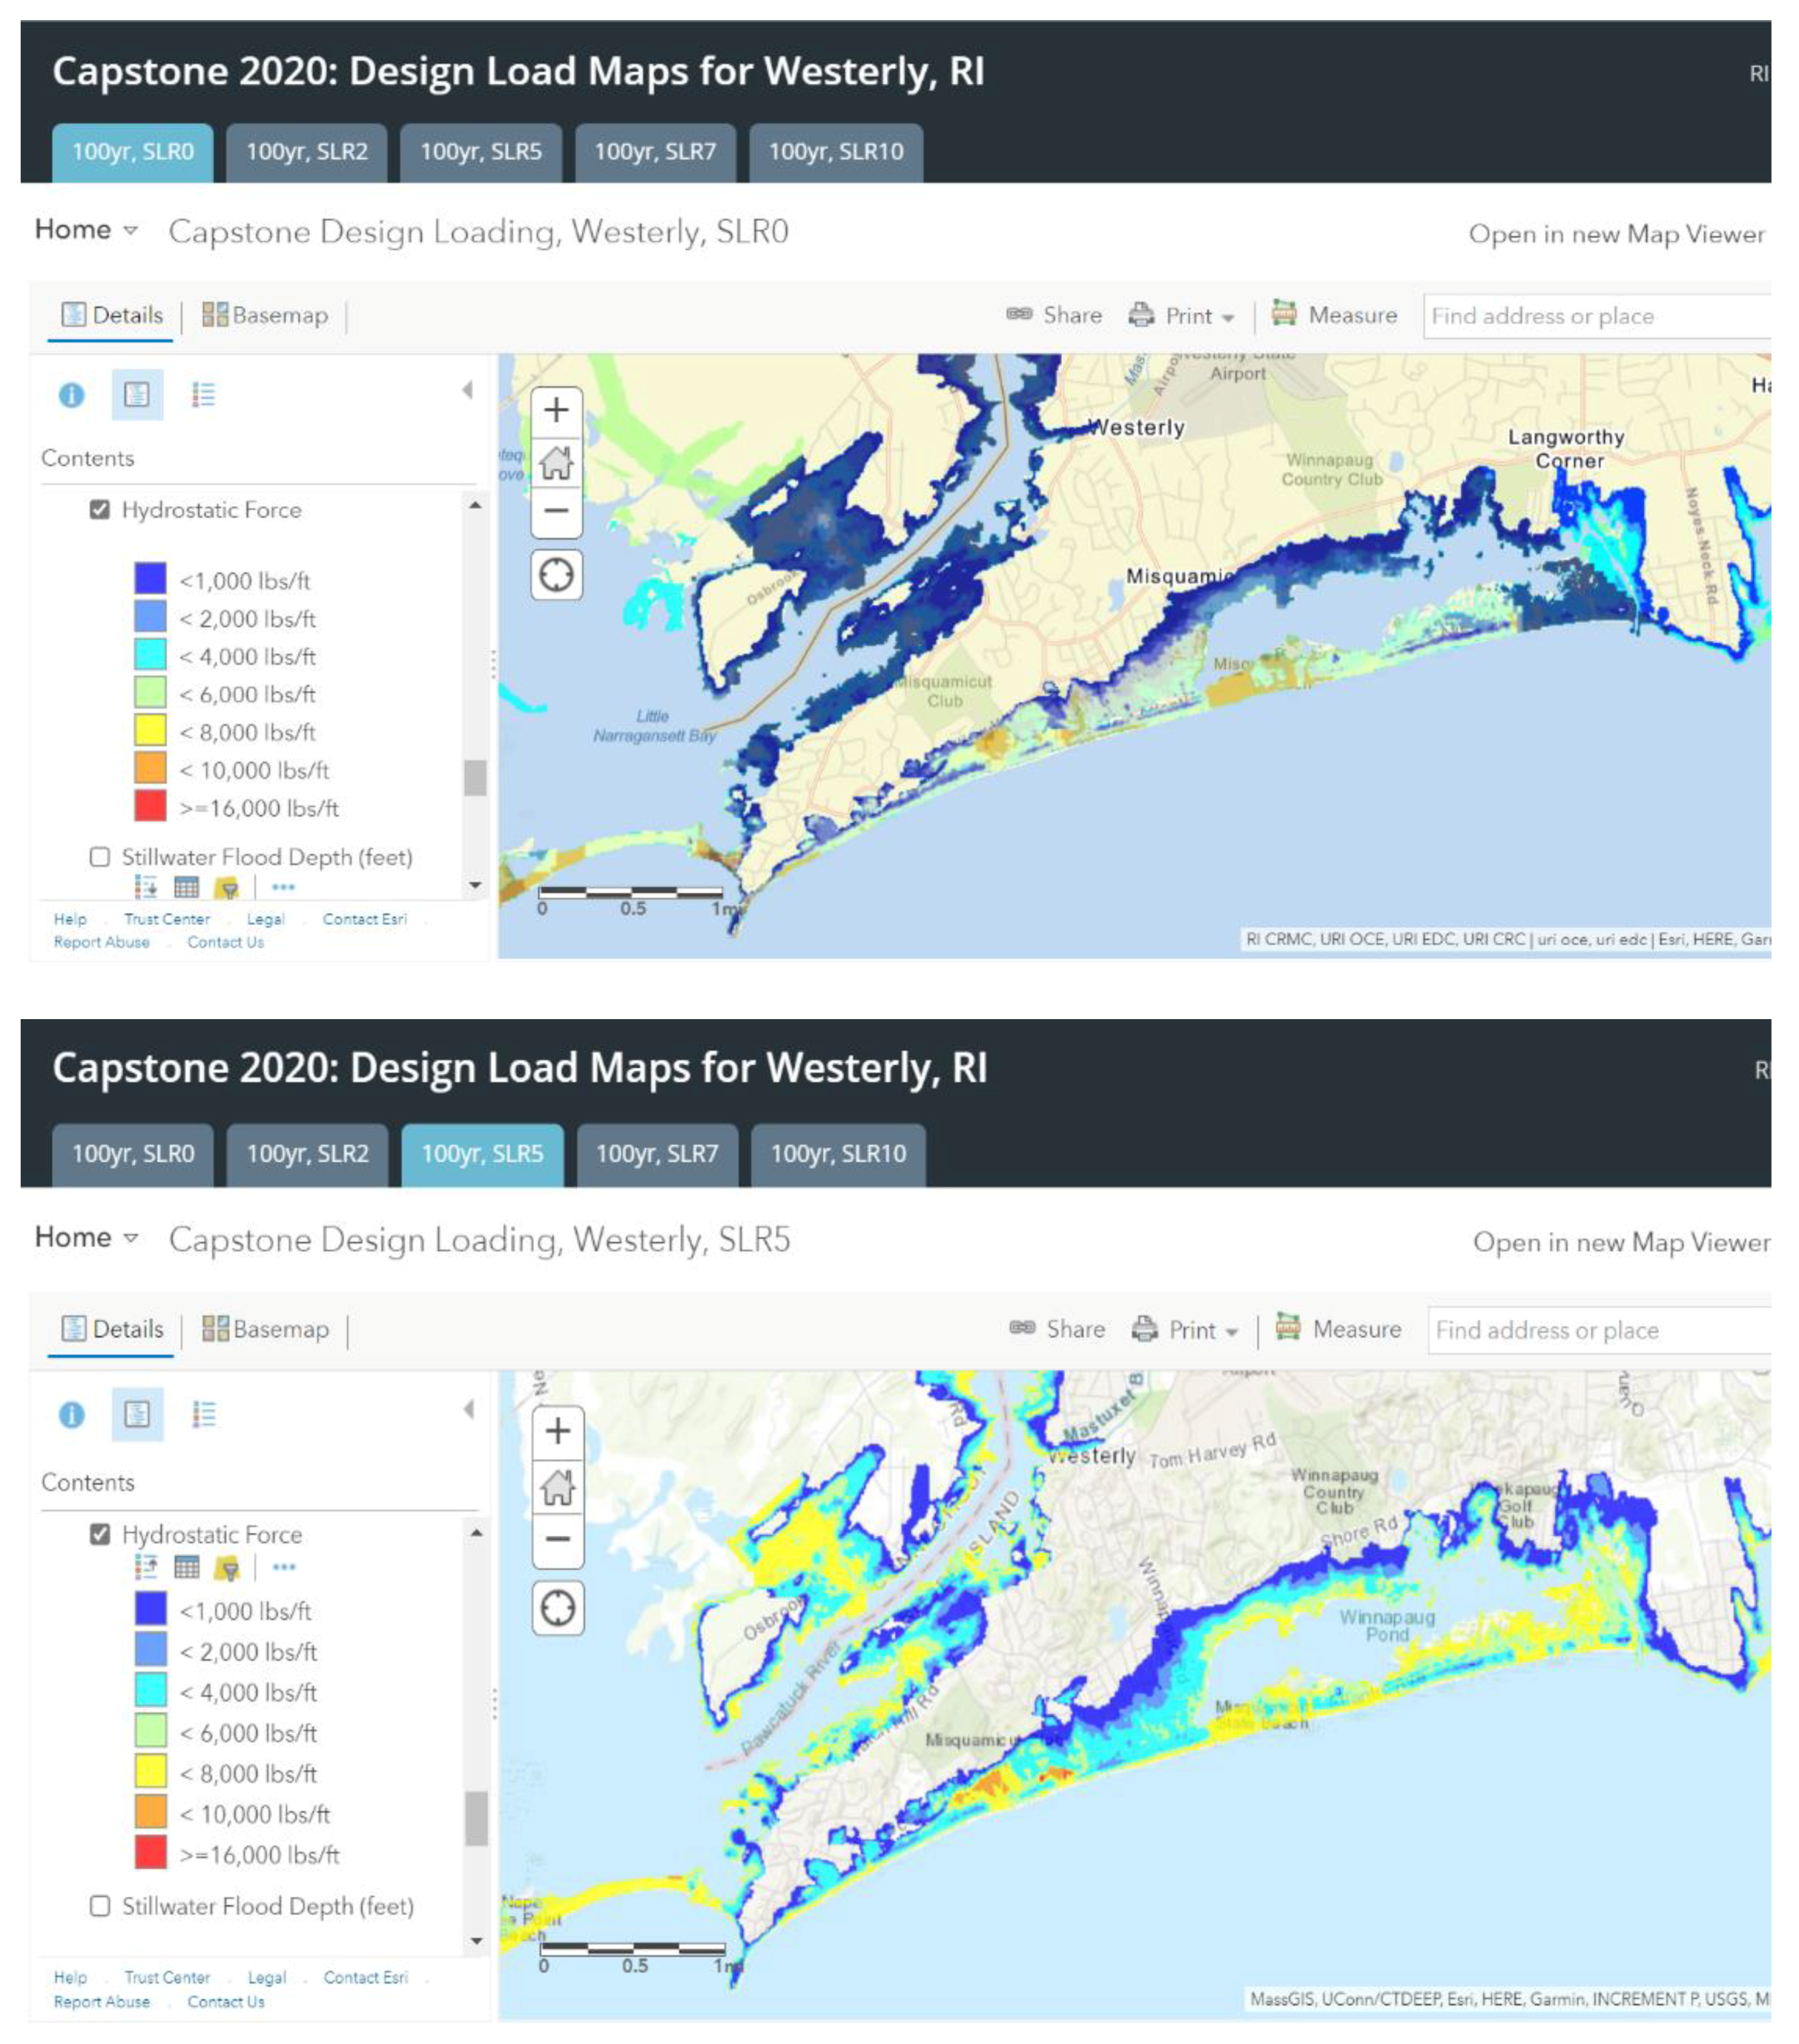
3.2. Hydrostatic Loads
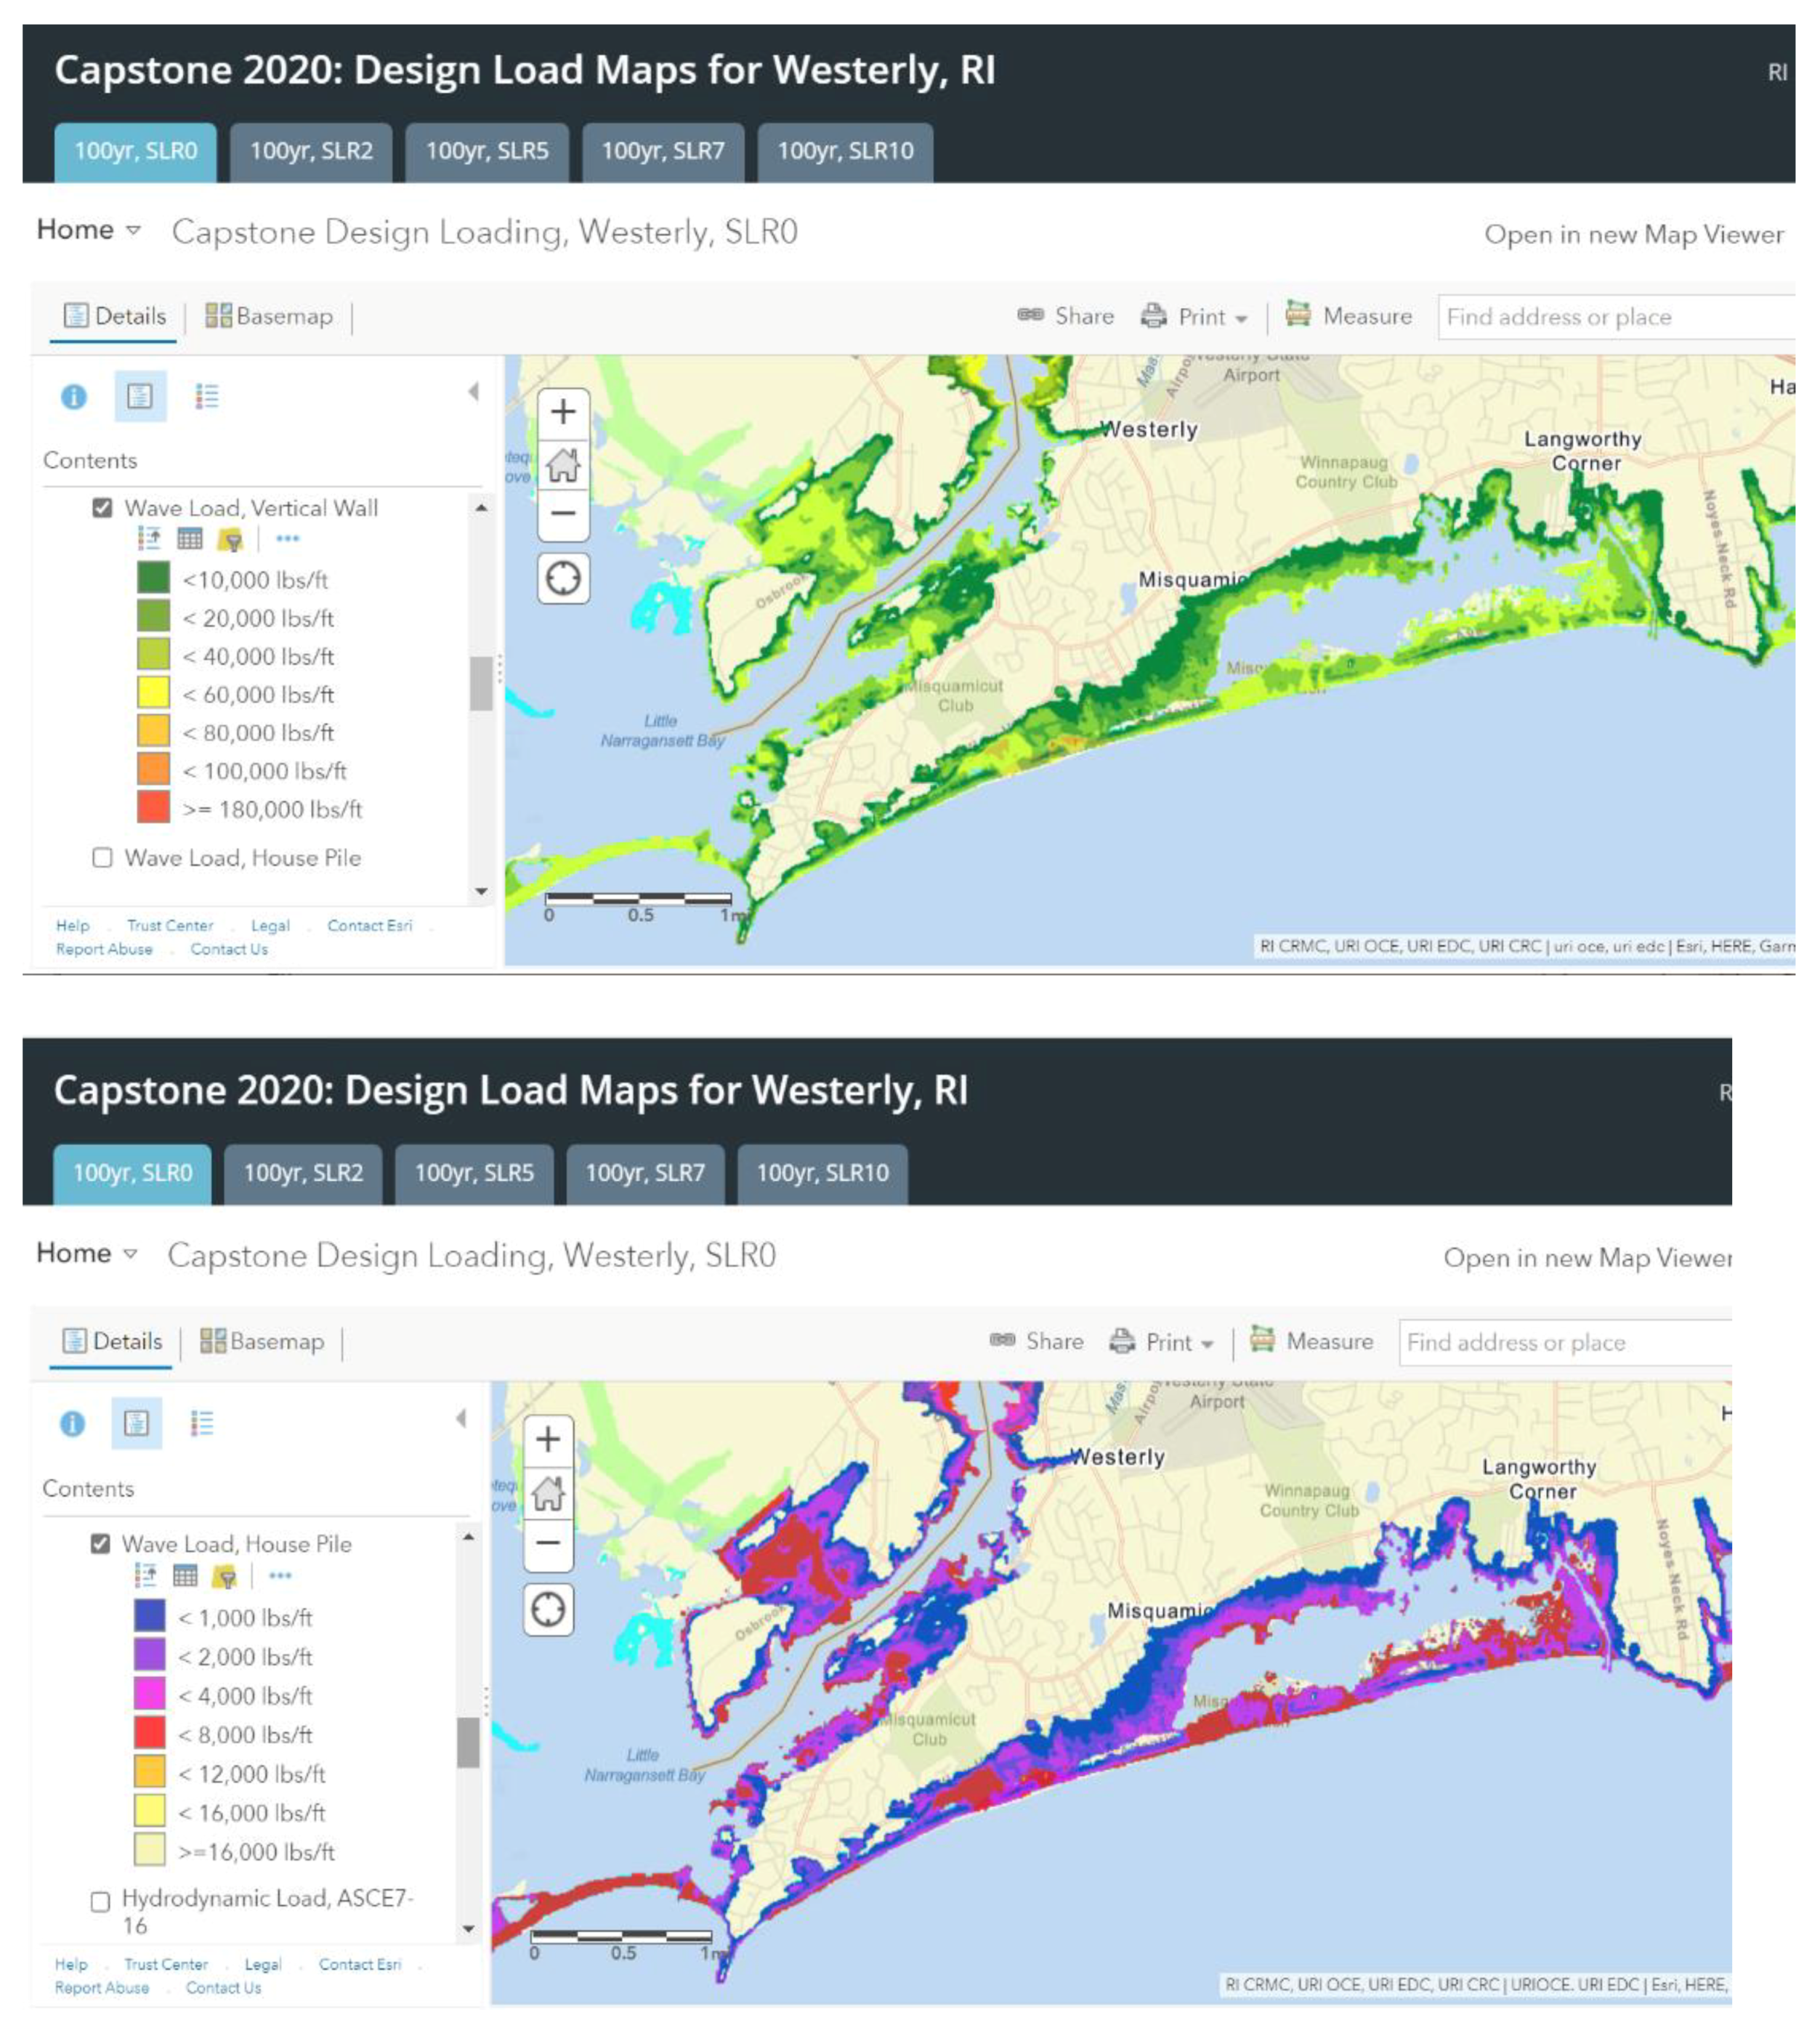
The hydrostatic loads for the 100 yr storm with 0 ft (upper panel) and 5 ft (lower panel) of SLR are shown in Figure 7. The values for the surge depth ds, relative to grade, necessary to make these estimates are provided in Figures S1 and S2, upper left panel, for the two SLR cases. The force acts at two-thirds of the local surge depth, ds. The hydrostatic force is predicted to be highest where the elevation of the topography is the lowest and thus the surge depth is the greatest. This force is predicted to decrease with distance landward, as the elevation of the topography increases, and to increase with SLR, in response to increases in surge depth. Hydrostatic loads are omnidirectional and can be countered by allowing water inside the structure via windows or doors.

3.3. Wave Loads

Maps for the wave loads for vertical walls for the 100 yr, 0 ft SLR case, for a Type 5A/6A structure are shown in the upper panel of Figure 8, while the loads for the Type 7A, pile supported structure are provided in the lower panel of the figure. The analysis for these two types of structures is separated, given the substantial difference in the foundations and support for the structures. Figure 9 shows the same maps, but for the 5 ft SLR case. Additional maps are available for 2, 7, and 10 ft SLR cases at the SDL web site [18], but are not shown. Wave loads are observed to be highest at the coast and decrease with distance landward, consistent with decreases in storm wave heights (Figures S1 and S2, lower left panel for no and 5ft SLR). The loads are predicted to increase with increasing SLR, since SLR increases the flooding depth and associated wave heights. The wave loads for pile supported structures are much lower than for the vertical walls, given the substantial difference in the width of the structure, w, versus a pile diameter (D), times the number of piles (N). The assumption here is that the piles are circular. If the piles are square, the drag coefficient needs to be adjusted. The unit wave loads are estimated to be much higher than the unit hydrostatic loads. For pile supported structures a transition occurs when the flood depth exceeds the FFE. Wave loads are directional and dependent on the storm wind and wave direction in the study area.

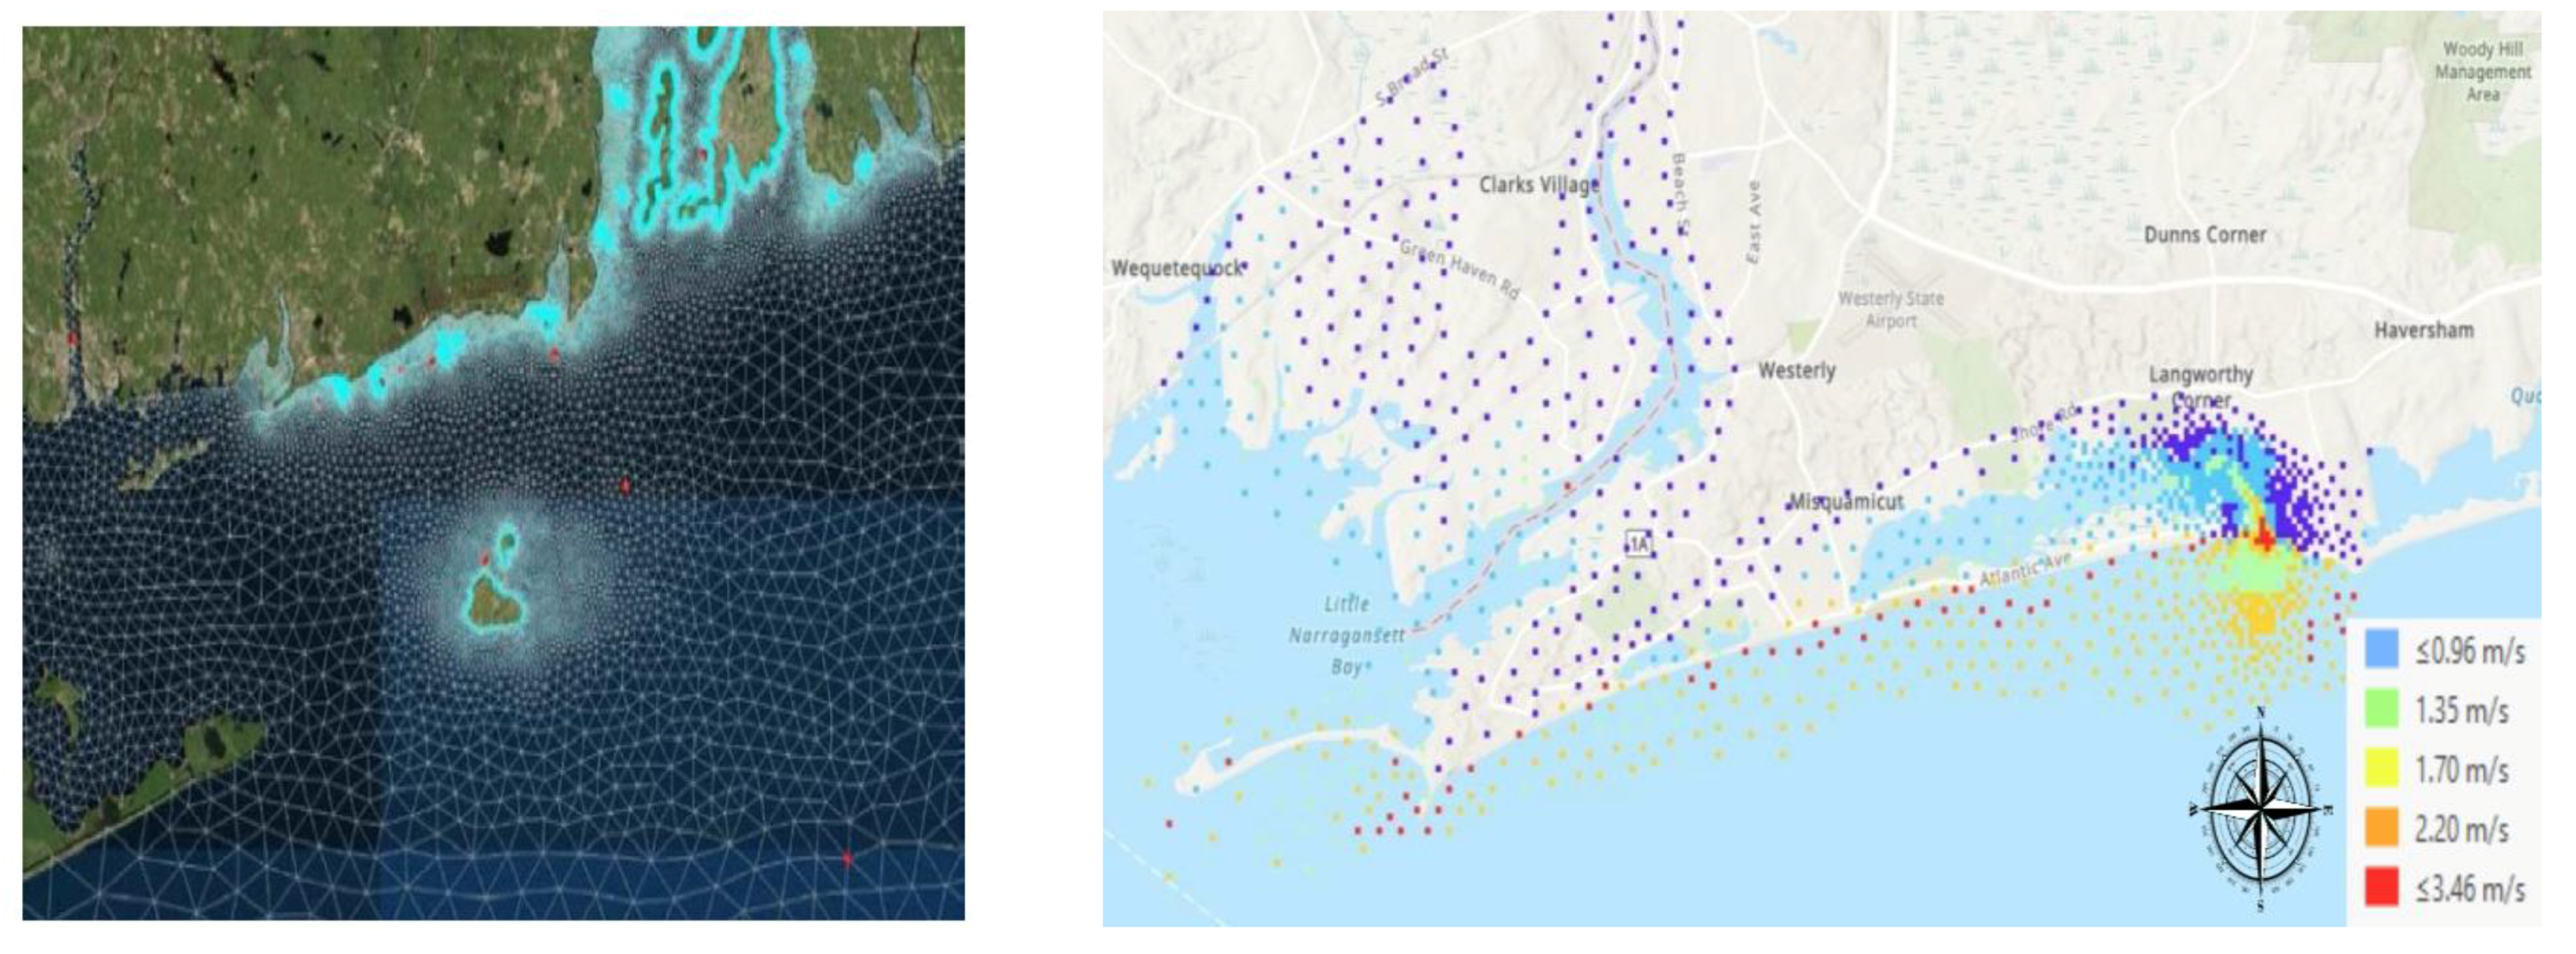
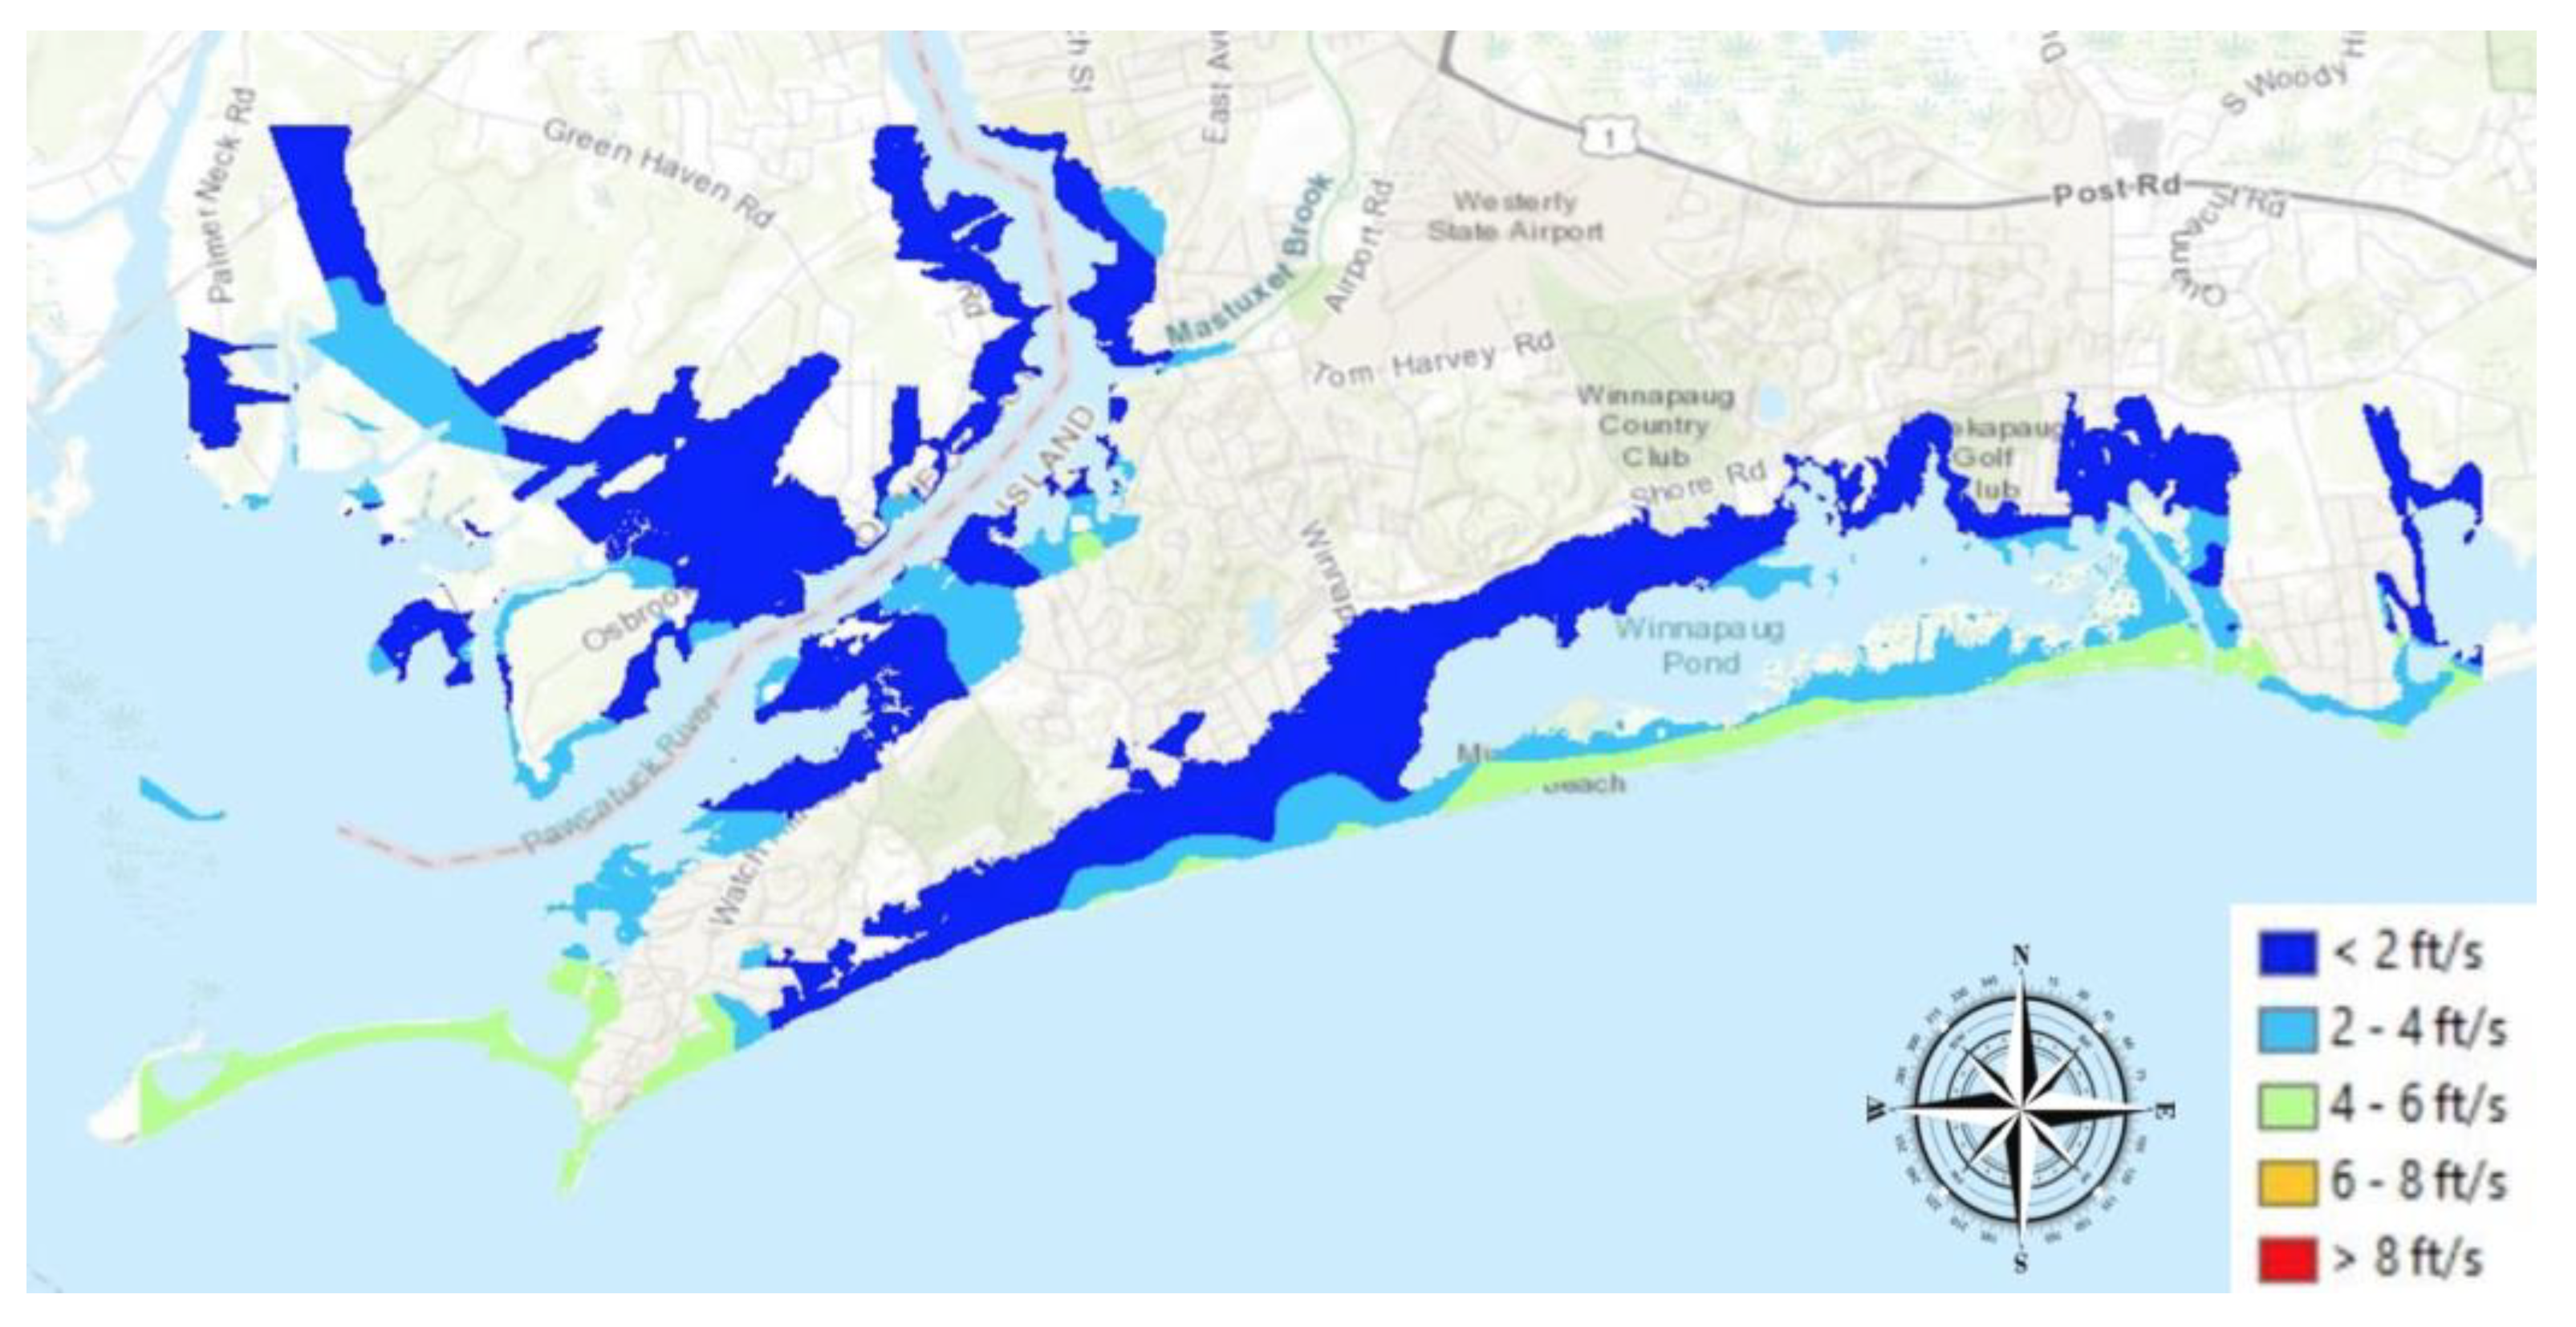
3.4. Hydrodynamic Loads
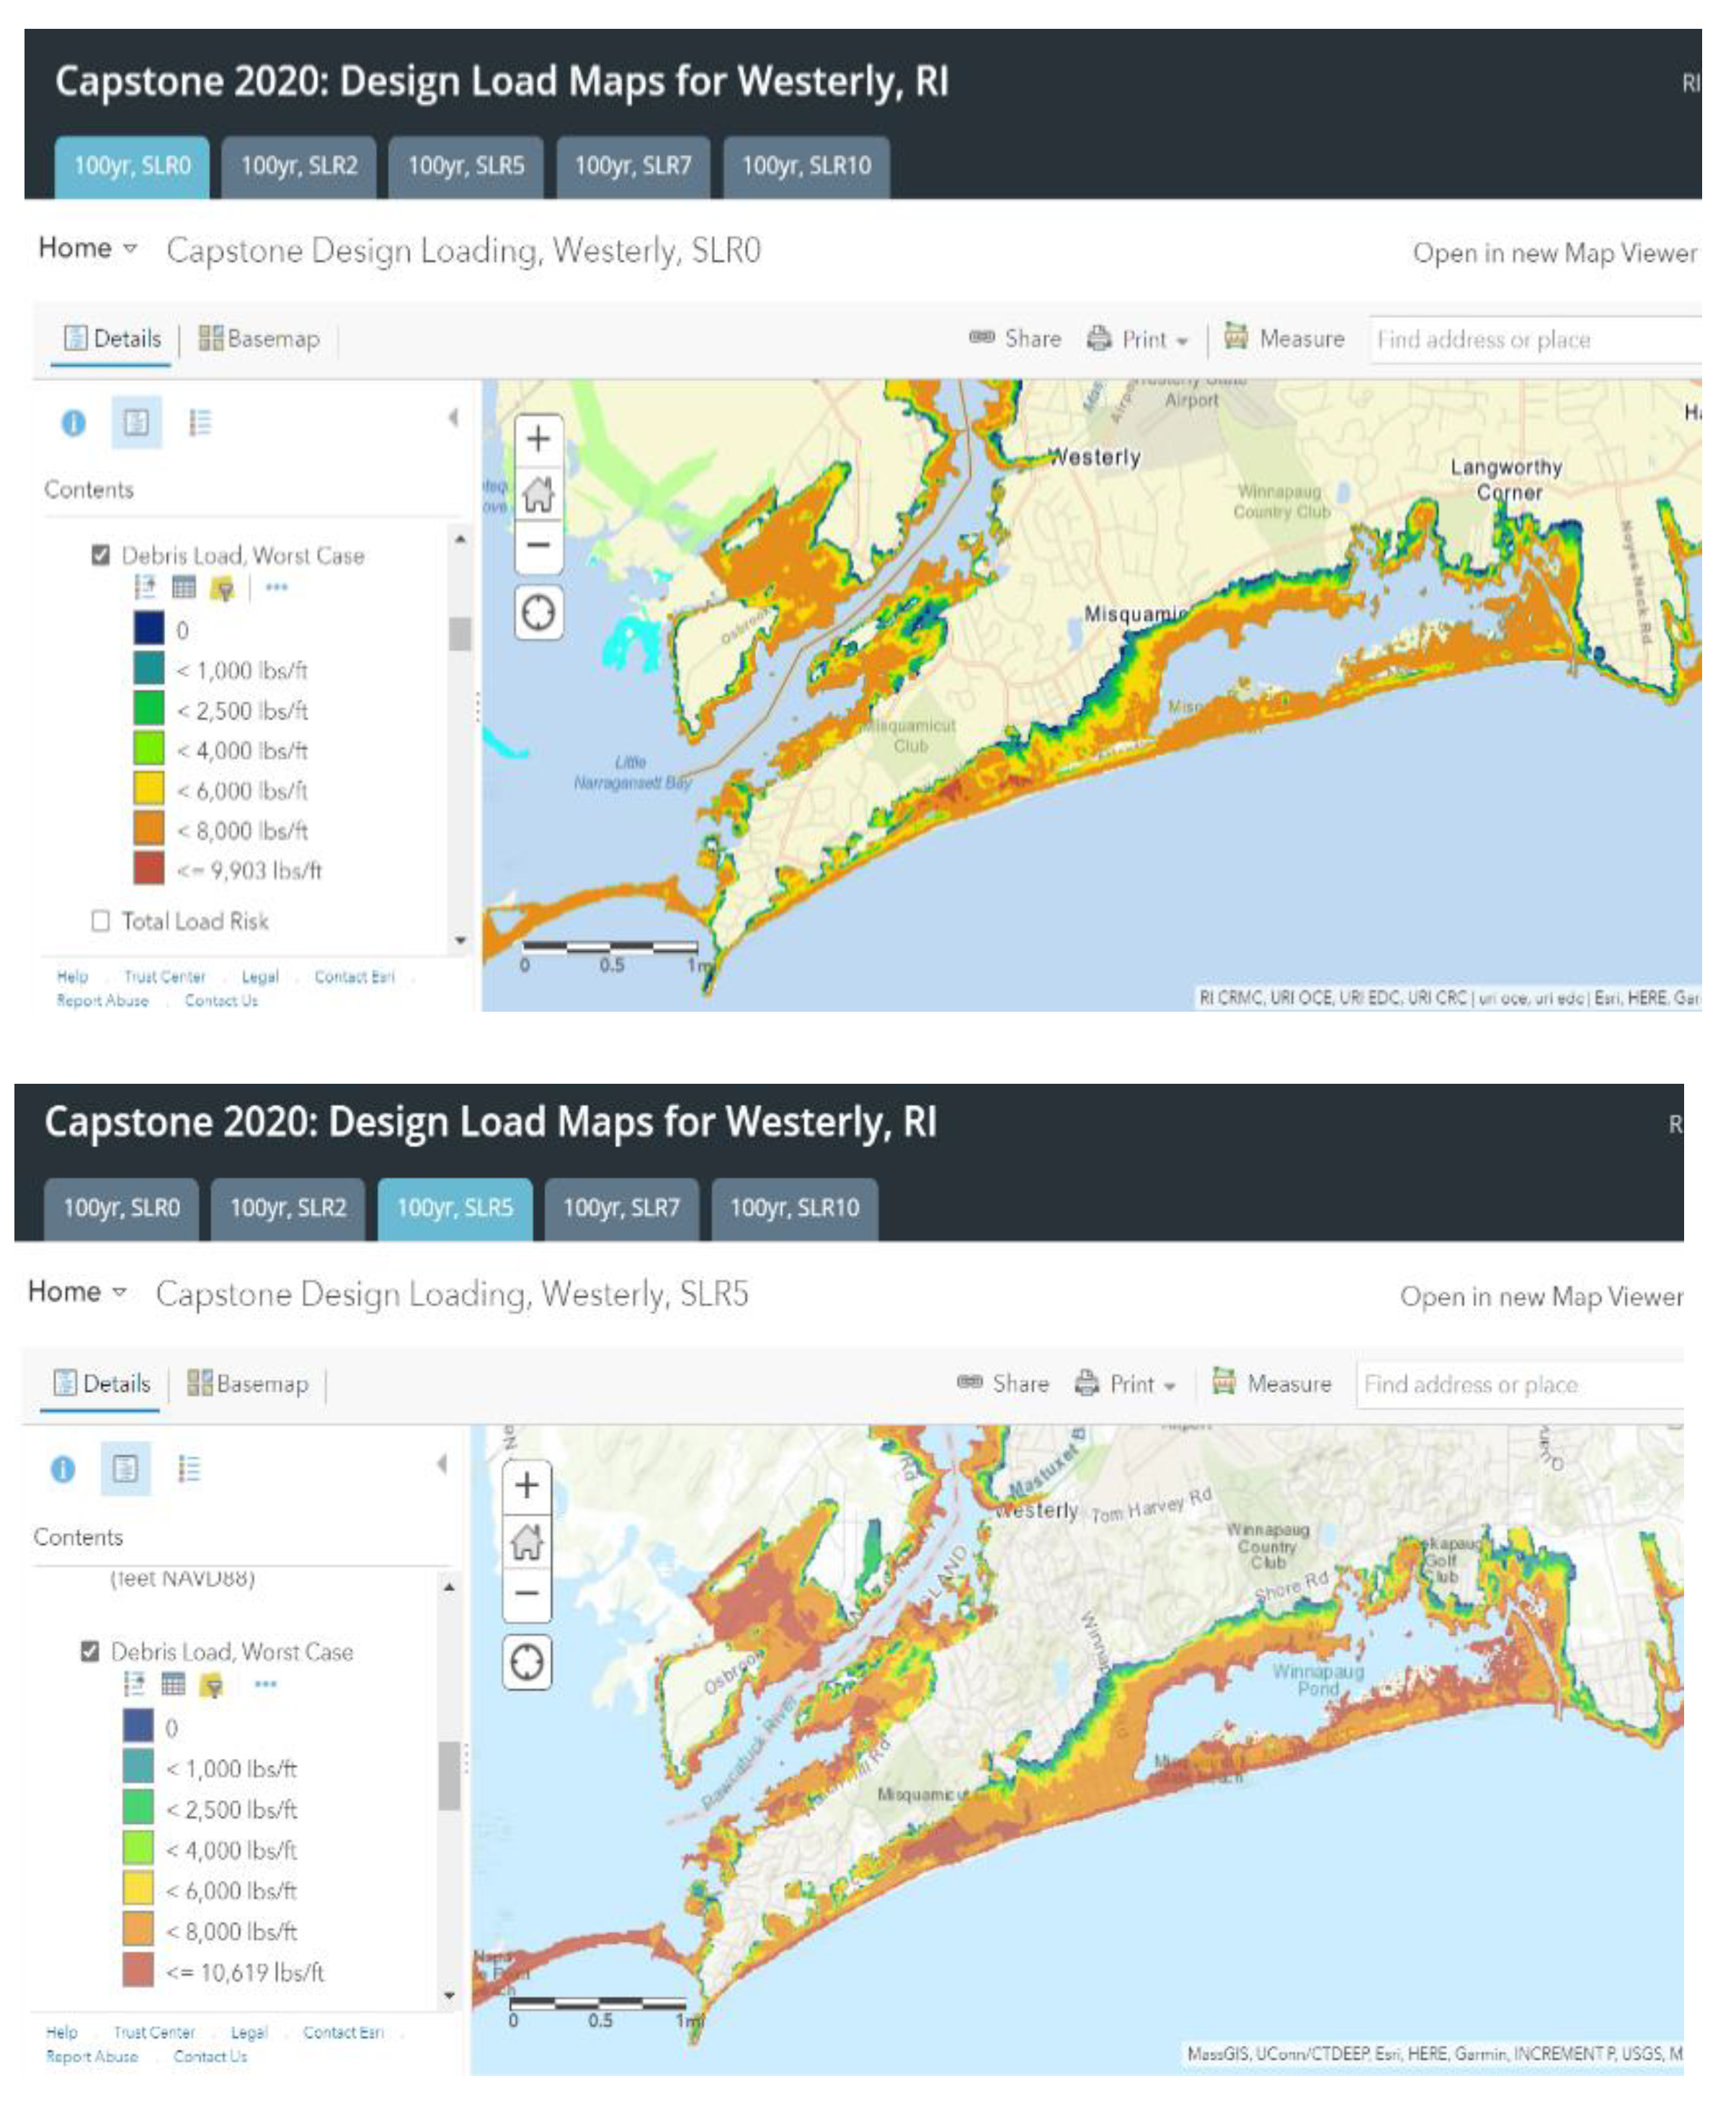
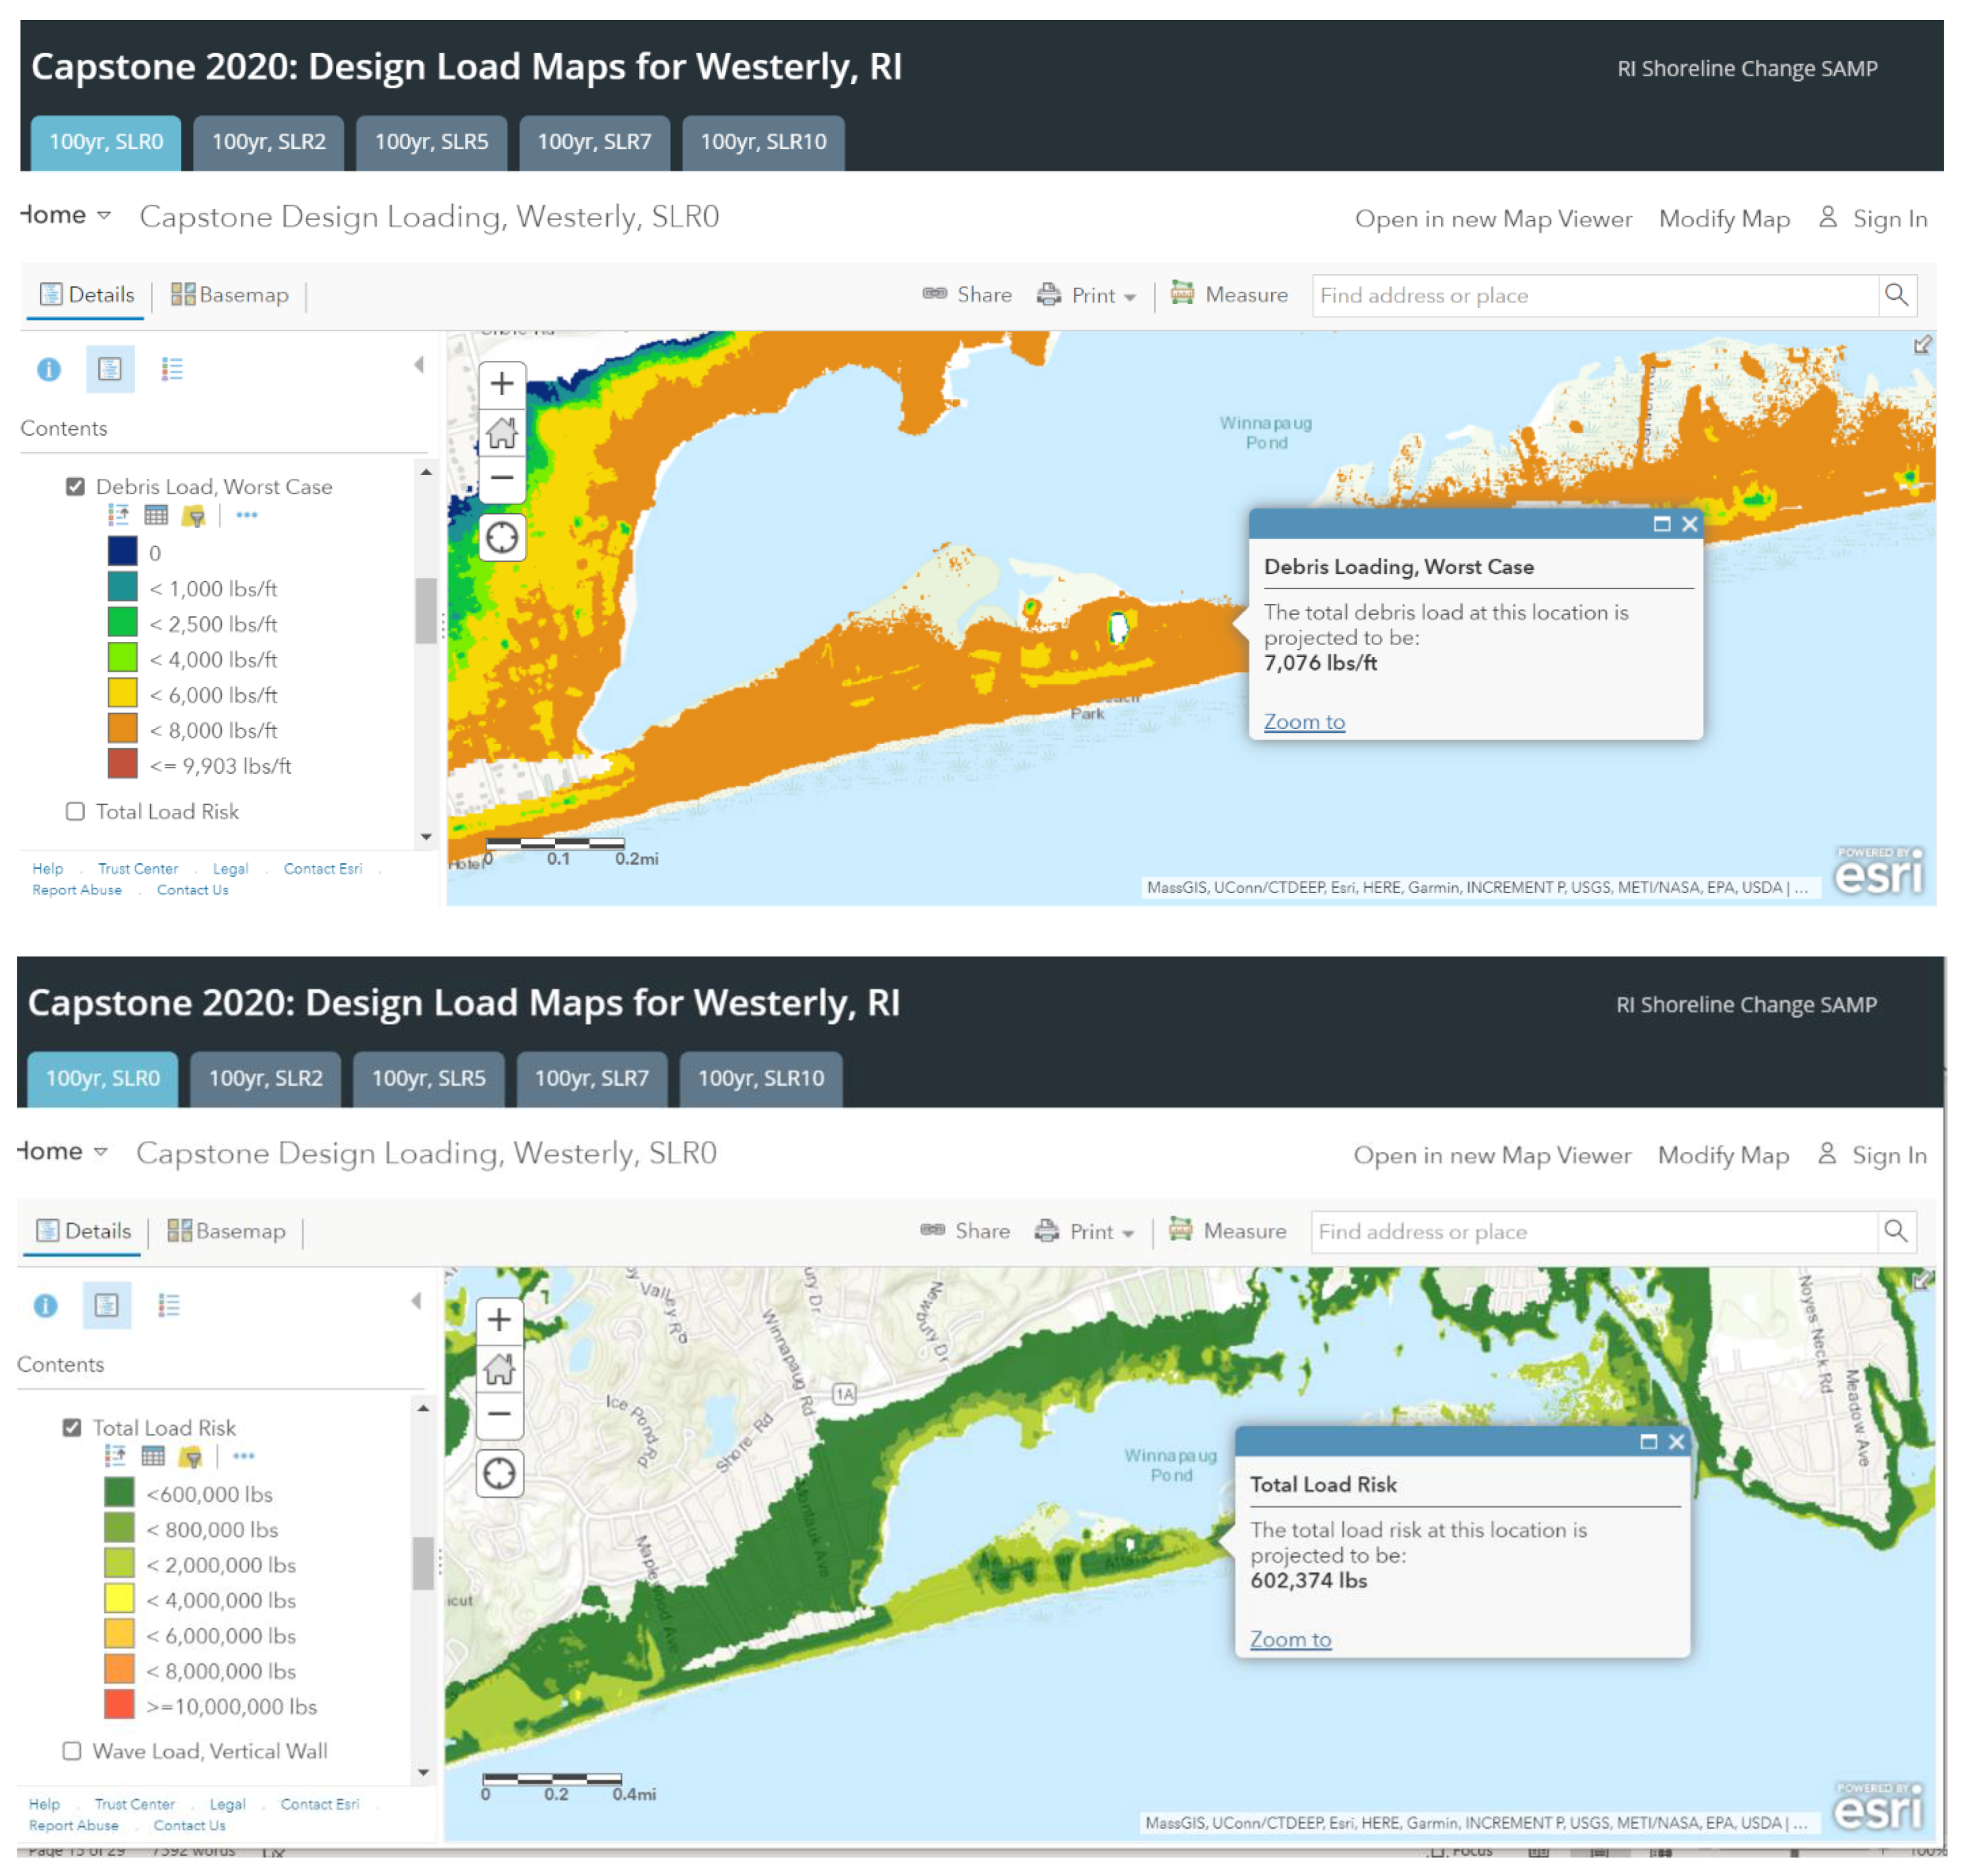
The hydrodynamic loads were estimated based on the FEMA CCM method [10] for the study area. Figure 10, upper panel, shows the results for the 100 yr storm with 0 ft of SLR. The loads scale with the current speed squared and are generally quite small given the low surge current speeds. ASCE/SEI [9] recommends that if the speeds are lower than 10 ft/sec that they can be converted into an equivalent hydrostatic load and added to the estimated hydrostatic loads. The result of performing this analysis is shown in Figure 10, lower panel. The current-induced hydrodynamic loads, after conversion to equivalent hydrostatic loads, can be compared to the original estimate of the hydrostatic load shown in Figure 7. The comparison shows only a small increase in load, typically less than 5%.
As an alternate strategy, following the FEMA CCM [10] method one can use the shallow water wave speed, which scales as the square root of the local water depth, to estimate the hydrodynamic load. Figure 11 shows the results of this estimate for the 0 ft (upper panel) and 5 ft (lower panel) SLR case. Note that these loads are lbs/ft2. To convert them to lbs/ft one needs to multiple them by the flooding depth, ds. The predicted loads are generally quite low and similar to the surge induced hydrodynamic loads, shown in Figure 10. Wave induced currents decrease landward as wave heights decrease (Figures S1 and S2) but increase with SLR, which results in greater inundation depths. Hydrodynamic loads are normally considered on three sides of structures, with the lee of the structure assumed to experience no load.

3.5. Debris Loads

The debris impact load maps for the 100 yr storm, and SLR of 0 and 5 ft, are shown in Figure 12, upper and lower panel, respectively. The loads are given in lbs/ft, so are unitized by the structure width. For this study, the debris impact load maps were developed for the highest load scenario. To provide a baseline for the potential damage to a general structure, the loads shown are based on the conservative assumption that flood-borne debris is present at every location within the study area. Debris, transported by the currents generated by surge and waves, is typically created from the first row of homes and local objects, such as trees and utility poles. It gradually impacts structures moving inland/in the flood direction until reaching a point where it is no longer of concern since the debris has been trapped by structures closer to the ocean or the debris source. The debris impact load is important to consider when designing structures in high density residential areas, particularly those in close proximity to the shoreline. The load is predicted to increase with SLR because of the higher wave induced current speeds. Debris loads are generally considered line loads, at the water line, on the side of the structure facing the incoming flow direction.

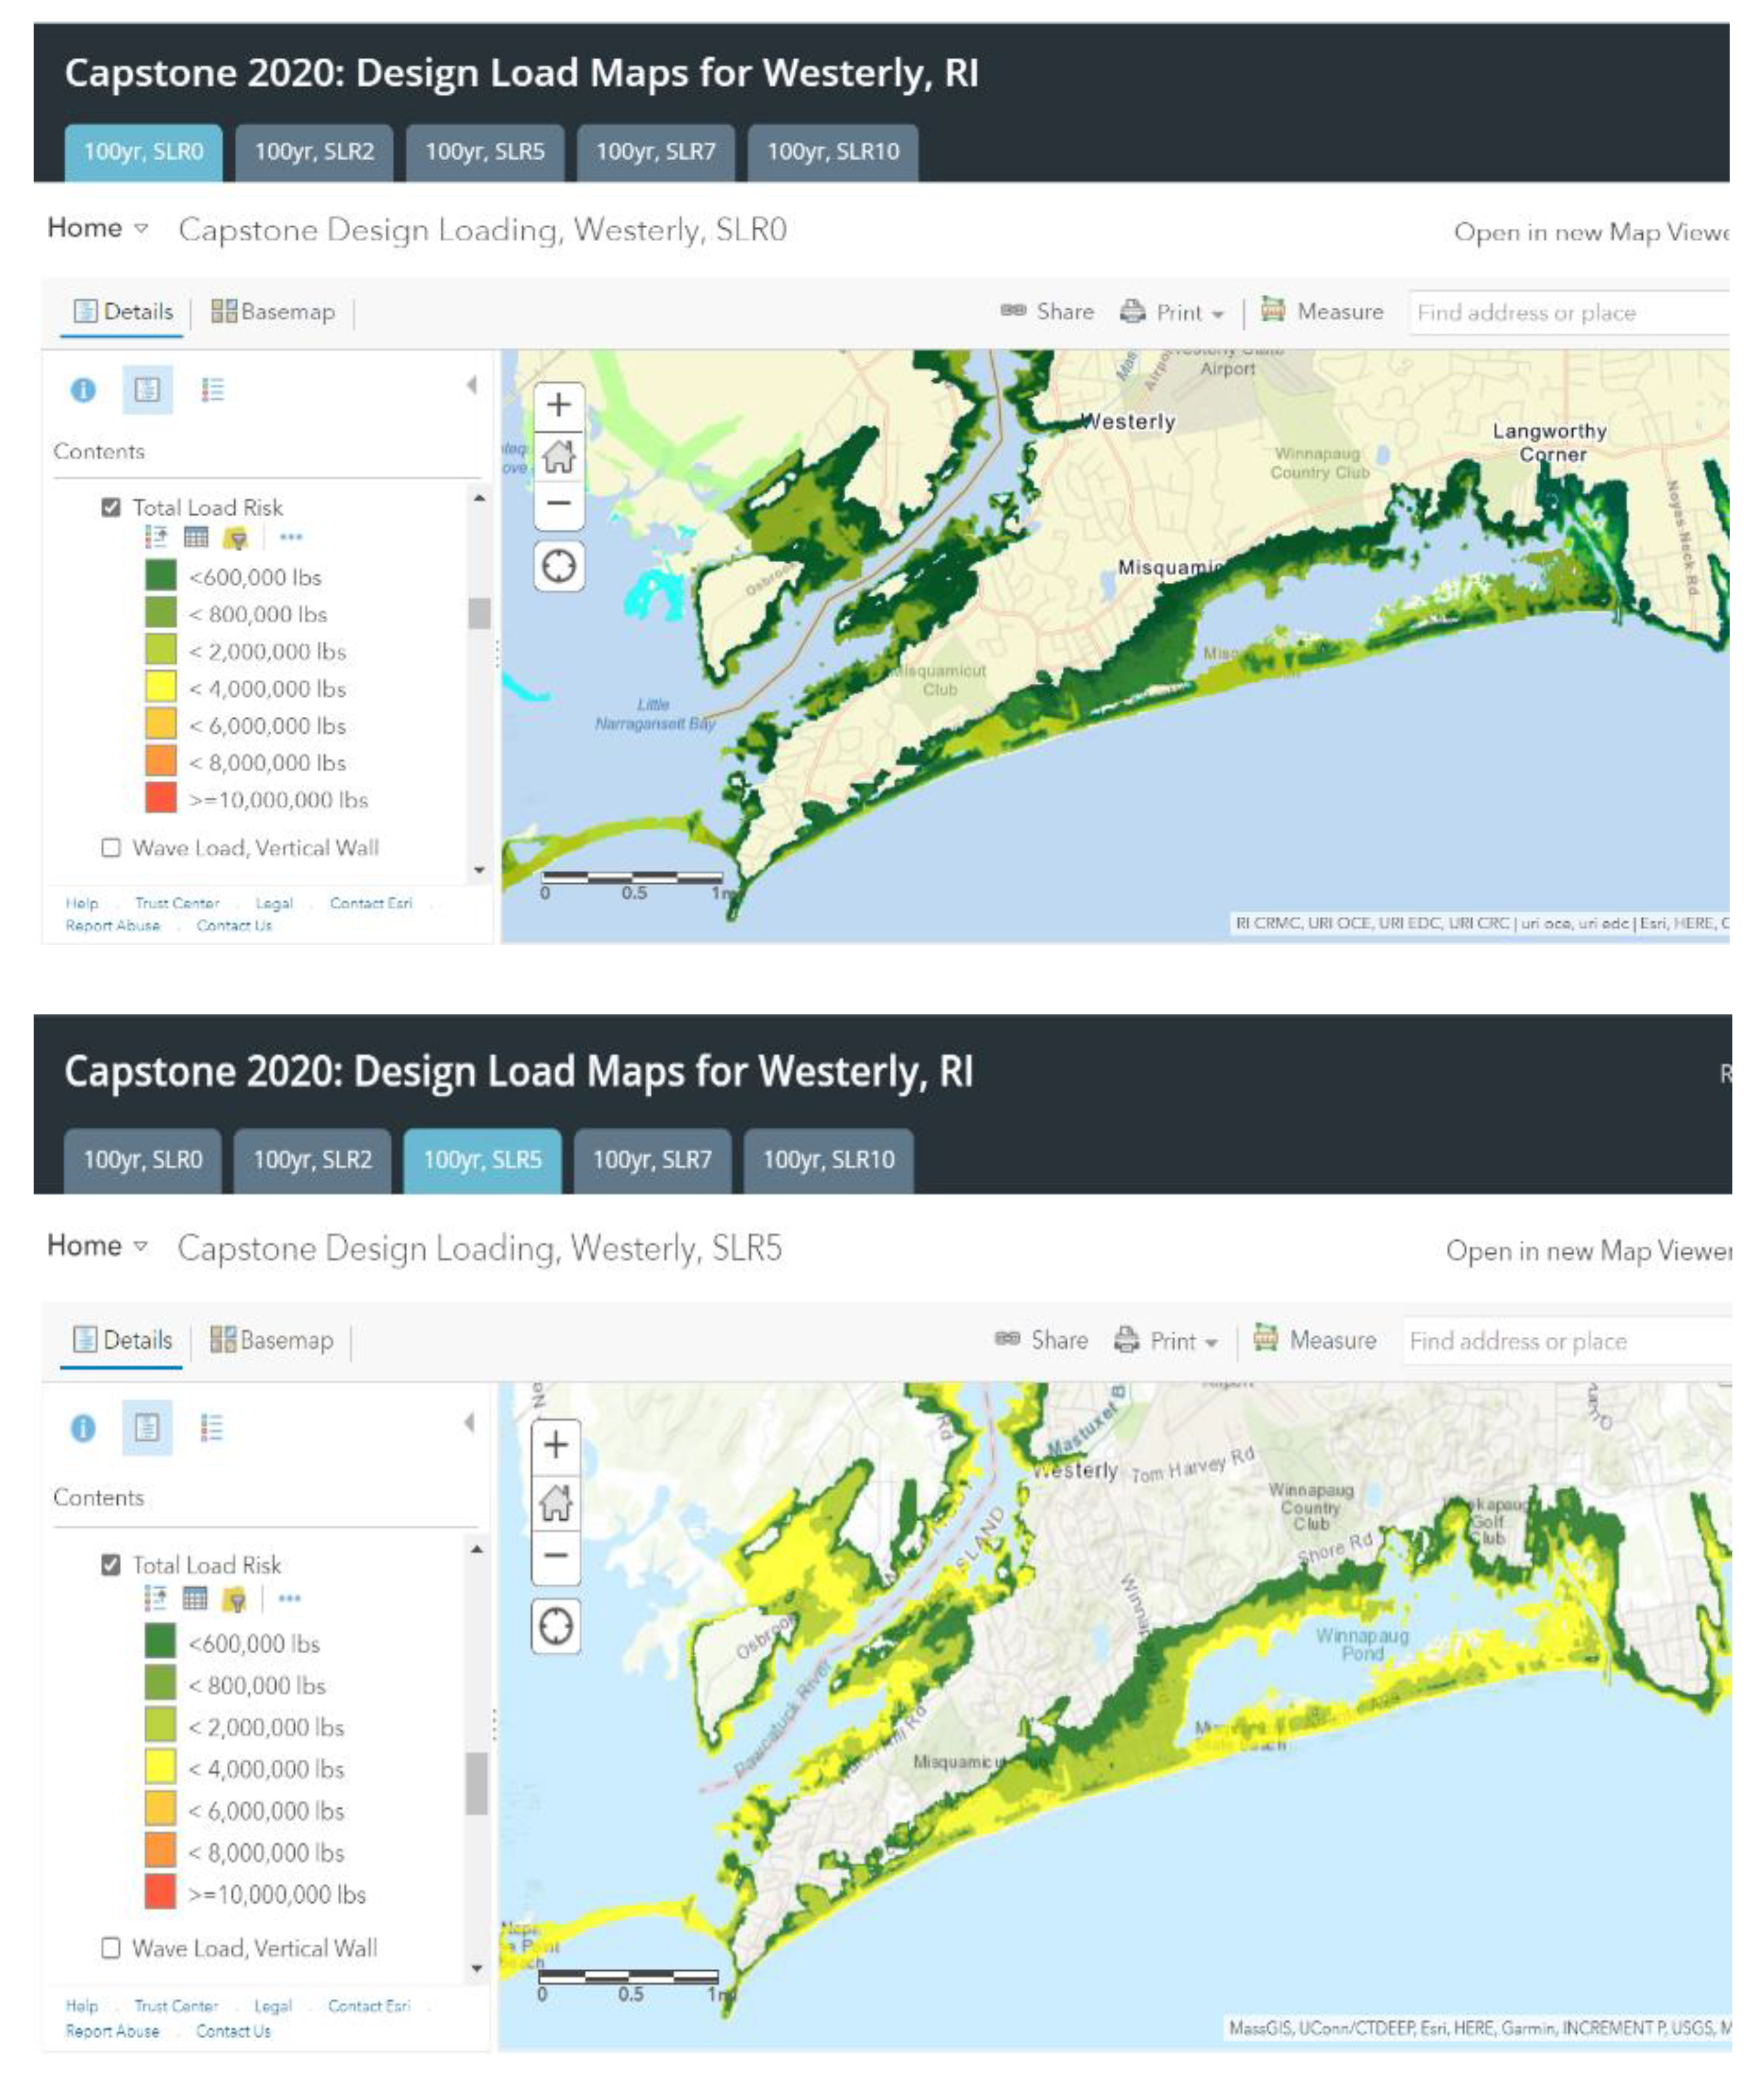
3.6. Total Loads and Risk

To help understand the risk at a given location, total load maps (hydrostatic, hydrodynamic, and wave loads) were developed for a Type 6A structure—single story with a basement (the most common in the area) (nominal width of 35 ft) and are shown in Figure 13 for 0 and 5 ft of SLR, left and right panels, respectively. Maps for other SLR cases are available but not shown here. The maps show that the total loads are highest in areas dominated by waves and generally decrease with distance inland, as wave heights and the inundation depth decrease. The impact of SLR is generally to increase the loads as larger waves are present and the inundation depth increases. This is particularly noticeable for the barrier/dune system south of Winnapaug Pond. The total load maps show that the wave loads dominate close to the shoreline, where the flooding depth is greatest and wave heights highest. Hydrostatic loads are next, followed by hydrodynamic loads, which are the lowest.
To evaluate whether the total load maps can be considered a proxy for damage, structure risk maps for the study area were generated using CERI and are shown in Figure 14 for the 100 yr storm with 0 ft (upper panel) and 5 ft of SLR (lower panel). Comparing the two one can clearly see the maps are consistent with one another; with the highest damages occurring where the total loads are highest. The structural risk and loads are both shown to increase with SLR, because of increases in the inundation depth, wave heights, and induced surge currents. A comparison of the structural risk maps to the individual structure risk maps are provided in Figure S4 for the two SLR cases. This allows one to compare the load maps directly to the structural damage to individual structures.
The ArcGIS Hub system developed to display the loads also allows the user to select a location of interest and determine the values for the selected loads at that location. Figure 15 shows an example of the debris load (upper panel) and total load risk (lower panel) for the 100 yr, 0 ft SLR case at a location on the dune-barrier system south of Winnapaug Pond. This procedure can be used for one or all loads combined, as well as on the supporting data on the still water flooding depth, wave crest height, BFE, and grade elevation.

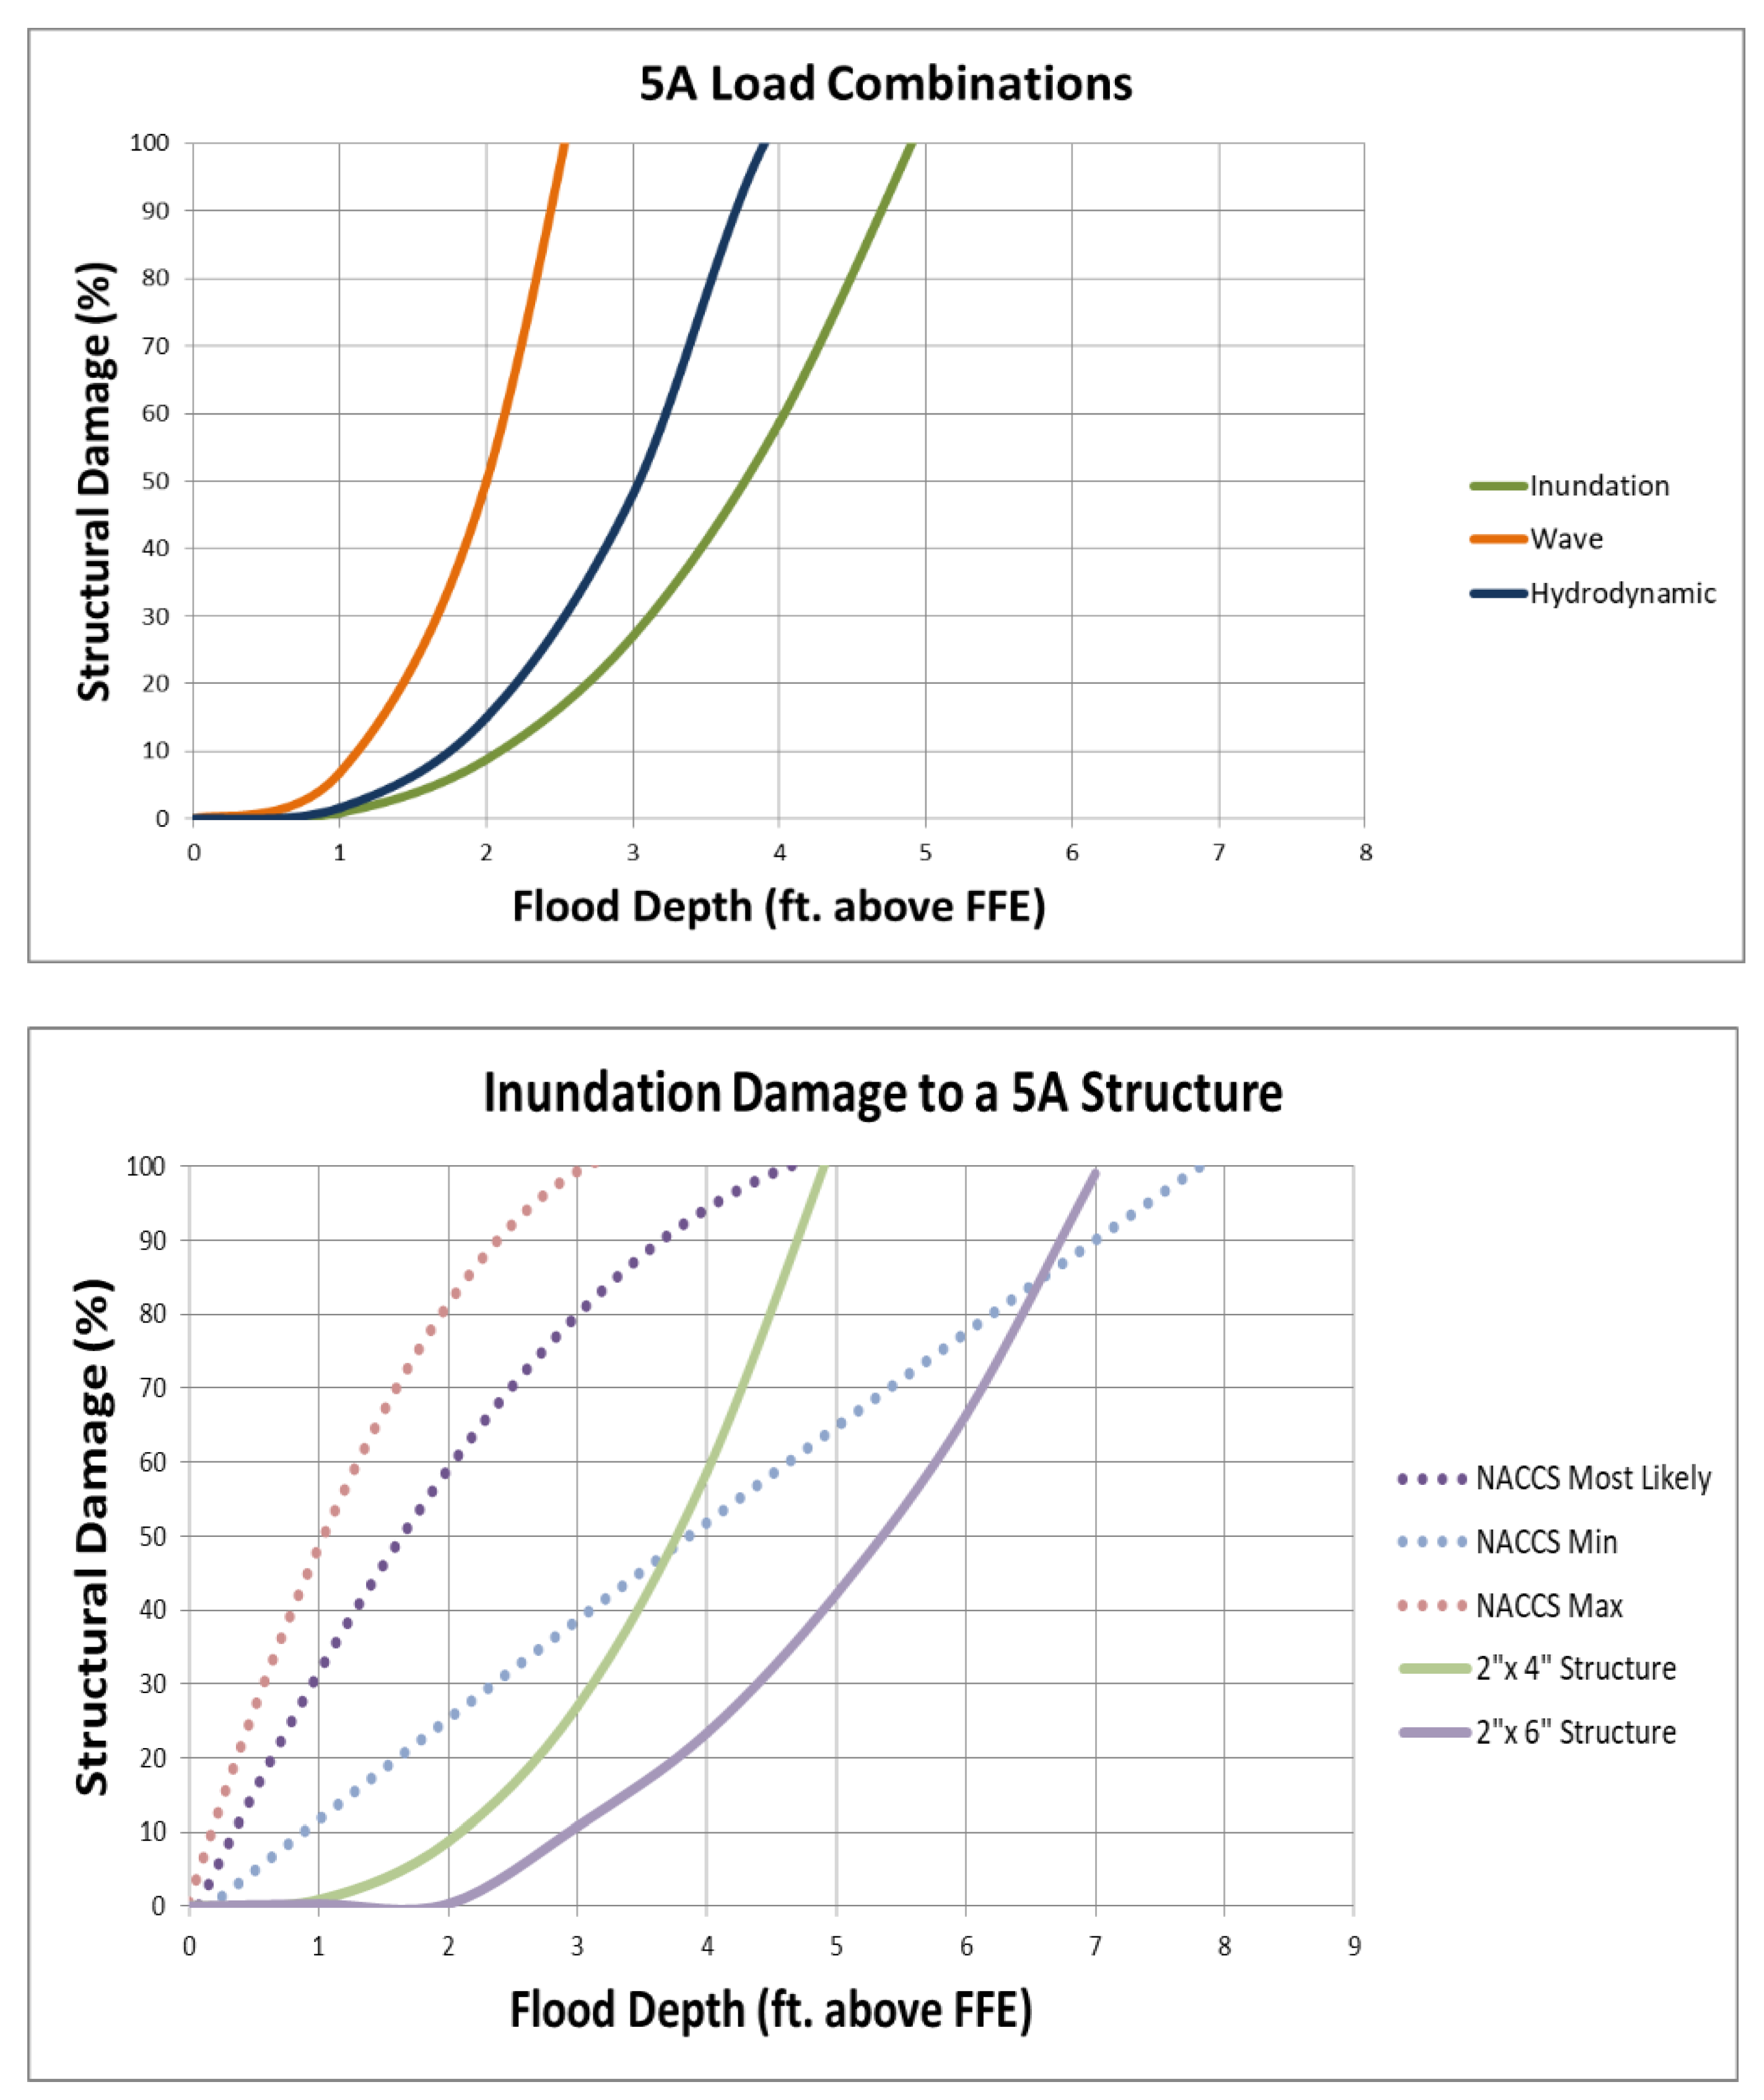
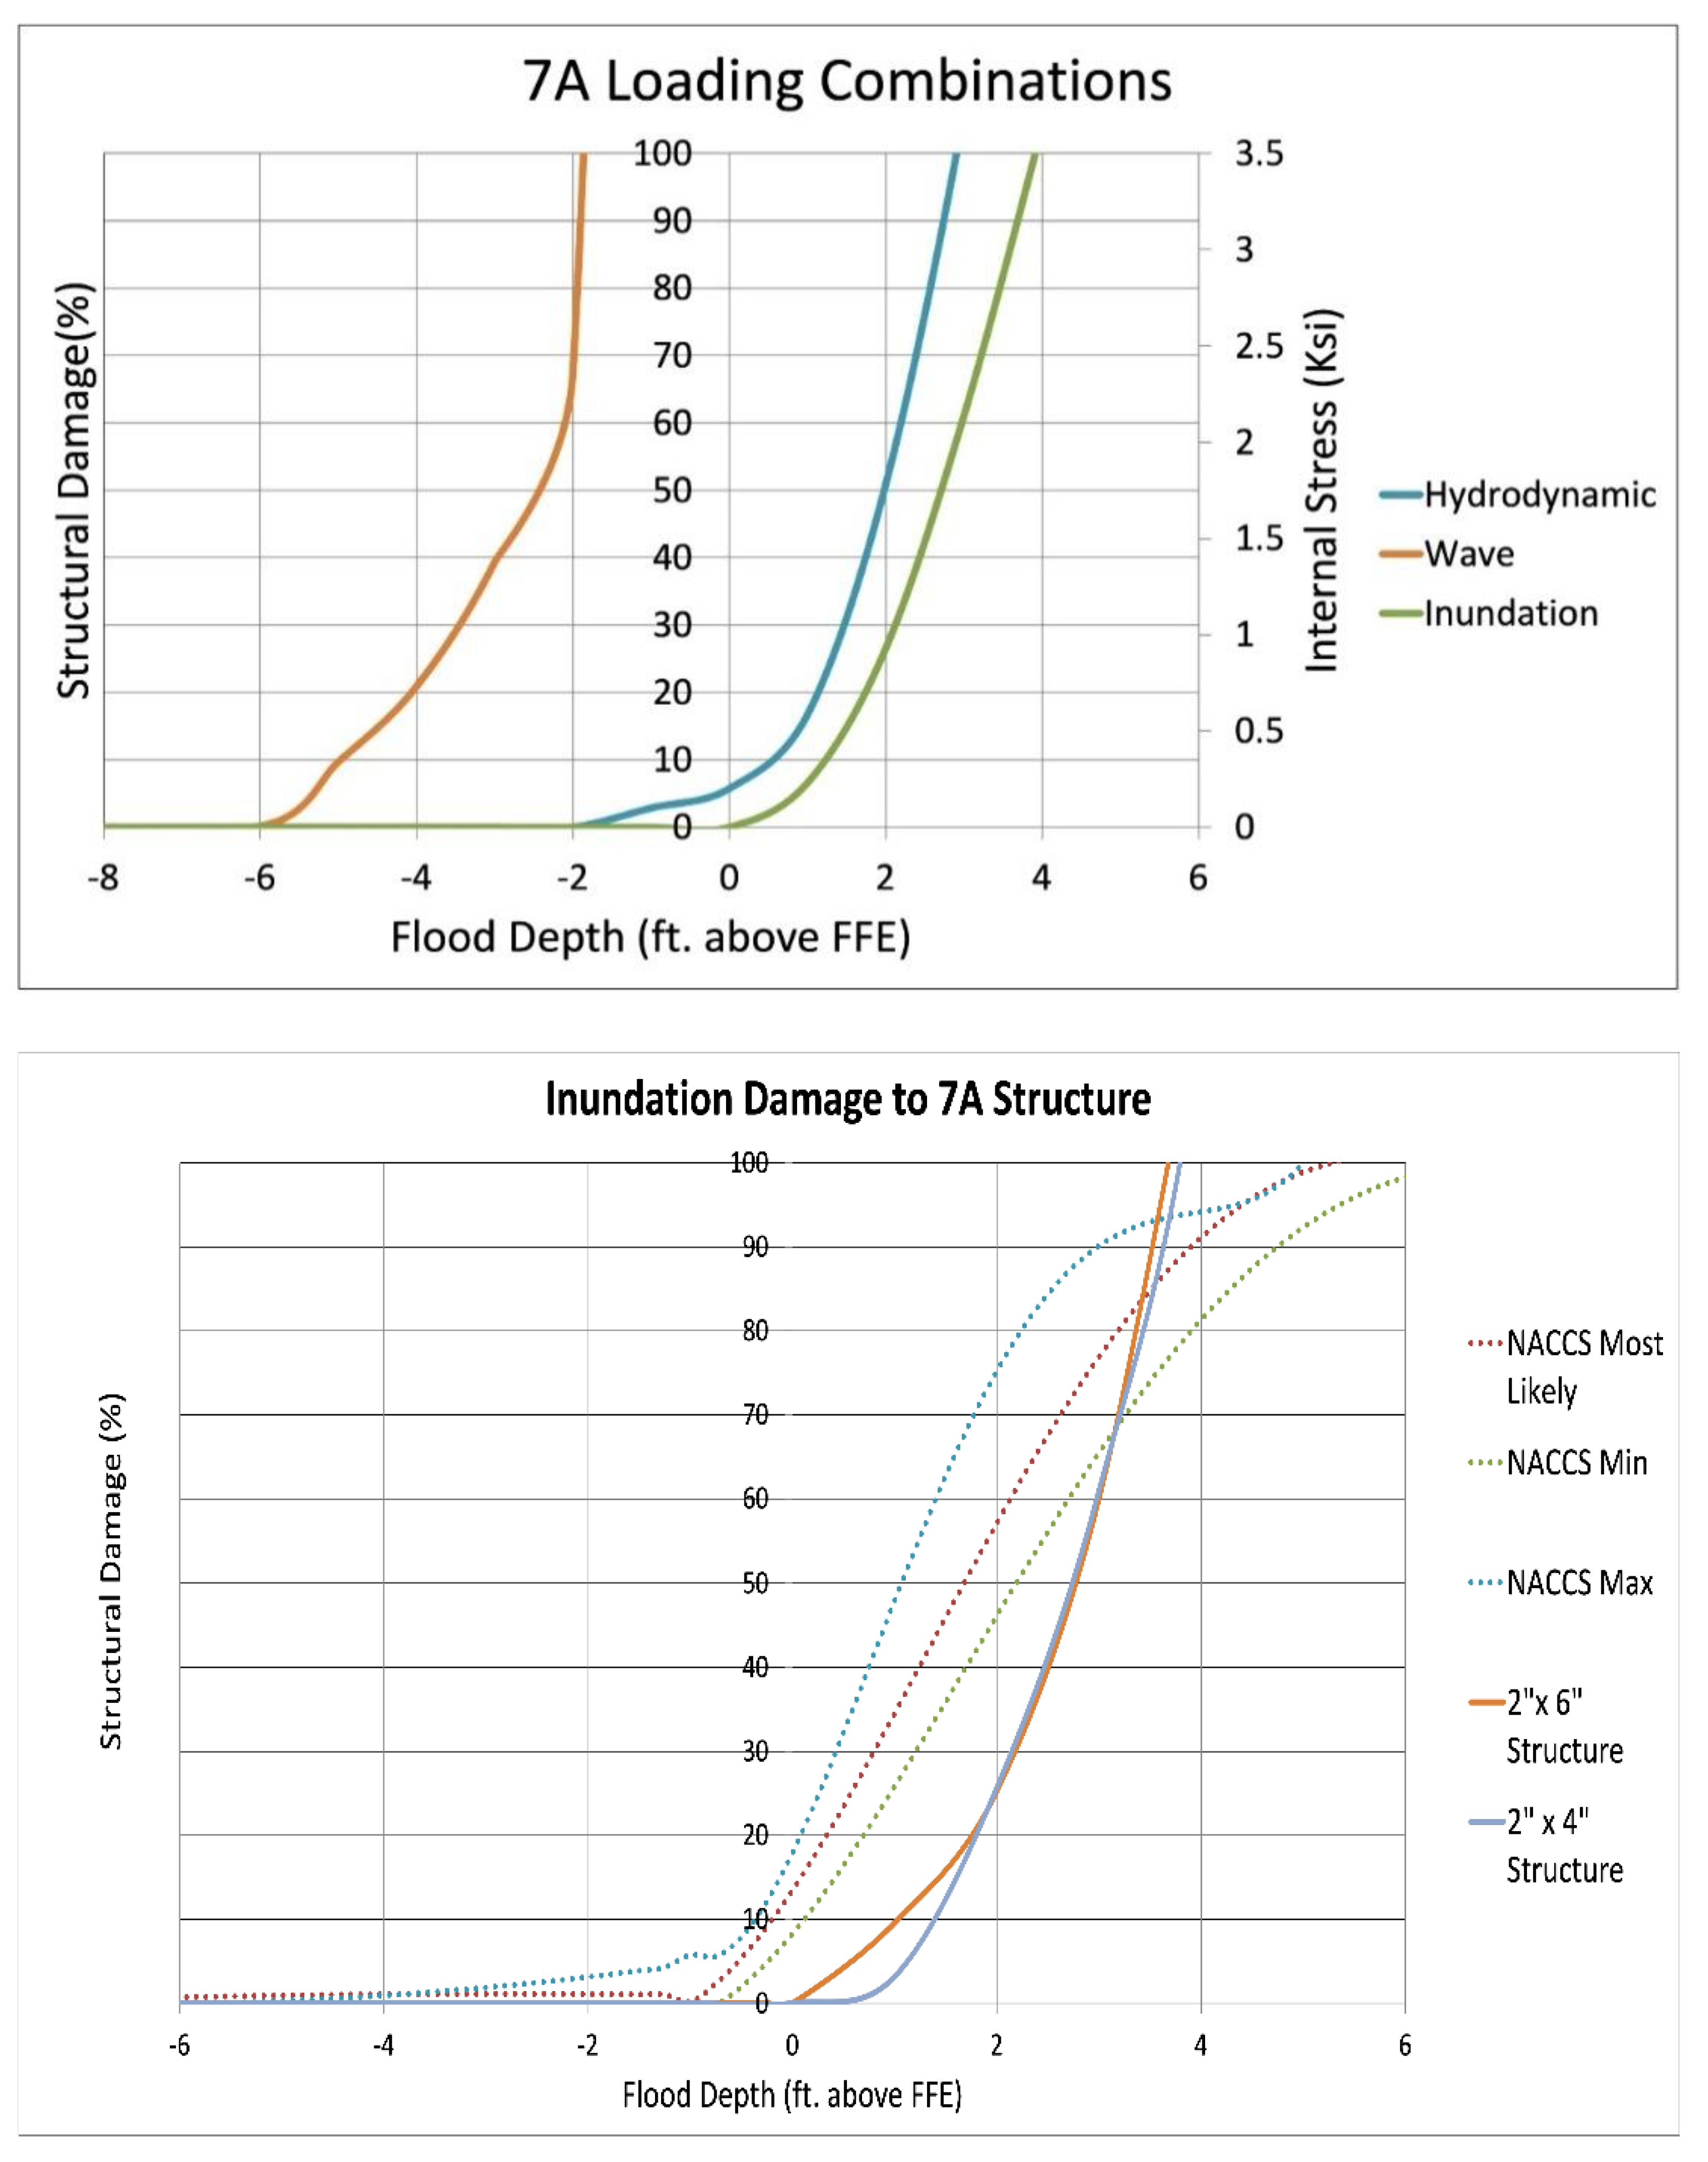
3.7. Structural Response

The structural model, described above, was applied to both Type 5A and 7A structures, as case examples, as these are often found in the study area [6]. The analysis estimates the flood loads on the structure and the bending stress in key structural members. Structural damage is then estimated from the bending stress and then compared to the USACE NACCS damage curves for the building prototype selected [8].

3.7.1. Type 5A—Single Story, No Basement

Figure 16, upper panel, depicts the results of three loading scenarios (hydrostatic (inundation), hydrodynamic, and wave) applied to a single-story structure, with no basement (Type 5A), constructed with 2 in. by 4 in. vertical wall studs and 2 in. by 12 in. floor joists. Inundation loads are experienced when a structure is surrounded by water on all sides. For this scenario, the building envelope is intact, so all forces are acting from the outside of the structure directed inward. The hydrodynamic loads are caused by the flow induced by the storm surge, with the force acting on three sides of the structure. The hydrodynamic loads are converted to equivalent hydrostatic loads and added to the baseline hydrostatic loads that are present. The waves however act as a line load, applied to only one side of the structure.
When subjected to wave loading the structural model predicted that the majority of its members reach bending moment capacity at flood water depths of about 2.5 ft. This early failure is a result of the wave load acting on only one side of the structure. The structure fails when the hydrodynamic load scenario (three sides of structure), reaches just over 4 ft, while inundation (hydrostatic) failure (four sides) is reached at flood elevations of just under 5 ft.
Figure 16, lower panel, shows the inundation loading scenario for a single-story structure, constructed of both 2 in. by 4 in. and 2 in. by 6 in. vertical wall studs, with 16 in on center stud spacing and compares the NACCS study minimum, most likely, and maximum inundation damage curves vs. the depth of flooding [8]. The present prediction is in reasonable agreement with the NACCS most likely value for the typical 2 in. by 4 in. stud walls, and with the minimum value for the more conservative 2 in. by 6 in. studs at the upper limit. In general, the NACCS damage curves are consistent with the present analyses at the upper end of the damage curve but show higher damage at the lower flooding depth, likely because they reflect observations of damage that may not be structural.

3.7.2. Type 7A—Open Pile Supported

Figure 17 depicts the results of three loading scenarios (inundation, hydrodynamic, and wave) applied to an open pile supported structure (Type 7A), constructed with 2 in. by 4 in. vertical wall studs and 2 in by 12 in floor joists (upper panel). There are 20 piles, nominally 12 in diameter. Since the stress is felt in the floor joists and sill plates before the studs, the 2 in. by 12 in. structural members were analyzed for internal bending stress. With inundation loads due to flooding, the floor joists start feeling internal stress when the water depth reaches FFE, and failure at 4 ft above FFE. This load case has the highest resistance to flooding. All other cases reach failure before 4 ft above FFE. When hydrodynamic loads are considered the damage curve shifts to lower flooding depths, since the loading is now on three sides.
Unlike inundation, the 2 in. by 12 in. members start feeling internal stress 2 ft below FFE and reach failure just before 3 ft above FFE. Lastly the wave load was evaluated and yielded the lowest flood depth failure out of all three loading scenarios. Here the floor joists feel the internal stress at 6 ft below FFE and fail just after 2 ft below FFE. These loads are transmitted via the support piles to the structure.
Figure 17, lower panel, shows the inundation damage to a 7A structure, with one structure’s walls composed of 2 in. by 4 in. and the other of 2 in. by 6 in. studs. The NACCS minimum, most likely, and maximum damage curves are shown for comparison. The internal stress of the 2 in. by 12 in. floor joists are still the ones being evaluated. Damage curves for both the 2 in. by 4 in. and 2 in. by 6 in. structural members reach failure close to the NACCS damage curves, but fail slightly before, at close to 4 ft FFE. The damage curves also show that the 2 in. by 6 in. and 2 in. by 4 in. studs reach structural failure at about the same flood depth. This result is consistent with the fact that the failure location is the floor joists and not the stud walls. Once again, the failures for the present simulations occur at slightly lower values of flooding depth than the NACCS curves, consistent with the argument that the NACCS analysis reflects damage, below the point of failure, that is likely not structural. It is noted that the slope of the NACCS damage vs. the flooding depth curve is significantly higher for pile-elevated structures than structures on grade (compare Figure 16 and Figure 17). The results of the present analysis are consistent with this pattern.

4. Summary and Conclusions

This study has resulted in the development of STORMTOOLS Design Load (SDL) maps that can be used to estimate flooding and debris loads in areas that may be subject to coastal and inland flooding. The loads have been developed following the ASCE/SEI 7–16 [9] and FEMA CCM [10] guidelines and are consistent with the current state of practice in the design of structures in the coastal flood zone. The maps have been unitized by the structure width to allow them to be scaled to the structure of interest. The maps can be used to estimate the loads to residential structures, either on grade or pile supported. Extension of the maps to commercial structures and infrastructure is straightforward. The maps have been made available via an ArcGIS Hub, thus allowing easy access to all that are interested. The maps can readily be transferred to other geographic locations and explicitly consider the impact of sea level rise on the design of coastal structures via the use of SDE maps, which explicitly consider sea level rise. The methodology has been designed to take advantage of typical coastal flooding maps (e.g., FEMA FIRMs) which are normally given in the form of BFEs for the areas of interest.
One unique feature of the maps is that they include loads which are associated with the flow caused by storm surges (hydrodynamic loads) and debris loads. As an example, the standard flooding maps used for most structural design in coastal areas are FEMA FIRM maps, which are specified in terms of BFEs and do not include estimates of flow fields. Hydrodynamic and debris loads are often not considered, since estimates of the storm induced flow field are rarely available. The flow fields for the application here use state of the art hydrodynamic models. That said, the present analysis suggests that the flood-induced flow speeds are low and much smaller than the hydrostatic loads. The only areas where they are substantial is in surge channels and where the overtopping of dunes results from erosion of the barrier dune system during storm events.
Total load maps were developed to provide a sense of the risk of locating structures at a particular site. The maps show that the risk is highest where the wave heights are highest and the inundation depths the largest. The surge and wave induced currents and associated loads are shown to be much smaller than either the wave or hydrostatic loads. The total load maps were consistent with, and compared favorably to, the CERI damage maps for individual structures and the generalized structure risk maps.
A state of the practice structural analysis tool, Autodesk Professional Robot Structural Analysis, was applied to estimate the damage to the most common residential structures in the study area. Two structure types were considered: a single-story house, with no basement (5A) and a pile-elevated structure (7A). The loads on the structure were estimated from the SDL maps. The structures investigated used wood frame construction typical of the area, with balloon framing and either 2 in. by 4 in. or 2 in. by 6 in., 16 in. on center, stud wall spacing with plywood sheathing, and 2 in. by 12 in. floor joists with 16 in. spacing. The analysis considered inundation, hydrodynamic, and wave loads and provided estimates of the percent damage to the structure vs. the depth of flooding relative to the first floor elevation (FFE). Internal bending stress in key structural elements (studs or floor joists) was used to determine damage and ultimately structural failure. The application showed that the wave loads dominate the damage, followed by hydrodynamic and then inundation loads. The first two have a strong directional component (waves—building face, hydrodynamic—building face and sides), that contributes to the damage, while the last is omnidirectional and has the lowest damage. Increasing the size of structural members (studs) increases the building’s resistance to damage if the structure is on grade, while increasing the size of floor joist lowers the damage for elevated structures. The slope of the damage vs. flood depth curve is steepest for elevated structures and is substantially lower for structures on grade. The predictions of the structural analysis model are generally consistent with the NACCS damage curves. However, the latter show more damage at lower flooding depths since they are based on a visual assessment of damage and do not necessarily reflect structural damage, except at the upper end of the damage curve. The structural analysis tool shows promise to help better inform damage assessment models and can effectively give an upper bound to their estimates.
In the interest of making the results of STORMTOOLS CERI more widely available, a mobile phone app was developed to allow the user to estimate the damage to a structure at any location [3] in the coastal flooding zone. The user can select the structure type and its location, and the SLR scenario of interest. The app then returns the grade elevation, BFE and percent damage to the structure. The app could readily be extended to allow access to load information as outlined in this paper.

Supplementary Materials

The following are available online athttps://www.mdpi.com/article/10.3390/jmse9070715/s1, Figure S1: Total still water depth (ft above grade) (upper panel, left), surge height (ft NAVD88) (upper panel, right) and wave crest height (ft) (lower panel, left) and BFE (ft, NAVD88) (lower panel, right) for 100 yr storm, no sea level rise (SLR), Figure S2: Total still water depth (ft, above grade) (upper panel, left), surge height (ft NAVD88) (upper panel, right) and wave crest height (ft) (lower panel, left) and BFE (ft, NAVD88) (lower panel, right) for 100 yr storm, 5 ft sea level rise (SLR), Figure S3: STORMTOOLS Design Load (SDL) Table of contents GIS links. The tabs at the header show the available sea level rise (SLR) cases, Figure S4: Risk to individual structures (left) and structural damage risk (right) for 100 yr storm with no (upper panel) and 5 ft SLR (lower panel).

Author Contributions

Conceptualization, M.S.; methodology, M.S., C.B.; software, All Students (AS): I.S., B.E., A.L., M.R., A.M., J.S., B.M., C.P.; validation, AS; formal analysis, AS; investigation, AS; resources, C.B.; data curation, AS; writing—original draft preparation, AS, M.S.; writing—review and editing, All; visualization, AS; supervision, M.S., C.B., C.S., G.T.; project administration, M.S., C.B.; funding acquisition, C.B. All authors have read and agreed to the published version of the manuscript.

Funding

The development and application of SDL maps for the study area was performed as part of a senior design class with students from the University of RI (URI), Ocean Engineering (OCE) and Civil and Environmental Engineering (CVE) Departments. The URI Sea Grant program provided support for Teresa Crean, Coastal Community Planner, URI Coastal Resources Center and Janelle Skaden, an MS student in Ocean Engineering at URI.

Institutional Review Board Statement

No institutional review required.

Informed Consent Statement

Informed consent not applicable.

Data Availability Statement

Data was generated by the authors or through existing open sources at the University.

Acknowledgments

Soroush Kouhi, formerly with Ocean Engineering, URI and now an Applied Science Specialist, Ocean Networks Canada, University of Victoria, Victoria. BC performed simulations of the 100 yr storm event, with and without sea level rise, necessary to determine the hydrodynamic force fields in the study area.

Conflicts of Interest

The authors declare no conflict of interest. The funders had no role in the design of the study; in the collection, analyses, or interpretation of data; in the writing of the manuscript, or in the decision to publish the results.

Abbreviations

ACEArmy Corps of Engineers
ADCIRCADvanced CIRCulation model
ArcGIS HubGIS system, community engagement software system
ASCEAmerican Society of Civil Engineers
AutoDeskAutoDesk Professional Robot Structural Analysis
BFEBase Flood Elevation
BIMBuilding Information Modeling
CCMCoastal Construction Manual
CERICoastal Environmental Risk Index
CRMCRI Coastal Resources Management Council
DEMDigital Elevation Model
FEMAFederal Emergency Management Agency
FFEFirst Floor Elevation
FIRMFlood Insurance Rate Map
GISGeographic Information System
LIDARLaser Detection and Ranging
NACCSUSACE, North Atlantic Comprehensive Coastal Study
NAVD88North Atlantic Vertical Datum, 1988
NOAA NOSNational Ocean and Atmospheric Administration-National Ocean Survey
RMSEroot mean square error
RI GISRhode Island-Geographic Information System
SDESTORMTOOLS Design Elevation
SDLSTORMTOOLS Design Load
SEIStructural Engineering Institute
SLRSea Level Rise
STWAVESTeady state spectral WAVE model
STORMTOOLStools in support of storm analysis
URIUniversity of Rhode Island
USACEUS, Army Corps of Engineers
USGSUS Geological Survey
XBeachnearshore wave and geomorphological model

List of Variables and Units

Aarea where load applied, ds × w
Cd, Cp, Cdbdrag coefficients-hydrodynamic, wave wall, and wave pile (see Section 8.5 [10] for recommended values)
Cb, Cdb, Co, CIcoefficients for debris loads: blockage, debris depth, orientation, and importance (see Section 8.5 [10] for recommended values)
dsstill-water flood depth
dhequivalent hydrostatic depth, dh = Ch V2/2g, Ch—drag coefficient
dttotal flood depth (dt = ds + dh)
Dpile diameter or if the pile is square then horizontal dimensions
fstatichydrostatic load per unit width
Fstatichydrostatic load × structure width, w
fbrkwwall wave flood load per unit width
Fbrkwwall wave flood load × structure width, w
fbrkppile wave flood load per unit width
Fbrkppile wave flood load × structure width, w
fdynamichydrodynamic load per unit width
Fdynamichydrodynamic load × structure width, w
fequiv_staticequivalent hydrostatic load for hydrodynamic load per unit width
Fequiv_staticequivalent hydrostatic load x structure width, w
fdebrisdebris load
ggravity
Hbbreaking wave height
ksithousand pounds per sq inch
Nnumber of piles
Rmaxmaximum response ratio for impulsive debris loads
Tnatural period of structure impacted
Vflood velocity
Vbvelocity of debris flow, Vb = 1/2(gds)1/2
wwidth of structure
Δtimpact time for debris load
ρwater density
γwspecific weight of salt water (64 lbs/ft3), ρg

References

  1. Spaulding, M.L.; Isaji, T.; Damon, C.; Fugate, G. Application of STORMTOOLS’s simplified flood inundation model, with and without sea level rise, to RI coastal waters. In Proceedings of the ASCE Solutions to Coastal Disasters Conference, Boston, MA, USA, 9–11 September 2015. [Google Scholar]
  2. Spaulding, M.L.; Grilli, A.; Damon, C.; Crean, T.; Fugate, G.; Oakley, B.A.; Stempel, P. STORMTOOLS: Coastal Environmental Risk Index (CERI). J. Mar. Sci. Eng. 2016, 4, 54. [Google Scholar] [CrossRef] [Green Version]
  3. Spaulding, M.L.; Grilli, A.; Damon, C.; McKenna, B.; Christensen, M.; Vinhateiro, N.; Boyd, J.; Fugate, G. STORMTOOLS, Coastal Environmental Risk Index (CERI) Risk and Damage Assessment App. J. Mar. Sci. Eng. 2020, 8, 129. [Google Scholar] [CrossRef] [Green Version]
  4. Grilli, A.; Spaulding, M.L.; Damon, C.; Crean, T.; Fugate, G. Application of the Coastal Environmental Risk Index (CERI) to Barrington, Bristol, and Warren, RI, Report Prepared for the RI.; Coastal Resources Management Council: South Kingstown, RI, USA, 2019.
  5. Spaulding, M.L.; Grilli, A.; Damon, C.; Crean, T.; Fugate, G. Application of STORMTOOLS Coastal Environmental Risk Index (CERI) to Inform State and Local Planning and Decision Making along the Southern RI Shoreline. J. Mar. Sci. Eng. 2020, 8, 295. [Google Scholar] [CrossRef]
  6. Spaulding, M.L.; Grilli, A.; Damon, C.; Hashemi, R.; Anbaran, S.K.; Fugate, G. STORMTOOLS Design Elevation (SDE) Maps: Including impact of sea level rise. J. Mar. Sci. Eng. 2020, 8, 292. [Google Scholar] [CrossRef] [Green Version]
  7. Cialone, M.A.; Massey, T.C.; Anderson, M.E.; Grzegorzewski, A.S.; Jensen, R.E.; Cialone, A.; Mark, D.J.; Pevey, K.C.; Gunkel, B.L.; McAlpin, T.O.; et al. North Atlantic Coast Comprehensive Study (NACCS) Coastal Storm Model Simulations: Waves and Water Levels; Report: ERDC/CHL TR-15-44; Coastal and Hydraulics Laboratory, U.S. Army Engineer Research and Development Center: Vicksburg, MS, USA, 2015; Available online: https://www.nad.usace.army.mil/CompStudy.aspx (accessed on 20 May 2021).
  8. Simm, J.D.; Guise, A.; Robbins, D.; Engle, J. US North Atlantic Coast Comprehensive Study: Resilient Adaptation to Increasing Risk; Physical Depth-Damage Function Summary Report; Coastal and Hydraulics Laboratory, U.S. Army Engineer Research and Development Center: Vicksburg, MS, USA, 2015; Available online: https://www.nad.usace.army.mil/Portals/40/docs/NACCS/10A_PhysicalDepthDmgFxSummary_26Jan2015.pdf (accessed on 20 May 2021).
  9. ASCE/SEI. Minimum Design Loads and Associated Criteria for Buildings and Other Structures; American Society of Civil Engineers (ASCE): Reston, VA, USA, 2017; ISBN 978-0-7844-7996-4. [Google Scholar]
  10. FEMA. Coastal Construction Manual (CCM): Principles and Practices of Planning, Siting, Designing, Constructing, and Maintaining Residential Buildings in Coastal Areas P-55, 4th ed.; US Federal Emergency Management Agency (FEMA): Washington, DC, USA, 2011. Available online: https://www.fema.gov/pdf/plan/prevent/nhp/nhp_fema55.pdf (accessed on 27 April 2021).
  11. Spaulding, M.L.; Grilli, A.; Damon, C.; Fugate, G.; Oakley, B.A.; Isaji, T.; Schambach, L. Application of State of Art Modeling Techniques to Predict Flooding and Waves for an Exposed Coastal Area. J. Mar. Sci. Eng. 2017, 5, 10. [Google Scholar] [CrossRef] [Green Version]
  12. Spaulding, M.L.; Grilli, A.; Damon, C.; Fugate, G.; Isaji, T.; Schambach, L. Application of State of Art Modeling Techniques to Predict Flooding and Waves for a Coastal Area within a Protected Bay. J. Mar. Sci. Eng. 2017, 5, 14. [Google Scholar] [CrossRef] [Green Version]
  13. RI CRMC. Coastal Hazards Application. Available online: http://www.crmc.ri.gov/coastalhazardapp.html (accessed on 13 May 2021).
  14. STORMTOOLS. ArcGIS Hub. Available online: http://www.beachsamp.org/stormtools/ (accessed on 13 May 2021).
  15. Silverman, I.B.; Engelman, A.; Leone, M.; Rothenbucher, A.; Munch, J.; Sorrentino, B.; Pearson, C. Development and Application of STORMTOOLS Design Load (SDL) maps, Final Report, Senior Design Class in Ocean and Civil and Environmental Engineering; University of RI: Narragansett, RI, USA, 2020. [Google Scholar]
  16. Autodesk Professional Robot Structural Analysis. Available online: https://www.autodesk.com/education/free-software/featured (accessed on 15 March 2020).
  17. STORMTOOLs Design Load Maps (SDL). Available online: https://crc-uri.maps.arcgis.com/apps/MapSeries/index.html?appid=cd7c1dc499a64434b6b55ab34522794c (accessed on 15 May 2021).
  18. STORMTOOLs Design Elevation Maps. Available online: http://www.beachsamp.org/stormtools-design-elevation-sde-maps/ (accessed on 15 May 2021).
Figure 1. Structural damage from inundation (upper panel) and waves (lower panel) for the NACCS prototype 5A—single-story residence, without a basement vs. flood depth or wave crest height relative to FFE. The NACCS minimum, most likely, and maximum damage estimates are provided. Survey data (black dots) from hurricane Sandy (2012) are also provided. FFE is the First (Finished) Floor Elevation, relative to grade (Figures 11 and 13 from Simms et al. [8], (https://www.nad.usace.army.mil/Portals/40/docs/NACCS/10A_PhysicalDepthDmgFxSummary_26Jan2015.pdf, Accessed on 20 May 2021).
Jmse 09 00715 g001
Figure 2. Westerly, RI study area showing the location of structures from the E911 Enhanced emergency data (see legend for structural type: white dots—residential structures, red dots—commercial structures). Background shows area impacted by 5 ft of SLR (light blue).
Jmse 09 00715 g002
Figure 3. STORMTOOLS Design Load (SDL) methodology: inputs, governing equations, and outputs. Governing equations and explanations for each load are provided in ASCE/SEI 7–16 [9] and FEMA CCE [10] manuals.
Jmse 09 00715 g003
Figure 4. ADCIRC grid system (left panel) used to predict the 100 yr storm event for SLR values of 0, 3.2, and 6.6 ft (simulations were performed by Soroush Kouhi, 2019) and the model predicted currents for the study area for the 100 yr storm, 3.2 ft SLR case (right panel).
Jmse 09 00715 g004
Figure 5. Contour map of model-predicted current speeds for 100 yr storm with 3.2 ft SLR.
Jmse 09 00715 g005
Figure 6. Structure type 5A—single story, no basement (left panel) and 7A—elevated on open pile (right panel) based on USACE NACCS classification [7,8]. Details on structure sizes and wood framing are also provided [15].
Jmse 09 00715 g006
Figure 7. Hydrostatic load (lbs/ft), 100 yr storm, 0 ft sea level rise (SLR) (upper panel) and 5 ft SLR (lower panel).
Jmse 09 00715 g007
Figure 8. Wave load (lbs/ft) for vertical wall (upper panel) and pile (lower panel) house, 100 yr storm, 0 ft sea level rise (SLR).
Jmse 09 00715 g008
Figure 9. Wave load (lbs/ft) for vertical wall (upper panel) and pile (lower panel) house, 100 yr storm, 5 ft sea level rise (SLR).
Jmse 09 00715 g009
Figure 10. Hydrodynamic load (lbs/ft2) for FEMA CCM [10] method (upper panel), ASCE/SEI 7–16 [9] method (lower panel) (lbs/ft), 100 yr storm, no sea level rise (SLR). It is noted the loads for the FEMA CCM method are based on the cross-sectional area (A = hs ∗ w) (lbs/ft2) while those from ASCE/SEI 7–16 are based on structure width (lbs/ft).
Jmse 09 00715 g010
Figure 11. Hydrodynamic wave loading (lbs/ft2), 100 yr storm, 0 ft sea level rise (upper panel), 5 ft SLR (lower panel).
Jmse 09 00715 g011
Figure 12. Worst case debris loads (lbs/ft), 100 yr storm, no sea level rise (SLR) (upper panel) and 5 ft SLR (lower panel).
Jmse 09 00715 g012
Figure 13. Total load risk (lbs/ft), 100 yr storm, no sea level rise (SLR) (upper panel) and 5 ft SLR (lower panel).
Jmse 09 00715 g013
Figure 14. Structural damage risk, 100 yr storm, 0 ft sea level rise (upper panel) and 5 ft SLR (lower panel).
Jmse 09 00715 g014
Figure 15. Use of SDL interrogation function to determine debris load (lbs/ft) (upper panel) and total load risk (lbs/ft) (lower panel) at a selected location of interest.
Jmse 09 00715 g015
Figure 16. Structural damage based on wave, inundation, and hydrodynamic loads vs. flood depth above FFE for a single-story structure, without basement (Prototype 5A) (upper panel), and structural damage for a 2 in × 4 in and 2 in × 6 in studded structure vs. flood depth compared to the NACCS [8] minimum, most likely, and maximum inundation damage curves (lower panel).
Jmse 09 00715 g016
Figure 17. Structural damage based on wave, inundation, and hydrodynamic loads vs. flood depth relative to FFE for an open pile supported structure (Type 7A) (upper panel), and structural inundation damage for a 2 in × 4 in and 2 in × 6 in studded structure vs. flood depth compared to the NACCS [8] minimum, most likely, and maximum damage curves (lower panel). The internal stress (ksi) is shown on the right vertical axis.
Jmse 09 00715 g017
Publisher’s Note: MDPI stays neutral with regard to jurisdictional claims in published maps and institutional affiliations.

