Article

Spatiotemporal Drought Risk Assessment Considering Resilience and Heterogeneous Vulnerability Factors: Lempa Transboundary River Basin in The Central American Dry Corridor

1
Hydroinformatics Chair Group, IHE Delft Institute for Water Education, 2611 AX Delft, The Netherlands
2
Water Resources Section, Delft University of Technology, 2600 AA Delft, The Netherlands
*
Author to whom correspondence should be addressed.
J. Mar. Sci. Eng. 2021, 9(4), 386; https://doi.org/10.3390/jmse9040386
Submission received: 10 February 2021 / Revised: 26 March 2021 / Accepted: 30 March 2021 / Published: 5 April 2021

Abstract

:
Drought characterization and risk assessment are of great significance due to drought’s negative impact on human health, economy, and ecosystem. This paper investigates drought characterization and risk assessment in the Lempa River basin in Central America. We applied the Standardized Evapotranspiration Deficit Index (SEDI) for drought characterization and drought hazard index (DHI) calculation. Although SEDI’s applicability is theoretically proven, it has been rarely applied. Drought risk is generally derived from the interactions between drought hazard (DHI) and vulnerability (DVI) indices but neglects resilience’s inherent impact. Accordingly, we propose incorporating DHI, DVI, and drought resilience index (DREI) to calculate drought risk index (DRI). Since system factors are not equally vulnerable, i.e., they are heterogeneous, our methodology applies the Analytic Hierarchy Process (AHP) to find the weights of the selected factors for the DVI computation. Finally, we propose a geometric mean method for DRI calculation. Results show a rise in DHI during 2006–2010 that affected DRI. We depict the applicability of SEDI via its relationship with El Nino-La Nina and El Salvador’s cereal production. This research provides a systematic drought risk assessment approach that is useful for decision-makers to allocate resources more smartly or intervene in Drought Risk Reduction (DRR). This research is also useful for those interested in socioeconomic drought.

1. Introduction

Drought is triggered by anomalies in meteorological variables, such as a lack of precipitation and an increase in evapotranspiration demand. These water anomalies can further lead to deficits in soil moisture and runoff [1,2,3]. Drought has a negative impact on the agriculture, service sector, and production market. It also has a large impact on human health and ecosystems [4,5,6]. Drought impacts make it one of the most severe and damaging natural hazards [7].
The consequences of its severe impacts highlight the importance of drought monitoring, characterization, and risk assessment. For example, in the last century and the beginning of the present, from 1900 to 2019, drought has affected around three billion people, causing more than 11 million deaths, and triggered global economic losses of $1.75 × 10¹² [8]. In the last decades, significant advances have been made in drought monitoring and characterization, particularly those where drought is conceptualized as an event that changes in space and time [9,10]. The improved methodologies for drought characterization can be explored to develop spatio-temporal approaches to drought risk assessment.
Drought risk assessment allows the evaluation of its negative impacts, and it is a prerequisite to developing solutions to mitigate its undesirable consequences. One of the early and prominent studies on this topic is proposed by Shahid and Behrawan [11] in calculating drought risk in Bangladesh. They performed the drought risk assessment by considering two components: hazard and vulnerability, both computed in indices. Regarding the hazard, they applied the Standardized Precipitation Index (SPI) to calculate drought frequency and magnitude (in drought study referred to as severity). On the other hand, for vulnerability, i.e., to estimate the degree of exposure of the socioeconomic system, they considered agricultural and anthropogenic factors evaluated at a local scale. Following their study, several researchers have focused on drought risk assessment creating a systematic approach, primarily defining the drought risk as the multiplication of drought hazard and drought vulnerability indices [12,13,14,15]. For instance, Sena et al. [16] investigated drought risk in Brazil, focusing on decision-making at the municipalities’ level. Dabanli [17] studied drought vulnerability and risk for provinces of Turkey using SPI. He used four socioeconomic factors for Drought Vulnerability Index (DVI) and mapped the indices to show 81 provinces. Zhang et al. [18] assessed the agricultural drought risk in the Lancang-Mekon region, applying drought hazard and vulnerability indices. They calculated low and high-risk areas and their association with agricultural lands. Adedeji et al. [19] assessed the spatiotemporal variation of droughts in Nigeria using remote sensing and geographic information system techniques to find regions prone to droughts risk. Jincy Rose and Chitra [20] employed SPI and the Standardized Precipitation Evapotranspiration Index (SPEI) drought indices to evaluate the temporal variation of drought in an Indian River basin. They demonstrated that the number of drought events increased based on SPEI compared to SPI. Lin et al. [21] used SPI for drought characterization and introduced a drought risk assessment framework based on drought hazard, vulnerability and exposure. Liu et al. [22] used the SPI and SPEI to investigate drought spatiotemporal patterns in China’s Sichuan Province. They also detected drought hotspots and carried out a drought characterization.
Nowadays, it is widely accepted that disaster risk is a multidimensional concept that is not solely outlined by natural hazards but is simultaneously shaped by the interaction of the hazard, vulnerability, and resilience [13,23,24]. Resilience is defined as the system’s ability to respond and recover from a disaster [25]. Current drought risk assessment approaches usually consider only drought hazard and drought vulnerability, but the role of resilience is often neglected [12,13,26]. Taking resilience into account enhances the conventional definition of risk [24] because it calculates drought risk more realistic than considering solely the degree of exposure of the system as it is done when using just drought vulnerability. On the other hand, drought vulnerability indices often treat all parts of the system equally vulnerable, but despite being practical, this consideration is not close to the whole truth [13,23,24].
Despite its importance, drought risk assessment, especially in the presence of resilience, is still a new and open debate area [24,27,28]. The framework for studying drought risk, including the terminology used, is not a fixed matter since it is updated as new studies are available. The terminology presented in this research corresponds to that commonly used in drought studies. Globally, there are efforts to unify terminologies and frameworks for disaster risk reduction. One of these efforts is the Sendai Framework for Disaster Risk Reduction 2015–2030 (hereafter Sendai Framework), where the United Nations Office for Disaster Risk (UNDRR) is tasked to support its implementation [29]. One of the Sendai Framework’s objectives is to point out who is responsible for estimating, managing, and reducing risk: the state; however, it also indicates that local governments and the private sector, among other stakeholders, should share such tasks. Although elaborated with the time’s scientific and technical knowledge, Sendai Framework was mainly focused on decision-makers; however, its consultation is recommended to the interested reader. This research’s study framework is mainly based on scientific publications and is relatively similar to the Pacific Disaster Center’s (PDC) approach [30]. The terminology, the approach, and the target audience may differ from the Sendai Framework. The way this research and previous ones relate to the Sendai Framework is beyond the research scope.
Based on the literature review on drought risk assessment, the following three gaps are identified in its formulation. (1) The consideration of the spatiotemporal variation of drought needs to be improved. (2) The different socioeconomic factors of the analyzed system need to be considered as not equally vulnerable, i.e., heterogeneous. (3) The role of resilience must be taken into account in the calculation of drought risk. As a contribution to improve the formulation of drought risk assessment, this research introduces an approach that fills the three gaps shown above. In this research, three components are considered in the drought risk assessment: (1) drought hazard, (2) vulnerability, and (3) resilience. The three components are calculated in the form of indices. It should be noted that, as readers will see in Material and Methods, drought hazard and drought index are related but different. A new drought risk index (DRI) is introduced based on the geometric mean of the drought hazard (DHI), vulnerability (DVI), and resilience (DREI) indices. The Standardized Evapotranspiration Deficit Index (SEDI) is used for the calculation of drought. The vulnerability of the system to drought is considered differently. We incorporated the Analytic Hierarchy Process (AHP) to calculate the weights of seven socioeconomic and physical/infrastructural factors considered to formulate vulnerability. The approach takes resilience into account. Four weighted factors are applied in resilience calculation to picture people, organizations, and the system’s ability to face the negative consequences of the drought. We assessed drought risk spatiotemporally considering eight sub-basins. The Lempa River basin located in Central America is selected to illustrate the methodology because it is vulnerable to drought due to its high population density and agricultural occupation [31,32].

2. Materials and Methods
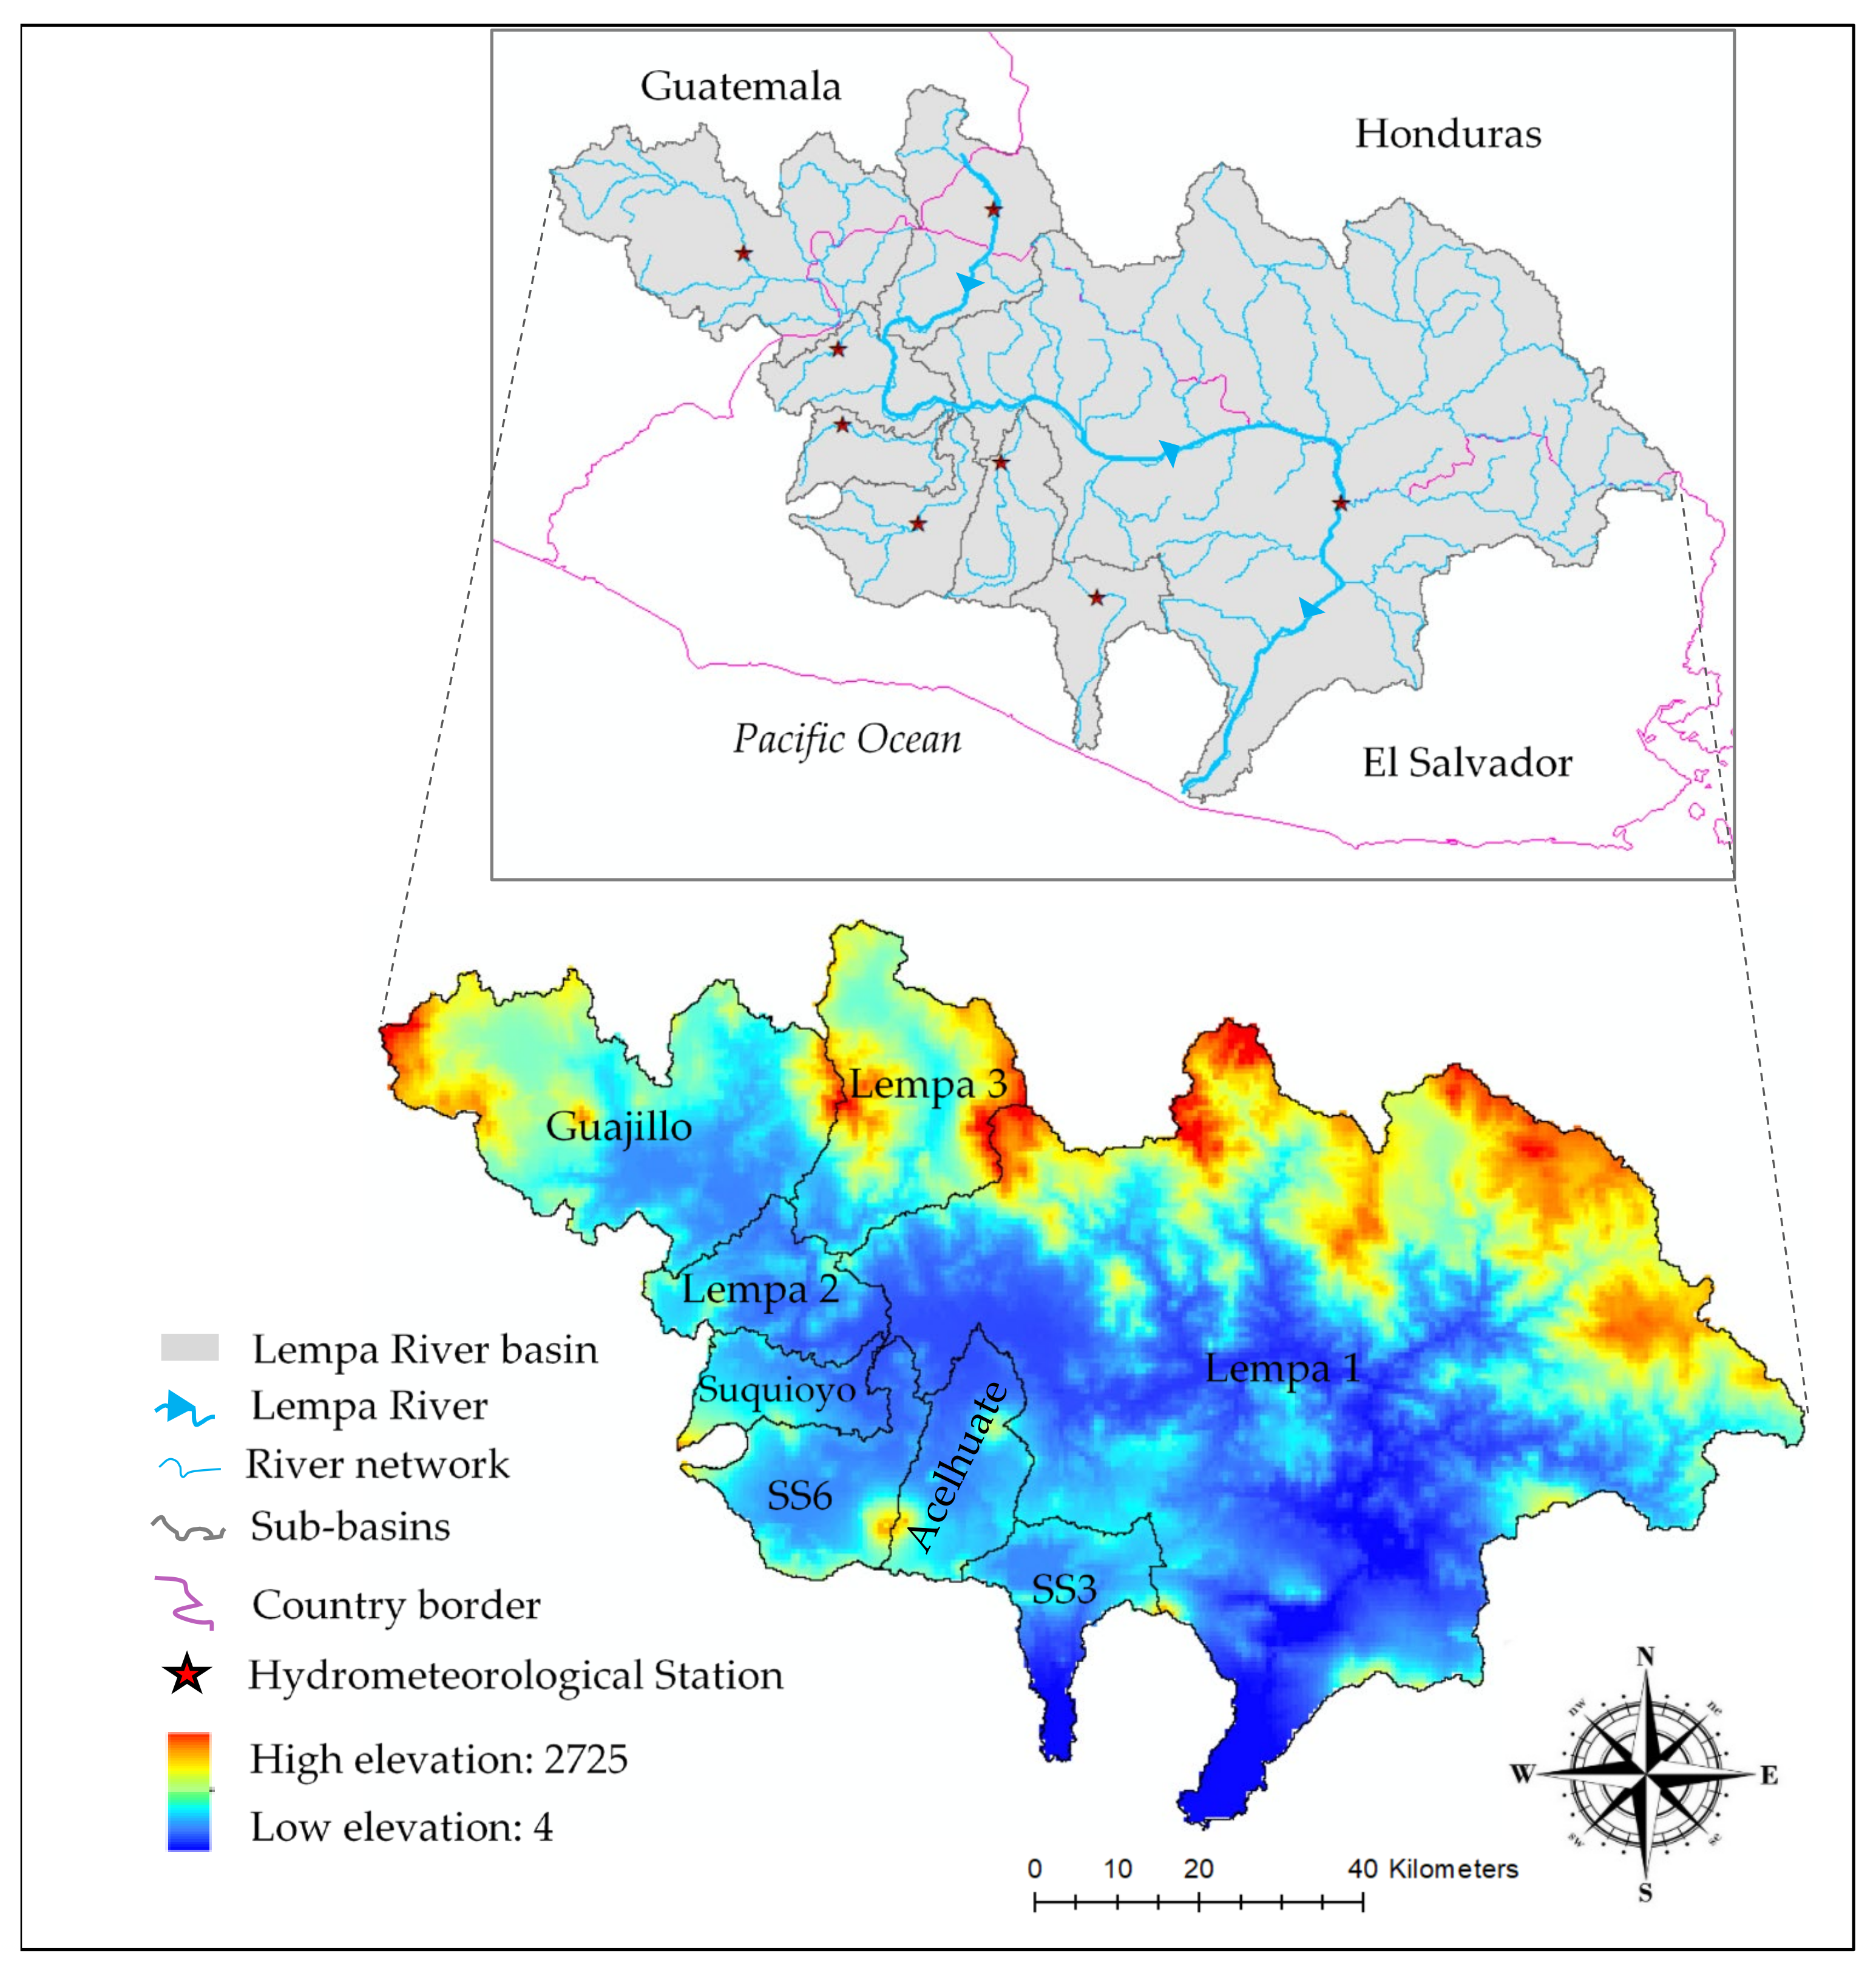
2.1. Case Study

The Lempa River is the longest in Central America, with a length of 422 km. It originates from volcanic mountains in Guatemala with a mean elevation of 1500 MAMSL, and its mouth is the coastal plain of the Pacific Ocean in El Salvador. From the river’s total length, 360.2 km (85%) flows in Salvadoran land [33]. The river basin covers three countries: Guatemala, Honduras, and El Salvador (Figure 1). The tri-national basin has a 17,790 km2 area, 10,082 km2 are located in El Salvador (49% of the El Salvador territory). The basin has a daily average temperature of 23.5 °C, a total annual rainfall average of 1698 mm, and an annual runoff of 19.21 dm3·s−1·km−2.
The water resources of El Salvador are under increasing stress due to population growth, economic activities, and land-use change. On the one hand, during the dry years, the river flow has decreased by 70% [32,34]. In this basin, 68% of the surface waters of El Salvador are found [35]. On the other hand, El Salvador has the largest population density in America (304 inhabitants per km2) [36]. The Lempa River basin encompasses 13 of 14 departments of El Salvador, comprising 3,967,159 inhabitants (77.5% of the country’s population). The information shown above on the basin condition, particularly in El Salvador, highlights the importance of water resources management and drought risk assessment in such a basin.

2.2. Data

The drought risk assessment in the Lempa River basin is carried out considering eight sub-basins named Lempa 1, Lempa 2, Lempa 3, Guajillo, Suquioyo, Acelhuat, SS6, and SS3 (Figure 1). The division of the sub-basins was carried out within the framework of the “El Salvador Rapid Assessment Mission” project in which an evaluation of two aspects about water resources was carried out, its availability and quality. After the interaction between local authorities and scientists in charge of carrying out the study, the division mentioned above was obtained. Runoff modeling was carried out within the framework of the mentioned project. The outlet of the basin is located in the sub-basin Lempa 1.
Time series of the hydrometeorological variables including runoff, infiltration, potential (PET) and actual (AET) evapotranspiration were calculated with the Water Evaluation and Planning system (WEAP), the well-known software for water resources planning developed by the Stockholm Environment Institute [37]. Precipitation, temperatures, and soil data used in the WEAP model were obtained from El Salvador’s Ministry of Environment and Natural Resources (MARN) [38]. Streamflow data used to calibrate the model was also obtained from the same source. Streamflow data was available for the period 2004 to 2009. Location of the hydrometeorological stations are shown in Figure 1.
WEAP provides the possibility of choosing between five methods to simulate the basin processes like evapotranspiration, runoff, and irrigation demands. We have used the Rainfall-Runoff method (Soil Moisture Method), representing the basin with two soil layers (called buckets). In this method, the topsoil layer is known as the shallow-water capacity and the bottom soil layer as deep-water capacity. The water balance is calculated for each fraction area j for the first layer, assuming that the climate is steady in each sub-basin. The water balance is calculated by Equation (1) [39].
R d j d Z 1 , j d t = P e t PET t k c , j t   5 Z 1 , j 2 Z 1 , j 2 3 P e t   Z 1 , j RRF j f j k s , j Z 1 , j 2 1 f j k s , j Z 1 , j 2
where Z1,j is the relative storage based on the total effective storage of the root zone; Rdj is the soil holding capacity of the land cover fraction j (mm). PET projects potential evapotranspiration and is calculated using the modified Penman-Monteith reference crop potential evapotranspiration with the crop/plant coefficient (kc,j) for each fractional land cover; Pe is the effective precipitation, and RRFj is the Runoff Resistance Factor of the land cover. Low and high values of RRFj may cause more or less surface runoff, respectively. P e t Z 1 , j RRF j is the surface runoff; f j k s , j Z 1 , j 2 is the interflow from the first layer; the term ks,j denotes the root zone saturated conductivity (mm/time); and fj is the partitioning coefficient that considers water horizontally and vertically, based on the soil, type of land cover, and topography.
In each of the eight sub-basins, the catchment-wide variables considered in the water balance were calculated. We used the catchment-wide actual (AET) and potential evapotranspiration (PET) for calculating the drought index. The drought index calculation was carried out in each of the eight sub-basins following the procedure presented under the sub-section “Standardized Evapotranspiration Deficit Index (SEDI)” in Section 2.3.1.

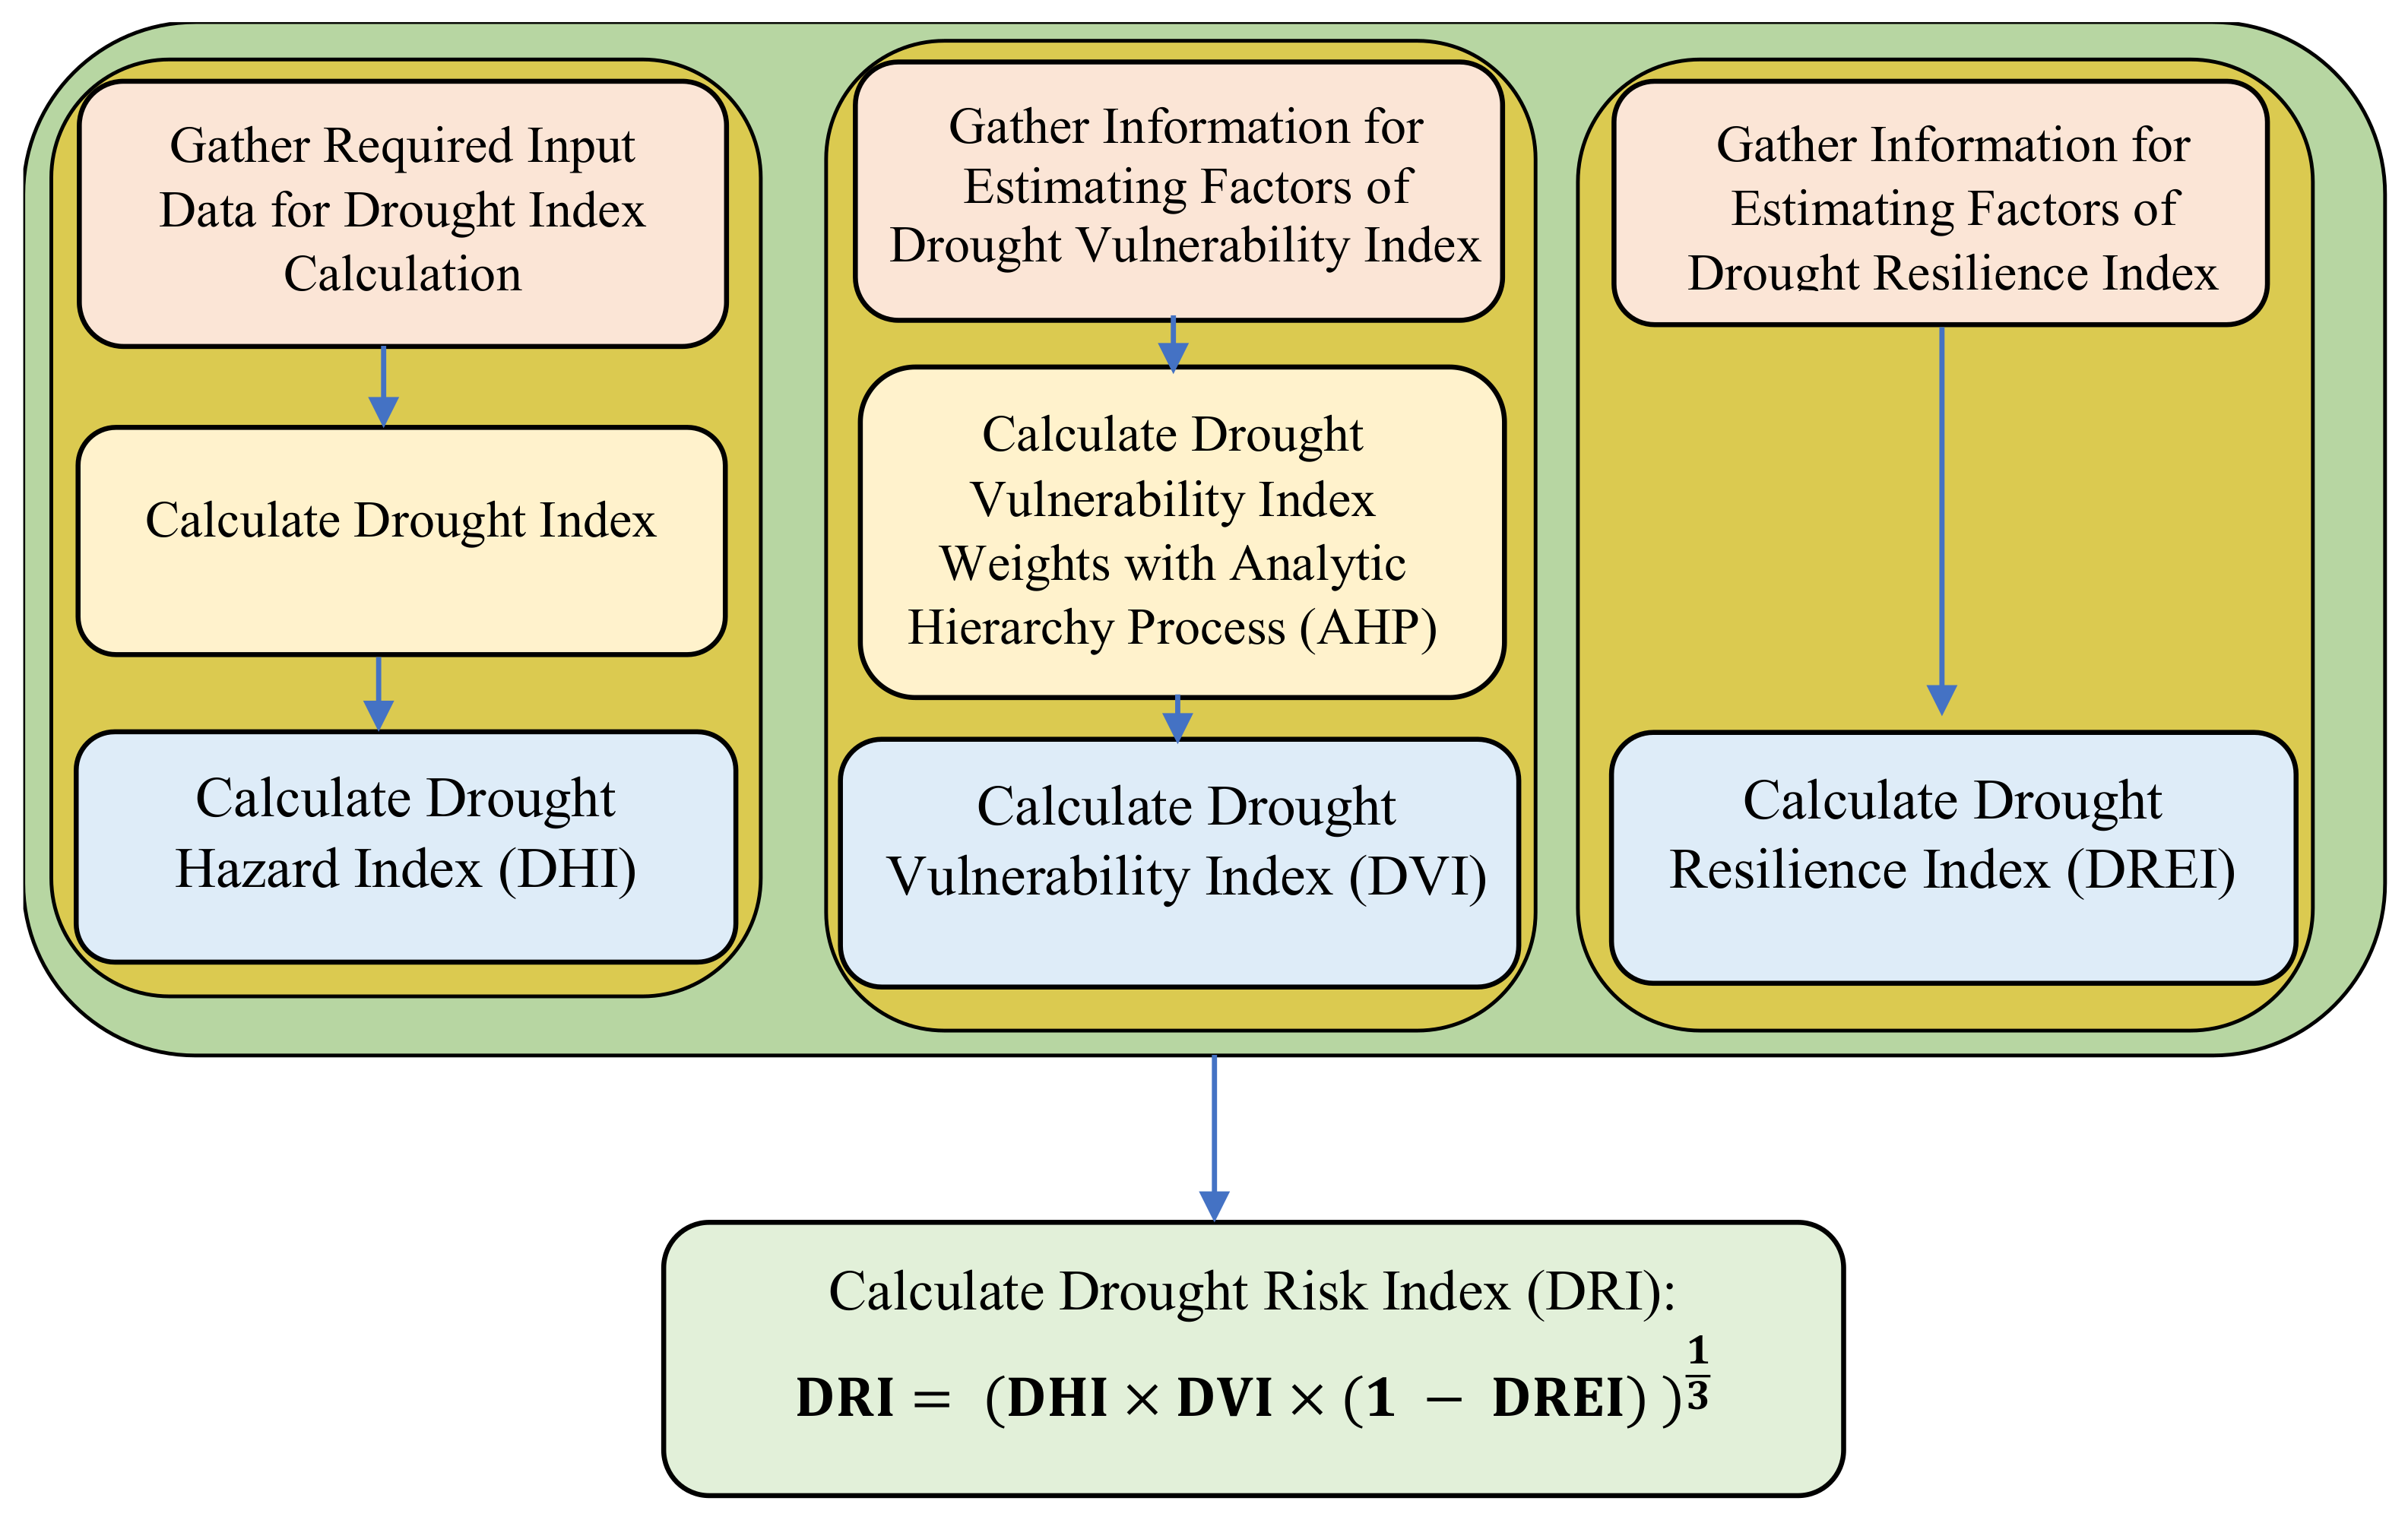
2.3. Drought Risk Assessment

Risk is defined as the probability of negative consequences of the hazard, e.g., deaths, damages [40,41], and disruption of economic activities. It captures the mutual interplay of the hazard and vulnerability of the system. However, often risk assessments neglect the inherent resilience of the system [24]. As in any other natural phenomenon, drought risk requires evaluating the combination of the physical nature of drought and the degree to which a system or activity is vulnerable to its damaging effects. Regarding this fact, Shahid and Behrawan [11] introduced the Drought Risk Index (DRI) as the multiplication of Drought Hazard Index (DHI) and Drought Vulnerability Index (DVI). DRI was defined as DRI = DHI × DVI . Although this formula has been vastly used to calculate DRI, nowadays, it is strongly recommended to also consider resilience when calculating risk. With the inclusion of resilience, it is foreseen that risk assessment may be improved, and more comprehensive results can be obtained. Resilience shows the ability of the system to recover from disasters in a reasonably short time and perform better in the future. The reducing effect of resilience on disaster risk has been considered by some studies in hurricane flood [24], coastal hazards [41], and typhoon [24], but is rarely used in drought risk assessment. In this study, resilience is taken into account for the calculation of DRI.
One of the essential features to consider when creating a risk index is its accuracy. The measure of risk is usually expressed in a single number that combines several factors. Therefore, such a risk index should provide the most accurate and most transparent evaluation of an event [42]. The traditional risk index calculation ( DRI = DHI × DVI ) presents a disadvantage when calculating risk. Consider the following example to expose such a disadvantage. Let DHI = 0.6 and DVI = 0.6 , which suggests high hazard and high vulnerability, then, DRI = 0.6 × 0.6 = 0.36 . Such a value of DRI indicates a low-risk condition, which does not sound reasonable. To overcome this limitation, different methodologies have been proposed. These methodologies include Principal Component Analysis (PCA), weighting methods, and aggregation methods [42,43].
In this study, we consider using geometric mean to aggregate the different components in the risk index. Geometric mean is chosen for its simplicity in calculation and application compared to other methods such as PCA. Furthermore, high accuracy has been reported when the geometric mean is applied in composite indices making it widely used [43,44,45,46]. Accordingly, the following generic formula is proposed for calculating the risk index (Equation (2)).
RI   = ( 1 n I i ) 1 n =   I 1 I 2 I n n
where RI is the risk index, Ii is the ith component (index) that is contributing to the risk index, and n is the total number of components.
For the particular case of drought (Equation (3)), in this study, in addition to DHI and DVI, a proposed drought resilience index (DREI) is considered. These three components (n = 3) are discussed in detail in the following sections. DHI, DVI, and DREI are normalized, taking values from 0 to 1 (Table 1). The max-min approach is used in the three indices for the normalization. Higher values of DHI and DVI represent a worse condition. On the other hand, in the case of DREI, higher values show a greater capacity of the system to cope with drought, and therefore, we used 1 DREI in the calculation of DRI.
The calculation of drought risk index (DRI) is performed by Equation (3).
DRI =   DHI × DVI × 1     DREI   1 3
The following sections describe the methodology for calculating the proposed DRI, including each of its three components (DHI, DVI and DREI). Figure 2 shows a flowchart of DRI calculation method.

2.3.1. Drought Hazard Index (DHI)

The first step in the computation of DHI is the calculation of droughts, also referred to as drought events, applying a drought index. The procedure to calculate drought events is fully documented in [2,3,10,47]. In the following section, the methodology for the calculation of droughts is described in short. The second step is the calculation of the characteristics of each drought event. This procedure is defined as drought characterization. These characteristics include duration and severity (magnitude), among others. Then, based on the drought severity, the drought events are categorized into four: low (L), moderate (M), severe (S), and extreme (E) [9,48,49,50], as indicated in Table 2. To finalize the calculation of droughts and their characteristics, the probability of occurrence of each drought category is also calculated. The probability of occurrence is broken into four ratings using the Jenks natural break method [11]. The values of ratings are 1, 2, 3, and 4 for the very low, low, high, and very high probability of occurrence. For the calculation of DHI, two factors are considered for each case of severity and probability of occurrence. These factors are weight (Dw) and rating (Dr). Table 2 shows allocated weights and ratings for each case.
Finally, DHI is calculated by Equation (4).
DHI =   L D r ×   L D w +   M D r ×   M D w +   S D r ×   S D w +   E D r ×   E D w
where LDr and LDw are the rating and weight corresponding to the low drought category, respectively. MDr and MDw depict similar values for the moderate drought category. SDr and SDw show the rating and weight determined for severe drought. Finally, EDr and EDw are the rating and weight for extreme drought. The values of DHI are normalized using the min-max normalization approach, which transfers the distribution of all values between 0 and 1.

Drought Characteristics

Four drought characteristics are calculated from the drought index. These characteristics are duration (DD), severity (DS), intensity (DI), and frequency (DF). The drought characteristics are computed for each drought category considering the thresholds shown in Table 2, similar to [9,48,49,50]. A drought starts as the Drought Index (DI) value falls below the threshold and ends when this value rises above the threshold again [9,51]. A calculated drought occurs if there are at least two consecutive months between the start and the end of the drought. Drought frequency is calculated in a five-year time window by splitting the 30-year dataset into six. These periods provide more accuracy and details than longer time resolutions [52]. The drought characteristics are calculated as follows.
  • Drought duration (DD): the number of months between the start and the end of droughts; the start month is considered, and the end month is omitted in calculations [51].
  • Drought severity (DS): the integral of the area confined between the horizontal line below the drought index threshold and the start-end points of the drought event. This method of demarcating is based on run theory [53].
  • Drought intensity (DI): DS per DD, which suggests that events with less duration and more severity have a greater intensity.
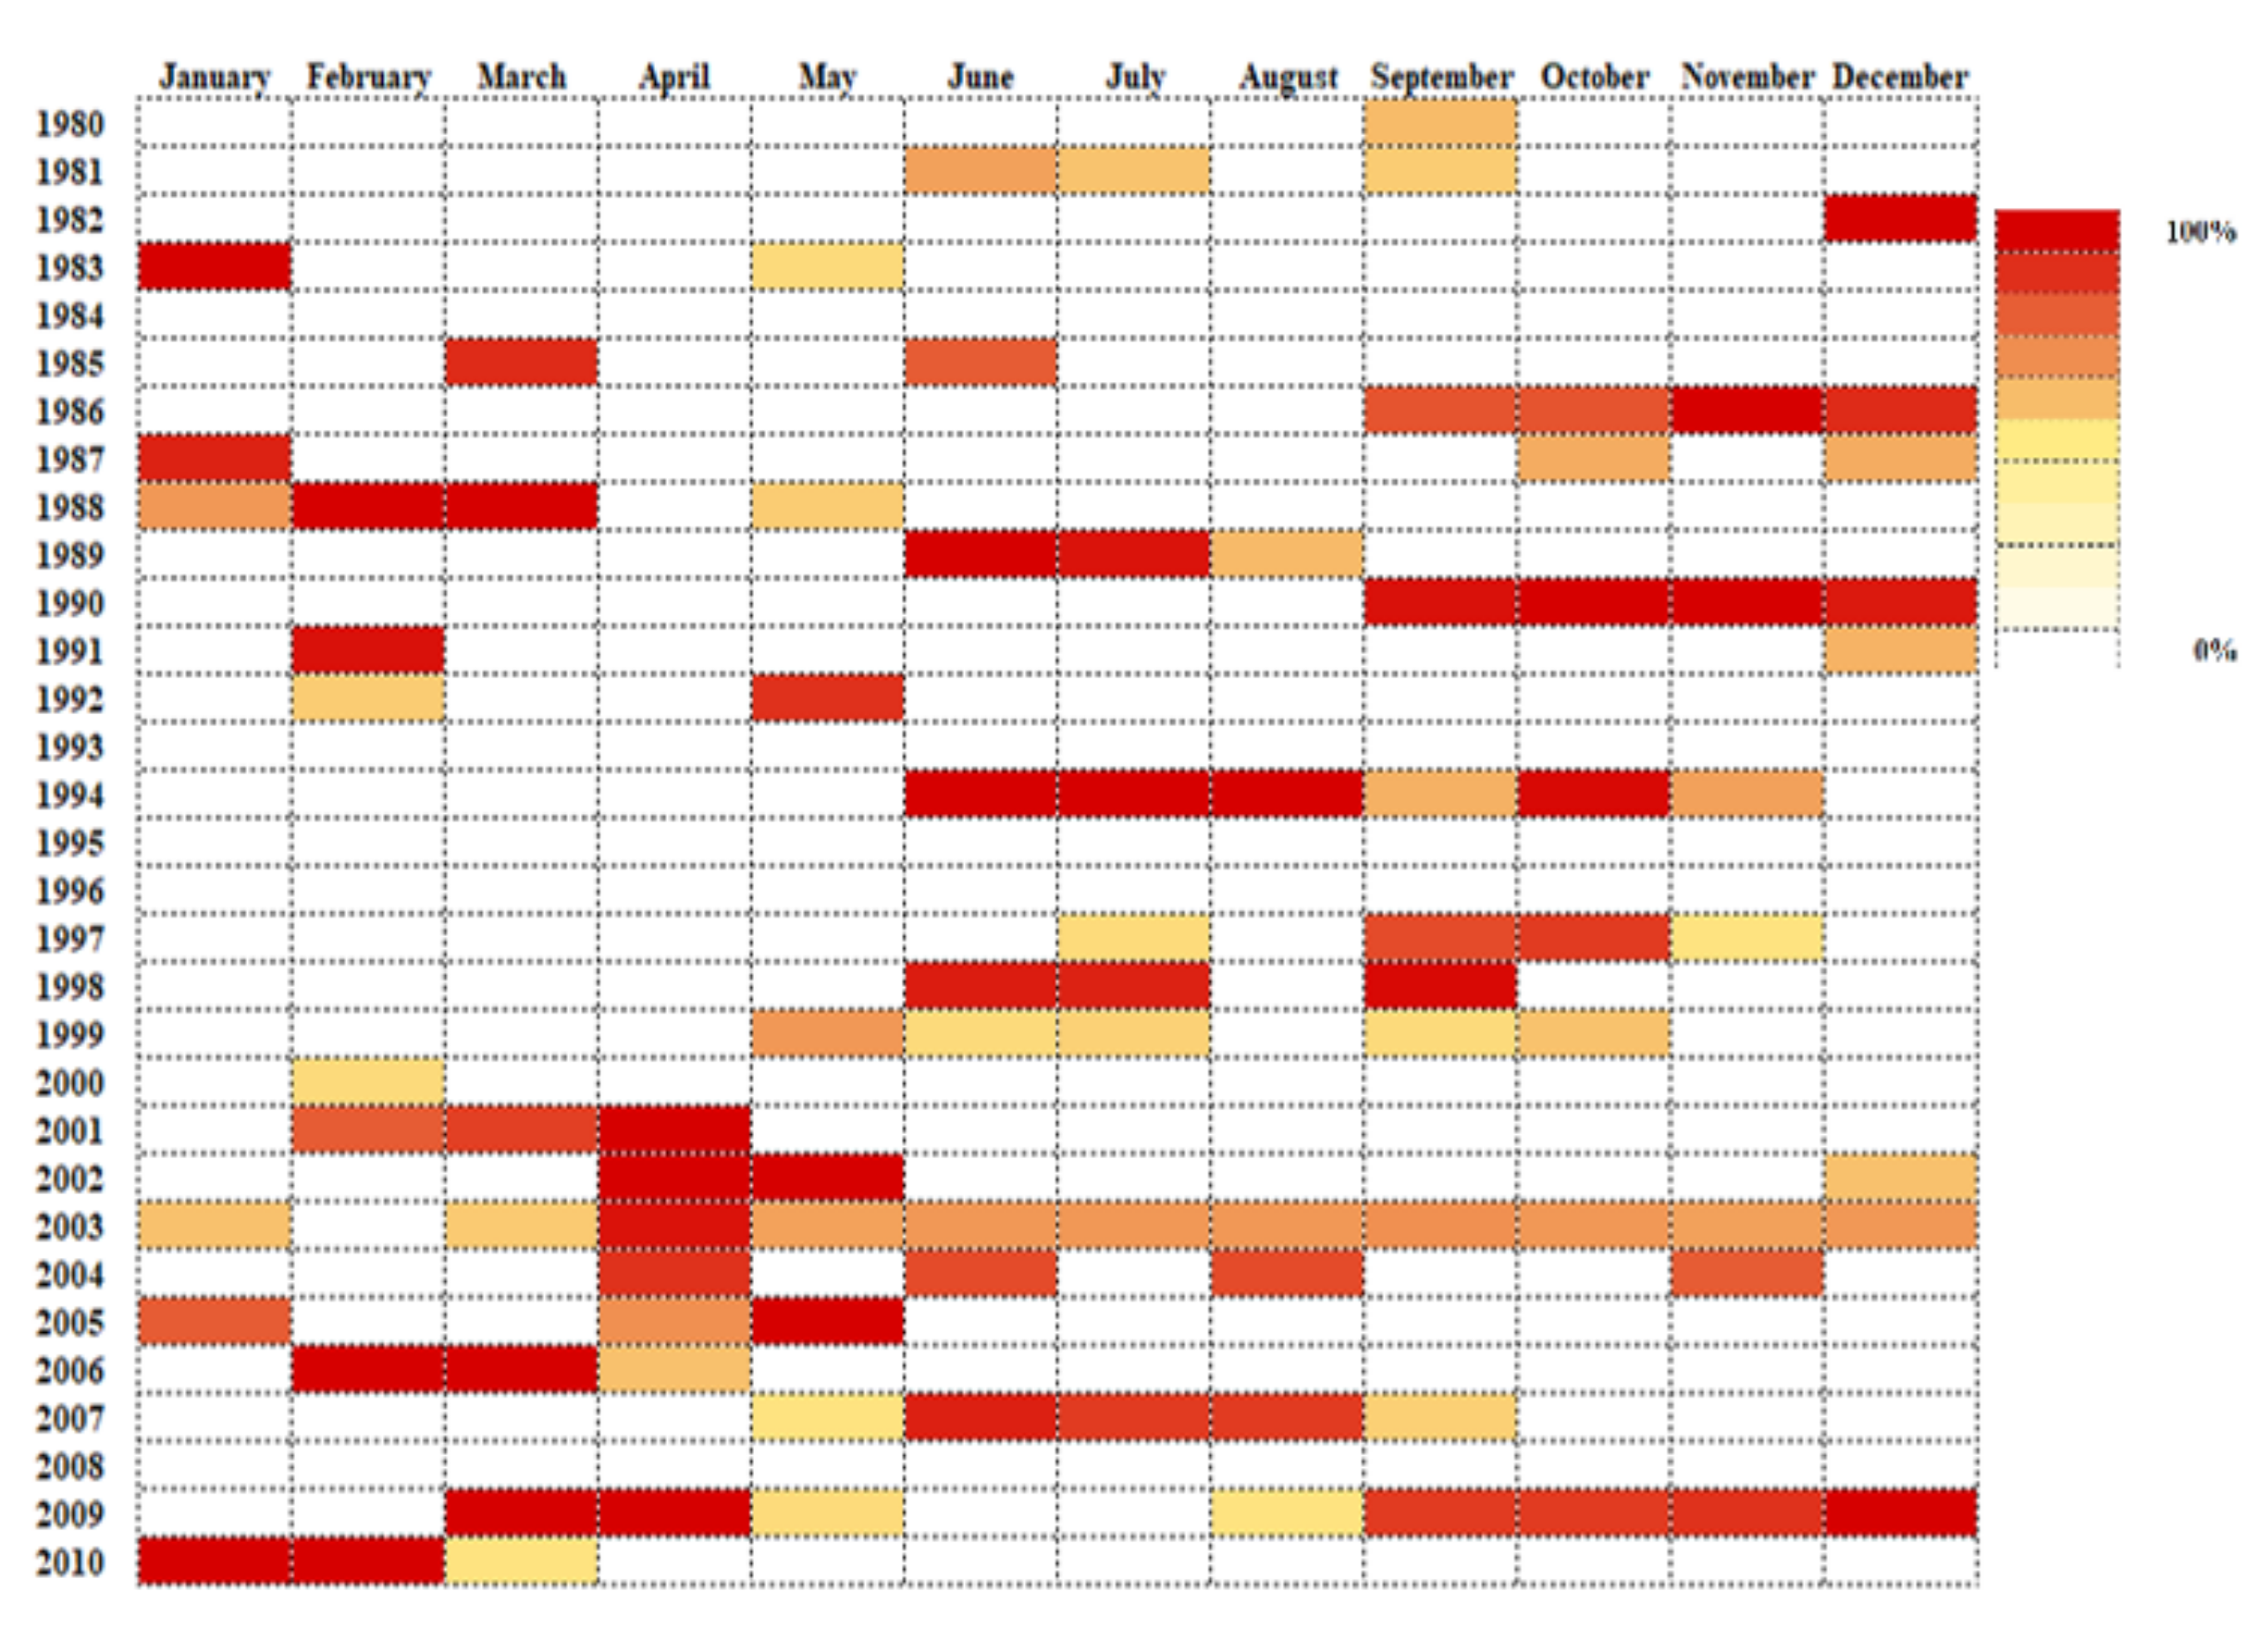
  • Drought frequency (DF): the numbers of events per quinquennium, and the numbers of events for the entire period (31 years, from 1980 to 2010).
To validate the results of drought characteristics, calculated droughts were compared with the El Nino and La Nina years. For this case, the spatial extent of drought (area) was calculated and used for the comparison. The percentage of drought area of the whole basin was calculated on a monthly basis as the ratio between the area of sub-basins in drought and the total area of the basin. As mentioned, a sub-basin is in drought if the drought index is below the selected threshold (Table 2).

Standardized Evapotranspiration Deficit Index (SEDI)

The Standardized Evapotranspiration Deficit Index (SEDI) is based on the Evapotranspiration Deficit (ED) anomalies, where PET and AET are used. By taking into account AET, which is the volume of the water evaporated directly from the soil, SEDI captures a more accurate image of the ground’s drought condition [35,44,45]. Although SEDI has been used to calculate meteorological and hydrological drought in previous studies [10,54,55], it is also used for agricultural drought monitoring.
To calculate SEDI, first, the ED anomalies are computed. There are ED formulations that use PET and AET. Some consider the difference between them (PET-AET), or the difference AET-AED as Vicente-Serrano et al. [10], where AED is atmospheric evaporative demand. Others use mathematical relationships that relate PET and AET, such as the Bouchet hypothesis [54]. Another way to calculate ED is through PET and AET’s relative difference concerning PET (Equation (5)). In Equation (5), ED runs from 0 to 1, with the lowest value being the worst condition.
ED =   PET AET / PET
In this research, SEDI calculation followed the formulation presented in Mercado et al. [55] that considers Equation (5) for ED calculation.
Once ED is calculated, the methodology follows the steps of SPI, but using ED instead of P. The SPI calculation method introduced by McKee et al. [3] is described as follows. First, an aggregated period (m) is specified. Usually, 3, 6, 9, 12, 24, and 48 months periods are considered. For each period, the hydrometeorological variable is aggregated, considering the analyzed month and previous m-1 months. After, each time series is fitted to a probability distribution. Then, the cumulative probability values are considered the same as the cumulative normal distribution. Finally, considering the mean of 1 and a standard deviation of 0, the inverse normal probability values are calculated.
For fitting ED, we used the three-parameter Log-logistic (LL3) distribution as the literature suggests [48].
Through PET theoretically, it is possible to compute the amount of water lost in evaporation or transpiration if there is an adequate water supply. Thus, using the PET is more desirable than just P since it considers the temperature and, as a result, the role of global warming and provides a more suitable vision about the effect of climate change on drought [56]. However, PET captures the most extreme situation of the evaporation situation. Therefore, a closer evaluation of the condition on the ground is necessary. This limitation can be overcome with the use of AET. AET can be calculated following remote sensing approaches or hydrological modeling, although empirical formulas can also be used.

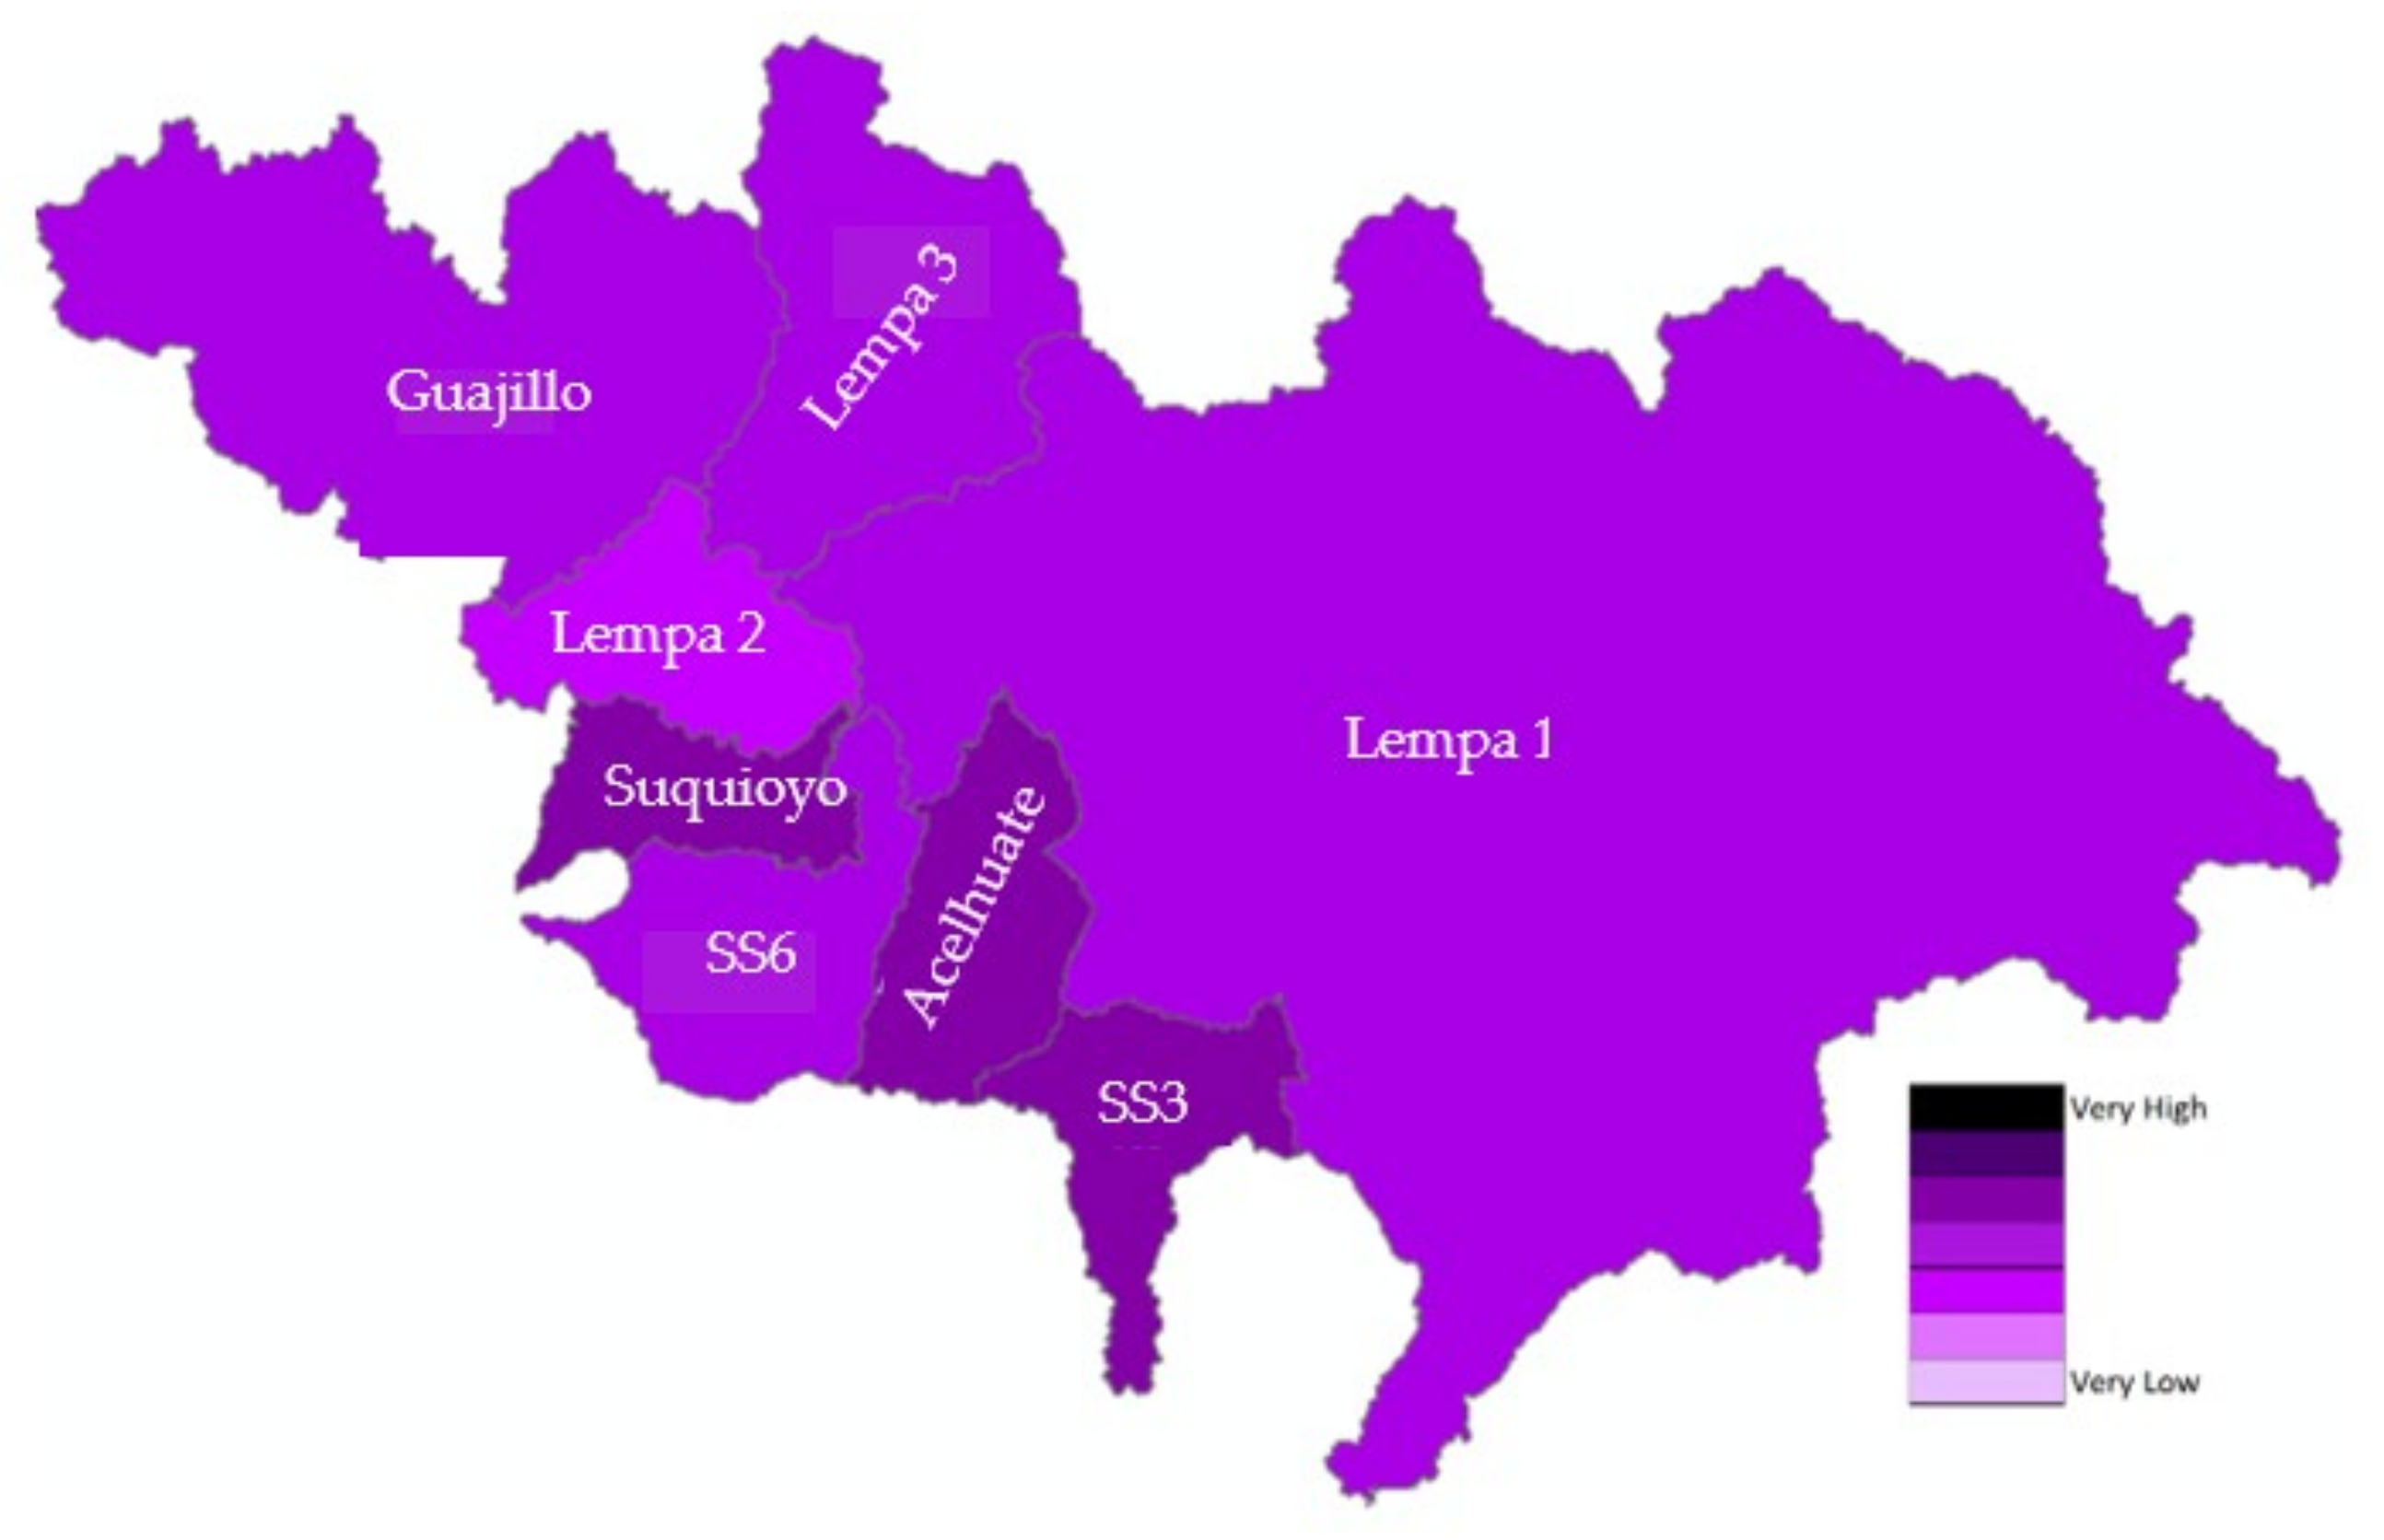
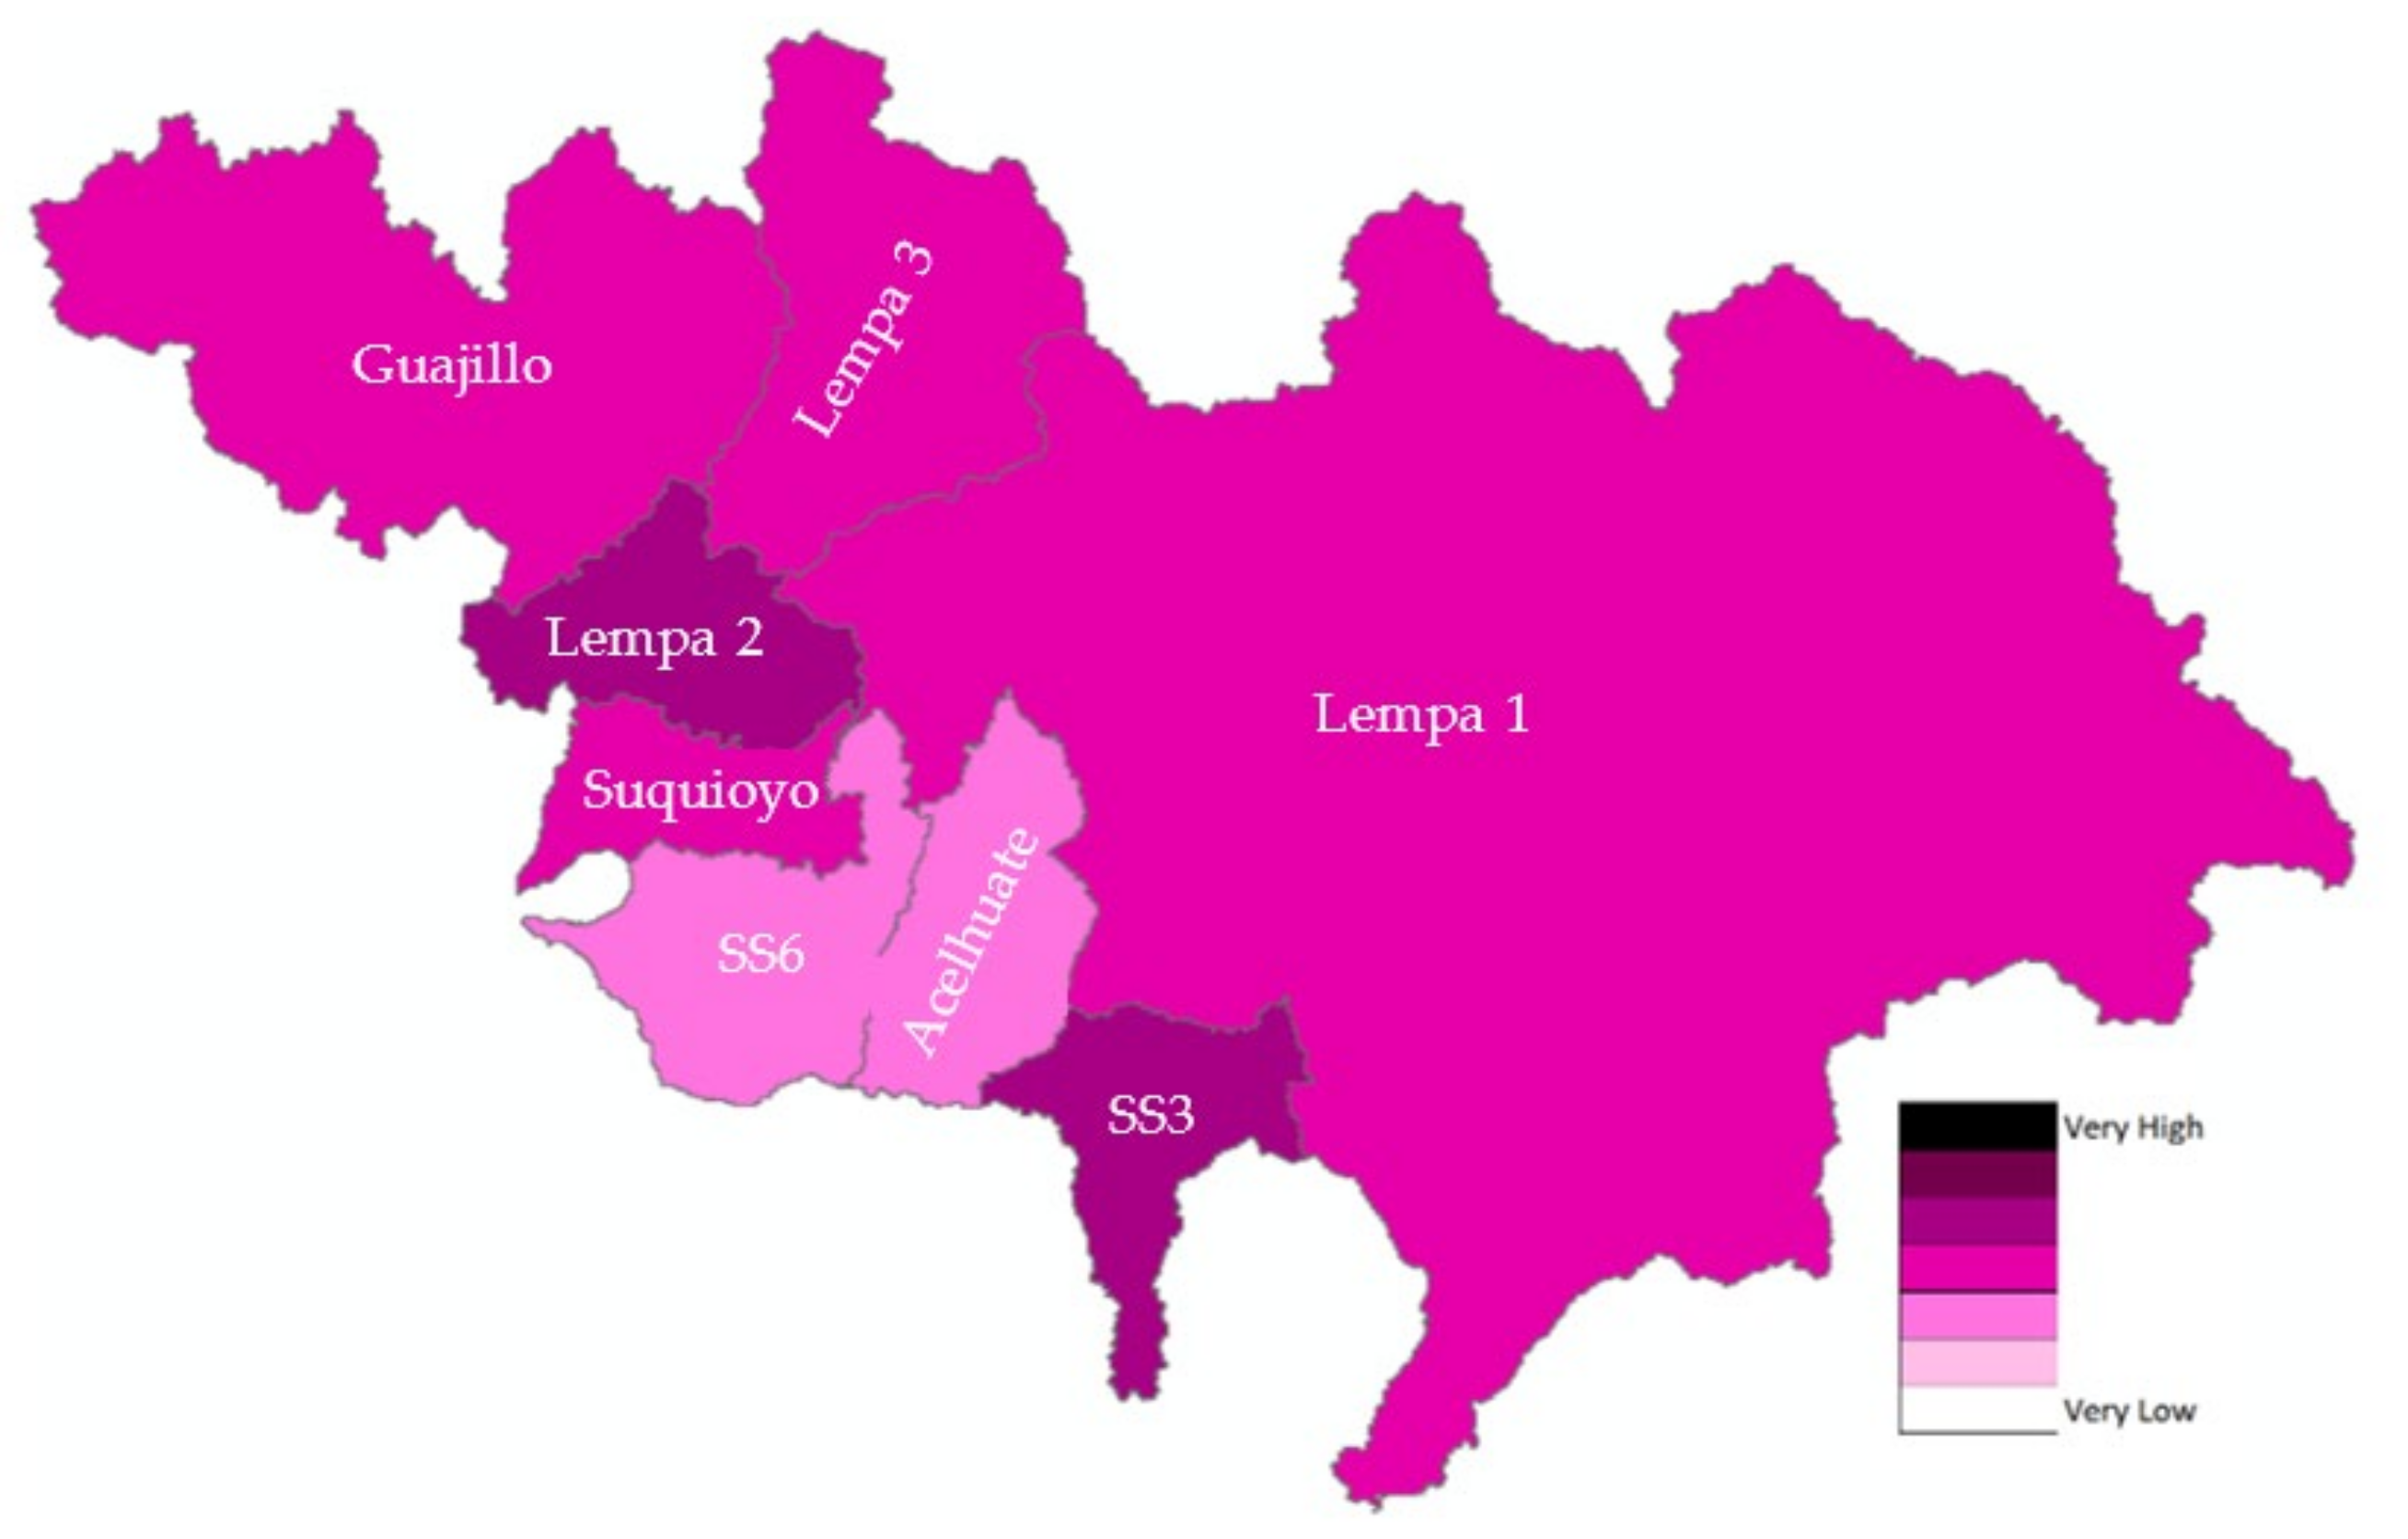
2.3.2. Drought Vulnerability Index (DVI)

Vulnerability refers to the communities’ conditions, making them suffer more in a disaster situation [24]. Vulnerability describes the degree to which a socioeconomic system or physical assets are susceptible to the impact of natural hazards [11]. The selection of vulnerability indicators varies between the sector, and their selection should be directly relevant to the local study context and their particular hazards [17]. Although many efforts have been made to determine a natural hazard vulnerability [13,17,24], factors related to soil conditions and agriculture are rarely used [13]. The inclusion of the assessment of agriculture-related vulnerability is essential in drought study, particularly in the evaluation of agricultural drought.
Considering the region’s local socioeconomic conditions, the following selected parameters to calculate DVI are proposed based on the previous studies of [11,57].
● Socioeconomic factors
  • Population Density (PD): the number of habitants per km2. Disaster with similar severity will affect more people if they occur in a more populated area.
  • Female to Male ratio (FM): the number of women to the number of men in an area. It has been proved that women are most at risk when a disaster occurs [11,58].
  • Poverty Level (PL): the percentage of people living below the poverty line in an area. There is a direct and absolute correlation between poverty and vulnerability, and the poor suffer more from hazards [11,59].
  • Agricultural Occupation (AO): the percentage of people working in the agriculture segment, including farmers and agricultural workers. Farmers fail to plant or get less production due to drought.
● Physical/infrastructural factors
  • Irrigated Land (IL): the percentage of irrigated land to total land. As the supplied water for irrigated land depends on the surface and groundwater resources, the IL factor is directly related to meteorological drought [2,11,60]. IL involves cash crops that usually are dependent on irrigation. Usually, the presence of irrigation avoids water stress in the crop fields in comparison to rainfed. At the same time, IL still represents the system’s vulnerability to lack of supplied water due to droughts [61]. We employed a systematic approach that considers all parts of the system, not the separate ones.
  • Soil Water holding Capacity (SWC): the difference in water content between field capacity and permanent wilting point, which shows soil’s ability to buffer crops during periods of deficit moisture.
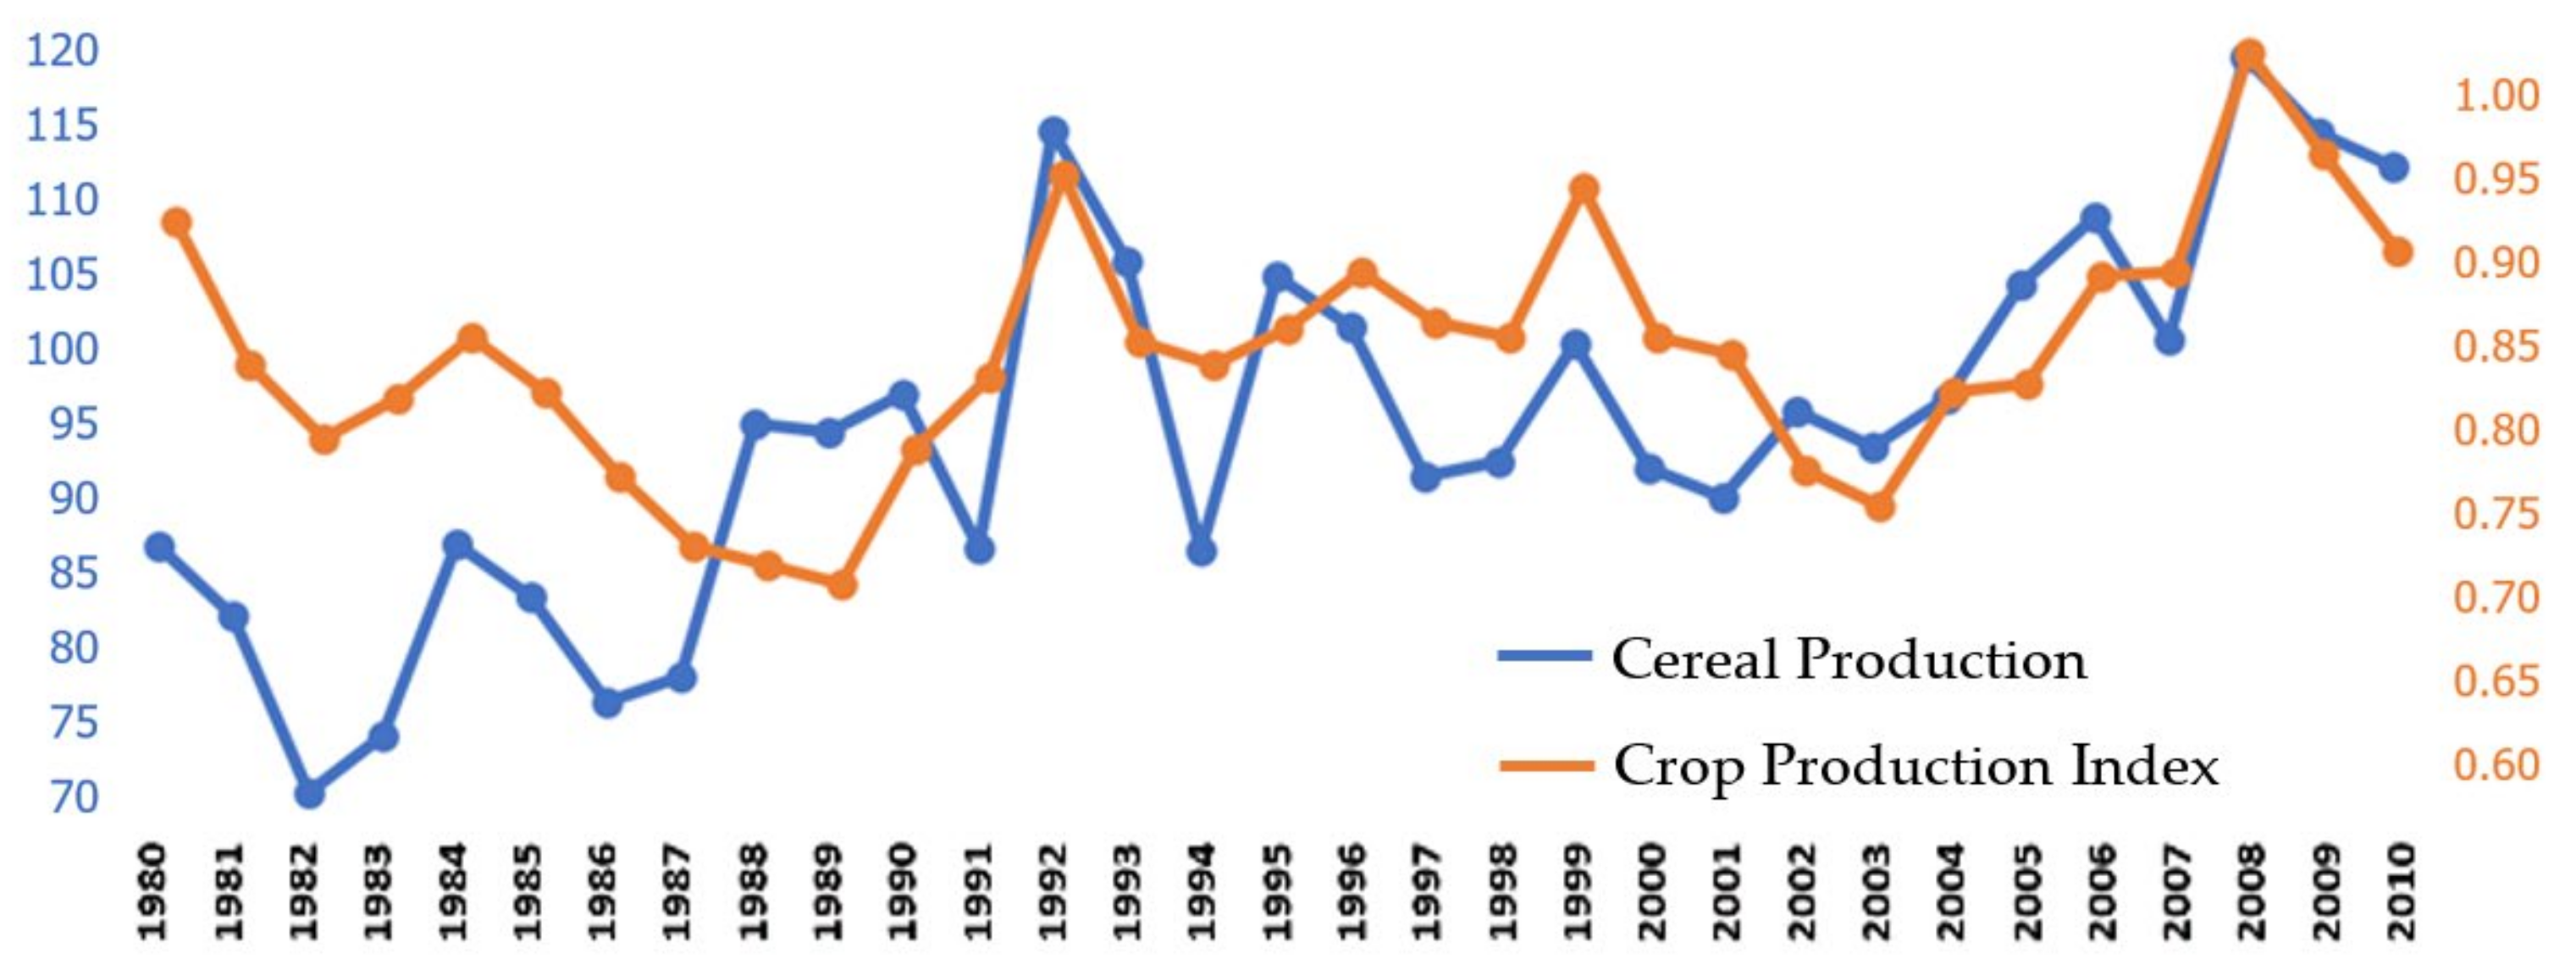
  • Food Production (FP): the amount of food, i.e., food crops that are considered edible and contain nutrients, produced in metric tons per square kilometer. Droughts in higher food production areas will have a higher negative impact on the economy.
The average PD of cities which are located in a sub-basin is considered as the sub-basin’s PD. Accordingly, we obtained a data set of PD for 1980–2010. Population data were obtained from El Salvador’s Department of Statistics and Census [62], National Institute of Statistics Guatemala [63], and Honduras’s National Institute of Statistics [64].
FM, PL, AO, IL, and FP time series of 31 years have been obtained from World Bank data [65]. We also have used the “Global Assessment of Water Holding Capacity of Soils” dataset [66] to calculate SWC in each sub-basin. Higher values indicate greater vulnerability for all of the mentioned factors except for soil water holding capacity (SWC). In SWC, lands with lower water holding capacity are more vulnerable to droughts, and higher values of this factor show more desirable conditions.
The mentioned factors are all normalized using the max-min approach.
Although several research works have calculated DVI, most of them neglected the degree to which these factors contribute to its calculation; therefore, DVI is usually calculated as an average ( DVI = i = 1 n I i / n ). Where n is the total number of factors, and Ii is the ith factor. When in DVI calculation, the average is used, the condition of the factors’ equal vulnerability is assumed [13,30].
A way to consider vulnerability’s factors differently is through weights. We used the Analytic Hierarchy Process (AHP) to derive such weights. AHP works based on binary comparison of factors and employing expert’s opinions that provide a proper evaluation of each factor’s significance. On the one hand, it takes into account the integration and complexity of the system. On the other hand, AHP keeps application flexibility in various climatic, geographical, and socioeconomic regions. For further details on the application of AHP, interested readers can consult Saaty [67]. Accordingly, DVI is calculated following Equation (6).
DVI =   i = 1 n w i   I i =   w 1   I 1 + w 2   I 2 + + w n   I n
where wi is the weight of the ith factor obtained from the AHP method ( 0 w i 1 ,   i = 1 n w i = 1 ), and Ii is the normalized value of the ith factor.
In this investigation, considering the factors previously introduced, DVI is calculated by Equation (7).
DVI = PD w × PD n + FM w × FM n + PL w × PL n + AO w × AO n + IL w × IL n + SWC w × ( 1 SWC n ) + FP w × FP n
where PDw, FMw, PLw, AOw, ILw, SWCw, and FPw are the weights for population density, female to male ratio, poverty level, agricultural occupation, irrigated land, soil water holding capacity, and food production, respectively. These weights are calculated with the AHP method. PDn, FMn, PLn, AOn, ILn, SWCn, and FPn are the normalized values of population density, female to male ratio, poverty level, agricultural occupation, irrigated land, soil water holding capacity, and food production, respectively. As the SWC has a vise versa behavior compared to the other six factors, we used ( 1 SWC n ) in Equation (7).
We implemented AHP as follows. The assignment of weights is based on experts’ opinions. Weights range from 0 to 1, and the sum of all equal to the unity. Based on experts’ opinions, including the MARN staffs as practitioners as well as local and international scientists of the scope, we ranked the seven factors considered (population density, female to male ratio, poverty level, agricultural occupation, irrigated land, soil water holding capacity, and food production) from 1 (the most vulnerable factor) to 7. Then, we employed AHP to find the weight of each factor (wi).

2.3.3. Drought Resilience Index (DREI)

As a multidimensional concept, resilience (RE) embraces different subjects in various fields, and its definition depends on the aim of investigation [24]. Based on the method and data proposed by Hughey et al. [30], RE pictures the ability of people, organizations, and systems to face and manage adverse, emergency, or disastrous conditions. Accordingly, RE includes factors that influence a community’s ability to absorb the negative impacts associated with a hazard effectively. On the one hand, a high RE suggests the combination of strong governance, economic capacity at the household level, environmental capacity, and availability of robust infrastructures that support people during normal and emergency conditions. On the other hand, a low RE indicates a limited ability to absorb, manage, and recover from hazards.
A generic equation to calculate DREI using a weighted combination of the contributing factors is indicated in Equation (8).
DREI =   i = 1 n w i I i
where DREI is the drought resilience index that runs between 0 and 1, n is the total number of factors, wi is the weight of the ith factor, and Ii is the normalized value of the ith factor.
In this study, we consider governance, infrastructure, economic capacity, and environmental capacity as the factors to assess DREI. The higher values of DREI show better conditions. Based on the weighted average to address differences in data quality and availability [30,43], DREI is calculated with Equation (9).
DREI = 0.3 G o + 0.3   I n + 0.3   E C + 0.1   E n C
where Go, In, EC, and EnC are governance, infrastructure, economic capacity, and environmental capacity, respectively. Factors are normalized using the max-min approach.
The factors to calculate DREI are proposed based on the previous studies of the Pacific Disaster Center (PDS) [68]. A description of each factor, based on the PDS, is provided as follows.
  • Governance (Go): The stability and effectiveness of institutional structures to provide equitable public services, freedom in selecting government, and enforcement of laws to prevent and control crime and violence. The total number of voter participation, violent crimes, extortion, and threats per 10,000 populations, as well as the percentage of householders that receive trash collection, are five components that create the Go factor [28,30].
  • Infrastructure (In): The ability to exchange information and physically distribute goods and services (Transportation and Health Care). Three healthcare infrastructure components including the number of physicians, nurses, midwives, and hospital beds per 10,000 population, and two transportation infrastructure components including the length of road and rail lines by total land area and the number of ports and airports per 10,000 km2 land area [27], and two communicational infrastructure components including the percentage of householders with a fixed phone line and percentage of householders with at least one cellular phone [69] are the seven components creating the In factor [30].
  • Economic capacity (EC): A region’s ability to absorb economic losses and mobilize financial assets to provide the required assistance. Total monthly income per capita, census value added per capita, and percentage of households that receive remittances are the three components of EC [30,69].
  • Environmental capacity (EnC): The environment’s ability to recover and maintain species health, biodiversity, and critical ecosystem services after impact. The percentage of total land area that is protected represents this factor [30].
Components that create each DREI factor are normalized based on the max-min approach (with a value between 0 to 1) and equally contribute to creating the factor (i.e., the average of components). Each component has been calculated for the eight sub-basins. This value is obtained from the weighted average of the calculated values for departments that the sub-basin embraces. Each department’s weight has been gained from the percentage of the sub-basin area, which is covered by the department.

3. Results

3.1. Drought Index

Employing Equation (5), the drought index (SEDI) was calculated monthly for 1980–2010 (31 years). As mentioned in the calculation of SEDI, it can be calculated at different aggregation periods. Although the drought risk assessment can be performed considering several aggregation periods, we chose the one that allowed us to evaluate both the agricultural drought and, as far as possible, the hydrological drought. Mercado et al. [55] showed that SEDI is highly correlated with SPI and SPEI in different time steps, especially in lower than nine months. SPI with 3 or 6 months can be considered as an agricultural drought index [3,70]. Additionally, we compared the river streamflow and SEDI for 3, 6, 9, and 12 months. We found that SEDI06 (SEDI for the aggregation period of 6 months) is most related in terms of low flows in the basin. Accordingly, we consider SEDI06 as the best proxy of the agricultural and hydrological drought condition in the basin. SEDI06 reflected a realistic vision of the basin that links meteorological, agricultural, and hydrological drought. Figure 3a–h shows the time series of SEDI06 in the eight sub-basins of the Lempa River basin for the period 1980–2010. These results were used in drought characterization and drought hazard index (DHI) calculation.

3.2. Drought Characteristics

Based on Table 2, the threshold of −0.42 that is the start point of Moderate Drought (MD), is selected to calculate drought events during our study horizon. Figure 4a–h shows droughts calculated with SEDI06 based on this threshold in eight sub-basins of the area. Red colors represent droughts ( S E D I 06 0.42 ), while white colors show the months that are not in drought. We calculated Drought Duration (DD) for each drought as the number of successive months in drought (red color).
To picture drought characteristics using SEDI06 over 31 years, we assessed DF, DS, and DI. These three characteristics were also calculated by dividing the overall period into six quinquennials, including 1981–1985, 1986–1990, 1991–1995, 1996–2000, 2001–2005, and 2006–2010. Figure 5, Figure 6 and Figure 7 show DF, DS, and DI over the mentioned quinquennials and the entire period, respectively.
As the results depict, during the first quinquennial (1981–1985), DD (Figure 4a–h) and DF (Figure 5a) are lower in comparison to other quinquennials. Besides, the events are milder (Figure 6a) with lower intensity (Figure 7a). During 1986–1990 droughts get more prolonged (Figure 4a–h) and more recurrent in Lempa1 and Lempa3 sub-basins (Figure 5b). Lempa3, Guajillo, and to some extent, Lempa1 sub-basins faced severe (Figure 6b) and intensive (Figure 7b) dry conditions during this quinquennial. During 1991–1995 a longer DD with five months tail appears in Guajillo, Lempa2, and Lempa3 sub-basins (Figure 4a–h). Guajillo and Suquioyo sub-basins have higher DF (Figure 5c), and the events are more severe (Figure 6c) in the western part of the basin. Suquioyo and SS6 have the most intensive events during this quinquennial (Figure 7c). During 1996–2000 events usually have low DD (Figure 4a–h). The lowest frequency of the phenomenon over the five quinquennials (Figure 5d) is observed in Guajillo and Suquioyo sub-basins during these years. Besides, the lowest drought severity takes place in Suquioyo and SS6 (Figure 6d). Droughts are more intensive (Figure 7d) in Lempa1 and Lempa3 during this quinquennial. The longest DD (Figure 4a–h) and highest DF (Figure 5e) are observed from 2001 to 2005, which appeared in Guajillo, Lempa2, and SS3 sub-basins. During these five years, the south-western part of the basin has undergone more severe (Figure 6e) and intensive (Figure 7e) events. During the last quinquennial, droughts are longer in Acelhuate and SS3 sub-basins (Figure 4a–h) and more recurrent (Figure 5f) along a large part of the basin. The highest DS (Figure 6f) is taken place in this period, and DI (Figure 7f) is almost the highest all over the basin.
Regarding the overall period (Figure 4a–h), the longest DD was nine months in Suquioyo and SS6 sub-basins during March-December 2003. Even in the remainder of sub-basins, this year has the worst case in terms of drought duration. During these 31 years, Lempa3, Acelhuate, and SS3 have the highest DF (Figure 5g) and DS (Figure 6g) in comparison to the other sub-basins. Results show that drought is more intensive in the basin’s eastern part (Figure 7g).

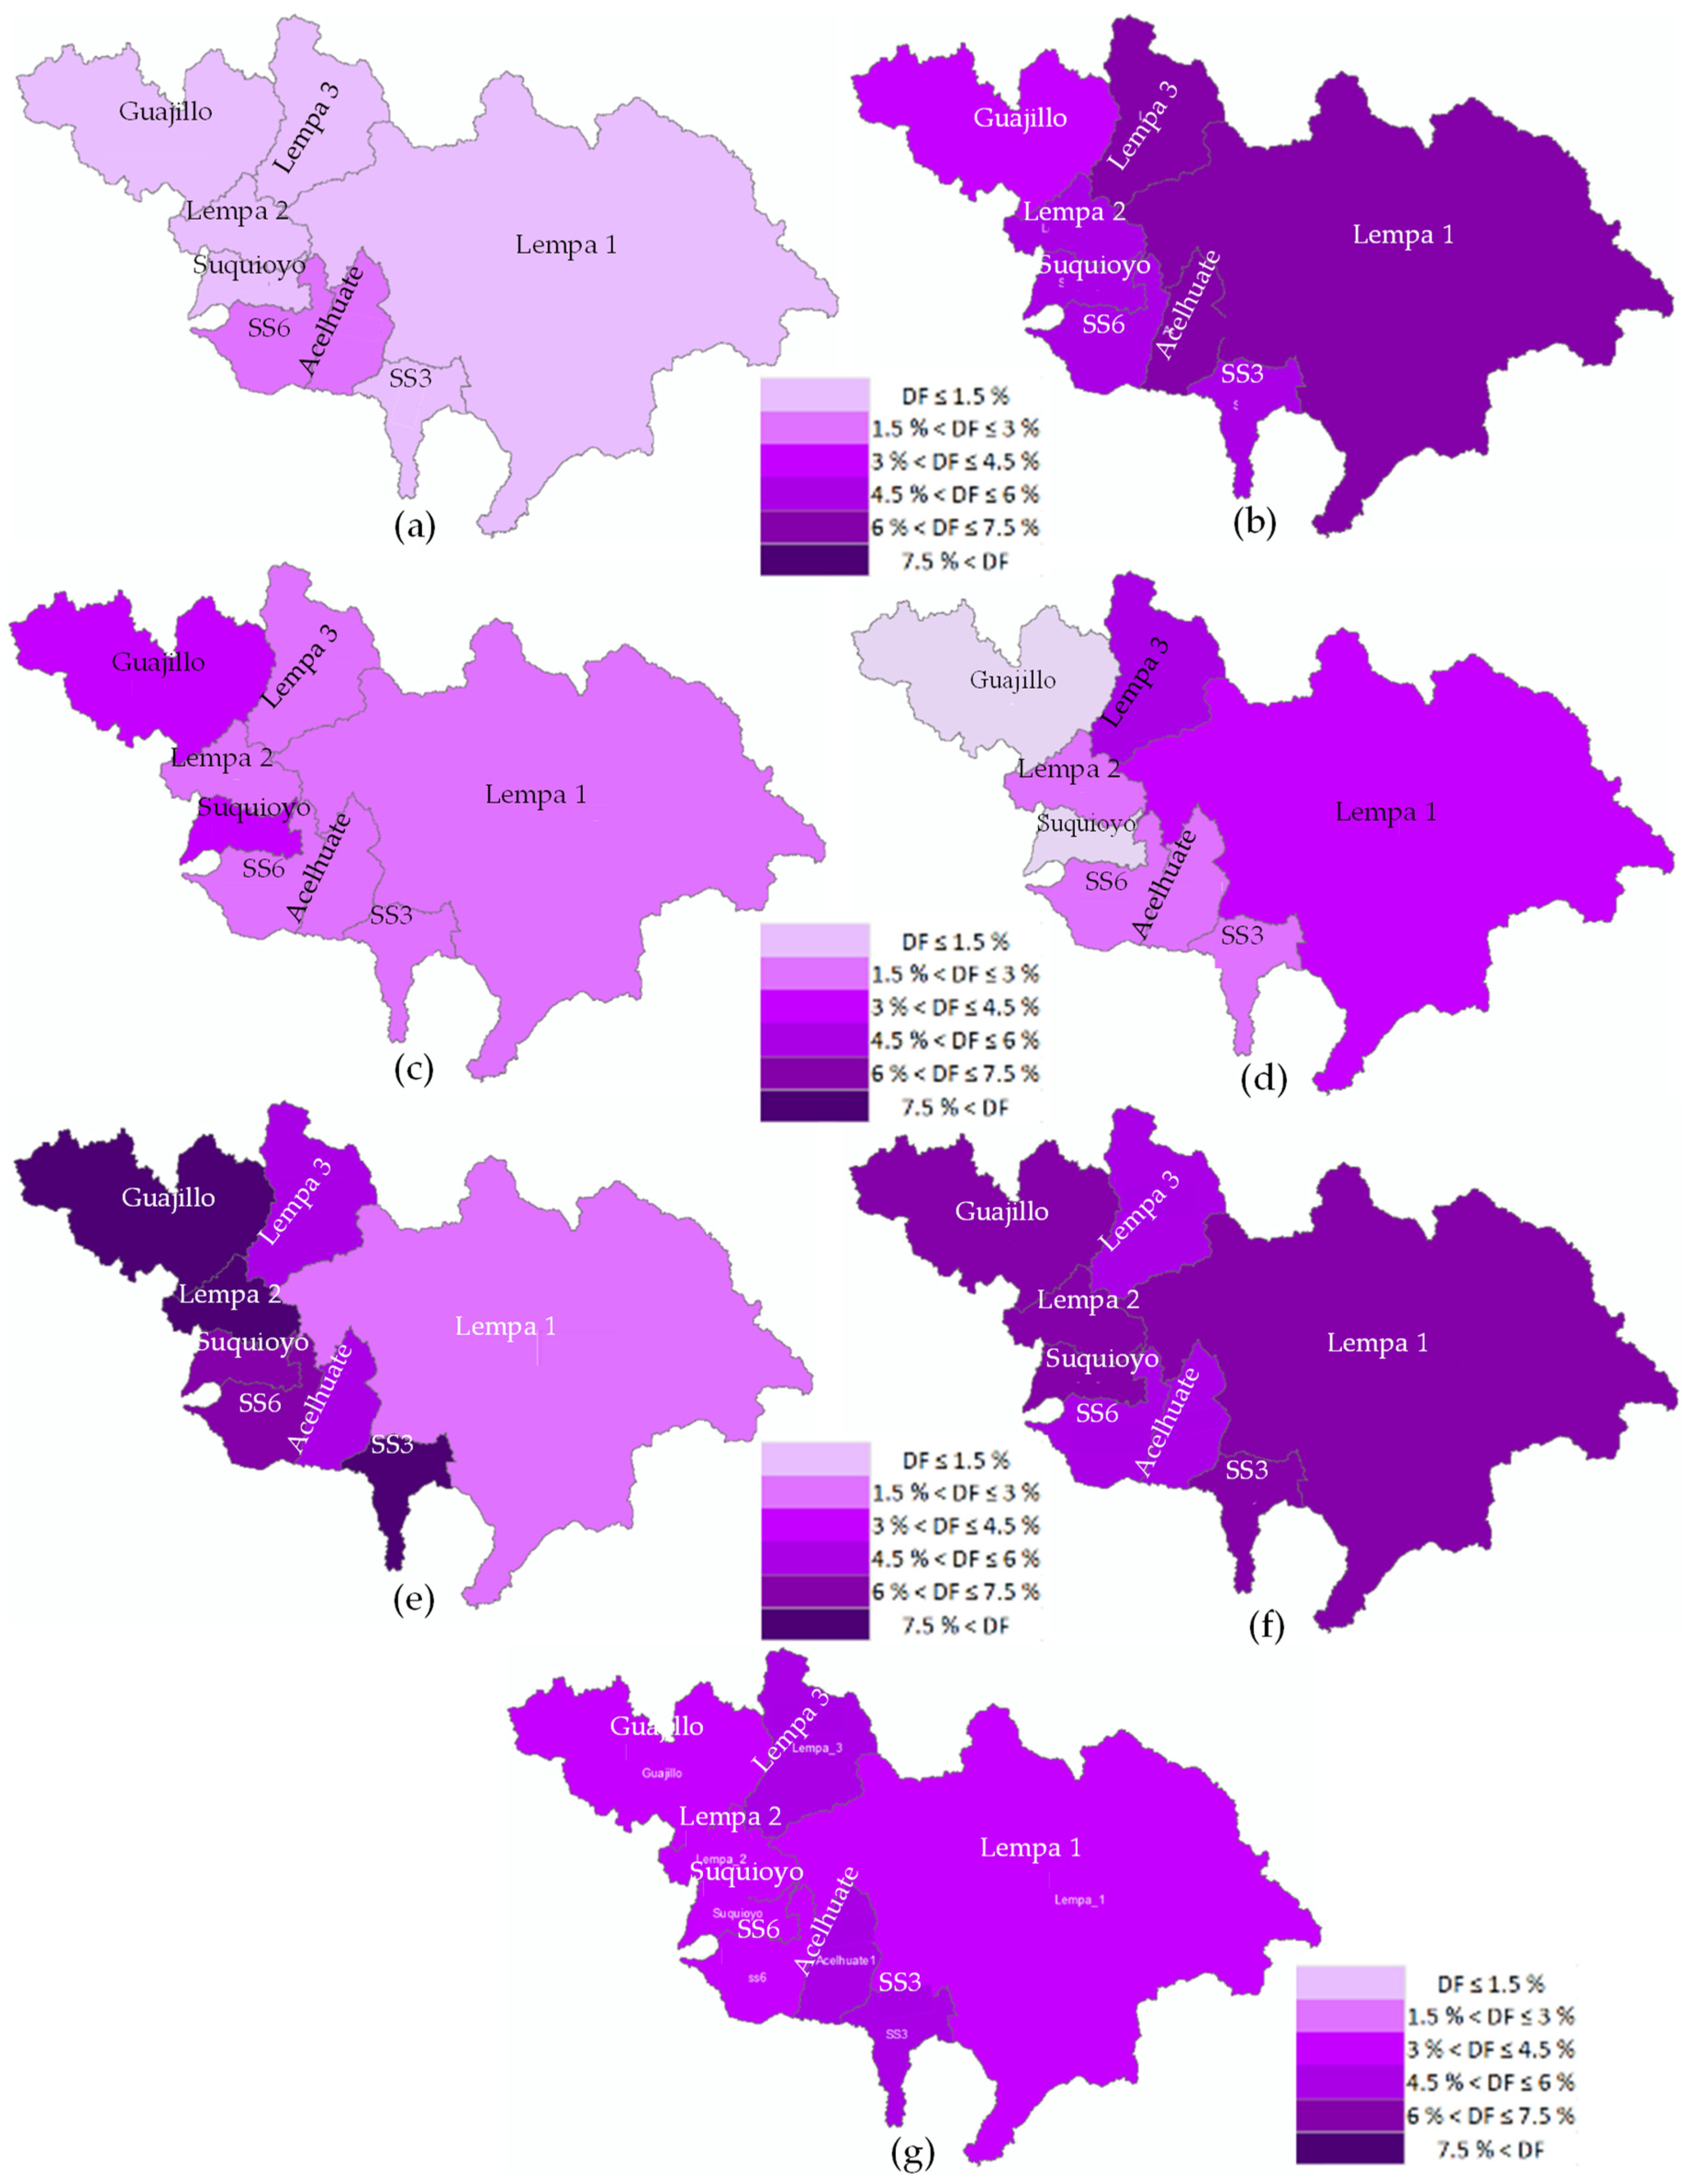
3.3. Percentage of Drought Area

Figure 8 presents the percentage of drought area based on SEDI06 for the Lempa River basin (1980–2010). Droughts with long duration are observed in 1986, 1990, 2003, and 2009. These droughts usually start in September and last till the end of the year. Among the mentioned years, the highest percentages occurred in 1990, and the longest one is in 2009, which lasts till March 2010. A clear increase in the duration of the drought is observed in the last decade, where more months perched at drought from March to May, while they were not at drought before. The highest percentage of the area at drought started from March to December of 2003 (ten months). The best situations are observed in 1984, 1993, 1995, 1996, and 2008, when there was no area at drought during the year.

3.4. Drought Risk Assessment

The results of DHI, DVI, DREI, and DRI are provided in this subsection. Maps of each index are presented in Figure 9, Figure 10, Figure 11 and Figure 12, respectively.
DHI was obtained based on the weights and rates provided for SEDI06 in Table 2 and using Equation (4). As Figure 9 shows, Guajillo and Lempa3 have the best condition among the eight sub-basins in terms of DHI. Suquioyo, SS3, and SS6 are in relatively low hazard, and the rest of the sub-basins face moderate drought hazard.
DVI was calculated by Equation (7). Figure 10 suggests that Suquioyo, Acelhuate, and SS3 are more vulnerable to drought, while Lempa2 sub-basin has the lowest vulnerability facing drought. The other sub-basins that embrace the largest part of the basin are in a moderate vulnerability situation.
After employing Equation (9), DREI was calculated in the eight sub-basins. As Figure 11 displays, SS6 and Acelhuate have the highest resilience when a drought occurs (recall that based on Table 1, the description of DREI is vice versa in comparison to DHI and DVI), while Lempa2 and SS3 have the worst capacity of resilience in the face of drought. The other parts of the region representing most of the basin are in a moderate situation of resilience.
By integrating these three indices (DHI, DVI, and DREI) by Equation (3), we calculated DRI. Figure 12 maps the DRI. This figure shows that Guajillo, Lempa3, and SS6 have the lowest drought risk, and the other parts of the region face moderate risk. As the drought characteristics components depicted, an increase in drought frequency and severity have occurred in the majority of the sub-basins within the last quinquennial (Figure 5f and Figure 6f, respectively). Furthermore, the events have become more intensive almost all over the basin during this quinquennial (Figure 7f). It was fruitful to obtain DRI within a horizon of 2006–2010 to investigate these characteristics’ impact on the risk. Figure 13 maps DRI during 2006–2010 over the eight sub-basins. As Figure 13 depicts, the basin is divided into three parts: relatively low, moderate, and relatively high DRIs.

4. Discussion

4.1. Calculation of Droughts and Their Characteristics

From 2001 and in almost all sub-basins, a drought pattern within March to May is captured (Figure 4a–h shows). On the other hand, from September to December, which includes the region’s wet period [31], there is a recurring pattern of droughts with the driest situation in 2003. Figure 5, Figure 6 and Figure 7 show that DF and DS are similar in some sub-basins in terms of the highest and lowest amounts, while the pattern is different in terms of intensity. Droughts are more frequent and severe in the Lempa3, Acelhuate, and SS3 sub-basins, whereas the events get more intensive in the western part of the basin. We compared El Nino and La Nina years [71] with calculated droughts to corroborate the results of drought duration and frequency. Figure 14 shows El Nino and La Nina years based on Oceanic Nino Index (ONI) [71].
In 1986, 1994, 2003, and 2009, droughts with long duration are observed (Figure 8), moderate El Nino has been reported. This pattern of occurrence in El Nino coincides with the results of the drought calculation. On the other hand, 1984, 1995, 1996, 2000, and 2008 are white years with zero percentage of drought areas when we observe La Nina in Figure 14. Accordingly, there exists a meaningful relationship between the obtained results (Figure 8) and the El Nino-La Nina report (Figure 14) outlining our results’ validity.
On the other hand, 1984, 1995, 1996, 2000, and 2008 are white years with zero percentage of drought areas. As Figure 14 depicts, these years are related to La Nina [71]. This relationship between the obtained results (Figure 8) and the El Nino-La Nina report (Figure 14) outlines our results’ validity.
Drought is a significant driver that leads to cereal loss both in yield and quality worldwide [72]. If ED and thereby SEDI depict the drought, there should exist a relation between SEDI and cereal production when droughts are severe both spatially and temporally [73]. Accordingly, we also compared the patterns of drought areas (Figure 8) with cereal production of El Salvador [74]. Figure 15 shows the country’s cereal and crop production for the period 1980–2010.
Cereal production presents a local minimum value in the years 1986, 1994, 2003, and 2007. In 2009, the production was also lower than its previous year. These drops in cereal production coincide with drought patterns. In 1994, the most extended drought area, an intensive reduction occurred in the production amount comparing with the other mentioned years. On the other hand, in 1984, 1995, 1996, and 2008, as the white years (Figure 8), and relatively 2000, the production shows at a local maximum. Such similarity between the patterns of drought areas and the evolution of crop production index is also observed in Figure 15. These observations indicate that the results could be used for the assessment of agricultural drought. Generally, a growing pattern in cereal and crop production is observed during our study horizon, which may seem odd at first glance as the drought risk has increased as well. This is because cereal and crop productions are influenced by different factors, including agricultural land and technology. As an instance, El Salvador’s agricultural land has grown from 14,100 km2 (or 68.05% of land area) in 1980 to 15,350 (or 74.08% of land area) in 2010 [75].

4.2. Drought Risk Assessment

We incorporated SEDI into the DHI calculation. SEDI considers actual and potential evapotranspiration, for which this drought index also considers the effects of rainfall, land cover, and elevation. Therefore, SEDI is more related to agricultural drought. Figure 9 shows that DHI is observed in three levels, low, relatively low, and moderate hazard. Lempa1, Lempa2, and Acelhuate faced more severe droughts in the 31 years that means more tension in water availability and soil moisture. In these extreme conditions, various parts of the system are affected, such as agricultural activities, drinking, industrial required water, and biodiversity.
The DVI calculation using weights obtained from AHP based on experts’ opinions for the seven socioeconomic and physical/structural factors results in a comprehensive DVI map (Figure 10). The reflection of higher population density, and the percentage of people who depend on agriculture, has been pictured in the Suquioyo, Acelhuate, and SS3 sub-basins.
In calculating DVI, seven factors were considered, including Irrigated Land (IL) and Soil Water holding Capacity (SWC). These two factors were included to make a general assessment of the different agricultural production systems. The irrigated agricultural area is directly related to IL, while rainfed agriculture is linked with SWC. Currently, DVI is limited to considering an overall assessment of the agricultural condition. Therefore, the different water needs of the various crops may not be fully represented. However, factors considered in DVI calculation make it robust for assessments at the basin scale.
We considered four weighted factors to obtain DREI (Figure 11). As the figure shows, SS6 and Acelhuate have more capacity to cope with drought because of their appropriate governance, economic capacity, and infrastructures. San Salvador, as the capital of El Salvador, has an influential impact on DVI and DREI of the Acelhuate sub-basin. Its high population has led to worsening DVI, while DREI improvement is caused by the city’s good governance, economic capacity, and infrastructure.
It is worth noting that although Guajillo and Lempa3 sub-basins are moderately vulnerable (Figure 10) and do not possess strong powers of resilience (Figure 11), their DRI values are relatively low (Figure 12). These low DRI values are due in part to the relatively low drought hazard (Figure 9). In the SS6 sub-basin, we observe a relatively low DHI, moderate DVI, and relatively low DREI (relatively high power to cope with drought) that simultaneously result in relatively low DRI. In Lempa2, we observe moderate DRI. Coming to its influential factors, its DHI, DVI, and DREI are moderate, relatively low, and relatively high (relatively low coping power), respectively. In Lempa1, DHI, DVI, and DREI are all moderate, giving rise to moderate DRI. While Suquioyo has a relatively low DHI, relatively high DVI, and moderate DREI bring a moderate DRI. Acelhuate also has a moderate DRI, which is originated from a moderate DHI, relatively high DVI, and relatively low DREI (relatively high power of resilience). Finally, the SS3 has a moderate DRI caused by a relatively low DHI, relatively high DVI, and relatively high DREI (relatively low power of resilience).
Figure 13 shows the spatial distribution of DHI in the eight sub-basins over 2006–2010. During this period, Lempa3 has the same situation over the 31 years (Figure 12), as its DF, DS, and DI are not significantly different. On the other hand, Guajillo has relatively high DRI in the mentioned quinquennial, while its DRI is relatively low over the 31 years. The high DRI can be justified with the sub-basins’ DF, DS, and DI values during 2006–2010. SS3 and Suquioyo sub-basins also have higher DRI during the last quinquennial than the overall period as they have higher DF and DS during 2006–2010. At the same time, Suquioyo experienced higher DI, which was not the case for SS3. SS3 faced a more significant rise in DS during the quinquennial. SS6 fell into moderate risk during 2006–2010 due to its higher drought frequency, a sharp increase of DS, and rise of DI in the last quinquennial in comparison to the 31 years. Acelhuate has low tolerances of DF and DI, but it has a severe rise in DS. It did not experience different DRI in the assessed quinquennial because of its higher governance, infrastructure, and economic capacity that cause a stronger power of resilience. Lempa2 does not experience different DRI during 2006–2010 compared to the 31 years, although its DF, DS, and DI are high. Its vulnerability is relatively low, which prevents a higher DRI.

4.3. Strengths and Limitations

Taking resilience into account for the DRI calculation shows a more realistic vision of the risk situation because the system’s ability to cope with drought is also considered. By using geometric mean in the DRI calculation, DHI, DVI, and DREI can be better integrated because geometric mean remarks, the effects of main contributing factors and reflect an actual vision of the system’s risk.
The overall results highlight the multivariate nature of drought and the interactive impact on drought risk assessment. The influential factors considered in all the indices are combined by geometric mean that we considered a better way of integration.
Finally, in this research, drought is calculated on a monthly scale, so the effects of short dry spells that could hit crops in their most vulnerable stages (i.e., flowering stage) may not be captured in the DHI calculation. Therefore, applying the proposed approach in shorter time resolutions are recommended.

5. Conclusions

We propose a novel comprehensive method for drought risk assessment that integrates three components (1) drought hazard (DHI), (2) vulnerability (DVI) and (3) resilience (DREI) indices. This method is applied in eight sub-basins of the Lempa River basin, the longest river in Central America.
The drought index SEDI is used to calculate drought. SEDI is found to be capable of capturing agricultural and hydrological drought. SEDI-derived drought characteristics are used to compute DHI.
This research introduces an improvement of the DVI calculation by considering different weights for the seven socioeconomic and physical/ infrastructural factors that are evaluated. These weights are based on the AHP experts’ opinions approach.
Our formulation of drought risk index (DRI) considers the DREI that is calculated based on four weighted factors.
The three indices DHI, DVI, and DREI, are combined through the geometric mean to calculate the drought risk index (DRI).
The DHI obtained from the SEDI takes actual evapotranspiration into account and pictures useful results, especially for agricultural drought, which is one of the most important practices over the basin.
This research also contributes to developing a drought risk assessment methodology and the drought study in Central America. Our study focuses on the hydrological instead of the sub-basins’ political boundaries, which has rarely been taken into account before. The paper is helpful for the decision-makers in the area to have a broader vision of the basin. It can also come in handy to allocate resources more smartly or interfere immediately with Drought Risk Reduction (DRR). Results of this research are also useful for those interested in socioeconomic drought.
We foresee the application of the proposed DRI approach in different study regions in future research. Remote sensing or hydrological modeling-based drought indices are also recommended to be incorporated.
Particularly for the Lempa River basin, results show an increase in drought duration and frequency during 1980–2010. Therefore, an assessment to evaluate the future condition of the study area might be promising. Our case study is investigated at a sub-basin scale. Accordingly, applying our proposed method within higher resolution cases and fully distributed manner can be useful for specifying hotspot, more sensitive, and resistant zones when performing evaluations at national and sub-national levels.

Author Contributions

A.K.: conceptualization, methodology, investigation, validation, software, writing—original draft; G.A.C.P.: conceptualization, supervision, review; V.D.: conceptualization, writing—review and editing. All authors have read and agreed to the published version of the manuscript.

Funding

This research received no external funding.

Institutional Review Board Statement

Not applicable.

Informed Consent Statement

Not applicable.

Data Availability Statement

Data available upon reasonable request from the authors.

Conflicts of Interest

All authors have no conflict of interest to report.

References

  1. Won, J.; Choi, J.; Lee, O.; Kim, S. Copula-based Joint Drought Index using SPI and EDDI and its application to climate change. Sci. Total Environ. 2020, 744, 140701. [Google Scholar] [CrossRef]
  2. Vicente-Serrano, S.M.; Beguería, S.; López-Moreno, J.I. A Multiscalar Drought Index Sensitive to Global Warming: The Standardized Precipitation Evapotranspiration Index. J. Clim. 2010, 23, 1696–1718. [Google Scholar] [CrossRef] [Green Version]
  3. McKee, T.B.; Doesken, N.J.; Kleist, J. The relationship of drought frequency and duration to time scales. In Proceedings of the 8th Conference on Applied Climatology, Anaheim, CA, USA, 17–22 January 1993; pp. 179–183. [Google Scholar]
  4. Santos, C.A.G.; Neto, R.M.B.; Nascimento, T.V.M.D.; da Silva, R.M.; Mishra, M.; Frade, T.G. Geospatial drought severity analysis based on PERSIANN-CDR-estimated rainfall data for Odisha state in India (1983–2018). Sci. Total Environ. 2021, 750, 141258. [Google Scholar] [CrossRef] [PubMed]
  5. García-León, D.; Standardi, G.; Staccione, A. An integrated approach for the estimation of agricultural drought costs. Land Use Policy 2021, 100, 104923. [Google Scholar] [CrossRef]
  6. Gaitán, E.; Monjo, R.; Pórtoles, J.; Pino-Otín, M.R. Impact of climate change on drought in Aragon (NE Spain). Sci. Total Environ. 2020, 740, 140094. [Google Scholar] [CrossRef] [PubMed]
  7. Haldar, A.; Alam, A.; Satpati, L. Habitat, Ecology and Ekistics; Springer: Cham, Switzerland, 2021. [Google Scholar]
  8. Liu, Y.; Chen, J. Future global socioeconomic risk to droughts based on estimates of hazard, exposure, and vulnerability in a changing climate. Sci. Total Environ. 2021, 751, 142159. [Google Scholar] [CrossRef]
  9. Diaz, V.; Perez, G.A.C.; Van Lanen, H.A.; Solomatine, D.; Varouchakis, E.A. An approach to characterise spatiotemporal drought dynamics. Adv. Water Resour. 2020, 137, 103512. [Google Scholar] [CrossRef]
  10. Vicente-Serrano, S.M.; Miralles, D.G.; Domínguez-Castro, F.; Azorin-Molina, C.; El Kenawy, A.; McVicar, T.R.; Tomás-Burguera, M.; Beguería, S.; Maneta, M.; Peña-Gallardo, M. Global Assessment of the Standardized Evapotranspiration Deficit Index (SEDI) for Drought Analysis and Monitoring. J. Clim. 2018, 31, 5371–5393. [Google Scholar] [CrossRef]
  11. Shahid, S.; Behrawan, H. Drought risk assessment in the western part of Bangladesh. Nat. Hazards 2008, 46, 391–413. [Google Scholar] [CrossRef]
  12. Blauhut, V. The triple complexity of drought risk analysis and its visualisation via mapping: A review across scales and sectors. Earth Sci. Rev. 2020, 210, 103345. [Google Scholar] [CrossRef]
  13. Hagenlocher, M.; Meza, I.; Anderson, C.C.; Min, A.; Renaud, F.G.; Walz, Y.; Siebert, S.; Sebesvari, Z. Drought vulnerability and risk assessments: State of the art, persistent gaps, and research agenda. Environ. Res. Lett. 2019, 14, 083002. [Google Scholar] [CrossRef]
  14. Guo, H.; Wang, R.; Garfin, G.M.; Zhang, A.; Lin, D.; Liang, Q.; Wang, J. Rice drought risk assessment under climate change: Based on physical vulnerability a quantitative assessment method. Sci. Total Environ. 2021, 751, 141481. [Google Scholar] [CrossRef] [PubMed]
  15. Zhong, L.; Hua, L.; Yan, Z. Datasets of meteorological drought events and risks for the developing countries in Eurasia. Big Earth Data 2020, 4, 191–223. [Google Scholar] [CrossRef] [Green Version]
  16. Sena, A.; Ebi, K.L.; Freitas, C.; Corvalan, C.; Barcellos, C. Indicators to measure risk of disaster associated with drought: Implications for the health sector. PLoS ONE 2017, 12, e0181394. [Google Scholar] [CrossRef]
  17. Dabanli, I.J.N.H.; Discussions, E.S.S. Drought Risk Assessment by Using Drought Hazard and Vulnerability Indexes. Nat. Hazards Earth Syst. Sci. Discuss. 2018, 1–15. [Google Scholar] [CrossRef]
  18. Zhang, L.; Song, W.; Song, W. Assessment of Agricultural Drought Risk in the Lancang-Mekong Region, South East Asia. Int. J. Environ. Res. Public Health 2020, 17, 6153. [Google Scholar] [CrossRef]
  19. Adedeji, O.; Olusola, A.; James, G.; Shaba, H.A.; Orimoloye, I.R.; Singh, S.K.; Adelabu, S. Early warning systems development for agricultural drought assessment in Nigeria. Environ. Monit. Assess. 2020, 192, 1–21. [Google Scholar] [CrossRef]
  20. Rose, M.A.J.; Chithra, N.R. Evaluation of temporal drought variation and projection in a tropical river basin of Kerala. J. Water Clim. Chang. 2020, 11, 115–132. [Google Scholar] [CrossRef]
  21. Lin, Y.-C.; Kuo, E.-D.; Chi, W.-J. Analysis of Meteorological Drought Resilience and Risk Assessment of Groundwater Using Signal Analysis Method. Water Resour. Manag. 2021, 35, 179–197. [Google Scholar] [CrossRef]
  22. Liu, C.; Yang, C.; Yang, Q.; Wang, J. Spatiotemporal drought analysis by the standardized precipitation index (SPI) and standardized precipitation evapotranspiration index (SPEI) in Sichuan Province, China. Sci. Rep. 2021, 11, 1–14. [Google Scholar] [CrossRef]
  23. Chambers, R. Vulnerability, Coping and Policy (Editorial Introduction). IDS Bull. 2006, 37, 33–40. [Google Scholar] [CrossRef] [Green Version]
  24. Sajjad, M.; Lin, N.; Chan, J.C. Spatial heterogeneities of current and future hurricane flood risk along the U.S. Atlantic and Gulf coasts. Sci. Total Environ. 2020, 713, 136704. [Google Scholar] [CrossRef] [PubMed]
  25. Marasco, S.; Cardoni, A.; Noori, A.Z.; Kammouh, O.; Domaneschi, M.; Cimellarof, G.P. Integrated platform to assess seismic resilience at the community level. Sustain. Cities Soc. 2021, 64, 102506. [Google Scholar] [CrossRef]
  26. Sajjad, M.; Chan, J.C.; Chopra, S.S. Rethinking disaster resilience in high-density cities: Towards an urban resilience knowledge system. Sustain. Cities Soc. 2021, 102850. [Google Scholar] [CrossRef]
  27. Cutter, S.L.; Barnes, L.; Berry, M.; Burton, C.; Evans, E.; Tate, E.; Webb, J. A place-based model for understanding community resilience to natural disasters. Glob. Environ. Chang. 2008, 18, 598–606. [Google Scholar] [CrossRef]
  28. Cutter, S.L.; Ash, K.D.; Emrich, C.T. The geographies of community disaster resilience. Glob. Environ. Chang. 2014, 29, 65–77. [Google Scholar] [CrossRef]
  29. United Nations Office for Disaster Risk Reduction. Global Assessment Report (GAR) on Disaster Risk Reduction. Available online: https://gar.undrr.org/ (accessed on 29 September 2020).
  30. Hughey, E.; Morath, D.; Mielbrecht, S.; Gray, H.; Todd, B.; Stelow, C.; Fernandes, P.; Leuck, R.; Green, J. National Disaster Preparedness Baseline Assessment: El Salvador. Available online: https://www.pdc.org/wp-content/uploads/2018/06/NDPBA_ElSalvador_Final_Report_English.pdf (accessed on 6 August 2020).
  31. Armenteras, D.; Gibbes, C.; Vivacqua, C.A.; Espinosa, J.S.; Duleba, W.; Goncalves, F.; Castro, C. Interactions between Climate, Land Use and Vegetation Fire Occurrences in El Salvador. Atmosphere 2016, 7, 26. [Google Scholar] [CrossRef] [Green Version]
  32. Jennewein, J.S.; Jones, K.W. Examining ‘willingness to participate’in community-based water resource management in a transboundary conservation area in Central America. Water Policy 2016, 18, 1334–1352. [Google Scholar] [CrossRef]
  33. Hernández, W. Nacimiento y Desarrollo del río Lempa; Servicio Nacional de Estudios Territoriales (MARN/SNET): San Salvador, El Salvador, 2005. [Google Scholar]
  34. Helman, P.; Tomlinson, R. Two Centuries of Climate Change and Climate Variability, East Coast Australia. J. Mar. Sci. Eng. 2018, 6, 3. [Google Scholar] [CrossRef] [Green Version]
  35. El Salvador’s Ministry of Environment and Natural Resources (MARN). Water Resources Maps. Available online: https://web.archive.org/web/20090422151648/http://snet.gob.sv/cd2/SeccionSIG/map_hi.htm (accessed on 15 March 2019).
  36. Anticó, E.; Cot, S.; Ribó, A.; Rodríguez-Roda, I.; Fontàs, C. Survey of Heavy Metal Contamination in Water Sources in the Municipality of Torola, El Salvador, through In Situ Sorbent Extraction. Water 2017, 9, 877. [Google Scholar] [CrossRef] [Green Version]
  37. Seiber, J.; Purkey, D. WEAP—Water Evaluation and Planning System User Guide for WEAP 2015; Stockholm Environmental Institute: Boston, MA, USA, 2015. [Google Scholar]
  38. El Salvador’s Ministry of Environment and Natural Resources (MARN). Available online: https://www.marn.gob.sv/ (accessed on 19 March 2019).
  39. Oti, J.O.; Kabo-Bah, A.T.; Ofosu, E. Hydrologic response to climate change in the Densu River Basin in Ghana. Heliyon 2020, 6, e04722. [Google Scholar] [CrossRef] [PubMed]
  40. Khoshnazar, A.; Nasrabadi, T.; Abbasi Maedeh, P. Evaluating the efficiency of artificial neural network in prediction of Electrical conductivity of Zarrinehroud River. Human Environ. 2012, 10, 1–16. [Google Scholar]
  41. Sajjad, M.; Chan, J.C.; Lin, N. Incorporating natural habitats into coastal risk assessment frameworks. Environ. Sci. Policy 2020, 106, 99–110. [Google Scholar] [CrossRef]
  42. MacKenzie, C.A. Summarizing Risk Using Risk Measures and Risk Indices. Risk Anal. 2014, 34, 2143–2162. [Google Scholar] [CrossRef] [PubMed] [Green Version]
  43. Commission, J.R.C.-E. Handbook on Constructing Composite Indicators: Methodology and User Guide; OECD Publishing: Paris, France, 2008. [Google Scholar]
  44. Waldinger, M.D.; Zwinderman, A.H.; Olivier, B.; Schweitzer, D.H. Geometric Mean IELT and Premature Ejaculation: Appropriate Statistics to Avoid Overestimation of Treatment Efficacy. J. Sex. Med. 2008, 5, 492–499. [Google Scholar] [CrossRef]
  45. Abyani, M.; Asgarian, B.; Zarrin, M. Sample geometric mean versus sample median in closed form framework of seismic reliability evaluation: A case study comparison. Earthq. Eng. Eng. Vib. 2019, 18, 187–201. [Google Scholar] [CrossRef]
  46. Khalifeh, S.; Khoshnazar, A. Evaluation of Water Quality in Zarrinehrood River Using the Standard Quality Index of Iran’s Surface Water Resources. Water Wastewater Sci. Eng. 2018, 3, 22–34. [Google Scholar]
  47. Shukla, S.; Wood, A.W. Use of a standardized runoff index for characterizing hydrologic drought. Geophys. Res. Lett. 2008, 35, L02405. [Google Scholar] [CrossRef] [Green Version]
  48. Zhang, X.; Li, M.; Ma, Z.; Yang, Q.; Lv, M.; Clark, R. Assessment of an Evapotranspiration Deficit Drought Index in Relation to Impacts on Ecosystems. Adv. Atmos. Sci. 2019, 36, 1273–1287. [Google Scholar] [CrossRef]
  49. Li, J.; Wang, Z.; Lai, C. Severe drought events inducing large decrease of net primary productivity in mainland China during 1982–2015. Sci. Total Environ. 2020, 703, 135541. [Google Scholar] [CrossRef] [PubMed]
  50. Veettil, A.V.; Mishra, A.K. Multiscale hydrological drought analysis: Role of climate, catchment and morphological variables and associated thresholds. J. Hydrol. 2020, 582, 124533. [Google Scholar] [CrossRef]
  51. Brito, S.S.B.; Cunha, A.P.M.A.; Cunningham, C.C.; Alvalá, R.C.; Marengo, J.A.; Carvalho, M.A. Frequency, duration and severity of drought in the Semiarid Northeast Brazil region. Int. J. Clim. 2018, 38, 517–529. [Google Scholar] [CrossRef]
  52. Oikonomou, P.D.; Karavitis, C.A.; Tsesmelis, D.E.; Kolokytha, E.; Maia, R. Drought Characteristics Assessment in Europe over the Past 50 Years. Water Resour. Manag. 2020, 34, 4757–4772. [Google Scholar] [CrossRef]
  53. Yevjevich, V.M. An Objective Approach to Definitions and Investigations of Continental Hydrologic Droughts. Ph.D. Dissertation, Colorado State University, Fort Collins, CO, USA, 1967. [Google Scholar]
  54. Kim, D.; Rhee, J. A drought index based on actual evapotranspiration from the Bouchet hypothesis. Geophys. Res. Lett. 2016, 43, 10–277. [Google Scholar] [CrossRef]
  55. Mercado, V.D.; Perez, G.C.; Solomatine, D.; Van Lanen, H.A. Spatio-temporal Analysis of Hydrological Drought at Catchment Scale Using a Spatially-distributed Hydrological Model. Procedia Eng. 2016, 154, 738–744. [Google Scholar] [CrossRef] [Green Version]
  56. Vicente-Serrano, S.M.; López-Moreno, J.I.; Beguería, S.; Lorenzo-Lacruz, J.; Azorin-Molina, C.; Morán-Tejeda, E. Accurate Computation of a Streamflow Drought Index. J. Hydrol. Eng. 2012, 17, 318–332. [Google Scholar] [CrossRef] [Green Version]
  57. Le Cozannet, G.; Nicholls, R.J.; Hinkel, J.; Sweet, W.V.; McInnes, K.L.; Van De Wal, R.S.W.; Slangen, A.B.A.; Lowe, J.A.; White, K.D. Sea Level Change and Coastal Climate Services: The Way Forward. J. Mar. Sci. Eng. 2017, 5, 49. [Google Scholar] [CrossRef] [Green Version]
  58. Vaughan, M. The Story of an African Famine: Gender and Famine in Twentieth-Century Malawi; Cambridge University Press: Cambridge, UK, 1987. [Google Scholar]
  59. Yodmani, S. Disaster Risk Management and Vulnerability Reduction: Protecting the Poor. In Proceedings of the Social Protection Workshop 6: Protecting Communities—Social Funds and Disaster Management, the Asian Development Bank, Manila, Philippines, 5–9 February 2001. [Google Scholar]
  60. Zhu, X.; Hou, C.; Xu, K.; Liu, Y. Establishment of agricultural drought loss models: A comparison of statistical methods. Ecol. Indic. 2020, 112, 106084. [Google Scholar] [CrossRef]
  61. Zachariah, M.; Mondal, A.; Das, M.; AchutaRao, K.M.; Ghosh, S. On the role of rainfall deficits and cropping choices in loss of agricultural yield in Marathwada, India. Environ. Res. Lett. 2020, 15, 094029. [Google Scholar] [CrossRef]
  62. El Salvador’s Department of Statistics and Census. Available online: https://www.digestyc.gob.sv/ (accessed on 20 June 2020).
  63. National Institute of Statistics Guatemala. Available online: https://www.ine.gob.gt/ine/ (accessed on 27 July 2020).
  64. Honduras’s National Institute of Statistics. Available online: https://www.ine.gob.hn/V3/ (accessed on 18 August 2020).
  65. The World Bank Group. Available online: https://www.worldbank.org/en/search?q=data&currentTab=1&label=2473192505 (accessed on 9 January 2021).
  66. Assessment of Water Holding Capacity of Soils Map. Available online: https://www.nrcs.usda.gov/wps/portal/nrcs/detail/soils/use/worldsoils/?cid=nrcs142p2_054022 (accessed on 26 January 2021).
  67. Saaty, T.L. How to make a decision: The analytic hierarchy process. Eur. J. Oper. Res. 1990, 48, 9–26. [Google Scholar] [CrossRef]
  68. Pacific Disaster Center. Available online: https://www.pdc.org/ (accessed on 14 January 2021).
  69. Cutter, S.L.; Burton, C.G.; Emrich, C.T. Disaster Resilience Indicators for Benchmarking Baseline Conditions. J. Homel. Secur. Emerg. Manag. 2010, 7, 1–24. [Google Scholar] [CrossRef]
  70. Vicente-Serrano, S.M. Differences in Spatial Patterns of Drought on Different Time Scales: An Analysis of the Iberian Peninsula. Water Resour. Manag. 2006, 20, 37–60. [Google Scholar] [CrossRef]
  71. Golden Gate Weather Services. El Niño and La Niña Years and Intensities Based on Oceanic Niño Index (ONI). Available online: https://ggweather.com/enso/oni.htm (accessed on 22 February 2021).
  72. Karim, M.R.; Rahman, M.A. Drought risk management for increased cereal production in Asian least developed countries. Weather Clim. Extrem. 2015, 7, 24–35. [Google Scholar] [CrossRef] [Green Version]
  73. Lewis, J.E.; Rowland, J.; Nadeau, A. Estimating maize production in Kenya using NDVI: Some statistical considerations. Int. J. Remote Sens. 1998, 19, 2609–2617. [Google Scholar] [CrossRef]
  74. The World Bank Group. Cereal Production (Metric Tons)—El Salvador. Available online: https://data.worldbank.org/indicator/AG.PRD.CREL.MT?locations=SV (accessed on 19 February 2021).
  75. The World Bank Group. Indicators. Available online: https://data.worldbank.org/indicator (accessed on 20 February 2021).
Figure 1. Lempa River basin and its eight sub-basins elevation map.
Jmse 09 00386 g001
Figure 2. Scheme of the methodology for calculating Drought Risk Index (DRI).
Jmse 09 00386 g002
Figure 3. Time series of SEDI for 6-month aggregation period (1980–2010) in Lempa River basin: (a) Acelhuate sub-basin; (b) Guajillo sub-basin; (c) Lempa1 sub-basin; (d) Lempa2 sub-basin; (e) Lempa3 sub-basin; (f) SS3 sub-basin; (g) SS6 sub-basin; and (h) Suquioyo sub-basin.
Jmse 09 00386 g003
Figure 4. Droughts calculated with SEDI06 (1980–2010): (a) Acelhuate sub-basin; (b) Guajillo sub-basin; (c) Lempa1 sub-basin; (d) Lempa2 sub-basin; (e) Lempa3 sub-basin; (f) SS3 sub-basin; (g) SS6 sub-basin; (h) Suquioyo sub-basin.
Jmse 09 00386 g004
Figure 5. Drought Frequency (DF) maps based on SEDI06 in eight sub-basins of Lempa River basin. Considering six quinquennials, and the overall period: (a) 1981 to 1985; (b) 1986 to 1990; (c) 1991 to 1995; (d) 1996 to 2000; (e) 2001 to 2005; (f) 2006 to 2010; (g) 1980 to 2010 (31 years).
Jmse 09 00386 g005
Figure 6. Drought Severity (DS) maps based on SEDI06 in eight sub-basins of Lempa River basin. Considering six quinquennials, and the overall period: (a) 1981 to 1985; (b) 1986 to 1990; (c) 1991 to 1995; (d) 1996 to 2000; (e) 2001 to 2005; (f) 2006 to 2010; (g) 1980 to 2010 (31 years).
Jmse 09 00386 g006
Figure 7. Drought Intensity (DI) maps based on SEDI06 in eight sub-basins of Lempa River basin. Considering six quinquennials, and the overall period: (a) 1981 to 1985; (b) 1986 to 1990; (c) 1991 to 1995; (d) 1996 to 2000; (e) 2001 to 2005; (f) 2006 to 2010; (g) 1980 to 2010 (31 years).
Jmse 09 00386 g007
Figure 8. Time series of percentage of drought area based on SEDI06 in Lempa River basin from 1980–2010.
Jmse 09 00386 g008
Figure 9. Spatial variation of drought hazard index (DHI) in eight sub-basins of Lempa River basin based on SEDI06.
Jmse 09 00386 g009
Figure 10. Spatial variation of drought vulnerability index (DVI) in eight sub-basins of Lempa River basin based on SEDI06.
Jmse 09 00386 g010
Figure 11. Spatial variation of drought resilience index (DREI) in eight sub-basins of Lempa River basin based on SEDI06.
Jmse 09 00386 g011
Figure 12. Spatial variation of drought risk index (DRI) in eight sub-basins of Lempa River basin based on SEDI06 (1980–2010).
Jmse 09 00386 g012
Figure 13. Spatial variation of drought risk index (DRI) in eight sub-basins of Lempa River basin based on SEDI06 (2006–2010).
Jmse 09 00386 g013
Figure 14. Oceanic Nino Index (ONI) for the period 1980–2010 (31 years). Adapted from [71].
Jmse 09 00386 g014
Figure 15. Cereal production (million metric tons) and crop production index in El Salvador for the period 1980–2010 (31 years). Data from [74].
Jmse 09 00386 g015
Table 1. Categorization of DRI, DHI, DVI and DREI.
DRI, DHI, DVI, and DREI ValuesDRI, DHI, and DVI CategoryDREI Category
0 to 0.15Very LowVery High
0.15 to 0.29LowHigh
0.29 to 0.43Relatively LowRelatively High
0.43 to 0.57ModerateModerate
0.57 to 0.71Relatively HighRelatively Low
0.71 to 0.85HighLow
0.85 to 1Very HighVery Low
Table 2. Weight (Dw) and rating (Dr) for each drought category and probability of occurrence.
Drought Index Value CategoryWeight (Dw)Occurrence Probability Rating (Dr)
≤−0.8Extreme
(E)
4Very high4
High3
Low2
Very low1
−0.8 to −0.63Severe
(S)
3Very high4
High3
Low2
Very low1
−0.63 to −0.42Moderate
(M)
2Very high4
High3
Low2
Very low1
−0.42 to 0Low
(L)
1Very high4
High3
Low2
Very low1
Publisher’s Note: MDPI stays neutral with regard to jurisdictional claims in published maps and institutional affiliations.

