Article

Assessment of Water Quality and Phytoplankton Structure of Eight Alexandria Beaches, Southeastern Mediterranean Sea, Egypt

1
National Institute of Oceanography and Fisheries (NIOF), Cairo 11516, Egypt
2
Animal and Fish Production Department, College of Agricultural and Food Sciences, King Faisal University, P.O. Box 420, Al Hofuf 31982, Saudi Arabia
3
Fish and Animal Production Department, Faculty of Agriculture (Saba Basha), Alexandria University, Alexandria 21531, Egypt
4
Department of Biology, College of Science, Taif University, P.O. Box 11099, Taif 21944, Saudi Arabia
5
Department of Biotechnology, College of Science, Taif University, P.O. Box 11099, Taif 21944, Saudi Arabia
*
Authors to whom correspondence should be addressed.
J. Mar. Sci. Eng. 2021, 9(12), 1328; https://doi.org/10.3390/jmse9121328
Submission received: 12 October 2021 / Revised: 21 November 2021 / Accepted: 23 November 2021 / Published: 24 November 2021
(This article belongs to the Special Issue Coastal Lagoon Ecology)

Abstract

:
This study aims to investigate the abundance, community, and structure of phytoplankton, physicochemical parameters, and some eutrophication state indices, to estimate the water quality of eight selected beaches along the Alexandria Coast, in the southeast of the Mediterranean Sea. The samples were collected monthly from 2019 to 2020. Nutrient values ranged from 1.54 to 33.21 µM for nitrate, 0.01 to 1.98 µM for nitrite, 0.12 to 9.45 µM for ammonia, 0.01 to 1.54 µM for phosphate, and 0.67 to 29.53 µM for silicate. Phytoplankton biomass was characterized by chlorophyll-a concentration, which fluctuated between 0.12 and 12.31 µg L−1. The annual phytoplankton average was 63.85 ± 17.83 × 10³ cells L−1. Phytoplankton was highly diversified (228 taxa), and the most diversified group was diatoms (136 taxa), followed by a remarkably low number of Dinophyta (36 taxa). Diatoms reached maximum abundance in December. Meanwhile, a dense bloom of microalga Chlorella marina occurred in June on some beaches. High temperature, high dissolved inorganic nitrogen, and less-saline waters have supported green algal proliferation. The Shannon–Wiener diversity index (H’) showed that there was a qualitative seasonal difference in the composition of the phytoplankton community. Waters of beaches 1–3 were classified as between clean and moderately polluted; and beaches 4–8 varied between moderately and heavily polluted. The study revealed that human activities might have triggered the algal bloom and may be responsible for alterations in the Alexandria coast ecosystem.

1. Introduction

The eastern Mediterranean Sea is one of the world’s most oligotrophic aquatic areas [1]. This pattern may have changed in recent years due to human activities, leading to unfavorable hydrochemical and hydrographic changes. The tourism industry has a huge impact on the economies, communities, and ecology of coastal areas, where the majority of the associated services are located [2]. The coastal zone of Egypt suffers from a number of serious problems, including a high rate of population growth, excessive erosion rates, saltwater intrusion, and lack of appropriate institutional management systems [3]. The succession, abundance and seasonal variations of phytoplankton are related to a variety of environmental factors in aquatic environments [4,5].
Previous studies on the biotic and abiotic status of Alexandria’s coastal water were focused on hotspots, including harbors and semiclosed areas, which usually show higher nutrient concentrations (>15 µM phosphate, >50 µM dissolved inorganic nitrogen, >70 µM silicate) and dense blooms of harmful algae such as Alexandrium minutum Halim, Prorocentrum triestinum J. Schiller, Skeletonema costatum (Grev.) Cleve and Eutreptiella sp. [6,7,8,9,10,11]. Many studies have reported the occurrence of blooms along the Alexandria coast, which were sometimes caused by green algae, such as in Marabella village, in which Carteria sp. reached 2.7 × 10⁶ cells L−1 [12] or by the singular euglenoid Eutreptiella, which reached 17 × 106 cells L−1 on the Western Harbor [10]. Eutrophication is caused by an increase in nutrients in aquatic environments, mainly nitrogen and phosphorus, which results in increased photosynthesis and organic matter accumulation [4].
Water quality monitoring is the initial step toward the management and conservation of aquatic environments. Temperature, pH, salinity, dissolved oxygen, biological oxygen demand, chemical oxygen demand, nutrients, reactive phosphate, heavy metal pollution, and other chemical and physical elements, all have an impact on the marine environment, as well as affecting aquatic species’ immigration, abundance, chemical structure, immunity, survival, and growth [13,14,15,16,17]. The abundance, communities, and biodiversity, as well as chemical and biochemical structure of phytoplanktonic cells, are among the most important issues affected by water quality [3,6,7,8,9,18,19]. Low hydrologic flow, municipal discharges, wastewater effluents, and other human activities could all contribute to poor water quality. In addition, for recognizing the health status of the ecosystems, Shannon–Wiener diversity (H’) is used to assess biodiversity [5]. Additionally, water quality indices (WQI) are important tools that can provide insight into the health of ecosystems [4,20,21,22]. Furthermore, eutrophication can cause negative effects among virtually all biological species and their interactions within a water body [15]. The rate of this process is extremely slow under natural conditions—over hundreds of thousands of years. Phytoplankton are the main food source for zooplankton, which are considered a bridge between primary production and higher trophic levels [23,24,25,26,27,28,29], and are also very important in monitoring water quality and pollution [30,31,32].
Until now, studies on the biotic and abiotic parameters of the different Alexandria beaches have not provided a clear evaluation of this environment. Therefore, this work aims to assess water quality at Alexandria beaches by studying phytoplankton communities and their relationships with physicochemical parameters, and to assess Shannon index of diversity, Pielou’s evenness index, and WQI to provide information about the human impacts on this coastal ecosystem, with the aim of providing a better understanding of the issue to those who seek to make coastal management decisions.

2. Materials and Methods
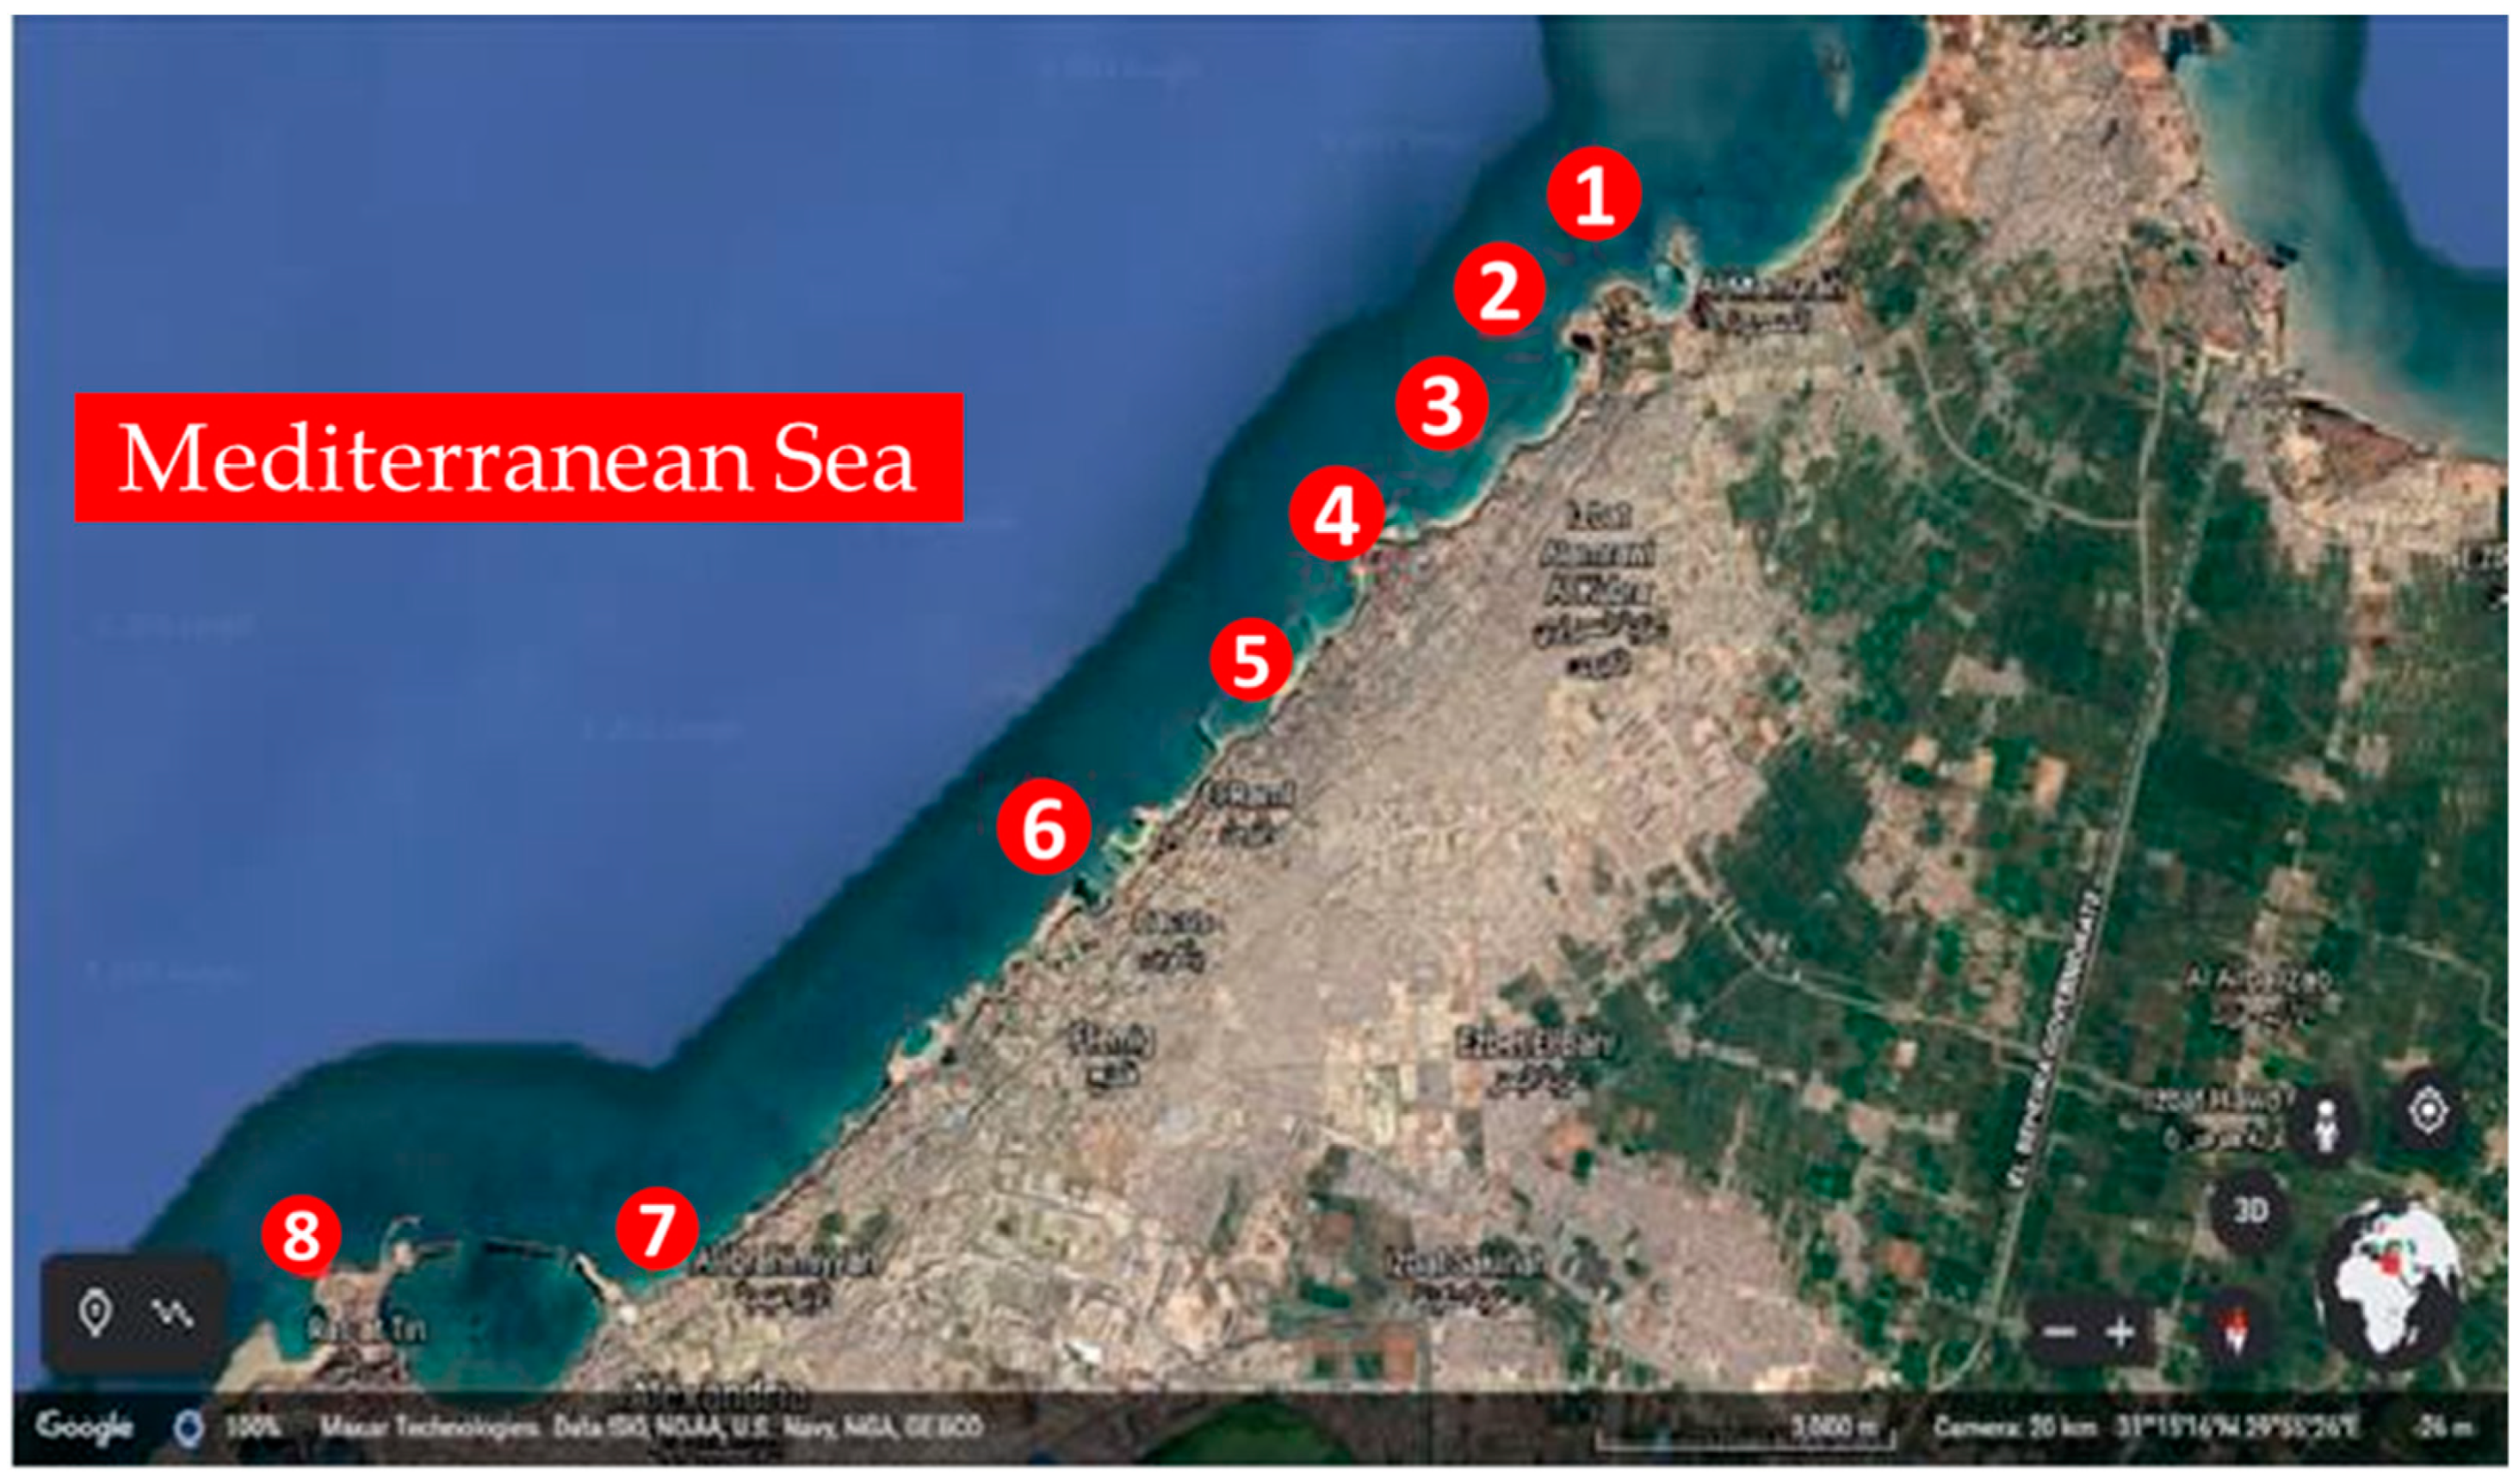
2.1. Study Area

Alexandria lies on the southeast of the Mediterranean Sea, Egypt, between longitude (29°55′ and 30°04′ E) and latitude (31°13′ and 31°19′ N) (Table 1). The Alexandria coast contains more than 35 beaches, which are about 24 km long in total. Two decades ago, the discharge of drainage water into the Alexandria beaches was stopped, and the main source of beach pollution became the activity of vacationers, especially during summer and autumn. Alexandria’s beaches have various statuses; tourist beaches, recommended beaches, and free beaches. Because the tourist beaches are expensive, the impact on the public beaches has been greater and denser. The chosen study beaches are public, cheap or free, and so are crowded with visitors during summer and autumn. The beaches extend for about 18 km with a maximum depth of 10 m. These beaches are El-Montaza (1), El-Mandra (2), El-Asafra (3), Miamy (4), Sidi Bisher (5), Al-saraya (6), El-Shatby (7) and El-Anfoshy (8), and each beach was represented by one station. El-Shatby and El-Anfoshy are the most crowded beaches.

2.2. Sampling and Laboratory Analysis

A Ruttner sampler was used to collect a total of 96 samples monthly from eight coastal sites, from March 2019 to February 2020 (Table 1 and Figure 1). Two samples were gathered from each beach (1 m depth): one for chemical analysis and the other for phytoplankton count. The temperature of the water was measured in the field by a thermometer graduated to 0.1 °C, and the pH was determined in situ by a portable digital pH meter. In addition, water salinity was measured by a Beckman salinometer (Model NO.R.S. 10) and expressed as ppt. Dissolved oxygen (DO), dissolved inorganic nitrogen (DIN), nitrite (NO3), nitrate (NO2), ammonia (NH4), reactive silicate (RS), as well as soluble reactive phosphorus (SRP), were measured in accordance with standard methods described in APHA [32]. The samples for qualitative and quantitative analyses of phytoplankton were immediately fixed with formaldehyde at 4% for laboratory examination. After full sedimentation, the topwater was carefully siphoned off without disturbing the sample. Phytoplankton were identified and counted by 2 mL of settling chambers, using a Nikon TS 100 inverted microscope at 400× magnification by Utermohl [33] technique. The density of phytoplankton was calculated as the number of cells per liter. The chlorophyll-a was estimated based on the method described by Parsons [33].

2.3. Water Quality Index (WQI)

The WQI is a statistic that reduces many measured parameters into a single value that indicates water quality [34,35]. Seven parameters were chosen for the WQI: pH, DO, nitrite-N, nitrate-N, ammonium, SRP, and RS. Each water quality parameter used in the WQI calculation was multiplied by a weighting factor, the summation of which characterizes water quality as good, medium, bad, or very bad. The quality rating (qi) for the water quality factor was performed [36] as follows:
q i = 100 × [ Vi Si ]
where Si is the standard of the stream water quality, and Vi is the observed data of the factor at a known sampling site according to all parameters. The equation confirms that qi = 100 if the presented data are impartial and equal to its standard data. Therefore, the larger data of qi revealed polluted water.
To compute the WQI [34,35], the quality rating qi corresponding to the factor can be determined using Equation (2):
WQI = Σ q i
where the parameter i for the variable q should take values from 1 to n.
The average water quality index (AWQI) for n factors was computed using the following Equation (3):
AWQI = q i / n
where n = number of factors. AWQI was categorized into four classes: good (0.0–100), medium (100–150), bad (150–200), and very bad (over 200) [37].

2.4. Species Diversity Index

Species diversity index (Shannon index of diversity; H′) was assessed according to Shannon [38] as follows:
H = i = 1 n Pi   Ln   Pi
where Pi shows significance probability for all species (n/N is the proportion of i, expressed as nets.
Wilhm and Dorris [39] proposed the following relationship between diversity index (D’) and pollution status: >3 clean waters, 1–3 moderately polluted, <1 heavily polluted. However, Staub et al. [40] proposed another scale of pollution which was different: (3.5–4.5) slight pollution, (2.0–3.0) light pollution, (1.0–2.0) and moderate pollution, (0.0–1.0) heavy pollution.

2.5. Pielou’s Evenness Index (J)

For calculating the evenness of species, the Pielou’s Evenness Index (J) was used as per a previous study [38].
J = H / In   S
where: H’ = Shannon–Wiener diversity index; S = total number of species in the sample.

2.6. Statistical Analysis

The Spearman rank correlation coefficient (r) was used to estimate the relationships between phytoplankton abundances (n = 96) and environmental variables by using the SPSS (8.0) Statistical Package Program.

3. Results

3.1. Physicochemical Conditions

The monthly average hydrographic factors of the various beaches from March 2019 to February 2020 are presented in Table 2. Water temperature fluctuated between 18.6 and 19.9 °C in winter and between 26.6 and 27.3 °C in summer. Salinities showed high oscillations with a maximum of 38.8 ppt in October (beach 1) and a minimum of 27.5 ppt in May (beach 8); with an annual average of 35.43 ppt. pH values were alkaline and remained comparatively stable throughout the study period. pH varied by 1.28 units among all beaches. The minimum pH value (7.26) was recorded in May (beach 6), while the highest (8.54) was in June (beach 4). The concentration of dissolved oxygen varied from 4.12 mg L−1 (49.9% saturation) in May to 7.50 mg L−1 (97.5% saturation) in April and June. DIN values were significantly higher on beaches 6, 7, and 8 (>10 µM), in which nitrate was the highest source of inorganic nitrogen compounds. In addition, the lowest and highest values (1.54 and 33.21 µM) were observed in beach 2 (May) and beach 6 (December), respectively. The nitrite concentration was typically low and ranged between 0.01 and 1.98 µM. Furthermore, ammonia varied significantly during the sampling stage from 0.04 to 9.45 µM. The SRP was typically low, ranging between 0.01 and 1.54 µM. The lowest average values of SRP were 0.09 and 0.02 µM, which occurred at beaches 1 and 2, respectively. On the other hand, the highest values (0.20–0.42 µM) were observed at beaches 5 and 7, respectively. Silicate values were generally high, with the highest values at beach 1 (29.53 µM) in December, while the lowest was 0.67 µM recorded in June at beach 4. Moreover, ratios of DIN:SRP were much higher than the Redfield ratio (N:P = 16) for most of the year but were lower than the Redfield ratio in the summer months at beaches 4–8. The WQI fluctuated from 64 to 93. Therefore, water quality can be classified as varying from medium to excellent among all beach sites.

3.2. Phytoplankton Community Structure and Composition

A total of 228 phytoplankton species were recorded in the different beaches. Bacillariophyceae (diatoms) was reported to have the highest richness index (53 genera, 136 species), followed with less extent by Dinoflagellates (Dinophyta) (17 genera, 36 species). Chlorophyceae, Cyanophyceae, and Euglenophyta were characterized by 28, 19, and 6 species, respectively. Rhodophyta, Raphidophyceae, and Dictyochophyceae were characterized by having one species each (Table 3).
The total number of species found on the studied beaches demonstrated a slight variation. Beaches 1 and 2 harbored 135–138 species, followed by 129 species recorded at beach 7. Similar numbers of species (122–123 species) were documented at beaches 3 and 4, although an obviously small number (113–116 species) was found at beaches 5, 6 and 8. The most diverse were pennate and centric diatoms, with 72 and 64 species, respectively. Among the centric diatoms, the richest genera were Biddulphia (7 species), Chaetoceros (5 species), and Rhizosolenia (5 species). For pennate diatoms, the Nitzschia group was represented by 19 species (16 species of the genus Nitzschia and three species of the morphologically close genera Pseudo-nitzschia. The genus Amphora was represented by seven species. Of the 36 species of dinoflagellates, the richest genus was Protoperidinium, with 7 species, and 4 species for each of Prorocentrum and Dinophysis. The most-dominant species and their percentage contributions to the total phytoplankton density at the various beaches are shown in Table 4. Phytoplankton abundance ranged from 1.37 × 10³ to 1578 × 103 cells L−1 (63.85 ± 17.83 × 10³ cells L−1 on average) and biomass characterized by chlorophyll-a concentration ranged from 0.12 to 12.31 µg L−1 (2.476 ± 1.820 µg L−1 on average). Many species (70) were infrequent, with a relative abundance of <2.00% in all samples, but they were important as they controlled phytoplankton diversity. The lowest diversity (H′) was 0.151 recorded in June (beach 7) and the highest was 3.439 in January (beach 1). Species evenness (J) fluctuated between 0.055 in June (beach 7) and 0.933 in August (beach 1), with relatively higher values mostly recorded throughout winter, indicating the disappearance of species dominance at this period.
The correlation between phytoplankton species diversity index and abundance was not significant but include r and p values of −0.018 and 0.863, respectively. Testing the diversity equitability suggested that diversity had a strong relationship with equitability (r = 0.945, p < 0.001).

3.3. Seasonal Variation of Phytoplankton

Regarding temporal variation, diatoms registered the highest counts in most beaches during spring, autumn, and winter, and reached their maximum relative abundances in beach 3 (75.92%), beach 1 (65.35%), beach 2 (63.10%). Chlorophyta was dominant during summer (June) and reached 97% at beach 7. Dinophyta displayed the highest abundance in late summer and early autumn (beaches 4, 5, and 6). Euglenophyta reached its highest abundance in April (48.87%) at beach 8. In contrast, Cyanophyceae, Rhodophyta, Raphidophyceae, and Silicoflagellates never dominated in the algal community, accounting for a mean abundance percentage of 0.7%. The lowest phytoplankton abundance was recorded in spring (Figure 2) with a mean of 30.14 × 10³ ± 19.08 × 10³ cells L−1 and ranged between 15.19 × 10³ cells L−1 in beach 5 and 70.20 × 10³ cells L−1 in beach 4. Spatial fluctuation varied widely regarding the phytoplankton densities and dominant species. Additionally, Bacillariophyta was the dominant division at all sampling stations except in beaches 7 and 8 in March and April in beach 8, and sharing abundance with Dinophyta in March (beach 1). Cyclotella kützingiana Thwaites, Pseudo-nitzschia delicatissima (Cleve) Heiden, and Skeletonema costatum (Greville) Cleve formed the bulk of the diatom’s abundance. Dinophyta was dominant in April (beaches 7 and 8) and May (beach 8). Prorocentrum triestinum J. Schiller and Karenia mikimotoi (Miyake and Kominami ex Oda) Gert Hansen and Ø. Moestrup were the most dominant forms. In addition, the contribution of Euglenophyta to the whole abundance in April was 48.9% at beach 8. The development of Cyanophyta reached 21.9% in March (beach 7). Eutreptiella spp. from Euglenophyta and Oscillatoria simplicissima Gomont from Cyanophyta appeared clearly.
However, in the summer season, the mean cell of abundance was 148.21 × 10³ ± 175.61 × 10³ cells L−1. Additionally, the total average of phytoplankton varied between 7.95 × 10³ cells L−1 in beach 1 and 532.02 × 10³ cells L−1 (beach 7). Additionally, spatial fluctuation varied extensively in density as well as the dominant species. In June, except for beaches 1–3, Chlorophyta was the dominant division, and a green algal bloom of Chlorella marina (Butcher) reached an extreme concentration of 1.54 × 10⁶ cells L−1 at beach 7. The blooming covered beaches 4 and 8. The community began recovering during July (diatoms reached 44.18%) and in August, Dinophyta reached 67.34%. Dinophyta was the second most significant division on beach 2, in which Prorocentrum lima Cienkowski was the dominant form. Pseudonitzschia delicatissima was dominant at beaches 1, 2, and 3.
During the autumn season, the average phytoplankton abundance was 33.93 × 10³ ± 16.01 × 10³ cells L−1. The total average phytoplankton abundance varied between 15.73 × 10³ cells L−1 at beach 3 and 66.12 × 10³ cells L−1 at beach 7. Diatoms achieved the highest percentage, varying between 53.16% at beach 3 and 81.42% at beach 7. Pseudonitzschia delicatissima was the dominant species at all beaches during September, Skeletonema costatum (beaches 3, 4, 6, and 8) during October, Cyclotella comta (Ehrenberg) Kützing (beach 2) during September, and Navicula tripunctata (beach 1) formed the bulk of the phytoplankton abundance during November. Dinophyta was second in dominance during September at most beaches, forming 31% of the total abundance, whereas the dominant species were Prorocentrum triestinum (beach 1), Akashiwo sanguinea K.Hirasaka (beach 2), Protoperidinium conicum (Gran) Balech (beach 4), Protoperidinium cerasus (Paulsen) Balech (beaches 5 and 6) and Protoperidinium pellucidum Bergh (beach 7).
Nevertheless, during the winter season, the total phytoplankton abundance varied between 17.07 × 10³ cells L−1 (beach 1) and 67.59 × 10³ cells L−1 (beach 3) with a seasonal average of 43.13 × 10³ ± 16.33 × 10³ cells L−1. The community represented mainly by diatoms reached 93% in December, corresponding to Pseudo-nitzschia delicatissima and Leptocylindrus danicus (beaches 3, 5, 6, and 8). S. costatum was dominant from December-January (beaches 3–8) and Thalassiosira decipiens (Grunow) E.G. Jørgensen was dominant during January at beaches 3, 4, and 5. Gonyaulax polygramma Stein from Dinophyta showed a considerable number during February at beach 6.

3.4. Correlation Analysis between Biotic and Abiotic Variables

Phytoplankton, in terms of abundance and biomass and the selected taxonomical groups, were not significant with any of the environmental variables. A strongly negative significant correlation (p < 0.001) existed between the WQI and SRP (r = −0.819), ammonia (r = −0.721), pH (r = −0.492), and temperature (r = −0.450), and a significant positive correlation existed between WQI and silicate (r = 0.241). Temperature was associated with ammonia (r = 0.597) and phosphate (r = 0.462) and showed a negative correlation with silicate (r = −0.387). Moreover, Shannon’s index of diversity (H’) values were mostly augmented as the numeral of species (S) (r = 0.504, p < 0.001), and showed a positive correlation with salinity values (r = 0.265, p < 0.05). In general, species numbers increased in parallel to increasing phytoplankton density (r = 0.358, p < 0.001).

4. Discussion

Following the implementation of wastewater treatment over the last two decades and the cessation of sewage discharge into Alexandria’s coastal waters, the main source of pollution affecting the studied public beaches is human activities resulting from the high volume of visitors from late spring to early autumn. Despite the relatively small geographic area of the studied coast of Alexandria’s waters extending for about 18 km, it showed a distinct change in the abiotic and biotic conditions from one beach to another. All oxygen values of the sampled beaches fell below the limit of 10 mg L−1. These low values can be attributed to the degradation of organic materials resulting from human activities [41,42,43,44].
Nutrient concentrations were relatively lower than the average values in touristic villages and Matrouh beaches west of the Alexandria coast [12,41]. In the current study, phosphate, silicate, nitrate, nitrite and ammonia concentrations, flocculated in the ranges 0.01–1.54, 0.67–29.53, 1.54–33.21, 0.01–1.98, and 0.04–9.45, respectively, whereas in Matrouh beaches, the concentrations different in the ranges 0.01–7.30, 0.20–4.79, 0.13–5.10, 0.01–0.30, and 0.18–16.83 µM, respectively [41], and in the touristic village Marakia in the west of Alexandria, the concentrations were fluctuated between 0.00–2.50, 0.11–3.08, 0.10–4.01, 0.00–0.30, and 0.14–24.25 µM, respectively [41] (Table 5).
On the other hand, Dango et al. [42] studied the Chlorophyll-a and nutrient salts in the surface water along the Alexandria coast, and found that pH ranged between 7.53 and 8.12, salinity between 35.34 and 38.28 ppt, dissolved oxygen between 4.77 and 11.13 mg L−1, and the averages of nitrate, nitrite, ammonia, phosphate, and silicate were 7.97 ± 1.72, 0.66 ± 0.14, 2.18 ± 0.73, 0.37 ± 0.09, 12.42 ± 4.04 µM, respectively, and Chl-a ranged between 0.38 and 6.96 µg L−1. Nitrate values were usually below the WHO recommended concentration of 50 mg L−1. High concentrations of ammonia recorded during the summer and autumn, in particular at beaches 7 and 8 (range: 2.87 and 9.45 µM), means the two beaches suffered from some pollution. In the existence of high ammonium concentrations, the phytoplankton productivity could be high or even higher if the cells are using NH4+ rather than NO3 [45,46].
Sewage from human activities is rich in these nutrients and may be responsible for the high levels of the nutrients. Oczkowski and Nioxn [47] mentioned that 4 μM of nitrate and 2 μM of ammonium are the criteria of eutrophication. On the other hand, Seroka [48], James and Adejare [49] illustrated that a nitrate value less than 0.5 mg L−1 can still be indicative of unpolluted waters. The nitrite values recorded are common to unpolluted water; they ranged between 0.01 and 1.98 µM with an average of 0.48 µM. In addition, silicate concentrations were generally high throughout the different beaches (with average 13.95 µM), with a strong increase in December when levels reached 29.53 µM on beach 1. High concentrations of silicate may lead to the prevalence of diatoms (63–76%) especially pennate forms.
Phosphorus is generally considered a limiting nutrient for the growth of phytoplankton, and excess values can lead to eutrophication. The increased values of phosphate during summer (average of 0.52 µM) are attributed to human activities. The optimal N:P ratio for the growth of phytoplankton is known as the Redfield ratio and is equal to 16:1 [50]. In the eastern region of the Mediterranean Sea, phosphate and nitrate levels are the limiting nutrients [51,52]. Except for sporadic ratios in Alexandria beaches during the summer and the late winter, the N:P ratios were much greater than the Redfield relationship, suggesting a high nitrogen budget, meaning phosphorus was exerting a limiting influence all year.
Chl-a values ranged from 0.10 µg L−1 in March (beach 1), and 12.31 µg L−1 in January (beach 4) with an annual average of 2.81 µg L−1. Chl-a concentration was relatively high during the summer and autumn at beaches 7 and 8, depending on phytoplankton productivity, because these beaches are more affected by human activities. Throughout the sampling beaches, the majority of Chl-a values (76%) were more than 1.0 µg L–1. Despite the high Chl-a values in the present beaches, it was low when compared with the values recorded in another Alexandria coast as in the Western Harbor, which reached 33.82 µg L−1 [8], and higher than 2.4 µg L−1 recorded in the Eastern Harbor and 2.0 µg L−1 in Katey Bey [53]. Chlorophyll-a concentration was not correlated with phytoplankton number, which means that other nano- and pico-plankton cells that were not counted in the current study could be responsible for the increase in chlorophyll-a.
The phytoplankton diversity in Alexandria beaches reveals an increment (228 taxa) due to the high species number of diatoms (136 species), and may be related to the stability of the studied beaches. The species numbers of phytoplankton in Alexandria beaches are similar to those recorded in Matrouh beaches (203 taxa) by [41], and much greater than those recorded in other Alexandria waters, which is 162 species, including 100 diatoms and 32 dinoflagellates in the Eastern Harbor, and 110 species, including 64 diatoms and 21 dinoflagellates in Kayet Bey [43]. Shams El-Din and Abel Halim [12] qualified 90 species (61 diatoms, 11 dinoflagellates) in El Mohandessin village; 83 species (56 diatoms, 12 dinoflagellates) in Marakia village; 54 species (34 diatoms, 9 dinoflagellates) in Marabella village. Dango et al. [42] studied the phytoplankton along the Alexandria coast during 2013–14 and recorded 153 species, including 85 diatoms and 31 dinoflagellates (Table 6).
The overall mean of phytoplankton density in Alexandria beaches was 64 × 103 cells L−1, this average being 4.57 times higher than recorded in Matrouh beaches [41] and >20 times higher in Marakia touristic village of Shams El-Din and Abel Halim [12] and is in conformity with the results of Dango et al. [42] along the Alexandria coast, and 4 times fewer than in other Alexandria beach areas such as harbors and semienclosed zones [8,10,54].
The increase in p. delicatissima numbers is mostly reported to take place at low temperatures [55,56,57], and might adjust to an extensive range of temperatures therefore being able to bloom in various seasons, as shown by it being more abundant in September and December. Increased numbers of the genus Pseudo-nitzschia were common in coastal waters rich with nutrients, and their existence may be an indication of eutrophication [8,58]. Dinoflagellates were second in importance. Devell and Kideys [58] mentioned that dinoflagellates flourish well at high temperatures; the present results showed a clear existence of dinoflagellates during summer and autumn.
During early summer (June), beaches 4–8 were characterized by an isolated event of one species, Chlorella marina, which reached 97.5% of the total phytoplankton abundance (beach 7), whereas no green algae blooms were observed in beaches 1 and 3 at the same time. The Chlorella bloom coincided with a 5 °C increase in water temperature, plus the pH values were slightly higher than the nonbloom beaches (8.08–8.54) and the water was less saline (33.8–34.2 ppt). There was an obvious increase in phosphorus (0.64 µM), nitrate (7.27 µM), and ammonia (8.97 µM). All the previous factors enhance the growth of Chlorella. Ouyang et al. [59], Mohanty et al. [60] and Asha et al. [61] reported that C. marina flourishes with the increase in salinity and can also tolerate higher temperature. Adenan et al. [46] mentioned that 25 ppt salinity and 25 °C temperature were optimum for the growth of Chlorella. Euglenophyta was the main component in April (beach 8), forming 48.87% of the total density. The genus Eutreptiella was the leader, and it was commonly observed in Egyptian waters [10]. Euglenophyta can grow rapidly at higher nutrient concentrations, moderate salinity, and high temperatures in the range >20 °C, therefore these factors appeared to provide ideal conditions for the growth of euglenophycean blooms [62].
In addition, the range of the Shannon index (0.151–3.439 nats) is wider than (1.00–2.50) that which was recorded by Gharib et al. [8], Heneash et al. [10], Khairy et al. [63] in other coastal waters. Diversity indices decreased to less than 1 nats in June and increased to more than 3 nats in January. The lowest diversity values were recorded in beaches 4–8. Diversity reached its minimum level when a few species dominated the community. The highest species diversity recorded during winter was due to a more stable community and a balanced distribution among species. It makes sense to consider that phytoplankton diversity correlated with phytoplankton abundance, but the present study failed to find a statistically significant relationship between abundance and diversity (r = −0.018, p = 0.863) which may be because other factors were in control of the variations in the two variables. According to Wilhm and Dorris [39] and Staub et al. [40] the waters of beaches 1–3 are classified as between clean and moderately polluted, and beaches 4–8 varied between moderately and heavily polluted.
The water quality index is a valuable tool to evaluate water quality and can be calculated by transforming many physical and chemical factors into a single number that symbolizes the level of the water quality [35,64]. This index can enable decision makers to assess the water quality. The obtained data suggested that the water quality off the various beaches in Alexandria was good, with some indices of medium recorded in summer. Generally, 86% of the WQI values corresponded to “good” water quality. As well as the correlation coefficients amongst WQI and physical and chemical factors, it was shown that WQI negatively correlated with ammonia (r = −0.721), phosphate (r = –0.819), temperature (r = −0.450), and pH values (r = −0.492) at p < 0.001. Accordingly, it can be concluded that the WQI is more appropriate for evaluating the water quality of the Alexandria beaches than the diversity index based on phytoplankton species. The principal feature of the studied beaches is the spatial differences in the physicochemical influences, phytoplankton abundance and structure, and phytoplankton diversity index. Turkoglu [65,66] emphasized the fact that seasonal changes in phytoplankton abundance and species structure are mainly dependent on exchanges between chemical and physical influences.

5. Conclusions

The Alexandria Beaches (El-Montaza, El-Mandra, El-Asafra, Miamy, Sidi Bisher, Al-saraya, El-Shatby, and El-Anfoshy) of the southeastern Mediterranean Sea, Egypt, studied in the present studies, are public and highly populated. The results revealed that the water quality index fluctuated from 64 (beach 7, El-Shatby) to 93 (beach 2, El-Mandra); hence, the water can be categorized as medium to good. The phytoplankton density and composition exhibit spatial and temporal changes, whereas the abundance averaged 63.85 ± 17.83 × 10³ cells L–1, and biomass characterized by chlorophyll-a concentration averaged 2.476 ± 1.820 µg L–1 in different studied sites, with the maximum in the summer season. The species with the highest abundance were Bacillariophyceae, Dinoflagellates, and Chlorophyceae. It is possible to say that Alexandria beaches have generally oligotrophic waters. Beaches 7 and 8 (El-Shatby and El-Anfoshy, respectively) are unique and display a transition from oligotrophic to mesotrophic conditions. These beaches contain many human activities such as cafeterias, clubs, and boats, which are characterized by a high density of vacationers, and high tourism activities, in addition to the presence of shipbuilding centers that dump their waste on the beach. Similarly, when compared to other coastal zones around the Alexandria coast, anthropogenic effects were minimal. Furthermore, during the study period, no severe nutrient concentrations were found, and no harmful algal blooms were reported.

Author Contributions

Conceptualization, A.E.A. and S.M.G.; Data curation, A.E.A., M.A., A.T.M. and S.M.G.; Formal analysis, A.E.A., M.A. and S.M.G.; Funding acquisition, O.M.A., S.F.M. and A.T.M.; Investigation, A.E.A., M.A. and S.M.G.; Methodology, A.E.A. and S.M.G.; Resources, A.E.A., A.T.M., O.M.A., S.F.M. and S.M.G.; Software, M.A., A.T.M., O.M.A., S.F.M. and S.M.G.; Supervision, A.E.A. and A.T.M.; Validation, O.M.A., S.F.M. and S.M.G.; Visualization, M.A., A.T.M., O.M.A., S.F.M. and S.M.G.; Writing—original draft, A.E.A. and M.A.; Writing—review and editing, A.E.A., M.A., A.T.M. and S.M.G. All authors have read and agreed to the published version of the manuscript.

Funding

This research was funded by Taif University Researchers Supporting Project, Project number (TURSP-2020/262).

Institutional Review Board Statement

Not applicable.

Informed Consent Statement

Not applicable.

Data Availability Statement

All relevant data are within the paper, and those are available from the corresponding author.

Acknowledgments

The authors would like to thank Taif University Researchers Supporting Project number (TURSP-2020/262), Taif University, Taif, Saudi Arabia to support the publication of this work.

Conflicts of Interest

The authors declare no conflict of interest.

References

  1. Azov, Y. Eastern Mediterranean—A marine desert? Mar. Pollut. Bull. 1991, 23, 225–232. [Google Scholar] [CrossRef]
  2. Abo-Taleb, H.; Ashour, M.; El-Shafei, A.; Alataway, A.; Maaty, M.M.; Abo-Taleb, H.A.; Ashour, M.; El-Shafei, A.; Alataway, A.; Maaty, M.M. Biodiversity of Calanoida Copepoda in Different Habitats of the North-Western Red Sea (Hurghada Shelf). Water 2020, 12, 656. [Google Scholar] [CrossRef] [Green Version]
  3. Dorgham, M.M. Phytoplankton dynamics and ecology in a polluted area on the Alexandria Mediterranean coast. In Proceedings of the 3rd International Conference on Mediterranean Coastal Environment, Qawra, Malta, 11–14 November 1997; Volume 1, pp. 151–160. [Google Scholar]
  4. Alprol, A.E.; Heneash, A.M.M.; Soliman, A.M.; Ashour, M.; Alsanie, W.F.; Gaber, A.; Mansour, A.T. Assessment of Water Quality, Eutrophication, and Zooplankton Community in Lake Burullus, Egypt. Diversity 2021, 13, 268. [Google Scholar] [CrossRef]
  5. Zaghloul, F.A.-R.; Khairy, H.M.; Hussein, N.R. Assessment of phytoplankton community structure and water quality in the Eastern Harbor of Alexandria, Egypt. Egypt. J. Aquat. Res. 2020, 46, 145–151. [Google Scholar] [CrossRef]
  6. El-Sherif, Z.; Mikhail, S.K. Phytoplankton dynamics in the southwestern part of Abu Qir Bay, Alexandria, Egypt. Egypt. J. Aquat. Biol. Fish 2003, 7, 219–239. [Google Scholar]
  7. Ismael, A.A.; Dorgham, M.M. Ecological indices as a tool for assessing pollution in El-Dekhaila Harbour (Alexandria, Egypt). Oceanologia 2003, 45, 121–131. [Google Scholar]
  8. Gharib, S.M.; Dorgham, M.M. Eutrophication stress on phytoplankton community in the Western Harbour of Alexandria, Egypt. Int. J. Ocean. Oceanogr. 2006, 1, 261–273. [Google Scholar]
  9. Dorgham, M.M.; Abdel-Aziz, N.E.; El-Deeb, K.Z.; Okbah, M.A. Eutrophication problems in the western harbour of Alexandria, Egypt. Oceanologia 2004, 46, 25–44. [Google Scholar]
  10. Heneash, A.M.M.; Tadrose, H.R.Z.; Hussein, M.M.A.; Hamdona, S.K.; Abdel-Aziz, N.; Gharib, S.M. Potential effects of abiotic factors on the abundance and distribution of the plankton in the Western Harbour, south-eastern Mediterranean Sea, Egypt. Oceanologia 2015, 57, 61–70. [Google Scholar] [CrossRef] [Green Version]
  11. Zingone, A.; Escalera, L.; Aligizaki, K.; Fernández-tejedor, M.; Ismael, A.; Montresor, M.; Mozetič, P.; Taş, S.; Totti, C. Toxic marine microalgae and noxious blooms in the Mediterranean Sea: A contribution to the Global HAB Status Report. Harmful Algae 2020, 101843. [Google Scholar] [CrossRef] [PubMed]
  12. Shams El-Din, N.; Abel Halim, A. Changes in phytoplankton community structure at three touristic sites at western Alexandria Beach. Egypt. J. Aquat. Biol. Fish. 2008, 12, 85–118. [Google Scholar] [CrossRef] [Green Version]
  13. Abbas, E.M.; Ali, F.S.; Desouky, M.G.; Ashour, M.; El-Shafei, A.; Maaty, M.M.; Sharawy, Z.Z. Novel comprehensive molecular and ecological study introducing coastal mud shrimp (Solenocera crassicornis) recorded at the Gulf of suez, Egypt. J. Mar. Sci. Eng. 2021, 9, 9. [Google Scholar] [CrossRef]
  14. Mabrouk, M.M.; Ashour, M.; Labena, A.; Zaki, M.A.A.; Abdelhamid, A.F.; Gewaily, M.S.; Dawood, M.A.O.; Abualnaja, K.M.; Ayoub, H.F. Nanoparticles of Arthrospira platensis improves growth, antioxidative and immunological responses of Nile tilapia (Oreochromis niloticus) and its resistance to Aeromonas hydrophila. Aquac. Res. 2021, 1–11. [Google Scholar] [CrossRef]
  15. Ashour, M.; Abo-Taleb, H.; Abou-Mahmoud, M.; El-Feky, M.M.M. Effect of the integration between plankton natural productivity and environmental assessment of irrigation water, El-Mahmoudia Canal, on aquaculture potential of Oreochromis niloticus. Turk. J. Fish. Aquat. Sci. 2018, 18, 1163–1175. [Google Scholar] [CrossRef]
  16. Metwally, S.A.; El-Naggar, H.A.; El-Damhougy, K.A.; Bashar, M.A.E.; Ashour, M.; Abo-Taleb, H.A.H. GC-MS analysis of bioactive components in six different crude extracts from the Soft Coral (Sinularia maxim) collected from Ras Mohamed, Aqaba Gulf, Red Sea, Egypt. Egypt. J. Aquat. Biol. Fish. 2020, 24, 425–434. [Google Scholar] [CrossRef]
  17. Ashour, M.; Mabrouk, M.M.; Ayoub, H.F.; El-Feky, M.M.M.; Sharawy, Z.Z.; Hoseinifar, S.H.; Rossi, W.; Van Doan, H.; El-Haroun, E.; Goda, A.M.-S. Effect of dietary seaweed extract supplementation on growth, feed utilization, hematological indices, and non-specific immunity of Nile Tilapia, Oreochromis niloticus challenged with Aeromonas hydrophila. J. Appl. Phycol. 2020, 32, 3467–3479. [Google Scholar] [CrossRef]
  18. El-Shenody, R.A.; Ashour, M.; Ghobara, M.M.E. Evaluating the chemical composition and antioxidant activity of three Egyptian seaweeds: Dictyota dichotoma, Turbinaria decurrens, and Laurencia obtusa. Braz. J. Food Technol. 2019, 22. [Google Scholar] [CrossRef] [Green Version]
  19. Elshobary, M.E.; El-Shenody, R.A.; Ashour, M.; Zabed, H.M.; Qi, X. Antimicrobial and antioxidant characterization of bioactive components from Chlorococcum minutum. Food Biosci. 2020, 35, 100567. [Google Scholar] [CrossRef]
  20. Abualnaja, K.M.; Alprol, A.E.; Abu-Saied, M.A.; Mansour, A.T.; Ashour, M. Studying the Adsorptive Behavior of Poly (Acrylonitrile- co -Styrene) and Carbon Nanotubes (Nanocomposites) Impregnated with Adsorbent Materials towards Methyl Orange Dye. Nanomaterials 2021, 11, 1144. [Google Scholar] [CrossRef]
  21. Abualnaja, K.M.; Alprol, A.E.; Ashour, M. Removing of Anionic Dye from Aqueous Solutions by Adsorption Using of Multiwalled Carbon Nanotubes and Poly (Acrylonitrile-styrene) Impregnated with Activated Carbon. Sustainability 2021, 13, 7077. [Google Scholar] [CrossRef]
  22. Abualnaja, K.M.; Alprol, A.E.; Ashour, M.; Mansour, A.T. Influencing Multi-Walled Carbon Nanotubes for the Removal of Ismate Violet 2R Dye from Wastewater: Isotherm, Kinetics, and Thermodynamic Studies. Appl. Sci. 2021, 11, 4786. [Google Scholar] [CrossRef]
  23. Ashour, M.; Mabrouk, M.; Abo-Taleb, H.A.; Sharawy, Z.Z.; Ayoub, H.F.; Van Doan, H.; Davies, S.J.; El-Haroun, E.; Goda, A.A. A liquid seaweed extract (TAM®) improves aqueous rearing environment, diversity of zooplankton community, whilst enhancing growth and immune response of Nile tilapia, Oreochromis niloticus, challenged by Aeromonas hydrophila. Aquaculture 2021, 543, 736915. [Google Scholar] [CrossRef]
  24. Magouz, F.I.; Essa, M.A.; Matter, M.; Tageldein Mansour, A.; Alkafafy, M.; Ashour, M. Population dynamics, fecundity and fatty acid composition of Oithona nana (Cyclopoida, Copepoda), fed on different diets. Animals 2021, 11, 1188. [Google Scholar] [CrossRef]
  25. Abo-Taleb, H.A.; Ashour, M.; Elokaby, M.A.; Mabrouk, M.M.; El-feky, M.M.M.; Abdelzaher, O.F.; Gaber, A.; Alsanie, W.F.; Mansour, A.T. Effect of a New Feed Daphnia magna (Straus, 1820), as a Fish Meal Substitute on Growth, Feed Utilization, Histological Status, and Economic Revenue of Grey Mullet, Mugil cephalus (Linnaeus 1758). Sustainability 2021, 13, 7093. [Google Scholar] [CrossRef]
  26. Abo-Taleb, H.A.; El-feky, M.M.M.; Azab, A.M.; Mabrouk, M.M.; Elokaby, M.A.; Ashour, M.; Mansour, A.T.; Abdelzaher, O.F.; Abualnaja, K.M.; Sallam, A.E. Growth Performance, Feed Utilization, Gut Integrity, and Economic Revenue of Grey Mullet, Mugil cephalus, Fed an Increasing Level of Dried Zooplankton Biomass Meal as Fishmeal Substitutions. Fishes 2021, 6, 38. [Google Scholar] [CrossRef]
  27. Magouz, F.I.; Essa, M.A.; Matter, M.; Mansour, A.T.; Gaber, A.; Ashour, M. Effect of different salinity levels on Copepoda (Oithona nana) population dynamics, production, and composition. Diversity 2021, 30, 190. [Google Scholar] [CrossRef]
  28. Abo-Taleb, H.A.; Zeina, A.F.; Ashour, M.; Mabrouk, M.M.; Sallam, A.E.; El-Feky, M.M. Isolation and cultivation of the freshwater amphipod Gammarus pulex (Linnaeus, 1758), with an evaluation of its chemical and nutritional content. Egypt. J. Aquat. Biol. Fish. 2020, 24, 69–82. [Google Scholar] [CrossRef] [Green Version]
  29. Heneash, A.M.M.; Alprol, A.E. Monitoring of Water Quality and Zooplankton Community in Presence of Different Dietary Levels of Commercial Wood Charcoal of Red Tilapia. J. Aquac. Res. Dev. 2020, 11, 1–6. [Google Scholar] [CrossRef]
  30. Zaki, M.A.; Ashour, M.; Heneash, A.M.M.; Mabrouk, M.M.; Alprol, A.E.; Khairy, H.M.; Nour, A.M.; Mansour, A.T.; Hassanien, H.A.; Gaber, A. Potential Applications of Native Cyanobacterium Isolate (Arthrospira platensis NIOF17/003) for Biodiesel Production and Utilization of Its Byproduct in Marine Rotifer (Brachionus plicatilis) Production. Sustainability 2021, 13, 1769. [Google Scholar] [CrossRef]
  31. Alprol, A.E.; Ashour, M.; Abualnaja, K.M.; Alhashmialameer, D.; Mansour, A.T.; Sharawy, Z.Z.; Abu-Saied, M.A.; Abomohra, A.E.-F. Potential Applications of Arthrospira platensis Lipid-Free Biomass in Bioremediation of Organic Dye from Industrial Textile Effluents and Its Influence on Marine Rotifer (Brachionus plicatilis). Materials 2021, 14, 4446. [Google Scholar] [CrossRef] [PubMed]
  32. Ashour, M.; Alprol, A.E.; Heneash, A.M.M.; Saleh, H.; Abualnaja, K.M.; Alhashmialameer, D.; Mansour, A.T. Ammonia Bioremediation from Aquaculture Wastewater Effluents Using Arthrospira platensis NIOF17/003: Impact of Biodiesel Residue and Potential of Ammonia-Loaded Biomass as Rotifer Feed. Materials 2021, 14, 5460. [Google Scholar] [CrossRef]
  33. Parsons, T.R. A Manual of Chemical & Biological Methods for Seawater Analysis; Elsevier: Amsterdam, The Netherlands, 2013; ISBN 1483293394. [Google Scholar]
  34. Elhdad, A.M.A. Assessment of Surface Water Quality, Raw versus Treated, for Different Uses at Dakahlia Governorate, Egypt. Egypt. J. Chem. 2019, 62, 1117–1129. [Google Scholar] [CrossRef]
  35. Sargaonkar, A.; Deshpande, V. Development of an overall index of pollution for surface water based on a general classification scheme in Indian context. Environ. Monit. Assess. 2003, 89, 43–67. [Google Scholar] [CrossRef]
  36. El-Hamid, H.T.A.; Hegazy, T.A.; Ibrahim, M.S.; Khalid, M. Assessment of water quality of the Northern Delta Lakes, Egypt. J. Environ. Sci. 2017, 46, 21–34. [Google Scholar]
  37. Tiwari, T.N.; Manzoor, A. Water quality index for Indian rivers. In Ecology and Pollution of Indian River; Ashish Publishing House: New Delhi, India, 1988; pp. 271–286. [Google Scholar]
  38. Pielou, E.C. Ecological Diversity; John Wiley & Sons: New York, NY, USA, 1975; ISBN 0471689254. [Google Scholar]
  39. Wilhm, J.L.; Dorris, T.C. Biological Parameters for Water Quality Criteria. BioScience 1968, 18, 477–481. [Google Scholar] [CrossRef]
  40. Staub, R.; Appling, J.N.; Hotsteiler, A.M.; Hass, I.J. The effects of industrial wastes of Memphis and Shelby county on primary planktonic producers. BioScience 1970, 20, 905–912. [Google Scholar] [CrossRef]
  41. Gharib, S.M.; El-Sherif, Z.M.; Abdel-Halim, A.M.; Radwan, A.A. Phytoplankton and environmental variables as a water quality indicator for the beaches at Matrouh, south-eastern Mediterranean Sea, Egypt: An assessment. Oceanologia 2011, 53, 819–836. [Google Scholar] [CrossRef] [Green Version]
  42. Dango, E.A.; Ibrahim, M.S.; Hussein, N.R.; El Gammal, M.I.; Okbah, M.A. Spatial and temporal variations of phytoplankton communities and environmental conditions along the coastal area of Alexandria. Sci. Res. 2015, 3, 273–282. [Google Scholar] [CrossRef] [Green Version]
  43. Khairy, H.M.; Faragallah, H.M.; Hussein, N.R.; Dorgham, M.M. Environmental characteristics and nutritional level of chronically eutrophic bay on Alexandria Sea coast, Egypt. Indian J. Mar. Sci. 2014. Available online: http://www.niscair.res.in/jinfo/ijms/ijms-forthcoming-articles/BKP-IJMS-PR-Aug 2014/MS 2166 Edited.pdf (accessed on 30 October 2021).
  44. Fepa, A. Guidelines and Standards for Environmental Pollution Control in Nigeria; Federal Environmental Protection Agency (FEPA): Lagos, Nigeria, 1991.
  45. Tadros, H.R.Z.; Ibrahim, G.H.; El Zokm, G.M. Multivariate analysis to investigate the organization of physicochemical Multivariate analysis to investigate the organization of physicochemical parameters in the Eastern Harbour Alexandria, Egypt. Int. J. Contemp. Appl. Sci. 2016, 3, 33–45. [Google Scholar]
  46. Adenan, N.S.; Yusoff, F.M.; Shariff, M. Effect of salinity and temperature on the growth of diatoms and green algae. J. Fish. Aquat. Sci. 2013, 8, 397. [Google Scholar] [CrossRef] [Green Version]
  47. Oczkowski, A.; Nixon, S. Increasing nutrient concentrations and the rise and fall of a coastal fishery; a review of data from the Nile Delta, Egypt. Estuar. Coast. Shelf Sci. 2008, 77, 309–319. [Google Scholar] [CrossRef]
  48. Seroka, G. The Relationship between Dissolved Oxygen, Nitrate and Phosphate Concentrations and Chlorophyll-a Concentration in Rhode River, a Subestuary of Chesapeake Bay; Thomas Jefferson High School of Science and Technology: Alexandria, VA, USA, 2004. [Google Scholar]
  49. James, B.K.; Adejare, L.I. Nutrients and phytoplankton production dynamics of a tropical harbor in relation to water quality indices. J. Am. Sci. 2010, 6, 261–275. [Google Scholar]
  50. Redfield, A.C. The biological control of chemical factors in the environment. Am. Sci. 1958, 46, 205–221. [Google Scholar]
  51. Krom, M.D.; Kress, N.; Brenner, S.; Gordon, L.I. Phosphorus limitation of primary productivity in the eastern Mediterranean Sea. Limnol. Oceanogr. 1991, 36, 424–432. [Google Scholar] [CrossRef]
  52. Bethoux, J.P.; Morin, P.; Madec, C.; Gentili, B. Phosphorus and nitrogen behaviour in the Mediterranean Sea. Deep. Sea Res. Part A Oceanogr. Res. Pap. 1992, 39, 1641–1654. [Google Scholar] [CrossRef]
  53. Khairy, H.M.; Hussein, N.R.; Faragallah, H.M.; Dorgham, M.M. The phytoplankton communities in two eutrophic areas on the Alexandria coast, Egypt. Rev. Biol. Mar. Oceanogr. 2014, 49, 267–277. [Google Scholar] [CrossRef] [Green Version]
  54. El-Sherif, Z.M.; Nassar, M.Z.; Fahmy, M.A. Phytoplankton distribution in the southeastern Mediterranean Sea (Egyptian waters) in summer and winter 2005. Egypt. J. Aquat. Res. 2010, 36, 609–621. [Google Scholar]
  55. Turkoglu, M.; Koray, T. Phytoplankton species’ succession and nutrients in the southern Black Sea (Bay of Sinop). Turk. J. Bot. 2002, 26, 235–252. [Google Scholar]
  56. Lundholm, N.; Andersen, P.; Jørgensen, K.; Thorbjørnsen, B.R.; Cembella, A.; Krock, B. Domoic acid in Danish blue mussels due to a bloom of Pseudo-nitzschia seriata. Harmful Algae News 2005, 29, 8–10. [Google Scholar]
  57. Liefer, J.D.; MacIntyre, H.L.; Novoveská, L.; Smith, W.L.; Dorsey, C.P. Temporal and spatial variability in Pseudo-nitzschia spp. in Alabama coastal waters: A “hot spot” linked to submarine groundwater discharge? Harmful Algae 2009, 8, 706–714. [Google Scholar] [CrossRef]
  58. Develİ, E.E.; Kideyş, A.E. Weekly variations in phytoplankton structure of a harbour in Mersin Bay (north-eastern Mediterranean). Turk. J. Bot. 2000, 24, 13–24. [Google Scholar]
  59. Ouyang, Z.; Wen, X.; Geng, Y.; Mei, H.; Hu, H.; Zhang, G.; Li, Y. The effects of light intensities, temperatures, pH and salinities on photosynthesis of Chlorella. J. Wuhan Bot. Res. 2010, 28, 49–55. [Google Scholar] [CrossRef]
  60. Mohanty, A.K.; Satpathy, K.K.; Sahu, G.; Hussain, K.J.; Prasad, M.V.R.; Sarkar, S.K. Bloom of Trichodesmium erythraeum (Ehr.) and its impact on water quality and plankton community structure in the coastal waters of southeast coast of India. Indian J. Mar. Sci. 2010, 39, 323–333. [Google Scholar]
  61. Asha, P.S.; Diwakar, K.; Sivanesh, H.; Kaladharan, P. Bloom of micro alga Chlorella marina (Butcher) in the Karapad lagoon, Gulf of Mannar, southeast coast of India. J. Mar. Biol. Assoc. India 2015, 57, 31–35. [Google Scholar] [CrossRef]
  62. Olli, K.; Heiskanen, A.-S.; Seppälä, J. Development and fate of Eutreptiella gymnastica bloom in nutrient-enriched enclosures in the coastal Baltic Sea. J. Plankton Res. 1996, 18, 1587–1604. [Google Scholar] [CrossRef]
  63. Khairy, H.M.; Gharib, S.M. Factors regulating composition and abundance of phytoplankton in El Dekhaila Harbor, South-Eastern Mediterranean Sea, Egypt. Asian J. Biol. Sci. 2017, 10, 27–37. [Google Scholar] [CrossRef] [Green Version]
  64. Sánchez, E.; Colmenarejo, M.F.; Vicente, J.; Rubio, A.; García, M.G.; Travieso, L.; Borja, R. Use of the water quality index and dissolved oxygen deficit as simple indicators of watersheds pollution. Ecol. Indic. 2007, 7, 315–328. [Google Scholar] [CrossRef]
  65. Turkoglu, M. Winter bloom and ecological behaviors of coccolithophore Emiliania huxleyi (Lohmann) Hay & Mohler, 1967 in the Dardanelles (Turkish Straits System). Hydrol. Res. 2010, 41, 104–114. [Google Scholar]
  66. Turkoglu, M. Temporal variations of surface phytoplankton, nutrients and chlorophyll-a in the Dardanelles (Turkish Straits System): A coastal station sample in weekly time intervals. Turk. J. Biol. 2010, 34, 319–333. [Google Scholar]
Figure 1. Map of sampling sites during the period study (1: El-Montaza; 2: El-Mandra; 3: El-Asafra; 4: Miamy; 5: Sidi Bisher; 6: Al-saraya; 7: El-Shatby; 8: El-Anfoshy).
Jmse 09 01328 g001
Figure 2. Monthly phytoplankton abundances among eight Alexandria beach sites sampled from March 2019 through February 2020.
Jmse 09 01328 g002
Table 1. Sampling sites description.
NoSampling SiteNE
1El-Montaza31 17 2130 00 42
2El-Mandra31 16 5130 00 36
3El-Asafra31 16 2530 00 01
4Miamy31 16 1229 59 29
5Sidi Bisher31 15 4529 59 03
6Al-saraya31 13 2029 55 51
7El-Shatby31 12 3829 54 29
8El-Anfoshy31 12 4629 52 54
Table 2. The average monthly physicochemical parameters and standard deviation (SD) from March 2019 to February 2020 at the beaches in Alexandria.
Beaches *12345678
Parameter(Min–Max)(Min–Max)(Min–Max)(Min–Max)(Min–Max)(Min–Max)(Min–Max)(Min–Max)
Mean ± SDMean ± SDMean ± SDMean ± SDMean ± SDMean ± SDMean ± SDMean ± SD
Temperature
(°C)
18.6–27.018.6–27.018.7–27.118.7–27.318.7–27.218.8–27.218.8–27.218.8–27.3
23 ± 3.31 23.1 ± 3.2523.2 ± 3.2123.2 ± 3.2823.2 ± 3.2623.3 ± 3.2923.3 ± 3.2823.3 ± 3.3
pH7.23–8.207.54 −8.207.67–8.307.45–8.547.42–8.347.26–8.327.43–8.347.38–8.44
7.88 ± 0.277.92 ± 0.177.94 ± 0.247.93 ± 0.257.98 ± 0.277.96 ± 0.287.97 ± 0.268.03 ± 0.32
Salinity (ppt)34.80–38.833.4–38.233.60 −38.332.5–38.132.40–38.132.3–38.232.0–38.127.50–38.1
37.53 ± 1.0035.43 ± 1.5535.57 ± 1.5435.27 ± 1.6935.24 ± 1.6935.06 ± 1.7035.04 ± 1.7534.31 ± 2.75
DO (mg L−1)4.23–5.804.12–6.404.65–6.234.80–6.404.87–6.104.12–6.104.54–6.404.10–7.50
5.00 ± 0.625.60 ± 0.665.42 ± 0.455.49 ± 0.415.59 ± 0.365.42 ± 0.505.67 ± 0.486.39 ± 1.06
NO2-N (µg L−1)0.01–0.930.01–0.950.04 −1.210.06–1.760.03–1.980.07–1.870.28–1.980.42–1.50
0.23 ± 0.290.26 ± 0.280.32 ± 0.340.49 ± 0.470.51 ± 0.520.61 ± 0.480.71 ± 0.450.74 ± 0.30
NO3-N (µg L−1)2.36–9.041.54–10.541.98–10.652.65–16.763.43–19.763.54–33.212.65–23.763.54–13.78
3.84 ± 2.224.06 ± 2.524.23 ± 2.375.40 ± 3.786.05 ± 4.437.71 ± 8.177.79 ± 5.656.79 ± 2.59
NH4 (µg L−1)0.12–7.550.04–6.340.23–5.870.23–7.340.04–7.540.10–7.390.04–9.450.26–7.98
2.48 ± 2.852.19 ± 2.312.51 ± 2.282.74 ± 2.922.89 ± 2.892.70 ± 2.753.54 ± 3.823.23 ± 3.13
PO4-P (µg L−1)0.02–0.340.01–0.070.03–0.450.02–0.930.02–0.720.03–1.050.03–1.540.02–1.05
0.09 ± 0.090.02 ± 0.020.15 ± 0.160.28 ± 0.400.20 ± 0.230.30 ± 0.340.42 ± 0.540.29 ± 0.37
SiO2 (µg L−1)9.08–29.535.91–25.216.98–16.090.67–23.416.14–22.054.05–23.123.98–25.673.57–25.70
16.29 ± 6.0314.23 ± 6.4811.04 ± 3.3711.58 ± 5.8814.19 ± 4.8814.25 ± 6.3815.28 ± 5.6913.86 ± 7.21
Chl-a (µg L−1)0.16–4.740.12–4.650.22–4.600.12 −12.310.47–5.650.16–4.120.13–5.730.18–5.23
1.57 ± 1.332.16 ± 1.342.37 ± 1.413.19 ± 3.342.64 ± 1.592.52 ± 1.412.76 ± 1.762.59 ± 1.59
WQI66–9082–9275–9070–8969–8969–8664–9068–91
82.65 ± 6.8786.52 ± 2.5383.03 ± 4.7380.66 ± 5.1281.19 ± 6.0978.68 ± 5.8379.30 ± 8.7680.53 ± 7.81
* Beaches: 1: El-Montaza; 2: El-Mandra; 3: El-Asafra; 4: Miamy; 5: Sidi Bisher; 6: Al-saraya; 7: El-Shatby; 8: El-Anfoshy.
Table 3. Richness of the main phytoplankton groups recorded from Alexandria beaches.
ClassRichness
(Number of Taxa)
Bacillariophyceae136
Dinoflagellates36
Chlorophyceae28
Cyanophyceae19
Euglenophyta6
Rhodophyta1
Raphidophyceae1
Silicoflagellates1
Total phytoplankton richness228
Table 4. Top 10 most-abundant phytoplankton species in each beach and their percentage to the total phytoplankton density.
Beach 1 *%Beach 2%Beach 3%Beach 4%
Pseudo-nitzschia delicatissima12.27Pseudo-nitzschia delicatissima15.44Skeletonema costatum23.30Chlorella marina44.44
Skeletonema costatum11.13Skeletonema costatum11.16Leptocylindrus danicus14.47Skeletonema costatum19.25
Navicula tripunctata11.10Akashiwo sanguinea5.12Pseudo-nitzschia delicatissima12.89Pseudo-nitzschia delicatissima5.78
Prorocentrum triestinum10.31Cyclotella kützingiana5.06Chlorella marina7.97Karenia mikimotoi3.67
Cyclotella kützingiana7.84Cyclotella comta4.60Thalassiosira decipiens3.89Protoperidinium conicum2.82
Cyclotella comta7.53Prorocentrum triestinum3.82Cyclotella kützingiana3.00Chaetoceros constrictus2.28
Licmophora ehrenbergii4.45Navicula tripunctata3.59Cyclotella comta2.66Thalassiosira decipiens2.19
Crucigenia rectangularis3.55Chlorella marina2.97Prorocentrum triestinum2.59Cyclotella kützingiana1.90
Prorocentrum micans3.42Crucigenia rectangularis2.96Chaetoceros decipiens2.02Cyclotella comta1.77
Leptocylindrus danicus2.84Nitzschia longissima2.16Navicula tripunctata1.95Eutreptiella braarudii1.62
Beach 5%Beach 6%Beach 7%Beach 8%
Chlorella marina29.72Chlorella marina38.06Chlorella marina79.03Chlorella marina1.62
Pseudo-nitzschia delicatissima10.94Pseudo-nitzschia delicatissima13.08Pseudo-nitzschia delicatissima7.33Pseudo-nitzschia delicatissima58.67
Skeletonema costatum9.68Skeletonema costatum10.28Eutreptiella braarudii1.52Eutreptiella braarudii5.95
Thalassiosira decipiens6.77Cyclotella kützingiana5.20Skeletonema costatum1,21Karenia mikimotoi5.33
Leptocylindrus danicus5.28Leptocylindrus danicus4.64Protoperidinium pellucidum1.07Skeletonema costatum4.67
Karenia mikimotoi3.91Gonyaulax spinifera3.67Chaetoceros constrictus0.89Cyclotella kützingiana4.47
Chaetoceros constrictus3.67Nitzschia longissima2.29Cyclotella kützingiana0.76Leptocylindrus danicus3.22
Cyclotella comta3.47Protoperidinium cerasus1.89Exuviaella marina0.76Euglena granulata2.60
Prorocentrum triestinum2.43Prorocentrum triestinum1.84Leptocylindrus danicus0.74Prorocentrum lima1.39
Protoperidinium cerasus2.33Gyrodinium spirale1.45Pseudo-nitzschia seriata0.36Eutreptiella gymnastica1.28
* Beaches: 1: El-Montaza; 2: El-Mandra; 3: El-Asafra; 4: Miamy; 5: Sidi Bisher; 6: Al-saraya; 7: El-Shatby; 8: El-Anfoshy.
Table 5. Several year observations of nutrient salts (µg L−1) in Alexandria coast.
Nutrients SaltsAlexandria BeachesMatrouh BeachesTouristic Village Marakia
Present StudyGharib et al. [41]Shams El-Din and Abdel Halim [12]
Phosphate0.01–1.540.01–7.300.00–2.50
Silicate0.67–29.530.20–4.490.11–3.08
Nitrate 1.54–33.210.13–5.100.10–4.01
Nitrite 0.01–1.980.01–0.300.00–0.30
Ammonia0.04–9.450.18–16.830.14–24.25
Table 6. Total numbers of phytoplankton species and main groups in Alexandria coast during different years.
Group/SourceBacillariophytaDinoflagellatesTotal Phytoplankton Species
Alexandria BeachesPresent Study13636228
Matrouh beaches[41]12052203
Alexandria coast[42]8531153
Eastern Harbor[43]10032162
Kayet Bay6421110
El Mohandessin village [12]611190
Marakia village561283
Marabella village34954
Publisher’s Note: MDPI stays neutral with regard to jurisdictional claims in published maps and institutional affiliations.

