1. Introduction
Estuaries are the primary transitional zones between land and sea [
1,
2]. There is much research on tidal rivers all over the world, such as the Amazon in Brazil, the Columbia, Fraser, and Saint Lawrence in North America, as well as the Yangtze and Pearl in China [
3]. Among all these estuaries, the hydrodynamic process is controlled by both fluvial and tidal dynamics, leading to complex annual, monthly, and daily variation characteristics [
4,
5]. Moreover, large-scale anthropogenic activities (e.g., dam construction, land reclamation, sand excavation, and waterway dredging) significantly change the riverbed topography and estuarine coastlines [
6,
7]. These changes, which are different from those of natural evolution, also cause corresponding adjustments in the hydrodynamic characteristics of the estuary [
8,
9]. For example, a study of Chesapeake Bay, eastern United States (U.S.), showed an increase in the residence time of freshwater and the penetration of upstream saltwater due to the sea-level rise [
10]. The historic dredging and deepening of the navigation channel in the Caloosahatchee Estuary, Florida, U.S., has caused a significant system-wide increase in salt transport [
11]. In China, the Pearl River Delta (PRD) is a highly urbanized delta that is affected by high-intensity human intervention [
12].
Large-scale sand excavation in the PRD since the mid-1980s has resulted in serious and uneven riverbed downcutting, with a maximum cutting amplitude that exceeds 20 m [
6,
13]. Moreover, Wu et al. [
14] pointed out that the PRD sediment input decreased by 70% since the 1950s, with 90% of this decrease being attributed to human intervention (e.g., dam construction, as well as soil and water conservation). The decrease in the sediment input caused the continuous scour of the riverbed. Furthermore, land reclamation in the estuary resulted in significant changes in the coastlines, with the water area shrinking significantly and forming many mouths that extend to the sea, resulting in a maximum extension length of nearly 20 km. In recent years, the implementation of the “Outline Development Plan for the Guangdong-Hong Kong-Macao Greater Bay Area” policy has further intensified human intervention, further modifying the topography of the PRD [
15].
Severe topographic changes have led to significant adjustments in the river-tide-salt dynamic process in the PRD. Many studies have shown that riverbed downcutting in the Pearl River network significantly lowers the water-discharge relationship curve, reduces the annual water level, increases the annual tidal range, and increases the duration of the corresponding flood tide [
6,
16]. These adjustments further enhance tidal dynamics and increase saltwater intrusion [
17,
18,
19,
20]. However, reclamation in the estuary has caused the mouth to continuously extend, thus weakening the tidal dynamics entering the inland and decreasing saltwater intrusion [
21,
22,
23].
The changes in the coastline caused by land reclamation and riverbed downcutting, which are induced by human activities such as sand excavation and dredging for navigation, have different effects on the hydrodynamic process of the PRD estuary. However, the intensity of the two effects has not been clearly quantified, and the impacts of diverse human activities on the hydrodynamic structures of the PRD are not well understood. In this study, a three-dimensional river-tide-salt dynamic model based on the environmental fluid dynamic code (EFDC) model was used to simulate the hydrodynamic characteristics of the Modaomen Estuary (ME) for different historical periods. The results obtained from this study provide new insights into the evolutionary process of hydrodynamic characteristics driven by human activities in the PRD. This is expected to provide scientific guidelines for water resource utilization, flood prevention and control, saltwater intrusion prevention, and other general water management methods in the PRD.
2. Numerical Model
2.1. Study Area
The PRD, located on the southeast coast of China, is considered one of the most complex delta systems in the world. It mainly comprises a river network area controlled by upstream fluvial dynamics and an estuary area dominated by tidal dynamics [
24]. The river network area starts from the Makou, Sanshui, and Shilong stations and terminates at eight major entrances into the sea. The area of the network of channels is approximately 9750 km
2, and the density ranges from 0.68 to 1.07 km/km
2 [
25]. The front of the PRD estuary starts at the Kowoon Peninsula in Kowloon City, Hong Kong, which is in the east, and ends at the Etoujing of the Chixi Peninsula in Jiangmen City, which is to the west. The network includes eight mouths and their extension areas, covering a water area of 6536 km
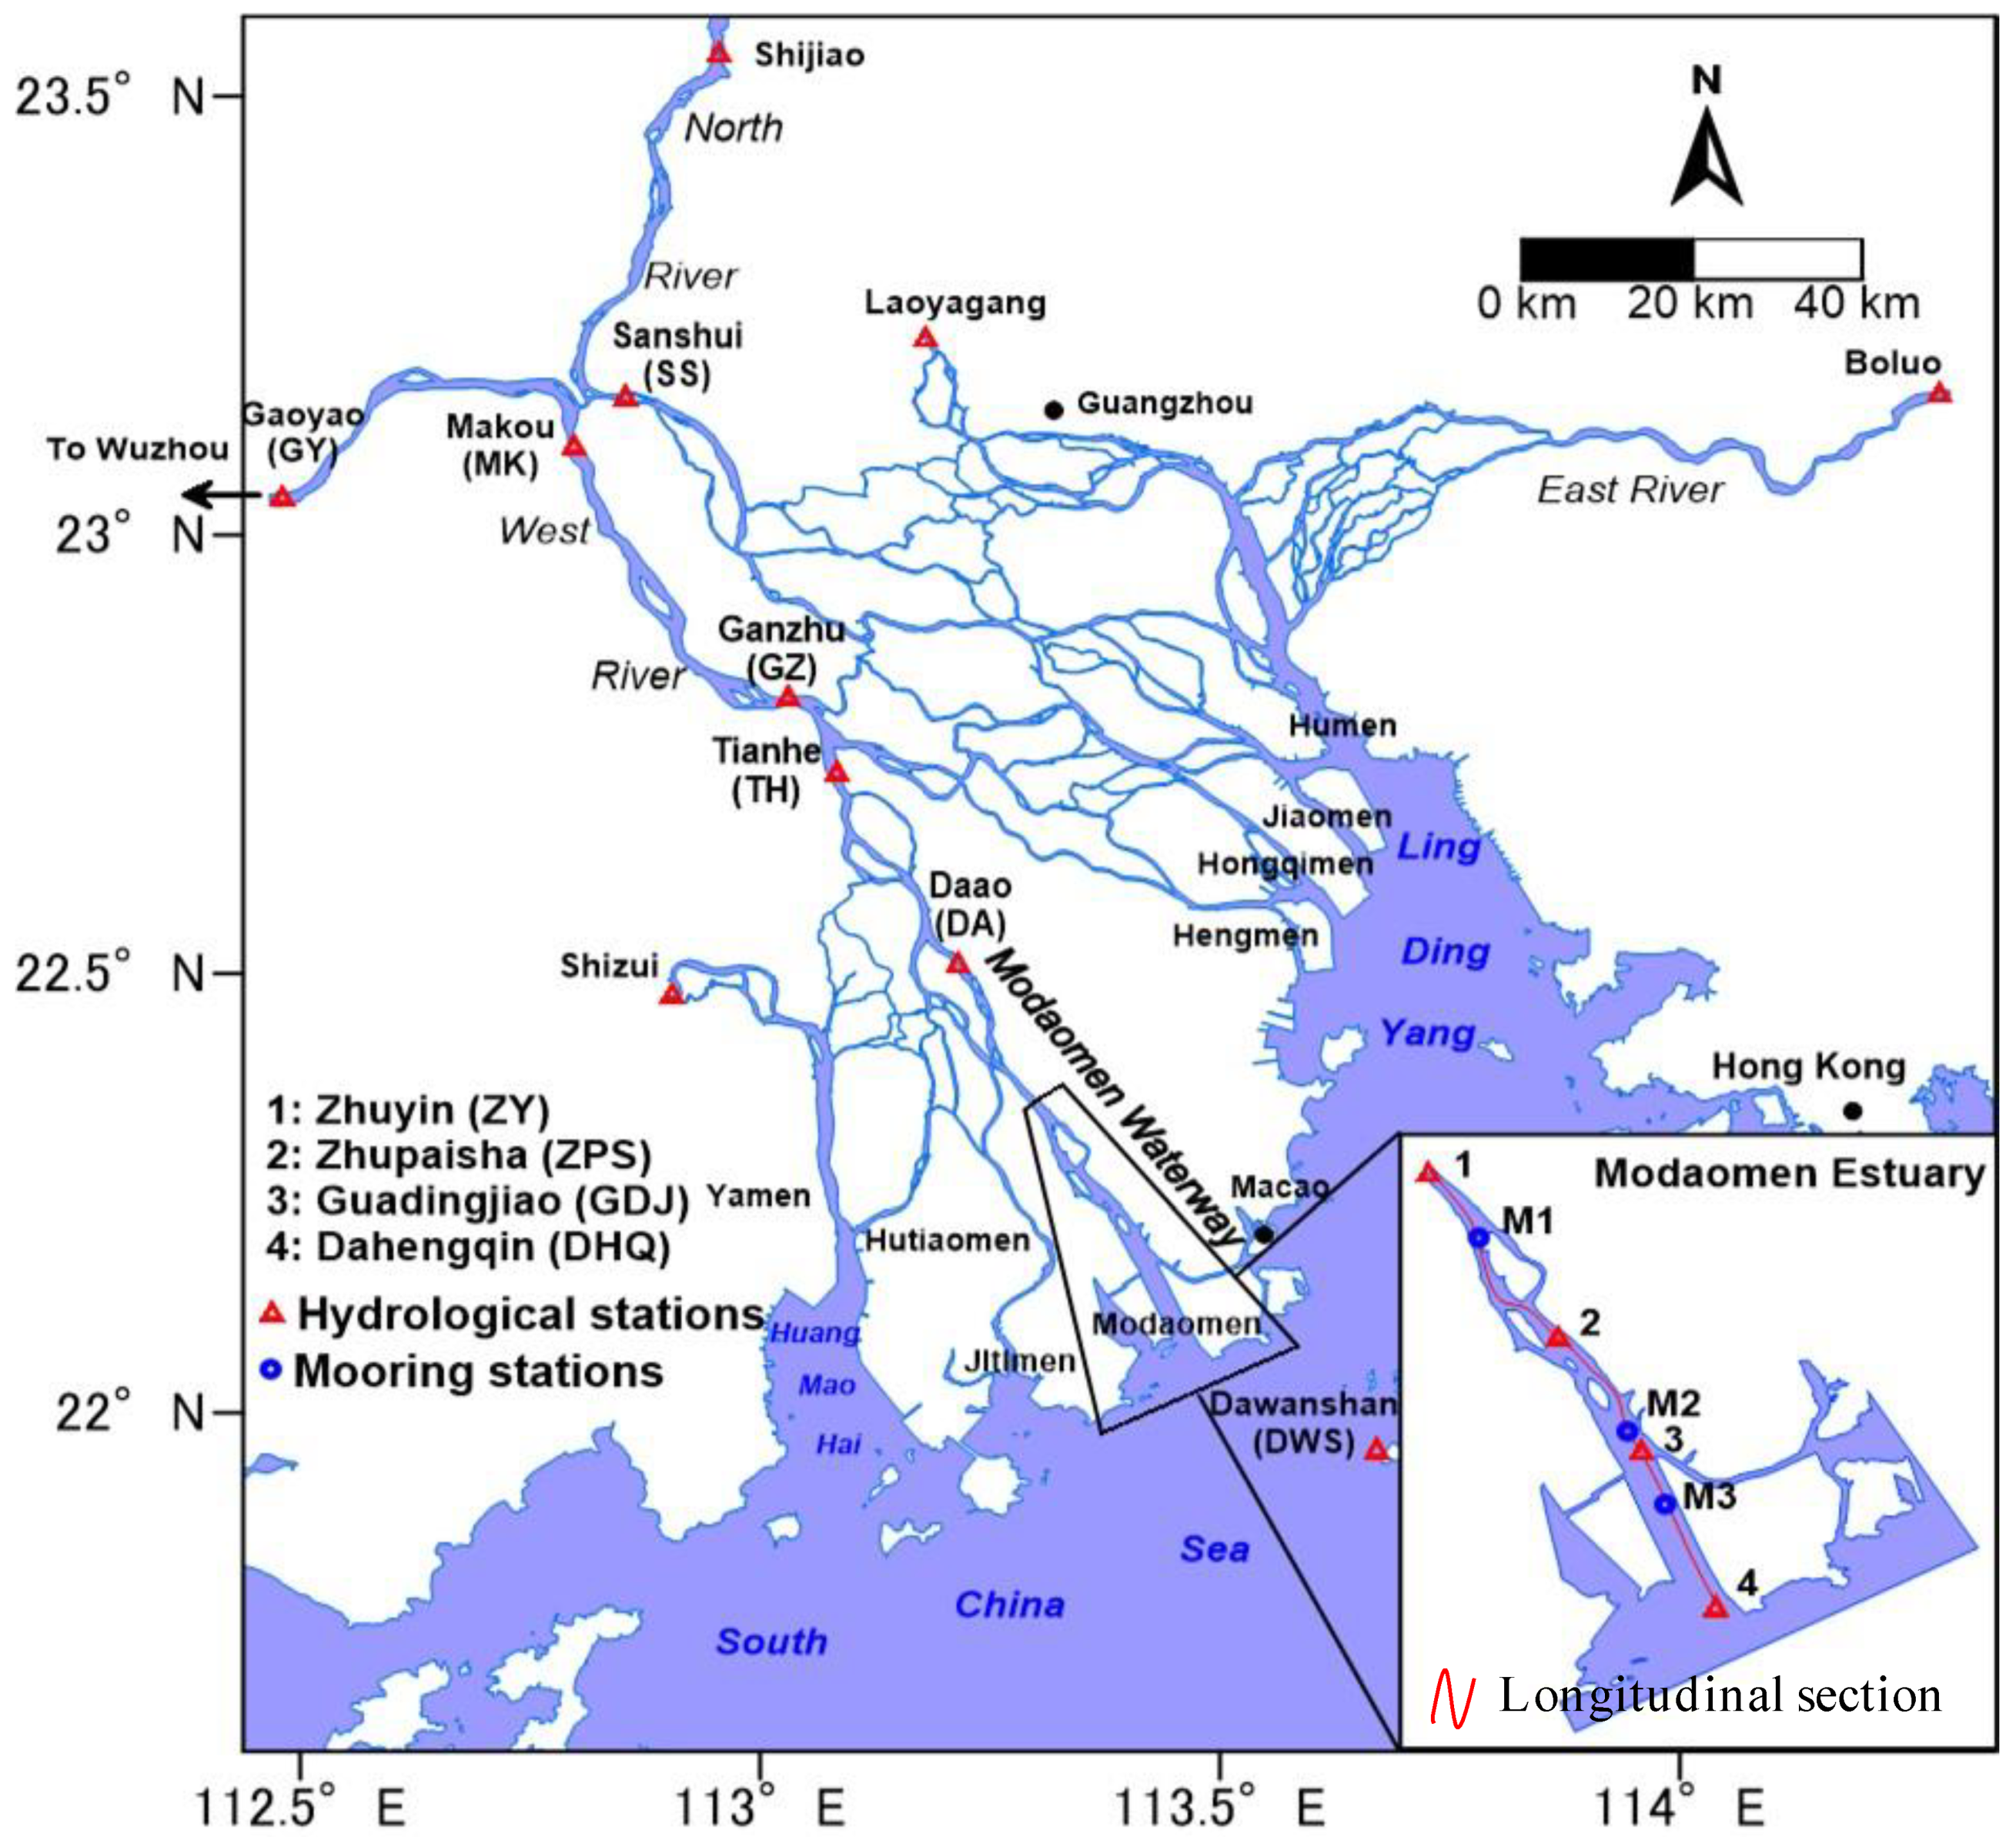
2, a coastline 522.4 km in length with twists and turns, and numerous offshore islands. Among the eight estuaries of the PRD, the flow and sediment from the mouth in the east (Humen, Jiaomen, Hongqimen, and Hengmen) debouches into Lingding Bay, an estuary that occupies a nearly funnel-shaped area on the east side of the PRD. Hutiaomen and Yamen are connected to Huangmao Bay, a funnel-shaped estuary on the western side of the delta. The ME directly debouches into the South China Sea, whereas Jitimen debouches into the waters between Sanzao Island and Gaolan Island. The whole PRD presents a water system pattern with a “three river confluence, river network interweave, track and tide superposition, and eight mouths into the sea” (
Figure 1).
This study focuses on the river channel located between the ZY and DHQ stations (known as the Modaomen Waterway) within the ME, along which are many waterworks to provide freshwater to the surrounding cities. However, the aggravation of saltwater intrusion has disrupted the water supply in recent years [
26]. The channel has a mean water depth of approximately 5 m, with an approximate length of 40 km and a width of less than 3 km. The annual mean freshwater discharge reached 88.4 billion m
3—38% of the total inflow from the West River—making the ME discharge the highest for freshwater discharges in the PRD. The ME has an irregular semidiurnal tidal regime and features a microtidal character with an average tidal range of only 0.86–1.11 m. The tidal range of the estuary mouth is close to the open sea, and it decreases further when the tide propagates from the estuary mouth to the upstream channels. The boundary of the tide zone during the dry season can extend to the upper reaches of Gaoyao in the West River [
26].
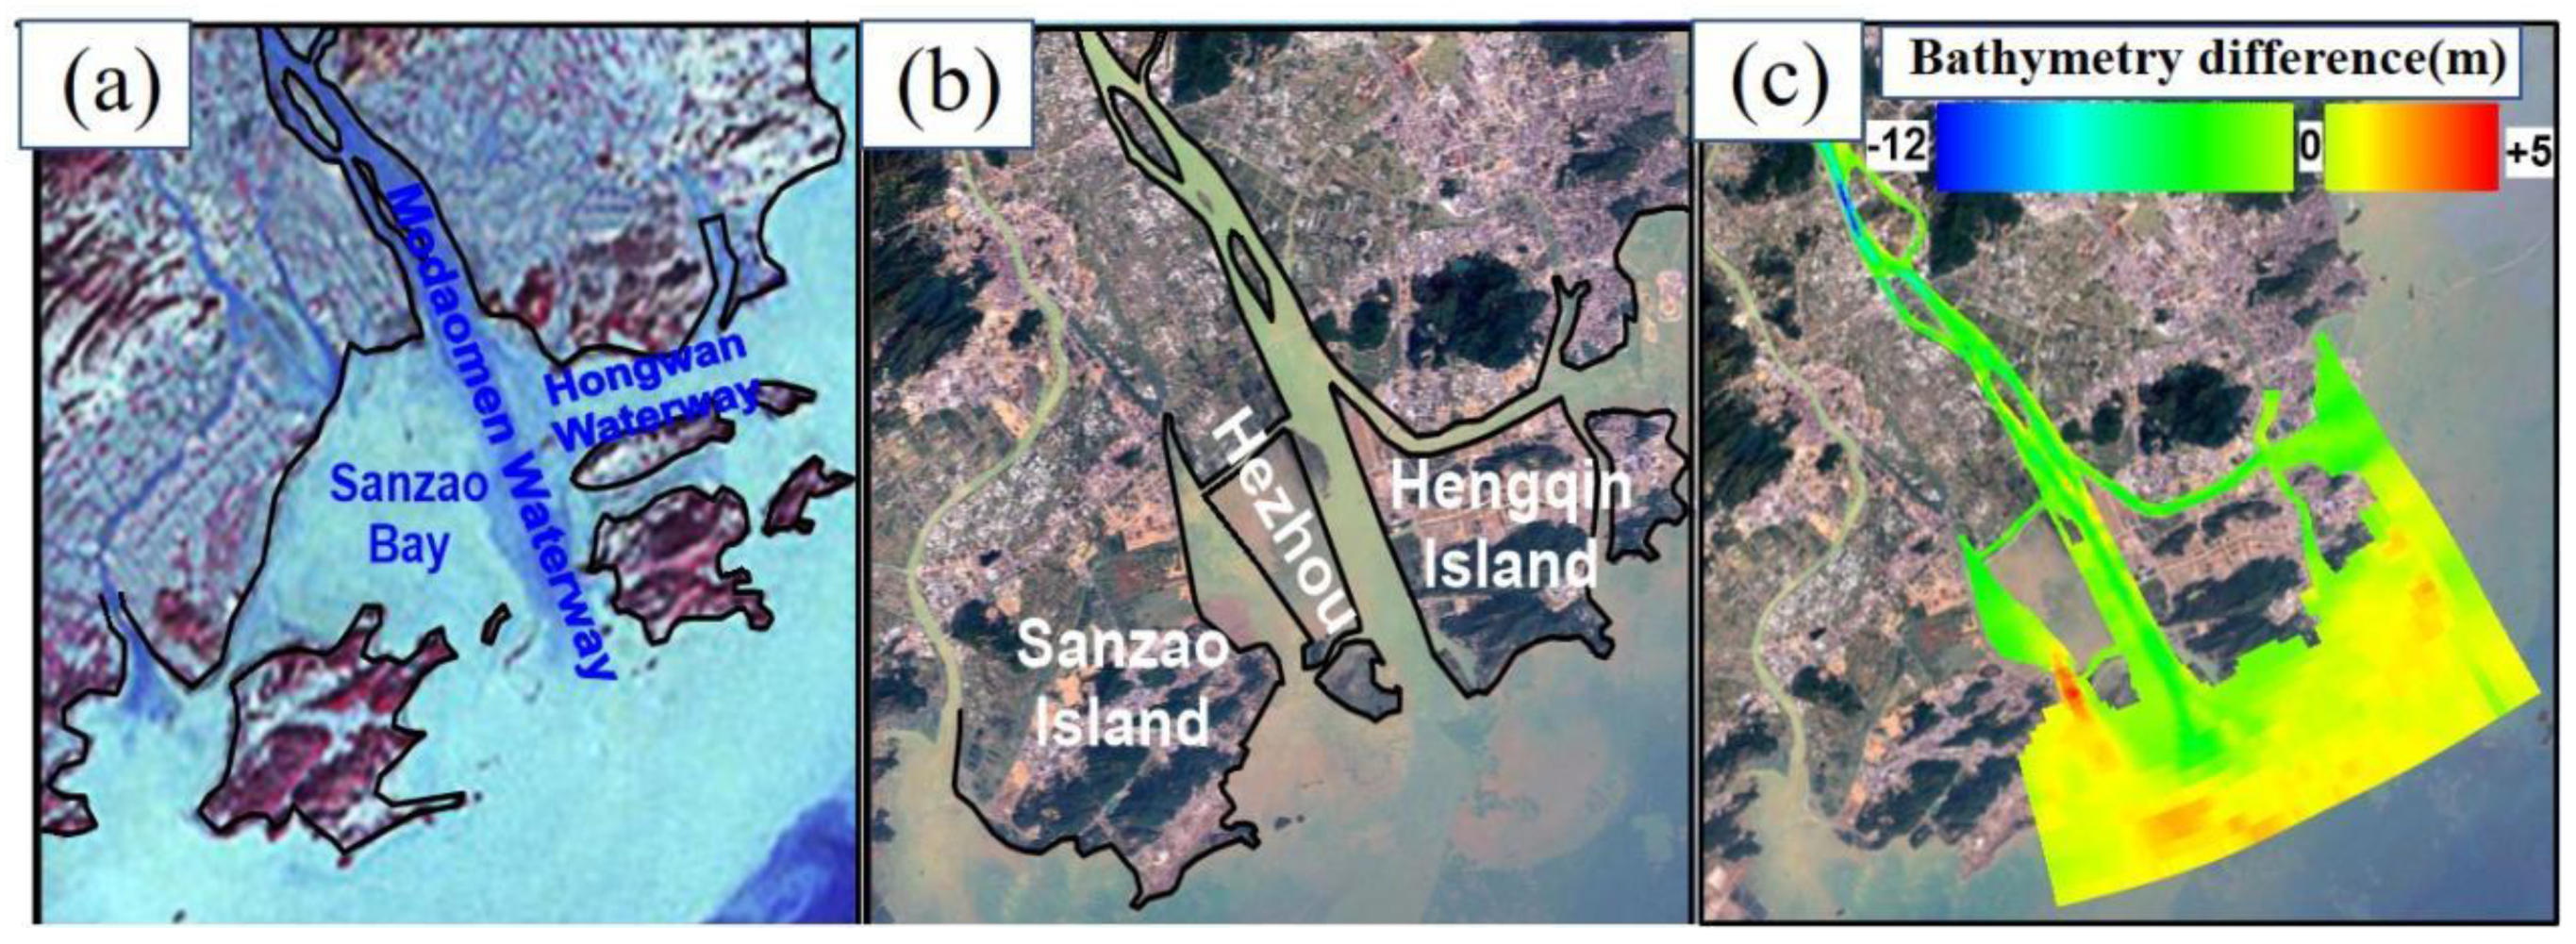
Urbanization has significantly changed the natural coastline and riverbed topography of the ME. As shown in
Figure 2a, the open-sea area of the ME was vast in the 1970s, and the coastline of the estuary exhibited a distinct “trumpet” feature. The mouth of the estuary is located near the GDJ station, through which water flows into the Sanzao Bay and Hongwan Waterway. However, severe coastline changes have occurred in the estuary due to land reclamation at Hezhou, Sanzao Island, and Hengqin Island during the 1980s and 1990s. Consequently, Sanzao Bay has almost disappeared, and its water area has decreased by 117 km
2 to only 77% of the water area in the 1970s. The Hongwan Waterway has become extremely narrow, with a current width of 500 m, which is only one-third of its original width. Between the 1970s and 2010, the water area in the estuary decreased by more than 170 km
2, and the Modaomen Waterway extended seaward by 15 km. The vast open sea in the Modaomen Esturary has shrunk into one main channel (i.e., Modaomen Waterway) and one tributary channel (i.e., Hongwan Waterway), with the extension of the estuary mouth from the GDJ station to the DHQ station (
Figure 2b). In addition, under the influence of anthropogenic activities (e.g., dam construction, sand excavation, and waterway dredging), the topography of the channel in ME between the 1970s and 2010 experienced significant downcutting. The average downcutting amplitude of the entire estuary is 2.75 m, and the maximum downcutting depth has increased to 12 m (
Figure 2c).
2.2. Model Setup
To quantitatively evaluate the impacts of changes in the coastlines and topography of the ME (caused by the human activities mentioned above) on hydrodynamic structures, a three-dimensional river-tide-salt dynamic model based on EFDC and covering the entire PRD was used to simulate the water level, velocity, and salinity of the ME. The model used curvilinear and orthogonal horizontal coordinates, as well as stretched (or sigma) vertical coordinates, to indicate the physical characteristics of the water body to solve the motion equations of a three-dimensional continuity-free surface. The numerical scheme employed in EFDC to solve the equations of motion uses second-order accurate spatial finite-difference on a staggered or C grid. The model’s time integration employs a second-order accurate three-time level, finite-difference scheme with an internal-external mode-splitting procedure to separate the internal shear or baroclinic mode from the external free surface-gravity wave or barotropic mode. The Mellor and Yamada level 2.5 turbulence closure scheme was implemented in this model [
19] and has been successfully applied in environmental studies of the PRD and other estuarine systems worldwide.
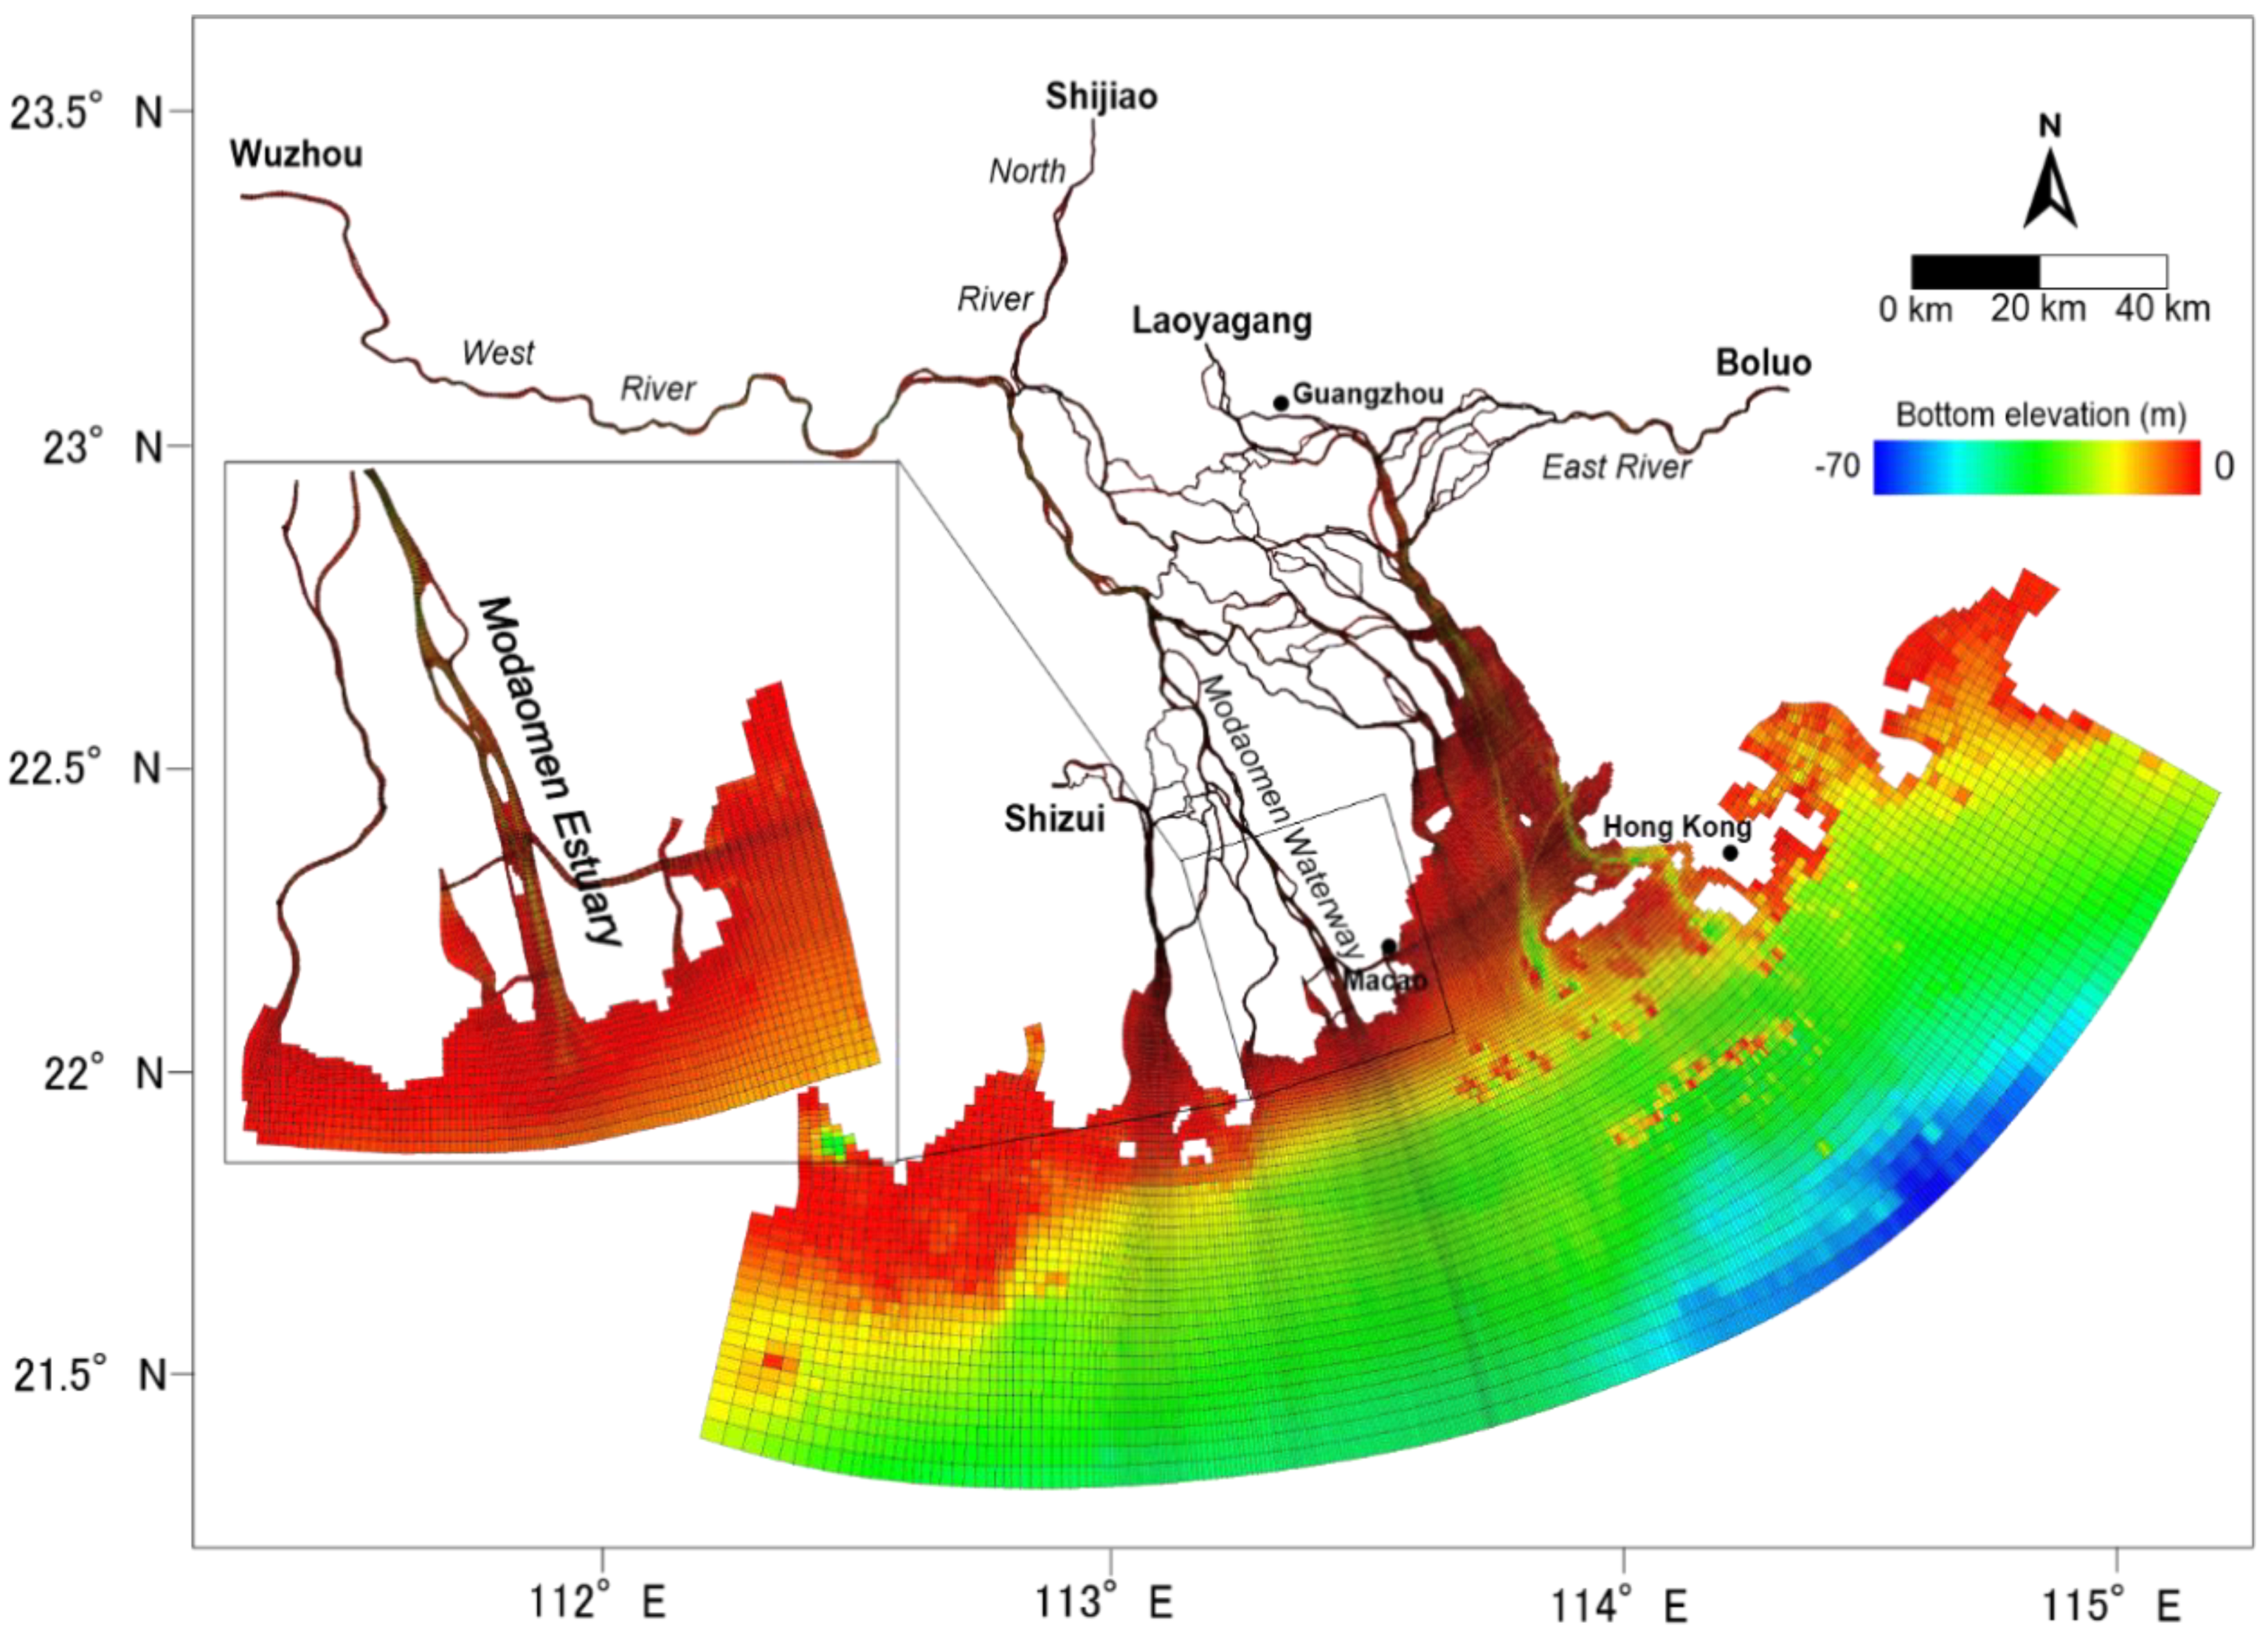
Figure 3 shows the grid and bottom elevations of the river-tide-salt dynamic model of the PRD. The inlet and outlet boundaries should be set at a sufficient distance from the ME to ensure that the effects of human activities on the boundaries are negligible. Thus, the model covered the entire Peal River network, as well as the coastal regions, including the ME. The upstream reached the Wuzhou (WZ) station of the West River, Shijiao (SJ) station of the North River, and Boluo (BL) station of the East River, and the downstream was extended approximately 70 m to the isobaths offshore. The eastern boundary was located close to 115.00° E, which covers Dapeng Bay and Daya Bay, and the western boundary was located near 112.20° E, covering the Guanghai Bay and Zhenhai Bay.
A curvilinear and orthogonal grid was used over the domain, and the grid of the ME region was refined. The grid sensitivity was tested. Initially, three sets of grids were prepared for the model, with the number of grids being 42,475, 75,341, and 132,873, respectively. The most sparse grid was discarded due to poor accuracy. The most dense grid took twice as long as the second set of grids, but the accuracy improvement was small. Therefore, the second set of grids was selected as the grid of the model. The spatial resolution ranged from 10 km in the offshore regions to 50 m in the area near the river channels, which was high enough to characterize the topography of the ME. Vertical sigma stratification was adopted, with the results of several model sensitivity tests indicating that the salinity transportation process in the estuary could be easily simulated. The calculation time was also within an acceptable range when 13 sigma layers were set in the model. The measured scattered topographic data from 2008 was mainly used for the interpolation of the bottom elevation grid, which was adjusted in the different simulation scenarios.
Daily water discharges were specified as the inflow boundaries at the WZ, SJ, and BL stations. The water levels observed during the same period were specified at other upstream boundaries (i.e., LYG and SZ stations). The water levels at the offshore open boundary were influenced by the tidal elevations provided by the TPXO models. The inverse simulation model of ocean tides proposed by Egbert and Erofeeva [
27], which uses eight principal tidal constituents (i.e., Q1, O1, P1, K1, N2, M2, S2, and K2) that account for most of the tidal energy in the South China Sea, was combined with the calibration of measured data for tidal harmonic analysis to obtain the hourly tidal-level process needed for the opening boundary of the downstream offshore sea. The incoming salinities at the offshore open boundary were specified as 34 ppt, which was also provided by WL-Delft Hydraulics [
28] and Gong et al. [
29]. The initial water level and velocity were each set to 0, and the initial salinity field was adopted as the salinity distribution after 60 d of model operation under the given boundary conditions.
2.3. Model Calibration and Verification
The hourly measured tide level data at the DHQ, GDJ, ZPS, and ZY stations and the hourly measured velocity and salinity data of the surface, middle, and bottom layers at the M1, M2, and M3 stations (from December 9th to 16th in 2009) were used to calibrate the model parameters. We found that the calculated results conformed to the measured data when the bottom roughness height was set to 2 mm.
The root-mean-square error (RMSE) and Nash–Sutcliffe efficiency coefficient (NSE) were used to assess the accuracy of the model. The RMSE of
n model data comparisons is defined as
The NSE of the modeled result is calculated as
where
D is the observational data,
is the mean of the observational data, and
M is the corresponding modeled data. Perfect agreement between the modeled results and observation will yield an NSE value of 1; an NSE value of 0 indicates that the predictions made by the model are equivalent to the mean of the observations. A negative NSE value suggests that the model is less predictive than the mean of observations, an NSE value close 1 indicates high model accuracy. Generally, levels for the model performance are categorized as >0.65: excellent; 0.65–0.5: very good; 0.5–0.2: good; and <0.2: poor.
As shown in
Table 1,
Table 2 and
Table 3, the RMSE of the tide level was 0.12 m, whereas the NSE was above 0.92. The RMSE of the velocity at stations M1, M2, and M3 ranged from 0.10 to 0.24 m/s, whereas the NSE ranged from 0.51 to 0.90. The RMSE of the salinity ranged from 0.8 to 2.0 ppt, whereas the NSE ranged from 0.42 to 0.76 ppt. These indicators suggest that the modeled results achieved a good performance.
The hourly measured-tide-level data at the DHQ, GDJ, ZY, DA, GZ, and MK stations; hourly measured-velocity data at the GDJ, TH, MK, and SS stations (from December 1st to 7th in 2016); and daily mean-salinity data at the DHQ, GDJ, ZPS, and ZY stations (from December 9th to 16th in 2009) were used to verify the precision of the model. The results show that the average RMSE of the tide level was 0.13 m, the average RMSE of the velocity was 0.08 m/s, and the NSE of both was 0.90. The RMSE of the salinity was less than 1.0 ppt, whereas the NSE was over 0.74. The detailed calibration and verification process of the model is presented by Liu et al. [
22]. The calculated results of the model are in agreement with the measured data in both the calibration and verification processes, indicating the good performance of the model for simulating the river-tide-salt dynamics of the ME.
2.4. Design of the Numerical Simulation
To exclude the effects of the flow changes on saltwater movement, constant discharges of 2900 m
3/s at the WZ station, 600 m
3/s at the SJ station, and 400 m
3/s at the BL station were used as the upstream boundaries. These discharges were chosen because they are the perennial average discharges of the PRD during the dry season between 1950 and 2016. The open boundary of the downstream was set to the two-month tide cycle, with a constant salinity of 34 ppt. Wind and waves are ignored in this study. As shown in
Table 4, based on the measured data of the PRD river network in 2008, three scenarios were simulated to quantify the potential influence of human activities on the change in the ME riverbed topography. The pre−EROP case was based on coastlines during the 1970s and the bathymetry map of the ME from 1977. The transition case was defined as a scenario to quantitatively evaluate the impact of land reclamation on saltwater transportation, using the coastlines from 2010 but with the same bathymetry as that of the pre−EROP case. The present case was defined as a simulation that quantitatively evaluates the impact of riverbed downcutting on saltwater transportation. The comparison between the present case and the pre−EROP case illustrates the importance of the changes in the shorelines and downcutting, thus further elaborating the significant influence of the change in the riverbed topography on the hydrodynamic structures in the ME.
3. Results
3.1. Changes in Hydrodynamic Structures
Figure 4 and
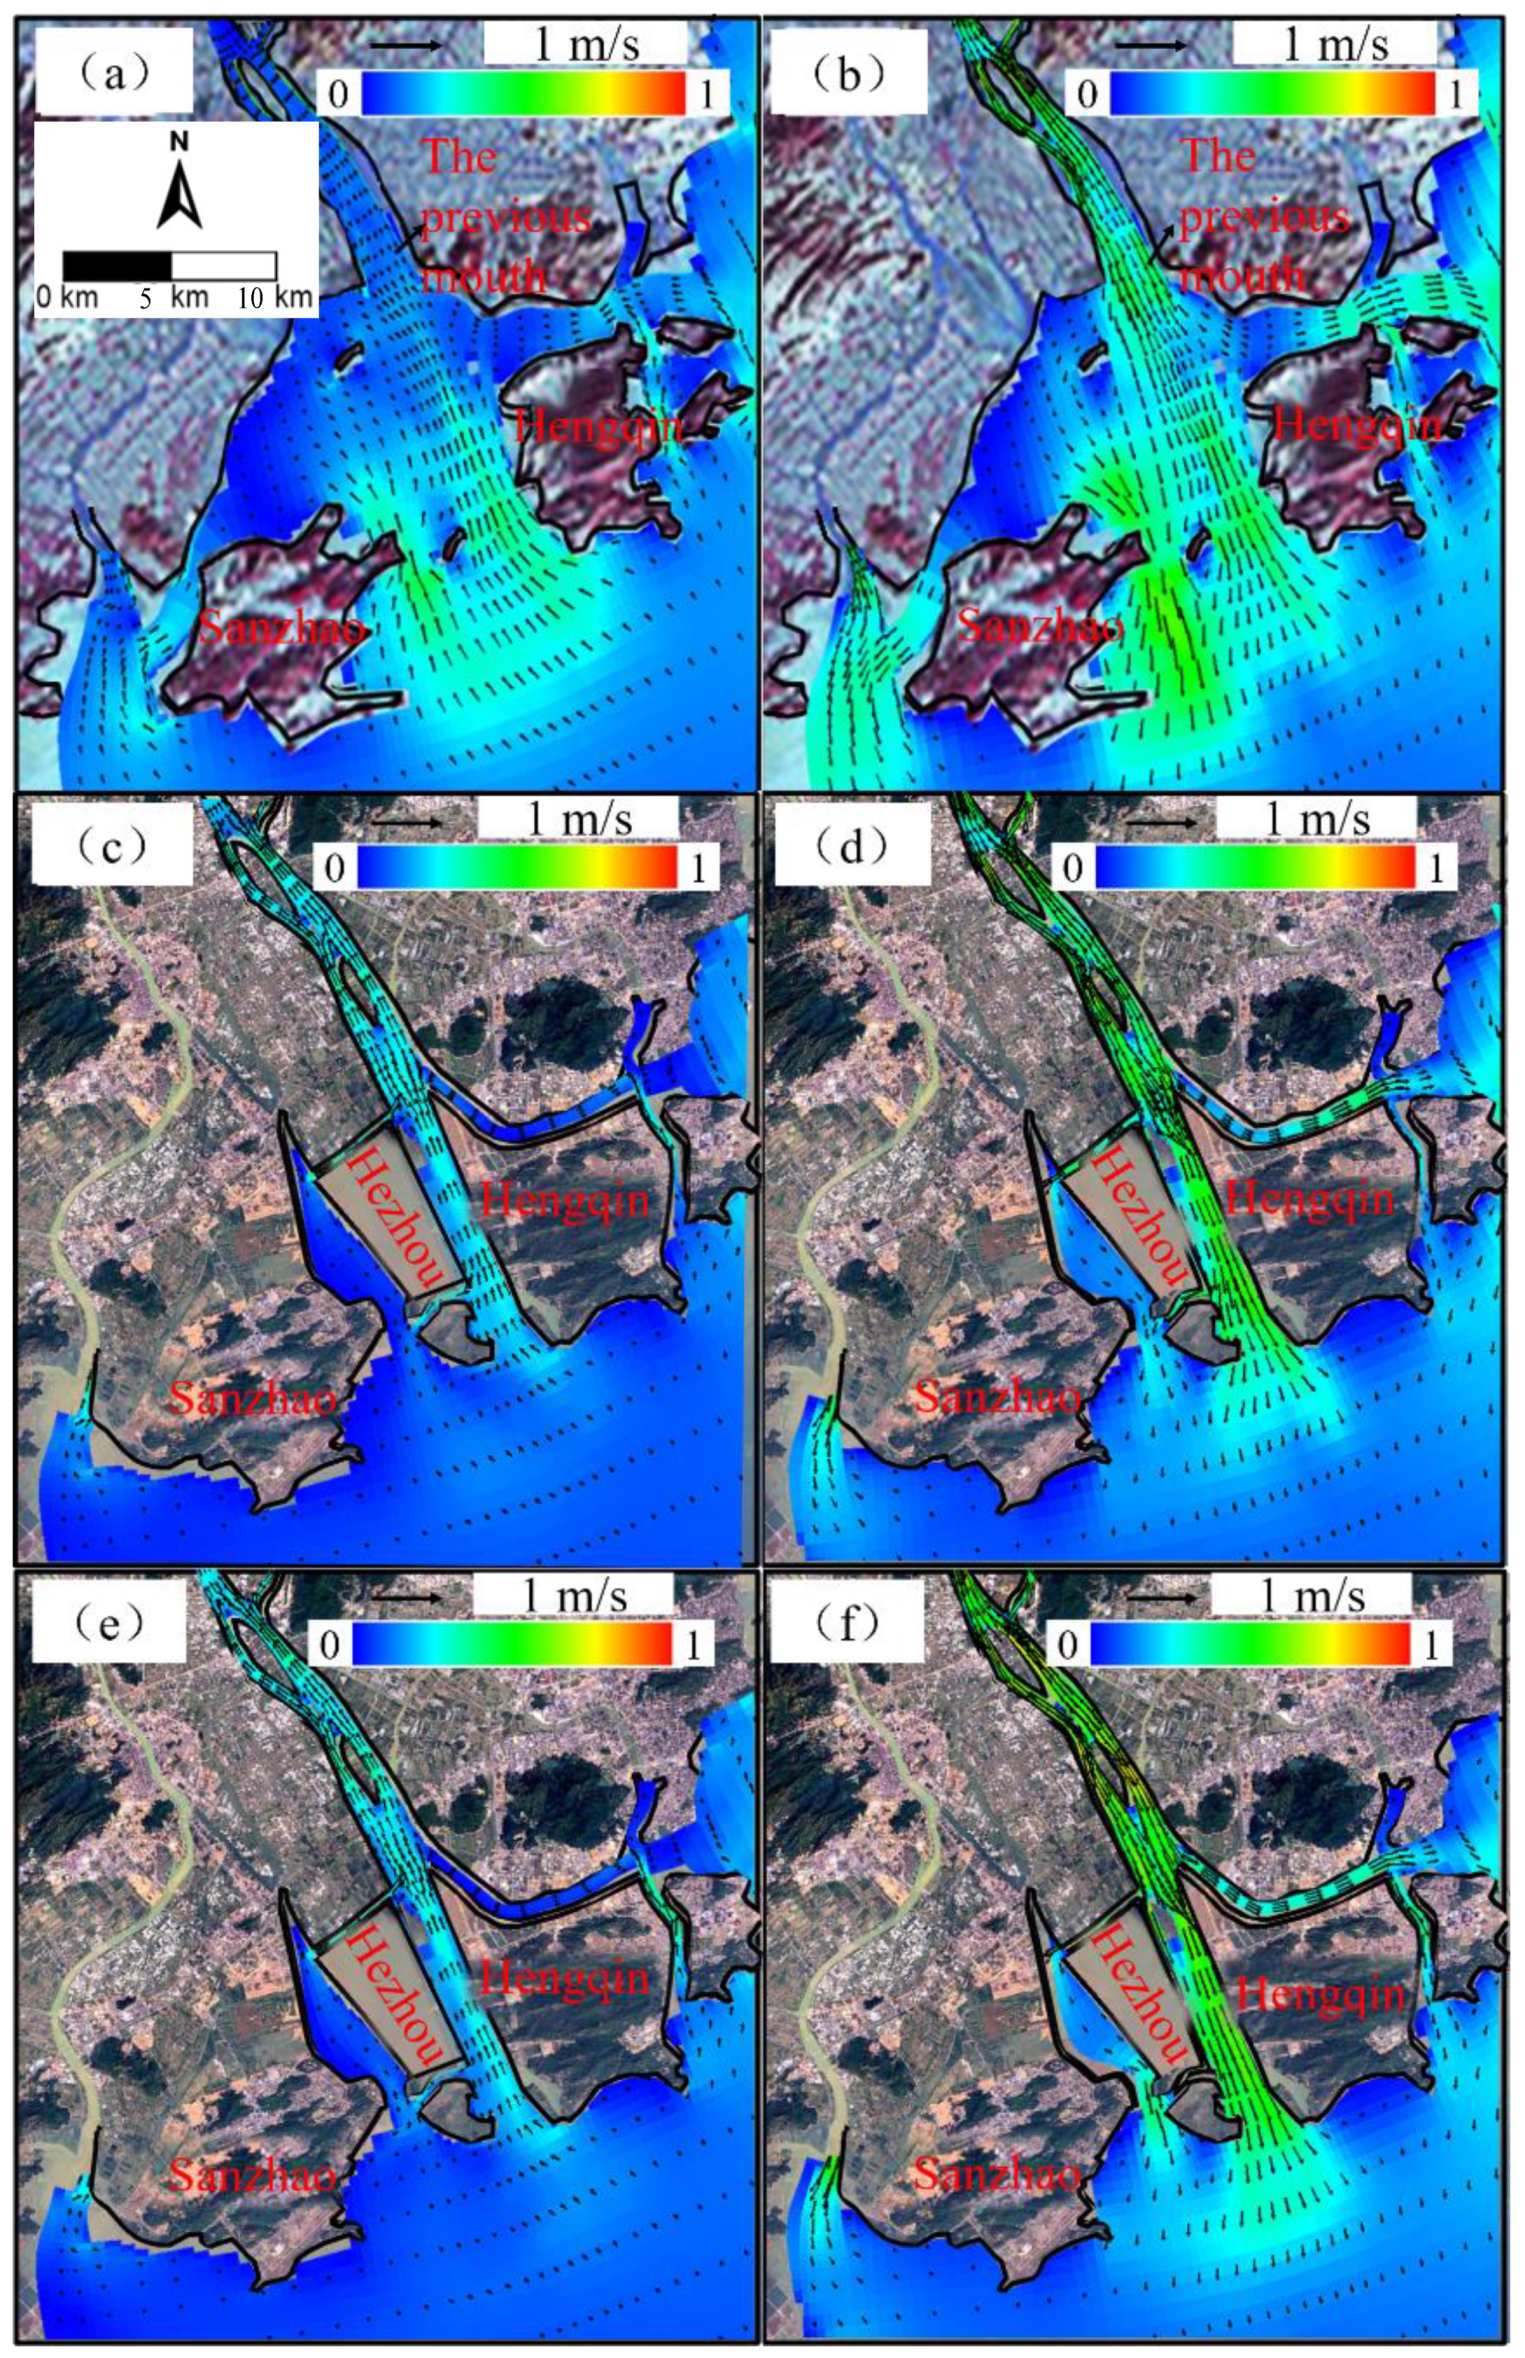
Figure 5 show the distributions of the depth-averaged velocity in the ME of the neap and spring tides. There are distinguishable high-velocity zones during flood-tide periods and ebb-tide periods in the neap tides of the pre−EROP case. They are located between Sanzao Island and the mainland, between Sanzao Island and Hengqin Island, and between Hengqin Island and the mainland (
Figure 4a,b), representing the four typical tidal channels of the ME. The neap-tide velocity is landward during the flood-tide periods, with a 0.1–0.4 m/s velocity, and the neap-tide velocity is seaward during the ebb-tide periods, with a 0.2–0.5 m/s velocity. The maximum flow during flood-tide and ebb-tide periods at the previous mouth in the ME ranged from 2900 to 3200 m
3/s.
For the transition case (
Figure 4c,d), Sanzao Island was connected to the mainland as a result of an important tidal channel in the ME being blocked by the land reclamation at Sanzao Bay. Due to the presence of an embankment and land reclamation at Hezhou, the two tidal channels between Sanzao Island and Hengqin Island were transformed into a narrow Modaomen Waterway. The narrow coastlines caused the tidal current velocity to increase by approximately 15% to 0.3–0.5 m/s, with the original wide high-velocity area being reduced by more than 75%. The land reclamation zone between Hengqin Island and the mainland narrowed at the Hongwan channel, resulting in a slight increase in the current tidal velocity and a decrease in the area of the high-velocity zone. In general, compared to the pre−EROP case, the reclamation in the transition case increased the morphological resistance of the ME, which was not conducive to the upstream propagation of tidal waves. During neap tides in the ME, the ebb-and-flow volume decreased to 2200–2700 m
3/s—a reduction of approximately 20%.
In the present case (
Figure 4e,f), riverbed downcutting reduced the riverbed resistance in the ME, leading to a significant increase in the flood-tide and ebb-tide velocities in the tidal channel. Compared to the transitional case, the flood-tide and ebb-tide velocities in the ME increased by 25–30%, reaching 0.4–0.6 m/s. Riverbed downcutting also increased the channel volume and strengthened the tidal capacity of the ME. Therefore, the discharge of the ME increased rapidly to 4250–4350 m
3/s, which is significantly higher than in the transitional and pre−EROP cases. These results indicate that the influence of riverbed downcutting on tidal dynamics in the ME was greater than the weakening effect of land reclamation.
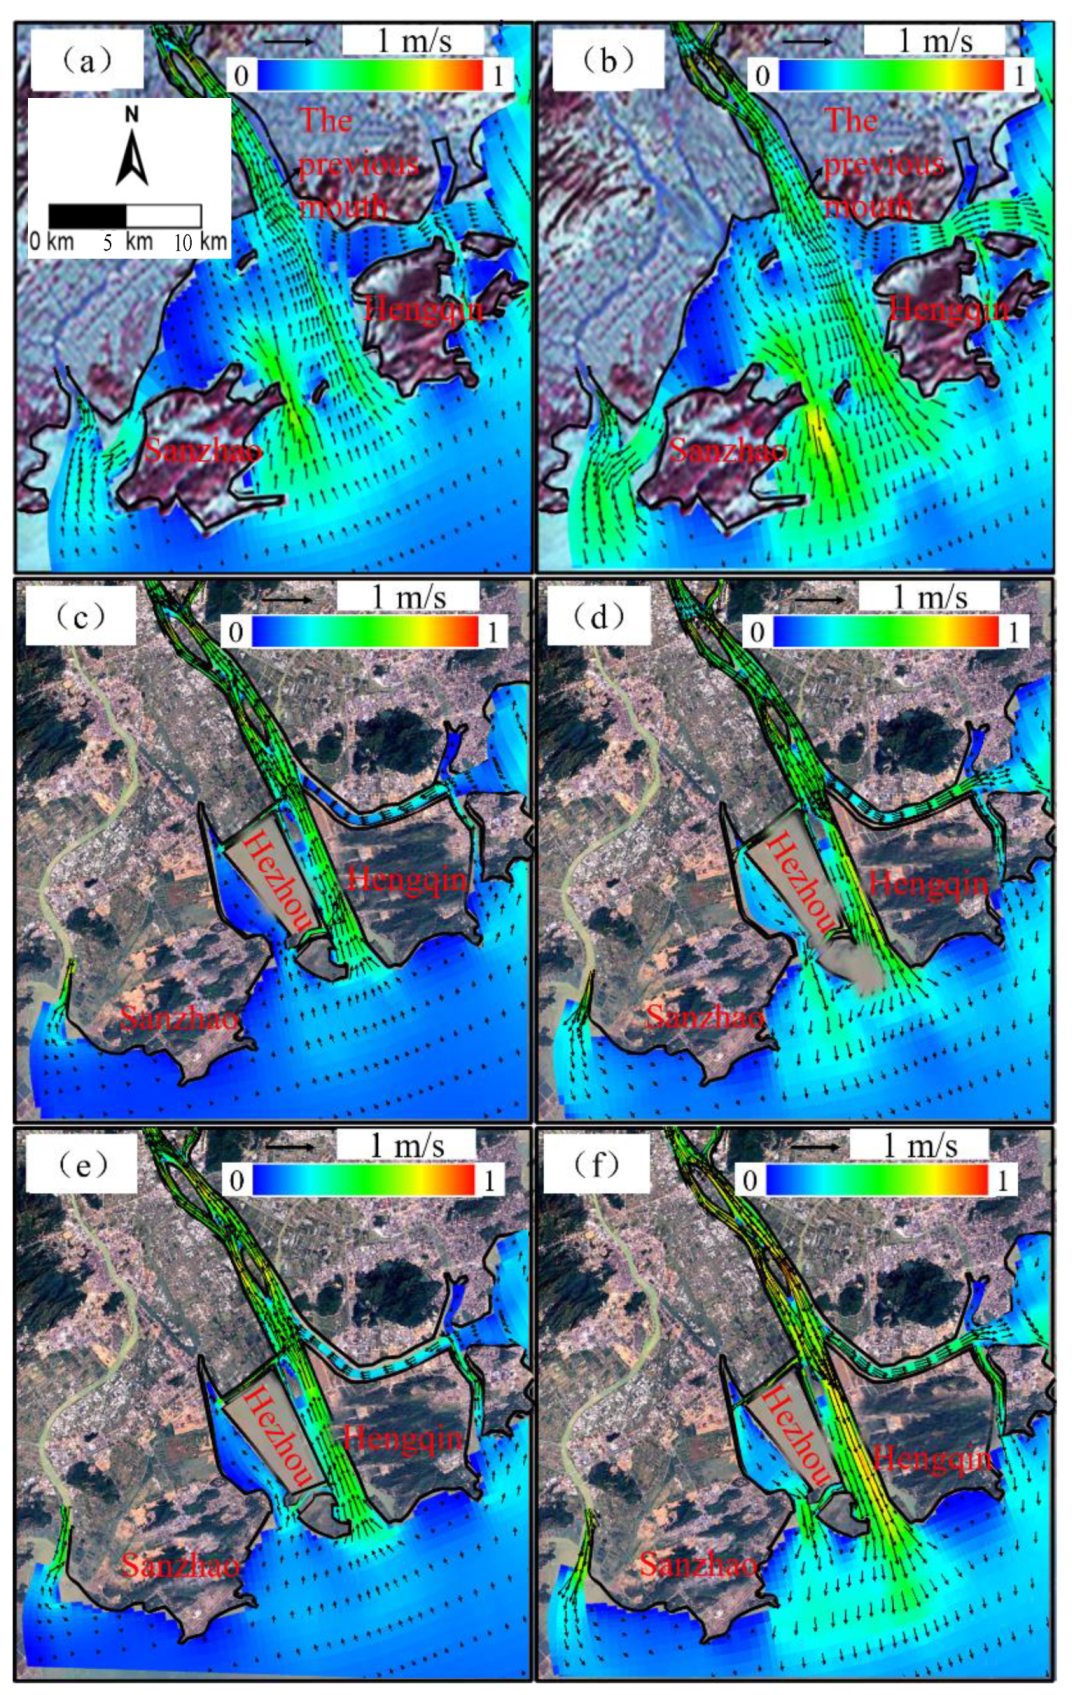
As shown in
Figure 5, the tidal dynamics in the ME were significantly enhanced during spring tides. In the same scenario, the flood-tide and ebb-tide velocities in the tidal channel were 0.1–0.2 m/s higher than that of the neap tides, and the corresponding flood-tide and ebb-tide flow discharges were 1.4 times higher. Similar to the impact of human activities during neap tides, land reclamation in the transition case greatly weakened the tidal dynamics during spring tides in the ME. Compared to the pre−EROP case, the Modaomen Waterway had a 15% increase in flood-tide and ebb-tide velocities due to section contraction, but the flood-tide and ebb-tide discharges decreased from the 4500–5300 m
3/s range to the 3700–4450 m
3/s range—a decrease of 18%. In the present case (
Figure 5e,f), riverbed downcutting significantly increased the flood-tide and ebb-tide velocities during spring tides in the ME. The velocity of the Modaomen Waterway increased to 0.9–1.0 m/s—an increase of 25–30%—and that of the Hongwan Waterway increased to 0.4–0.5 m /s—an increase of 20–30% (
Figure 5c,d). Meanwhile, the flood-tide and ebb-tide discharges during spring tides in the present case significantly increased to 7700–7900 m
3/s, which is twice that of the transitional case and 50% higher than that of the pre−EROP case. Consistent with the analysis of neap tides, the comprehensive influence of human interventions (i.e., land reclamation and riverbed downcutting) has enhanced tidal dynamics during spring tides in the ME.
3.2. Changes in Profile Hydrodynamic Structures
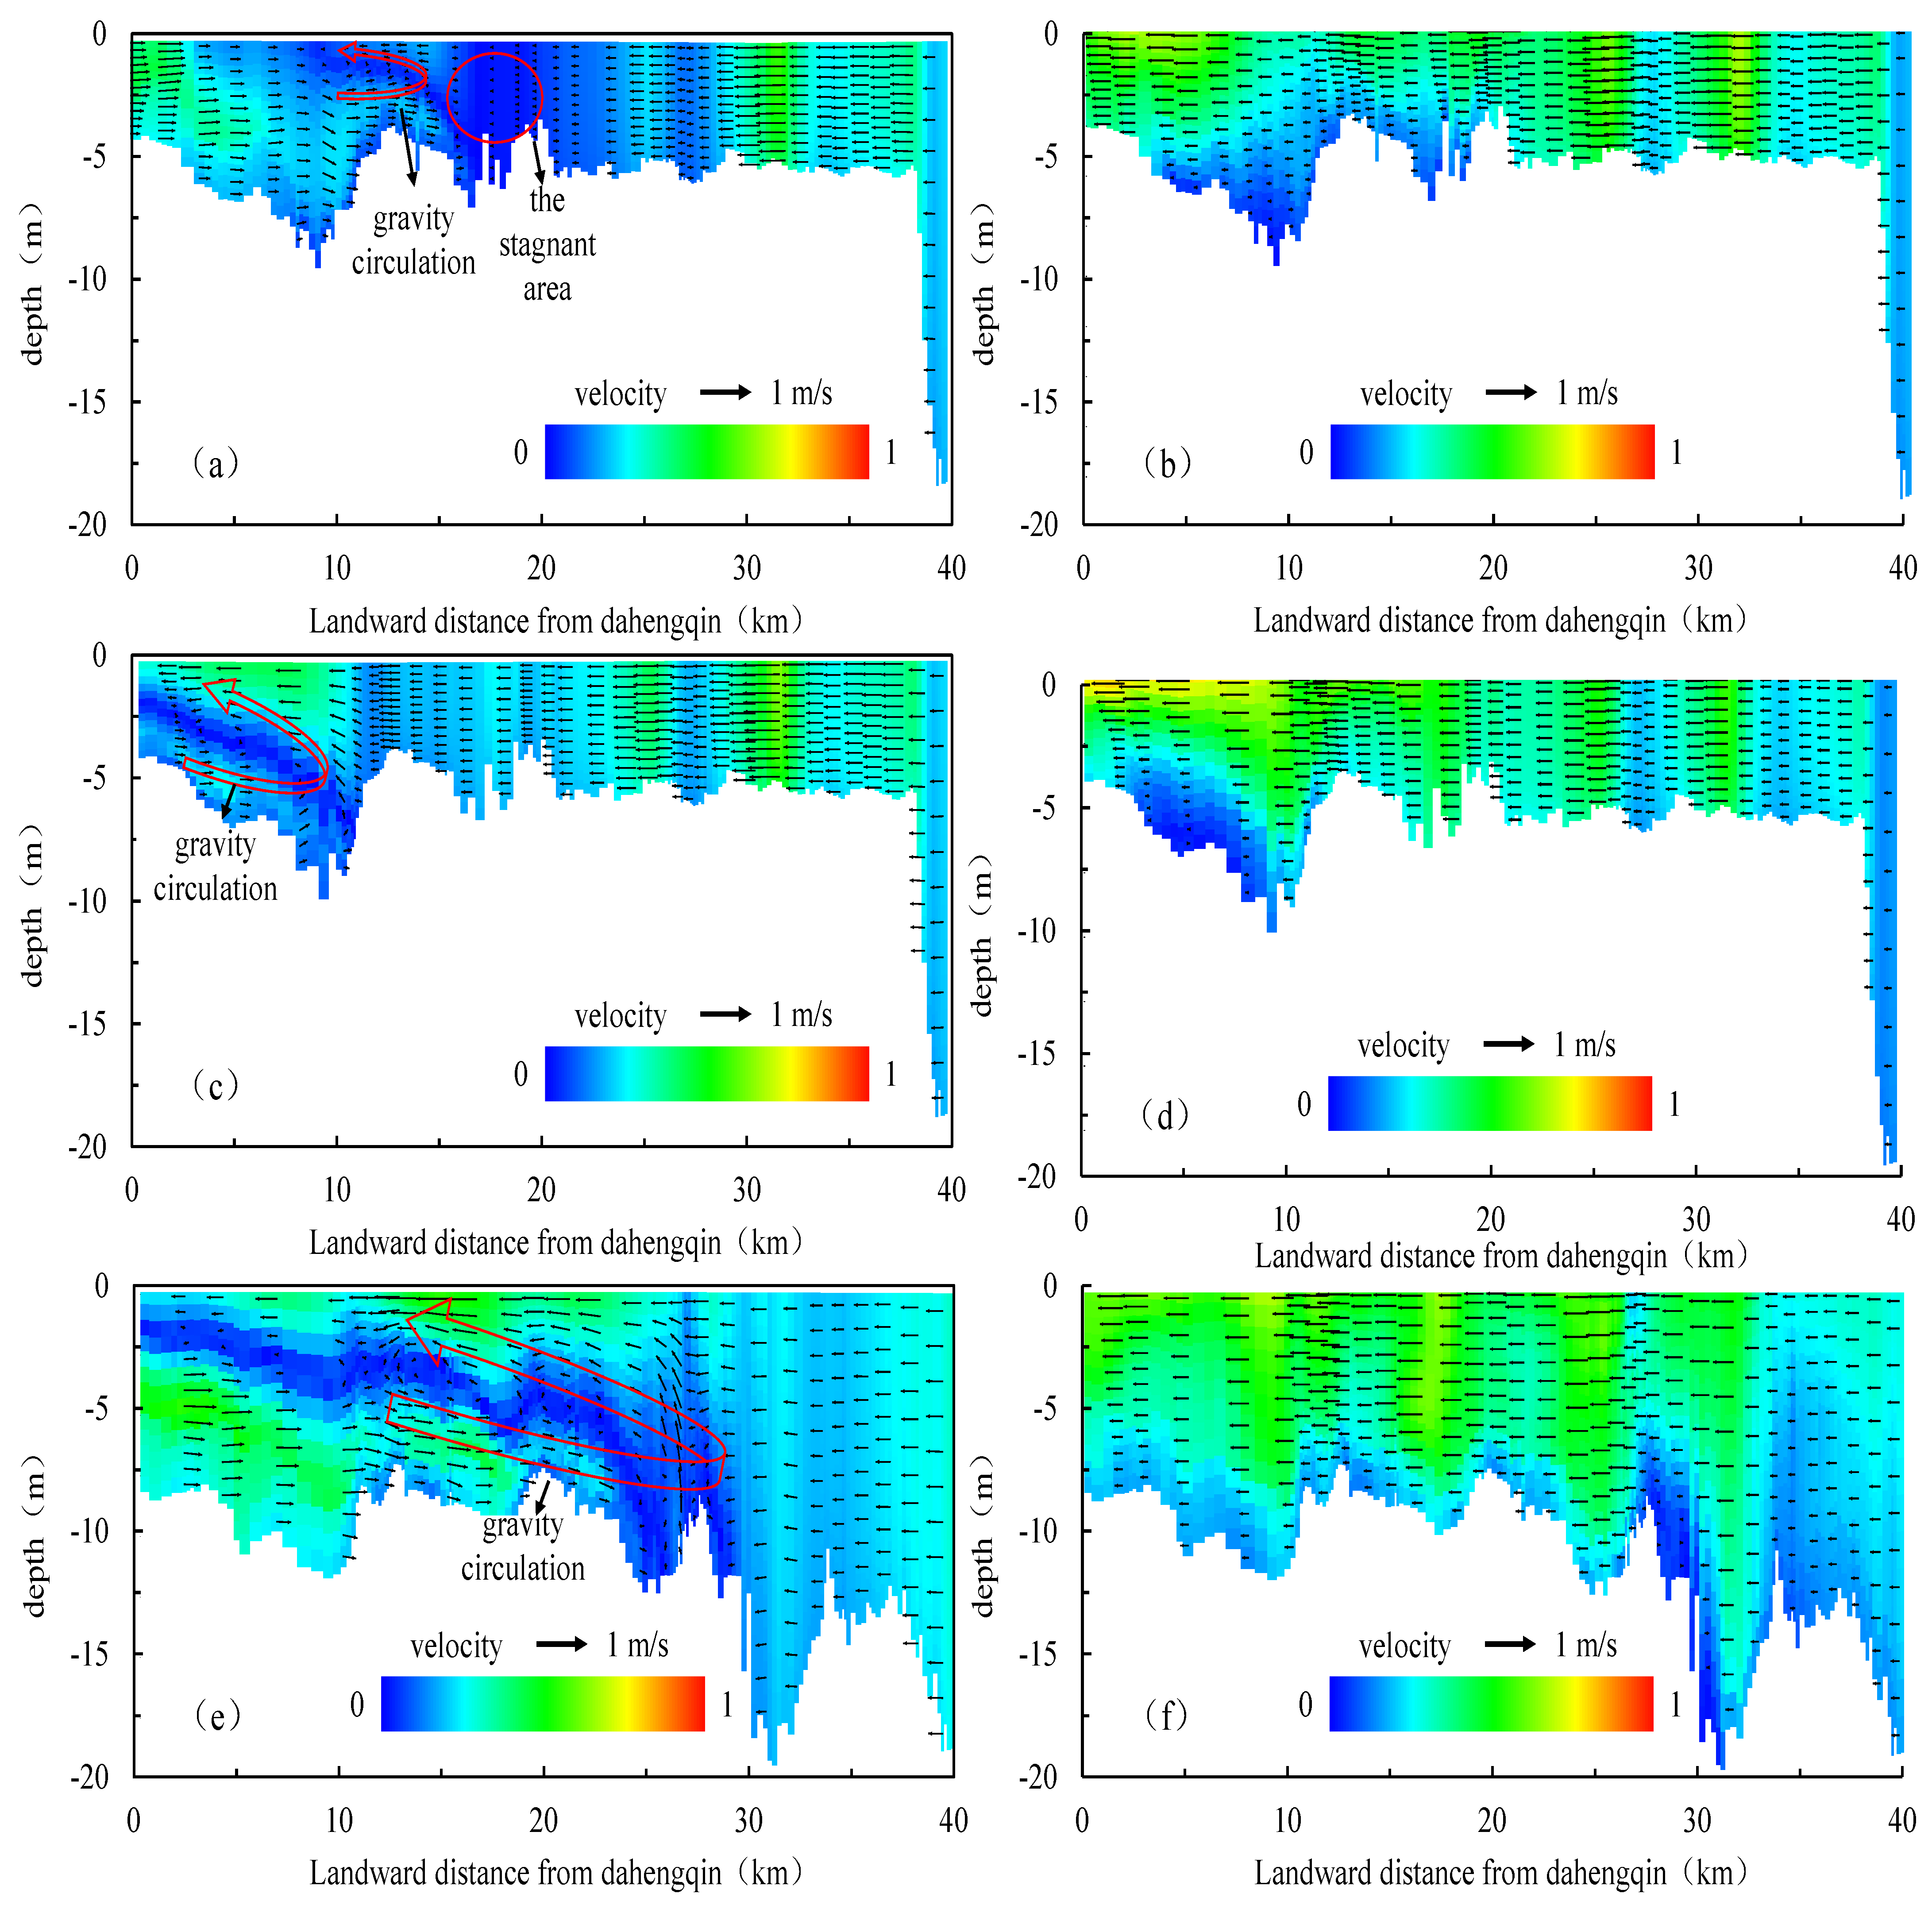
Figure 6 and
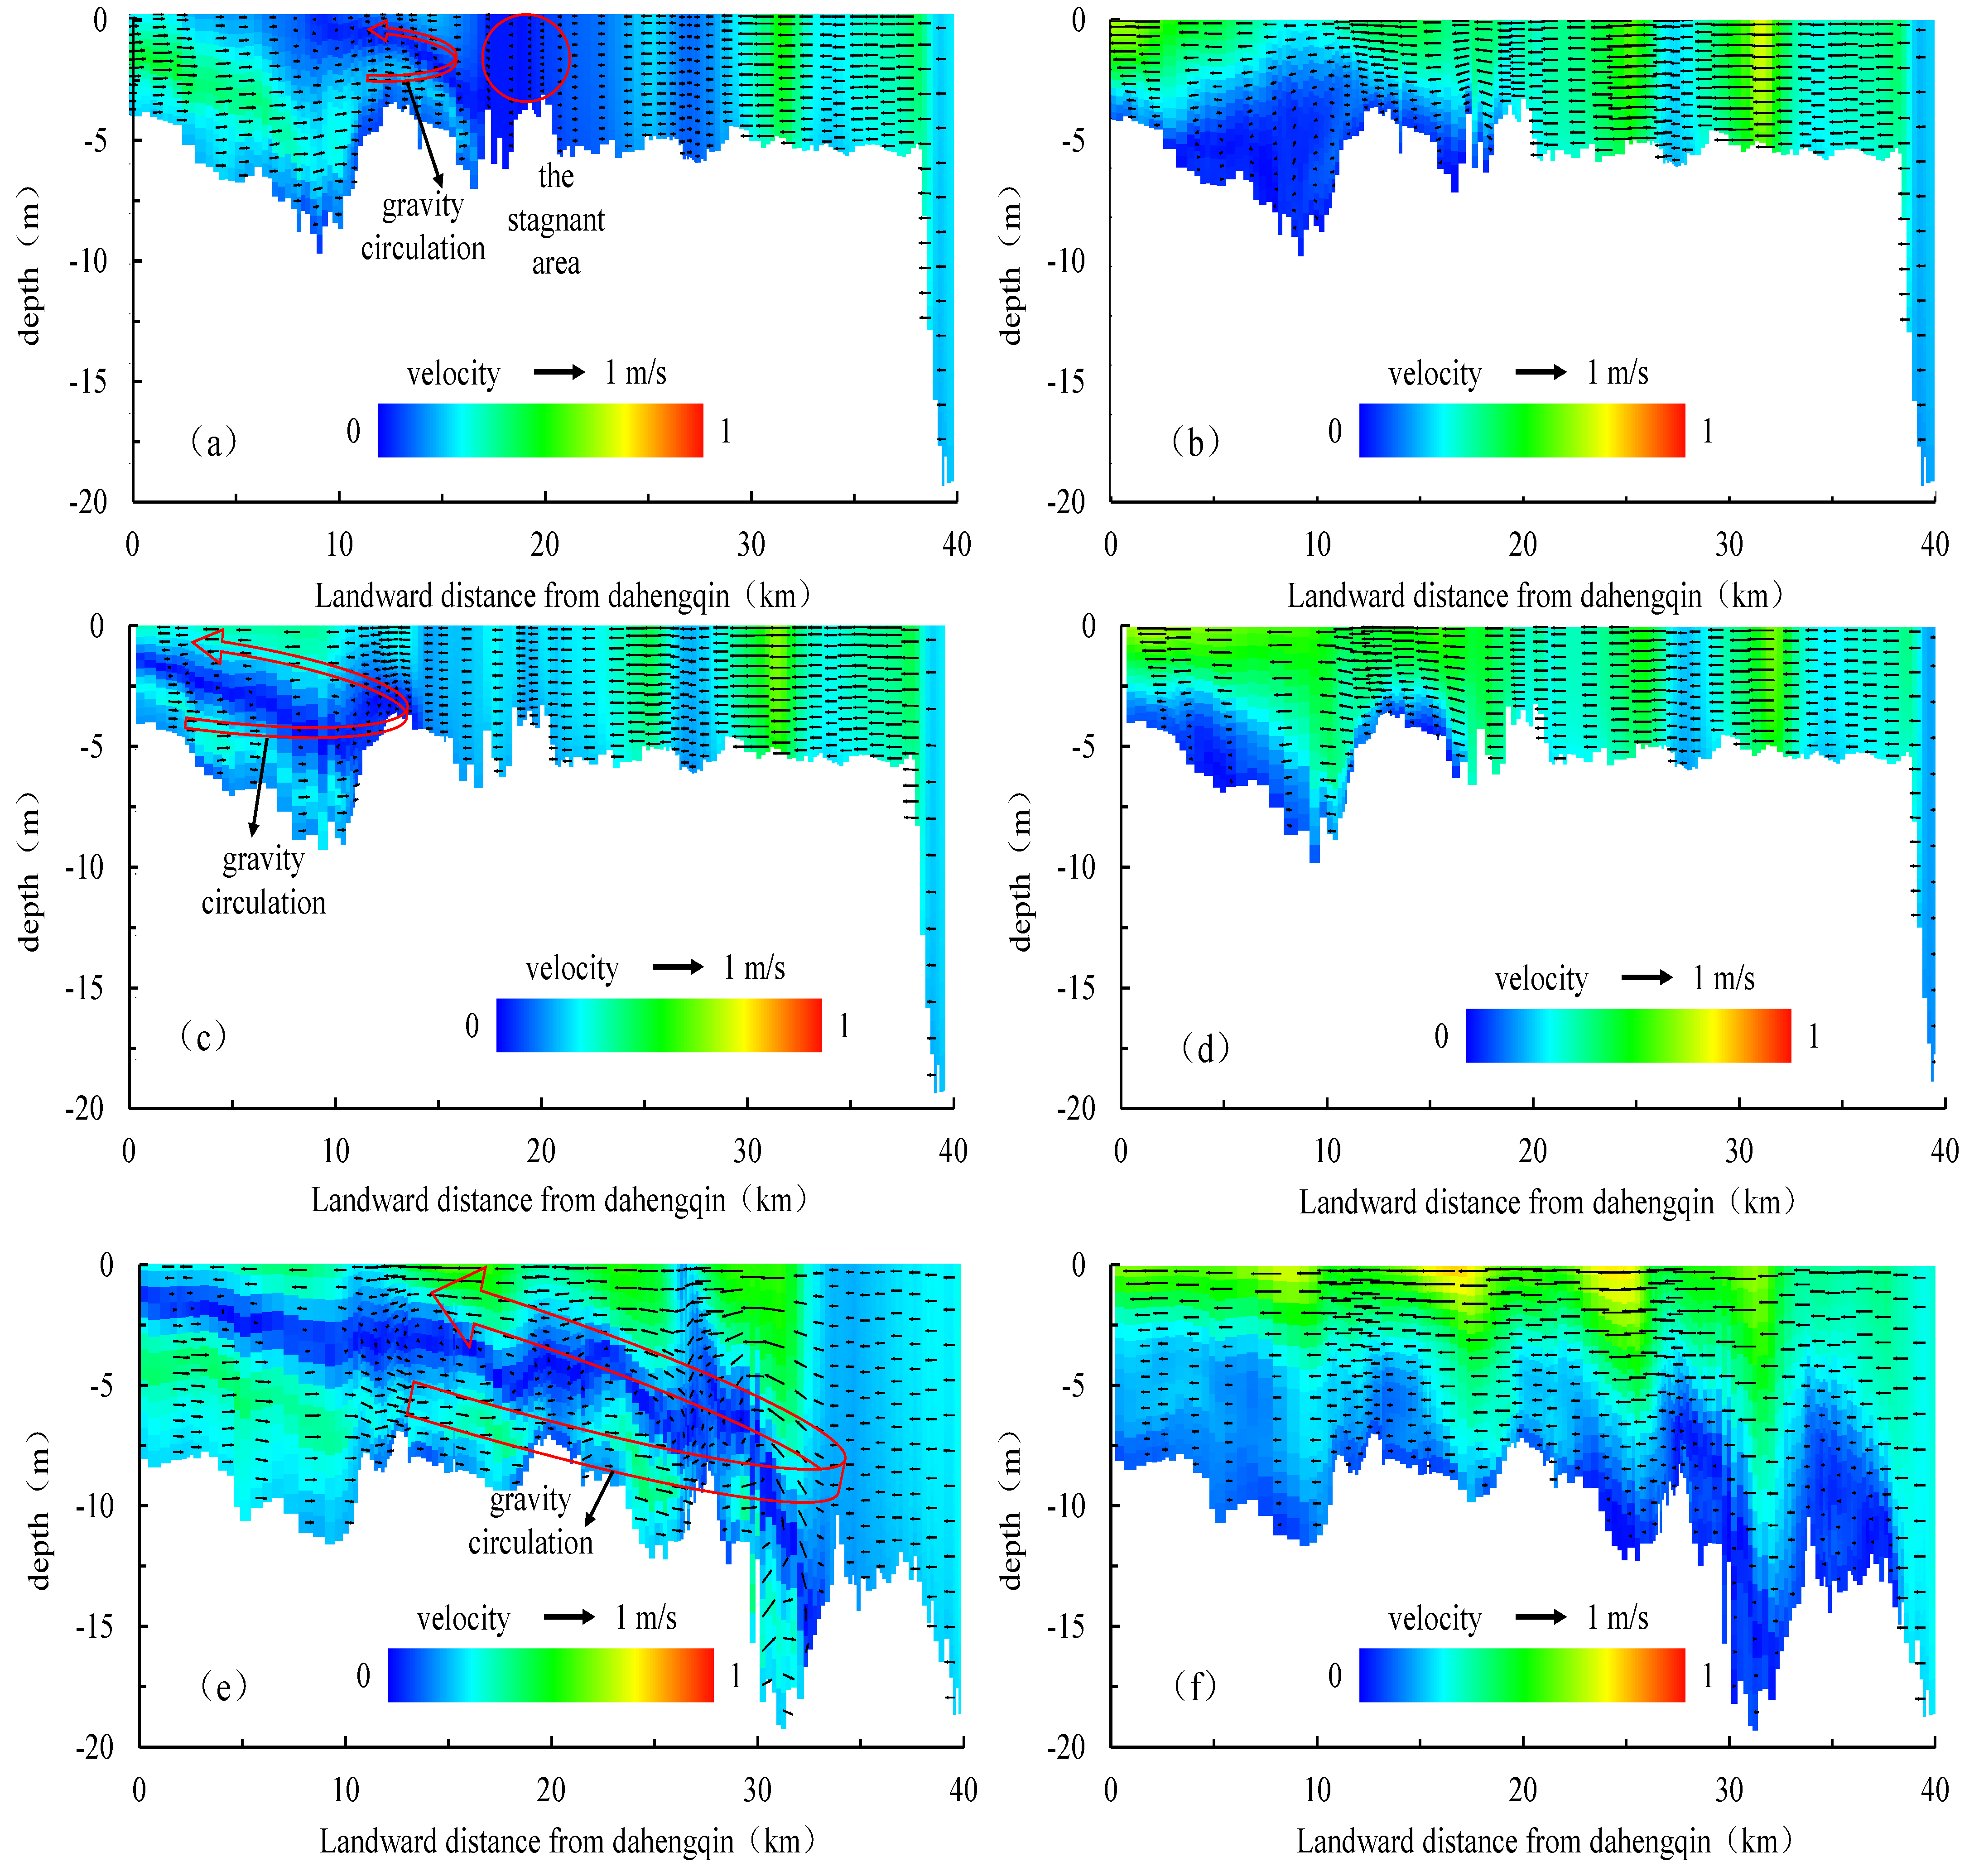
Figure 7 show the velocity distributions along the longitudinal section of the ME of the neap and spring tides, respectively. Due to the density difference in the water bodies at the estuarine salt–freshwater junction, the flow often exhibited noticeable stratification during the flood-tide periods. The freshwater, which is located on the surface, drained toward the sea due to its lower density, whereas the saltwater with higher density flowed landward with the flood tide along the bottom of the channel. The salt-freshwater junction is inclined upstream, with the saltwater at the junction being mixed upward and diluted at the surface, after which it is discharged to the sea, forming a gravity circulation on the longitudinal section of the estuary.
As shown in
Figure 6, there was no obvious stratification in the flood-tide velocity downstream of the ME during the neap tides in the pre−EROP case, which is attributed to sufficient mixing of the salinity of the ME and the low density between the bottom and surface water (
Figure 8, left panel). At the old mouth (near the GDJ station), the surface velocity was seaward, whereas the bottom velocity was landward, forming an insignificant gravity circulation with a very small scale. A noticeable stagnant area was formed when the flood-tide saltwater encountered the freshwater in the middle reaches of the estuary, and the current velocity in the stagnant area dropped to approximately 0. The salinity was mainly mixed through diffusion. During the ebb-tide periods, the weak gravity circulation in the old mouth diminished due to the seaward surface and bottom velocities. Moreover, the surface velocity was greater than the bottom velocity.
The velocity distribution along the longitudinal section was adjusted in the transition case (
Figure 6c,d). The tidal dynamics in the ME were weakened, whereas the salinity stratification was increased due to land reclamation (
Figure 8, middle panel). Velocity stratification occurred downstream of the ME during flood-tide periods in neap tides due to the difference in the vertical density, seaward surface velocity, and landward bottom velocity. The velocity at the interface was approximately 0. Significant gravity circulation was created in the 15 km upstream section of the DHQ. However, during the neap ebb, the bottom velocity was gradually adjusted to the seaward direction, resulting in the disappearance of the estuarine circulation. The ebb-tide velocity after land reclamation in the ME waterway increased compared to that during the 1970s, showing consistency with previous results.
In the present case (
Figure 6e,f), riverbed downcutting led to the enhancement of the tidal dynamics in the ME. An increase in the saltwater intrusion length during neap-tide periods in the transition case resulted in a larger water depth, which significantly affected the surface and bottom salinity (
Figure 8, right panel). Thus, during flood tide during the neap-tide periods in the present case, the low-salinity water on the surface of the ME continued to flow seaward, whereas the high-salinity water at the bottom continued to invade the land. The velocity stratification and the scale of gravity circulation were increased significantly. The spatial scale of gravity circulation was close to 35 km, almost covering the whole ME, which was more than twice the gravity circulation scale in the transition case.
The velocity distributions along the longitudinal section in the ME of the spring tides are shown in
Figure 7. Consistent with the impact of human activities during the neap-tide periods, land excavation weakened the tidal mixing effect during the spring-tide periods in the transition case, which enhanced the salinity stratification (
Figure 9, middle panel). Moreover, the velocity showed significant stratification downstream of the ME. The surface water flowed to the sea, whereas the bottom water flowed to the land. Therefore, a typical gravity circulation was created 10 km upstream of the DHQ. During the ebb tide, the velocity at the surface and the bottom were adjusted seaward, resulting in the disappearance of the gravity circulation. However, the ebb-tide velocity increased compared to that during neap tide under the same conditions, with riverbed downcutting weakening the resistance of the ME. During the spring tide, the gravity circulation scale was still larger in the present case than in the transition case. The spatial scale of gravity circulation was nearly 30 km, covering 3/4 of the length of the ME. During the ebb-tide periods in the spring tide, the velocities were seaward and were higher than those in the transition case, resulting in the disappearance of gravity circulation. Compared to the neap tide, the scale of gravity circulation in the ME during spring tide was significantly smaller under the same conditions, but both were shortened by approximately 5 km in the transition and present cases.
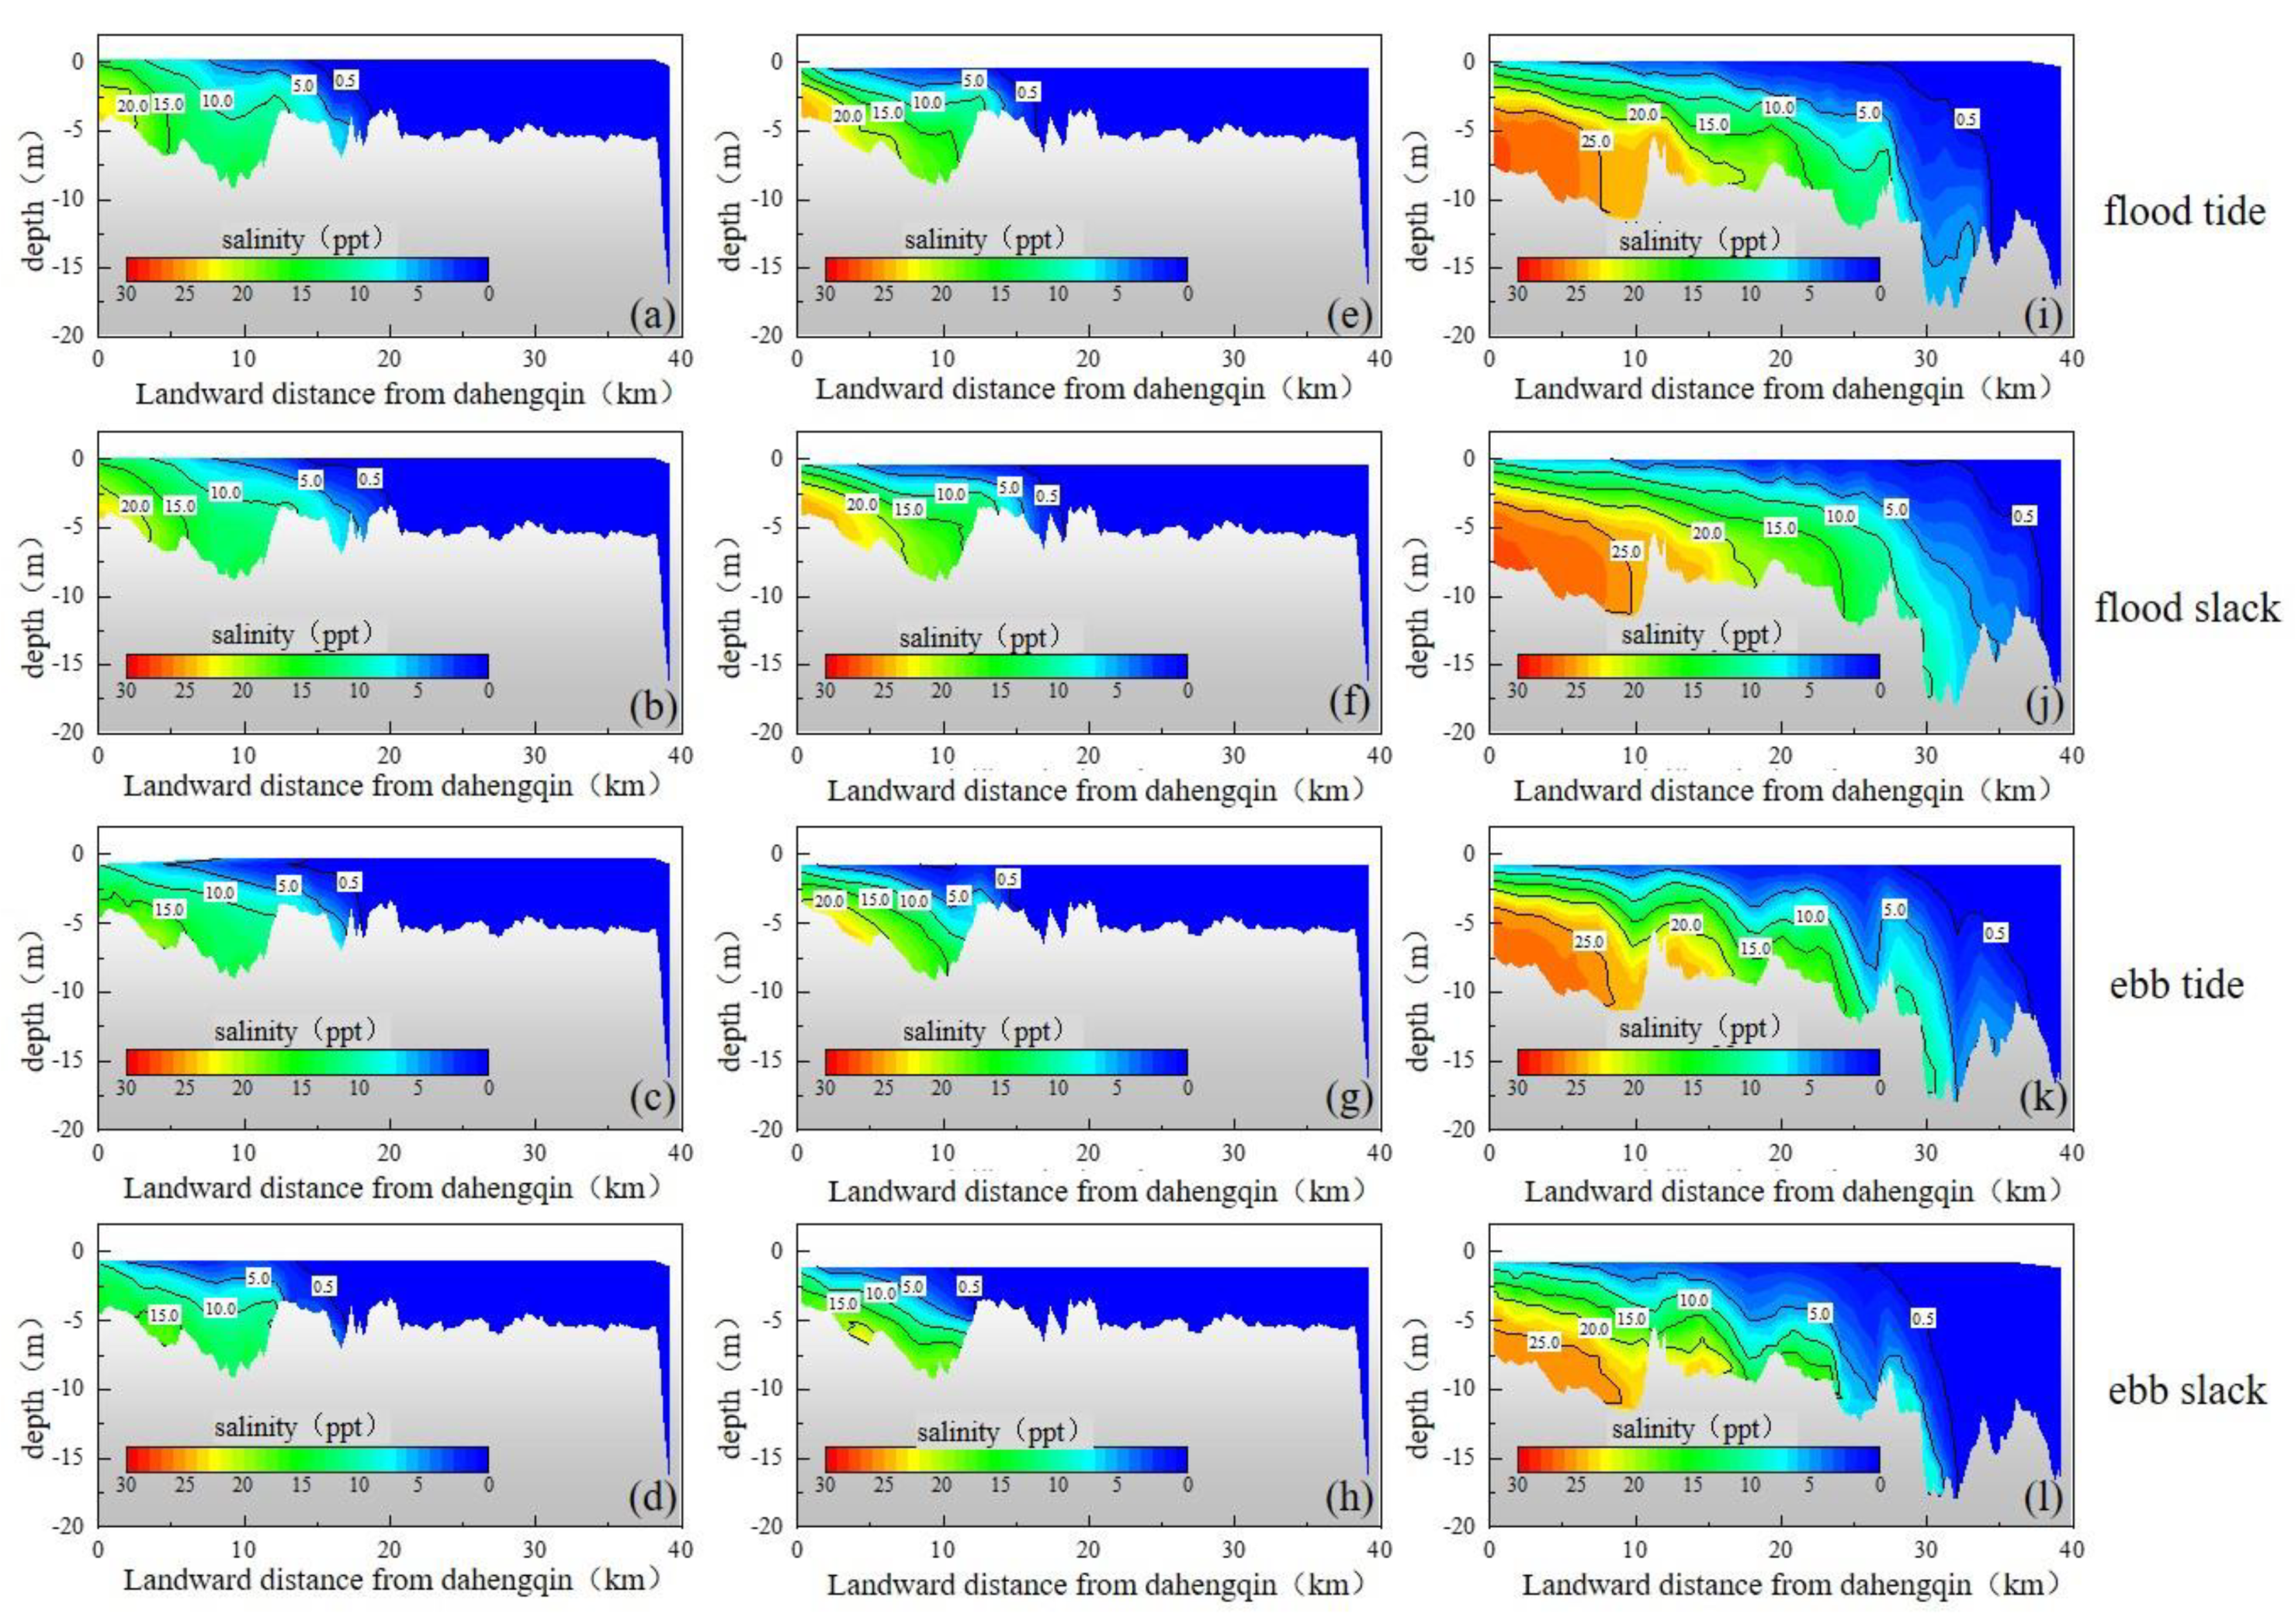
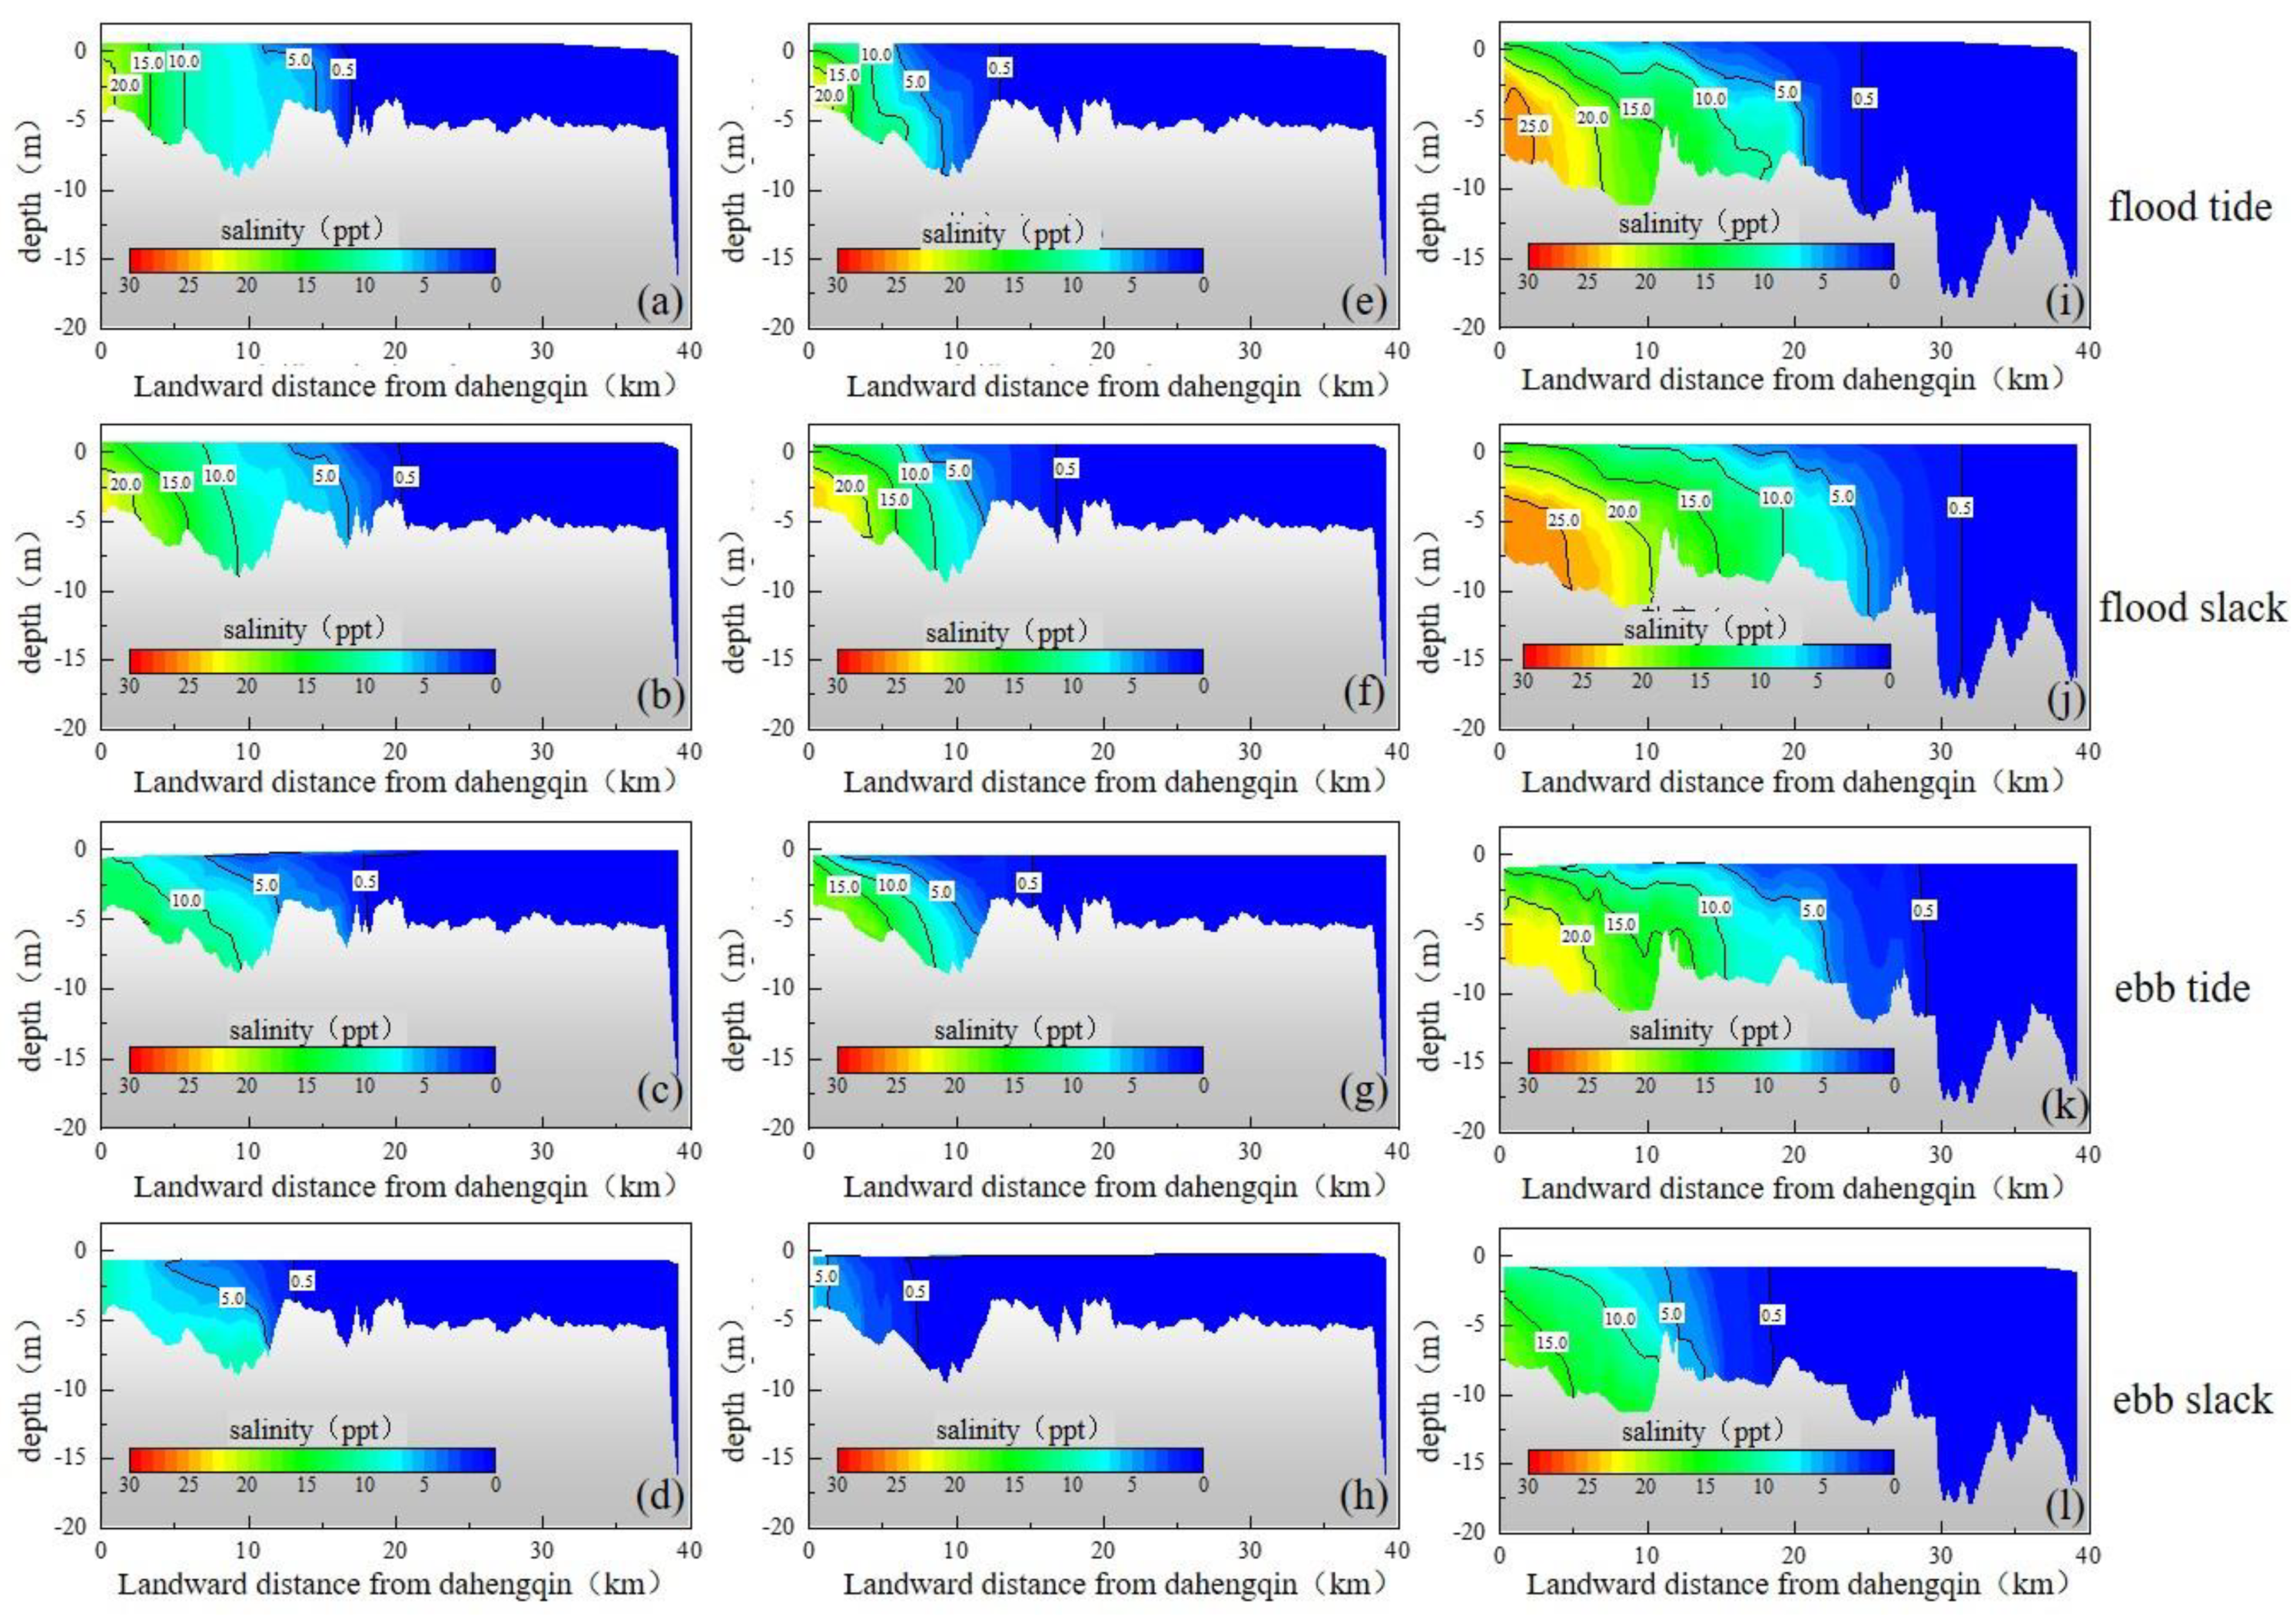
3.3. Changes in Vertical Stratification
The formation and development of gravity circulation in estuaries is closely related to salinity stratification. In this section, the impact of human activities on the salinity stratification in the ME and its relationship to the variation in gravity circulation will be further discussed.
Figure 8 and
Figure 9 show the salinity distributions along the longitudinal section in the three cases of the ME of the neap and spring tides, respectively. During both the spring and neap tides, salt was transported to the land during the flood tide, with salt intrusion being the most intense at flood slack. However, salt was expelled from the estuary during the ebb-tide periods. The salinity decreased, and minimal salt intrusion occurred at the ebb slack.
During the neap tide, the estuary was mainly in a partially stratified state during the pre−EROP case. The ratio of the salinity difference between the surface and the bottom to the depth-averaged salinity (Sp) was between 0.2 and 0.8, with a large angle between the salinity isohaline and horizontal direction (
Figure 8, left panel). Salinity mixing was relatively sufficient downstream of the ME, and the salinity difference between the surface and the bottom was not sufficient to form gravity circulation. However, there was a distinct salinity difference between the surface and the bottom of the old mouth, resulting in weak gravity circulation during the flood tide.
However, due to the reduction in the tidal mixing effect caused by land reclamation, the tidal dynamics and mixing effect were weakened. During the neap tide, the SP increased to 1.1–1.3, and the salinity changed to a highly stratified state. The salinity isohaline became nearly horizontal, and a characteristic salt-wedge type was displayed at the lower estuary 18.5 km from the DHQ station (
Figure 8, middle panel). The significant difference in salinity between the surface and bottom of the salt wedge contributed to significant gravity circulation in the ME (
Figure 6c). Moreover, the bottom salinity front extended landward significantly, whereas the surface salinity front (0.5 ppt isohaline) retreated by approximately 6.0 km. These results indicate that land reclamation increased salinity stratification and decreased salt intrusion, which is consistent with the results of the weakening impact of land reclamation on the tidal dynamics in the ME discussed in
Section 3.1.
In the present case, the estuary is highly stratified, with an Sp greater than 1 and a horizontal isohaline (
Figure 8, right panel). For the transition case, the gravity circulation in the estuary was greatly enhanced, owing to the existence of the salt wedge. The roughness of the riverbed was also weakened due to riverbed downcutting, leading to the exacerbation of saltwater intrusion in the ME. The surface and bottom salinities increased by approximately 5 ppt. Moreover, the salinity fronts were extended landward significantly by 10–20 km. The salt wedge extended landward significantly over a distance of 40 km, leading to the exacerbation of gravity circulation. This result also confirms that tidal dynamics and saltwater intrusion were intensified due to the combined influence of human activities [
30].
During the neap tide of the spring tide, there is a similar impact on the salinity stratification in ME. Due to large-scale land reclamation, salinity stratification was intensified, whereas saltwater intrusion was weakened (
Figure 9, middle panel). The typical gravity circulation was also formed downstream of the ME (
Figure 7c). Moreover, riverbed downcutting intensified salinity intrusion (
Figure 9, right panel), leading to a salt wedge filling 3/4 of the length of the estuary. Compared to the transition case, the longer salt wedge contributed to a larger-scale gravity circulation (
Figure 7e). During the spring tide, the greater tidal range enhanced the tidal mixing effect but weakened salinity stratification. The Sp in the pre−EROP, transition, and present cases decreased to 0.02–0.4, 0.1–0.7, and 0.5–0.8, respectively. Furthermore, the saltwater intrusion during the spring tide was weaker than that during the neap tide in both the transition and present cases, with the saltwater intrusion length shortening by 5–15 km. The narrowing of the salt wedge shortened the gravity-circulation range during spring tide.
4. Discussion
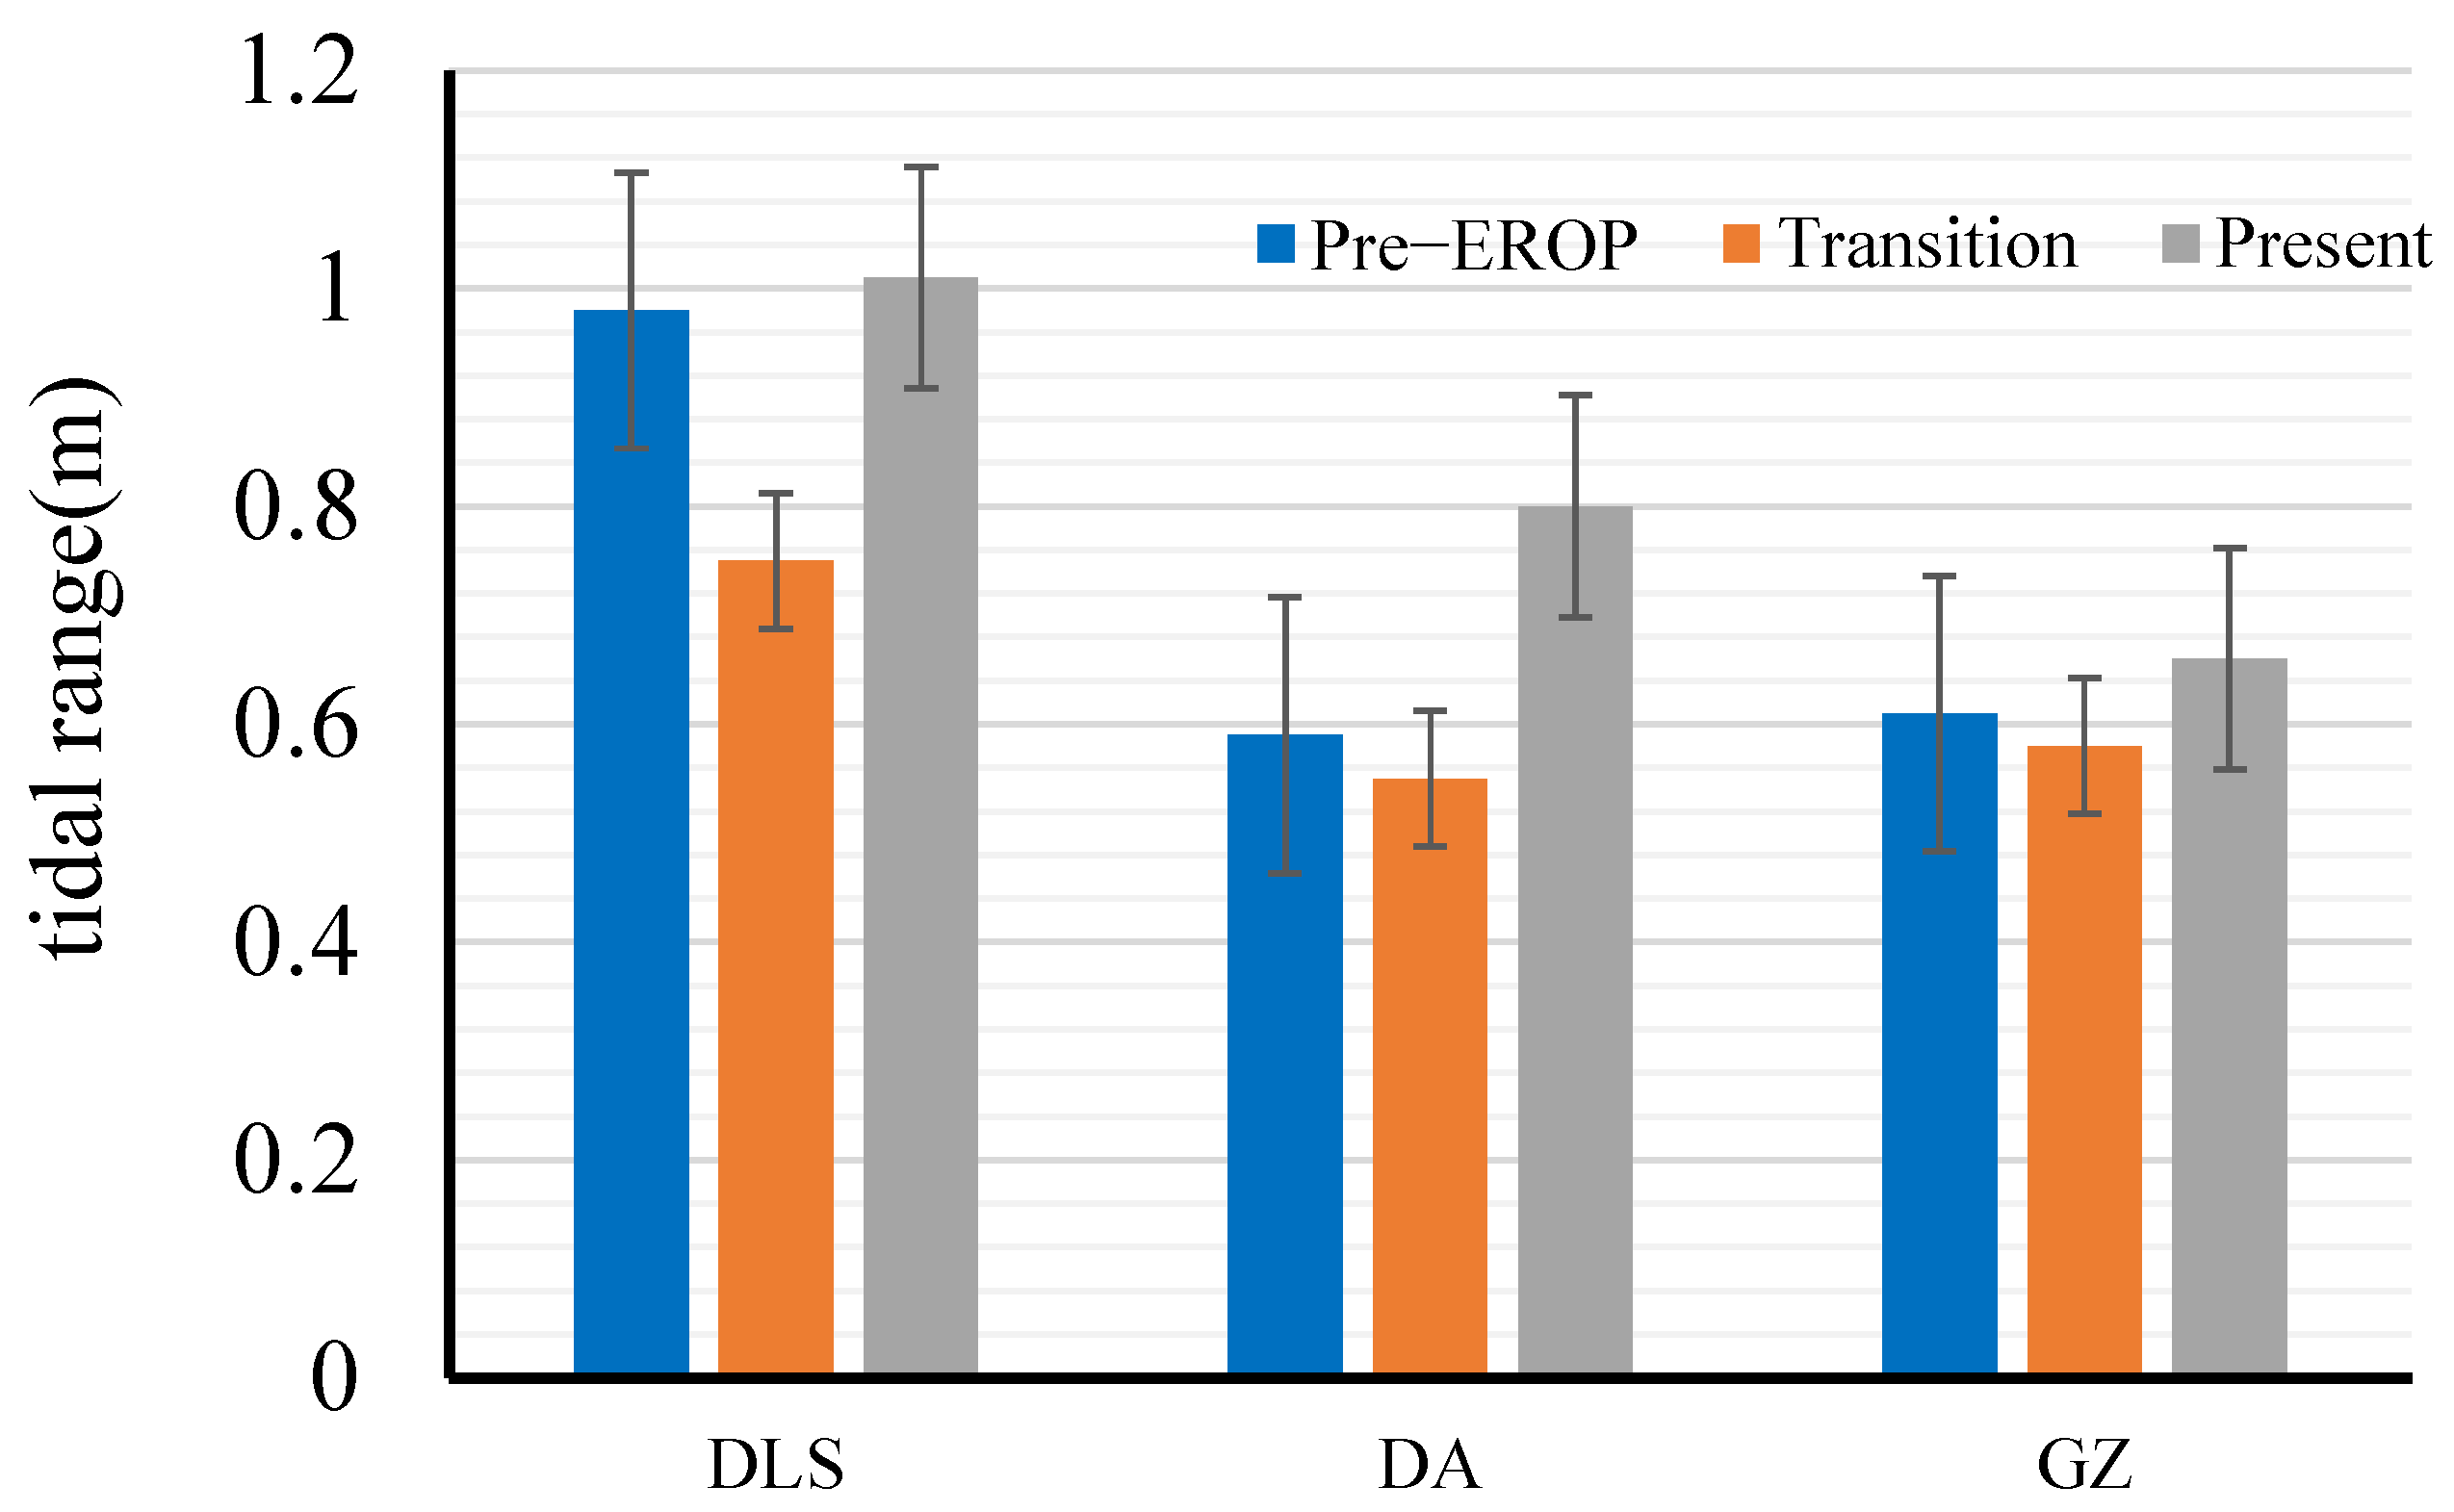
4.1. Tidal-Range Changes of the Estuary
Tidal range is an important index to measure tidal dynamic intensity. In this study, the tidal ranges of three stations were calculated, representing the tidal dynamic in the upstream (GZ), midstream (DA), and downstream (GDJ), respectively.
Figure 10 shows the changes in the monthly average tidal range at each station. It indicates that the due to land reclamation, tidal range in the transition case is 0.04–0.18 m lower than that in the Pre−EROP Case. However, the riverbed downcutting caused the tidal range in the present case to increase by 0.08–0.23 m, compared with the transition case, which was also greater than the tidal range in the Pre−EROP Case. Besides, the negative effect of land reclamation on the tidal range was significant in the downstream but not obvious in the midstream and upstream. However, the positive effect of riverbed downcutting on the tidal range is prominent both in the middle and lower reaches. In summary, we found that whether from the aspect of tidal-range value or the spatial-influence range, the effect of terrain cutting was always stronger than that of reclamation, which is consistent with the analysis in
Section 3.1.
Cai et al. [
5] pointed out that in the momentum equation of one-dimensional tidal cycle average, the residual water level gradient (RWLG) is balanced with the friction term (
). Here, the residual water level refers to the average water level within 25 h of a lunar day. It means that RWLG can reflect the resistance of tidal-wave propagation. Through calculation, the RWGL in the ME increased from 1.0 × 10
−5 in the Pre−EROP case to 1.1 × 10
−5 in transition case, whereas it decreased to 0.8 × 10
−5 in the present case. Hence, the reclamation increased the resistance of upstream propagation of tidal waves, which is conducive to a reduction in tidal range. Contrarily, the riverbed downcutting decreased the resistance of tidal-wave propagation, which is conducive to an increase in tidal range. The result of the comprehensive effect of human activities is a net reduction of frictional resistance but a net increase in the tidal range.
4.2. Influence of Hydrodynamic Structure Change on Estuarine Water Environments
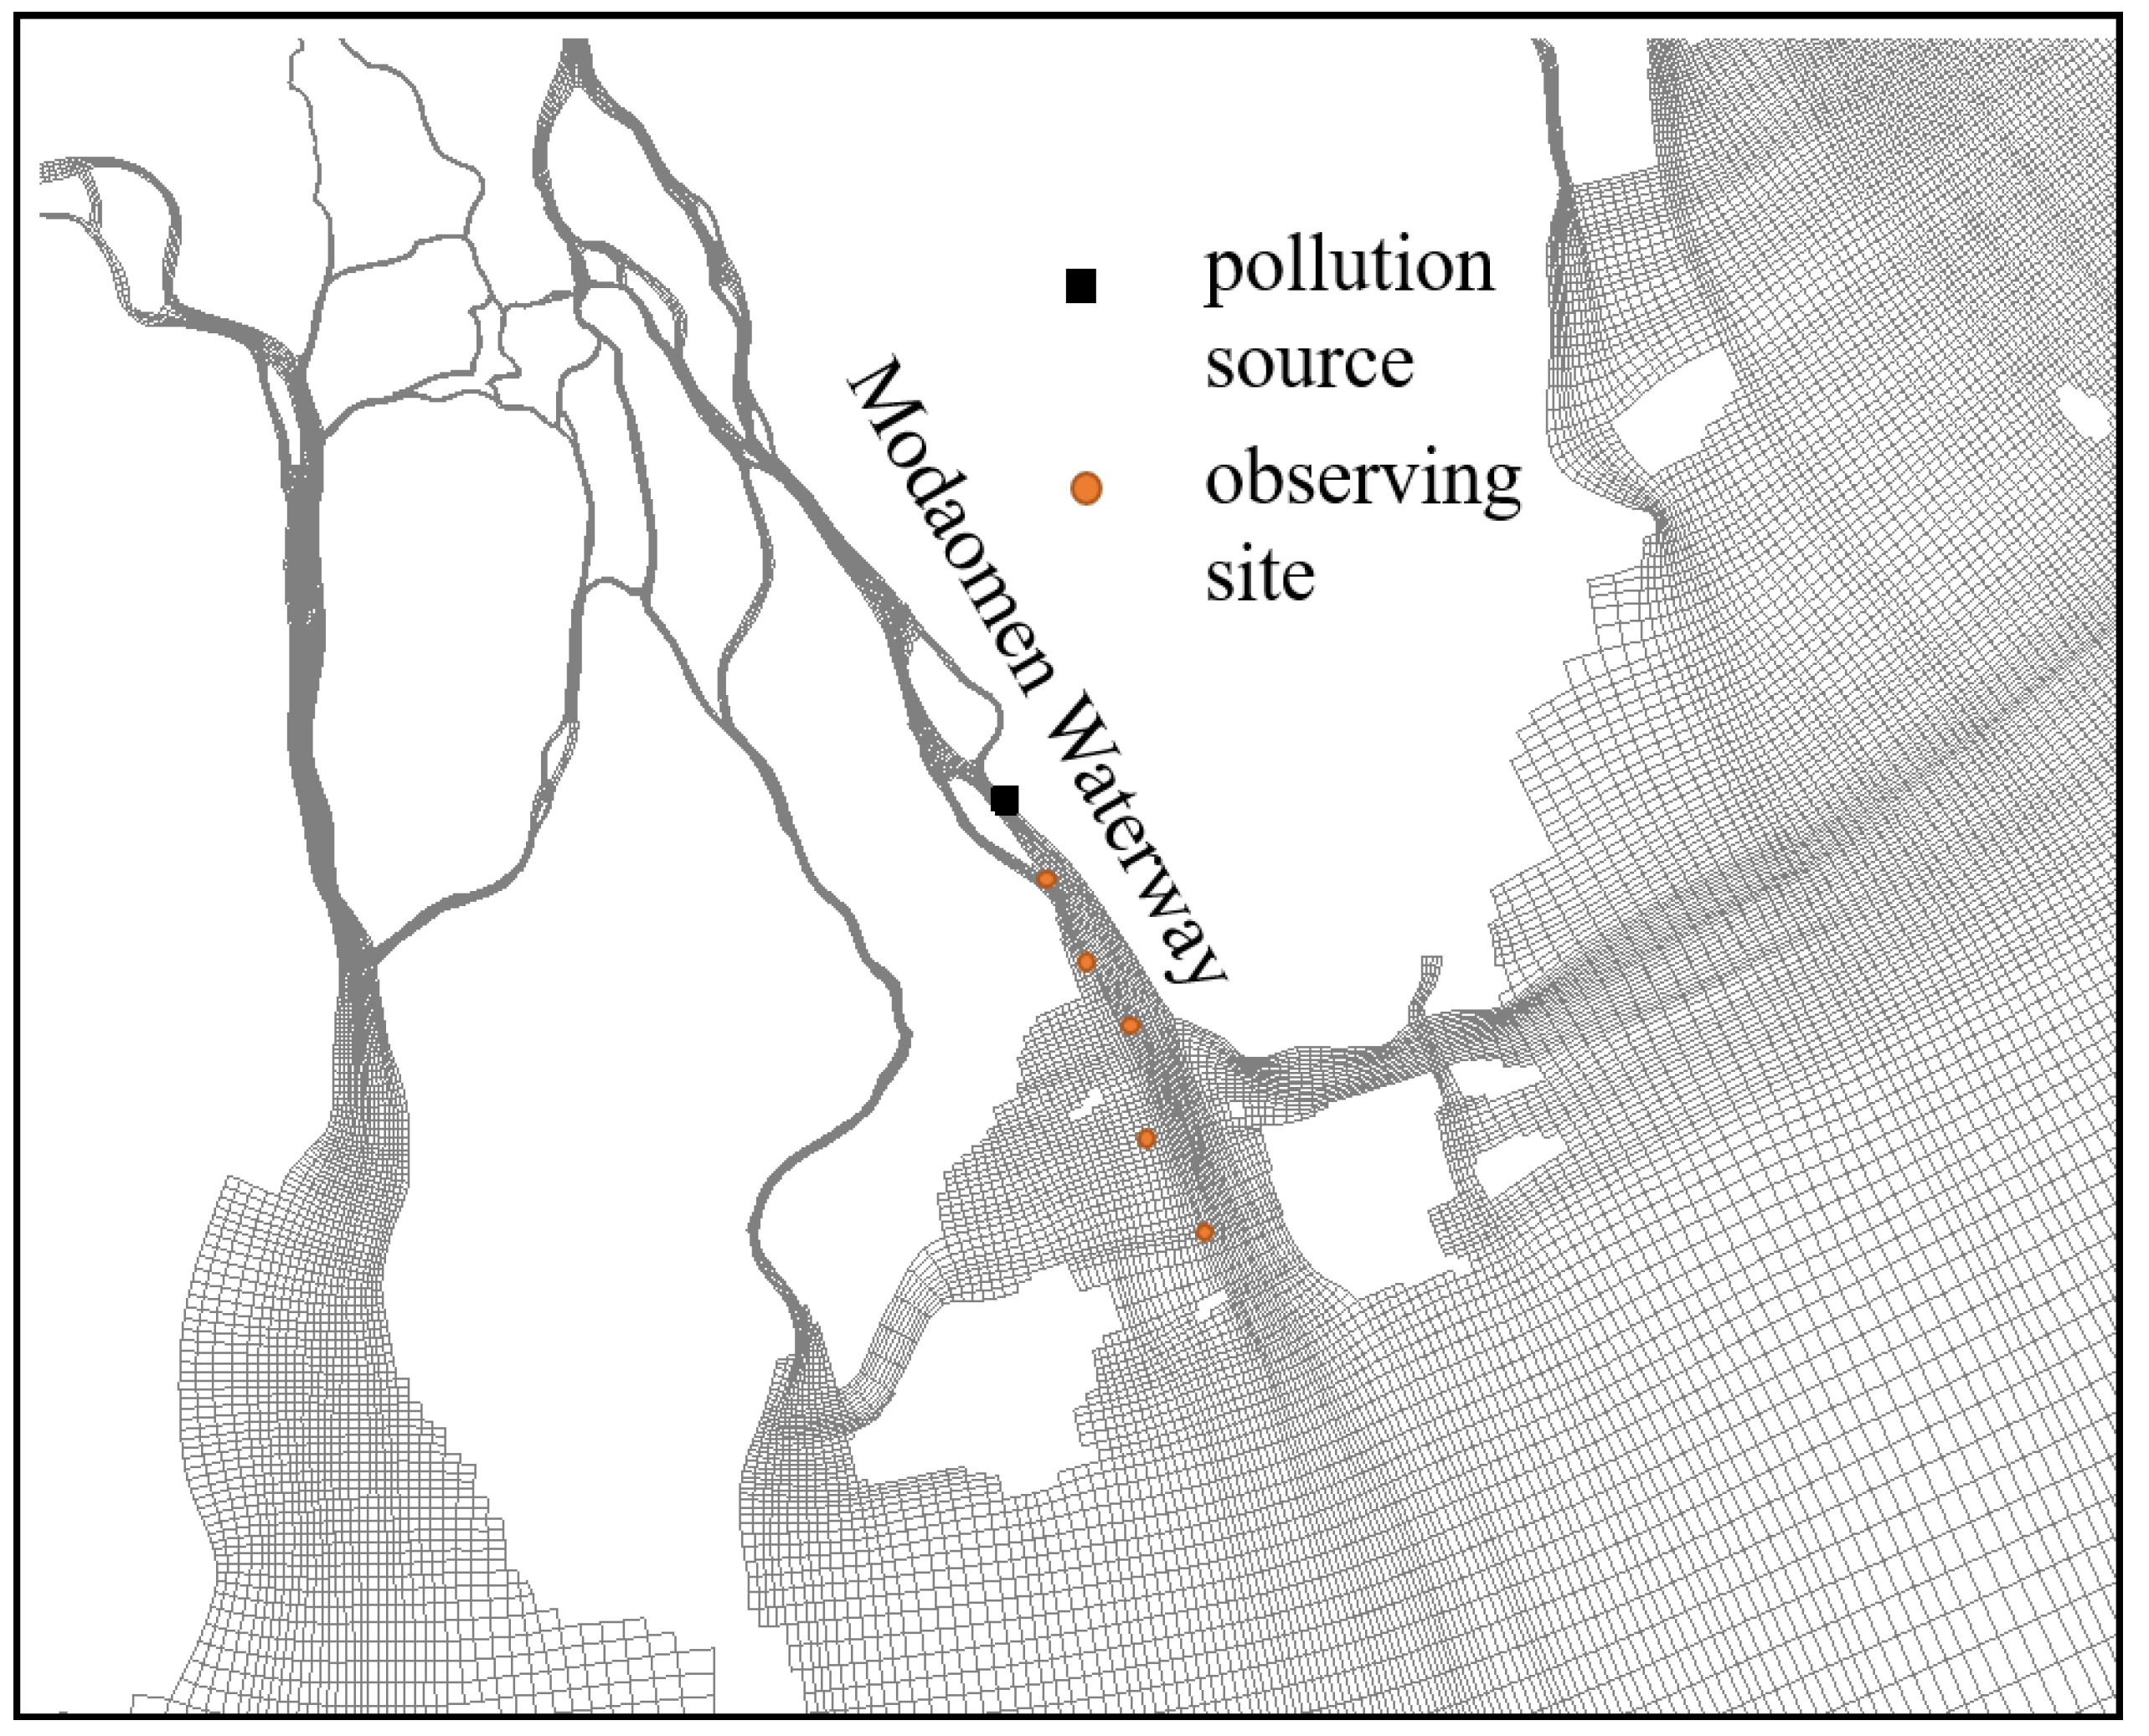
The water quality of estuaries is largely affected by the process of salt transport, which controls the intrusion of saltwater, the longitudinal and transverse density gradient, and the baroclinic circulation and also influences the transport of sediment and nutrients. The above analysis results show that the hydrodynamic structures in the ME changed from a state of atypical gravity circulation with nonobvious stratification to a state of highly stratified and large-scale gravity circulation due to the comprehensive influence of human activities between the 1970s and 2010. Therefore, the pollutant transport process in the ME may also have undergone great changes. In this study, a pollutant module was added to the model, as shown in
Figure 11, and TN was selected as a typical pollutant for the discussion of the influence of hydrodynamic-structure changes on the estuarine water environment. According to the functional zoning of the surface-water environment in Guangdong Province (2011 Edition), the ME should meet the class III water standard. TN is specified as 1.0 mg/L in the class III water standard of surface-water environmental quality standards. According to the current investigation of the sewage outlet of Modaomen, the generalized pollution-point source is located near the ZPS station, with a discharge flow of 5 m
3/s and a concentration of 1.0 mg/L.
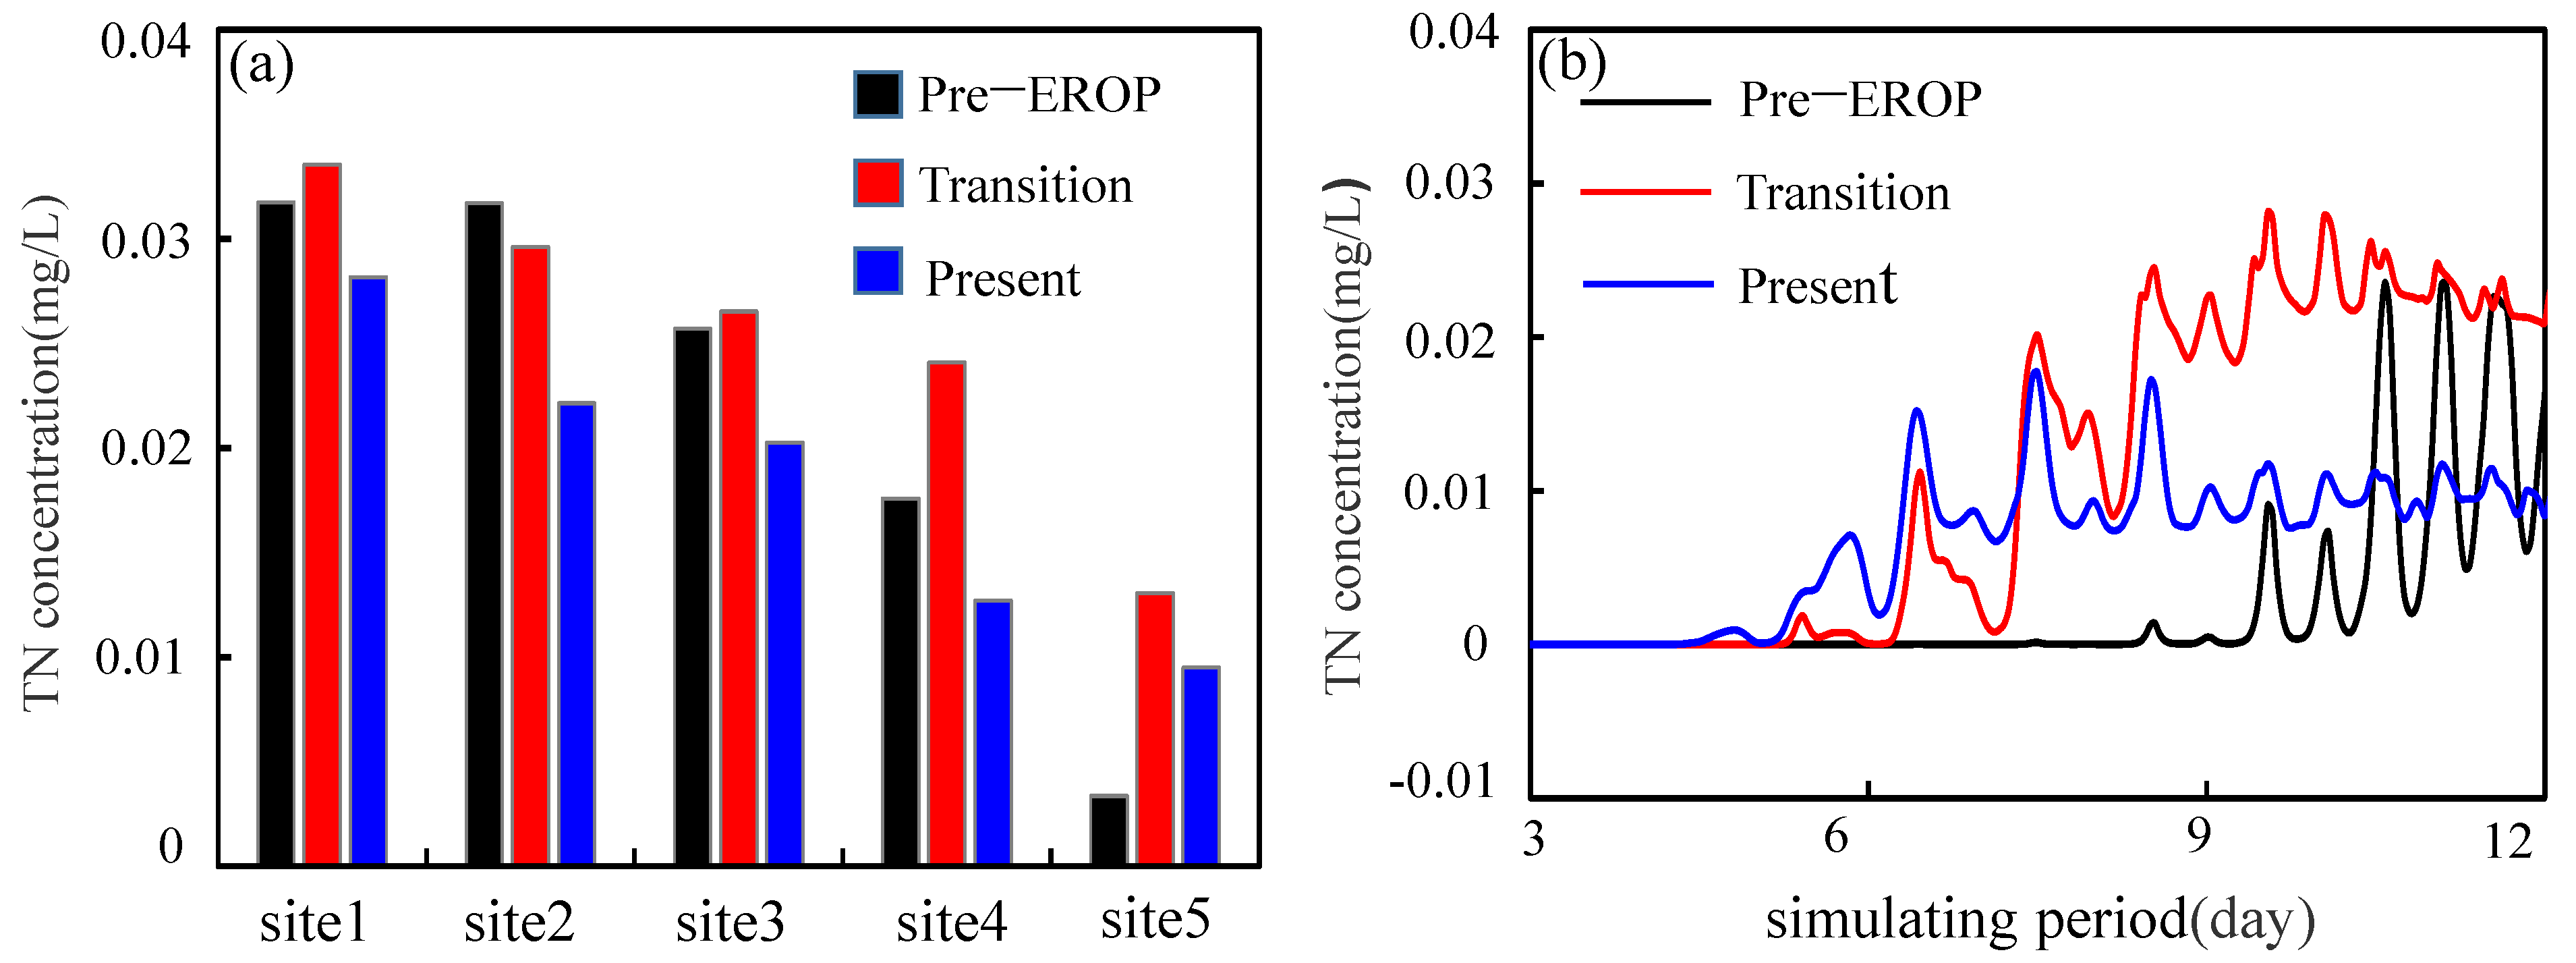
As the sewage outlet discharges along the bank, a coastal pollution zone forms along the water-flow direction.
Figure 12a shows the average concentration of TN at the five stations along the water channel of ME. The lower the concentration of pollutants downstream, the more mixing of the water columns. For sections where reclamation occupies a large area of water, the volume of the water-column containing pollutants in Modaomen was reduced, and the weakening of tidal dynamics was not conducive for the mixing of pollutants and the water column. Generally, coastal pollution is intensified under the simulating scenario of the transition period, where the TN concentration was, on average, 0.0033 mg/L higher than that under the scenario of the 1970s. In 2010, the riverbed topography was cut down, which increased the channel volume, enhanced the pollutant dilution capacity of Modaomen, enhanced the tidal dynamic, increased the tidal range, and mixed the water column violently. The TN concentration decreased significantly, with an average decrease of 0.0035 mg/L compared with the pre−EROP simulation scenario.
Figure 12b shows the time change in the pollutant concentration in the ME. The pollutants remained in the ME for a long time under the pre−EROP simulation scenario. The pollutants were released from day 3, but there was no significant TN concentration fluctuation until after 9.6 d; the narrow waterway after reclamation was conducive to quickly pushing pollutants into the open sea. There was significant TN concentration fluctuation after 6 d. That means the narrowed estuary, due to land reclamation, is conducive to the rapid entry of pollutants into the open sea.
5. Conclusions
In this study, a river-tide-salt dynamic model based on EFDC was used to simulate the hydrodynamic characteristics of the ME during different historical periods and reveal the impacts of human activities on the hydrodynamic structures of the ME in the PRD during the dry season.
The modeled results indicate that large-scale land reclamation in the ME blocked the original tidal channel and increased the morphological resistance of the estuary. Although the velocities of the flood tide and ebb tide increased by 15% due to the narrow section profile, the flow discharge decreased by 20%. Meanwhile, the tidal mixing effects were weakened while the salinity in vertical stratification was enhanced, and a typical gravity circulation with surface velocity to the sea and bottom velocity to the land formed within 15 km downstream of the ME during the flood tide.
However, riverbed downcutting weakened the morphological resistance of the estuary, thus enhancing tidal dynamics. The velocities of the flood tide and ebb tide increased by 20–30%, and the flow discharge was increased by twice as much as before. Moreover, the length of the saltwater intrusion was increased by 10–20 km, which resulted in the intensification of the velocity stratification in the ME during the flood tide, causing the spatial scale of gravity circulation to expand by 1–2 times.
The impact of the enhancement of riverbed downcutting on tidal dynamics in the ME was greater than the weakening effect of land reclamation. Hence, due to the combined influence of human activities between the 1970s and 2010, the velocities of the flood tide and the ebb tide increased by approximately 1.5 times. The hydrodynamic structures in the ME changed from a state of atypical gravity circulation with imperceptible stratification to a state of highly stratified and large-scale gravity circulation. The stratification of the neap tide was more significant than that of the spring tide, and the spatial scale of gravity circulation was larger.
Pollutant diffusion in the ME under different scenarios is also discussed in this paper. The results show that reclamation results in weakening of tidal dynamics, which is not conducive to the mixing and diffusion of pollutants in the estuary. However, the narrowed estuary due to land reclamation is conducive to the rapid entry of pollutants into the open sea.
This study attempts to identify the combined influence of human activities on the hydrodynamic structures of the ME. The results obtained from this study could be beneficial for the management and utilization of estuaries worldwide, which are subject to large-scale human interference.
Author Contributions
Conceptualization, Z.Z. and C.L.; methodology, C.L. and Z.Z.; software, Z.Z.; validation, C.L.; resources, writing—original draft preparation, C.L.; writing—review and editing, X.C. and Y.X.; project administration, M.Y.; funding acquisition, C.L. All authors have read and agreed to the published version of the manuscript.
Funding
This research was funded by National Key Research and Development Program of China (Grant No. 2019YFC1510400).
Institutional Review Board Statement
Not applicable.
Informed Consent Statement
Not applicable.
Data Availability Statement
The data that support the findings of this study are available from the corresponding author, Minghui Yu (e-mail:
mhyu@whu.edu.cn), upon reasonable request.
Acknowledgments
The authors also wish to thank the editor and anonymous reviewers, whose invaluable and constructive suggestions have greatly improved the scientific quality of the original manuscript.
Conflicts of Interest
The authors declare no conflict of interest.
References
- Tejedor, A.; Longjas, A.; Zaliapin, I.; Foufoula-Georgiou, E. Delta Channel Networks: 1. A Graph-Theoretic Approach for Studying Connectivity and Steady State Transport on Deltaic Surfaces. Water Resour. Res. 2015, 51, 3998–4018. [Google Scholar] [CrossRef]
- Giosan, L.; Syvitski, J.; Constantinescu, S.; Day, J. Climate Change: Protect the World’s Deltas. Nature 2014, 516, 31–33. [Google Scholar] [CrossRef] [Green Version]
- Hoitink, A.J.F.; Jay, D.A. Tidal River Dynamics: Implications for Deltas. Rev. Geophys. 2016, 54, 240–272. [Google Scholar] [CrossRef]
- Cai, H.; Yang, Q.; Zhang, Z.; Guo, X.; Liu, F.; Ou, S. Impact of River-Tide Dynamics on the Temporal-Spatial Distribution of Residual Water Level in the Pearl River Channel Networks. Estuaries Coasts 2018, 41, 1885–1903. [Google Scholar] [CrossRef]
- Zhao, J.; Guo, L.; He, Q.; Wang, Z.B.; van Maren, D.S.; Wang, X. An Analysis on Half Century Morphological Changes in the Changjiang Estuary: Spatial Variability under Natural Processes and Human Intervention. J. Mar. Syst. 2018, 181, 25–36. [Google Scholar] [CrossRef] [Green Version]
- Luo, X.-L.; Zeng, E.Y.; Ji, R.-Y.; Wang, C.-P. Effects of In-Channel Sand Excavation on the Hydrology of the Pearl River Delta, China. J. Hydrol. 2007, 343, 230–239. [Google Scholar] [CrossRef]
- Gong, W.; Lin, Z.; Chen, Y.; Chen, Z.; Zhang, H. Effect of Winds and Waves on Salt Intrusion in the Pearl River Estuary. Ocean Sci. 2018, 14, 139–159. [Google Scholar] [CrossRef] [Green Version]
- Jia, L.; Luo, Z.; Yang, Q.; Ou, S.; Lei, Y. Impacts of the Large Amount of Sand Mining on Riverbed Morphology and Tidal Dynamics in Lower Reaches and Delta of the Dongjiang River. J. Geogr. Sci. 2007, 17, 197–211. [Google Scholar] [CrossRef]
- Wu, Z.; Milliman, J.D.; Zhao, D.; Cao, Z.; Zhou, J.; Zhou, C. Geomorphologic Changes in the Lower Pearl River Delta, 1850–2015, Largely Due to Human Activity. Geomorphology 2018, 314, 42–54. [Google Scholar] [CrossRef]
- Hong, B.; Shen, J. Responses of Estuarine Salinity and Transport Processes to Potential Future Sea-Level Rise in the Chesapeake Bay. Estuar. Coast. Shelf Sci. 2012, 104–105, 33–45. [Google Scholar] [CrossRef]
- Sun, D.; Wan, Y.; Qiu, C. Three Dimensional Model Evaluation of Physical Alterations of the Caloosahatchee River and Estuary: Impact on Salt Transport. Estuar. Coast. Shelf Sci. 2016, 173, 16–25. [Google Scholar] [CrossRef]
- Zhang, W.; Ruan, X.; Zheng, J.; Zhu, Y.; Wu, H. Long-Term Change in Tidal Dynamics and Its Cause in the Pearl River Delta, China. Geomorphology 2010, 120, 209–223. [Google Scholar] [CrossRef]
- Liu, F.; Hu, S.; Guo, X.; Luo, X.; Cai, H.; Yang, Q. Recent Changes in the Sediment Regime of the Pearl River (South China): Causes and Implications for the Pearl River Delta. Hydrol. Process. 2018, 32, 1771–1785. [Google Scholar] [CrossRef]
- Wu, C.S.; Yang, S.L.; Lei, Y. Quantifying the Anthropogenic and Climatic Impacts on Water Discharge and Sediment Load in the Pearl River (Zhujiang), China (1954–2009). J. Hydrol. 2012, 452–453, 190–204. [Google Scholar] [CrossRef] [Green Version]
- Tan, C.; Huang, B.; Liu, K.; Chen, H.; Liu, F.; Qiu, J.; Yang, J. Using the Wavelet Transform to Detect Temporal Variations in Hydrological Processes in the Pearl River, China. Quat. Int. 2017, 440, 52–63. [Google Scholar] [CrossRef]
- Hao, Y.; Suying, O.; Linxi, F.; Feng, L.; Huayang, C.; Qingshu, Y. Quantifying the Impacts of External Forcing on Daily Averaged Water Levels in the Modaomen Estuary of the Pearl River. J. Hydraul. Eng. 2020, 51, 869–881. [Google Scholar]
- Zhang, W.; Wang, W.; Zheng, J.; Wang, H.; Wang, G.; Zhang, J. Reconstruction of Stage-Discharge Relationships and Analysis of Hydraulic Geometry Variations: The Case Study of the Pearl River Delta, China. Glob. Planet. Chang. 2015, 125, 60–70. [Google Scholar] [CrossRef]
- Yong, H.; Chen, L.; Liuzhu, Y.; Ronghui, Y.; Zhihua, Z.; Hua, W. The Impact of Channel-Floodplain Evolution on the Flood Release in the Mouths of Pearl River Estuary. J. Hydraul. Eng. 2018, 49, 72–80. [Google Scholar]
- Hamrick, J.; Wu, T. Computational Design and Optimization of the EFDC/HEM3D Surface Water Hydrodynamic and Eutrophication Models. In Proceedings of the Next Generation Environmental Models and Computational Methods; Delich, G., Wheeler, M.F., Eds.; Society for Industrial and Applied Mathematics: Philadelphia, PA, USA, 1997; pp. 143–161. [Google Scholar]
- Gong, W.; Wang, Y.; Jia, J. The Effect of Interacting Downstream Branches on Saltwater Intrusion in the Modaomen Estuary, China. J. Asian Earth Sci. 2012, 45, 223–238. [Google Scholar] [CrossRef]
- Xiaohong, C.; Lei, Z.; Zhong, S. Study on Spatial Variability of Water Levels in River Net of Pearl River Delta. J. Hydraul. Eng. 2004, 10, 36–42. [Google Scholar]
- Li, C.; Yu, M.; Cai, H.; Chen, X. Recent Changes in Hydrodynamic Characteristics of the Pearl River Delta during the Flood Period and Associated Underlying Causes. Ocean. Coast. Manag. 2019, 179, 104814. [Google Scholar] [CrossRef]
- Wei, Z.; Yixin, Y.A.N.; Yuliang, Z.H.U.; Mingyuan, Y. Impact of Sand Excavation and Waterway Regulation on Hydrodynamics of Pearl River Networks. J. Hydraul. Eng. 2008, 39, 1098–1104. [Google Scholar]
- Zhang, Q.; Chen, Y.D.; Jiang, T.; Chen, X.; Liu, Z. Human-Induced Regulations of River Channels and Implications for Hydrological Alterations in the Pearl River Delta, China. Stoch. Environ. Res. Risk Assess. 2011, 25, 1001–1011. [Google Scholar] [CrossRef]
- Zheng, J.; Zhang, W.; Zhang, P.; Zhu, Y. Understanding Space-Time Patterns of Long-Term Tidal Fluctuation over the Pearl River Delta, South China. J. Coast. Res. 2014, 30, 515–527. [Google Scholar] [CrossRef]
- Tan, C.; Huang, B.; Liu, F.; Huang, G.; Qiu, J.; Chen, H.; Liu, D.; Xie, R. Recent Morphological Changes of the Mouth Bar in the Modaomen Estuary of the Pearl River Delta: Causes and Environmental Implications. Ocean. Coast. Manag. 2019, 181, 104896. [Google Scholar] [CrossRef]
- Egbert, G.D.; Erofeeva, S.Y. Efficient Inverse Modeling of Barotropic Ocean Tides. J. Atmos. Ocean. Technol. 2002, 19, 183–204. [Google Scholar] [CrossRef] [Green Version]
- Fan, X.; Cui, B.; Zhao, H.; Zhang, Z.; Zhang, H. Assessment of River Water Quality in Pearl River Delta Using Multivariate Statistical Techniques. Procedia Environ. Sci. 2010, 2, 1220–1234. [Google Scholar] [CrossRef] [Green Version]
- Gong, W.; Chen, Y.; Zhang, H.; Chen, Z. Effects of Wave-Current Interaction on Salt Intrusion During a Typhoon Event in a Highly Stratified Estuary. Estuaries Coasts 2018, 41, 1904–1923. [Google Scholar] [CrossRef]
- Gong, W.; Maa, J.P.-Y.; Hong, B.; Shen, J. Salt Transport during a Dry Season in the Modaomen Estuary, Pearl River Delta, China. Ocean. Coast. Manag. 2014, 100, 139–150. [Google Scholar] [CrossRef]
Figure 1.
Sketch of the PRD showing the location of the ME, including the hydrological and mooring stations.
Figure 1.
Sketch of the PRD showing the location of the ME, including the hydrological and mooring stations.
Figure 2.
Changes in the coastlines and topography of the ME. (a) Coastlines in the 1970s. (b) Coastlines in 2010. (c) Changes in the topography of the ME between 1977 and 2010.
Figure 2.
Changes in the coastlines and topography of the ME. (a) Coastlines in the 1970s. (b) Coastlines in 2010. (c) Changes in the topography of the ME between 1977 and 2010.
Figure 3.
Model grid showing the bottom elevation and locations of the upstream boundaries.
Figure 3.
Model grid showing the bottom elevation and locations of the upstream boundaries.
Figure 4.
Distribution of the depth-averaged velocities in the ME during neap tides. (a) flood−tide in pre−EROP case (b) ebb−tide in pre−EROP case (c) flood−tide in transition case (d) ebb−tide in transition case (e) flood−tide in present case (f) ebb−tide in present case.
Figure 4.
Distribution of the depth-averaged velocities in the ME during neap tides. (a) flood−tide in pre−EROP case (b) ebb−tide in pre−EROP case (c) flood−tide in transition case (d) ebb−tide in transition case (e) flood−tide in present case (f) ebb−tide in present case.
Figure 5.
Distribution of the depth-averaged velocities in the ME during spring tides. (a) flood−tide in pre−EROP case (b) ebb−tide in pre−EROP case (c) flood−tide in transition case (d) ebb−tide in transition case (e) flood−tide in present case (f) ebb−tide in present case.
Figure 5.
Distribution of the depth-averaged velocities in the ME during spring tides. (a) flood−tide in pre−EROP case (b) ebb−tide in pre−EROP case (c) flood−tide in transition case (d) ebb−tide in transition case (e) flood−tide in present case (f) ebb−tide in present case.
Figure 6.
Longitudinal distribution of velocity in the ME during neap tides. (a) flood−tide in pre−EROP case (b) ebb−tide in pre−EROP case (c) flood−tide in transition case (d) ebb−tide in transition case (e) flood−tide in present case (f) ebb−tide in present case.
Figure 6.
Longitudinal distribution of velocity in the ME during neap tides. (a) flood−tide in pre−EROP case (b) ebb−tide in pre−EROP case (c) flood−tide in transition case (d) ebb−tide in transition case (e) flood−tide in present case (f) ebb−tide in present case.
Figure 7.
Longitudinal distribution of velocity in the ME during spring tides. (a) flood−tide in pre−EROP case (b) ebb−tide in pre−EROP case (c) flood−tide in transition case (d) ebb−tide in transition case (e) flood−tide in present case (f) ebb−tide in present case.
Figure 7.
Longitudinal distribution of velocity in the ME during spring tides. (a) flood−tide in pre−EROP case (b) ebb−tide in pre−EROP case (c) flood−tide in transition case (d) ebb−tide in transition case (e) flood−tide in present case (f) ebb−tide in present case.
Figure 8.
Longitudinal distribution of salinity in the ME during neap tide. (a) flood−tide in pre−EROP case (b) flood−slack in pre−EROP case (c) ebb−tide in pre−EROP case (d) ebb−slack in pre−EROP case (e) flood−tide in transition case (f) flood−slack in transition case (g) ebb−tide in transition case (h) ebb−slack in transition case (i) flood−tide in present case (j) flood−slack in present case (k) ebb−tide in present case (l) ebb−slack in present case.
Figure 9.
Longitudinal distribution of salinity in the ME during spring tide. (a) flood−tide in pre−EROP case (b) flood−slack in pre−EROP case (c) ebb−tide in pre−EROP case (d) ebb−slack in pre−EROP case (e) flood−tide in transition case (f) flood−slack in transition case (g) ebb−tide in transition case (h) ebb−slack in transition case (i) flood−tide in present case (j) flood−slack in present case (k) ebb−tide in present case (l) ebb−slack in present case.
Figure 10.
Temporal and spatial changes in the tidal range and salinity in the ME under three simulated scenarios (the error bar stands for the range of tidal range at stations).
Figure 10.
Temporal and spatial changes in the tidal range and salinity in the ME under three simulated scenarios (the error bar stands for the range of tidal range at stations).
Figure 11.
Pollutant module setup.
Figure 11.
Pollutant module setup.
Figure 12.
(a) Average concentration of TN at the five stations along the coast after pollutant discharge. (b) Time change of pollutant concentration at the ME under three simulating scenarios.
Figure 12.
(a) Average concentration of TN at the five stations along the coast after pollutant discharge. (b) Time change of pollutant concentration at the ME under three simulating scenarios.
Table 1.
Calibration of water level at stations in the ME.
Table 1.
Calibration of water level at stations in the ME.
| Station | RMSE (m) | NSE |
|---|
| DHQ | 0.12 | 0.94 |
| GDJ | 0.12 | 0.94 |
| ZPS | 0.12 | 0.92 |
| ZY | 0.12 | 0.93 |
Table 2.
Calibration of water current at stations in the ME.
Table 2.
Calibration of water current at stations in the ME.
| Station | Layer | RMSE (m/s) | NSE |
|---|
| M1 | Surface | 0.24 | 0.66 |
| Middle | 0.16 | 0.72 |
| Bottom | 0.10 | 0.51 |
| M2 | Surface | 0.20 | 0.59 |
| Middle | 0.18 | 0.56 |
| Bottom | 0.13 | 0.50 |
| M3 | Surface | 0.21 | 0.75 |
| Middle | 0.14 | 0.90 |
| Bottom | 0.12 | 0.81 |
Table 3.
Calibration of salinity at stations in the ME.
Table 3.
Calibration of salinity at stations in the ME.
| Station | Layer | RMSE (ppt) | NSE |
|---|
| M1 | Surface | 0.8 | 0.70 |
| Middle | 1.6 | 0.46 |
| Bottom | 1.8 | 0.42 |
| M2 | Surface | 1.6 | 0.67 |
| Middle | 2.0 | 0.51 |
| Bottom | 2.6 | 0.65 |
| M3 | Surface | 1.5 | 0.66 |
| Middle | 2.0 | 0.76 |
| Bottom | 1.5 | 0.76 |
Table 4.
Coastlines and bathymetries of the Modaomen Estuary in the three simulated scenarios.
Table 4.
Coastlines and bathymetries of the Modaomen Estuary in the three simulated scenarios.
| Scenario | Coastline | Bathymetry |
|---|
| Pre−EROP Case | 1970s | Measured data for 1977 |
| Transition Case | 1970s | Measured data for 1977 |
| Present Case | 2010 | Measured data for 2010 |
| Publisher’s Note: MDPI stays neutral with regard to jurisdictional claims in published maps and institutional affiliations. |
© 2021 by the authors. Licensee MDPI, Basel, Switzerland. This article is an open access article distributed under the terms and conditions of the Creative Commons Attribution (CC BY) license (https://creativecommons.org/licenses/by/4.0/).


