Abstract
Wastewater formed on ships is divided into blackwater and graywater. While blackwater refers to wastewater from toilets, graywater defines wastewater from sinks, laundry and restaurants. Even though some treatments are applied onboard before discharge, wastewater contains significant amounts of fecal bacteria, heavy metals, etc., in excess of water quality standards. Dilution is a secondary natural treatment in the ship-wake region, which occurs after wastewater discharging. According to the Environmental Protection Agency (EPA), the natural treatment process is quantified by dilution factor, which is strongly dependent on vessel width, draft, speed and wastewater discharge rate. In this study, an Artificial Neural Network (ANN) model linked with the main ship parameters was developed to estimate the dilution factors while the ship is in the preliminary design stage. Gross ton, deadweight ton, passenger number, freeboard, engine power, propeller number and block coefficient values of 1041 large cruise ships were used to estimate the likely dilution factors. The best ANN estimation model was determined by Root Mean Square Error (RMSE) and Mean Absolute Error (MAE) methods. A decision tree was created for the results and the most important parameters affecting the dilution factors were determined. The main ship dimensions are needed for the dilution factor formulation of EPA whereas in the model created in this study only the gross ton or engine power of the ship is sufficient to estimate the dilution. Moreover, this new model is also usable for the estimation of dilution factors even if the main dimensions of the ship are not known.
1. Introduction
Cruise ships are enormous floating towns which are major sources of marine pollution through the dumping of garbage and untreated sewage at sea, and the release of other shipping-related pollutants. A large cruise ship with 3000 passengers generates over than 100,000 L of human waste a day. Although cruise ships are required to have on-board waste treatment systems, the Environmental Protection Agency (EPA) has found that many cruise ships treat sewage with old technology, resulting in discharge that often contains significant amounts of fecal bacteria, heavy metals, and nutrients in excess of federal water quality standards [1].
The ships produce two distinct streams of wastewater named as black and grey water. Black water is sewage while grey water is general cooking and cleaning waste. Sewage is considered to be dirty water coming from the toilets of the ship, animal habitats, and the infirmary, and it has high pollutant concentration while graywater is the wastewater from sinks, baths, laundries and the restaurant part of the ship, which have a lower concentration of contaminants than sewage. In most treatment systems used in passenger ships, sewage and graywater are collected in the same tank and treated through the same treatment processes.
Ship-based wastewater has pollutant concentrations such as organic matter, nutrients, suspended solids and coliforms, which constitute a high level of pollution in the marine environment. Organic materials in the wastewater have no direct effect on the environment every time. Most organic substances are biodegradable and use dissolved oxygen in this process. This leads to a lack of oxygen and creates an undesirable situation in the marine environment. When organics are introduced into the ambient water, they are decomposed by microorganisms and converted into carbon dioxide and water. During the biodegradation process, oxygen that is vital for living things is consumed. The situation becomes more serious when organic substances are mixed into semi-enclosed and warmer ambient water. This causes damage to the natural life and causes toxic and explosive gases and bad odors in the environment due to the aerobic conditions. Nutrients refer to substances such as nitrogen and phosphorus, which are necessary for the growth of organisms in the marine environment. These are the substances required for the survival of the marine environment. However, they increase the primary production if they are too prominent in the environment. This condition, called eutrophication, creates more important problems in water areas which do not have a high flow and water circulation. If nutrient discharges are not properly controlled, the water mass starts to grow and the water environment becomes marsh due to the growth of this organism that cannot be controlled. In these environments, eutrophication must be prevented, and necessary precautions must be taken due to these serious problems caused by nutrients in ship-based wastewater.
Coliform is particularly important for public health and marine life. In marine environments, coliform is used as an indicator of pathogenic microorganisms. Millions of coliforms are excreted through feces. Although these organisms are not pathogenic in themselves, they are a good indicator of waterborne diseases [2].
Acidity and alkalinity in water are indicated by pH. The water with a pH value above 7 is classified as alkaline and that below is classified as acidic water. Neutral solutions have a pH of 7 at 25 °C. In neutral water the concentration of H+ and OH− is equal. In acidic water, H+ and in basic water OH− formations are higher. The most important factor affecting the pH value of the sea water is CO2. The pH value of the sea water is between 7.5 and 8.4. When the concentration of carbon dioxide is low, the pH value of the water rises. The value of pH is one of the most important parameters for water creatures. High and low pH values have a negative effect on water organisms. The toxicity of some substances in the water decrease or increase depending on pH values of water. For example, as the pH value increases, the toxic effect of ammonia increases, and the toxic effect of sulfides and cyanides increase when the pH value decreases. The low or high pH values have a direct or indirect effect on fish. Chemical oxygen demand refers to the amount of oxygen required for the oxidation of all substances in the water. Organic substances that are dissolved in water can be of natural origin or may be composed of treated or combined with urban and industrial waste water. There is a natural balance between the organic matter produced at the end of the autotrophic processes and the consumption of the aerobic heterotrophic organisms in the water that are not exposed to the pollution load. The addition of biodegradable organic substances to water significantly changes this delicate balance. When the oxygen consumption is higher than the oxygen recovery, the biological processes in the water change completely [3].
Marine ecosystem is affected by these kinds of substances and thus, comprehensive international regulations were recognized such as International Convention for the Prevention of Pollution from Ships (MARPOL 73/78). MARPOL comprises six annexes and each of these annexes focuses on different pollution issues. Annex IV regulates the requirements for certification and investigation about the case of discharging sewage, necessary conditions related to treatment system at the ports, and facilities.
MARPOL Annex IV enforces the ships to use appropriate sewage treatment and disinfection system or sewage storage tank in the ship. According to the Annex IV, if the ship has one of these treatment systems, sewage can be discharged at 3 nautical miles (nm) from the coast. Otherwise, if the ship is not equipped with any treatment system, sewage has to be discharged at 12 nm from the coast [4].
According to the EPA’s regulations, the ships operate in Alaskan coastal water with the value of speeds under 6 knots must meet the fecal coliform criteria (the geometric mean of samples must not exceed 20/100 mL and 10% percent of samples must not exceed 40/100 mL during 30 days) and chlorine standards (total chlorine waste must not exceed 10 µg/L). The treated sewage, which must be discharged 1 nm from the coast and at minimum 6 knots speed, must also meet Clean Water Act (CWA) standards of the EPA [5,6].
Although the importance of this issue existent literature have limited number of studies concerning with liquid waste of ships. Westhof et al. [7] investigated the micropollutants (pharmaceuticals, personal car products and trace chemicals) in the ship wastewater. The study focused on the determination of the types and the concentration of different pollutants. Gibson et al. [8] compared the environmental performances of various pollutants of ships and found out that the discharges of the merchant ships have the 40–50% of the total deleterious impacts to the environment. Wilewska-Bien and Anderberg [9] focused on the role of the ports on sewage management in the Baltic Sea. The authors indicated that Baltic Sea will face new regulations in 2019 (in accordance with MARPOL Annex IV) and thus, the current situation and potential measurements of the ports were discussed. Wang et al. [10] studied the corporate social responsibility and concluded that although Carnival Corporation has a significant impact in resolving water pollution under the regulation of MARPOL IV. Backer [11] reviewed the previous studies on the environment of the Baltic Sea and discussed the role of Helsinki Commission (HELCOM). Wilewska-Bien et al. [12] studied on the comparison of the nitrogen and phosporus concentration of food wastes and sewage of the cruise ships operating in the Baltic Sea. It was concluded that the annual load of nitrogen contained in the food waste corresponds to 52% of the load of nitrogen from the sewage. The load of phosphorus is approximately one-third of that associated with the sewage.
Discharging into sea water, in terms of mixing and dispersion process, is subdivided into near-field, far-field and middle-zone sections [13,14,15,16,17]. At the discharge point, the jet flow direction and the mixing process depend on the discharge momentum, the densities between the discharge and the characteristics of the environment in which the waste water is discharged. The region defined as ‘near field’ is identified according to time and distance. After a certain time or distance, the effect of the discharge flow characteristics is dissipated. The areas where the wastewater is diluted by the effect of ocean currents are defined as ‘far fields’. Here the distance and time scale are in kilometers and hours. Between these two regions, there is a transition region called the ‘intermediate field’. This region begins at the end of the jet flow, i.e., at the end of the near field. Jirka [18] and Bleninger and Jirka [19] have shown that this central region can expand to greater distances from water depth under poor flow conditions. On the other hand, in strong environmental conditions (flows), the ‘middle zone’ process can be less important than the ‘far field’ process. Therefore, it is concluded that the middle zone can be neglected under strong flow conditions.
Wastewater can be discharged from ships into the sea within the framework of the rules set by national and international standards established by the EPA and International Maritime Organization (IMO). In its cruise ship discharge assessment report, the EPA explained the treatment systems used in passenger ships in detail. In this report, Marine Sanitation Devices (MSD) and Advanced Wastewater Treatment Systems (AWT) used for wastewater treatment on passenger ships are examined. It is stated that AWT systems make more successful treatment than MSD systems. Although successful treatment is made, it is stated that wastewater does not meet the standards set in terms of certain parameters. Wastewater is subjected to a second natural treatment called dilution, which occurs on the ship-wake. The EPA has made some theoretical and experimental studies on this subject. At the end of the studies, formulas were published [5].
In the detailed literature research, it is seen that this problem, which is very important for the oceans and seas today and in the future, is not mathematically examined and the number of publications is not very high. This study was conducted to examine how wastewater behaves after discharge from the ship. For this purpose, dilution of the wastewater of cruise ships was estimated using an ANN (artificial neural network) model. Firstly, the dilution factors of 1041 ships have been calculated by formulas EPA. Then dilution factors of the same ships have been estimated by an Artificial Neural Network (ANN) model depending on gross ton, deadweight ton, engine power, propeller number, block coefficient, freeboard and passenger number of ships. Finally, the calculated and estimated values of dilution factors have been compared to each other.
2. Dilution and Dilution Factor
Dilution is the process in which a chemical in an ecosystem becomes less concentrated and there is a decrease in the concentration of a solute in solution, usually simply by mixing with more solvent (such as water). Dilution is also a reduction in the acidity or alkalinity of a chemical (gas, vapor, solution). Dilution is one of the main processes for reducing the concentration of substances away from the discharge point. By itself, however, dilution does not reduce the mass of the chemical but, rather, spreads the area of potential exposure to the chemical. In addition, some contaminants are believed to be hazardous (such as the always lethal potassium cyanide) even at levels that may be too dilute to be detected with standard field characterization equipment and techniques [20].
Even if treatment is applied onboard before discharge from the ship, wastewater contains significant amounts of fecal bacteria, heavy metals, etc. in excess of water quality standards. Dilution is a secondary natural treatment in the ship-wake region which occurs after the wastewater is discharged into the sea. It is affected by the dimensions of the ship, the wastewater discharge flow, rotate of the propeller and the turbulence that occurs behind the ship. This secondary natural treatment is vital to ensure that vessels meet established standards [5].
The EPA studied the wastewater discharged to the sea from ships. These studies were made for cruise ships sailing in the open seas and oceans. Theoretical and experimental studies carried out by the EPA show that the dilution is affected from the breadth, draft, speed of the ship and the discharge flow rate of the waste water, and also the vortex which occurred due to the simultaneous motion of the propeller and the ship. The EPA has presented some dilution factors equations as the result of theoretical and experimental studies.
The first dilution factor equation for the big cruise ships whose passenger numbers are more than 500 people is as follows [5];
where;
DF = (B × T × V)/Q
DF: Dilution factor
B: Breadth (m)
T: Draft (m)
V: Speed (m/s)
Q: Discharging flow rate (m3/s)
Subsequent to these studies, it has been seen that the dilution factors obtained by different experimental studies are 0.9, 4.2, 4.5, 4.7, 5.1, 5.3 and 6.5 times higher than the dilution factors calculated by Equation 1 [21]. Thus the Equation (1) has been modified by adding a multiplier coefficient [5]. The new Equation as is follows;
DF = 4 × (B × T × V)/Q
The small cruise ships’ passenger capacities are less than 500. The studies offered that the Equation (1) can be used by multiplying with ‘3’ for small cruise ships due to the similar hydrodynamic characteristics of big and small ships [22]. The dilution factor equation for small ships as is follows:
DF = 3 × (B × T × V)/Q
3. Artificial Neural Network (ANN) Model
ANN is a soft computational problem-solving method which has been widely used by the environmental studies. ANN is an intelligent system that has the capacity to learn, memorize, and create relationships among data. They simulate a human brain and are ideal for modeling nonlinear, dynamic, noise-ridden, and complex systems. ANN is a massively parallel distributed processor that has a natural propensity for storing experiential knowledge and making it available for use. It is composed of neurons arranged in groups called layers and connected through weights. The adaptive weights are conceptually connection strengths between neurons activated during training and prediction. ANN consists of three layers as input, hidden and output layers. Input data are passed and operated through the neural network until an output is obtained at the output layer. Every neuron receives many inputs from other neurons through weighted connections. This type of weighted input is further added up to produce the argument for the transfer function of a linear and logistic function, producing the final output of the neuron [23,24].
Jumaat et al. [25] predicted the power output from photovoltaic (PV) panel system using ANN. The Root Mean Square Error (RMSE) values obtained in the study showed the suitability of the ANN method. Hanbay et al. [26] used ANN to estimate wastewater treatment plant performance in their study. Keiner and Yan [27] and Panda et al. [28] studied water quality modelling by using the ANN technique.
Abyaneh [29] evaluated the performance of multivariate linear regression (MLR) and ANN methods in the determination of biochemical oxygen demand and chemical oxygen demand values of wastewater in wastewater treatment plant. The performances of both methods were evaluated with the coefficient of correlation (R) and RMSE method and the ANN model was found to perform better than the MLR method. Elhatip and Kömür [30] used the ANN method to evaluate the changes in the electrical conductivity (EC) and dissolved oxygen (DO) values of the dam water and found that the results were close to the measured values. Ranković et al. [31] developed an ANN model and estimated dissolved oxygen values in the Gruža Reservoir, Serbia. The results were consistent with the experimental data. Saber et al. [32] reported that ANN was successful in predicting water quality parameters using coefficient determination (R2), RMSE and Relative Error (RE) in performance evaluation. Sarkar and Pandey [33], using ANN method in estimating dissolved oxygen in their study, stated that ANN is efficient in water quality modeling.
The objective of this study is to estimate the dilution factors of big cruise ships. As mentioned before, a ship whose passenger numbers are more than 500 is in the large ship class. Mathworks® MATLAB Neural Network Toolbox was utilized for ANN processes in this study. Firstly, the dilution factors were calculated with Equation (2) which was proposed by the EPA for 1041 large cruise ships. The calculated dilution factor values by Equation (2) were assumed to be real values. Then the gross ton, the deadweight ton, the passenger numbers, the freeboards, the engine powers, the propeller numbers and the block coefficients values of the 1041 ships were introduced as input values into the artificial neural network. The calculated dilution factors according to Equation (2) were entered as output values into the network.
Since the inputs—gross ton, deadweight ton and passenger number—used in the ANN are directly related to the weight of the ship, load and passenger carrying capacity and the amount of waste water to be produced, these parameters have an effect on the dilution factor. On the other hand, as the other inputs used, the freeboard and the block coefficient (CB) will be directly related to the wake that will occur behind the ship, while the engine power and the number of propellers are related to the turbulence and mixing event that will occur behind the ship, and therefore it is related to the dilution factor, too.
In total, 70% of the input data were used as the training values of the model in accordance with the calculated values by Equation (2). After the training process, 30% of the input values were introduced to the model and the dilution factor values were obtained by ANN. The training functions (TRAINBFG, TRAINBR, TRAINCGB, TRAINCGF, TRAINCGP, TRAINGD, TRAINGDM, TRAINGDA, TRAINGDX, TRAINLM, TRAINOSS, TRAINR, TRAINRP and TRAINSCG) and the learning functions (LEARNGD and LEARNGDM) were used as learning functions. To determine the most suitable ANN method, these estimated values were compared to calculated values. Feed-Forward Backpropagation (FFB) and Cascade-Forward Backpropagation (CFB) methods were used as network types. Mean Squared Normalized Error Performance function (MSE) and Sum Squared Error Performance (SSE) were used as performance and error functions. Log-sigmoid (LOGSIG) and tan-sigmoid (TANSIG) activations functions were used in both input and output; however, linear (PURELIN) activation function was only used in output. The calculations were repeated for 8, 10, 12 neurons. All of these functions were already identified in Mathworks® MATLAB Neural Network Toolbox. The inputs, outputs and functions that were used are tabulated in Table 1.

Table 1.
Inputs, outputs and functions used in ANN model.
FFB and CFB algorithms are very similar to each other. Both algorithms comprise a series of layers. In FFB algorithms, while the first layer transferred the data to the next layer and during the learning progress, the system continues to advance by spreading errors back to achieve a targeted level of learning. CFB algorithms also work with a similar logic. The only difference is that the first layer of CFB algorithms has a link directly to the output layer.
There are three activation functions used in Mathworks® MATLAB Neural Network Toolbox: LOGSIG, TANSIG and PURELIN. While the dynamic range of LOGSIG is in the range [0, 1], TANSIG and PURELIN’s dynamic range is in [−1, 1]. The following three equations present the mathematical expression of the functions [34,35]:
In this study, while LOGSIG and TANSIG functions were used in the hidden layer, TANSIG and PURELIN functions were used in the output layer.
Before the utilization of the functions, the data have to be normalized by the help of the following equations [34,35,36]:
The schematic presentation of the designed ANN system is presented in Figure 1.
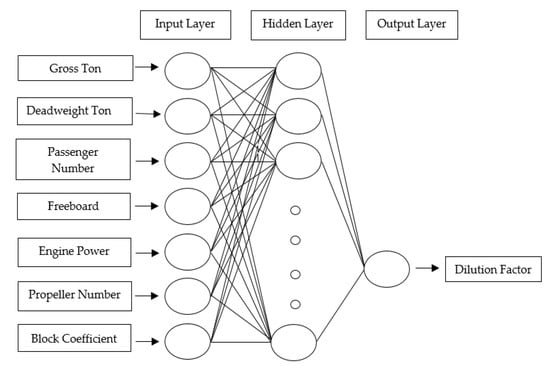
Figure 1.
The ANN model.
In Figure 1, it can be seen that the inputs were transferred to the output layer by the assistance a hidden layer, which included different numbers of neurons. In this study, 8, 10 and 12 neurons were utilized. While Mathworks® MATLAB Neural Network Toolbox program provides 10 as the initial number for neurons, Bal Beşikçi et al. [37] used 12 neurons for another ANN model. Besides, the calculations were repeated for 8 neurons.
4. Results and Discussion
A 1041 × 7 matrix, which means 7 inputs of 1041 big passenger ships, was utilized to operate the ANN model. The data were operated by different ANN models which comprise the network types, activation functions, training functions, learning functions, performance and error functions and three different neuron numbers, which were all identified in Table 1.
The data of 729 (70%) of the 1041 ships were identified into the system as training data in order to train the ANN model. In order to test the training performance of the system, the remaining data of the 312 ships (30%) were defined as the test data to the system. The dilution factors of ships identified as training data were calculated using the dilution factor of EPA (Equation (2)) and defined as the output of the training data. After the learning process was completed, the input of the test vessels was processed by ANN and how close the test vessels approach to the dilution factor value was calculated by the dilution factor formulation. Then, RMSE and MAE were implemented to all results to reach the best ANN model. RMSE and MAE are widely used to determine the accuracy of the ANN models and they are based on the difference between two continuous variables, i.e., the predicted and the obtained results. The formulas of RMSE and MAE are presented as follows [38]:
where;
DFEPA: Dilution factor calculated with EPA formula
DFANN: Dilution factor estimated by ANN
GT: Gross ton (m3)
DWT: Deadweight ton (ton)
PASS: Passenger Number
FRB: Freeboard (m)
EP: Engine power (kW)
PROP: Propeller number
CB: Block coefficient
n: Ship number
Table 2 presents the best 10 ANN results according to the RMSE and MAE methods. The RMSE and MAE results were calculated by implementing the Equations (9) and (10) to all of the results (results of 312 test ships) obtained via the ANN model. The convergence of the results to zero in the RMSE and MAE methods indicates that the system works better. In this study, the best RMSE and MAE values were obtained as 0.05290 and 0.0393 of the ANN model, which was run by the CFB network type, LOGSIG-PURELIN (LOGSIG in the hidden layer, PURELIN function in the output layer) activation function, TRAINCGB training function, LEARNGD learning function, MSE performance and error function and 12 neurons.
Table 2.
The best results according to the RMSE and MAE methods.
Figure 2 and Figure 3 presents the performance and regression graphs for the best ANN model. Figure 2 shows that the ANN model performed a total of 27 iterations and achieved the best result at 21st iteration. After the 21st iteration, the model decided to stop when it reached the best result. This means that the model becomes stable after 21st iteration.
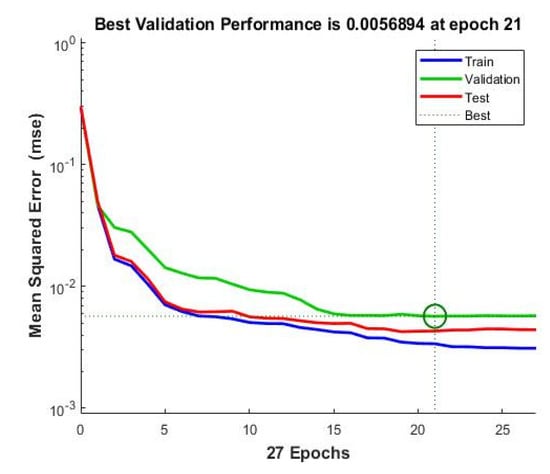
Figure 2.
Performance graphic of the best ANN model.

Figure 3.
Results of regression analysis for the best ANN model.
Mathworks® MATLAB Neural Network Toolbox realizes the learning process by dividing the given training data (70% of all existing data) as default for 70% training, 15% validation and 15% testing. According to Figure 3, the average success rate of the model in training, validation and test processes is 0.93216. Since this R value is very close to 1.0, it can be said that the model has achieved a successful result. The training section means the training performance of the ANN model. Figure 3 shows that the R value of the training is 0.93801, which indicates that the performance is pretty good. The validation section explains the verifying the training of the data and the R value of the validation is 0.9187. The test section was used for another dataset, which is apart from the training dataset. These data were not used during training and thus, the results could be obtained independent from the training. Because the number of data of the test dataset is lower than training dataset’s, the R value is a little worse, 0.9272, which is still in an acceptable level. The weights and biases of the model are presented on Table 3 and Table 4.
Table 3.
The weights and the biases of the first layer (hidden layer).
Table 4.
The weights and bias of the second layer (output layer).
The values presented in Table 3 and Table 4 indicate the effects of each neuron on each input. bi represents the deviation of the values of each input in the corresponding neuron.
The mathematical expression of the weights and the biases as is follow [37]:
where;
i: Neuron number
j: Ship parameters
ui: activity at ith neuron
Wij: jth weight at ith neuron
Xj: the output value at jth layer
bi: bias at ith neuron to layer1
The output values in the hidden layer were calculated by the following formulations as shown in Equation (4).
, and values for 1041 ships were calculated with the ANN model used. The modified equations according to the ANN model are as follows:
The output values in the output layer are calculated by the following formulations as shown in Equation (6).
where;
lwi: weight to layer
b2: bias to layer 2
Using weights and biases of trained ANN model, the normalized value of dilution factor can be given as follows:
where is the normalization value of the dilution factor according to Equation (7).
Seven inputs were entered into the artificial neural networks and dilution factors were obtained as outputs. Figure 4 shows the relationship between the calculated and estimated dilution factors by the ANN for all input values.
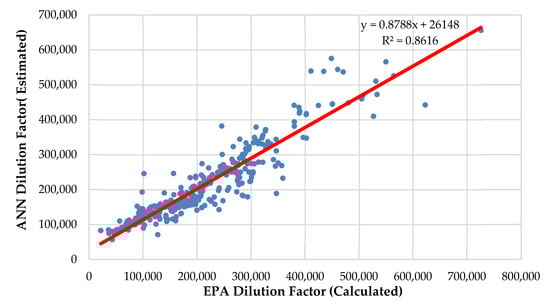
Figure 4.
Calculated and estimated dilution factors for all input values = .
When R2 approaches to 1.0, it means that the estimated and calculated dilution factors approach each other and the error rate decreases.
Which of the seven input parameters is more effective in predicting the dilution factor is important in terms of predicting the dilution factor with less input. Thus, without being dependent on the four parameters (breadth, draft, speed, discharge rate) used by the EPA, it will be easier to estimate the dilution factor with only the most important parameters affecting the dilution factor while in the pre-design stage. Estimation of the dilution factor with fewer input parameters while the ship is still at the preliminary design stage will not require determining the four parameters used in the formula. For this purpose, a decision tree was constituted to calculate the variable rates of importance of the parameters which affect the results obtained by ANN and to specify the dilution factors that can generate depending on the parameters while the ship is in pre-design stage. The decision tree was created by using CART (classification and regression tree) algorithm in R language and a code from the RPART (recursive partitioning for classification) library [39,40,41]. The rates of importance of the variables given as input to artificial neural networks on the dilution factors are shown on Table 5. As can be seen from the Table 5, EP and GT input values were affected the dilution factors by 37% and 29%, respectively.
Table 5.
Rates of importance of ANN for all inputs.
The input data values of EP and GT were both given separately and together to the ANN and then dilution factors were taken as output. Figure 5 shows the relationship between the dilution factor in which ANN is trained only with the engine power data series and the dilution factor calculated by the EPA formula (Equation (2)).
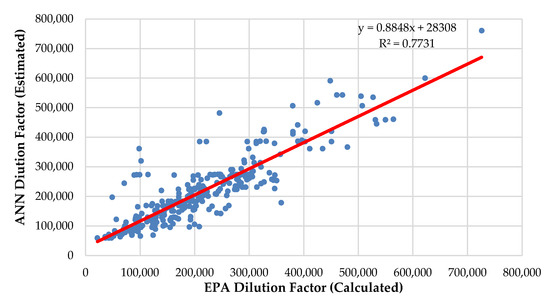
Figure 5.
Calculated and estimated dilution factors for only engine power inputs ( = .
The error analysis of the estimated dilution factors based on the engine power was made with Equations (9) and (10).
Figure 6 shows the relationship between the dilution factors in which ANN is trained only with the GT data series and the dilution factor calculated by the EPA formula.
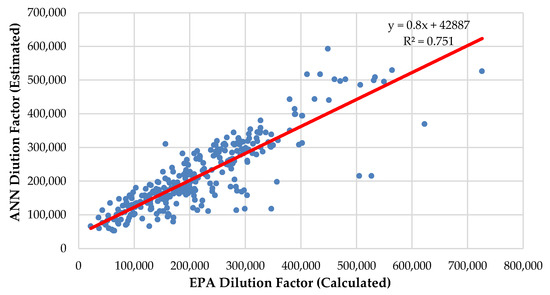
Figure 6.
Calculated and estimated dilution factor for only gross ton inputs ( = .
The error analysis of the estimated dilution factors based on the gross ton was made with Equations (9) and (10).
Figure 7 shows the relationship between the dilution factor in which ANN is trained with engine power and gross ton data series and the dilution factor calculated by the EPA formula.
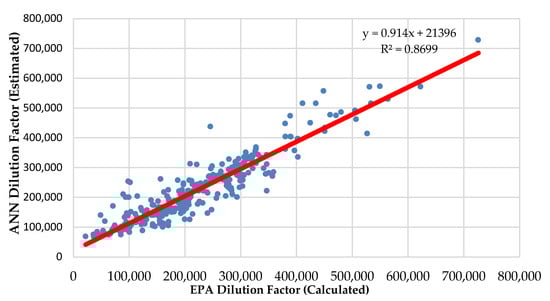
Figure 7.
Calculated and estimated dilution factors for both engine power and gross ton inputs ( = .
The error analysis of the dilution factors which estimated depending on both gross ton and engine power is as follows;
Table 6 shows the RMSE and MAE values of the ANN results. According to the results listed in Table 6 can be said the ANN is sufficient to estimate with an acceptable error the dilution factors of a ship in pre-design stage.
Table 6.
RMSE and MAE values for ANN results.
5. Conclusions
Passenger ships are major wastewater producers in the seas. The ships with bigger capacities, especially, have serious negative effects on the marine environment [5]. Ship-based wastewater has pollutant concentrations such as organic matter, nutrients, suspended solids and coliforms, which constitute a high level of pollution in the marine environment. The level of pollution may increase in time and this is a very important contaminant source for the ecology of oceans and seas today and in the future. In the existing literature, there are few studies about this subject. Further studies are very important for the future of oceans and seas.
This study has been realized using the data of 1041 ships. These are a considerable portion of the large passenger ships which are currently active in the world.
At the beginning of this study the dilution factors of ships were calculated by using the EPA formulation. In this calculation method, the parameters are breadth (m), draft (m), speed (m/s) values of ships and discharging flow rate (m3/s) of wastewater. These calculated dilution factors were accepted as actual. Then the engine powers, the gross ton, the deadweight ton, the freeboard values, the propeller numbers, the block coefficients and the passenger numbers of the same ships were given to ANN model as input values. The data of the 729 ships (70%) of the 1041 ships were identified into the system as training data in order to train the ANN model. In order to test the training performance of the system, the remaining data of the 312 ships (30%) were defined as the test data to the system. The dilution factors were estimated as outputs according to these new parameters by the ANN method. It is important to determine which ones of these seven input parameters are more effective in predicting the dilution factor by using less input. Thus, without being dependent on the four parameters (breadth, draft, speed, discharge rate) used by the EPA, it will be easier to estimate the dilution factor with only the most important parameters affecting the dilution factor while in the pre-design stage. In order to calculate the variable importance of the parameters affecting the dilution factors obtained by ANN, a decision tree was created by using the CART algorithm in R language and a code from the RPART library. The results of the RMSE and MAE performance analyses show that the ANN is sufficient to estimate the dilution factors of the ships with an acceptable error.
As a result of the study, the engine power (37%) and the gross ton (29%) were found to be the two most important parameters affecting the dilution factor.
The RMSE and MAE values of the results were calculated by giving the data of these two values separately and together as input to the best ANN model. The results of RMSE and MAE performance analyses show that introducing engine power only, GT values only, and engine power-GT values together into ANN is also sufficient to estimate the dilution factor with an acceptable error.
The effect of the number of passengers on the dilution factor value was determined to be 12%. According to this result, although the amount of wastewater increases as the number of passengers increases, the amount of dilution will not change substantially. Between the two ships with equal numbers of passengers, the one which has a greater engine power and gross ton shall have a greater dilution factor. The effect of ship block coefficient, freeboard value and propeller number on the dilution factor was 5%, 3% and 1%, respectively. Although these values affect the amount of the dilution on the ship wake, it is thought that their effect on the dilution factor calculation is low due to the fact that the dynamic change intervals in the normalization values in ANN are low. Knowing both engine power and gross ton values alone or together appears to be satisfactory in estimating the amount of dilution that the vessel will generate.
According to the results of this study, if the ship’s tonnage values are known while the ship is in the preliminary design stage, the dilution of the waste water to be made by the ship can be estimated with a very small error.
The main dimensions of the ship are needed for the dilution factor formulation of the EPA, whereas in the model created in this study, only the gross ton and/or engine power of the ship is sufficient to estimate the dilution. Moreover, this new model is also usable for the estimation of dilution factors even if the main dimensions of the ship are not known. Thus, it is possible to have an idea of whether wastewater after discharge will meet the MARPOL and EPA standards.
Author Contributions
Data curation, V.Ş.; Investigation, V.Ş. and N.V.; Methodology, V.Ş. and N.V.; Writing—original draft, V.Ş.; Writing—review & editing, N.V. All authors have read and agreed to the published version of the manuscript.
Funding
This research received no external funding.
Conflicts of Interest
The authors declare no conflict of interest.
References
- Sahin, V.; Vardar, N. A research on the sewage problems of cruise ships in the mediterranean. In Proceedings of the Maritime Transportation and Harvesting of Sea Resources, Lisbon, Portugal, 9–11 October 2017; Volume 2, pp. 853–860. [Google Scholar]
- Marine Environment Protection Committee. Revised Guidelines on Implementation of Effluent Standards and Performance Tests for Sewage Treatment Plants; Marine Environment Protection Committee: London, UK, 2006. [Google Scholar]
- Keskin, H.A. Gemilerden Kaynaklanan Atiklarin Kontrolü Kapsaminda Liman Atik Kabul Tesisi ve Ambarli Limani Örneği. Master’s Thesis, İstanbul Teknik Üniversitesi, İstanbul, Turkey, 2006. [Google Scholar]
- MARPOL Annex IV Regulations for the Prevention of Pollution by Sewage from Ships. Available online: http://www.imo.org/en/OurWork/Environment/PollutionPrevention/Sewage/Pages/Default.aspx (accessed on 3 February 2020).
- U.S. Environmental Protection Agency. Cruise Ship Discharge Assessment Report; U.S. Environmental Protection Agency: Washington, DC, USA, 2008.
- Şahin, V.; Vardar, N. Sewage Treatment Systems of Cruise Ships and the Parameters Affect on Dilution of Effluent at Sea. J. Marit. Mar. Sci. 2015, 1, 25–31. [Google Scholar]
- Westhof, L.; Köster, S.; Reich, M. Occurrence of micropollutants in the wastewater streams of cruise ships. Emerg. Contam. 2016, 2, 178–184. [Google Scholar] [CrossRef]
- Gibson, M.; Murphy, A.J.; Pazouki, K. Evaluation of environmental performance indices for ships. Transp. Res. Part D Transp. Environ. 2019, 73, 152–161. [Google Scholar] [CrossRef]
- Wilewska-Bien, M.; Anderberg, S. Reception of sewage in the Baltic Sea–The port’s role in the sustainable management of ship wastes. Mar. Policy 2018, 93, 207–213. [Google Scholar] [CrossRef]
- Wang, G.; Li, K.X.; Xiao, Y. Measuring marine environmental efficiency of a cruise shipping company considering corporate social responsibility. Mar. Policy 2019, 99, 140–147. [Google Scholar] [CrossRef]
- Backer, H. Regional work on prevention of pollution from ships in the Baltic Sea–A paradox or a global forerunner? Mar. Policy 2018, 98, 255–263. [Google Scholar] [CrossRef]
- Wilewska-Bien, M.; Granhag, L.; Andersson, K. The nutrient load from food waste generated onboard ships in the Baltic Sea. Mar. Pollut. Bull. 2016, 105, 359–366. [Google Scholar] [CrossRef]
- Jirka, G.H. Integral Model for Turbulent Buoyant Jets in Unbounded Stratified Flows Part 2: Plane Jet Dynamics Resulting from Multiport Diffuser Jets. Environ. Fluid Mech. 2006, 6, 43–100. [Google Scholar] [CrossRef]
- Zhao, L.; Chen, Z.; Lee, K. Modelling the dispersion of wastewater discharges from offshore outfalls: A review. Environ. Rev. 2011, 19, 107–120. [Google Scholar] [CrossRef]
- Martin, J.L.; McCutcheon, S.C.; Schottman, R.W. Hydrodynamics and Transport for Water Quality Modeling; CRC Press: Boca Raton, FL, USA, 2018. [Google Scholar]
- Davis, L.R. Fundamentals of Environmental Discharge Modeling; CRC Press: Boca Raton, FL, USA, 1999. [Google Scholar]
- Mestres Ridge, M. Three-Dimensional Simulation of Pollutant Dispersion in Coastal Waters. Ph.D. Thesis, Universitat Politècnica de Catalunya, Barcelona, Spain, 2002. [Google Scholar]
- Jirka, G.H. Multiport Diffusers for Heat Disposal—A Summary. J. Hydraul. Div. Am. Soc. Civ. Eng. 1982, 108, 1423–1468. [Google Scholar]
- Bleninger, T.; Jirka, G. Near- and far-field model coupling methodology for wastewater discharges. Environ. Hydraul. Sustain. Water Manag. Two Vol. Set 2004, 447–453. [Google Scholar] [CrossRef]
- Speight, J.G. Sorption, Dilution, and Dissolution; Elsevier: New York, NY, USA, 2018; ISBN 9780128044223. [Google Scholar]
- Loehr, L.C.; Atkinson, M.; George, K. Using a Simple Dilution Model to Estimate Wastewater Contaminant Concentrations Behind Moving Passenger Vessels. In Proceedings of the Oceans 2003, San Diego, CA, USA, 22–26 September 2003; Volume 1, pp. 390–393. [Google Scholar]
- Loehr, L.C.; Beegle-krause, C.; George, K.; Mcgee, C.D.; Mearns, A.J.; Atkinson, M.J. The significance of dilution in evaluating possible impacts of wastewater discharges from large cruise ships. Mar. Pollut. Bull. 2006, 52, 681–688. [Google Scholar] [CrossRef]
- Venkatramanan, S.; Chung, S.Y.; Selvam, S.; Son, J.H.; Kim, Y.J. Interrelationship between geochemical elements of sediment and groundwater at Samrak Park Delta of Nakdong River Basin in Korea: Multivariate statistical analyses and artificial neural network approaches. Environ. Earth Sci. 2017, 76, 1–12. [Google Scholar] [CrossRef]
- Mubiru, J. Using Artificial Neural Networks to Predict Direct Solar Irradiation. Adv. Artif. Neural Syst. 2011, 2011, 142054. [Google Scholar] [CrossRef]
- Amely Jumaat, S.; Crocker, F.; Helmy Abd Wahab, M.; Hanis Mohammad Radzi, N.; Fakri Othman, M. Prediction of Photovoltaic (PV) Output Using Artificial Neutral Network (ANN) Based on Ambient Factors. J. Phys. Conf. Ser. 2018, 1049. [Google Scholar] [CrossRef]
- Hanbay, D.; Turkoglu, I.; Demir, Y. Prediction of wastewater treatment plant performance based on wavelet packet decomposition and neural networks. Expert Syst. Appl. 2008, 34, 1038–1043. [Google Scholar] [CrossRef]
- Keiner, L.E.; Yan, X.H. A neural network model for estimating sea surface chlorophyll and sediments from thematic mapper imagery. Remote Sens. Environ. 1998, 66, 153–165. [Google Scholar] [CrossRef]
- Panda, S.S.; Garg, V.; Chaubey, I. Artificial Neural Networks Application in Lake Water Quality Estimation Using Satellite Imagery. J. Environ. Inform. 2004, 4, 65–74. [Google Scholar] [CrossRef]
- Abyaneh, H.Z. Evaluation of multivariate linear regression and artificial neural networks in prediction of water quality parameters. J. Environ. Health Sci. Eng. 2014, 12, 6–13. [Google Scholar] [CrossRef]
- Elhatip, H.; Kömür, M.A. Evaluation of water quality parameters for the Mamasin dam in Aksaray City in the central Anatolian part of Turkey by means of artificial neural networks. Environ. Geol. 2008, 53, 1157–1164. [Google Scholar] [CrossRef]
- Ranković, V.; Radulović, J.; Radojević, I.; Ostojić, A.; Čomić, L. Neural network modeling of dissolved oxygen in the Gruža reservoir, Serbia. Ecol. Modell. 2010, 221, 1239–1244. [Google Scholar] [CrossRef]
- Saber, A.; James, D.E.; Hayes, D.F. Estimation of water quality profiles in deep lakes based on easily measurable constituents at the water surface using artificial neural networks coupled with stationary wavelet transform. Sci. Total Environ. 2019, 694, 133690. [Google Scholar] [CrossRef] [PubMed]
- Sarkar, A.; Pandey, P. River Water Quality Modelling Using Artificial Neural Network Technique. Aquat. Procedia 2015, 4, 1070–1077. [Google Scholar] [CrossRef]
- Tahani, M.; Vakili, M.; Khosrojerdi, S. Experimental evaluation and ANN modeling of thermal conductivity of graphene oxide nanoplatelets/deionized water nanofluid. Int. Commun. Heat Mass Transf. 2016, 76, 358–365. [Google Scholar] [CrossRef]
- Chiteka, K.; Enweremadu, C.C. Prediction of global horizontal solar irradiance in Zimbabwe using artificial neural networks. J. Clean. Prod. 2016, 135, 701–711. [Google Scholar] [CrossRef]
- Deo, R.C.; Wen, X.; Qi, F. A wavelet-coupled support vector machine model for forecasting global incident solar radiation using limited meteorological dataset. Appl. Energy 2016, 168, 568–593. [Google Scholar] [CrossRef]
- Bal Beşikçi, E.; Arslan, O.; Turan, O.; Ölçer, A.I. An artificial neural network based decision support system for energy efficient ship operations. Comput. Oper. Res. 2016, 66, 393–401. [Google Scholar] [CrossRef]
- Chai, T.; Draxler, R.R. Root mean square error (RMSE) or mean absolute error (MAE)?—Arguments against avoiding RMSE in the literature. Geosci. Model Dev. 2014, 7, 1247–1250. [Google Scholar] [CrossRef]
- Atkinson, E.J.; Therneau, T.M. An Introduction to Recursive Partitioning Using the RPART Routines. Mayo Clin. Sect. Biostat. Tech. Rep. 2000, 61, 33. [Google Scholar]
- Edali, M.; Yücel, G. Automated analysis of regularities between model parameters and output using support vector regression in conjunction with decision trees. Jasss 2018, 21. [Google Scholar] [CrossRef]
- Loh, W.Y. Classification and regression trees. Wiley Interdiscip. Rev. Data Min. Knowl. Discov. 2011, 1, 14–23. [Google Scholar] [CrossRef]
© 2020 by the authors. Licensee MDPI, Basel, Switzerland. This article is an open access article distributed under the terms and conditions of the Creative Commons Attribution (CC BY) license (http://creativecommons.org/licenses/by/4.0/).