Abstract
In East Taiwan, coastal settlements are scattered and narrowly confined between the Coastal Mountain and the Pacific Ocean. These settlements are currently at risk as there is no room for retreat. Therefore, it is essential to conduct a comprehensive and continuous hazard assessment in these coastal residential areas. In order to avoid biased towards the natural environment, the factors that cannot easily be built within the geographic information system (GIS) database are distinguished by Unmanned Aerial Vehicle (UAV) to conduct a vulnerability assessment of threats to coastal zones. The method: we used the east coast of Taiwan as an example, through GIS and statistical analysis in land-use status, vulnerable population groups and UAV landscape signs of indicators of erosion and accumulation. Through the main output of an intuition scatter map, the erosion landscape susceptibility, economical land-use exposure, and special population groups’ ratio allowed for the easy comparison of the vulnerability, risk level and resilience between different coastal settlements. These diverse observation aspects of risk assessment results can provide prevention and control strategies that meet the different needs of coastal risk management in restricting and strengthening the land-use development of communities.
1. Introduction
Two percent of the world’s surface is 10 meters above sea level. However, more than 10% of the world’s population lives in these islands, low-lying coastal areas and deltaic coastal areas [1,2]. In Taiwan, the sea-level change rate is much higher than the global average [3]. Waves with heights of three to five meters are common when the northeast monsoon blows along the coast in winter, and the typhoons in summer often cause huge waves to reach seven meters. These particularly affect the East Coast of Taiwan, which is comprised of the Coastal Mountain and is bordered by the Pacific Ocean. The East Coast contains scattered coastline settlements for more than 100 kilometers. Under the threat of global warming, it continues to be exposed to risks such as sea-level rise, coastal zone erosion, storm surges, and extreme rainfall [4].
One effective way to prevent coastal environmental disasters is to design coastal receding or disaster buffer zones by limiting land use and population growth in disaster-prone areas. Taking Central and South America as examples, under the conditions of different aspects of economy, ecology and disaster, development has been restricted in coastal areas that are between 10 to 200 meters. [5].
Taiwan’s “Coastal Management Plan” restricts development in coastal areas by distinguishing its coast into first-class coastal protected areas in which development is forbidden, and second-class protected areas which can be developed conditionally after review [6]. There is no first-level coastal protection zone on the eastern coast of Taiwan, and three coastal sections the longest area designated as a second-class protected areas, totaling 109 kilometers and comprising 31.4% of the eastern coastline, are classified within the second-level protection zone [7]. It is clear these descriptions that the coastal erosion problem is common for all the settlements discussed in this article.
However, the natural environment has a very limited plain area, and the management plan does not offer an effective solution for the prevention of environmental disasters. Restricting land use and development in offshore land settlements requires more detailed landscape and land-use surveys and education to local populations on the importance of respecting the environment to limit disasters.
The hazard assessment-incorporated basic data of the coastal area settlements was obtained from an environmental survey using remote sensing and GIS to refine the resolution of coastal assessments to the nearby coastal settlements. Considering four aspects of the coastal settlements, namely the risk level of erosion of the landscape, the environmental vulnerability of the land use, peoples’ exposure at the time of the disaster, and the ratio of old and young people in the settlement population, the coastal settlements were visualized in an intuition scatter bubble chart using the assessment results. This allowed us to provide a solution for disaster avoidance without detailed information on the coastal settlements.
The research area is over 100 km long and 1 km wide, encompassing narrow coastal settlements of eastern Taiwan located near the Coastal Mountain and the Pacific Ocean. The following coastal settlements were considered in this study: Shoufeng Township’s Fudekeng, Yanliao, Ganzishu, and Shuilian, Fengbin Township’s Jiqi, Guian, Xinfeng, Libi, Xinshe, Xinzhuang, Dongxing, Yongfeng, Fengbin, Lide, Lifu, Shiti, Shitiping, Gangkou, Dagangkou, Jingpu, and Sanfu, totaling 21 settlements.
2. The Evaluation of the Vulnerability of Coastal Areas Review
The Reviewing Office of the United Nations Disaster Relief Coordinator (UNDRC), The UN Office for Disaster Risk Reduction (UNDRR), and Intergovernmental Panel on Climate Change (IPCC) research reports on environmental disasters in coastal areas show that the concept of vulnerability is constantly adjusted over time. For example, vulnerability analyzed by the UNDRC considers the risk of static socio-economic factors such as population, architecture, economy, and infrastructural elements [8]. UNDRR emphasizes the susceptibility of these natural, social, economic and environmental factors on the impact of harm [9]. In addition to the factors that increase susceptibility, the IPCC also proposes the concepts of coping, adaptability, and resilience [10].
In 1979, a static concept of abstraction and vulnerability of potential natural hazards that occurred in a specific period and region. In 2004, this concept was developed to include the dynamic measurement of the sensitivity of the economic or human life dynamics to increased loss exposure and risk level, more emphasis on adaptability and resilience after disasters. Until now, emphasizing disaster reduction and sustainable development is to respond to the aforementioned process of static, dynamic, and resilient reconstruction in order to achieve the goal of "more disaster resistance". For example, UNDRR, “Sendai Framework for Disaster Risk Reduction 2015–2030” passed by the meeting of the third World Disaster Reduction Conference was held in Sendai, Miyagi Prefecture, Japan, March 2015 [11].
More recent studies focused on the evaluation of the vulnerability of coastal areas make use of the Coastal Vulnerability Index (CVI), which is calculated using a combination of six parameters, namely terrain, coastline change, coast slope, relative sea-level rise, wave height, and tidal range, and is widely used in many countries [12,13,14,15,16,17]. The advantage of using the CVI and applying GIS and remote sensing data in spatial analysis is the rapid understanding of the natural environment of coastal areas. However, as can be seen from the literature, the inadequacy of using only one point of view and two indices were estimated—not only the single aspect of CVI indicators, but also the Social Vulnerability Index (SVI) in the assessment of the vulnerability of the coastal settlement environment [18]. It can also prove that this article, using comprehensive multiple aspects indicators, socio-economic environmental factors and landscape is a better way of coastal settlement hazard assessment.
3. Research Method
It can be learned from the literature review mentioned above that the assessment of coastal erosion in settlements requires different considerations. The first indicator of this study uses UAV to look for signs of erosion or the deposition of landscape, which is the first comprehensive risk level aspect. Calculating the possible economic loss when settlements are affected by disasters in coastal areas from the GIS database of land-use survey is the second environmental vulnerability aspect. The population exposures of settlements and the ratio of old and young people in the settlement of vulnerable groups from statistics is the third aspect.
3.1. Indicators of Erosion and Accumulation
The factors that contribute to the dynamic change of the coastal environment are not only from the physical environment of nature, such as earthquakes, tsunamis, storm surges, waves, sea-level rise, and tectonic changes, but also from various human activities, including newborn land formation along the coast due to large breakwaters concrete or sand extraction, coastal sand drifting blocked by large coastal structures, reduction of river sediment transport by reservoirs and sand dams, and the over-pumping of groundwater by coastal aquaculture fisheries [6].
While such coastal disasters cannot be interpreted by a single factor, they are often attributable to the combined effects of land utilization by humans, and the interactions between coastal protection and the natural environment, maintaining a delicate dynamic balance in these sensitive and fragile coastal areas.
In France, the Regional Coastal Hazards Observatory (OR2C) uses drones for the coastal land monitoring of the erosion of the Atlantic coast [19]. Drone surveys thus provide valuable information for assessing the factors of erosion and accumulation of coastlines cannot easily been built within the GIS database. This study therefore made use of a drone aerial photography survey of landscape signs in coastal settlements to assess coastal vulnerability, as shown in Figure 1.
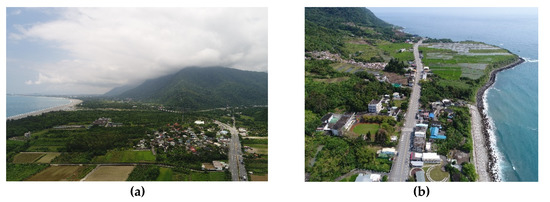
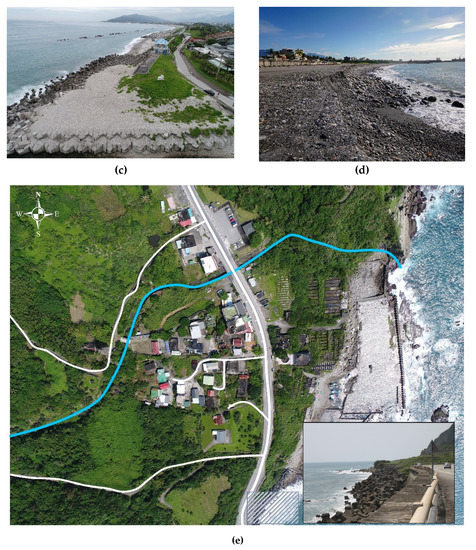
Figure 1.
Examples of landscape signs and drone aerial photography survey in coastal settlements. (a) large area of planted windbreaks built along the coast; (b) coastal landforms due to orographic uplift; (c) multilayer concrete or offshore breakwaters; (d) erosion scarps along the shoreline; (e) several bank revetments that seem to be newly built
Furthermore, disaster-inducing risks to coastal settlements were evaluated using the indices of erosion and deposition signs to respond to the more direct impact brought by these complex environments. Each symptom factor is given a point. The more the settlement’s coastal pattern or landscape meets the description of the erosion index, the higher the score of the erosion sign. The score for signs of erosion minus points for deposition signs give a total score, indicating that this settlement is subject to a slight risk of erosion. Conversely, if the settlement coast has more items that match the deposition landscape, the deposition score will be higher.
For each coastal settlement within the scope of the study, the aforementioned methods were used to obtain an evaluation score of coastal settlement erosion signs in Table 1. The checklist of cause can be adjusted according to the actual situation depending on the survey area and special conditions or different countries.

Table 1.
Drone aerial photographs of signs corresponding to ground survey photos.
3.2. Evaluation of the Extent of Exposure to Coastal Hazards from the Settlement Land Use
Taking into account the rapid changes in the socio-economic environment and actual needs in Taiwan, the Ministry of the Interior promotes a case-by-case investigation and mapping of land use every 10 years, starting in 1990. This study uses the results of the most recent (2015) land-use survey. The existence of very fine scales and well-categorized land-use survey data for the country allow for a detailed calculation of the disaster potential hazard areas and possible resultant economic losses.
Countries without survey data can use satellite imagery to perform similar calculations. Therefore, for coastal settlements only, according to the extent of the vulnerability of coastal erosion, three major land-use categories can be identified: construction, transportation and open space, as displayed in Table 2.

Table 2.
Settlement area showing different land-use patterns within the coastal land area.
The aforementioned land-use survey is the result of a detailed land-use classification system. For example, the transportation category includes the public facilities in the settlements, the construction category is highly exposed to disasters, and open space represents low-level development in the face of disasters. The area percentage of these categories in the settlement area represents the economic loss of the settlement after the disaster in Figure 2. This method can be appropriately adjusted according to the resolution of existing land-use data. Vulnerability refers to a system’s exposure to damage or capacity for loss for a given hazard [21]. This study used the percentage of construction area in the coastal settlement as an indication of the vulnerability of settlements.
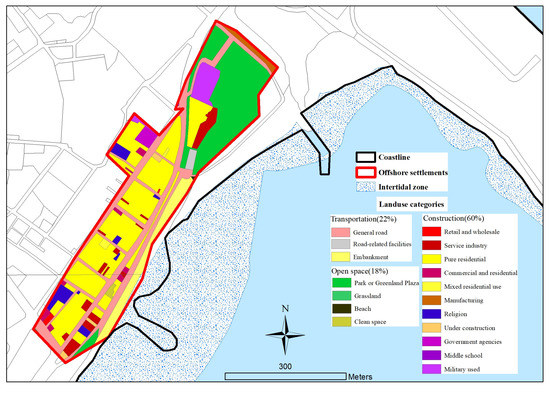
Figure 2.
Land-use category area distribution within the settlement area.
3.3. Estimation of the Number of People in the Settlement Area
The settlement area that may be affected by coastal erosion is usually not the smallest unit of statistics. There is no direct population or special age group statistics. Therefore, it must be calculated from GIS estimations of address matching or rooftop number.
Many countries, including Taiwan, have point coordinates for each household’s address, therefore, after overlaying the area of the settlement polygon on the map in GIS, the total number of households in the settlement can be calculated. According to the statistical data, the average population of each household in the village in the smallest statistical unit provides an accurate estimation of the population of the settlement. In the same way, an estimation of the population under 14 years old and over 65 years old, who will struggle to a greater extent to recover after disasters, can be obtained.
In countries where only satellite imagery is available, the actual number of roofs on each street block within the settlement can be counted. Using the ratio with the smallest statistical unit, the actual population in each settlement can also be deduced, as shown in Figure 3.
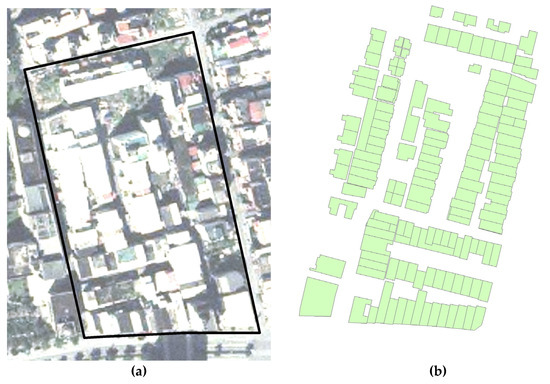
Figure 3.
Population estimation by means of rooftop counting. (a) Orthophoto or satellite image; (b) Rooftop digitizing.
4. Results
In summary, the coastal disaster risk assessment of this research incorporates four parameters determined from remote sensing and GIS, as shown in Table 3. The first factor is the use of drone and ground landscape surveys to comprehensively determine the degree of erosion and deposition of coastal settlements. The second factor is the calculation of high-risk areas, such as construction or economic areas, and the loss as a percentage of the total settlement land-use area using environmental survey data. In addition to the effects of possible exposure on properties, the third factor involves the population of the settlement, thereby addressing the exposure of human life. The fourth factor involved understanding the population ratio of vulnerable residents, the old and young, when the risk of coastal hazards between different settlements is high.

Table 3.
Assessment of the different settlements in the study area.
In Figure 4, the Y-axis is used as the percentage of construction land use that has the highest vulnerability to coastal erosion in the settlement; the X-axis is the percentage of the vulnerable young and elderly population in the settlement. The population of the settlements is represented by the size of the symbol, which allows for a visual comparison of the threats of erosion to different population sizes in the same coastal environment. The color represents the degree of coastal erosion and deposition in the landscape survey. Red represents erosion and green represents deposition, with deeper shades representing higher degrees of erosion/deposition. This system allows for a good risk assessment of the different settlements.
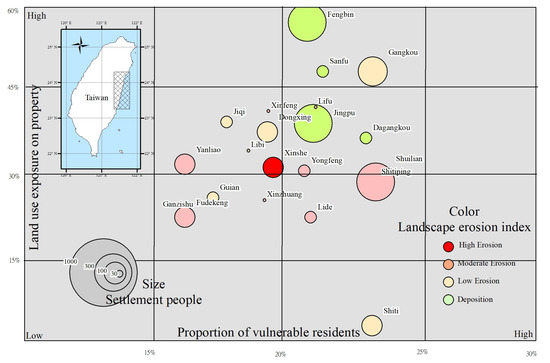
Figure 4.
Coastal settlement vulnerability assessment on the eastern side of Taiwan
Taking Xinshe settlement as an example, the red circle representing the settlement indicates that the landscape is encountering severe coastal erosion. In addition, the construction land-use ratio and the vulnerable population percentage are both median compared with other settlements in the same environment, therefore Xinshe falls in the center of the bubble chart. In contrast, Fengbin settlement has a relatively large population, so the circle diameter is large; the coast is in a state of deposition, and the land is mostly highly utilized for construction and economic purposes, therefore this settlement falls in the upper part on the bubble chart. As the population of the Shuilian settlement population is large, the symbol is also large; the proportion of young and elderly people is high, hence it occurs on the right-hand side of the chart; the coastal settlement is moderately eroded, therefore the circle is light orange-red in color.
5. Discussion and Conclusions
The accessibility of the Taiwan eastern coastal environment is not as good as further inland, and the difficulty of a comprehensive environmental investigation is relatively high. Therefore, existing investigation methods must be used to determine the coastal impact on the population of the local settlements.
The use of drones, which are a relatively cheap and popular survey tools, are highly effective for use in research involving remote sensing image surveys. In just 10 minutes from take-off to landing, drones capture hundreds of high-resolution orthographic or side shots. The coastal landscape formed as a result of numerous erosional and depositional events occurring in the area. Landscape survey methods are used to explore these high volumes of images, and interviews with residents as well as field surveys can assist in assessing the risk level of erosion for each nearshore settlement. Simply treating each erosion and deposition factor equally may not reflect the decisive influence on the coastal settlement. However, intuition is the biggest advantage of this method. The judgment criteria’s checklist can also be adjusted in different coastal environments per local environmental conditions. This method of quantifying the landscape checklist through drone photography and on-site surveys serve as an important reference for assessing the risk level threat of coastal erosion facing coastal settlements.
The second way to understand the coastal settlement is to assess the data from land-use surveys. This is a very suitable method in Taiwan where comprehensive environmental surveys exist for the island. The investigation of land use in Taiwan has been actively promoted since the establishment of the “National Land Information System Basic Environment Construction Plan” by the central government in the 1990s, so it has accurate and complete survey data with a high resolution and integrity. Therefore, it can be used as a calculation basis for the exposure of construction land use under the threat of coastal erosion as for the concept of vulnerability faced by coastal settlements. The categorization of land use into three categories, namely construction, transportation, and open space, allows for this method to be used in other countries where survey data do not exist and satellite images with lower resolutions are used. The results indicate that it is already possible to correctly and effectively judge the economic development of near-shore settlements. To determine the actual economic loss experienced by coastal settlements due to erosion, a more detailed calculation of economic loss using drone images to investigate is necessary.
Observing the degree of threat to settlements from coastal disasters using various assessment factors, it can be seen that different settlements are significantly affected, which means that the threats to coastal settlements should not be evaluated in a single aspect.
In the assessment of coastal disasters, in addition to the assessment of landscape and land-use economic property loss, this study also focused on the awareness of disasters in coastal settlements. Considering that resilience is one of the main focuses of modern environmental disaster research when disasters occur, residents need to rely on their disaster prevention, responses and recovery. Therefore, the age composition of the elderly and young should be determined. The population ratio of these vulnerable groups with a certain degree of correlation should be considered in the face of disaster resilience. However, survey data such as population or age composition can usually only be counted in the minimal administrative unit, the village, and cannot be directly applied in an environment where a village may include multiple coastal settlements.
The third way to understand coastal settlements from a comprehensive dataset is to assess census survey data. Using orthophoto images, we can directly calculate the number of households or roofs in the settlements, and then estimate the statistical data by determining the average number of people per household in the village. From the results of the study, it can be seen that this estimation is very close to the real numbers, and therefore, the method employed is an effective method.
The results of the study also indicate that this method of assessing the hazard of the coastal settlements is not only intuitive, effective and fast, but also meets the needs of assessing the exposure and resilience of vulnerable coastal settlements. The study area takes the eastern coast in Taiwan most susceptible to coastal erosion as an example. The results show that, from the observed indicators, in addition to the impact of the natural environment, under the influence of other human activities, the influence is no less than natural factors, and it also has a strong impact on coastal erosion. In addition to the CVI or GIS numerical database survey, coastal disaster assessment can be combined with aerial photography landscape methods.
Author Contributions
Conceptualization, S.-W.L.; Data curation, C.-F.Y.; Funding acquisition, C.-H.C.; Investigation, S.-W.L. and L.-J.W.; Methodology, S.-W.L.; Project administration, S.-W.L.; Resources, C.-H.C. and H.-J.S.; Validation, C.-H.C.; Writing–original draft, S.-W.L.; Writing–review & editing, C.-F.Y. All authors have read and agree to the published version of the manuscript.
Funding
This research was funded by “National Science and Technology Center for Disaster Reduction” in Taiwan, grant number NCDR-S-108018.
Acknowledgments
We would like to thank valuable comments from anonymous reviewers and all participants who made this study possible.
Conflicts of Interest
The authors declare no conflict of interest.
References
- Helderop, E.; Grubesic, T.H. Social, geomorphic, and climatic factors driving US coastal city vulnerability to storm surge flooding. Ocean Coast. Manag. 2019, 181, 104902. [Google Scholar] [CrossRef]
- McGranahan, G.; Balk, D.; Anderson, B. The rising tide: Assessing the risks of climate change and human settlements in low elevation coastal zones. Environ. Urban. 2007, 19, 17–37. [Google Scholar] [CrossRef]
- Tseng, Y.H.; Breaker, L.C.; Chang, E.T.Y. Sea level variations in the regional seas around Taiwan. J. Oceanogr. 2010, 66, 27–39. [Google Scholar] [CrossRef]
- IPCC. Global Warming of 1.5 °C; United Nations: New York, NY, USA, 2018; pp. 1–616. [Google Scholar]
- Perez-Cayeiro, M.L.; Chica-Ruiz, J.A.; Garrido, M.A.; Bedoya, A.M. Revising the limits of the coastal area in the regulations of the iberoamerican region. Are they appropriate for risk management and adaptation to climate change? Ocean Coast. Manag. 2019, 181, 104912. [Google Scholar] [CrossRef]
- Interior, M.O.T. Integrated Coastal Management Plan; National Science and Technology Center for Disaster Reduction: Taipei, Taiwan, 2017; pp. 1–195. [Google Scholar]
- The 9th River Management Office, Water Resource Agency. Hualien Coastal Protection Plan; NCKU Hydraulic and Ocean Engineering R&D Foundation: Tainan, Taiwan, 2019. [Google Scholar]
- UNDRO. Nature Disasters and Vulnerability Analysis; United Nations Disaster Relief Coordinator: New York, NY, USA, 1979; p. 8. [Google Scholar]
- UNDRR. Living with Risk: A Global Review of Disaster Reduction Initiatives; United Nations Inter-Agency Secretariat of the International Strategy for Disaster Reduction: Geneva, Switzerland, 2004; p. 16. [Google Scholar]
- IPCC. Climate Change 2014: Impacts, Adaptation, and Vulnerability Part A: Global and Sectoral Aspects; Press, C.U., Ed.; Intergovernmental Panel on Climate Change: New York, NY, USA, 2014; p. 5. [Google Scholar]
- UNDRR. Sendai Framework for Disaster Risk Reduction 2015–2030; United Nations Special Representative of the Secretary-General for Disaster Risk Reduction: Geneva, Switzerland, 2015; p. 35. [Google Scholar]
- Djouder, F.; Boutiba, M. Vulnerability assessment of coastal areas to sea level rise from the physical and socioeconomic parameters: Case of the Gulf Coast of Bejaia, Algeria. Arab. J. Geosci. 2017, 10, 299. [Google Scholar] [CrossRef]
- Hereher, M.E. Coastal vulnerability assessment for Egypt’s Mediterranean coast. Geomat. Nat. Hazards Risk 2015, 6, 342–355. [Google Scholar] [CrossRef]
- Hoque, M.A.; Ahmed, N.; Pradhan, B.; Roy, S. Assessment of coastal vulnerability to multi-hazardous events using geospatial techniques along the eastern coast of Bangladesh. Ocean Coast. Manag. 2019, 181, 104898. [Google Scholar] [CrossRef]
- Islam, M.A.; Mitra, D.; Dewan, A.; Akhter, S.H. Coastal multi-hazard vulnerability assessment along the Ganges deltaic coast of Bangladesh-A geospatial approach. Ocean Coast. Manag. 2016, 127, 1–15. [Google Scholar] [CrossRef]
- Rajan, S.M.P.; Nellayaputhenpeedika, M.; Tiwari, S.P.; Vengadasalam, R. Mapping and analysis of the physical vulnerability of coastal Tamil Nadu. Hum. Ecol. Risk Assess. 2019, 1–17. [Google Scholar] [CrossRef]
- Karymbalis, E.; Chalkias, C.; Chalkias, G.; Grigoropoulou, E.; Manthos, G.; Ferentinou, M. Assessment of the sensitivity of the southern coast of the Gulf of Corinth (Peloponnese, Greece) to sea-level rise. Cent. Eur. J. Geosci. 2012, 4, 561–577. [Google Scholar] [CrossRef]
- Tragaki, A.; Gallousi, C.; Karymbalis, E. Coastal hazard vulnerability assessment bsed on geomorphic, oceanographic and demographic parameters. Land 2018, 7, 56. [Google Scholar] [CrossRef]
- Kerguillec, R.; Audere, M.; Baltzer, A.; Debaine, F.; Fattal, P.; Juigner, M.; Launeau, P.; Le Mauff, B.; Luquet, F.; Maanan, M.; et al. Monitoring and management of coastal hazards: Creation of a regional observatory of coastal erosion and storm surges in the pays de la Loire region (Atlantic coast, France). Ocean Coast. Manag. 2019, 181, 104904. [Google Scholar] [CrossRef]
- National Land Surveying and Mapping Center. Land Use Investigation of Taiwan. 2019. Available online: https://www.nlsc.gov.tw/LUI/Home/Content_Home.aspx (accessed on 1 January 2020).
- Grubesic, T.H.; Matisziw, T.C. A typological framework for categorizing infrastructure vulnerability. Geojournal 2013, 78, 287–301. [Google Scholar] [CrossRef]
- National Science and Techonolgy Center for Diaster Reduction (NCDR). Coastal Settlement Environment Investigation and Disaster Risk Assessment Research; National Dong Hwa University College of Environmental Studies Diaster Prevention Center: Taiwan R.O.C., 2019. [Google Scholar]
© 2020 by the authors. Licensee MDPI, Basel, Switzerland. This article is an open access article distributed under the terms and conditions of the Creative Commons Attribution (CC BY) license (http://creativecommons.org/licenses/by/4.0/).