Abstract
The floating oil can drift to the coastal areas and interact with the shoreline substrates after oil spill accidents. This process is demonstrated to be the cause of the formation of oil-contaminated sediments, which has attracted much attention. However, no systematic study has concerned the desorption process of oil from oil-contaminated sediments when the coastal hydrodynamic conditions change. This work determines the effects of wave conditions and particle size on the release of oil from artificially prepared sediments in a wave tank. Nonlinear fitting results show that the oil release kinetic curves can be correctly estimated with the Lagrangian first-order (LFO) first-order equation. Under different test conditions. The oil concentration in the water increases rapidly within 6 h. However, the oil desorption is inhibited thereafter and the process of sorption occurs dominantly. Under higher wave energy, the process of desorption is significantly enhanced and more large oil droplets release from sediments. Under the same wave condition, small oil droplets firstly release from the sediments. Besides, more oil especially with a larger size can release from larger sediment while oil releases more quickly from smaller sediment.
1. Introduction
Marine oil spill accidents occur frequently with the development of oil transportation and offshore oil exploitation [1]. It is reported that the worldwide oil spills have released approximately 1,300,000 metric tonnes of oil into seas annually [2]. These oil spills not only destroy aquatic habitants but also adversely affect the health of the population near oil spill shorelines. In most cases, the density of spilled oil is lower than seawater and tends to form multiple surface slicks, mousses, and sheens due to the natural weathering processes including evaporation, emulsification, dissolution, dispersion, and photo-oxidation [3]. Traditional recovery of the spilled oil is mainly based on the physical methods such as booming and skimming. Furthermore, using chemical dispersants to cleanup oil spills from offshore production sources is also a technical response [4]. However, emergency strategies are sometimes not carried out on the oil spills timely and effectively. Subsequently, the untreated floating oil will be driven by wind, currents and wave action, further drift to the nearshore areas and stranded on the shoreline [5,6]. For example, the oil tanker Amoco Cadiz ran aground on Portsall Rocks on 16 March 1978, resulting in 246 million liters of oil being spilled into the sea. Prevailing westerly winds during the following days spread the floating oil along the coast and reached the Côtes d’Armor one week after the accident. The 2010 Deepwater Horizon oil spill released around 780 million liters of crude oil into the water, and a considerable amount of this spilled oil first arrived on Alabama’s shoreline ten days after the accident [7].
Once reached shorelines, the floating oil will undergo strong adhesion onto the sand or pebbles, which depends on the oil type and its characteristics, especially viscosity [8,9]. Generally, oil was deposited along the shoreline in three zones. Oil that remains in the subtidal zone is in the form of submerged oil mats and oil that remains in the supratidal zone performs as small surface residue balls (SRBs). By comparison, oil that remains in the intertidal zone will most likely penetrate into the shoreline substrates up to a few centimetres, which often refers to the oil-contaminated sediments containing a significant amount of polycyclic aromatic hydrocarbons [10,11]. However, studies have confirmed that the oil is not stranded steadily on the sediments all the time. Some of the oil from an oil-contaminated beach can be removed naturally by environmental processes such as evaporation, oxidation and biodegradation [12,13]. With an incoming tide, it can also separate from the sediments through the process of desorption, further transport into the water column [14]. The desorption behaviour is important for understanding fates of various pollutants including crude oil in a marine environment, as it may cause severe damage to shallow ecosystems.
Previous studies have mostly focused on the sorption behaviour of polycyclic aromatic hydrocarbons (PAHs) on the sediments, including effects of oil type, mixing time, temperature, and salinity [15,16,17,18,19]. Nevertheless, only a few studies focused on the desorption of oil pollutants from oil-contaminated sediments. In shallow coastal waters, the process of sediment transport and pollutant release mainly depend on wave and current movements, bedforms and sediment properties. For hydrodynamics, combined currents and waves form a wave-current boundary layer on the seabed, enhancing the turbulence intensity near the seawater-sediments interface. Furthermore, the bed shear-stress can cause the resuspension of the polluted sediment and increase the pressure of pore water, which will both result in the release of pollutants into the overlying water. Cao et al. (2013) found that the kinetics of heavy oil release from sediments could be described by a two-compartment first-order equation [20]. Yuan et al. (2017) presented that the static release process of oil reached equilibration after 48 h and could be accurately simulated by Lagrangian first-order equation [21]. In general, previous investigations were frequently conducted based on bench-scale tests such as glass cylinders and Erlenmeyer flask, while the mixing energy levels were usually higher than actual sea conditions. Additionally, the oil droplets size distributions (OSD) in the water column after the release process has not been taken into account. Different from other pollutants, a portion of the petroleum usually performs as emulsified oil droplets rather than molecules due to its poor solubility. Studies have reported that the OSD strongly controls the time taken for oil to reach the surface from the entrained depth as well as how much oil remains in the water column [22,23]. Hence, the estimation of OSD is also essential for responding to oil spills and their long-term behaviour [24].
To overcome the restrictions inherent in bench-scale tests, an experimental wave tank was used to examine the effects of wave conditions and particle size on the release of oil from artificially prepared sediments. The oil release efficiency (ORE) is used to improve the quantitative understanding of the oil release process. In addition, the OSD in the suspension has also been investigated. Ultimately, the data collected from this research will be applied in the predictive modelling studies on the transport and fate of oil pollutants in the contaminated sediments.
2. Materials and Methods
2.1. Wave Tank Facility
Figure 1 illustrated the photograph and schematic representation of the wave tank facility that was used to assess the release process of oil from oil-contaminated sediments. The dimensions were 1.5 m long, 0.3 m wide, and 0.5 m high. The seawater was obtained from Xinghai Bay, Dalian with a salinity of 30%. Before each experiment, it was filtered through 0.45 μm pore. The temperature of seawater was adjusted to 20 °C and the average water depth was 0.15 m. A motor-driven push-type wave maker situated at one end of the tank to generate waves. In this study, regular waves with different wave heights were simulated and reproduced. To accomplish this, the push plate was set to do a reciprocating motion at a different frequency. Furthermore, a wave absorber was placed oppositely to control the reflection of the waves. The wave height and wave frequency were measured by a digital wave altimeter (YWH200-DXX, range from 0–30 cm and measurement error ≤ 0.5%·FS/Y). In addition, the detector was placed 8 cm below the water surface. The current velocity (X direction) of three points at 1 cm above the simulated beach were measured by a portable rotameter (LS300-A, range from 0.01–4.00 m/s and measurement error ≤ 1.5%).
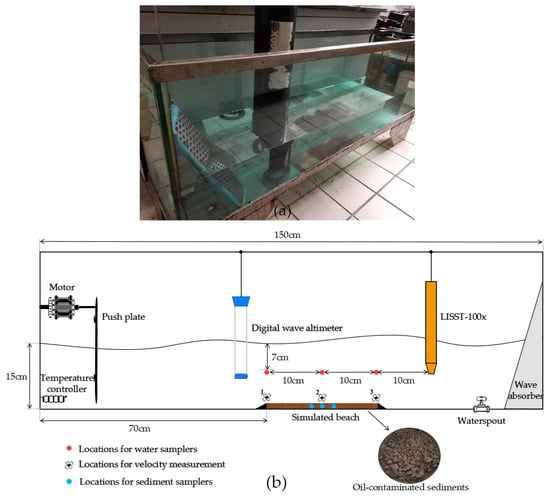
Figure 1.
(a) Photograph of wave tank and (b) Schematic representation of the mesoscale tank facility.
2.2. Oil and Sediment Property
The sediment was collected from the intertidal zone of Xiajiahe bath in Dalian, China (121°51′46″E, 39°03′55″N). The main composition of natural sediment is quartz sand. Seashells and gravel were firstly removed by a 60-mesh sieve. After flushed with distilled water and air-dried naturally, the sample were sieved through 90 + 110 mesh (150 + 160 µm), 120 + 130 mesh (112 + 125 µm), 180 + 200 mesh (73 + 90 µm) standard screens to three size ranges: 150–160 µm, 112–125 µm and 73–90 µm, respectively. The density of the sediment was 2.632 g/mL at 20 °C and the background oil concentration of the sediment was measured below 0.2 mg/g which could be ignored in this study.
The Oman crude oil was evaluated in this study. The density was measured six times using a Petroleum densimeter (SY-05) at 20 °C and the average value was 0.8720 g/cm3. The kinematic viscosity was measured for three times using a Kinematic viscosimeter (BF-03C) at 20 °C and the average value was 13.26 mm2/s. The asphaltene content and sulfur content of Oman crude oil were 1.75% and 1.49%, respectively (NB/SH/T 0509-2010).
2.3. Preparation of the Oil-Contaminated Sediments
The oil-contaminated sediments were prepared using an established method [21]. Some of the pretreated sediments were mixed slowly with solutions of the crude oil dissolved in n-hexane. The slurries were mixed thoroughly and air-dried at room temperature until the solvent evaporated completely to form the simulated oil-contaminated sediments. Then, the artificially spiked sediments were stored in the refrigerator for a week. Before the experiment, the mass of adhesive oil on the sediments was measured six times and the average value was calculated. The contamination concentration were 6.388 mg/g for sediment of 73–90 μm, 8.467 mg/g for sediment of 112–125 μm and 10.551 mg/g for sediment of 150–160 μm, respectively. Approximately 40 g of the oil-contaminated sediments were built in a graduated movable structure (20 × 10 × 1 cm) to form the simulated beach.
2.4. Analytical Methods for Measuring Oil Concentration
In this study, the push-plate was working continuously for 12 h, and three methods were used to determine the mass of released oil, the oil concentration in the suspension and the OSD in the water column, respectively at the specific time (0.5, 1, 2, 3, 4, 5, 6, 8, 10 and 12 h):
The sediment samples were collected from three portions of the simulated beach (Figure 1b) with a siphon and transferred as a suspension into the separatory funnel. Then, 50 mL of n-hexane and 2 mL of dilute sulphuric acid were added, constantly shaken for 5 min and settled down for 10 min. The water/sediment mixture remaining in the separatory funnel was passed through micro-fiber-glass filters to capture the sediment phase. After an overnight drying period in the bake oven (50 °C), the filter was weighed to determine the mass of unpolluted sediment. The extract was also filtered through micro-fiber-glass filters and dried with anhydrous sodium sulfate. The oil content was measured with a micro-plate and a UV spectrophotometry (Epoch 2, BioTek, Winooski, VT, USA). There was 2 mL of extract accurately diluted 10 times and then analysed for absorbance (A) at a wavelength of 225 nm, which is particularly sensitive for the detection of the test oil because aromatic hydrocarbons have a strong natural fluorescence. The function of the standard curve of petroleum hydrocarbons concentration for Oman crude oil (C) was: A = 0.0225C − 0.0159 (R2 = 0.9995).
As shown in Figure 1b, the water samples were taken from the tank at three horizontal locations (L = 70 cm, 80 cm, and 90 cm downstream from one side of the tank) and one depth (7 cm below the surface). The oil concentration in the water sample was also measured by the UV spectrophotometry following an established protocol. First, 10 mL of suspension was transferred into a separatory funnel. Then 20 mL of n-hexane and 2 mL of dilute sulphuric acid were added, constantly shaken for 2 min and settled down for 5 min. Finally, the extract was analysed for absorbance at a wavelength of 225 nm.
In this study, the OSD and volume concentration of emulsified oil (Voil) were measured by a laser-diffraction instrument (LISST-100X, Type C, Sequoia Scientific, Seattle, WA, USA) situated 100 cm downstream from one side of the tank with the detection windows 7 cm below the surface. It was operated in real time mode so that the dynamic oil-droplet size distribution as a function of time was acquired every 3 s. The volumetric mean diameter (VMD) of the emulsified oil droplets was calculated by:
where V is the total volume concentration, and vi is volume concentration of oil droplets in a size interval of average size di.
3. Results and Discussion
3.1. Characterization of Energy Levels
Generally, the waves in the simulated tank are always generated by flap type wavemaker and push plate wavemaker. The flap type wavemaker tends to produce irregular waves such as spilling breaking waves and plunging breaking waves. While push plate wavemaker tends to produce stable regular waves [25]. Therefore, only regular waves were considered in this study. As shown in Figure 2, three regular waves, namely high wave (2.13 Hz producing a wave height of 4.488 cm), middle wave (1.98 Hz producing a wave height of 3.647 cm) and low wave (1.92 Hz producing a wave height of 3.383 cm) were optimally selected in the pre-experiment and further investigated in the formal experiment.
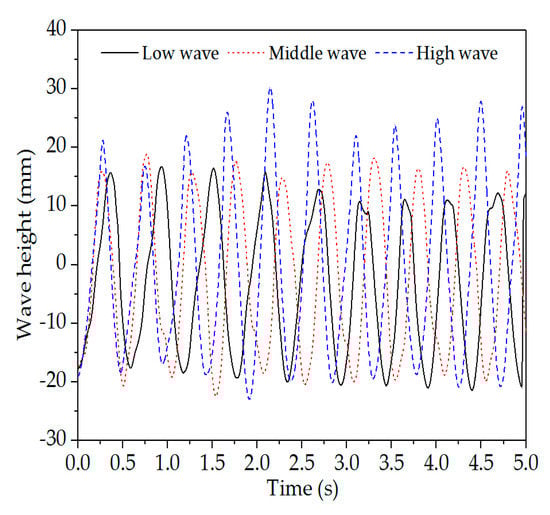
Figure 2.
Variation of wave height with time for the three wave conditions.
In this study, the release of oil from oil-contaminated sediments was mainly affected by the wave-induced shear stress above the seafloor. However, the wave boundary layer is typically less than 0.1 m in thickness, and it is difficult to measure the flow within this boundary directly. Based on previous experience [26,27], the wave-induced shear stress could be calculated by the quadratic stress law indirectly:
where τ is the wave-induced shear stress, ρs is the density of receiving water and fw is the wave friction factor, which can be expressed as:
where Z0 is a coefficient related to the roughness of seabed and Aw is the wave orbital amplitude at the bed given by:
where Hs is the significant wave height, kp is the peak wave number and h is the burst mean water depth.
Uw is the wave orbital velocity amplitude at the seabed defined as:
where Tp is the peak wave period.
In this study, Z0 was taken for 0.2 mm referring to previous studies [28], and ρs was 1.03 × 10³ kg/m3. Therefore, the wave-induced shear stress was 0.21, 0.26 and 0.34 N/m2 for low wave, middle wave and high wave, respectively.
3.2. Effect of Wave Conditions on the Release of Oil from Oil-Contaminated Sediments
The oil release process occurred in two stages: the oil pollutant was firstly desorbed from the surface of sediment into the water column and then diffused gradually under the action of the wave. The average oil concentration in the water column (Coil) was plotted as a function of time (Figure 3a). All series of data showed similar behaviour where Coil increased gradually over time within 6 h and then decreased slightly. Furthermore, it was clear that the oil release rate was higher at the early stage and then decreased.
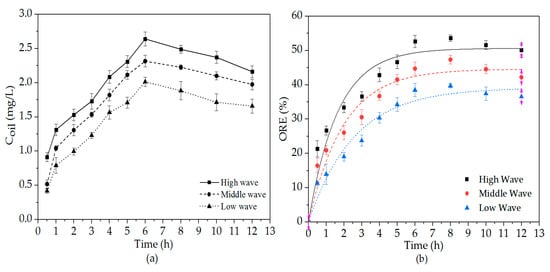
Figure 3.
(a) Variation of Coil with time using UV spectrophotometry and (b) Oil release kinetic curves of the sediment with particle size of 150–160 μm.
In order to improve the quantitative understanding of the oil release process, the oil release efficiency (ORE) was proposed, which represents the ratio of the mass of released oil over that of the initial oil stranded on the sediments (Figure 3b). The Lagrangian first-order (LFO) equation is well suited to simulate the desorption kinetics of heavy oil in previous studies [20,21], which was also applied in this study:
where E and E0 are the ORE at time t and the equilibrium (%), respectively, and k is the first-order rate constant (%/h).
Experimental results illustrated that the variation of ORE over time could be correctly estimated by the LFO equation (Figure 3b). The calculated parameters obtained by using the nonlinear fitting method were summarized in Table 1, which showed high regression coefficients under different conditions (R2 > 0.9). The data indicated that the mass of released oil and the oil release rate were both significantly enhanced by increasing the wave-induced shear stress.

Table 1.
Fitting parameters of oil release experiments under different wave conditions.
The OSD in the water column under three wave conditions is plotted as a function of time (Figure 4). Since the detection limit of the type C LISST-100X particle counter was 2.5 μm, the exact size of the smaller droplets generated in the suspension could not be determined. Under different wave conditions, small oil droplets firstly released from the sediments and more than 80% of the emulsified oil droplets concentrated in the size interval of 2.5–3.48 μm. Within a small size range, Voil increased gradually and then decreased. The size interval was 2.5–9.4 μm, 2.5–6.75 μm and 2.5–4.11 μm for high wave, middle wave and low wave, respectively. While in a larger size range, Voil increased steadily over time throughout the period. The size interval was 9.4–18.2 μm, 6.75–13.1 μm and 4.11–9.4 μm for high wave, middle wave and low wave, respectively.
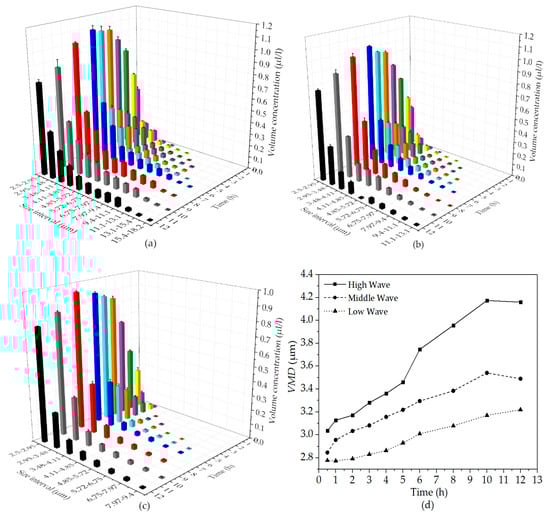
Figure 4.
(a) Oil droplets size distributions (OSD) under high wave condition, (b) OSD under middle wave condition, (c) OSD under low wave condition and (d) Variations of volumetric mean diameter (VMD) over time under different wave conditions.
The full spectrum of OSD at each sampling time was converted to VMD to compare the influence of different wave conditions (Figure 4d). The time-series of VMD within 10 h were similar under different wave conditions. However, under high wave and middle wave conditions, VMD decreased after 10 h. At the same sampling time, the VMD under higher wave condition was consistently larger than that under lower wave condition. The results indicated that larger oil droplets can release from sediments at a higher wave energy.
Since there is a high concentration gradient of the oil pollutant between the two-phase (seawater-sediments) boundary at the early stage, the adhesive oil can release rapidly from the sediments under the actions of diffusion force and wave-induced shear force. As the oil desorption proceeds, Coil increased gradually and the stranded oil on the surface of sediment also redistributed. When Coil reached a certain value, the desorption process was inhibited and the sorption process occurred dominantly. As shown in Figure 4, after 6 h desorption, small droplets were firstly adsorbed by sediments while large droplets still released from sediments. In addition, it has been confirmed that the small oil droplets may coalesce into larger oil droplets readily by the effect of turbulence [29]. Therefore, it is probably another reason why the VMD could still grow from 6 h till 10 h although the oil desorption was inhibited. As the sorption process continued, some of the large droplets were also adsorbed by sediments, causing VMD to decrease after 10 h. In addition, large droplets tend to rise up and reattach to the surface oil slick quickly [30]. Thus, the decrease of Voil and VMD may be also caused by the occurrence of oil resurfacing.
3.3. Effect of Particle Size on the Release of Oil from Oil-Contaminated Sediments
The oil release process is also closely related to the sediment particle size. As shown in Figure 5, for sediments with particle sizes of 112–125 μm and 73–90 μm, the experimental data could also be fitted well by the LFO equation. The parameters obtained by using the nonlinear fitting method were summarized in Table 2. When the particle size increased from 73–90 μm to 150–160 μm, the estimated E0 increased from 39.42 to 50.63%, while k declined from 71.36%/h to 60.83%/h. The results indicated that more oil seemed to release from larger sediments while oil released more quickly from smaller sediments.
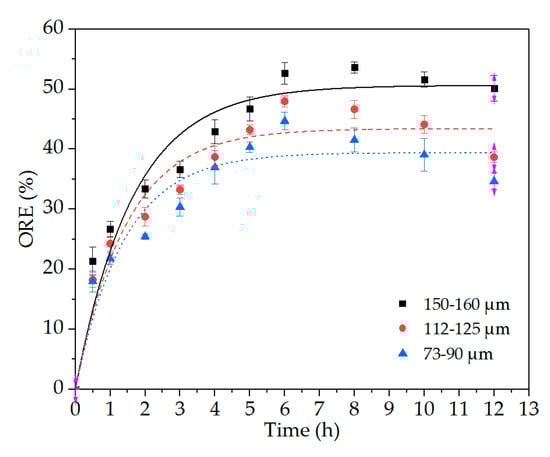
Figure 5.
Oil release kinetic curves under high wave condition for sediments with different particle sizes.
Table 2.
Fitting parameters of oil release experiments for different particle sizes.
The size distribution of oil droplet released from sediments with particle size of 112–125 μm and 73–90 μm was measured (Figure 6). The variation of Voil over time for the two kinds of sediments showed similar pattern as that for the sediment of 150–160 μm (Figure 4a). When the sediment particle size was 112–125 μm, the distribution of released oil ranged from 2.5–9.4 μm (Figure 6a). As the particle size decreased to 73–90 μm, the size of oil droplets reduced to 2.5–6.75 μm (Figure 6b). The results indicated that larger oil droplets can release from larger sediments.
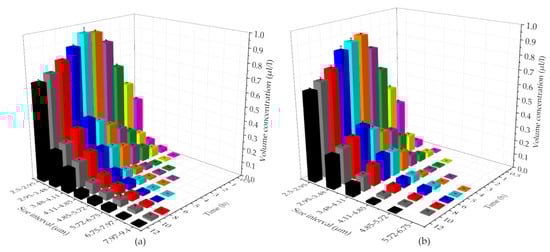
Figure 6.
Oil droplet size distribution in the water column as a function of time for sediments with particle size of (a) 112–125 μm and (b) 73–90 μm.
Figure 7 illustrated the VMD for sediment with different particle sizes as a function of time. Similar trends of the time-series of VMD for sediments of 150–160 μm and 112–125 μm were observed that the VMD increased gradually within 10 h and then decreased. In contrast, for sediments of 73–90 μm, the VMD increased slightly within 6 h and began to decrease thereafter. This finding suggested that sediments with small particle size obviously facilitated the sorption of small oil droplets. Moreover, it was clear that the VMD for sediments of 73–90 μm and 112–125 μm were consistently lower than that for sediment of 150–160 μm under the same wave condition. This is supported by the conclusion described above that more large oil droplets can release from larger sediments.
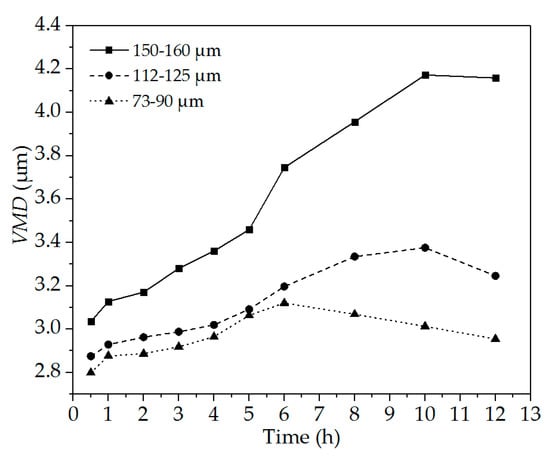
Figure 7.
Variation of VMD with time for sediments with different particle sizes.
The results may arise from different surface areas, total organic carbon (TOC) contents and shape of the sediment samples. Smaller particles result in higher specific surface areas, which accelerate the process of sorption and desorption. However, the TOC content of small particles is higher than that of large particles, causing the sediment surface to be more hydrophobic. Thus, the oil adheres more firmly on the surface of small particles. Furthermore, small particles tend to aggregate with each other in the form of clusters, while large particles are distributed discretely at the bottom of the tank. Therefore, the oil pollutant in the pore water between large particles can release into the overlying water more easily.
4. Conclusions
In this study, the effects of wave conditions and particle size on the dynamic oil release process have been investigated through a mesoscale experiment with artificially prepared sediments. Under different test conditions, all the oil release kinetic curves can be correctly estimated by the LFO equation. The oil is desorbed mainly from low-energy binding sites on the particle surface, through which the oil concentration in the water increases rapidly within 6 h. After that, the oil desorption is inhibited and the process of sorption occurs dominantly. Under higher wave energy, more large oil droplets can release from sediments. Meanwhile, the mass of released oil and the oil release rate are both significantly enhanced. As the oil desorption proceeds, small oil droplets firstly release from the sediments and more than 80% of the emulsified oil droplets concentrate in the size interval of 2.5–3.48 μm. Sediment particle size also has a significant effect on the oil release process that more oil especially with larger size tend to release from larger sediments. While oil release more quickly from smaller sediments. Besides, smaller sediments also obviously facilitated the sorption process.
Due to the spatial limitation of the wave tank in this study, the phenomenon of wave superposition may occur as a result of the re-reflection. However, most of the time, the waves are relatively stable. Therefore, the effect of wave superposition on the process of oil release from sediment may not be significant. Furthermore, the capillarity phenomenon can also arise due to the high wave frequencies. While the process of oil release from sediment is mainly caused by the wave-induced shear stress; the capillarity phenomena may play a minor role or have little effect on this process. Although the wave height in the mesoscale model can reach tens of centimeters, it is still not in the same order of magnitude as ocean and offshore waves. Thus, it is impossible to accurately simulate the realistic marine environment and a fully developed wave motion continuously. In future research, we will further expand the scale of the wave tank and use the similarity theory to translate the mesoscale model into real field conditions.
Author Contributions
Methodology, Z.Q. and D.X.; project administration, Y.Y. and W.L. and X.Y. and S.F.; writing—review and editing, Y.Y.
Funding
This research was funded by [National Natural Science Foundation of China] grant number [41807466]; [Fundamental Research Funds for the Central Universities] grant number [3132019148] and [Natural Science Foundation of Liaoning Province, China] grant number [20170540099].
Conflicts of Interest
The authors declare no conflict of interest.
References
- Qi, Z.X.; Zhang, C.C.; Han, J.S.; Gao, Y.L.; Xiong, D.Q. A decision model responding to the refuge request from a ship in need of assistance. Mar. Policy 2018, 95, 294–300. [Google Scholar] [CrossRef]
- French McCay, D.; Rowe, J.J.; Whittier, N.; Sankaranarayanan, S.; Schmidt Etkin, D. Estimation of potentialimpacts and natural resource damages of oil. J. Hazard. Mater. 2004, 107, 11–25. [Google Scholar] [CrossRef] [PubMed]
- Nelson, J.; Grubesic, T. The Implications of Oil Exploration off the Gulf Coast of Florida. J. Mar. Sci. Eng. 2018, 6, 1–21. [Google Scholar] [CrossRef]
- King, T.; Robinson, B.; Ryan, S.; Lee, K.; Boufadel, M.; Clyburne, J. Estimating the usefulness of chemical dispersant to treat surface spills of oil sands products. J. Mar. Sci. Eng. 2018, 6, 2–8. [Google Scholar] [CrossRef]
- Owens, E.H.; Sergy, G.A.; Chantal, C.C.; Prince, R.C.; Lee, K. The reduction of stranded oil by in situ, shoreline treatment options. Spill Sci. Technol. Bull. 2003, 8, 257–272. [Google Scholar] [CrossRef]
- Lucas, Z.; Macgregor, C. Characterization and source of oil contamination on the beaches and seabird corpses, Sable Island, Nova Scotia, 1996–2005. Mar. Pollut. Bull. 2006, 52, 778–789. [Google Scholar] [CrossRef]
- Hansel, T.C.; Osofsky, H.J.; Osofsky, J.D.; Speier, A.H. Longer-term mental and behavioral health effects of the deepwater horizon gulf oil spill. J. Mar. Sci. Eng. 2015, 3, 1260–1271. [Google Scholar] [CrossRef]
- Yim, U.H.; Ha, S.Y.; An, J.G.; Won, J.H.; Han, G.M.; Hong, S.H.; Kim, M.; Jung, J.H.; Shim, W.J. Fingerprint and weathering characteristics of stranded oils after the Hebei Spirit oil spill. J. Hazard. Mater. 2011, 197, 60–69. [Google Scholar] [CrossRef]
- Warnock, A.M.; Hagen, S.C.; Passeri, D.L. Marine Tar Residues: A Review. Water Air Soil Pollut. 2015, 226, 3–19. [Google Scholar] [CrossRef] [PubMed]
- Delvigne, G.A.L. Physical appearance of oil in oil-contaminated sediment. Spill Sci. Technol. Bull. 2002, 8, 55–63. [Google Scholar] [CrossRef]
- Jonker, M.T.O.; Sinke, A.J.C.; Brils, J.M.; Koelmans, A.A. Sorption of Polycyclic Aromatic Hydrocarbons to Oil Contaminated Sediment: Unresolved Complex. Environ. Sci. Technol. 2003, 37, 5197–5203. [Google Scholar] [CrossRef] [PubMed]
- Agarwal, A.; Liu, Y. Remediation technologies for oil-contaminated sediments. Mar. Pollut. Bull. 2015, 101, 483–490. [Google Scholar] [CrossRef] [PubMed]
- Stout, S.A.; Payne, J.R.; Emsbo-Mattingly, S.D.; Baker, G. Weathering of field-collected floating and stranded Macondo oils during and shortly after the Deepwater Horizon oil spill. Mar. Pollut. Bull. 2016, 105, 7–22. [Google Scholar] [CrossRef] [PubMed]
- Chapman, N. Operational Guidelines on Sunken and Submerged Oil Assessment and Removal Techniques; International Maritime Organization: London, UK, 2013; pp. 3–5. [Google Scholar]
- Van Noort, P.C.M.; Cornelissen, G.; ten Hulscher, T.E.M.; Vrind, B.A.; Rigterink, H.; Belfroid, A. Slow and very slow desorption of organic compounds from sediment: Influence of sorbate planarity. Water Res. 2003, 37, 2317–2322. [Google Scholar] [CrossRef]
- Yu, H.; Huang, G.H.; An, C.J.; Wei, J. Combined effects of DOM extracted from site soil/compost and biosurfactant on the sorption and desorption of PAHs in a soil-water system. J. Hazard. Mater. 2011, 190, 883–890. [Google Scholar] [CrossRef] [PubMed]
- Portet-Koltalo, F.; Ammami, M.T.; Benamar, A.; Wang, H.; Le Derf, F.; Duclairoir-Poc, C. Investigation of the release of PAHs from artificially contaminated sediments using cyclolipopeptidic biosurfactants. J. Hazard. Mater. 2013, 261, 593–601. [Google Scholar] [CrossRef]
- Poot, A.; Jonker, M.T.; Gillissen, F.; Koelmans, A.A. Explaining PAH desorption from sediments using Rock Eval analysis. Environ. Pollut. 2014, 193, 247–253. [Google Scholar] [CrossRef]
- Bandara, U.C.; Yapa, P.D.; Xie, H. Fate and transport of oil in sediment laden marine waters. J. Hydro-Environ. Res. 2011, 5, 0–156. [Google Scholar] [CrossRef]
- Cao, X.Y.; Han, H.; Yang, G.P.; Ding, H.B.; Zhang, H.H. A Study on the release of oil from oil-contaminated sediment through laboratory experiments. Water Air Soil Pollut. 2013, 224, 2–8. [Google Scholar] [CrossRef]
- Yuan, L.L.; Han, L.; Bo, W.; Chen, H.; Gao, W.S.; Chen, B. Simulated oil release from oil-contaminated marine sediment in the Bohai Sea, China. Mar. Pollut. Bull. 2017, 118, 79–84. [Google Scholar] [CrossRef]
- Li, M.; Garrett, C. The relationship between oil droplet size and upper ocean turbulence. Mar. Pollut. Bull. 1998, 36, 961–970. [Google Scholar] [CrossRef]
- Nissanka, I.D.; Yapa, P.D. Calculation of oil droplet size distribution in ocean spills. Mar. Pollut. Bull. 2018, 135, 723–734. [Google Scholar] [CrossRef] [PubMed]
- Pan, Z.; Zhao, L.; Boufadel, M.C.; King, T.; Robinson, B.; Conmy, R.; Lee, K. Impact of mixing time and energy on the dispersion effectiveness and droplets size of oil. Chemosphere 2017, 166, 246–254. [Google Scholar] [CrossRef]
- Marques, M.; Fábio, M.; Gameiro, L.; António, M.; Ferreira, A.D. Numerical simulation of regular waves: Optimization of a numerical wave tank. Ocean Eng. 2018, 170, 89–99. [Google Scholar] [CrossRef]
- Rodolfo, B.; Peter, D.T.; Judith, W. Comparison of measurements and models of bed stress, bedforms and suspended sediments under combined currents and waves. Coast. Eng. 2012, 62, 19–30. [Google Scholar]
- Sara, P.; Marco, P.; Silvia, B. On the wave bottom shear stress in shallow depths: The role of wave period and bed roughness. Water 2018, 10, 1348. [Google Scholar]
- Jia, Y.; Zhang, Y.; Liu, H. Wave-induced sediment resuspension of seabed in the Yellow River Delta. Acta Oceanol. Sin. 2012, 34, 100–110. [Google Scholar]
- Boyson, T.K.; Pashley, R.M. A study of oil droplet coalescence. J. Colloid Interface Sci. 2007, 316, 59–65. [Google Scholar] [CrossRef]
- Nissanka, I.D.; Yapa, P.D. Oil slicks on water surface: Breakup, coalescence, and droplet formation under breaking waves. Mar. Pollut. Bull. 2017, 114, 480–493. [Google Scholar] [CrossRef]
© 2019 by the authors. Licensee MDPI, Basel, Switzerland. This article is an open access article distributed under the terms and conditions of the Creative Commons Attribution (CC BY) license (http://creativecommons.org/licenses/by/4.0/).