Abstract
Offshore unconsolidated sandstone reservoirs suffer from severe sand production, which impairs wellbore stability and productivity. This study evaluates gravel packing in light-oil unconsolidated sandstone reservoirs in the Weizhou field. This paper conducts visual sand-control experiments to compare screens and gravel packs, and to quantify the effects of gravel size, packing thickness, packing density, and clay content on sand-retention behavior. On this basis, a coupled CFD–DEM model was developed to simulate sand transport and plugging within the gravel pack. Results show that gravel packing rapidly forms a stable bridging structure, reaching stabilized production 38.1% earlier than the screen and reducing sand production by 74.4%, while maintaining a stable pressure difference and limiting fine-sand breakthrough. Low-viscosity oil enhances sand carrying, increasing the stabilized pressure difference by 12% relative to water. For the low-clay fine reservoir, gravel sizes of 3–6 times the median sand size, packing thickness ≥ 25 mm, and packing density of 90–95% provide a balance between permeability and sand control. Numerical simulations identify a four-stage plugging process—initiation, surface accumulation, deep filling, and equilibrium—offering pore-scale support for the experimental observations. This study offers technical and theoretical guidance for the optimization of gravel-pack sand control in offshore light-oil unconsolidated sandstone reservoirs.
1. Introduction
In recent years, with the continuous development of deepwater oil and gas resources, the production capacity of offshore oilfields has increased significantly, but the associated problem of sand production has become increasingly prominent. Sand production can cause wellbore blockage, productivity decline, equipment erosion, and environmental risks [1], resulting in substantial losses for oil companies and, in some cases, even well failure [2]. Representative of unconsolidated sandstone reservoirs in the South China Sea, the Weizhou oilfield is characterized by weakly cemented reservoir rocks with a weak grain framework. In the process of oil and gas exploitation, sand production is easy to occur due to the decrease in formation pressure and fluid erosion [3], which severely undermines the stability of well productivity and shortens field life, posing serious threats to production safety, environmental protection, and economic performance [4].
Geologically, the Weizhou oilfield is located in the central and western part of the geological depression of Weizhou, a sub-depression in the northern Beibu Gulf Basin [5], which experienced multiple stages of rifting and subsequent fault-controlled subsidence under an extensional tectonic regime. The target reservoirs are mainly the Weizhou Formation, which was deposited in fluvial–deltaic to shallow-marine environments and is characterized by weakly cemented sandstones with relatively poor consolidation. The reservoir rocks are dominated by fine to very fine sandstones with moderate sorting and a loose grain framework, making them highly susceptible to sand production during pressure depletion and fluid flow. The petroleum system of the Weizhou oilfield is characterized by effective early hydrocarbon charging and relatively high oil mobility. Early hydrocarbon emplacement inhibited late-stage cementation and helped preserve pore structure and permeability [6], but also enhanced sand migration near the wellbore during production.
Sand production in oil wells mainly occurs in weakly cemented or unconsolidated sandstone formations. Especially in the late stage of oilfield development, with the development of water injection, due to the immersion of injected water, the cementation between sand particles is looser. With the increase in liquid production intensity, the flow rate of oil and water accelerates, and the sand carrying capacity increases, resulting in more serious sand production in oil wells, which restricts the long-term and efficient development of oil fields. In the eastern South China Sea oilfields, sand control is currently dominated by premium screens and gravel packing. However, in reservoirs with poor physical properties, such as high clay content or strong heterogeneity, premium screens are susceptible to damage by fluid flow, which may result in sand-control failure [7]. A review of 172 directional wells in the Bohai oilfield, located in the Bohai Bay Basin of eastern China, shows that sand production occurred in 37.5% of wells completed with simple screens, compared with only 3.2% of gravel-packed wells. Screen-only wells also had shorter productive lives, earlier sand onset, and produced sand grains larger than the screen slot size, indicating screen failure [8]. Conventional screens are exposed to multiple risks—including erosion [9], plugging [10], corrosion, and mechanical damage [11]—which can cause sand-control failure or productivity impairment and have led to substantial economic losses in several offshore oilfields, such as those in the South China Sea, offshore East Malaysia, and HPHT wells in the Gulf of Mexico [12,13].
With the development of offshore deepwater oil and gas resources, issues related to gravel-packing technology have attracted increasing attention [14]. Gravel-pack sand control, through the combined mechanisms of physical interception and flow-velocity moderation, can effectively mitigate sand production, particularly in unconsolidated, sand-prone reservoirs [15], and the service life of gravel packs can exceed 10 years, significantly longer than that of conventional screens [16]. Studies in unconsolidated sandstone oilfields in the eastern South China Sea show that gravel packing has broader applicability and stronger adaptability than screen-only sand control under varying clay contents and liquid production rates, and can be successfully applied in vertical, horizontal, and high-angle wells [17,18]. However, the use of gravel-pack completions is still constrained by complex operations, high risk and cost, and uncertainties in performance under different reservoir conditions and design parameters [19], which has motivated extensive research on the optimization of gravel-pack design. Based on experiments and field applications, Saucier [20] reported that when the gravel size is about 5–6 times the median grain size of the reservoir sand, the adverse impact on gravel-pack permeability is minimized and production is maximized. However, this criterion does not fully account for plugging mechanisms related to reservoir heterogeneity and clay content. Using repeatable large-scale sand-retention tests, Zimmermann et al. [21] validated and extended the traditional Saucier criterion for open-hole gravel packs and revealed the dominant damage mechanisms in highly heterogeneous, fine-rich formations, where fine-particle migration degrades gravel-pack performance. Bigna et al. [22] and Liu et al. [23] further investigated gravel-pack plugging mechanisms through sandbox experiments. They identified and quantified five types of fines-induced plugging controlled by particle-size ratios and developed mechanistic models consistent with permeability–time evolution, which can be used to determine allowable fines loading and plugging time and to optimize sand-control and injection–production operations. Through a series of experiments, Dong et al. [24] proposed a “viscosity–velocity index” as a key parameter to characterize the effects of fluid properties and flow conditions on gravel-pack plugging. Their results showed that flow velocity and viscosity mainly control the development of the mixing zone and the associated permeability loss within the gravel pack. In summary, the sand-control performance of gravel-pack completions is strongly governed by the compatibility between reservoir characteristics and packing parameters; in particular, sand–gravel size matching, gravel-layer thickness and packing density, and fluid viscosity are generally recognized as key factors controlling the effectiveness of gravel-pack sand control.
Some researchers have already carried out reservoir-scale numerical simulations of gravel-pack performance. Nguyen et al. [25] proposed a full-scale, three-dimensional mathematical modeling workflow for gravel-pack simulations. Zare-Reisabadi et al. [26] compared different sand-control completion schemes and showed that gravel packing can provide a favorable balance between productivity and pressure difference. At the pore scale, previous studies have mainly used phenomenological models and trajectory-based simulations to investigate particle-transport behavior within gravel packs [27]. The integration of computational fluid dynamics (CFD) with the discrete element method (DEM) has created an effective framework for exploring such research. Atashi et al. [28] examined the influence of fluid properties on sand production and validated their numerical model by comparing cases with and without gravel packing. Their results confirmed that gravel packs can effectively suppress sand production. Lezhnev [29] simulated the filtration processes of slotted screens and gravel-pack systems at the grain scale and concluded that uniform gravel size can effectively reduce sand production, although the selected parameters deviated considerably from field practice. By combining two-phase (solid–liquid) numerical simulations with visual experiments for mutual verification, the mechanisms of sand migration and gravel-pack plugging have been progressively refined and validated [30,31,32,33].
Most existing studies either focus on heavy oil with different viscosities or simplify the problem by using water. For light-oil unconsolidated sandstone reservoirs represented by the Weizhou oilfield in the South China Sea, systematic optimization of sand-control design parameters and a clear understanding of plugging mechanisms are still lacking. To address this gap, this study conducts visual sand-control experiments in which it synthetically reconstructs the reservoir sand distribution of the heterogeneous unconsolidated sandstone in the Weizhou oilfield, and compares the sand-control performance of premium screens and gravel packs. A series of comparative experiments is conducted on four key parameters—gravel size, packing density, packing thickness, and reservoir clay content. Sand production, particle-size distributions of produced sand, and the plugging behavior of flow channels were quantitatively evaluated. On this basis, coupled ANSYS Fluent 2022–EDEM simulations are performed to investigate microscale sand-transport behavior and filtration mechanisms within the gravel pack, providing complementary insight for data interpretation and parameter optimization. Overall, the results establish matching relationships between design parameters and sand-control performance, clarify particle-migration and plugging mechanisms during gravel-pack sand control, and verify the applicability of gravel-pack completions in light-oil unconsolidated sandstone reservoirs. The results provide theoretical support and experimental evidence for selecting sand-control technologies in the field.
2. Experiment Methodology
2.1. Experiment Apparatus
Figure 1 shows a photograph (a) and a schematic (b) of the visual sand-control experimental apparatus (Jiangsu Lianyou Scientific Research Instrument Co., Ltd., Nantong, China). The system mainly consists of five parts: a clean-fluid injection system, a sand-control simulation system, an automatic data acquisition system, an oil–sand separation system, and a vacuum system.
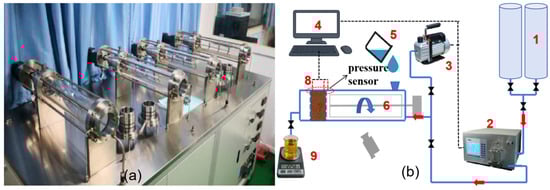
Figure 1.
Visual sand-control experimental apparatus: (a) photograph [33] and (b) schematic. 1—injection-fluid storage tank; 2—flow controller; 3—high-pressure dual-plunger pump; 4—automatic data acquisition system; 5—sand paste; 6—sand-mixing unit; 7—sand-retention unit; 8—high-precision pressure sensor; 9—oil–sand separation system.
The clean-fluid injection system circulates the test fluid through the apparatus using a high-pressure dual-plunger pump, with a constant flow rate controlled by computer. The automatic data acquisition system, consisting of a computer and dedicated software, enables real-time acquisition, display, and storage of injection rate, pressure difference, and other parameters. The oil–sand separation system uses a negative-pressure suction filtration unit combined with slow filter paper to separate oil from sand. The separated sand is subsequently washed and dried, after which its mass and particle-size distribution are measured. These measurements are used to assess plugging resistance and to evaluate the sand-control performance of the gravel pack. The vacuum system is also an essential component of the visual sand-control apparatus; it removes air from the system to eliminate its influence on the results of the sand-control plugging experiments.
The sand-control plugging experimental system consists of a sand-mixing unit and a sand-retention unit. The main body is made of a transparent acrylic tube with an inner diameter of 80 mm, an outer diameter of 100 mm, and a length of 500 mm. A 400 mm section near the inlet is used as the oil–sand mixing zone, and the opposite end is used to install the sand-retention unit. The apparatus can operate under pressures up to 5 MPa and is designed to accommodate a gravel-pack sand-control unit with a 60 mm effective diameter and a thickness of 10–25 mm. The system can handle sand concentrations of 1–10%, with a flow rate of 0–1000 mL/min, and the measurement accuracy of the pressure sensors and flowmeter is within 0.1%. To clearly observe sand-bridge formation on the outer protective shroud and the variation in slurry concentration inside the vessel, the acrylic tube was polished to a highly transparent finish. The visual sand-control apparatus provides linear flow, with the flow direction indicated in Figure 2. The sand-retention unit, which represents the gravel-pack sand-control section, consists of an outer protective shroud, a gravel-pack layer, and a base pipe. Three high-precision pressure sensors are installed at different positions on this unit (Figure 1b): on the outer surface of the shroud, on its inner surface, and on the surface of the base pipe. Data from these three pressure taps are used to track pressure evolution before and after plugging, characterize the plugging process, and calculate the permeability of the sand-retention unit in the plugged state. The sand-mixing unit is designed to prepare oil–sand mixtures with specified grain-size distributions and clay contents matching the reservoir. Under a prescribed initial sand concentration, a low-speed stirrer is used in the mixing section to keep the sand uniformly suspended throughout the experiment.
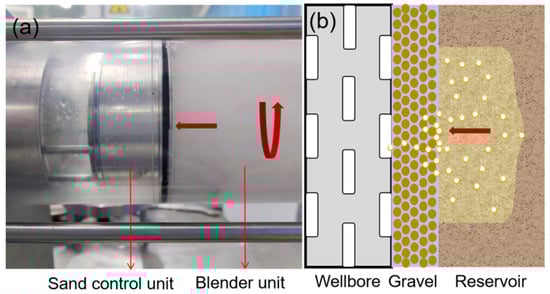
Figure 2.
Flow direction of the fluid in the visual sand-control apparatus: (a) photograph and (b) schematic.
2.2. Experiment Materials
In conventional selection of sand-control methods, four parameters are generally considered to be strongly correlated with the optimal completion scheme: the median grain size (d50), uniformity coefficient (Uc), clay content (Vsh), and montmorillonite content [34]. It is noteworthy that both clay content and montmorillonite content need to be considered. The swelling behavior of montmorillonite upon contact with water significantly increases the failure risk of sand-control strings [35] and differs from the mud-plugging effect of other clay minerals. Sand-production simulation experiments by Deng et al. [34] showed that a formation with 30% illite content yields higher post-sand-control productivity than one with 10% montmorillonite. To accurately reproduce the particle-size composition and distribution characteristics of the actual reservoir sand in the Weizhou oilfield, the particle-size range and median size of the experimental sand were first determined, followed by sieving and blending. Core grain-size analyses and previous rock-physics studies indicate that the Weizhou reservoir sand has the following features: a wide grain-size range, mainly between 0.01 mm and 0.5 mm; an average median grain size (d50) of about 0.209 mm; a non-uniform, typically asymmetric particle-size distribution; relatively low clay content; and an average uniformity coefficient (Uc) of approximately 5. The reservoir rocks are mainly quartz sandstone [6], and the clay minerals are dominated by montmorillonite and illite–smectite mixed-layer clays [36]. Clay minerals can form coating films and act as pore-filling material, which greatly reduces the flow capacity near the wellbore. Their physical properties differ significantly from those of quartz and feldspar grains, and they are a primary cause of plugging in sand-control units. Based on these considerations, industrial-standard mesh quartz sand and montmorillonite (Henan Mishang Environmental Protection Technology Co., Ltd., Zhengzhou, China) were used to prepare synthetic reservoir sand for the experiments. The proportions of different mesh sizes of quartz sand and montmorillonite were adjusted (Table 1) so that the blended sand matched the target grain-size characteristics of the reservoir. As shown in Figure 3, Samples 1–4 represent synthetic reservoir sands with clay contents of 0%, 3%, 5%, and 10%, respectively.

Table 1.
Blending schemes for synthetic reservoir sand samples.
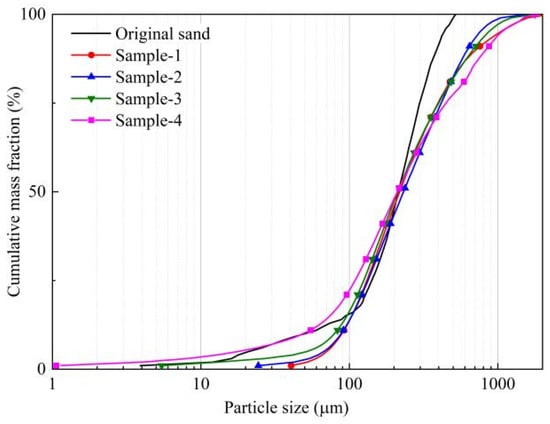
Figure 3.
Grain-size distribution test results for the blended synthetic reservoir sand samples.
Ceramic particles are regarded as the most suitable and widely used gravel-pack material in field applications [37]. Accordingly, artificial ceramic particles (Gongyi Longze Water Purification Materials Co., Ltd., Zhengzhou, China) with different sizes were selected as the gravel-pack medium in this study. Water and oil (Zhengzhou Xingyi Lubricating Oil Co., Ltd., Zhengzhou, China) were used as test fluids; based on the reservoir crude-oil properties, the viscosity of the oil was 5 mPa·s.
2.3. Experiment Procedure
The experiments were carried out in the following steps:
- (1)
- According to the blending scheme, 200 g of synthetic reservoir sand was prepared and thoroughly mixed. A laser particle-size analyzer was used to ensure that the median grain size and grain-size distribution curve matched the target reservoir-sand characteristics, thereby ensuring the validity of the experimental data.
- (2)
- Depending on the experimental conditions, a metal mesh screen was installed, or gravel of different particle sizes was packed. The packing density was controlled by adjusting the mass of gravel. After the sand-control unit was assembled, it was mounted at the designated position and connected to the flow lines.
- (3)
- Experimental fluid (water or oil) was injected into the sand-mixing unit to check for leaks. The stirrer was then switched on, and the premixed sand was added through the sand-injection port until the vessel was filled, after which the port was closed. The system was evacuated for 15 min.
- (4)
- The data-acquisition software was started, and the pump was set to an injection rate of 100 mL/min. The outlet valve was opened to initiate the experiment, while pressure data were recorded in real time, and produced fluids were collected. The pressure difference between the two ends of the sand-control unit, monitored by the data-acquisition system, increases with the severity of plugging. Based on the measured pressure difference, the permeability of the sand-control unit under unidirectional flow can be calculated using Darcy’s law as follows:
In practice, because the sand-retention medium is relatively thin and the pressure-transducer probes cannot be placed exactly at the two faces of the medium but are set slightly away from the boundaries, the permeability calculated from Darcy’s law inevitably contains some errors.
The post-test residual permeability in the classical sense was not directly measured. However, the permeability evaluated under stabilized pressure conditions represents the effective hydraulic conductivity of the sand-control unit after sand-bridging and pore-scale clogging had been fully established. From an engineering perspective, this stabilized permeability is more relevant to filtration performance than an idealized clean-fluid permeability measured after dismantling the filter.
- (5)
- After 60 min, when the pressure had become relatively stable, the experiment was stopped. The discharge valve was opened, the sand-control unit was removed, and sand invasion into the screen and gravel pack was visually examined.
- (6)
- The produced fluids and the sand that passed through the sand-retention medium were collected, dried, and weighed. A laser particle-size analyzer was then used to measure the maximum grain size and median grain size of the produced sand. According to the industry standard SY/T 5183-2024 [38], the sand-retention performance of the medium was evaluated using the “one-in-ten thousand” criterion, i.e., the cumulative sand production must not exceed 0.3‰ of the produced liquid volume.
2.4. Experiment Scheme
To compare the sand-control performance of conventional premium screens and gravel-pack completions and to further investigate the parameters affecting gravel-pack sand control, a metal sintered-mesh screen with a sand-retention accuracy of 0.2 mm was used, as calculated by Equation (2) [39]:
where W is the slot width, mm; and is the median grain size of the reservoir sand, mm. The thickness of the metal sintered-mesh screen was 2 mm.
There is an optimal size ratio between gravel and reservoir sand, and this ratio is one of the most critical design parameters in gravel-pack operations. The most widely used guideline is that the median size of the industrial gravel should be 5–6 times the median grain size of the reservoir sand in sand-producing wells. In practical field design, however, the gravel size should be further optimized according to reservoir heterogeneity and the grain-size distribution of produced sand. Packing density and thickness are other key factors controlling sand-control performance. Previous studies have indicated that the packing density should be at least 90% [40]. Conventional theory suggests that the gravel-pack thickness should exceed 20 mm, and preferably be greater than 30 mm [41], to ensure the formation of a stable filtration zone. Based on these considerations, four gravel sizes—10/20 mesh, 16/30 mesh, 20/40 mesh, and 30/50 mesh—were selected using artificial ceramic particles. Packing thicknesses of 25 mm, 20 mm, and 15 mm and packing densities of 95%, 90%, and 85% were tested. All experiments were conducted at a constant flow rate of 100 mL/min. All experimental schemes are summarized in Table 2.
Table 2.
Experimental design schemes.
3. Results
3.1. Comparison Between Screen and Gravel Packing
Metal mesh screens are prone to local erosion damage under long-term impact from sand-laden flow, which can eventually lead to sand production as a result of sand-control failure [42]. In a preliminary test, a single-layer 200-mesh metal screen was used and experienced sand-control failure. As shown in Figure 4a, there is a local loss of the filter cake under the screen, indicating that a typical continuous and intact structure of effective sand control did not form in this area. Instead, erosional damage to the screen led to the development of localized preferential sand-production pathways, ultimately resulting in sand control failure. This confirms that conventional screens have a critical limitation in service life when long-term sand-control performance over the full well life is required. By contrast, gravel packs possess sufficient compressive strength to withstand high downhole pressures and stress variations without crushing or degradation, thereby providing more durable sand-control and water-control performance [43]. On this basis, a metal sintered-mesh screen was selected as a representative premium screen, and its sand-control performance was compared with that of gravel packing.
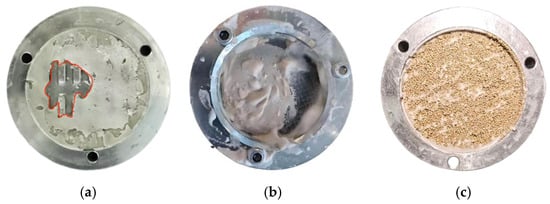
Figure 4.
Deposition of reservoir sand within the sand-control unit. (a) Local sand-control failure of the metal mesh screen. (b) Metal sintered-mesh screen. (c) Invasion of clay and fine sand into the gravel pack.
Gravel packing generally provides more effective sand control than screens. Under fixed overburden and injection pressures, Shirinabadi et al. [2] reported that sand production dropped to very low levels, or even to zero, after placement of a gravel-pack annulus. Figure 5 compares the pressure difference across the gravel-pack and screen sand-control units under different operating conditions. As shown in Figure 5a, under water-phase conditions, the gravel-pack group exhibits a higher pressure difference across the sand-control unit. However, the pressure difference first increases and then levels off, indicating a distinct bridging process and the formation of a stable gravel-pack structure. Figure 5b shows that low-viscosity oil does not significantly change the overall trend of the pressure curves. Gravel packing rapidly develops a stable bridging structure, and the time to reach steady production is 38.1% shorter than for the screen. Comparing Figure 5a,b also shows that, because the oil viscosity is slightly higher than that of water, its sand-carrying capacity is stronger, and the pressure increase rate in the oil phase is higher than in the water phase. At a clay content of 3%, the stabilized pressure difference for the oil-phase gravel-pack case is 12% higher than that for the water-phase case. For zero clay content, the pressure difference across the metal mesh screen remains almost unchanged during sand control. Under more realistic low-clay conditions, however, the pressure difference keeps increasing and fluctuates more strongly and more frequently than that of the gravel-pack group, indicating repeating cycles of sand deposition and scouring on the screen surface. Together with Figure 4b, this suggests that some areas of the screen surface experience severe local plugging. In Figure 5b, for the 3% clay case with screen sand control, the pressure difference increases to about 0.4 MPa and then gradually decreases. This behavior is interpreted as a consequence of the stronger sand-carrying capacity of the oil phase and the limitations of the experimental scale, which cannot fully reproduce the continuous transport of reservoir sand and clay to the sand-control unit over the entire well life. In an actual near-wellbore environment with continuously increasing clay content, the flow resistance would continue to rise, and there would be a high risk of early plugging of the filter layer.
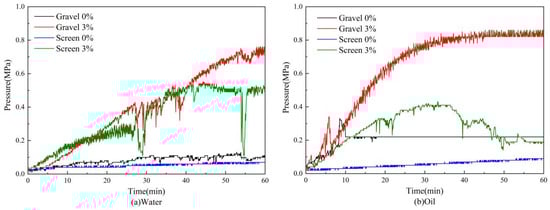
Figure 5.
Evolution of pressure difference across gravel-pack and screen sand-control units under different operating conditions.
Figure 6 shows the permeability evolution of the gravel-pack and screen sand-control units under different operating conditions. For both types of media, permeability decreases slowly at the beginning, then drops rapidly, and finally approaches a relatively stable value. This behavior corresponds to three characteristic stages of plugging: initiation, acceleration, and equilibrium [44]. The equilibrium permeability of the gravel-pack structure is lower than that of the screen group, but once a stable bridging structure is formed, the permeability curve of the gravel pack becomes smoother and more stable.
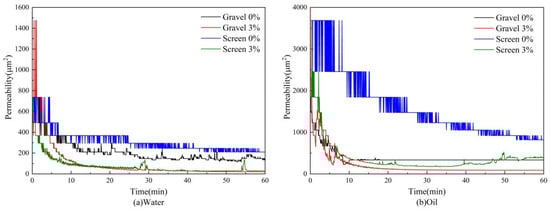
Figure 6.
Evolution of permeability for gravel-pack and screen sand-control units under different operating conditions.
As summarized in Figure 7, all tests meet the effective sand-control criterion in terms of total sand production. When the reservoir sand contains no clay, the designed sand-retention accuracy provides excellent sand control with almost no produced sand, making both mass and size distribution difficult to measure. At a clay content of 3%, the average cumulative sand production of the gravel-pack group is 1.62 times that of the screen group. However, evaluating sand-control performance based solely on sand volume is inappropriate. In terms of particle-size distribution, the gravel-pack group produces sand with a larger median size and a broader size range, indicating a stronger ability to form a multistage filtration zone and to restrict the migration of fine particles. During gravel-pack sand control, plugging develops gradually rather than instantaneously: pore channels are progressively filled, and flow paths are reorganized, and a small amount of early particle breakthrough does not imply sand-control failure [33].To further assess the long-term effectiveness of gravel packing, sand production under oil-phase conditions was compared after the gravel pack had developed an effective bridging structure, i.e., after the pressure had stabilized, with that of the screen over the same time interval. Although the screen maintained structural integrity, a noticeable fine-sand breakthrough occurred at 3% clay content, yielding 0.039 g of sand between 40 and 90 min. In contrast, the gravel-pack group produced almost no sand (≤0.01 g), a reduction of 74.4% relative to the screen, demonstrating its superior late-time sand-control performance. Such results are also consistent with the pressure evolution curves of the sand-control unit and are in agreement with the numerical simulation results presented in Section 3.6.3. Sand production predominantly occurred during the initial transient stage, which coincided with the rapid increase in pressure difference before an equilibrium stage was reached. Once the pressure difference stabilized, further sand migration became negligible within the duration of the experiment.
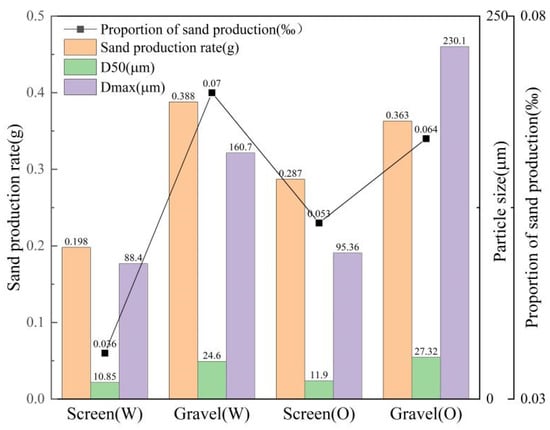
Figure 7.
Comparison of sand production for gravel-pack and screen sand-control units under different operating conditions.
The overall comparison shows that, because of its higher viscosity, the low-viscosity oil has a stronger sand-carrying capacity, leading to a faster increase in pressure and a higher stabilized pressure difference than under water-phase conditions. The gravel-pack structure can rapidly form a bridging sand-control framework and, under low-clay conditions, exhibits greater stability and adaptability, as well as superior long-term sand-control performance. To further optimize its design, the following sections systematically investigate how gravel size, packing thickness, packing density, and clay content affect sand-control performance and the underlying mechanisms.
3.2. Influence of Gravel Size on Gravel Packing
Optimal gravel size selection is a core issue in gravel-pack sand control. Whether reservoir sand can penetrate the gravel pack is mainly controlled by two factors: the size of the reservoir sand grains and the size of the pore channels formed within the gravel pack. The key is whether the gravel-pack structure can simultaneously provide sufficient sand-retention capacity and adequate flow paths. The ratio between gravel size and reservoir-sand size is therefore a critical design index. When this ratio is approximately 4–6, the gravel-pack permeability is maximized, so that productivity is maintained while sand grains are effectively prevented from entering the pack. When the ratio is <4 (gravel being too fine), permeability is significantly reduced, and production declines; when the ratio is >8 (gravel being too coarse), reservoir sand is more likely to penetrate the gravel pack and cause sand-control failure [22,45].
As shown in Figure 8, the pressure difference does not increase monotonically but exhibits noticeable fluctuations. These fluctuations are mainly attributed to the cyclic migration, bridging, and removal of the particles within the pore throats. Local pore blocking by sands causes a temporary increase in pressure difference, while the subsequent breakdown or bypass of these blockages leads to a sudden drop, resulting in the fluctuations. Under both water-phase and oil-phase conditions, the pressure curves for 16/30-mesh and 20/40-mesh gravel increase relatively smoothly and then stabilize. For the coarser 16/30 mesh pack, the larger and more heterogeneous pore throats allow clay and fines to penetrate deeper into the pack and be trapped internally, resulting in strong deep-bed filtration and a more pronounced pressure build-up. In contrast, for the finer and more uniform 20/40 mesh, fines are preferentially retained near the inlet and form a relatively continuous filter cake; once the differential pressure exceeds a critical value, this cake collapses, and a new preferential flow channel is opened, leading to the marked pressure drop observed in the 20/40 mesh curve at around 50 min. It should be noted that such marked pressure drops may occur in any individual test, and their influence on sand-control performance depends on the magnitude of the pressure loss, the extent of subsequent pressure recovery, and the eventual sand production behavior. The 30/50-mesh gravel exhibits a lower stabilized pressure difference, but its pressure curve shows abnormal spikes. This behavior is closely related to the sand-production response and is therefore interpreted together with the sand-production data in the next paragraph. For 10/20-mesh gravel, the pressure difference remains at a low level with almost no change. Figure 9 clearly indicates that larger gravel sizes create larger pore channels, leading to a higher initial permeability, which then decreases as sand migrates and accumulates. Gravel with an appropriate size is more likely to form a stable bridging structure: coarse reservoir sand tends to build a skeletal bridge at the top of the gravel pack and traps incoming large grains, while finer particles that pass through larger pores are retained by intergranular jamming and screening. This behavior is consistent with the stable pressure and permeability evolution observed for the 16/30-mesh and 20/40-mesh gravel packs. The permeability curve of the 10/20-mesh gravel pack exhibits remarkable fluctuations. This behavior is mainly a calculation effect rather than a sign of strong physical instability. Because the pressure difference across the pack remains very low under the same flow rate, minor disturbances of pressure difference are strongly amplified in the permeability calculated from Darcy’s law, resulting in the apparent large fluctuations in the curve.
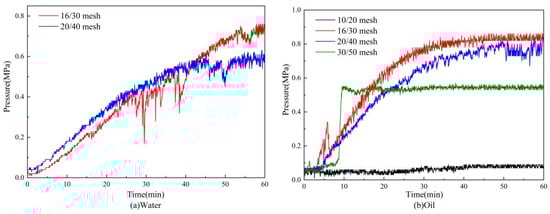
Figure 8.
Pressure difference evolution across gravel packs with different gravel sizes at 3% clay content.
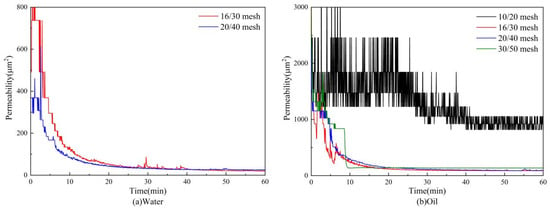
Figure 9.
Permeability evolution of gravel packs with different gravel sizes at 3% clay content.
Figure 10 shows that, for the cases of 16/30-mesh and 20/40-mesh gravel packs, the ratio of cumulative sand production to cumulative liquid volume is 0.034–0.064‰, well below the effective sand-control criterion of 0.3‰. The median grain size of produced sand ranges from 10.51 to 27.32 µm, and the maximum size from 43.97 to 230.1 µm, all within the designed sand-retention accuracy. Because of continuous sand migration and accumulation, the upstream part of the gravel pack experiences more severe damage [30]. In fine-gravel packs, the pore channels are smaller. Although this would theoretically improve sand retention, it also promotes rapid accumulation of clay and fine sand near the surface of the pack, leading to a sharp permeability decline, rapid pressure increase, and eventual fine-sand breakthrough. As shown in Figure 8b and Figure 10, for the 30/50-mesh gravel, the final stabilized pressure difference is low, but the pressure curve exhibits distinct spikes, indicating that no effective bridging structure forms; instead, transient localized plugging occurs. The cumulative sand production reaches 2.162 g, exceeding the effective sand-control limit, and the produced sand has a median size of 18.06 µm and a maximum size of 110.3 µm, with the size distribution dominated by fine particles. For 10/20-mesh gravel, the pore channels are too large, the sand-laden flow moves freely through the pack, and effective sand control cannot be achieved. The cumulative sand production reaches 2.639 g, and both the median grain size (66.09 µm) and the maximum size (355.0 µm) are significantly larger than those in the other experimental groups.
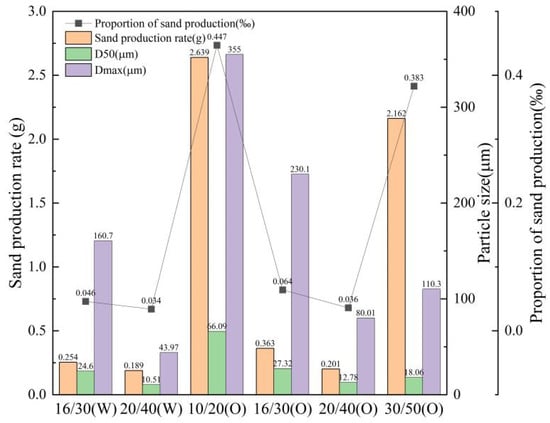
Figure 10.
Comparison of sand production for gravel packs with different gravel sizes at 3% clay content.
Based on the present experiments, the matching between reservoir-sand size and gravel size remains one of the most critical design parameters for gravel-pack sand control in light-oil reservoirs. For a given reservoir sand with specified grain-size distribution and clay content, there exists a critical gravel size beyond which sand-control failure occurs. Under the relatively fine-grained reservoir conditions considered in this study, gravel sizes of approximately 3–4 times the median grain size of the reservoir sand provide a good balance between productivity, pressure difference, and sand production control.
3.3. Influence of Packing Thickness on Gravel Packing
Gravel-pack thickness is one of the key structural parameters controlling the effectiveness of the sand-retention layer. It not only affects the development of the bridging structure, but also directly governs the erosion resistance and permeability stability of the pack. In principle, a thicker gravel pack provides a longer flow path, greater energy dissipation, and more opportunities for sand grains to be retained. Conversely, insufficient thickness makes the pack prone to local bridge collapse or the formation of through-going channels under high-velocity flow, leading to sand-control failure. After a well is put on production, reservoir sand carried by formation fluids can invade the gravel pack and form a mixing zone, as illustrated in Figure 4c, which causes a pronounced reduction in gravel-pack permeability and well productivity; the severity depends on the depth of invasion and the associated permeability loss [46,47,48].
The pressure-difference curves in Figure 11a show that the 25 mm gravel-pack group maintains a relatively high and smooth pressure difference throughout the experiment. The 20 mm group exhibits the most unstable behavior, with strong pressure fluctuations, whereas the 15 mm group shows a low and stable pressure difference at early times, followed by a gradual increase as plugging develops. As seen in Figure 11b, the 15 mm gravel pack initially has the highest permeability because of its shorter flow path and lower flow resistance. Under the fixed injection rate used in the experiments, the 25 mm gravel pack eventually attains the highest stabilized permeability, whereas the 20 mm pack ends up with the lowest.
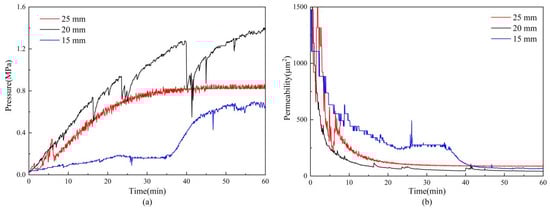
Figure 11.
Evolution of pressure difference (a) and permeability (b) for gravel packs with different packing thicknesses.
A combined analysis of pressure difference, permeability, and sand production (Figure 12) indicates that the 25 mm gravel pack develops a stable, continuous bridging structure during plugging and gradually establishes stable flow channels. Under low-clay conditions, this configuration effectively prevents fine particles from migrating deeper into the pack. In contrast, the other two thicknesses both exceed the effective sand-control criterion. For the 20 mm gravel pack, the flow field induces repeated cycles of bridge erosion and reformation, allowing large amounts of fine sand to pass through; the cumulative sand production reaches 3.393 g. These bridge collapse events cause transient pressure release, which is manifested as the pronounced pressure troughs observed in Figure 11a. For the 15 mm pack, the low early-time pressure difference actually reflects the formation of localized sand-production channels, and the cumulative sand production reaches 2.245 g. These results demonstrate that gravel packs with insufficient thickness cannot form a stable multistage filtration structure and tend to fail by through-flow channeling. Therefore, gravel-pack thickness is positively correlated with sand-control performance. A thicker gravel pack can rapidly build a skeletal bridging framework in the early stage, limiting deep invasion of fine particles, while its interior provides a larger buffer zone in which pore plugging follows a gradual “slowing then stabilizing” trend. When the thickness is inadequate, persistent flow more easily generates preferential channels and destabilizes the bridging structure, leading to a marked increase in sand production.
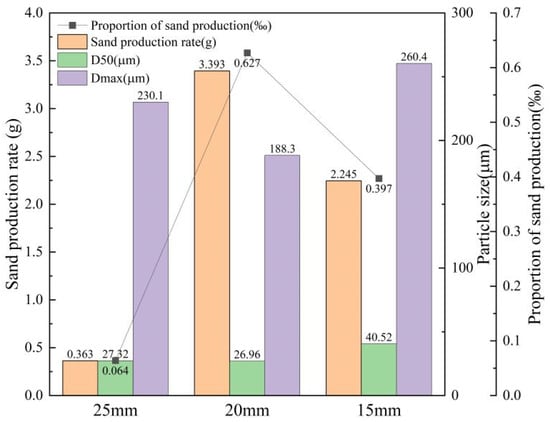
Figure 12.
Comparison of sand production for gravel packs with different packing thicknesses.
Taking both theoretical considerations and experimental results into account, a packing thickness of 25 mm is identified as the optimal value at the scale of this study, providing a good balance between sand-control stability and uniformity of flow channels. When the packing thickness is ≤20 mm, the instability of the bridging structure caused by insufficient thickness should be compensated by increasing the packing density or optimizing the gravel-size distribution. If the borehole diameter does not allow sufficient thickness, a gravel pack of limited thickness should be combined with a sand-control screen or graded filter layers to extend the effective sand-control period and mitigate the risk of early plugging.
3.4. Influence of Packing Density on Gravel Packing
Gravel-pack packing density has a significant impact on the evolution of bridging and sand control. Sparlin et al. [49] showed that mixing sand into gravel strongly reduces permeability: as the sand content increases, the permeability of the mixture decreases rapidly and can even fall below that of pure sand. In a special test with tightly packed media (74% gravel + 26% sand filling the pore space), the permeability was only 5.36 D, less than half that of pure sand packed by the same method.
As shown in Figure 13a, at a fixed packing thickness of 25 mm, increasing the packing density from 85% to 95% causes the pressure-difference curves to evolve from stepwise, fluctuating behavior with sharp spikes to an almost monotonic and smooth rise. For a 95% packing density, the pressure difference increases steadily and reaches a stable stage at around 0.85 MPa, with the smallest fluctuation amplitude. The 90% group shows intermittent rise–fall cycles with pronounced pressure oscillations. The 85% group exhibits the fastest pressure build-up and the strongest fluctuations, with instantaneous peaks up to 1.5 MPa, indicating unstable plugging. In Figure 13b, the permeability curve for 95% packing density is the most stable, that for 90% shows the largest fluctuations, and that for 85% has the lowest permeability overall.
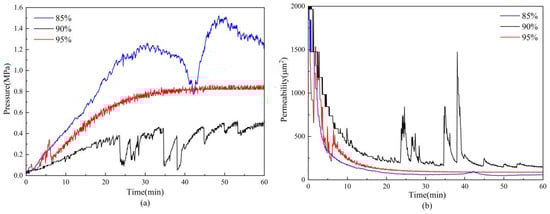
Figure 13.
Evolution of pressure difference (a) and permeability (b) for gravel packs with different packing densities.
Mechanistically, high packing density reduces pore-throat size but makes its distribution more uniform. Particles of different sizes are more effectively screened and retained within the gravel pack at an early stage, so flow resistance increases in a continuous manner, producing smooth pressure and permeability curves. When packing density decreases, the dispersion of pore-throat sizes increases. Preferential channels are more likely to form, leading to local bridging and bypass flow, and later in the flow history to delayed global plugging and sudden pressure jumps. These intermittent local bridging and bypass-flow events are responsible for the pronounced pressure peaks and troughs observed in Figure 13a. In the 85% low-density pack, the pore structure is highly non-uniform; particle migration and re-deposition during flow cause localized plugging, which explains why this low-density pack develops higher pressure and much lower permeability than the other cases.
Figure 14 compares sand production for different packing densities. As packing density decreases, both the median and maximum grain sizes of produced sand increase, and the total sand production rises sharply. For 85% packing density, cumulative sand production far exceeds the effective sand-control criterion.
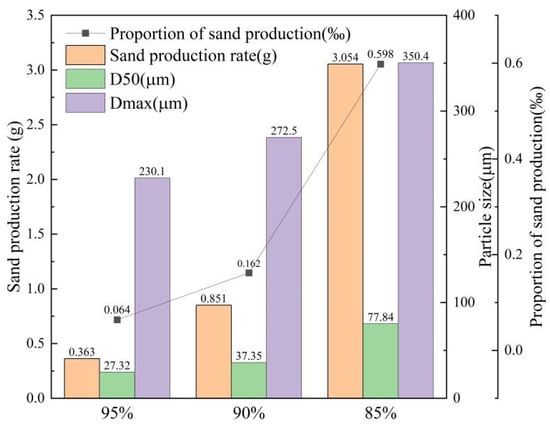
Figure 14.
Comparison of sand production for gravel packs with different packing densities.
These results suggest that, in field design, reducing the packing density does not enhance fluid flow capacity or improve permeability. Instead, it tends to create non-uniform flow channels, which promote local plugging after reservoir sand invasion and lead to permeability loss or unstable bridging with sustained pressure fluctuations. Both effects degrade sand-control performance and production stability. In contrast, high packing density provides a more uniform pore structure, resulting in a more controllable and stable pressure difference with smaller fluctuations.
3.5. Influence of Reservoir Clay Content on Gravel Packing
Clay content is one of the key reservoir parameters controlling the performance of gravel-pack sand control. Clay minerals such as montmorillonite and illite are very fine, have a large specific surface area, and exhibit swelling and strong adsorption. They readily form plugging nuclei within pore throats and alter the internal flow-path structure. As clay content increases, migrating clay particles can deposit on the surface or inside the gravel pack, inducing a coupled effect of fine-particle migration and clay plugging, which reduces gravel-pack permeability and shortens the effective sand-control period.
As shown in Figure 15 and Figure 16, when clay content increases from 0% to 10%, the pressure difference across the sand-control unit rises significantly for both 16/30-mesh and 20/40-mesh gravel packs, and the rate of increase becomes progressively higher. The corresponding permeability decreases significantly. At 0% clay, the pressure difference remains stable with no upward trend, and permeability stays relatively high, indicating unobstructed flow through the gravel pack and highlighting the critical role of clay in the plugging process. At clay contents of 3% and 5%, the pressure difference increases slowly and then stabilizes. This suggests that clay, fine sand, and coarse sand act together to build a stable multistage filtration and bridging structure within the gravel pack. Consistent with this, Figure 17 shows that, for all four clay contents, the ratio of sand production to liquid volume is 0.036–0.159‰, which is within the effective sand-control criterion, demonstrating the strong sand-retention capability of the gravel pack. At 10% clay content, the 16/30-mesh gravel pack exhibits a rapid rise and subsequent oscillations in pressure difference (Figure 15a), indicating severe plugging and instability. These oscillations are attributed to repeated clay-induced pore-throat blockage and partial re-opening during flow. The stabilized permeability is much lower than that at lower clay contents (Figure 15b), implying that clay particles form an essentially irreversible plugging structure within the gravel pack. Although the pressure difference across the sand-control unit increases sharply, it eventually reaches a stable level, and the cumulative sand production does not significantly exceed the effective sand-control limit (0.35‰ for 16/30 mesh). This confirms that gravel-pack sand control still retains a degree of adaptability under high-clay conditions.
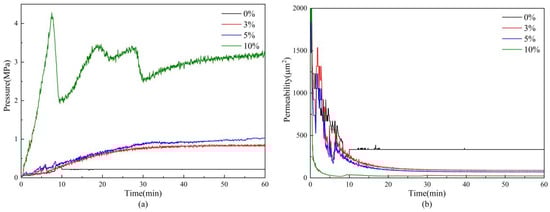
Figure 15.
Evolution of pressure difference (a) and permeability (b) for 16/30-mesh gravel packs at different clay contents.
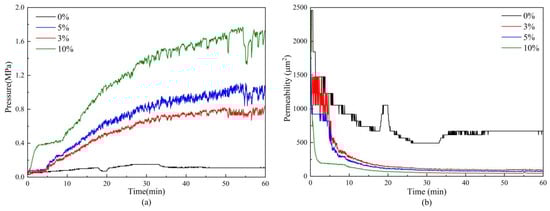
Figure 16.
Evolution of pressure difference (a) and permeability (b) for 20/40-mesh gravel packs at different clay contents.
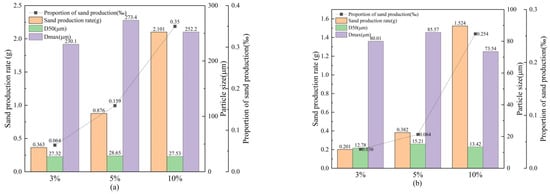
Figure 17.
Comparison of sand production for 16/30-mesh (a) and 20/40-mesh (b) gravel packs at different clay contents.
The response to clay content also differs between gravel sizes. For 20/40-mesh gravel packs, relatively small pressure fluctuations and higher equilibrium permeability can still be maintained at elevated clay contents, whereas 16/30-mesh packs exhibit earlier and more severe plugging under the same conditions. This indicates that, in finer gravel packs, the pore throats are smaller and clay and fine particles mainly accumulate near the surface, causing only limited blockage without significantly impairing overall flow. In contrast, coarser gravel packs have larger pores that are more susceptible to blockage by aggregates of clay and sand.
A combined analysis shows that clay content alters both the flow behavior of the fluid–particle system and the pore-throat structure of the filter layer, causing a pronounced nonlinear degradation of gravel-pack sand-control performance. At low clay contents, the gravel pack can maintain a stable bridging structure and effective multistage filtration. At high clay contents, however, permeability drops sharply, and the coupled effects of fine-particle migration and clay plugging can substantially shorten the effective sand-control period. Moderately reducing gravel size can partially alleviate deep plugging within the pack, but the effective clay-content threshold for reliable sand control still requires further experimental investigation and verification.
3.6. Numerical Verification and Mechanistic Interpretation
3.6.1. Numerical Method
Several fluid–solid coupling approaches have been developed that combine the discrete element method (DEM) with fluid-flow models, including Darcy–DEM, CFD–DEM (computational fluid dynamics), LBM–DEM (lattice Boltzmann method), SPH–DEM (smoothed particle hydrodynamics), and DNS–DEM (direct numerical simulation) [50,51]. Each has inherent limitations. DEM–Darcy is not suitable for high-velocity flow or particle-laden suspensions [52]. SPH is a continuum-based method that strongly depends on macroscopic constitutive relationships [53]. And DNS has limited capability for handling particle–particle collisions efficiently [54]. Because the above methods have some defects, both LBM–DEM and CFD–DEM have been widely applied to investigate sand-production mechanisms and migration behavior in conventional oil and gas reservoirs.
CFD–DEM has distinct advantages for resolving particle migration and is now widely used to study microscale particle transport in screens and gravel packs. The DEM was first proposed by Cundall in 1971 as a numerical method for analyzing assemblies of discrete particles [55]. Its key strength is that each physical particle is modeled individually, allowing the position, velocity, and contact forces of every particle to be computed and tracked at each time step [56]. DEM is therefore well suited for simulating particle-scale motion and interactions. In CFD, the fluid flow field is solved over each time step. In a coupled CFD–DEM simulation, the fluid flow and particle motion are computed simultaneously, and the two-way interaction between fluid and particles is explicitly accounted for. As a result, the simulation can realistically capture particle-transport behavior [57]. On this basis, several commercial software combinations have been used to model fluid–particle interaction, such as OpenFOAM + LIGGGHTS, ANSYS Fluent + EDEM, and PFC3D. In this study, the simulations were carried out using a coupled ANSYS Fluent–EDEM framework (Figure 18). The governing equations of the numerical model are given in the Appendix A.
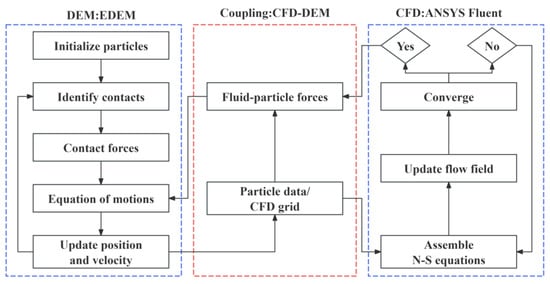
Figure 18.
Flowchart of the coupled CFD–DEM simulation procedure.
3.6.2. Model Description
To focus on sand transport, spatial distribution, and the plugging process within the gravel pack, a one-way fluid–solid coupling model was adopted. To balance computational cost and accuracy, the cylindrical sand-control unit used in the physical experiments was simplified to a cubic model with a reduced inlet area, as shown in Figure 19a,b. This geometric simplification does not affect the essential features of sand migration. The model consists of a 30 mm × 30 mm × 12.5 mm gravel-pack layer and five 0.3 mm outlet channels. Sand-laden fluid enters through the entire square inlet face and exits through the outlet channels. The overall configuration is based on the gravel-pack sand-control unit used in the experiments. A structured mesh with 51,402 grid points and 25,350 hexahedral control volumes was generated for the CFD domain. Gravel particles were packed inside a cubic container bounded by rigid walls, as shown in Figure 19c. The particles were allowed to settle under gravity without additional compaction, yielding a packing density of about 95%, which better represents field conditions and provides sufficient pore space and flow channels for reservoir-sand migration.
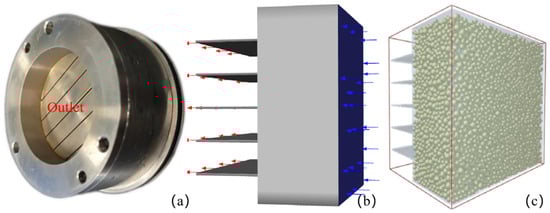
Figure 19.
Physical sand-control unit (a), numerical model (b), and gravel-pack model (c).
Two particle sizes, 0.8 mm and 1.2 mm, were used in the model to represent the gravel-pack layer, which approximately matches the experimentally optimized gravel size of 16/30 mesh (0.60–1.18 mm). The material properties of the gravel particles are summarized in Table 3. Based on the reservoir sand grain-size distribution, two size fractions of reservoir sand were defined in the simulation: sand with a median grain size (0.2 mm) and fine sand (0.1 mm). Because the simulations do not focus on deformation and collisions between gravel and reservoir sand, and previous studies have shown that Young’s modulus and shear modulus have only a minor influence on CFD–DEM results [50,58,59,60,61], a relatively low shear modulus was assigned to accelerate the calculations. The injected fluid properties were chosen to match those of the reservoir crude oil and the experimental test fluid, with a density of 840 kg/m3 and a dynamic viscosity of 0.005 kg/(ms).
Table 3.
Parameters used in the simulation.
The flow in the system is modeled as one-dimensional, isothermal linear flow. At the inlet, a sand-laden fluid velocity of 0.06 m/s is prescribed to match the constant injection rate used in the experiments. The fluid outlet is assigned to a zero-gauge pressure boundary condition. This boundary condition represents the drawdown pressure, i.e., the difference between the reservoir pressure and the bottom-hole flowing pressure, rather than the absolute values of these two pressures [62,63]. An Euler time-integration scheme is used to better capture porous flow, particle collisions, and the plugging process. In Fluent, the flow is solved with a heterogeneous Eulerian multiphase model. The Eulerian phase is configured as a Dense Discrete Phase Model (DDPM), in which the carrier fluid (oil) is coupled with the reservoir-sand particles generated in EDEM to form the sand-laden fluid. The viscosity model is described by the RNG k–epsilon model with scalable wall functions (SWFs). To ensure stable and efficient two-phase coupling, pressure–velocity coupling is handled using the Phase-Coupled SIMPLE algorithm. The momentum, volume-fraction, and turbulence transport equations are discretized with a first-order upwind scheme to achieve robust convergence. In the discrete-phase model, Saffman lift, virtual-mass forces, pressure-gradient forces, and two-way turbulence coupling acting on the EDEM particles are all considered.
3.6.3. Analysis of Reservoir-Sand Migration Results
Figure 20 shows the distribution of reservoir sand within the gravel pack at 1 s, where green denotes 0.2 mm sand and red denotes 0.1 mm sand. The coarse particles mainly accumulate near the formation side at the outer surface of the gravel pack, filling large pores and compressing the gravel toward the casing. A smaller portion of coarse sand penetrates deeper, usually as aggregates of multiple grains, and further fills medium-to-large pores inside the pack, thereby building a dense multistage filtration and bridging structure. The fine particles penetrate more deeply and occupy a wider region, but this does not imply sand-control failure. Early migration and breakthrough of fine particles are unavoidable. As reservoir sand of different sizes progressively fills the medium and large pores within the gravel pack, an increasing fraction of the fine sand is trapped in the shallow part of the pack.
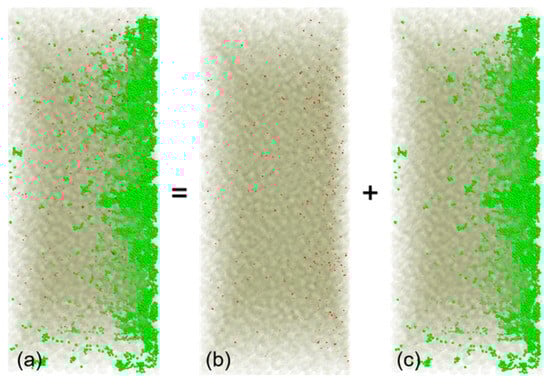
Figure 20.
Spatial distribution of reservoir sand in the gravel pack: (a) all reservoir sand, (b) 0.1 mm sand, and (c) 0.2 mm sand.
Figure 21 shows snapshots of the local sand distribution within the gravel pack at different times, which helps to visualize particle migration and the plugging process. The evolution can be divided into four stages: the initial stage, the surface-accumulation stage, the deep-filling stage, and the equilibrium stage. In the surface-accumulation stage, as fluid enters the pack, fine particles move easily through the pore network and are transported rapidly. Coarse particles, together with part of the fine particles, begin to accumulate in the larger pores near the outer surface of the gravel pack, forming local plugs. Flow channels at the surface start to close, and a bridging structure begins to develop, as shown in Figure 21b. In the deep-filling stage, some coarse particles gradually penetrate deeper and fill the medium-to-large pores inside the gravel pack, thereby constructing a multistage filtration structure, as shown in Figure 21c. Surface pores are nearly filled, and the further invasion of coarse particles is largely controlled. In the equilibrium stage, the surface of the gravel pack is fully covered by sand, and both the large pores at the surface and the medium-to-large pores in the interior are essentially filled by the two kinds of sand, forming a stable multistage filtration and bridging structure, as shown in Figure 21d. Sand migration within the gravel pack is nearly complete, the flow field reaches a steady state, and most fine particles are retained near the surface with almost no additional fines penetrating deeper into the pack. This indicates that an effective sand-control barrier has been established. This four-stage evolution is consistent with the experimental observations, in which gravel-packed sand-control units exhibit a “pressure difference that first increases and then stabilizes, accompanied by very low late-time sand production.”
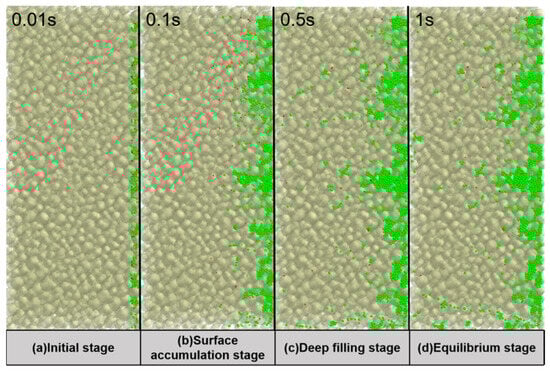
Figure 21.
Migration and plugging of reservoir sand within the gravel pack.
4. Discussion
This study demonstrates the superiority of gravel packing for sand control in light-oil unconsolidated sandstone reservoirs and clarifies the underlying sand-retention mechanisms of the gravel-pack layer. Previous work has shown that fluid viscosity is a key parameter affecting gravel-pack performance. Based on the reservoir properties of the Weizhou oilfield, this work conducts extensive multi-parameter gravel-pack experiments and simulations under low-viscosity oil conditions, thereby filling an important gap in the optimization of gravel-pack sand control for light-oil reservoirs.
A noteworthy observation emerged from the experimental results. The optimal gravel size under clay-rich conditions deviates from the traditional Saucier guideline, which recommends gravel sizes of 5–6 times the median reservoir-sand grain size. When reservoir clay content increases, the present results suggest that moderately reducing the gravel size to about 3–4 times the median sand size yields a more stable pressure curve. This is because aggregates of clay and reservoir sand tend to cause deep plugging within the gravel pack, whereas smaller gravel sizes help confine such plugging to the near-surface zone. This trend has also been confirmed in previous studies: for example, Yang et al. [64] found experimentally that selecting gravel sizes 3–4 times the median reservoir-sand size reduces the probability of sand–gravel intermixing.
From an engineering perspective, this setup is mainly used to rapidly identify experimental trends, optimize parameters, and narrow the range of design variables. The resulting observations are broadly consistent with existing studies, confirming that these experimental simplifications are reasonably reliable. This, in turn, provides a convenient basis for future validation using full-scale sand-control simulators under more realistic engineering conditions such as longer-term cyclic production. And the experiments provide baseline data for the future development of predictive models for the final residual permeability of sand-control units under different sand-control strategies.
The numerical simulations in this work reveal that gravel-pack plugging evolves through four stages, which correspond well with the experimentally observed pressure–time curves and sand-production trends. However, existing studies on microscale plugging mechanisms have rarely incorporated the effect of clay content. In reality, clay occurs mainly as clay minerals, with montmorillonite in particular exhibiting strong swelling and adsorption, and it plays a crucial role in plugging within sand-control units. The microscale migration and plugging mechanisms of particles under clay-coupled conditions should therefore be a key focus of future research. In particular, combined pore-scale visualization, microfluidic experiments, and coupled numerical simulations are recommended to quantitatively resolve the interactions between clay particle and fluid.
5. Conclusions
Based on the grain-size distribution and crude-oil properties of the light-oil unconsolidated sandstone reservoirs in the Weizhou oilfield of the South China Sea, a series of visual sand-control experiments was designed and conducted. The sand-control performance of gravel packing was compared with that of premium screens, and the effects of gravel size, packing thickness, packing density, and clay content on gravel-pack sand-control behavior were systematically evaluated. In addition, a coupled CFD–DEM numerical model was used to investigate the plugging mechanisms within the gravel pack. The main conclusions are as follows:
- (1)
- Under long-term operation, the pressure-difference curve of the gravel pack follows a “rise–then–stabilize” pattern, indicating the formation of a stable bridging structure and a multistage filtration zone. The time to reach stable production is 38.1% shorter than for the screen, showing higher late-time stability and adaptability. Under clay-bearing conditions, screens are more prone to fine-sand breakthrough. After a stable bridge forms in the gravel pack, the controlled sand production is reduced by 74.4% compared with the screen.
- (2)
- Low-viscosity oil has a stronger sand-carrying capacity than water, which accelerates both sand production and plugging. Compared with the water phase, the stabilized pressure difference across the sand-control unit increases by 12%, and the pressure curve rises more rapidly.
- (3)
- For the target reservoir characterized by heterogeneous fine sand and low clay content, gravel sizes of approximately 3–6 times the median reservoir-sand grain size provide an optimal compromise between permeability and sand-retention efficiency. If the gravel is too fine, clay and fine sand readily accumulate near the surface, causing a rapid permeability decline. If the gravel is too coarse, pore throats become too wide, and the risk of fine-sand breakthrough increases.
- (4)
- In field applications, it is critical to ensure sufficient packing thickness (≥25 mm) and packing density (90–95%). Insufficient thickness or low packing density leads to pronounced pressure fluctuations and can promote the formation of preferential sand-production channels or severe local plugging.
- (5)
- Clay content is strongly positively correlated with the pressure difference across the gravel pack. High clay content can cause severe coupled plugging by clay and sand, yet the pressure curve ultimately stabilizes, indicating that gravel packs retain a certain adaptability to increasing clay content. At moderate clay contents, slightly reducing the gravel size to about 3–4 times the median reservoir-sand grain size can mitigate clay–sand coupled plugging.
- (6)
- Gravel-pack plugging proceeds through four stages: initiation, surface accumulation, deep filling, and equilibrium. Coarse particles first form a skeletal bridge near the boundary and at the surface; part of the coarse and fine particles then progressively fill medium-to-large pores inside the pack, and the system gradually develops a stable multistage filtration structure. This evolution is consistent with the experimental observation that the pressure difference first increases and then stabilizes, while late-time sand production remains very low.
Based on the experimental and numerical simulation results, the following guidelines are recommended for practical gravel-pack applications. The gravel size should first be determined according to the median formation sand size (d50) and the clay content of the target reservoir. The traditional Saucier criterion is applicable to sandstone reservoirs with low clay content (<5%). For formations with relatively higher clay content, a reduced gravel size of approximately 3–4 times the median formation sand size is recommended. In addition, considering reservoir conditions and operational constraints, field implementation should ensure a packing thickness greater than 25 mm and a packing density of 90–95% to achieve improved sand-control performance.
Author Contributions
Conceptualization, P.D., H.G., Y.A. and Y.Z.; Methodology, P.D., H.G., Y.A. and Y.Z.; Software, P.D., H.G., Y.A. and Y.Z.; Validation, P.D.; Investigation, P.D., H.G., Y.A. and Y.Z.; Resources, P.D., Y.A. and Y.Z.; Data curation, P.D. and H.G.; Writing—original draft, P.D. and H.G.; Writing—review & editing, P.D., H.G., Y.A. and Y.Z.; Supervision, Y.A. and Y.Z. All authors have read and agreed to the published version of the manuscript.
Funding
This work was financially supported by Sponsored by Beijing Nova Program (No. 20240484622).
Data Availability Statement
The original contributions presented in this study are included in the article. Further inquiries can be directed to the corresponding author.
Conflicts of Interest
Author Peng Du was employed by the SINOPEC Shanghai Offshore Oil and Gas Company. The remaining authors declare that the research was conducted in the absence of any commercial or financial relationships that could be construed as a potential conflict of interest.
Appendix A
Appendix A.1. Fluid Control Equation
In CFD–DEM, the fluid phase is treated as a continuum and solved using the Navier–Stokes equations [65]. The corresponding mass and momentum conservation equations can be written as
where is the volume fraction of the fluid, dimensionless; is the fluid density, kg/m3; is the fluid velocity, m/s; is the fluid pressure, Pa; is the fluid viscosity, Pa·s; and is the momentum term—that is, the body force of each fluid unit or the force of sand particles in the fluid unit on the fluid, N/m3.
Appendix A.2. Particle Motion Control Equation
Newton’s Equation (A3) and Euler’s Equation (A4) describe the motion of each particle, including both translational and rotational components [66].
where is the mass of the particle, kg; is the translational velocity of the particle, m/s; is the angular velocity of the particle, rad/s; is the inertia moment of the particle, kg·m2; is the total force on the particle, N; is the torque acting on the particle, N·m; and g is the gravitational acceleration, m/s2.
Appendix A.3. Force Between Fluid and Particles
The interaction forces between the fluid and particles include drag, Saffman lift, buoyancy, gravity, pressure-gradient force, and the Basset history force. Among these, drag is the dominant force driving the motion of reservoir sand in the fluid. The drag force primarily reflects the momentum exchange between the fluid and particles, and the Di Felice model is one of the most commonly used approaches for describing drag in particle-blocking problems [32]. Its expression is given by
where is the Reynolds number of fluid sand, dimensionless; is the radius of sand, m; is the drag coefficient, dimensionless, ; is the correction coefficient; and is the porosity.
References
- Ying, R.; Zhao, X.; Shi, B.; Wu, L.; Zhang, X.; Jiang, Z.; Guo, X. Experimental study on erosion and wear law of metal screen under spraying condition. J. Mech. 2022, 38, 117–127. [Google Scholar] [CrossRef]
- Shirinabadi, R.; Moarefvaand, P.; Goshtasbi, K.; Ahangari, K. The physical and numerical modeling of sand production and gravel pack in oil wells by designing and manufacturing the machine and presenting a relation estimating sand production rate. J. Min. Sci. 2016, 52, 300–312. [Google Scholar] [CrossRef]
- Ma, S.; Huang, J.; Zhang, F. Reasonable horizontal well producing drawdown determination of the low-permeability unconsolidated sandstone reservoir in western south china sea. Spec. Oil Gas Reserv. 2018, 25, 138–142. [Google Scholar]
- Zhang, Z. An Advanced Sand Control Technology for Heavy Oil Reservoirs. Master’s Thesis, University of Calgary, Calgary, AB, Canada, 2017. [Google Scholar]
- Lin, S.; Lu, Y.; Liu, Z.; Lu, W.; Hu, P. Novel Water-Based Mud for Low-Permeable Reservoir in South China Sea. Energies 2023, 16, 1738. [Google Scholar] [CrossRef]
- Chen, G.; Meng, Y.; Huan, J.; Wang, Y.; Zhang, L.; Xiao, L. Distribution and origin of anomalously high permeability zones in Weizhou formation, Weizhou 12-X oilfield, Weixinan Sag, China. Earth Sci. Inform. 2021, 14, 2003–2015. [Google Scholar] [CrossRef] [PubMed]
- Zhou, B.; Dong, C.; Gan, L.; Liu, Y.; Xu, H.; Li, Q. Experimental simulation and new prediction model of sand control screen erosion performance in weakly consolidated heterogeneous reservoirs. J. Pet. Sci. Eng. 2022, 215, 110587. [Google Scholar] [CrossRef]
- Xin, Y.; Chen, G.; Lei, Y.; Ren, P.; He, Z. Analysis of Sand Production Reasons of Oil Wells in Loose Sandstone Reservoir of XX Oilfield in Bohai Sea. Technol. Superv. Pet. Ind. 2024, 41, 6–11. (In Chinese) [Google Scholar]
- Yeh, C.; Moffett, T.; Barry, M.; Hecker, M.; Howell, D.; Green, A.; Gillespie, G.; Hall, C.; McNamee, S. Enhancing sand screen reliability: An innovative, adaptive approach. In Proceedings of the SPE Annual Technical Conference and Exhibition, Florence, Italy, 20–22 September 2010; p. SPE-134492-MS. [Google Scholar]
- Abduljabbar, A.; Mohyaldinn, M.E.; Younis, O.; Alghurabi, A.; Alakbari, F.S. Erosion of sand screens by solid particles: A review of experimental investigations. J. Pet. Explor. Prod. Technol. 2022, 12, 2329–2345. [Google Scholar] [CrossRef]
- Peng, Y.; Fu, G.; Sun, B.; Sun, X.; Chen, J.; Estefen, S.F. Bending Deformation and Ultimate Moment Calculation of Screen Pipes in Offshore Sand Control Completion. J. Mar. Sci. Eng. 2023, 11, 754. [Google Scholar] [CrossRef]
- Gundemoni, B.R.; Jackson, S.R.; Zimmermann-Ptacek, J.; Barth, P.; Idris, K.N.; Yeap, W.J.; Catherine, T.L. Ceramic Sand Screen Design Enhancement Lessons Learnt from Initial Field Installations of through Tubing Applications in Offshore East Malaysia to Improve Well Performance. In Proceedings of the Offshore Technology Conference Asia, Kuala Lumpur, Malaysia, 2–6 November 2020; p. D041S040R004. [Google Scholar]
- Khan, R.; Ya, H.H.; Pao, W.; Khan, A. Erosion–corrosion of 30°, 60°, and 90° carbon steel elbows in a multiphase flow containing sand particles. Materials 2019, 12, 3898. [Google Scholar] [CrossRef]
- Yang, L.; Lin, H.; Zhou, S.; Feng, Z. An Improved Artificial Electric Field Algorithm for Determining the Maximum Length of Gravel Packing in Deep-Water Horizontal Well. J. Mar. Sci. Eng. 2024, 12, 1507. [Google Scholar] [CrossRef]
- Nie, S.; Li, H.; Hu, Z.; Wen, M.; Gao, S.; Zhang, H.; Luo, H.; Zhang, L. A review of the research status and development prospects for gravel packing sand control in horizontal wells. Geoenergy Sci. Eng. 2023, 229, 212152. [Google Scholar] [CrossRef]
- Fucheng, D.; Jingen, D.; Ying, Y.; Lihua, W.; Wei, Y. Gravel pre-packed screen development and filled parameters optimization research. SOCAR Proc. 2012, 4, 20–29. [Google Scholar] [CrossRef]
- Li, Y.; Chen, S.; Wang, X.; Zhang, D.; Liu, S.; Xia, Z. Sand control method optimization of loose sandstone in X oilfield in eastern South China Sea. Chem. Eng. Equip. 2023, 3, 91–92. (In Chinese) [Google Scholar]
- Shi, H.; Dong, C.; Zhan, X.; Liu, C.; Li, L.; Ji, J.; Yu, Y.; Li, Z. Selection Results of Solid Material for Horizontal and Highly-Deviated Well Completion Gravel-Packing: Experiments, Numerical Simulation and Proposal. J. Mar. Sci. Eng. 2024, 12, 1690. [Google Scholar]
- Carlson, J.; Gurley, D.; King, G.; Price-Smith, C.; Waters, F. Sand control: Why and how. Oilfield Rev. 1992, 4, 41–53. [Google Scholar]
- Saucier, R. Considerations in gravel pack design. J. Pet. Technol. 1974, 26, 205–212. [Google Scholar] [CrossRef]
- Zimmermann, J.H.B.; Haftani, M.; Wang, C.; Salimi, M.; Nouri, A. A novel laboratory technique for open-hole gravel-pack design. J. Pet. Sci. Eng. 2022, 215, 110713. [Google Scholar]
- Bigna, Y.; Oyeneyin, M.; Peden, J. Investigation of pore-blocking mechanism in gravel packs in the management and control of fines migration. In Proceedings of the SPE International Conference and Exhibition on Formation Damage Control, Lafayette, LA, USA, 7–10 February 1994; p. SPE-27342-MS. [Google Scholar]
- Liu, Q.; Cui, X.; Zhang, C.; Huang, S. Experimental investigation of suspended particles transport through porous media: Particle and grain size effect. Environ. Technol. 2016, 37, 854–864. [Google Scholar]
- Dong, C.; Zhou, Y.; Chen, Q.; Zhu, C.; Li, Y.; Li, X.; Liu, Y. Effects of fluid flow rate and viscosity on gravel-pack plugging and the optimization of sand-control wells production. Pet. Explor. Dev. 2019, 46, 1251–1259. [Google Scholar] [CrossRef]
- Nguyen, P.; Fitzpatrick, H.; Woodbridge, G.; Reidenbach, V. Analysis of gravel packing using 3-D numerical simulation. In Proceedings of the SPE International Conference and Exhibition on Formation Damage Control, Lafayette, LA, USA, 26–27 February 1992; p. SPE-23792-MS. [Google Scholar]
- Zare-Reisabadi, M.R.; Beidokhti, M.; Kaffash, A.; Bataee, M. Sand production prediction and well completion optimization. Int. J. Pet. Geosci. Eng. 2014, 2, 361–374. [Google Scholar]
- Zamani, A.; Maini, B. Flow of dispersed particles through porous media—Deep bed filtration. J. Pet. Sci. Eng. 2009, 69, 71–88. [Google Scholar] [CrossRef]
- Seyed Atashi, S.M.; Goshtasbi, K.; Basirat, R. Fluid properties effects on sand production using discrete element method. J. Chem. Pet. Eng. 2018, 52, 169–179. [Google Scholar]
- Lezhnev, K. Application of discrete element method for modelling sand control systems. In Proceedings of the SPE Russian Petroleum Technology Conference, Moscow, Russia, 15–17 October 2018; p. D033S017R015. [Google Scholar]
- Li, Y.; Li, M.; Qin, G.; Wu, J.; Wang, W. Numerical simulation study on gravel-packing layer damage by integration of innovative experimental observations. In Proceedings of the SPE Canada Heavy Oil Conference, Calgary, Canada, 12–14 June 2012; p. SPE-157927-MS. [Google Scholar]
- Luo, B.; Xiong, Y.; Li, Z.; Qu, Z.; Liu, F.; Guo, T.; Yang, Z.; Shi, Y. Experimental and Numerical Analysis of Particle Migration and Patterning Behavior in a Gravel Pack. Fluid Dyn. Mater. Process. 2022, 19, 911–928. [Google Scholar] [CrossRef]
- Deng, F.; Wen, L.; Li, G.; Fan, B.; Gong, N.; Chen, S. Study of the blocking mechanism in gravel packing based on CFD-DEM. Particuology 2024, 90, 164–178. [Google Scholar] [CrossRef]
- Ma, C.; Dou, Y.; Deng, J.; Hui, C.; Zhao, K.; Feng, Y.; Dou, L. Numerical simulations of sand-screen performance in unconsolidated prepacked gravel screen. Energy Sci. Eng. 2023, 12, 983–1003. [Google Scholar] [CrossRef]
- Deng, J.; Li, P.; Zhou, J.; He, B.; Chen, S.; Wang, L. Sand control optimization applied to moderately sanding wells in offshore loose sandstone reservoirs. Acta Pet. Sin. 2012, 33, 676–680. (In Chinese) [Google Scholar]
- Deng, F.; Shen, X.; Liang, Q.; Wang, L.; Wang, J.; Deng, Z.; Wei, J. The jamming mechanism of sand control screen for the montmorillonite inflation with the water. J. Pet. Explor. Prod. Technol. 2018, 8, 189–194. [Google Scholar] [CrossRef]
- Lou, M.; Yang, X.; Yao, G.; Jiang, P. Relationship between authigenic clay mineral and dessert reservoir—A case study in Weixinan Sag and Wenchang A Sag. Geol. Surv. China 2021, 8, 13–23. (In Chinese) [Google Scholar]
- Alcocer, C.; Toups, M.; Hayatdavoudi, A.; Ghalambor, A.; Okoye, C. The Effect of Temperature on the Size Stability of Conventional and Ceramic Gravel Packs. In Proceedings of the SPE International Conference and Exhibition on Formation Damage Control, Lafayette, LA, USA, 22–23 February 1990; p. SPE-19405-MS. [Google Scholar]
- SY/T 5183-2016; Evaluation Methods for Sand Control Effect of Oil Well. China Industry Standard (Petroleum): Beijing, China, 2024.
- Changyin, D. Sand Control Technology for Oil and Gas Wells; China Petrochemical Press: Beijing, China, 2009; p. 104. (In Chinese) [Google Scholar]
- Peng, X.; Dou, L.; Gao, Q.; Tian, P.; Li, M.; Gao, W. A new gravel pack parameter optimization scheme to reduce the risk of sand production in unconsolidated sandstone reservoirs. Powder Technol. 2025, 465, 121338. [Google Scholar] [CrossRef]
- Feng, S.; Wei, Y.; Zhang, Q.; Wang, T.; A, X.; Xing, Z. The technical parameters of sand control by gravel packing in the Sebei gas field. Nat. Gas Ind. 2009, 29, 89–91+142–143. (In Chinese) [Google Scholar]
- Cao, Y.; Wen, M.; Qiu, H.; Xinjiang, Y.; Zhai, X. Erosion life prediction of metal mesh screen pipes in oil wells based on numerical simulation of discrete particle flow. ACS Omega 2023, 8, 39807–39815. [Google Scholar] [CrossRef]
- Ramezanian, M. An Experimental Study to Investigate the Effect of Temperature and Pressure on a Modified Design of Gravel Packing with Oil Swelling Rubber Particles and Unconventional Rock Properties. Ph.D. Thesis, Texas Tech University, Lubbock, TX, USA, 2020. [Google Scholar]
- Dong, C.; Gao, K.; Dong, S.; Shang, X.; Wu, Y.; Zhong, Y. A new integrated method for comprehensive performance of mechanical sand control screens testing and evaluation. J. Pet. Sci. Eng. 2017, 158, 775–783. [Google Scholar] [CrossRef]
- Matanovic, D.; Cikes, M.; Moslavac, B. Sand Control in Well Construction and Operation; Springer Science & Business Media: Heidelberg/Berlin, Germany, 2012; pp. 54–64. [Google Scholar]
- Gao, K.; Dong, C.; Gao, J.; Zhou, C.; He, H.; Dong, Y. Regularity of permeability loss in gravel-packing layer for sand control during initial production. Oil Drill. Prod. Technol. 2016, 38, 876–881. [Google Scholar]
- Wang, Z.-G.; Li, A.-F.; Zhang, H.-L. Experimental study on the mechanism of gravel packing for gravel packing. J. China Univ. Pet. (Ed. Nat. Sci.) 2000, 24, 49–53. [Google Scholar]
- Dong, C.; Gao, K.; Wang, J.; Zhi, Q. Experimental study on mechanical and chemical combined plugging mechanism of sand control media in heavy oil reservoirs with polymer flooding. J. China Univ. Pet. (Ed. Nat. Sci.) 2016, 40, 104–111. [Google Scholar]
- Sparlin, D.D. Sand and gravel-A study of their permeabilities. In Proceedings of the SPE International Conference and Exhibition on Formation Damage Control, New Orleans, LA, USA, 30 January–1 February 1974; p. SPE-4772-MS. [Google Scholar]
- Cheng, K.; Wang, Y.; Yang, Q. A semi-resolved CFD-DEM model for seepage-induced fine particle migration in gap-graded soils. Comput. Geotech. 2018, 100, 30–51. [Google Scholar] [CrossRef]
- Hu, Z.; Zhang, Y.; Yang, Z. Suffusion-induced deformation and microstructural change of granular soils: A coupled CFD–DEM study. Acta Geotech. 2019, 14, 795–814. [Google Scholar] [CrossRef]
- Goodarzi, M.; Kwok, C.Y.; Tham, L.G. A continuum-discrete model using Darcy’s law: Formulation and verification. Int. J. Numer. Anal. Methods Geomech. 2015, 39, 327–342. [Google Scholar] [CrossRef]
- Boutt, D.; Cook, B.; Williams, J. A coupled fluid–solid model for problems in geomechanics: Application to sand production. Int. J. Numer. Anal. Methods Geomech. 2011, 35, 997–1018. [Google Scholar] [CrossRef]
- Zhu, H.P.; Zhou, Z.Y.; Yang, R.; Yu, A. Discrete particle simulation of particulate systems: Theoretical developments. Chem. Eng. Sci. 2007, 62, 3378–3396. [Google Scholar] [CrossRef]
- Cundall, P.A.; Strack, O.D. A discrete numerical model for granular assemblies. Geotechnique 1979, 29, 47–65. [Google Scholar] [CrossRef]
- Mao, S.; Shang, Z.; Chun, S.; Li, J.; Wu, K. An efficient three-dimensional multiphase particle-in-cell model for proppant transport in the field scale. In Proceedings of the SPE/AAPG/SEG Unconventional Resources Technology Conference, Denver, CO, USA, 22–24 July 2019; p. D023S034R001. [Google Scholar]
- Tsuji, Y.; Kawaguchi, T.; Tanaka, T. Discrete particle simulation of two-dimensional fluidized bed. Powder Technol. 1993, 77, 79–87. [Google Scholar] [CrossRef]
- Ismail, N.I.; Kuang, S.; Yu, A. CFD-DEM study of particle-fluid flow and retention performance of sand screen. Powder Technol. 2021, 378, 410–420. [Google Scholar]
- Chilamkurti, Y.N. Towards Understanding the Heat Transfer Behavior of Dense Granular Media; North Carolina State University: Raleigh, NC, USA, 2019; pp. 43–49. [Google Scholar]
- Deshpande, R.; Antonyuk, S.; Iliev, O. Study of the filter cake formed due to the sedimentation of monodispersed and bidispersed particles using discrete element method–computational fluid dynamics simulations. AIChE J. 2019, 65, 1294–1303. [Google Scholar] [CrossRef]
- Kloss, C.; Goniva, C.; Hager, A.; Amberger, S.; Pirker, S. Models, algorithms and validation for opensource DEM and CFD–DEM. Prog. Comput. Fluid Dyn. Int. J. 2012, 12, 140–152. [Google Scholar]
- Liu, Y.; Wang, L.; Hong, Y.; Yin, Z.-Y. Coupled thermo-hydro-mechanical-chemical modeling of fines migration in hydrate-bearing sediments with CFD-DEM. Can. Geotech. J. 2022, 60, 701–717. [Google Scholar] [CrossRef]
- Song, Y.; Ranjith, P.; Wu, B.; Song, Z. A microscopic study of sand arches and sand skeletons under hydrodynamic force based on the CFD-DEM model. J. Nat. Gas Sci. Eng. 2021, 92, 104017. [Google Scholar] [CrossRef]
- Yang, W.; Wen, Z.; Wei, X. Loose Sandstone Reservoir Gravel Packing Sand Control Technology Research on Parameters Optimization. Sci. Technol. Eng. 2013, 13, 2813–2816+2826. (In Chinese) [Google Scholar]
- Zhu, B.; Tang, H.; Wang, X.; Zhao, F.; Yuan, X. Coupled CFD-DEM simulation of granular LCM bridging in a fracture. Part. Sci. Technol. 2020, 38, 371–380. [Google Scholar] [CrossRef]
- Wu, C.-Y. Discrete Element Modelling of Particulate Media; Royal Society of Chemistry: London, UK, 2012; pp. 46–50. [Google Scholar]
Disclaimer/Publisher’s Note: The statements, opinions and data contained in all publications are solely those of the individual author(s) and contributor(s) and not of MDPI and/or the editor(s). MDPI and/or the editor(s) disclaim responsibility for any injury to people or property resulting from any ideas, methods, instructions or products referred to in the content. |
© 2026 by the authors. Licensee MDPI, Basel, Switzerland. This article is an open access article distributed under the terms and conditions of the Creative Commons Attribution (CC BY) license.