Article

Development of a Systematic Method for Tuning PID Control Gains in Free-Running Ship Simulations

Department of Naval Architecture and Ocean Engineering, Inha University, Incheon 22201, Republic of Korea
*
Author to whom correspondence should be addressed.
J. Mar. Sci. Eng. 2025, 13(9), 1813; https://doi.org/10.3390/jmse13091813
Submission received: 26 August 2025 / Revised: 14 September 2025 / Accepted: 15 September 2025 / Published: 19 September 2025
(This article belongs to the Special Issue Marine CFD: From Resistance Prediction to Environmental Innovation)

Abstract

In free-running ship simulations, PID control gains for rudder and propeller revolution are often selected based on empirical experience without a standardized procedure, leading to inconsistent results under varying operational conditions. This study examined PID control gains by implementing a simulation framework using STAR-CCM+. The Ziegler–Nichols tuning method was applied to derive control gains, and their behavior was analyzed across different wave conditions (calm, short, medium, and long waves), PID period condition, ship speeds (low and design speeds), and scale ratios. The simulations showed that the PID gains derived under moderate wave conditions provided stable and reliable control performance across various sea states. Furthermore, the influence of scale ratio changes on the control performance was evaluated, and a non-dimensional scaling formula for PID coefficients was proposed to enhance applicability across different model sizes. Validation against experimental data confirmed the reliability of the simulation setup. These findings offer a systematic guideline for selecting the PID control gains for free-running simulations, promoting improved accuracy and stability under diverse environmental and operational conditions. This research contributes to developing standardized practices for maneuvering performance evaluations in realistic maritime environments.

1. Introduction

With the rapid advances in science and technology, transportation systems have continuously evolved, with maritime, road, and air transport experiencing significant growth. Among these, the maritime transportation system has a dominant position within the global transport network. A study conducted by the global research institute STATISTA reported an approximately 4.5-fold increase in the volume of global maritime trade in 2019 compared to 1970 [1]. Consequently, maritime traffic issues have become more severe as the maritime transport volume continues to rise, leading to an increasing demand for enhanced ship safety and navigation control systems.
The thrust and directional control of a vessel are critical factors influencing safety and economic efficiency. Recent advances in computational power and improvements in the reliability and accuracy of computational fluid dynamics (CFD) analysis have facilitated the widespread application of CFD-based simulations for maneuvering performance estimation. These simulations, encompassing constrained model tests and free-running scenarios, enable precise evaluation of the effects of the interactions between the hull, rudder, and propeller.
The maneuverability of ships, which encompasses all aspects of trajectory, speed, and directional control, is generally classified into course-keeping, maneuvering, and speed-changing performance. The IMO has established maneuverability standards to mitigate the risk of maritime accidents [2]. These standards are defined for unrestricted deep water conditions, calm sea states, full-load draft configurations, and normal operating conditions. Nevertheless, a major limitation of these criteria is their exclusion of real-world environmental effects, such as waves, wind, and currents, which significantly influence the maneuvering performance of vessels in practical operating conditions.
During maneuvering operations, ships are subject to varying environmental disturbances, including waves, wind, and currents, significantly affecting their handling characteristics. A considerable proportion of maritime accidents is attributable to adverse sea conditions. The 2020 SIMMAN workshop held discussions on ship maneuvering performance estimations under calm water conditions and maneuvering performance assessments in wave conditions [3]. Consequently, the estimation of maneuvering performance that appropriately considers actual sea conditions has emerged as a crucial research area for ensuring maritime safety.
Two primary model testing methods are commonly used for maneuvering performance evaluation: the captive model test and the free-running model test. Among these, the free-running model test involves direct control of the rudder and propeller using a model ship, simulating actual ship operations. Compared to the captive model tests, the free-running model tests can provide more extensive data across various operational conditions [4,5,6]. Recent research has been conducted on free-running simulations using CFD programs to estimate the maneuvering performance under realistic sea conditions [7,8].
The free-running model test is conducted in an unconstrained environment, where rudder and propeller control are applied to simulate the free-running state of a ship. Notably, Woo and Hwang [9] conducted free-running model tests using a KCS model ship under three different heeling conditions (heel angles of 0°, −10°, and −20°) to investigate the changes in maneuverability associated with ship heel. They analyzed the results of turning circle and zigzag maneuvers performed under each condition. Yoon et al. [10] developed a free-running model ship to evaluate the performance of an attitude control system and established a stepwise testing procedure. Moreover, scale effects arise in model tests for estimating ship maneuvering performance because of differences in model ship sizes, leading to discrepancies between experimental results. Nevertheless, a standardized correction method for scale effects has not been established. Yun et al. [11] addressed this issue by conducting comparative analyses using three different scale ratios for the KCS hull form. The results revealed similar performance trends across different scale conditions when using auxiliary propulsion devices, confirming the feasibility of applying such methods to a maneuvering performance evaluation.
Furthermore, Lee et al. [12] investigated the resistance characteristics of four ship types (LNG carriers, tankers, container ships, and bulk carriers) under wave conditions using captive tests and free-running model tests. Although the overall trends between the two tests were similar, discrepancies were observed in the short-wave and resonance regions. The additional resistance in the free-running model test caused by waves was attributed to the differences in thrust and thrust deduction coefficients.
In CFD free-running simulations, Paramesh and Rajendran [13] applied a proportional–integral–derivative (PID) control model to simulate free-running motion under wave conditions for a KVLCC2 hull form and determined the PID control coefficients using a line-of-sight (LOS) algorithm. Similarly, Kim et al. [7] implemented a PID control model for the KCS hull form in a simulation environment and exhibited excellent straight-course stability under head and oblique wave conditions. All these studies used the STAR-CCM+ software (Ver. 17.06) to conduct the maneuvering simulations, validating the reliability of CFD-based approaches for ship maneuverability assessment.
In free-running model tests, PID control models are used predominantly for rudder and propeller speed control. According to the study by G.N. Roberts [14], PID control remains the industry standard for automatic control systems because of its ease of design and efficiency, making it widely applicable in dynamic process control. Beyond maneuvering performance evaluations, PID control also plays a crucial role in Auto-Pilot systems, with ongoing research in this area. For example, Kwon et al. [15] proposed a PID compensation-based automatic control system capable of overcoming nonlinear factors and disturbances in ship operations. In addition, Zhang et al. [16] and Tomera [17] integrated Fuzzy control, an intelligent control method, with PID control to develop a Fuzzy-PID control system, which enhances adaptability to environmental changes. The simulation results using a fuzzy self-tuning controller showed that the Fuzzy-PID control system improved the system response time while significantly reducing overshoot compared to conventional PID control.
Various experimental and simulation-based studies have been conducted to establish the free-running conditions. Nevertheless, most studies reported only the final PID control gain values without explaining the selection process. This limitation arises because of the absence of a standardized methodology for determining PID control gains, leading to gain selection that relies heavily on individual experience and the general characteristics of each PID parameter. This study aimed to establish a systematic approach for determining the PID control gain values for rudder and propeller control, which are critical for ship maneuvering applications.
This study aimed to implement free-running conditions using PID control and analyze the characteristics of PID control gain values under various operating conditions, establishing a systematic gain selection process. The ‘Simulation Operation’ function in STAR-CCM+ was used to adjust the PID control cycle and ensure stable free-running conditions and stable thrust control. The operating conditions considered in this study include wave conditions (calm conditions and wave conditions), PID period conditions, and ship speed (low speed and design speed). In addition, different scale ratio conditions were applied to the same hull form to examine the convergence characteristics of PID control gain values for the propeller and rudder and their mutual interactions.

2. Materials and Methods

2.1. Numerical Approach

2.1.1. Target Ship and Propeller

The K-Supramax, a 66 K bulk carrier designed by the Korea Research Institute of Ships & Ocean Engineering (KRISO), was selected as the target hull (Figure 1a). A Full-Spade Rudder using PID control was utilized for rudder angle control (Figure 1b). The KP1306 propeller was chosen as the propulsion system (Figure 1c). The ship has a length and beam of 192 m and 36 m, respectively. Table 1 and Table 2 list the principal specifications and geometry of the selected hull and propeller. The PID control coefficients were determined by numerical analysis based on a model ship with a scale ratio of 1:24. The experimental tests were carried out in the KRISO model test basin under identical scale and wave height conditions. The numerical analysis results were compared with the experimental data to validate the simulation and grid system.

2.1.2. Governing Equation

The Reynolds-Averaged Navier-Stokes (RANS) equations and the continuity equation were used as the governing equations to simulate three-dimensional incompressible viscous flow. This formulation, incorporating fluid viscosity, is expressed in Equations (1) and (2) [18]. The flow around the hull was assumed to be incompressible and inviscid, except at the hull surface.
u i ¯ x i ¯ = 0
u i ¯ t + u j ¯ u i ¯ x j ¯ = 1 ρ P ¯ ¯ x j ¯ + 1 ρ 2 x j ¯ ( μ u i ¯ x j ¯ ρ u i , ¯ u j , ¯ )
These equations are used to describe the three-dimensional, incompressible, and viscous flow around the ship hull. In these equations, ρ , ν , and P are the fluid density, the kinematic viscosity, and the static pressure, respectively. x i ( i = 1, 2, 3) denotes the spatial Cartesian coordinates ( x ,     y ,     z ), and u i ( u , v , w ) denotes the velocity components in these directions.

2.1.3. Numerical Schemes

For the turbulence model, the realizable k-ε model, which is used widely for propeller open water (POW) analysis and ship self-propulsion simulations, was used to analyze the flow characteristics of a ship. This model allows for effective control of the grid resolution near the wall surfaces and provides relatively accurate computational results, making it a preferred choice in ship hydrodynamic studies. The SIMPLE algorithm [19] was used to couple velocity and pressure, while the VOF (Volume of Fluid) method [20] was applied to account for free-surface interactions induced by propeller and rudder movements under various wave conditions. A second-order Implicit Unsteady Method was used for time discretization. The time step was set to ensure that the CFL number remained below one for numerical stability under each wave condition. Accordingly, a time step corresponding to 1/350 of the encounter period was applied.

2.1.4. Computation Domain and Grid System

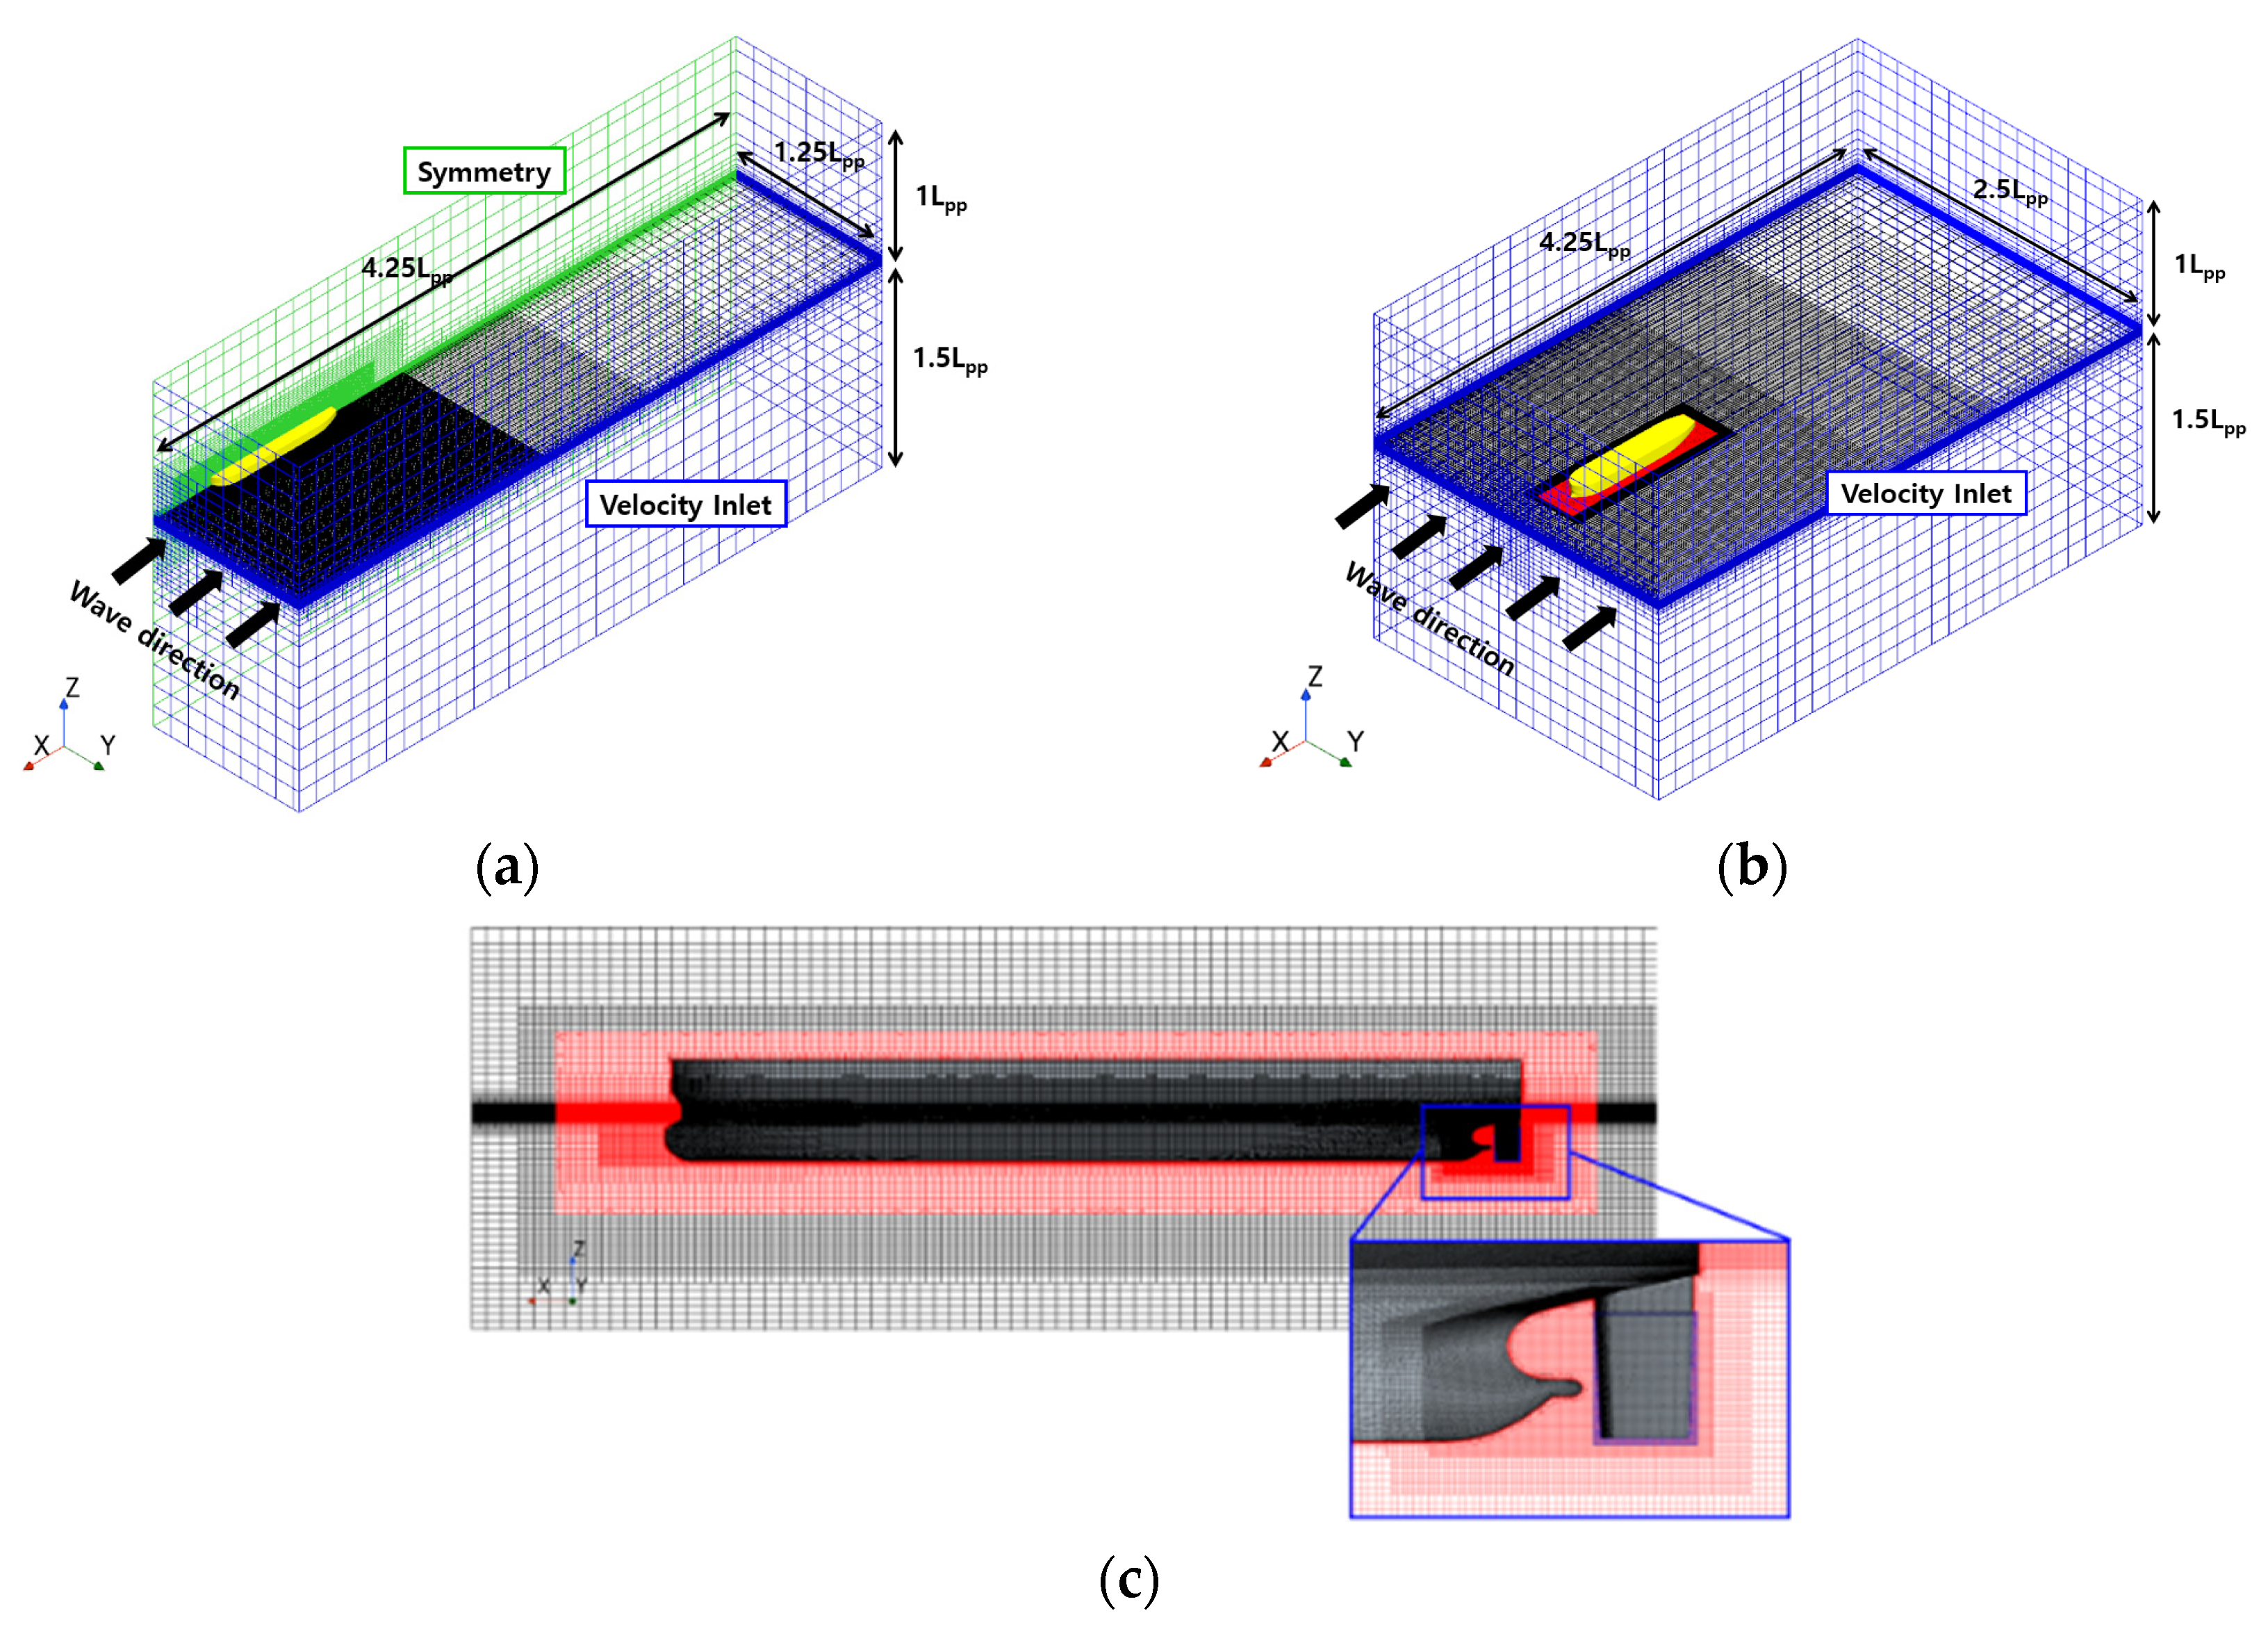
This study used two types of mesh systems for the numerical simulations. A half-domain mesh was used for resistance analysis in calm water and waves, as shown in Figure 2a. In contrast, for free-running simulations in calm water and waves, a full-domain mesh, shown in Figure 2b, was adopted to accommodate for the lateral motion of the rudder. Figure 2c presents the side grid of the computational domain used in the free-running simulations, where an overset mesh was implemented to capture the motion of the ship and rudder accurately by defining the overset domain (red region) and rudder domain (blue region).
Regarding the boundary conditions, the symmetry condition was applied to the half-domain simulations, while all other boundaries were set as the velocity inlet. The number of computational cells varied according to the analysis type. Approximately 3.7 M cells were used in the half-domain configuration for resistance analysis in calm water and regular waves. In contrast, the overset and rudder domains were refined to increase the grid resolution for free-running simulations, resulting in approximately 9.0 M cells in the full-domain setup. The free-surface mesh resolution was designed to accommodate various wave conditions, with approximately 80–120 cells per wavelength and 16–24 cells per wave height.
Figure 3 presents the grid system and boundary conditions for the POW analysis of the model propeller. The SST k-ω turbulence model was used to capture the blade surface flow characteristics accurately. The computational domain consisted of approximately 2 M cells, and the sliding mesh method (Δt: 2 deg) was applied to simulate the rotational motion of the propeller [21]. The near-wall grid resolution was refined to maintain Wall Y+ ≤ 1 and ensure the accuracy of viscous sublayer modeling.

2.1.5. Control of Rudder Angle and Propeller Revolution

For rudder control, PID control was performed by acquiring data at every time step. In the case of revolution control, PID control was conducted by collecting data at specified control intervals using the Simulation Operation feature available in the STAR-CCM+ software (Ver. 17.06) [22]. For rudder control, the set-point was defined as a heading angle of zero. The error was defined as the difference between the actual measured value and the set-point, as expressed in Equation (3). To implement proportional (P) control, Equation (3) was realized using Field Function and Monitor features. Integral (I) control was achieved by applying the Monitor Integral Report function to the previously defined rudder error value. For derivative (D) control, the Field History function within the Monitor was utilized, with the sample window set to two, thereby generating Histories of e r ( N ) and e r ( N     1 ) , which were employed in Equation (4). When using the Field History function, the Field Function with the highest number corresponds to the most recently stored state. By combining the P, I, and D control implementations, PID control was realized, and the numerical expression for rudder control thus implemented is presented in Equation (5).
e r = T a r g e t P r e s e n t
d e r d t = e r ( N ) e r ( N 1 ) Δ t
u r = K P ( e r ) + K I ( e r d t ) + K D ( d e r d t )
where T a r g e t and P r e s e n t are the target heading angle (degrees) and the current heading angle (degrees), respectively. e r is the rudder error representing the difference between the target and present heading. e r ( N ) and e r ( N 1 ) are the rudder error values calculated at each control cycle. u r is the rudder control value.
For revolution control, the set-point was defined as the condition where the difference between the total resistance and thrust is zero, as shown in Equation (6). The P, I, and D controllers were each implemented within the STAR-CCM+ software (Ver. 17.06) and, unlike the rudder control which operates at every time step, PID control was performed by utilizing the Simulation Operation feature to execute control at specified intervals. As data were extracted and control was updated at each control period, there were slight differences compared to the rudder control approach. For the implementation of the revolution control, the proportional (P) component was realized using the Expression Report and Monitor functions in the Report module. The control interval for the Monitor was managed by linking the Update Event to the SimOps Counter Monitor, which differs from the method used in rudder control. The integral (I) controller was implemented by applying the Statistics Report function to the previously defined RPS error value. For derivative (D) control, Equation (7) was entered into the Expression Report, in the same manner as for the P control. Here, e w ( N 1 ) and e w ( N ) were defined as parameters, so that their values were updated at each control interval. By integrating the P, I, and D components, PID control for revolution was realized, and the final numerical formulation used for revolution control is presented in Equation (8).
e w = T T a r g e t T P r e s e n t
d e w d t = e w ( N ) e w ( N 1 ) Δ t
u w = K P ( e w ) + K I ( e w d t ) + K D ( d e w d t )
where V T a r g e t and V P r e s e n t are the target thrust ( N and the current thrust ( N ), respectively. e w is the revolution error representing the difference between target and present thrust, and u w is the RPS control value.

2.2. Validation

2.2.1. Validation of Resistance in Calm Water

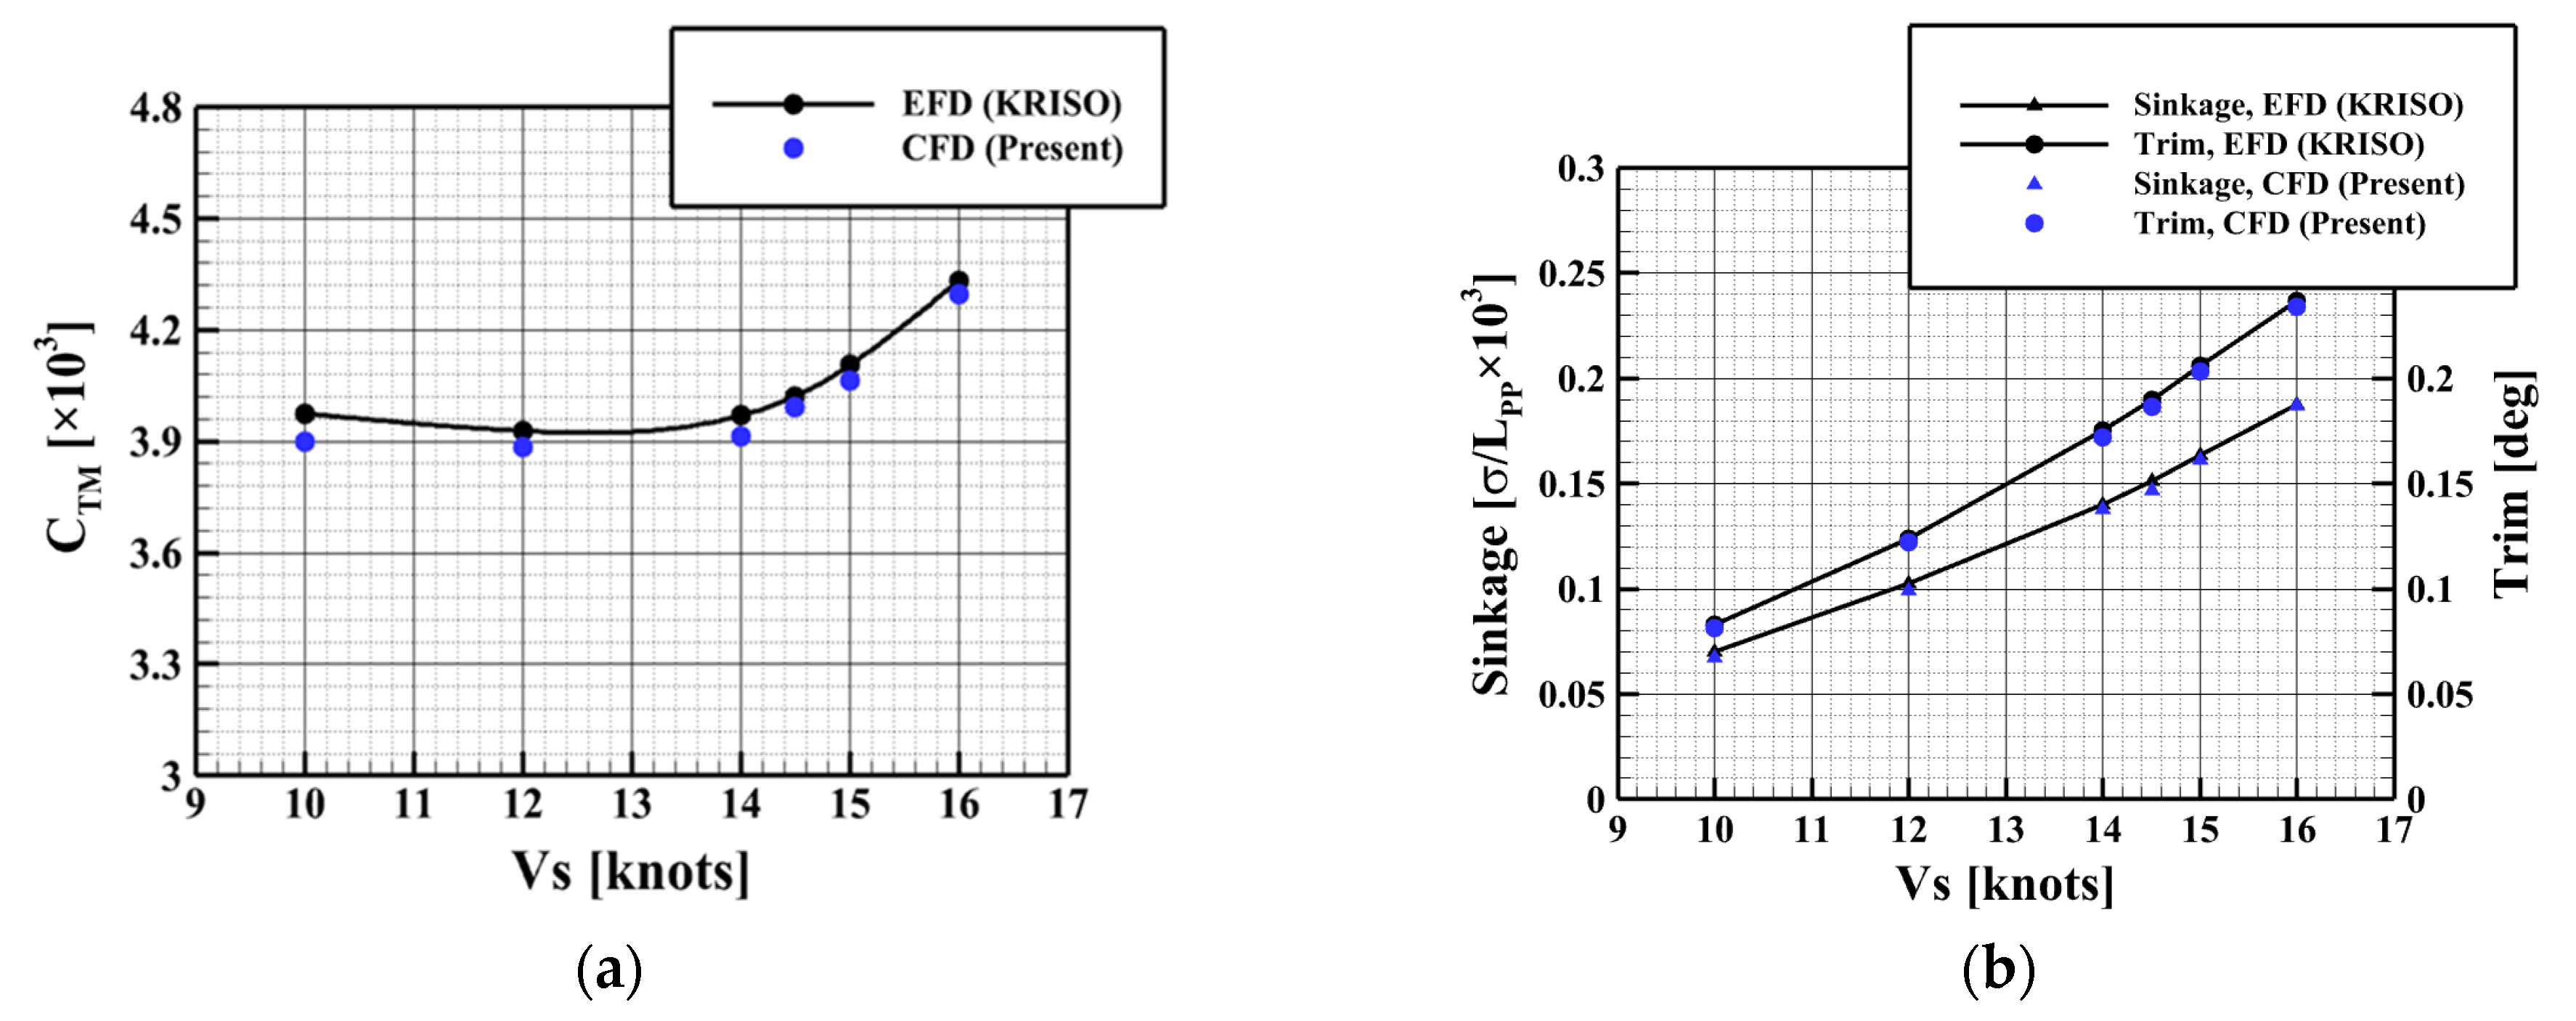
The resistance analysis was conducted under the computational conditions for the target vessel to evaluate its resistance performance. The resistance coefficient (CTM× 03), sinkage (σ/LPP× 103), and trim angle (τ) were compared with KRISO experimental data [23,24] at the same scale ratio. The comparison results are summarized in Figure 4. The total resistance coefficient, sinkage, and trim angle values showed good agreement with the experimental data over the range of ship speeds considered.

2.2.2. Validation of Propeller Open-Water Test

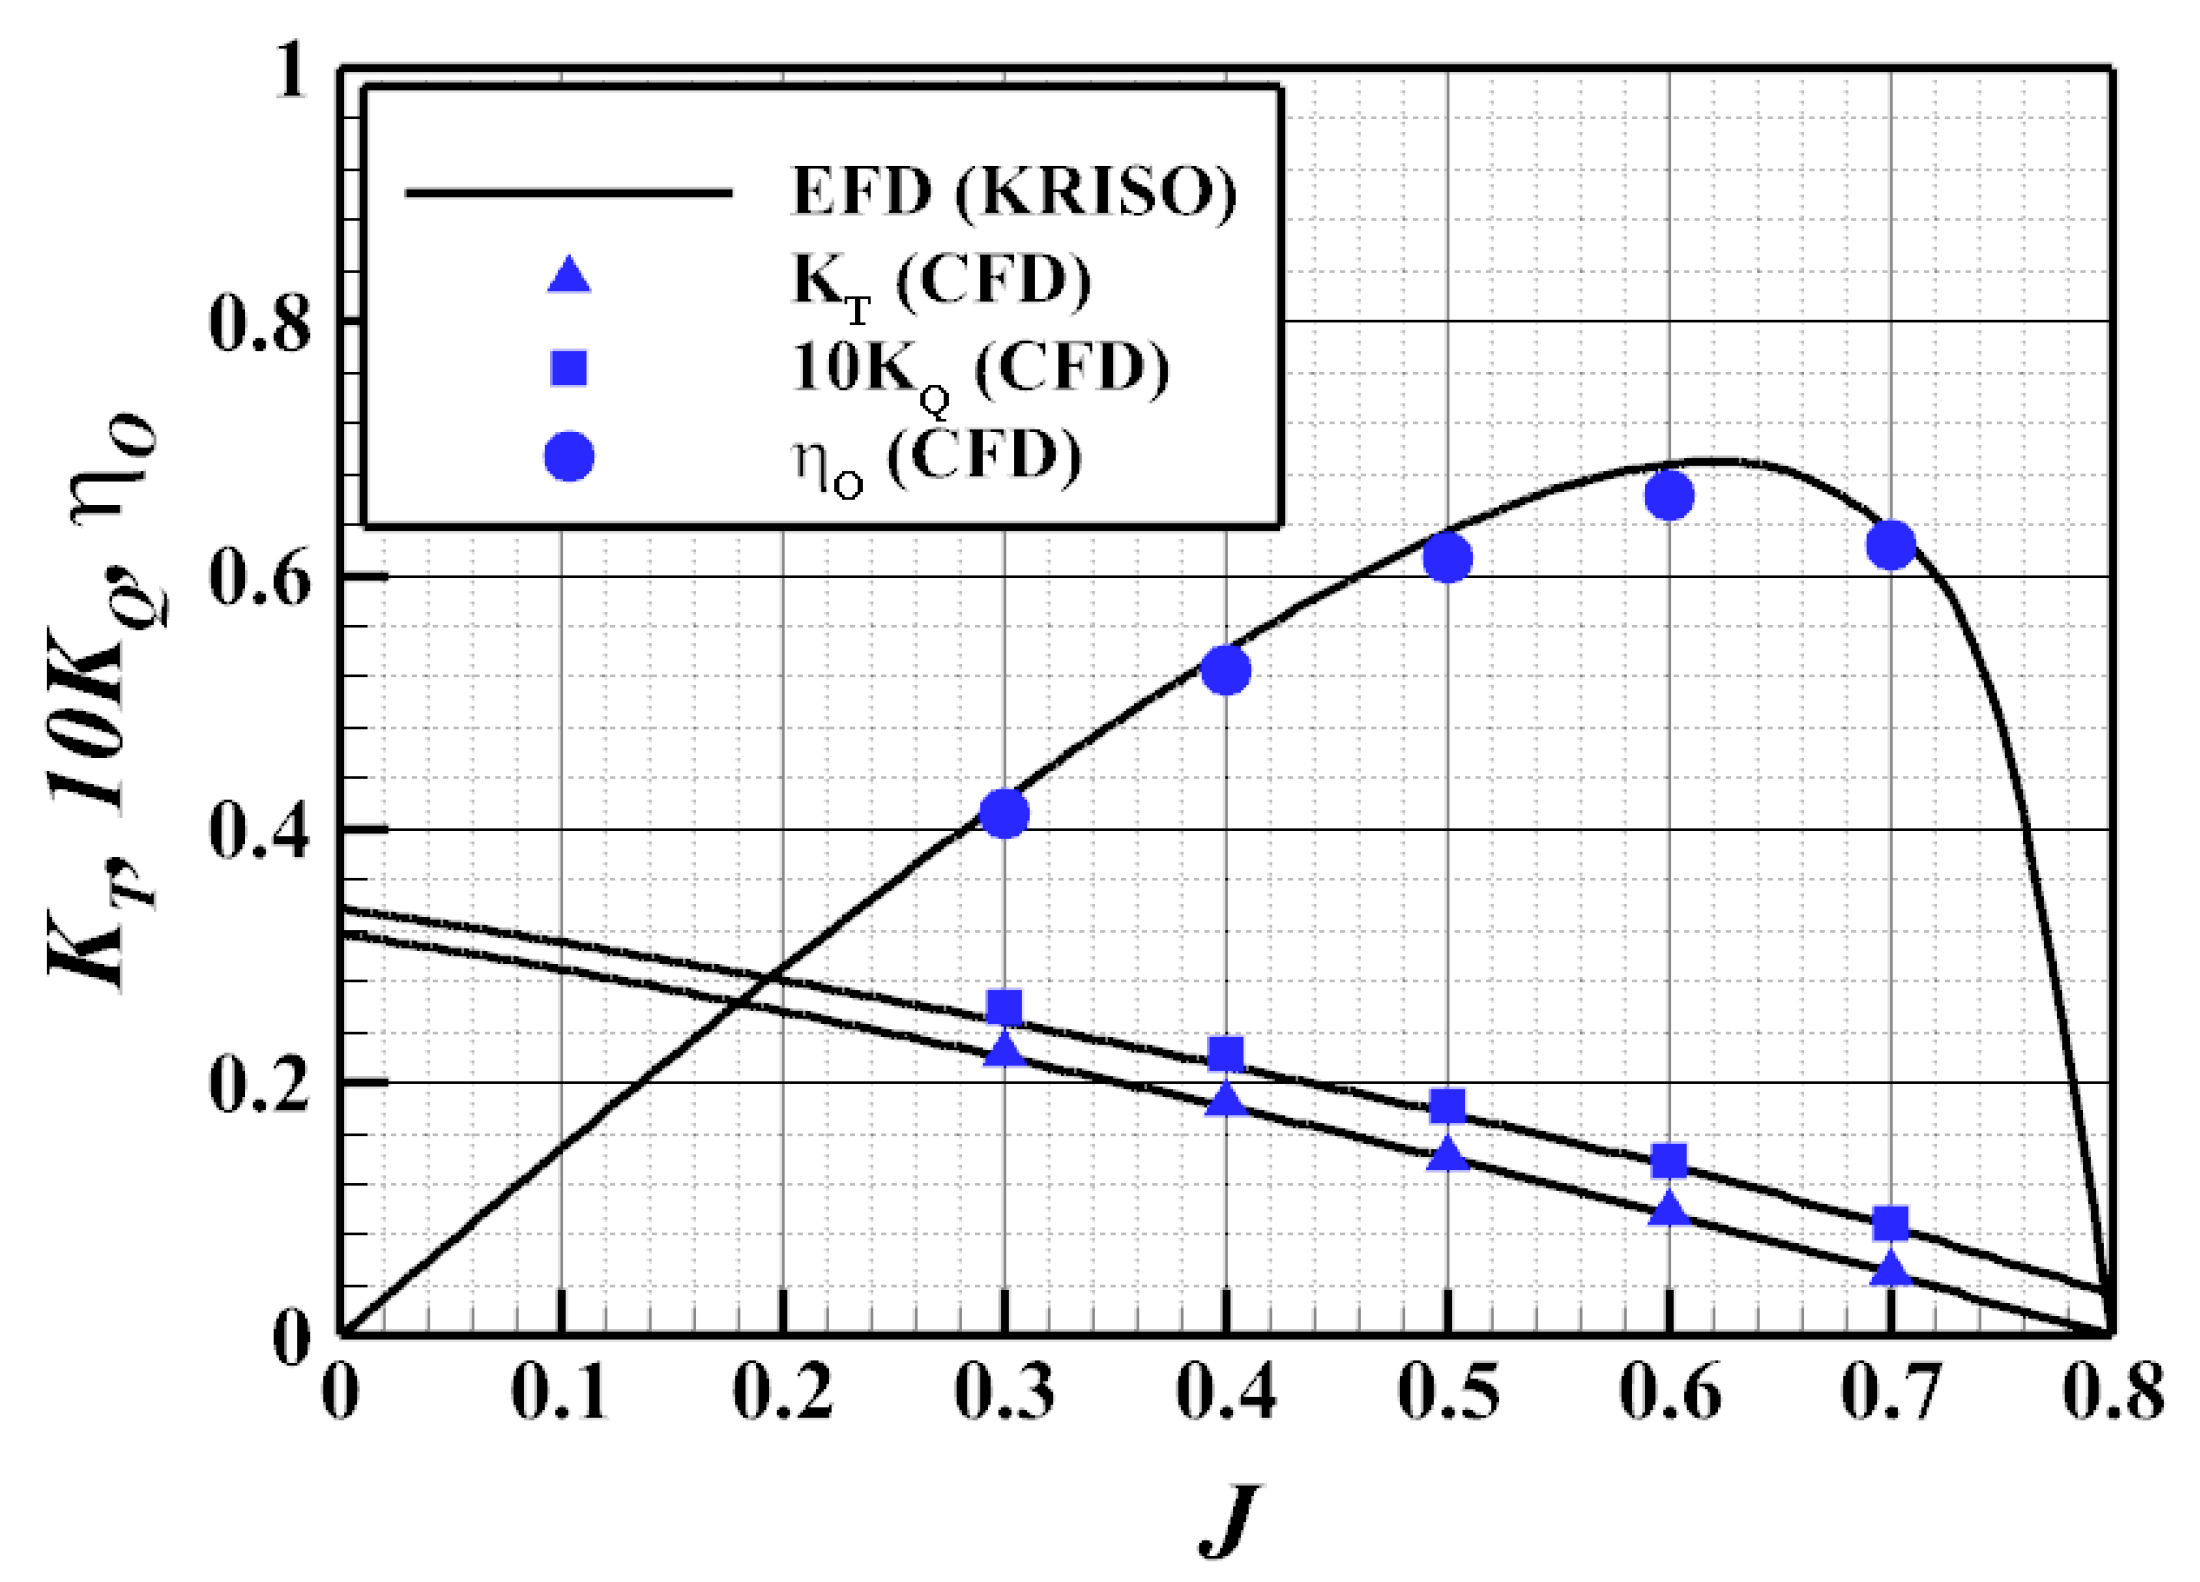
The virtual disk method was applied to perform free-running simulations using PID control. Before its implementation, a propeller open-water test was conducted to validate the method. Numerical analyses were carried out for five different advance ratios. The results were compared with the KRISO model test data [25] obtained at the same scale ratio. Figure 5 compares the numerical results and experimental data. As a result, it can be observed that across all advance ratio ranges, the results exhibited similar trends and a high level of agreement with the experimental data.

2.2.3. Validation of Self-Propulsion in Calm Water

Before conducting the free-running simulations using PID control, a self-propulsion analysis in calm water was performed using the propeller model and the virtual disk method. The Q-criterion distributions of the model propeller and the virtual disk method were compared, as shown in Figure 6. The propeller shape was not explicitly modeled when applying the virtual disk method, as illustrated in Figure 6b. Instead, the method generated equivalent thrust and torque based on the inflow velocity, forming a circular vortex core like a physical propeller. The self-propulsion performance in calm water was validated by comparing the numerically obtained self-propulsion factors with the KRISO model test data [23], which was conducted at the same scale ratio. Table 3 lists the comparison results. The self-propulsion factors were estimated using the ITTC 1978 method [26]. The virtual disk model showed relatively higher accuracy than the model propeller approach. This result was attributed to the model propeller method requiring finer grid resolution and smaller time steps, leading to higher error rates under identical simulation conditions. Nevertheless, the overall error remained within approximately 5% for both approaches, confirming the validity of both methods for the self-propulsion analysis.

2.2.4. Validation of Added Resistance in Regular Waves

The resistance required in waves must be validated before the simulations under wave conditions during free-running tests. Table 4 lists the regular wave conditions used for the added resistance analysis. The target wave height was set to H / L P P =   0.008 . On the other hand, in cases where the wave steepness became excessive, such as for short waves with λ / L P P = 0.2 or when wavelengths exceeded the ship length ( λ / L P P >   1 ) and posed a risk of deck immersion, the wave height was reduced to H / L P P = 0.00667 for safety and stability in the simulations.
Nineteen cases were analyzed, consisting of 14 two-degree-of-freedom (2-DOF) and 5 six-degree-of-freedom (6-DOF) simulations. The added resistance in regular waves was calculated at the design speed of 14.5 knots (Fr = 0.172). Figure 7 presents the results adopted from a previous study [24], in which the added resistance coefficient and motion response were analyzed and compared with experimental data and CFD results reported in other related studies [12,27].
The formula used to calculate the added resistance coefficient is expressed as Equation (9), while Equations (10) and (11) were used to obtain the heave and pitch motion coefficients, respectively. In these equations, R T ¯ , R c ω , ξ 3 , A, and k denote the time-averaged added resistance, calm-water resistance, amplitudes of heave and pitch motions, wave amplitude, and wave number, respectively.
The trend of the added resistance results in regular waves showed good agreement with the experimental and numerical data from other institutions, validating the reliability of the wave condition simulations.
R a ω = R T ¯ R c ω
ξ 3 = ξ 3 A
ξ 5 = ξ 5 k A

3. Results and Discussion

3.1. Derivation of PID Control Coefficients Under Standard Condition

The wave characteristics were incorporated, and the time required to determine control coefficients was reduced using the Ziegler–Nichols method [28] to derive the PID control coefficients. The Ziegler–Nichols method gradually increases the proportional gain until the system reaches a critical state of sustained oscillations. At this point, the gain value and the oscillation period are measured. Using the predetermined Ziegler–Nichols tuning table, the PID parameters K P , T i , and T d are then calculated. This approach allows for relatively simple determination of initial tuning values. In other words, a few preliminary tests on the actual control system provide data from which the PID coefficients can be computed via straightforward formulas. The standard form of the PID controller is expressed as Equation (12). Here, C ( s ) denotes the transfer function of the PID controller in the Laplace domain, where s is the Laplace variable.
C ( s ) = K p ( 1 + 1 T i s + T d s )
where K P is the proportional gain (dimensionless), and T i and T d are the integral and derivative time constants, respectively, both having the dimension of time [s].
The Ziegler–Nichols method consists of two approaches. The first approach uses the step response curve and only applies to stable systems without integrators and with non-complex dominant poles. The second approach can be applied to some systems having a pole at the origin or unstable behavior, but it does not guarantee success for all unstable systems. Therefore, careful consideration and system analysis are necessary before applying this method. This study adopted the second approach under validated and suitable conditions. Table 5 lists the PID control coefficients determined using the parameters.
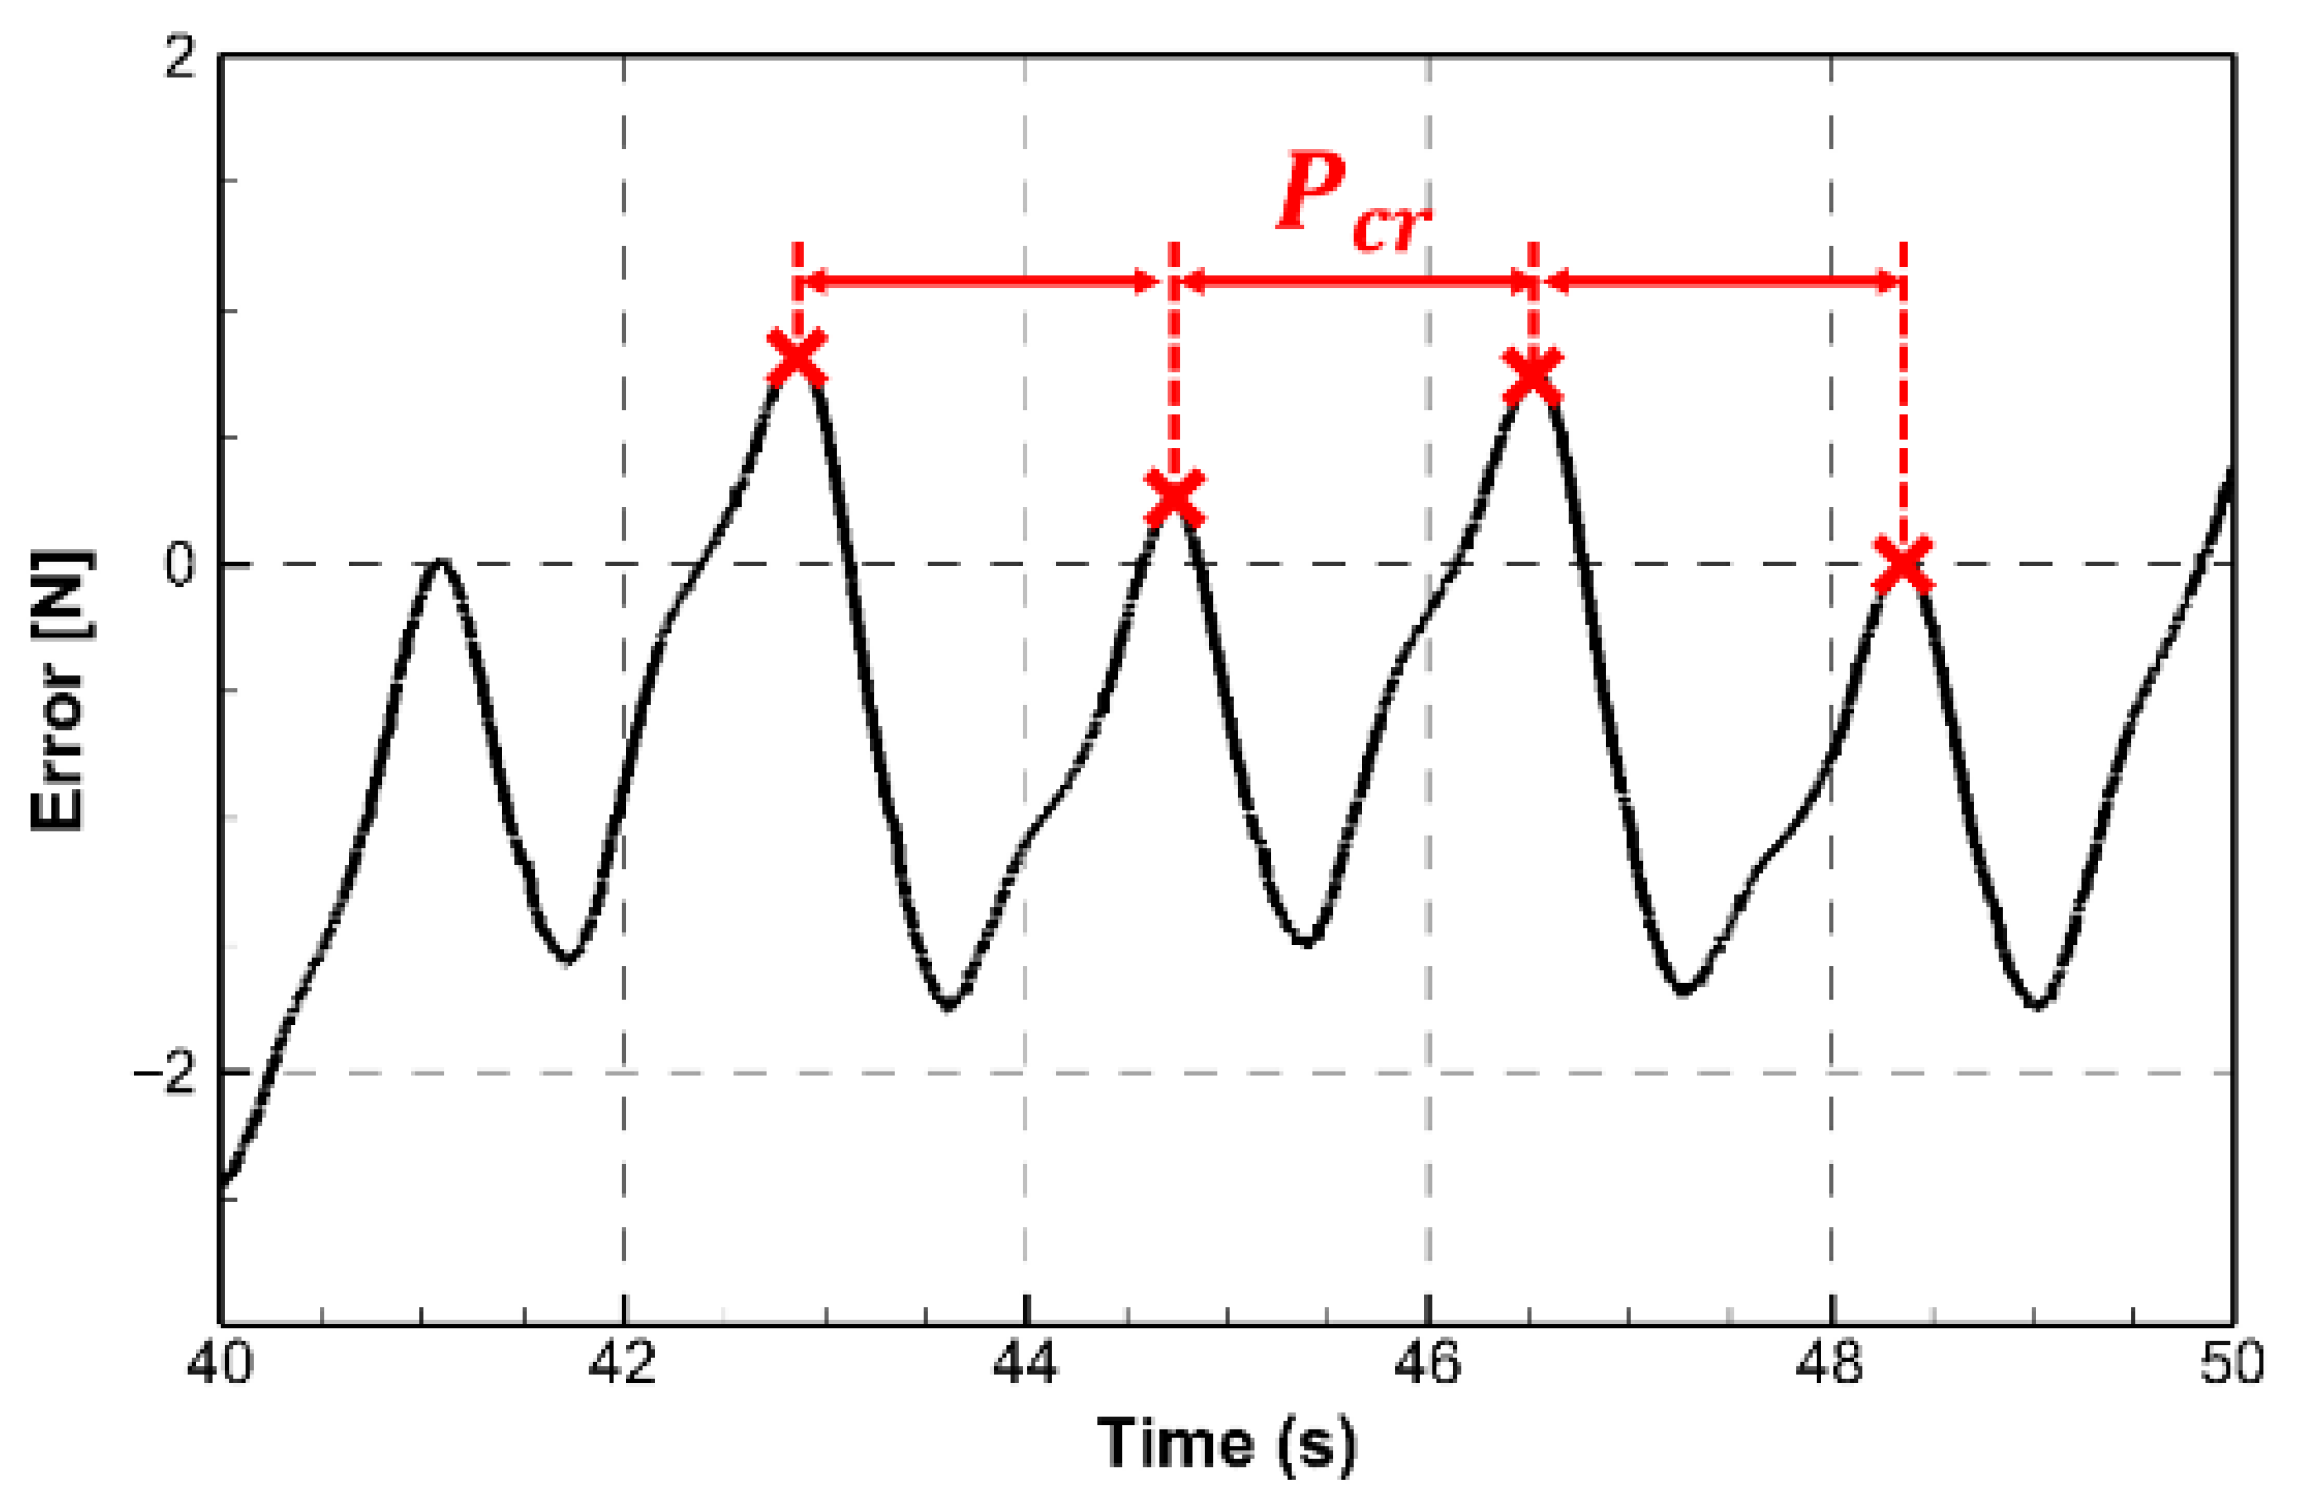
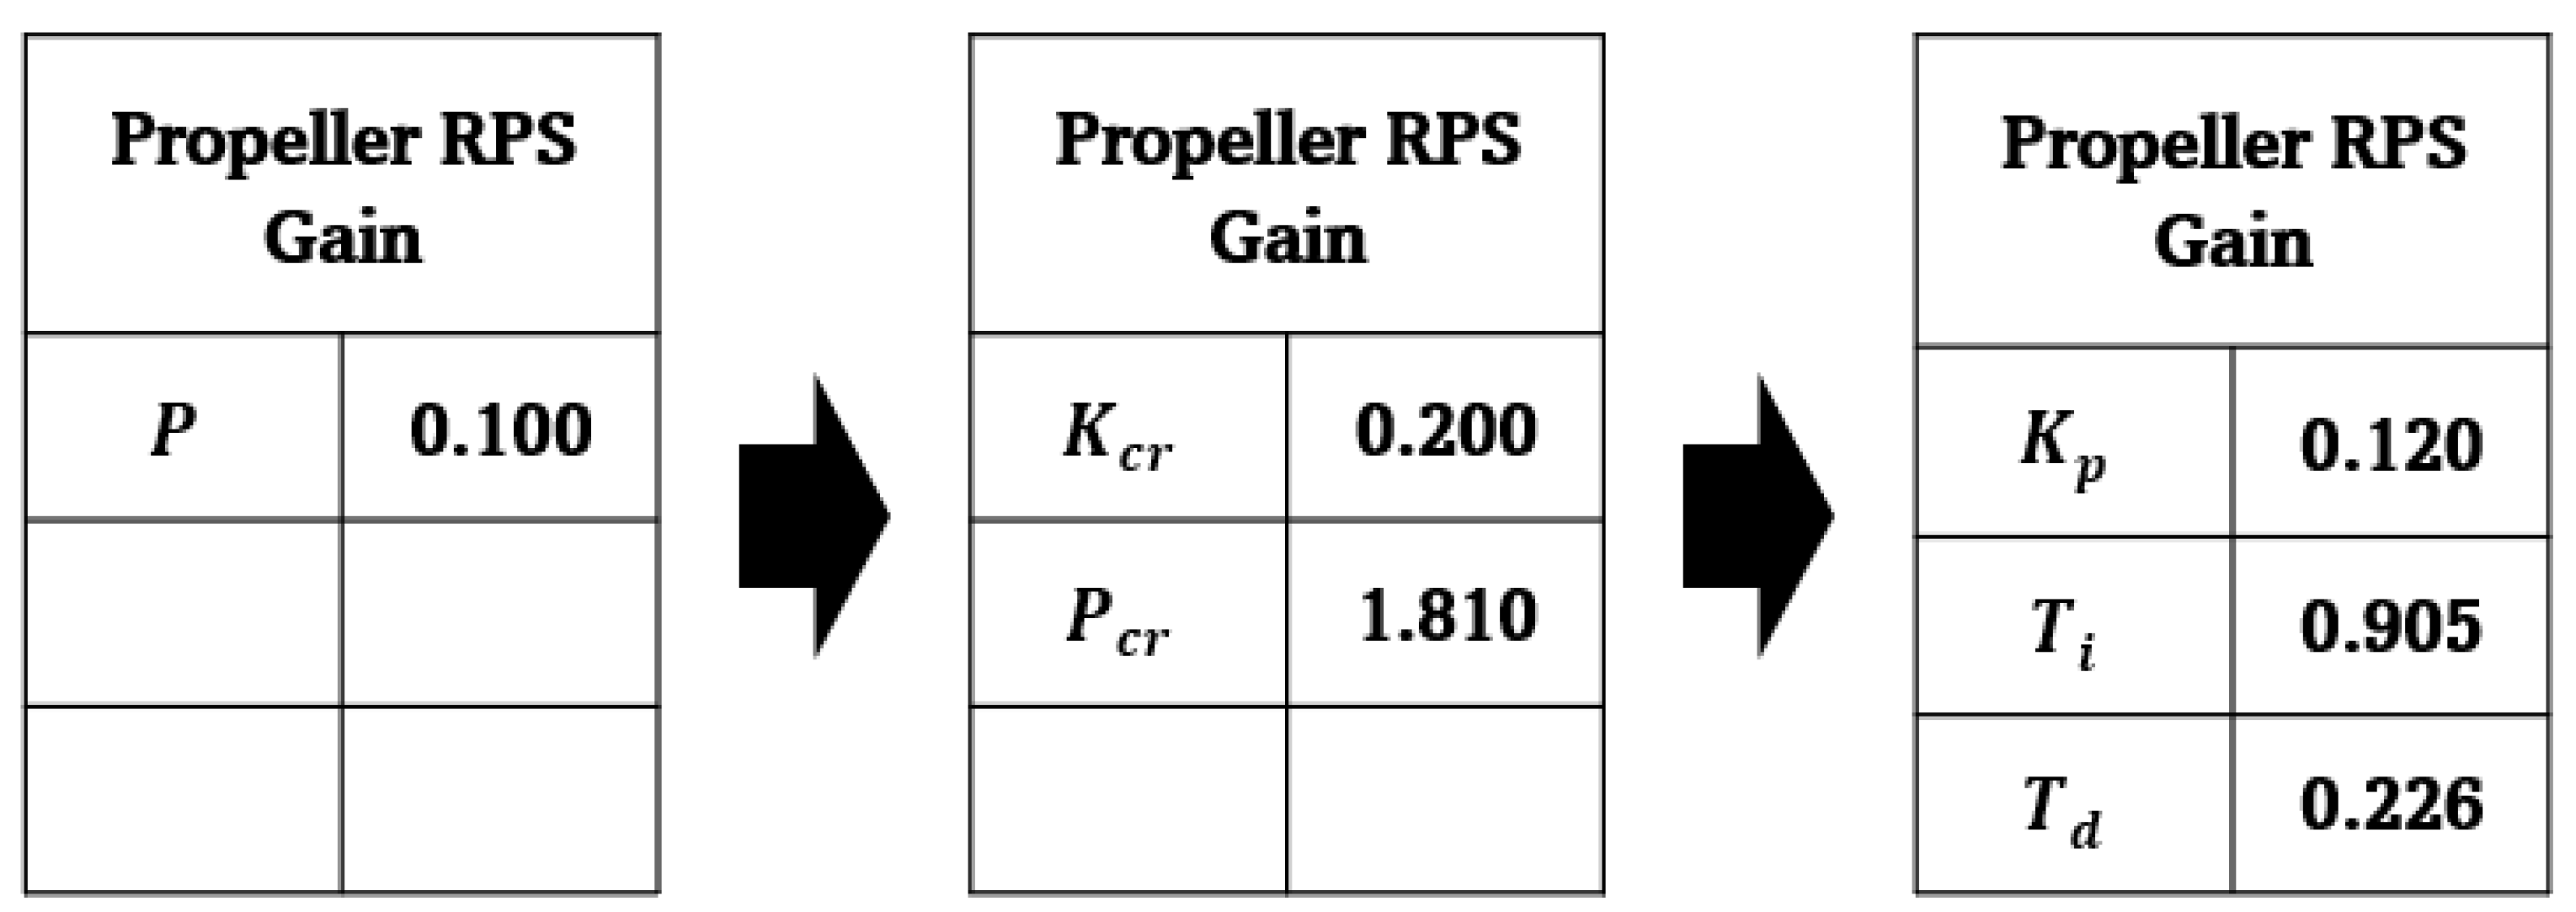
One of the key advantages of this form is that the PID coefficients can be determined using a simple formula based on the results of a few preliminary tests conducted on the actual control system. The procedure for obtaining these coefficients follows the three-step process illustrated in Figure 8. It is particularly useful when the critical gain ( K c r ) induces sustained oscillations upon applying P control, allowing for the determination of the critical period ( P c r ).
The standard condition for determining the PID control coefficients was set to λ/LPP = 1.25 and H/λ = 0.008, corresponding to a wave condition that induces sustained oscillations. The rudder angle control coefficients were set to K P = 0.02, T i = 1.00, and T d = 5.00. For the revolution rate control, the previously used PID parameters led to divergence. Therefore, new values were determined to ensure stable self-propulsion conditions. The error for revolution control was defined as “Error = Total Resistance−Thrust.” A steady-state condition was defined when the error remained within ±5%.
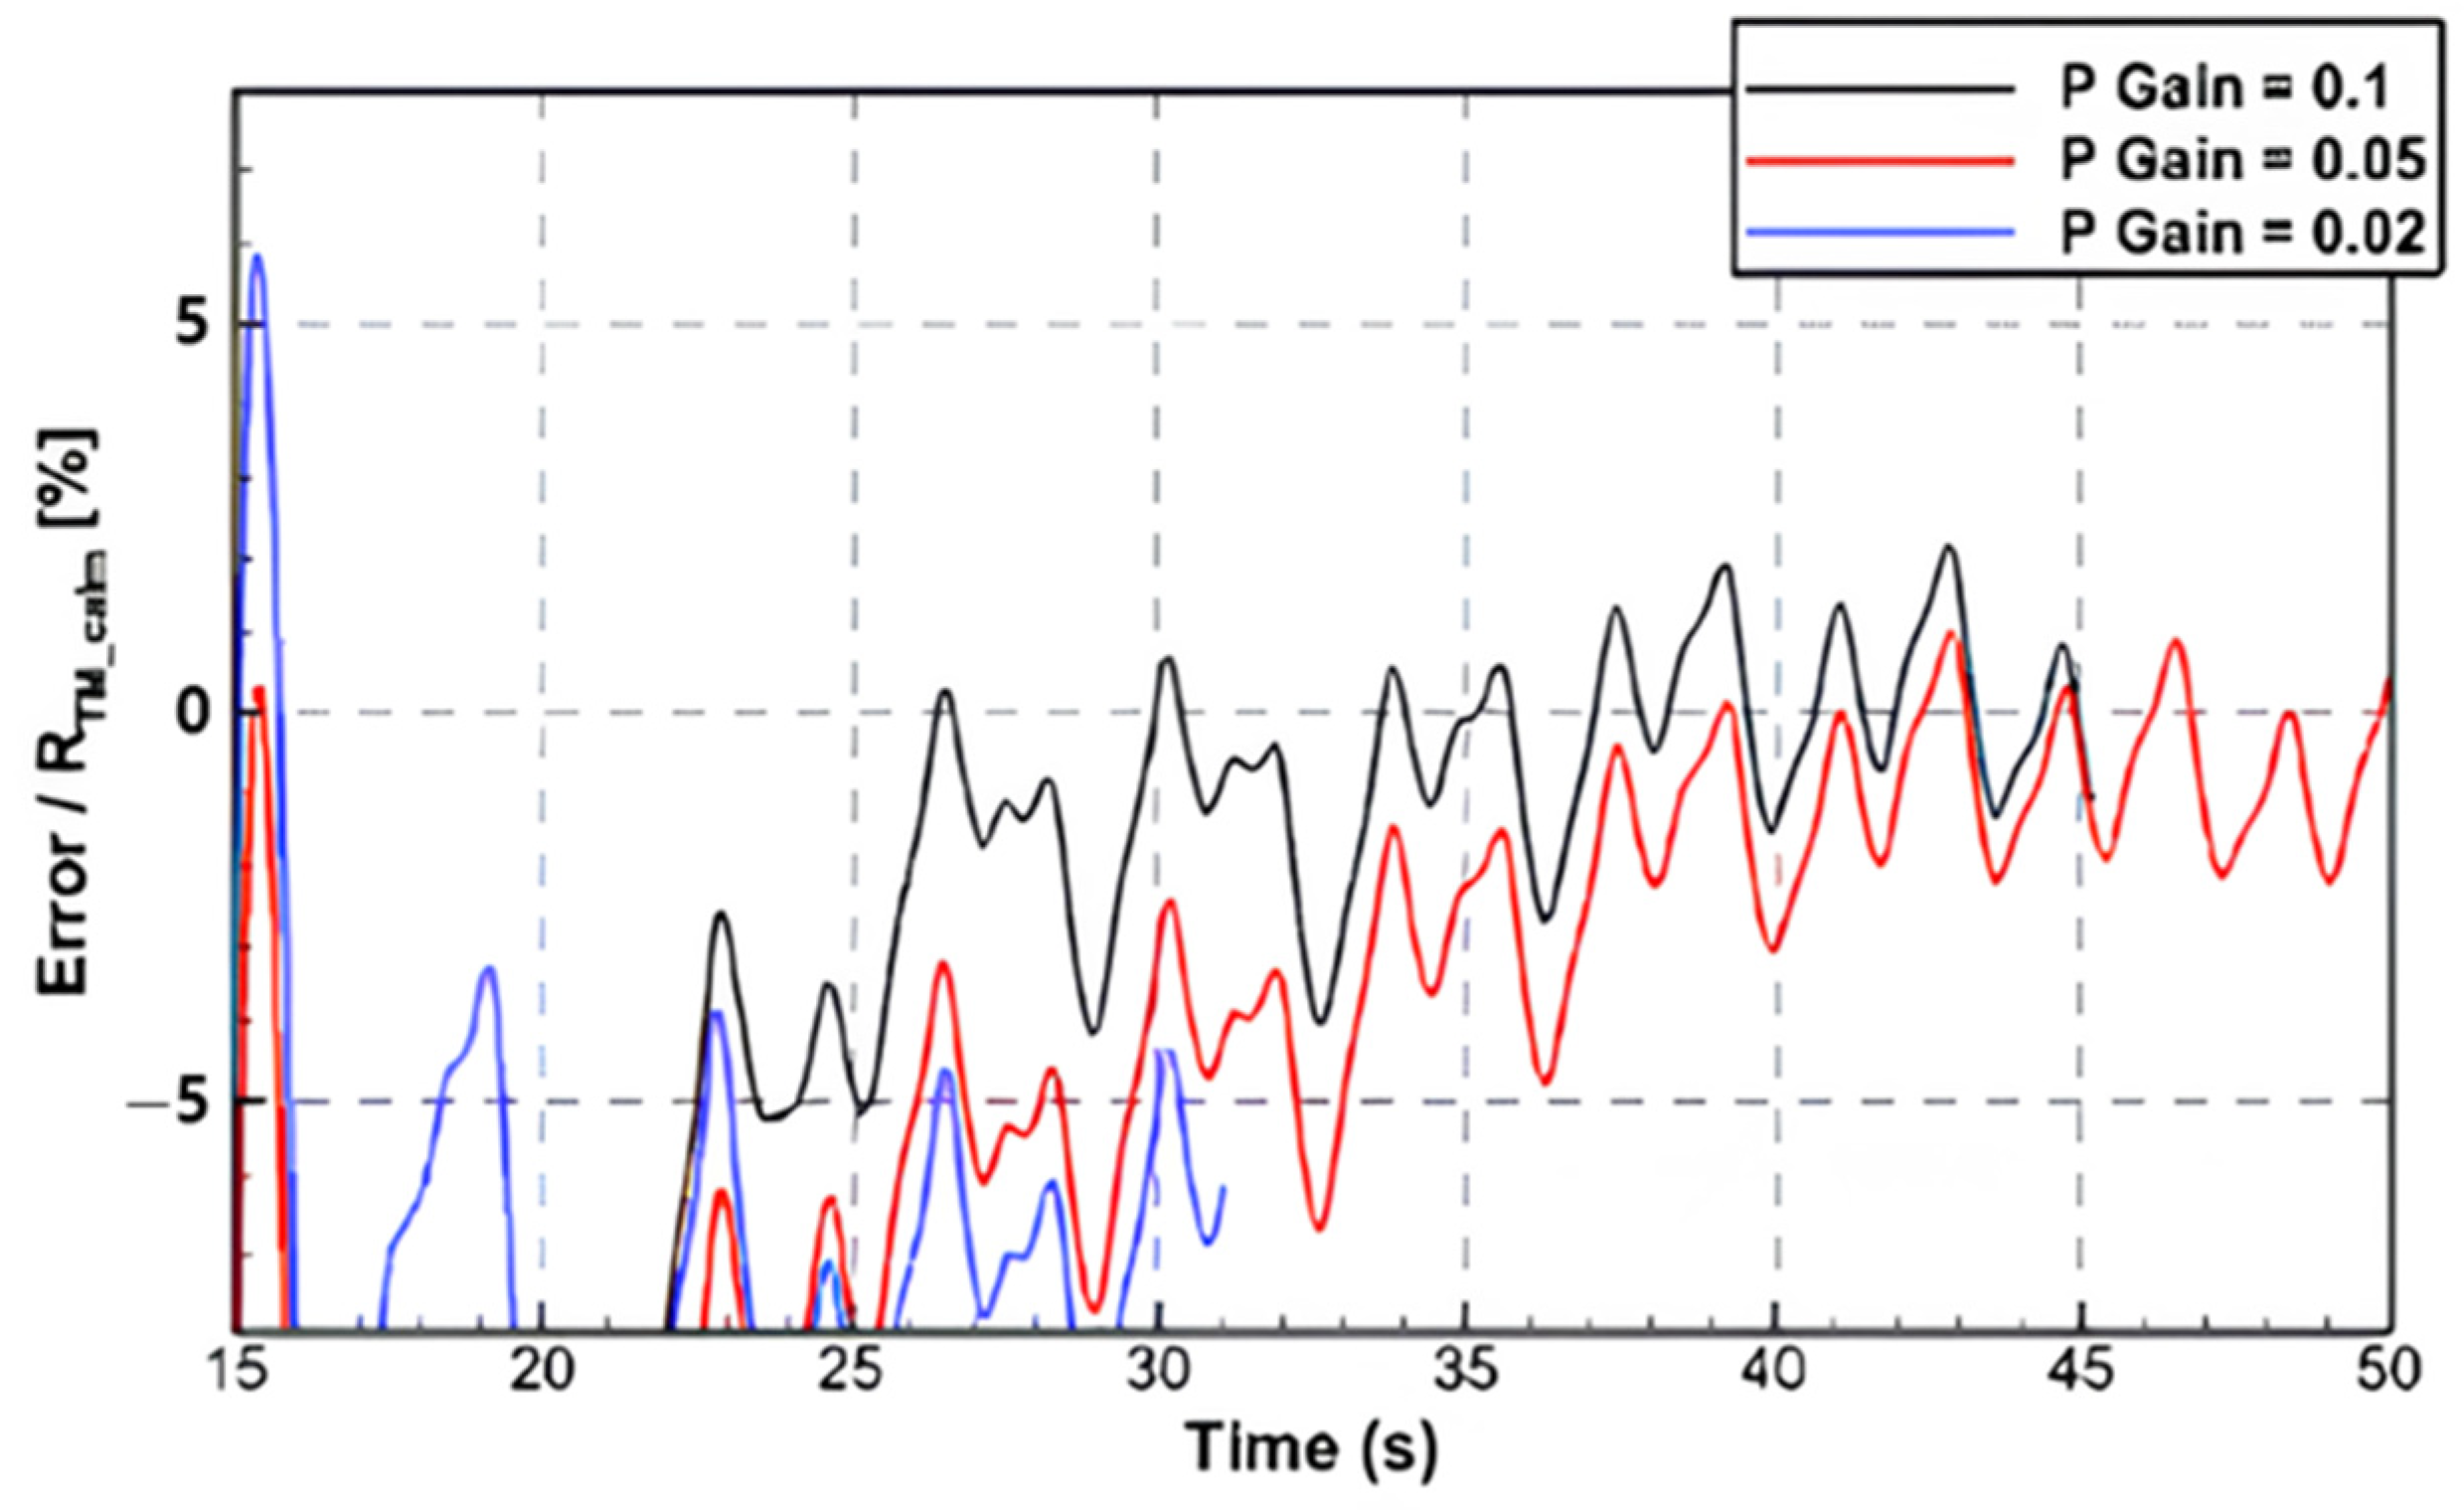
The control coefficients were derived using the Ziegler–Nichols method by setting the initial P gain values to 0.1, 0.05, and 0.02 and analyzing the variations in error values for each case. The critical period ( P c r ) was determined by averaging the five oscillation cycles of the sustained error response, as shown in Figure 9. The critical gain ( K c r ) was calculated using the formula provided in Table 5 based on the selected P gain values. For example, Figure 10 presents the procedure for deriving K P , T i , and T d using the Ziegler–Nichols method when P gain = 0.1.
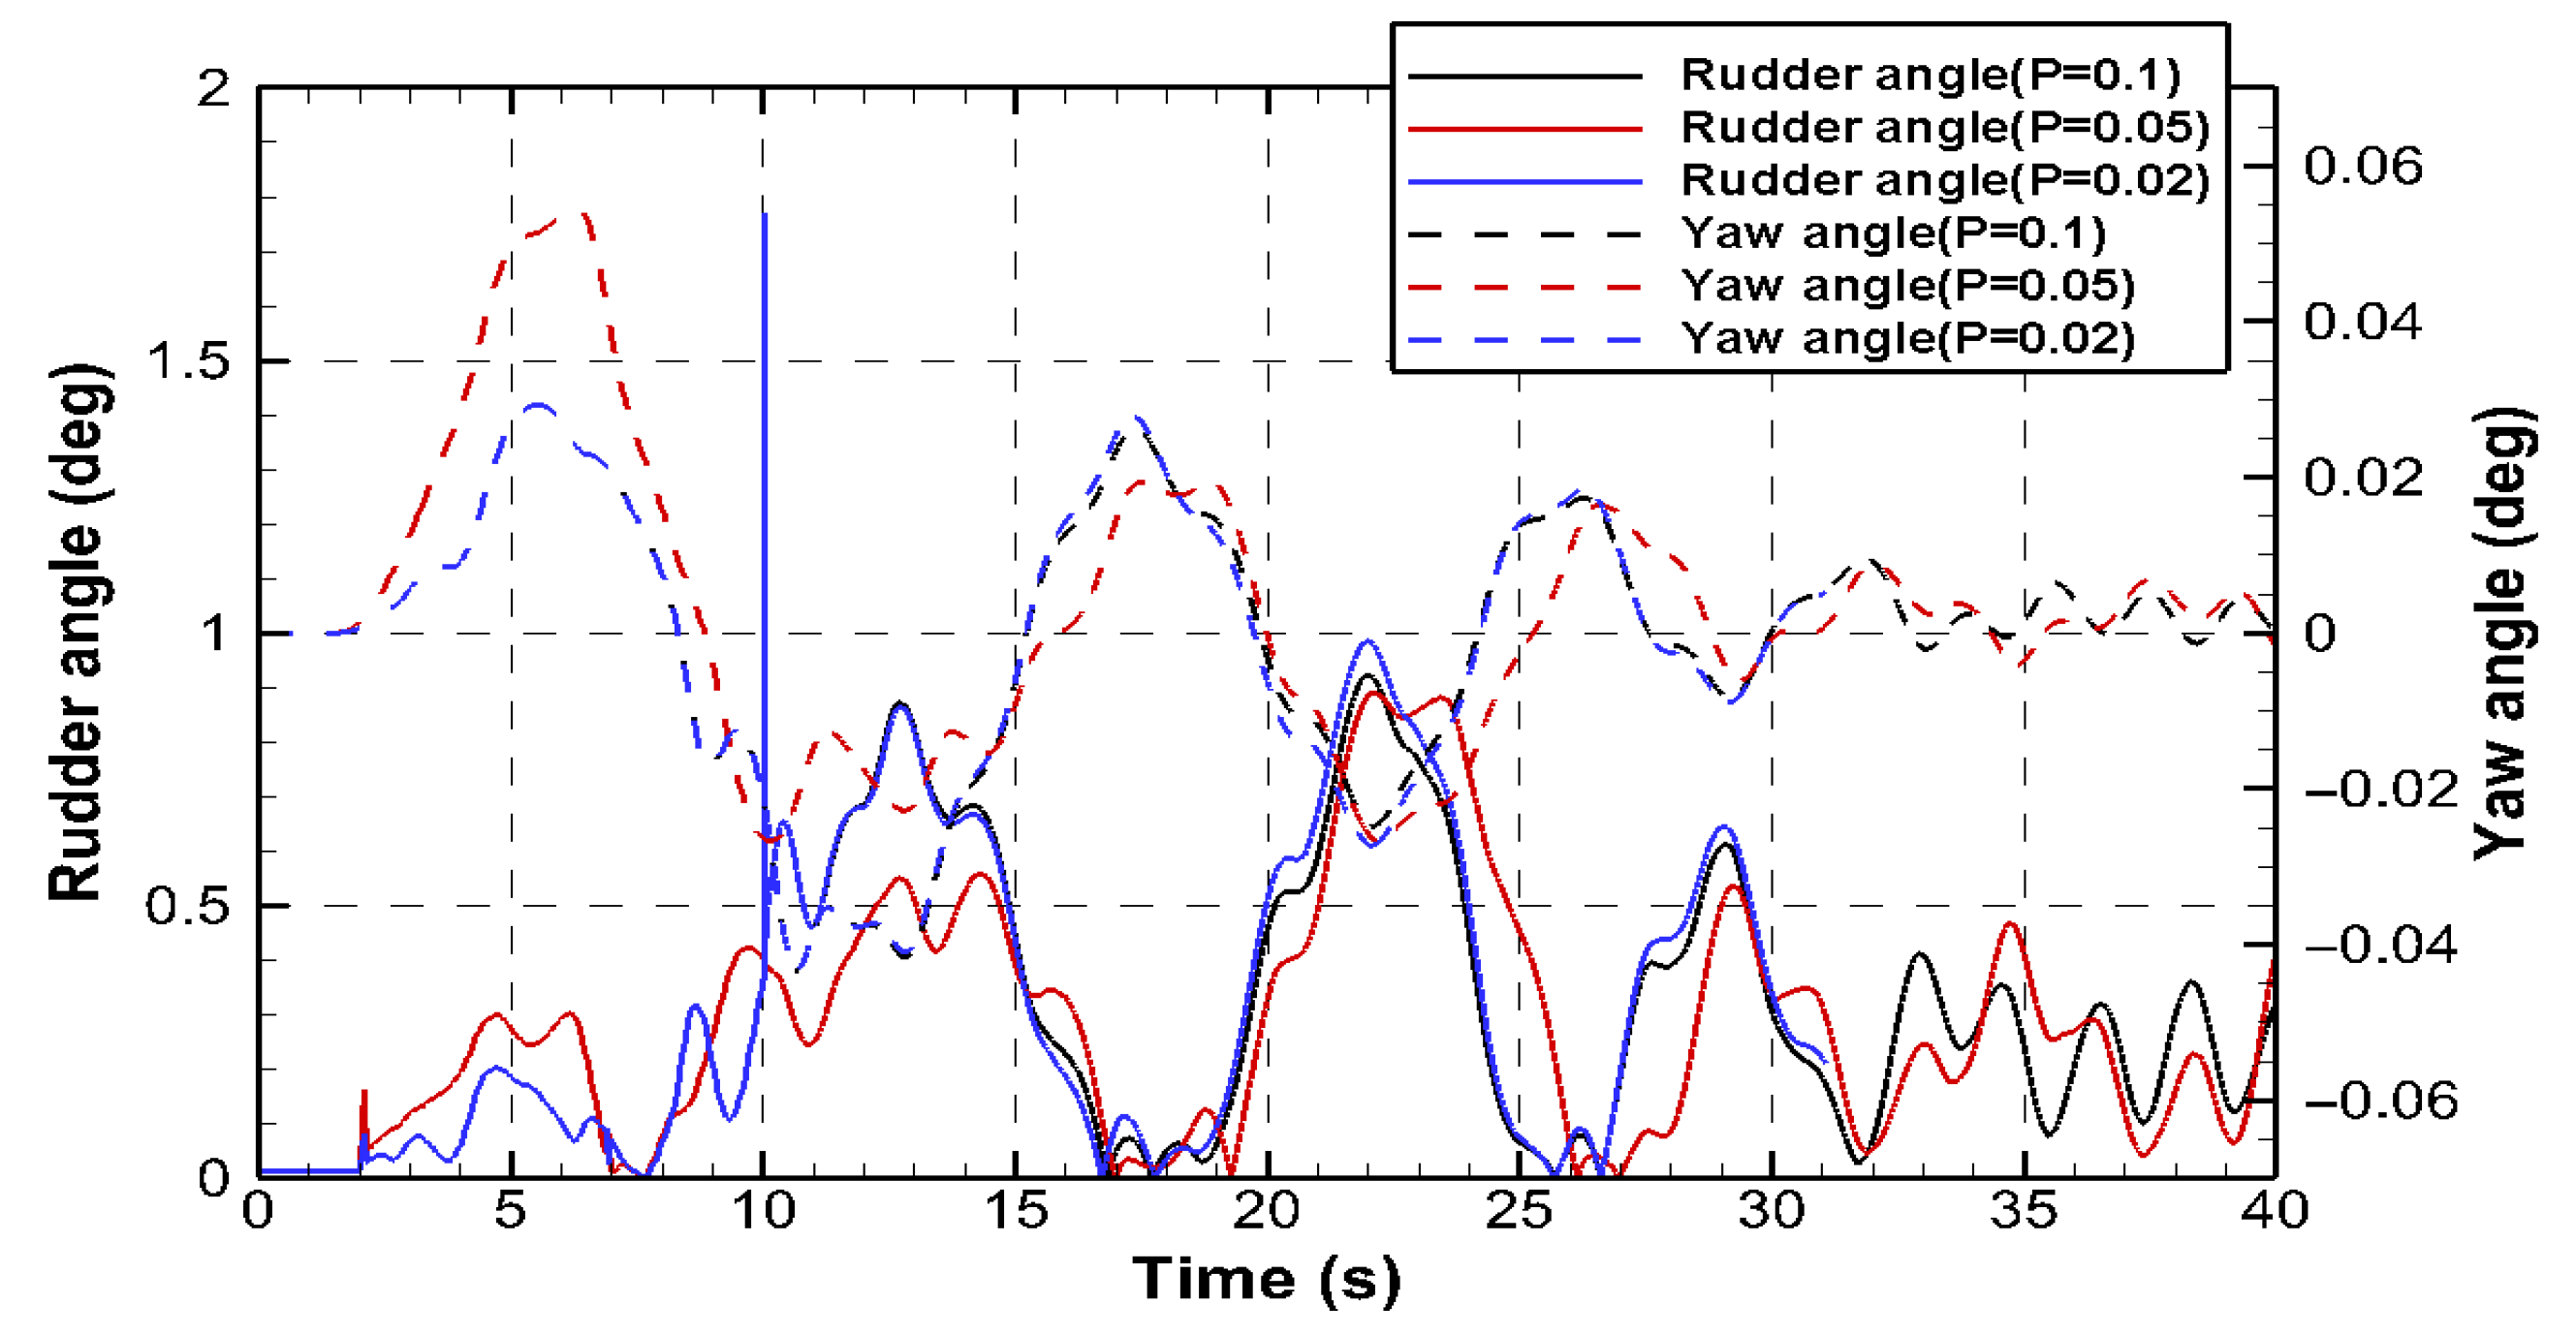
Figure 11 shows the time series of error variations for the three different P gain values. Among them, the P gain = 0.05 case exhibited a narrower oscillation range and faster convergence to the steady state (error = 0) than the other cases. The critical gain ( K c r ) and critical period ( P c r ) obtained for this case were 0.100 and 1.807, respectively. For rudder angle control, the rudder and yaw angle successfully converged to zero under all conditions when only the P gain value for revolution control was varied while keeping the rudder control coefficients constant, as shown in Figure 12. Based on these findings, P gain = 0.05 was selected as the optimal value for computing K P , T i , and T d , as listed in Table 6.
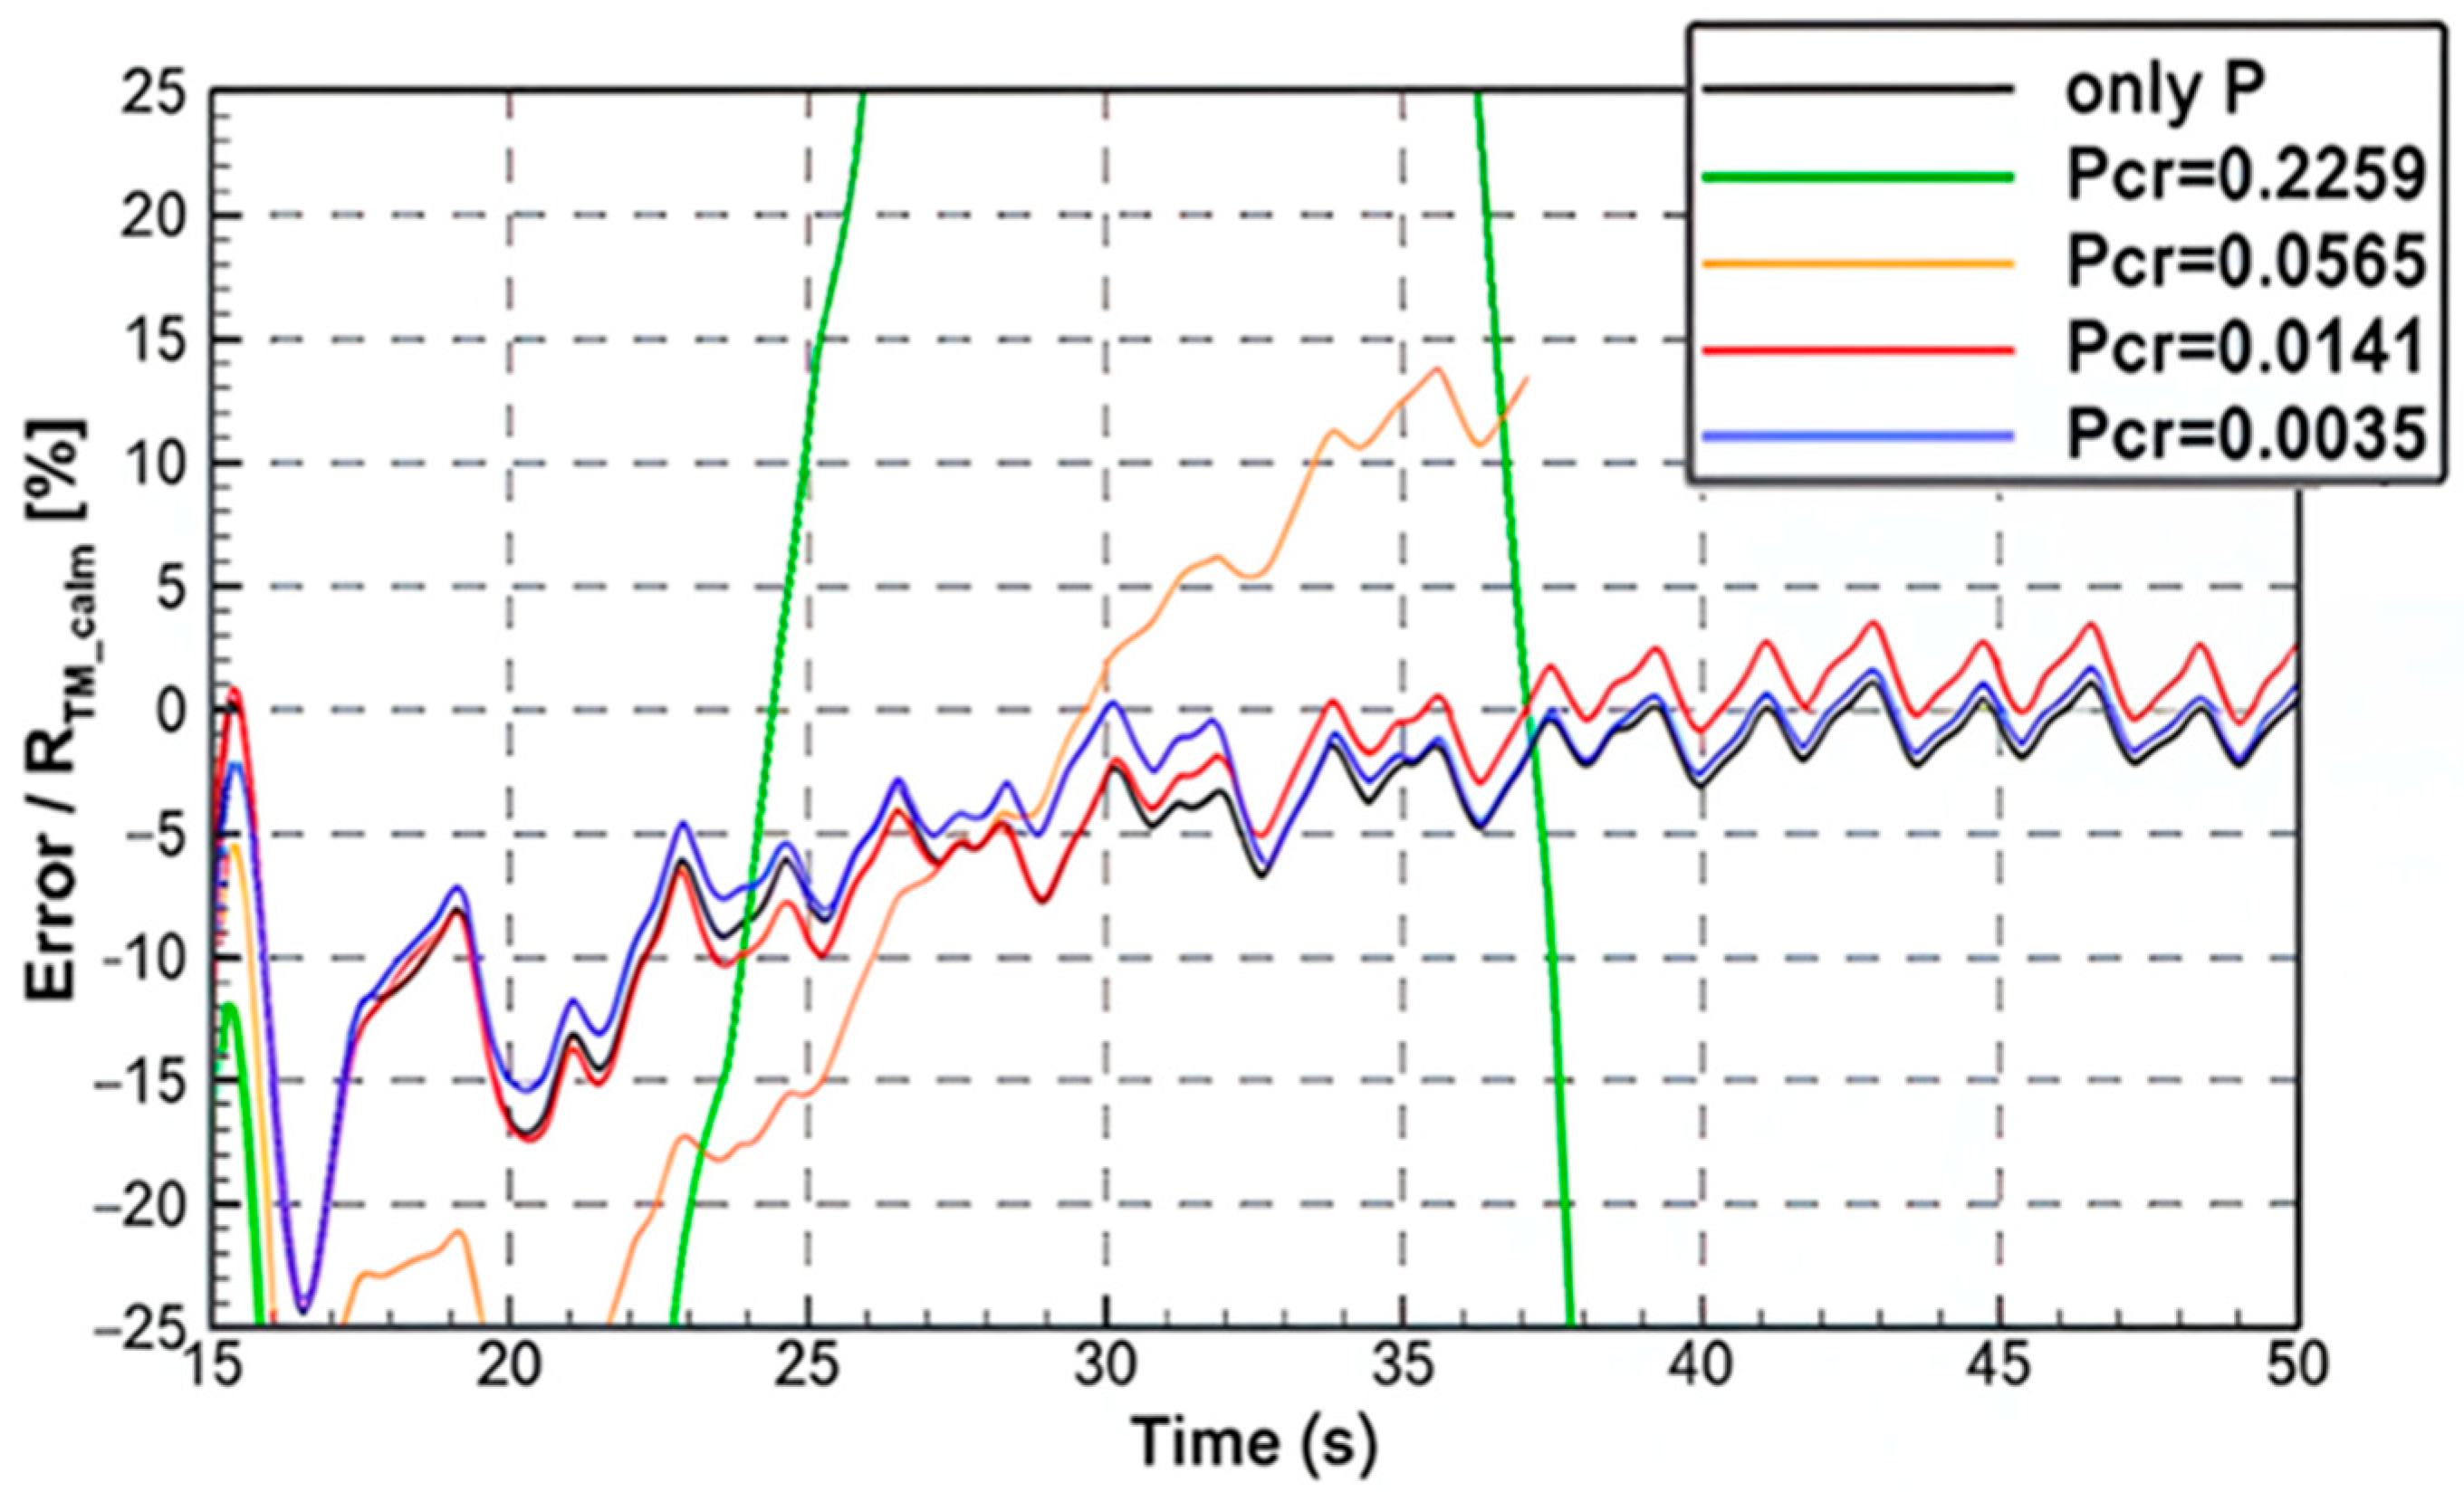
Subsequently, numerical simulations were conducted using the PID control coefficients derived from the initially selected P c r _ i = 1.807. On the other hand, applying these initially determined coefficients resulted in the divergence of the solution. Considering that significant variations in error values can be mitigated by adjusting the critical period ( P c r ), the second step involved analyzing the effects of P c r variations on system behavior. Figure 13 shows the error variations corresponding to different P c r values for P gain = 0.05. The P c r value was progressively reduced by a factor of four, testing values of 0.2259, 0.0565, 0.0141, and 0.0035 while observing the corresponding changes. As a result, the system exhibited the fastest convergence when P c r = 0.0141, which was consequently selected as the final critical period ( P c r _ f ). The third step involved a comparative analysis of T d variations, but preliminary evaluations indicated that the effect of T d variations was negligible. As a result, no further adjustments were applied. Table 7 lists the final PID control coefficients for rudder and revolution control. The final PID control gains listed in Table 7 are applied in the control laws given by Equations (13)–(16). Specifically, the rudder and propeller PID gains ( K P , T i , T d ) are substituted into the corresponding terms of the control equations for propeller revolution and rudder angle, as described in Section 3.5.

3.2. Wave Condition

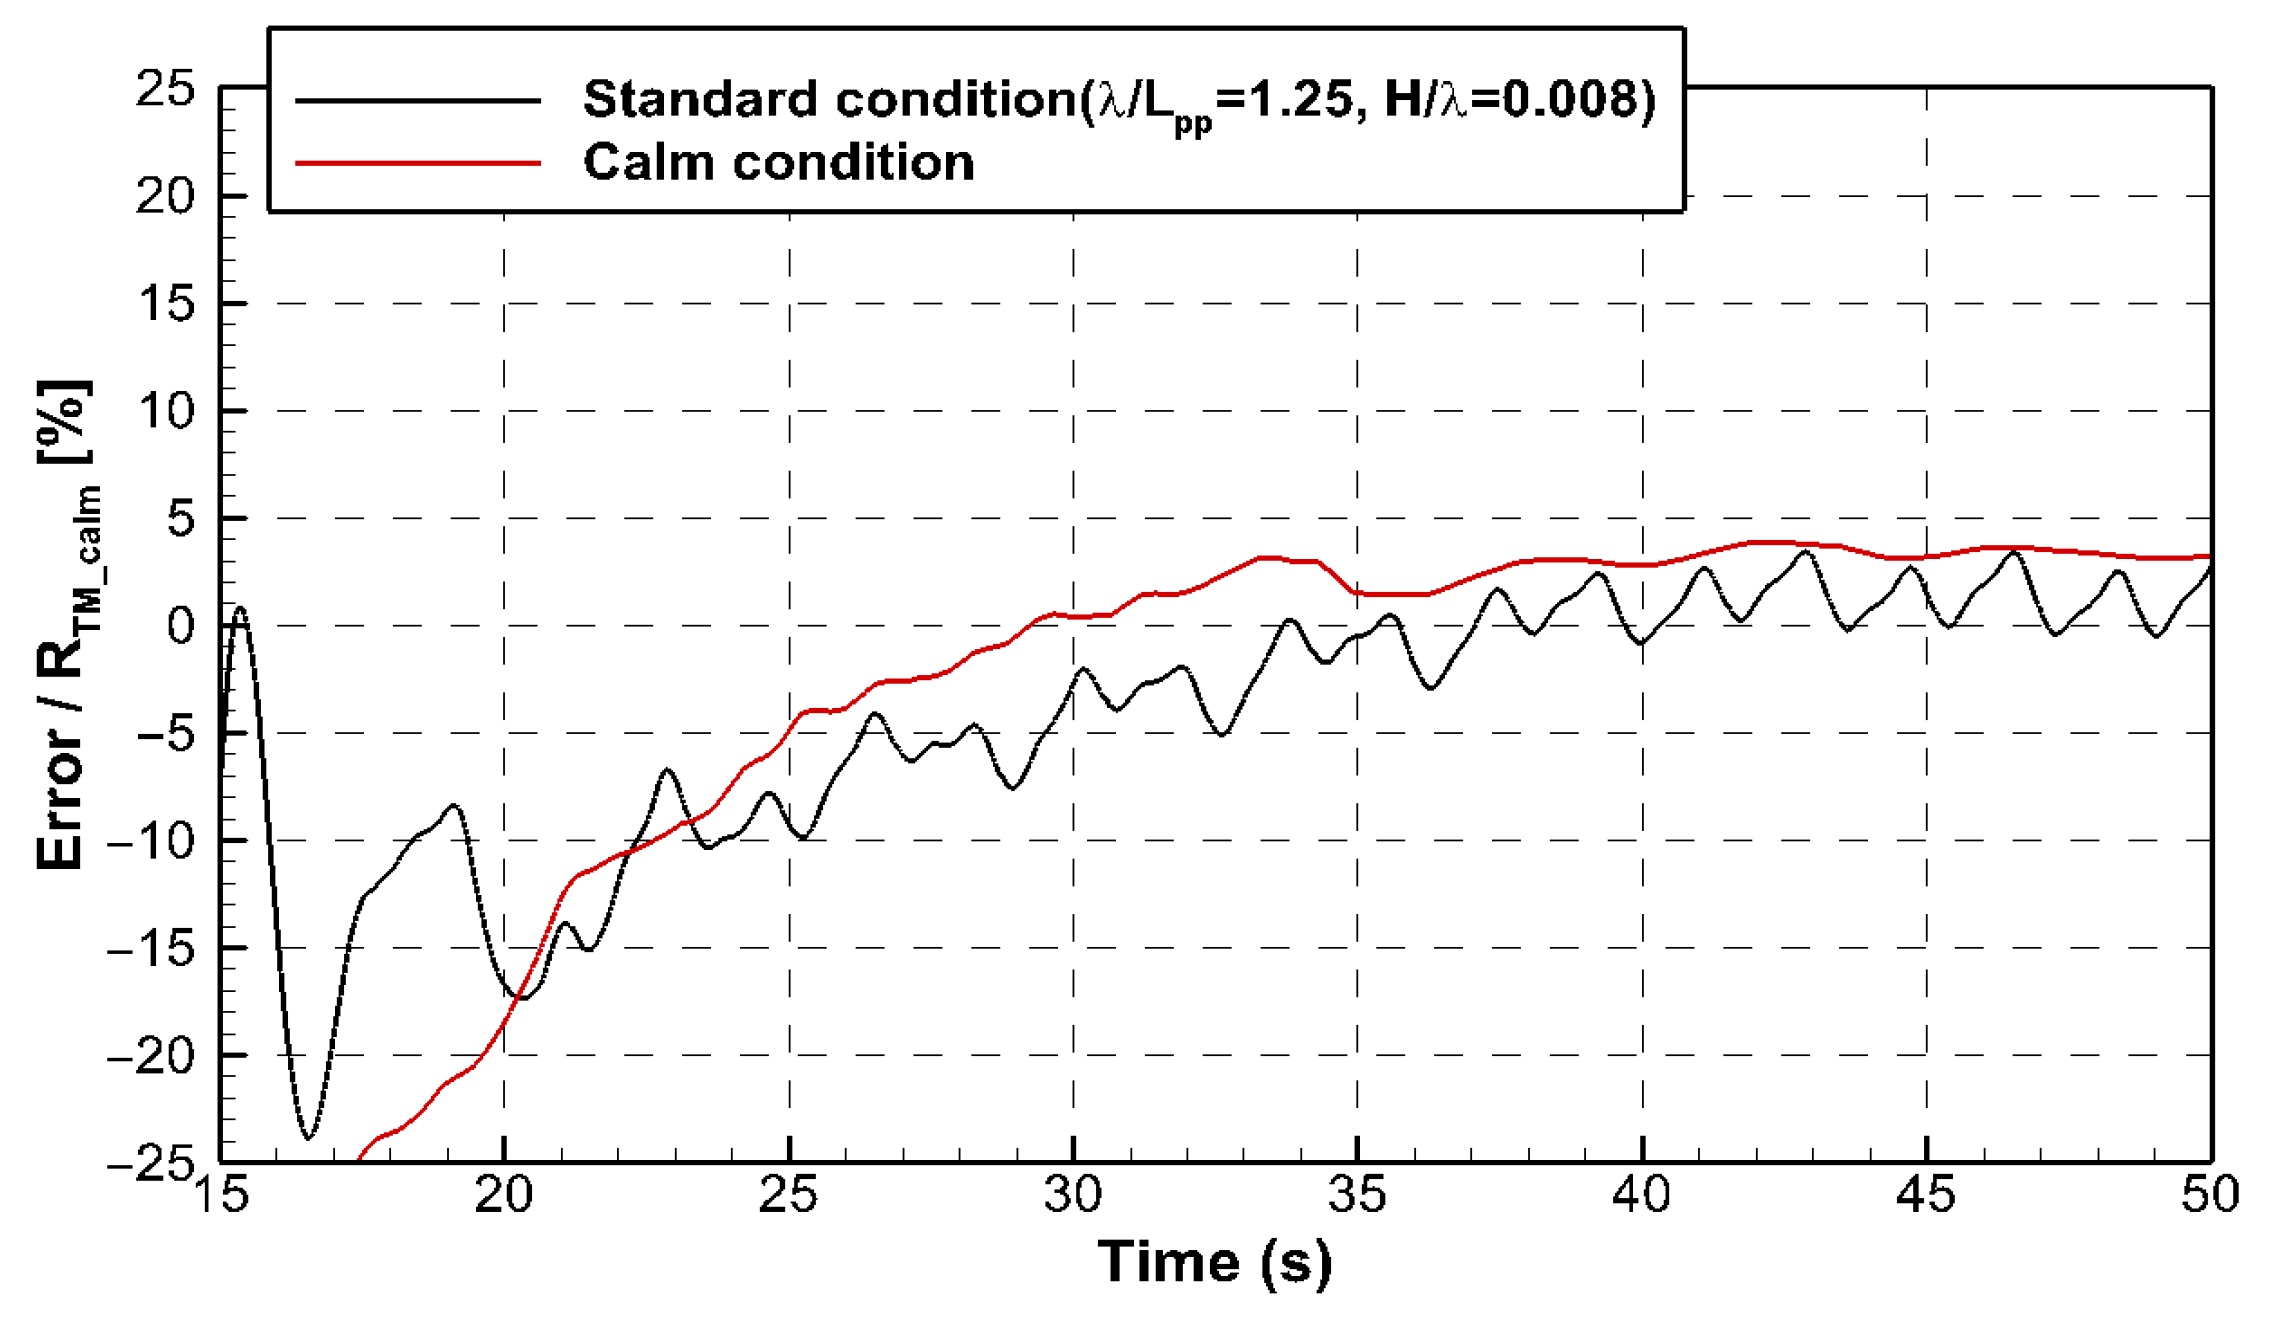
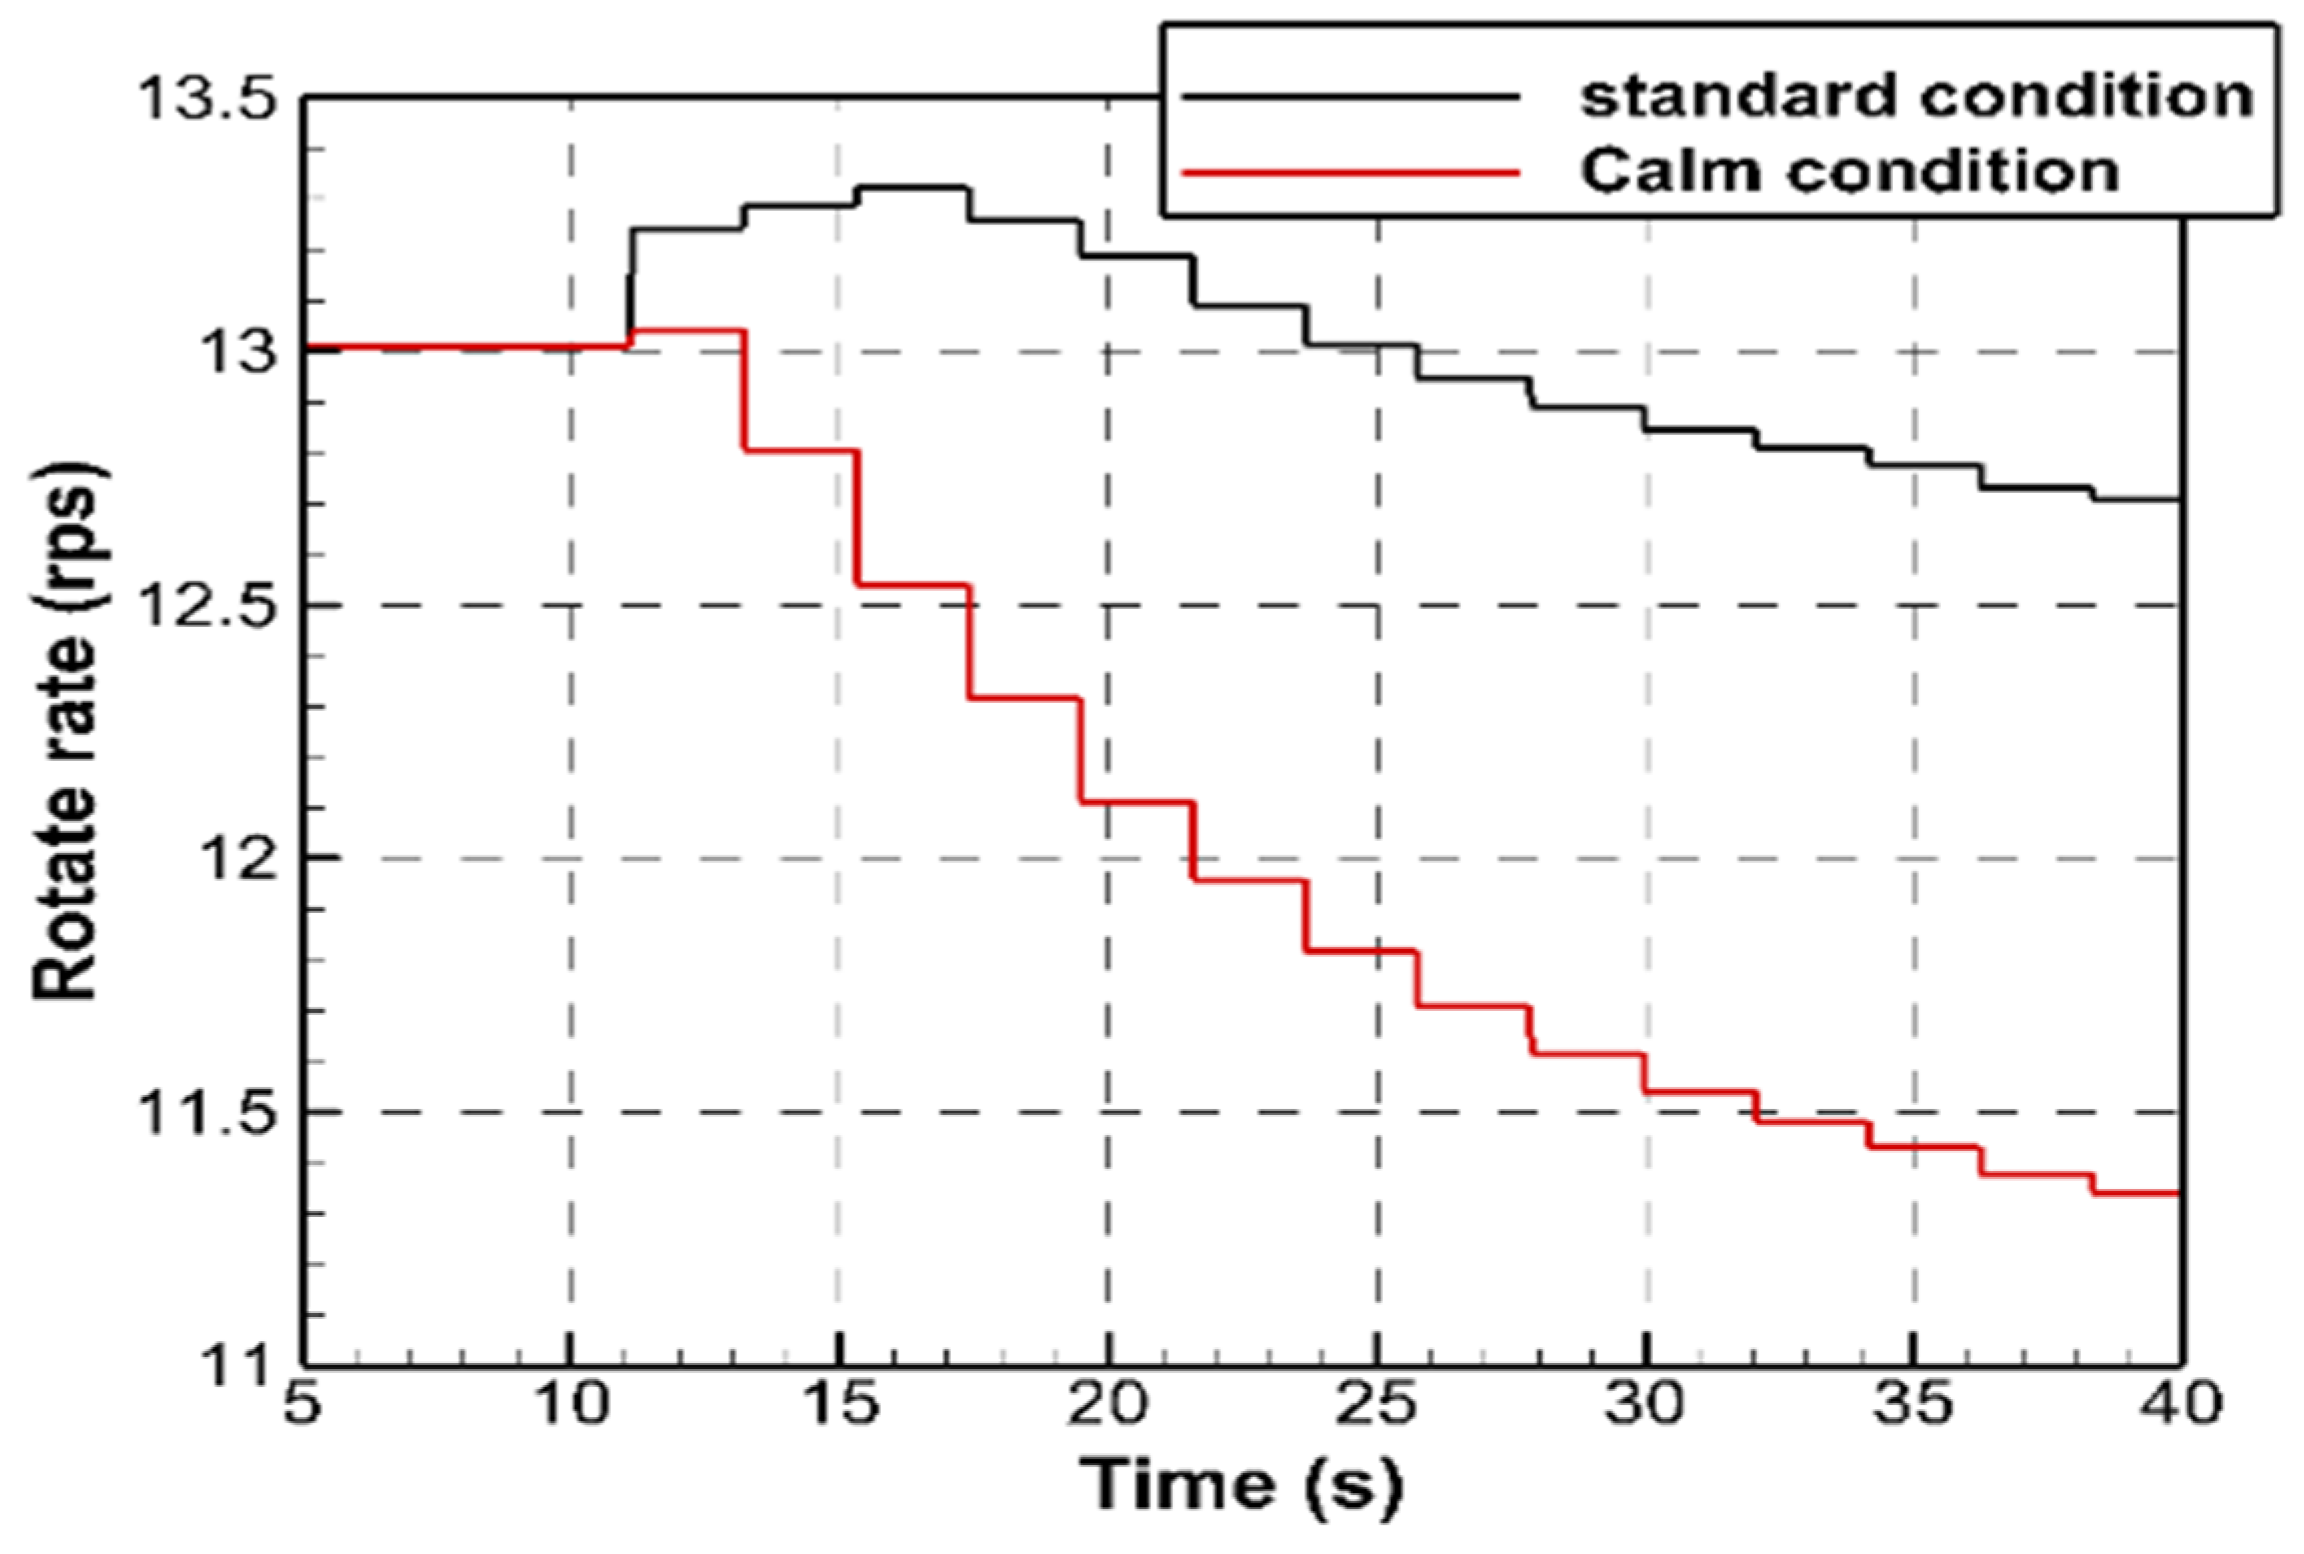
An additional analysis was conducted under calm water conditions to verify the applicability of the PID control gains derived under the standard condition to the calm water (self-propulsion) case. Figure 14 shows the resulting fluctuations in the error values. The revolution rate (RPS) was observed to converge toward the self-propulsion point under calm and wave conditions, as shown in Figure 15. The error values converged to within a 4% tolerance. For rudder angle control, the same PID gains were applied, and the yaw angle successfully converged to zero, as shown in Figure 16.
This analysis confirms that the PID control gains for rudder angle and propeller revolution rate, derived under the standard condition corresponding to medium wave environments, can also be effectively applied under calm water conditions. Therefore, the final procedure for determining the PID control gains under the standard condition is as follows. To elaborate on each step: in the second stage, the critical period ( P c r ) was defined based on the oscillation period of the error observed under wave conditions because it closely resembled the encounter period influenced by the wave environment. In the third stage, the final critical period ( P c r _ f ) was obtained by dividing the initial critical period ( P c r _ i ) by 27, which resulted in a stable error fluctuation range, as illustrated and summarized below. The initial critical period ( P c r _ i ) under medium wave conditions was divided by 27 to obtain the final critical period ( P c r _ f ). The factor 27 was chosen based on empirical results confirming stable error fluctuations. Therefore, the PID gains K P , T i , and T d calculated using the final critical period were selected as the final RPS PID control coefficients.
Step 1: Gain ( K c r ) by identifying the P-gain value that allows the system to reach the target without divergence and with stable convergence.
Step 2: Derive the initial critical period ( P c r _ i ) based on the encounter period observed under wave conditions.
Step 3: Define the final critical period ( P c r _ f ) by dividing the initial value by P c r _ i /27 and use this to calculate the final PID control gains.
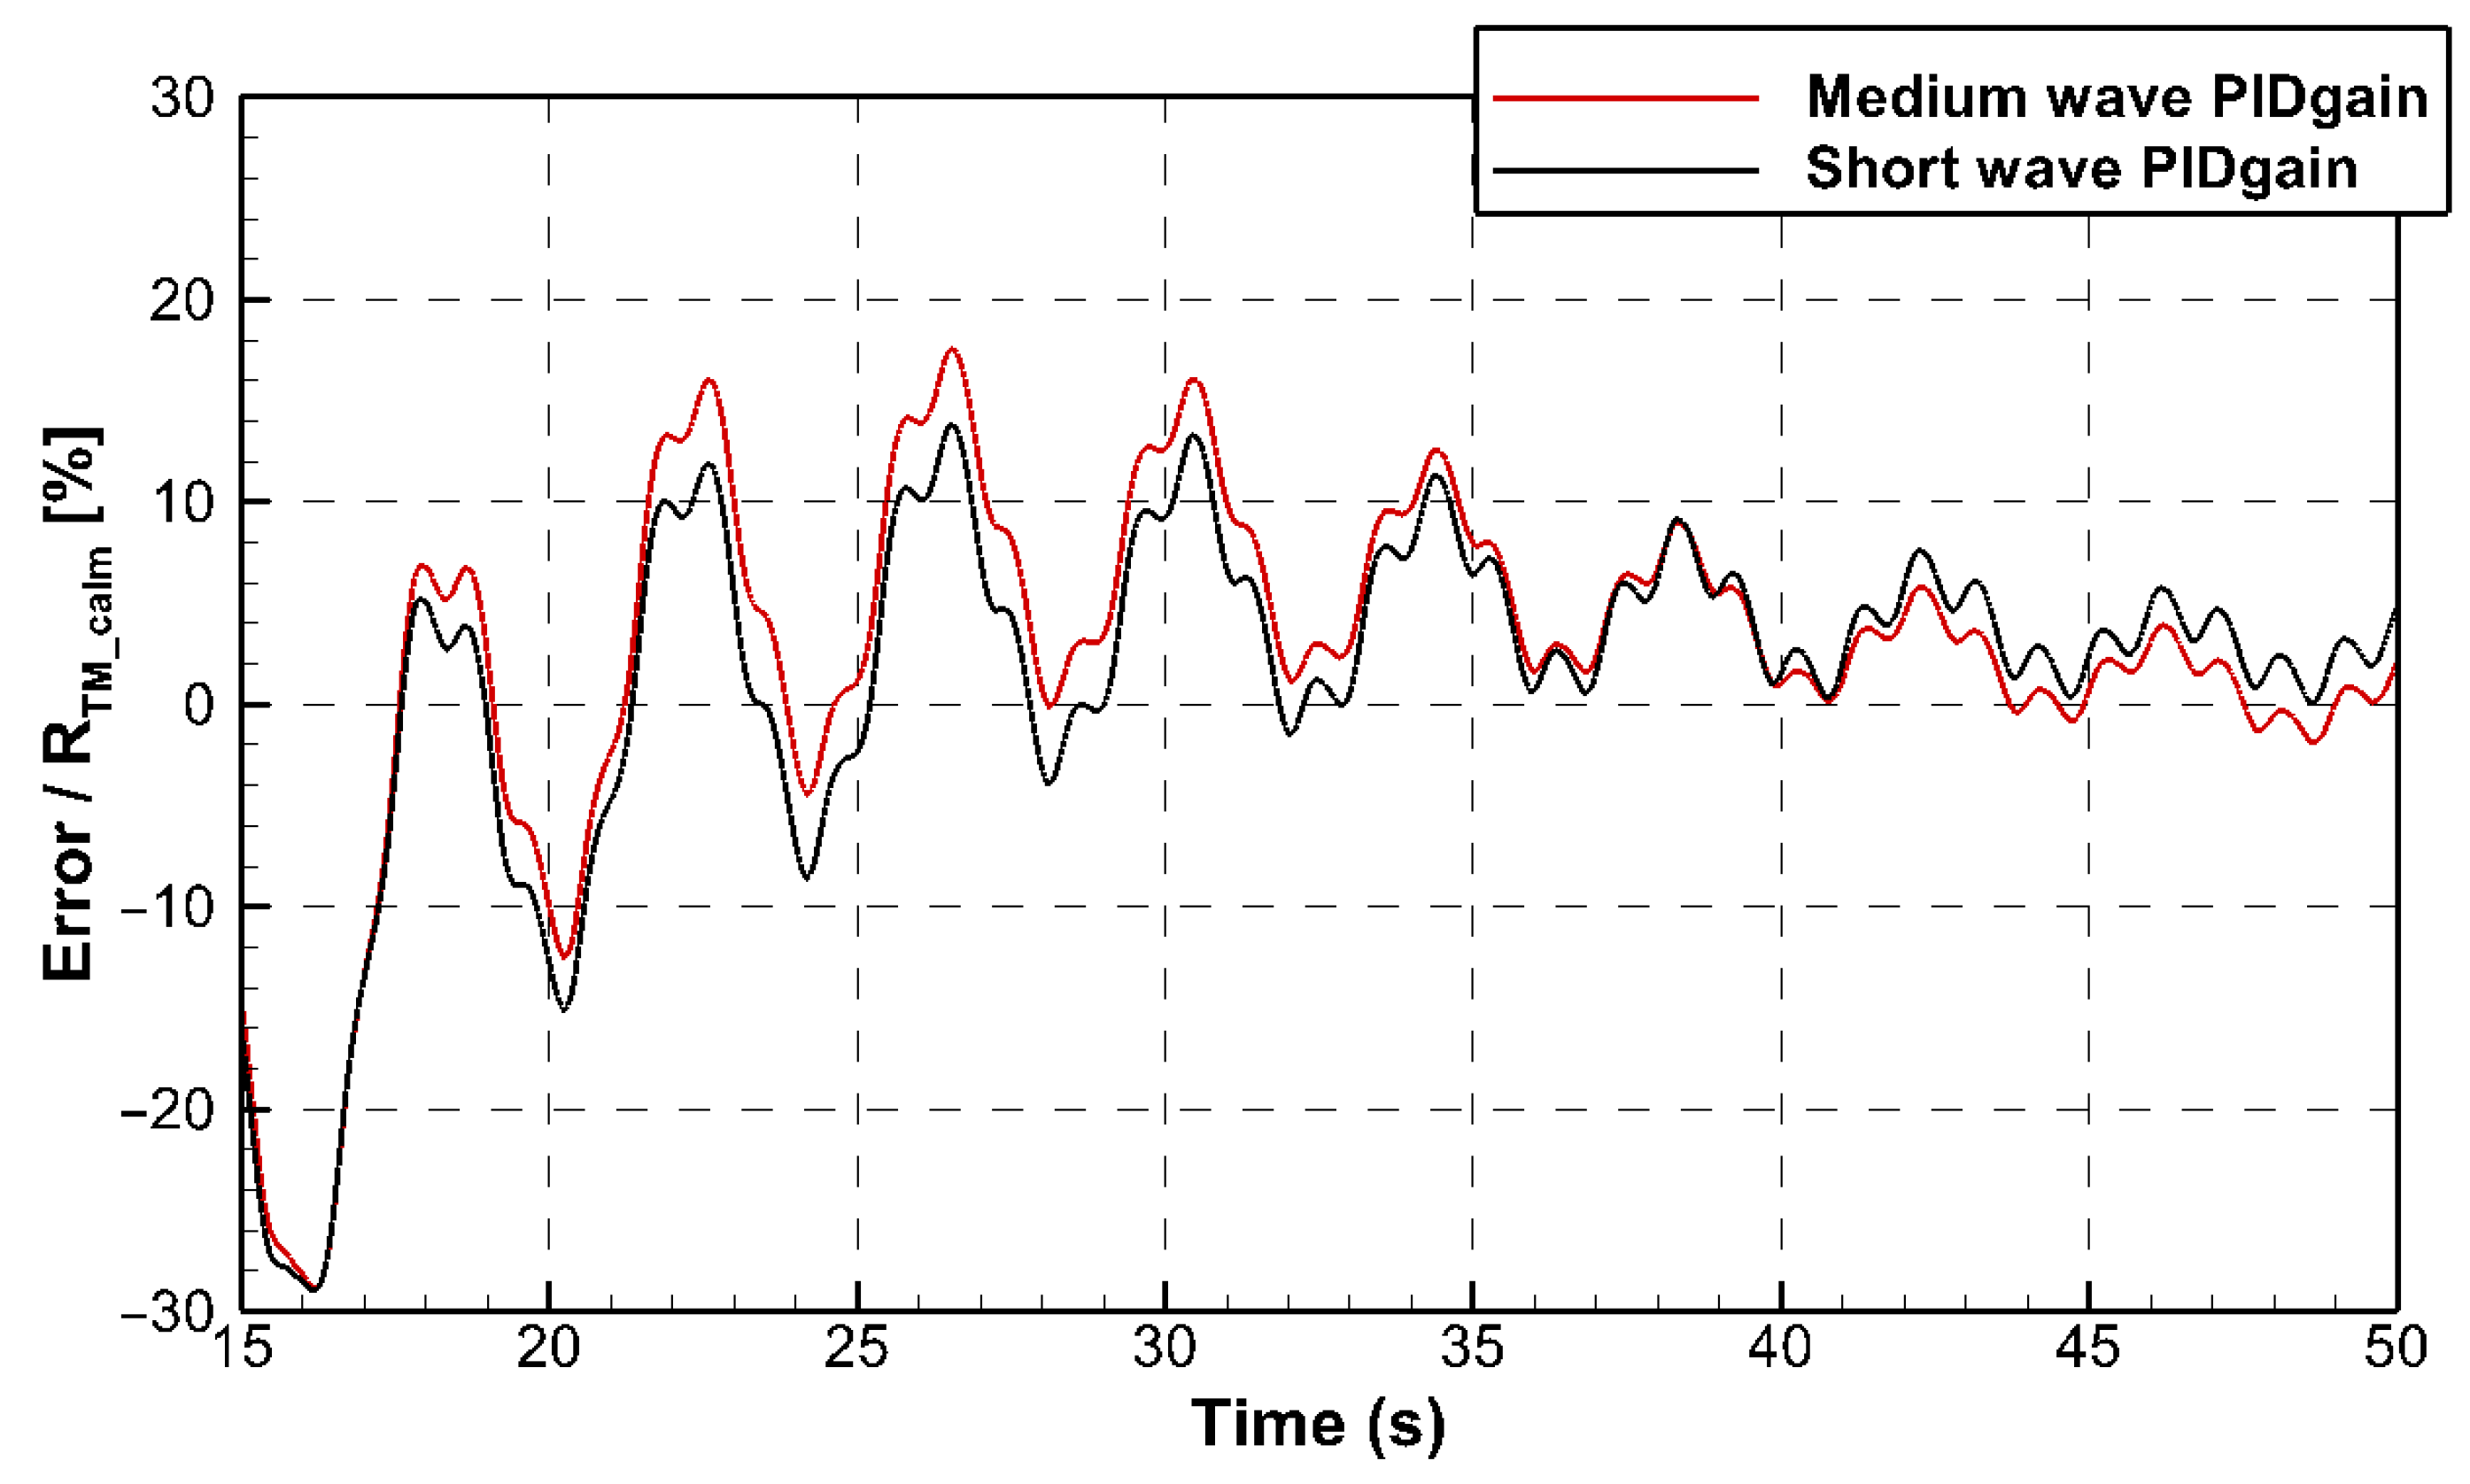
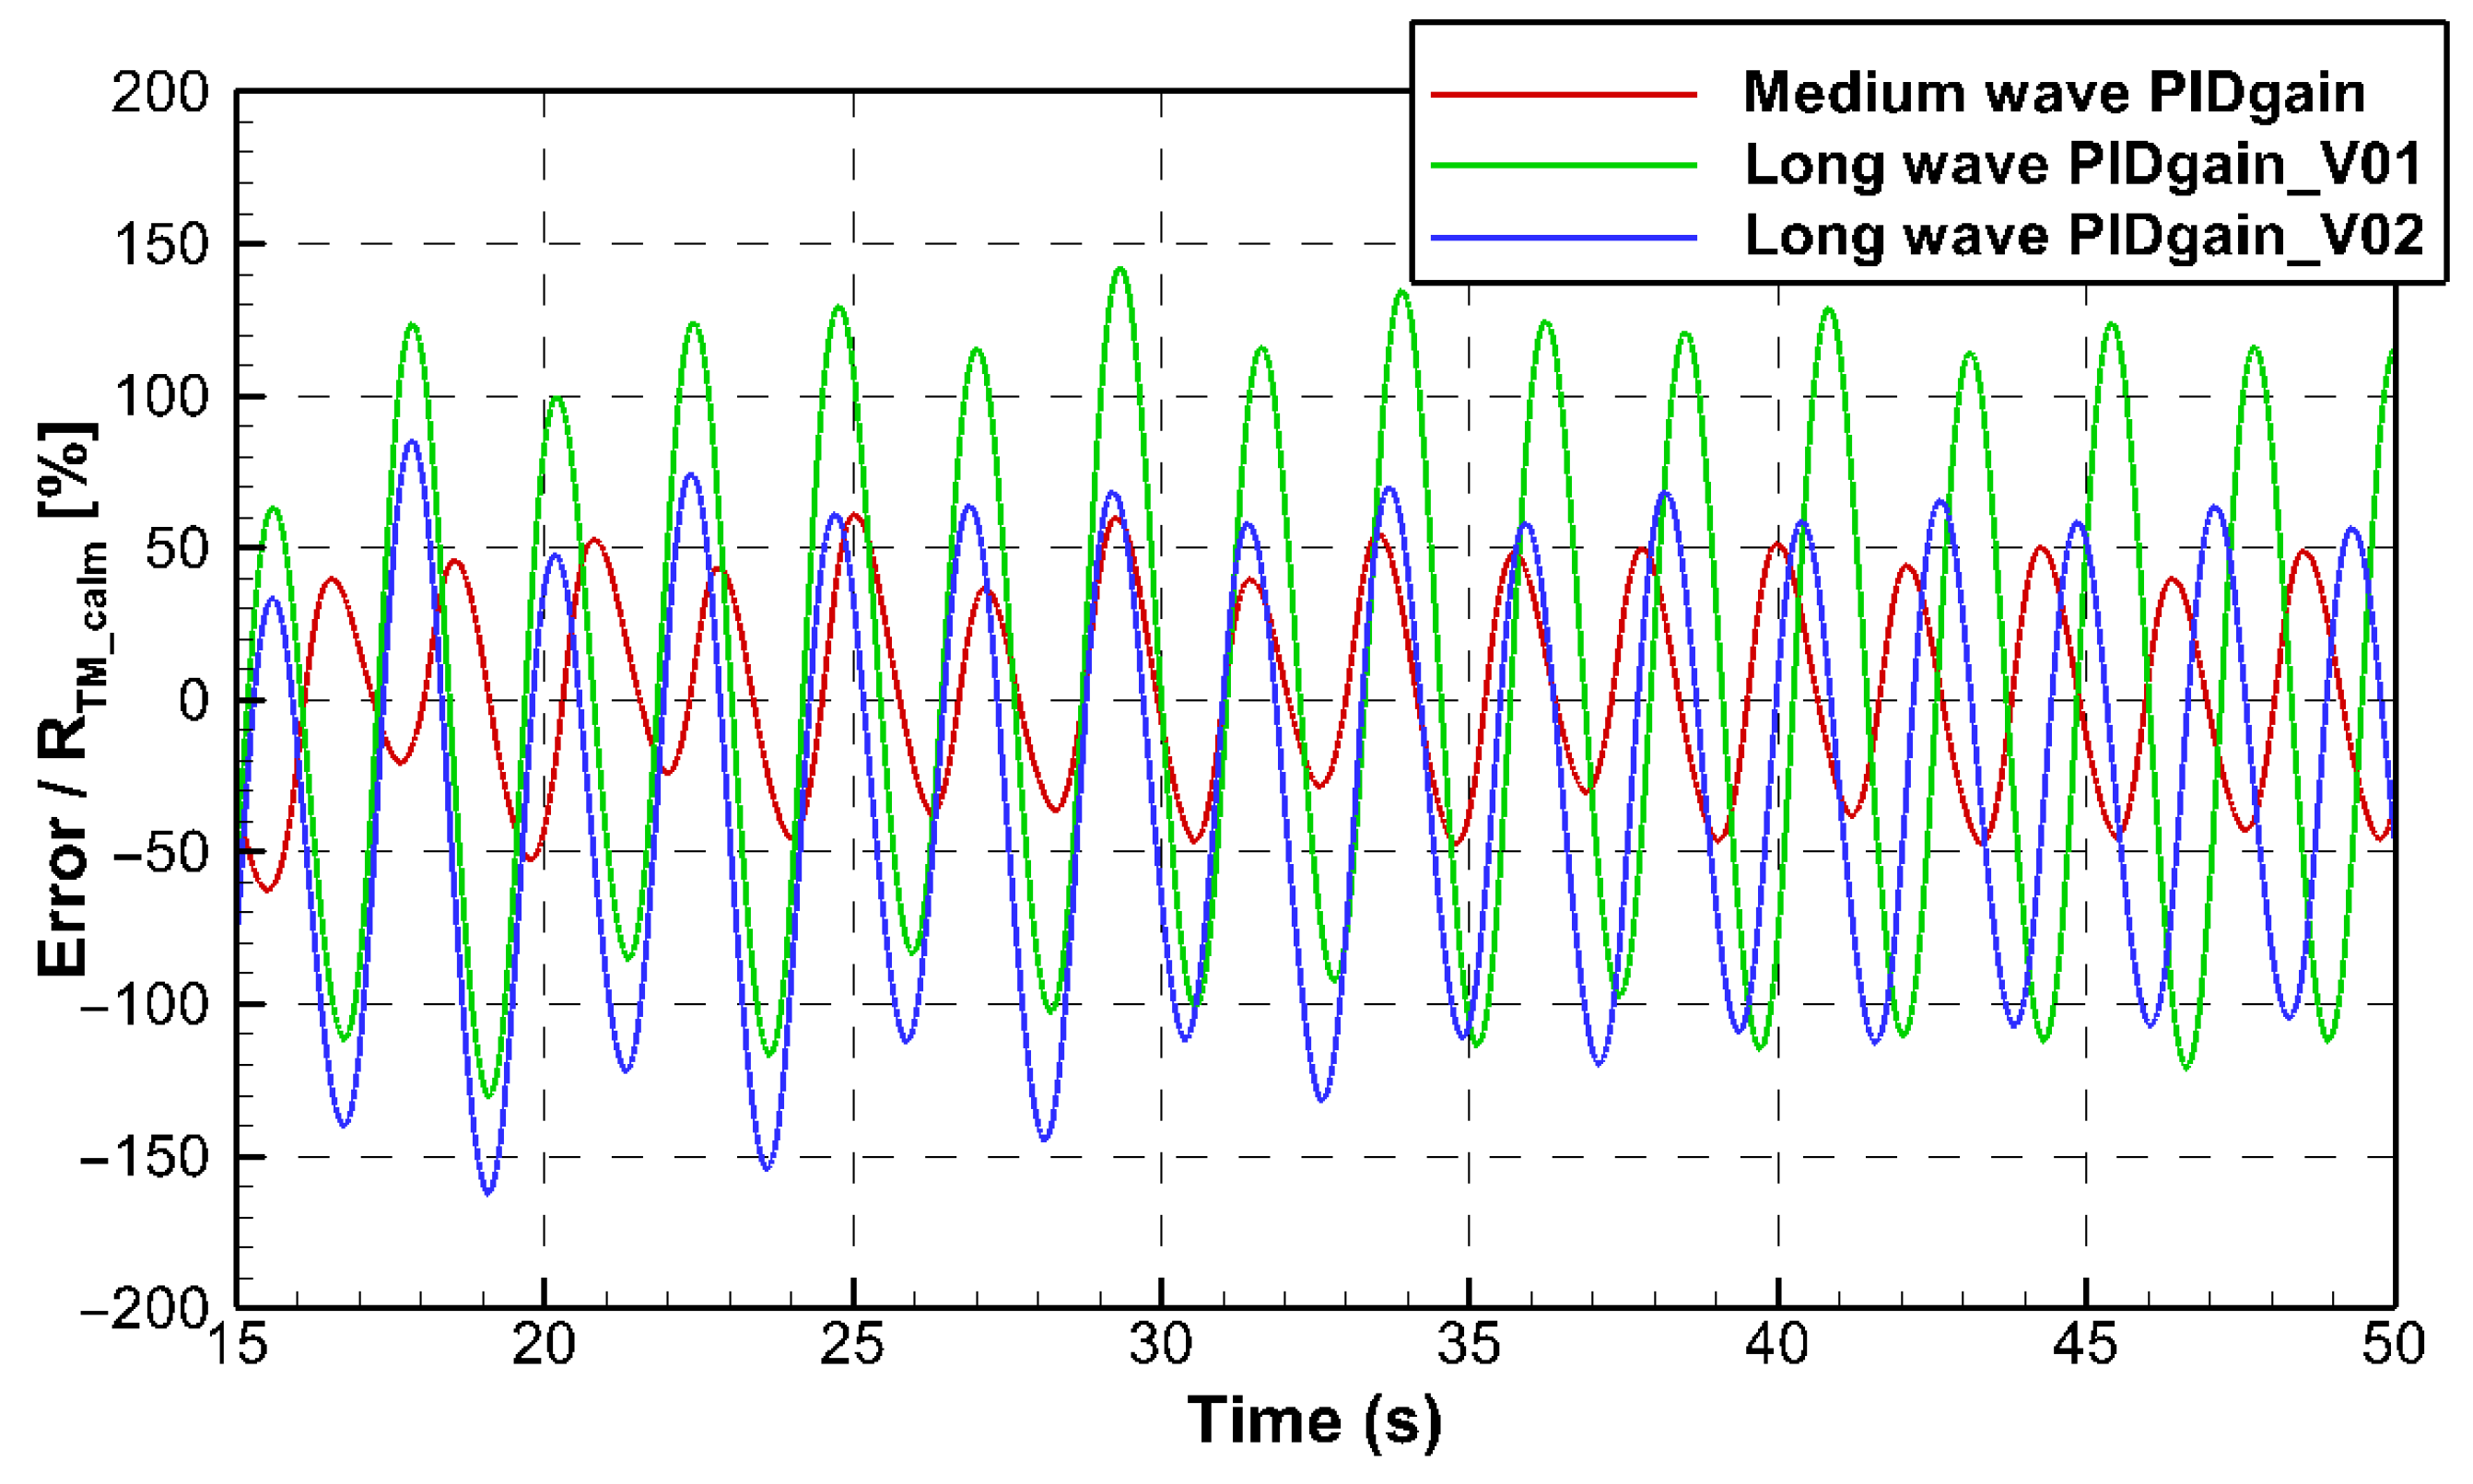
Based on the experience gained thus far, it was established that once the initial P-gain is determined, the remaining PID control gains can be systematically derived. To verify whether the PID tuning procedure developed under the standard condition is also applicable to other wave conditions, additional simulations were carried out under both short and long wave conditions. The short-wave condition was defined as λ/LPP = 0.5, H / λ = 0.008 while the long wave condition was defined as λ/LPP = 1.6, H / λ = 0.008.
For the short wave condition comparison, the rudder PID control used the same gains as those listed in Table 7. Two sets of PID gains obtained under different conditions were applied for the revolution rate PID control, as shown in Table 8. The simulations were conducted under the short wave condition. Although there were no significant differences in performance, the PID gains derived from the moderate wave condition resulted in a faster convergence to zero, as shown in Figure 17.
For the long wave condition comparison, the rudder PID control used the same gains as those listed in Table 7, consistent with the short wave case. For the revolution rate PID control, three sets of PID gains obtained under different conditions were applied to simulations under the long wave condition, as shown in Table 9. The fluctuation range of error values was smaller when using the PID gains derived from the medium wave condition, as shown in Figure 18.
Therefore, using the PID control gains derived under medium wave conditions across various wave environments yielded more favorable results than individually tuning the PID gains for each specific wave condition.

3.3. PID Period Condition

In this study, the term ‘PID control period’ refers to the time required for one loop of the PID controller when operating via the Simulation Operation function, expressed in seconds [s]. Currently, there is no established metric for determining the optimal PID control period. Generally, a shorter control period allows the PID algorithm to respond more rapidly and reach the set-point faster; however, it also increases the likelihood of hunting phenomena. The effect of the control period was investigated by comparing the convergence time of the error for different control periods, using the same PID control gains under the standard condition for both rudder and revolution control, while varying only the control period. To establish criteria for selecting the PID control period, four different values (45, 14, 10, and 2 degrees) were selected based on the self-propulsion point of the K-Supramax hull form, as summarized in Table 10. For these comparisons, the self-propulsion point of the K-Supramax hull corresponds to 9.292 RPS, and the time step was uniformly set to 0.00522, which is equivalent to T e /350.
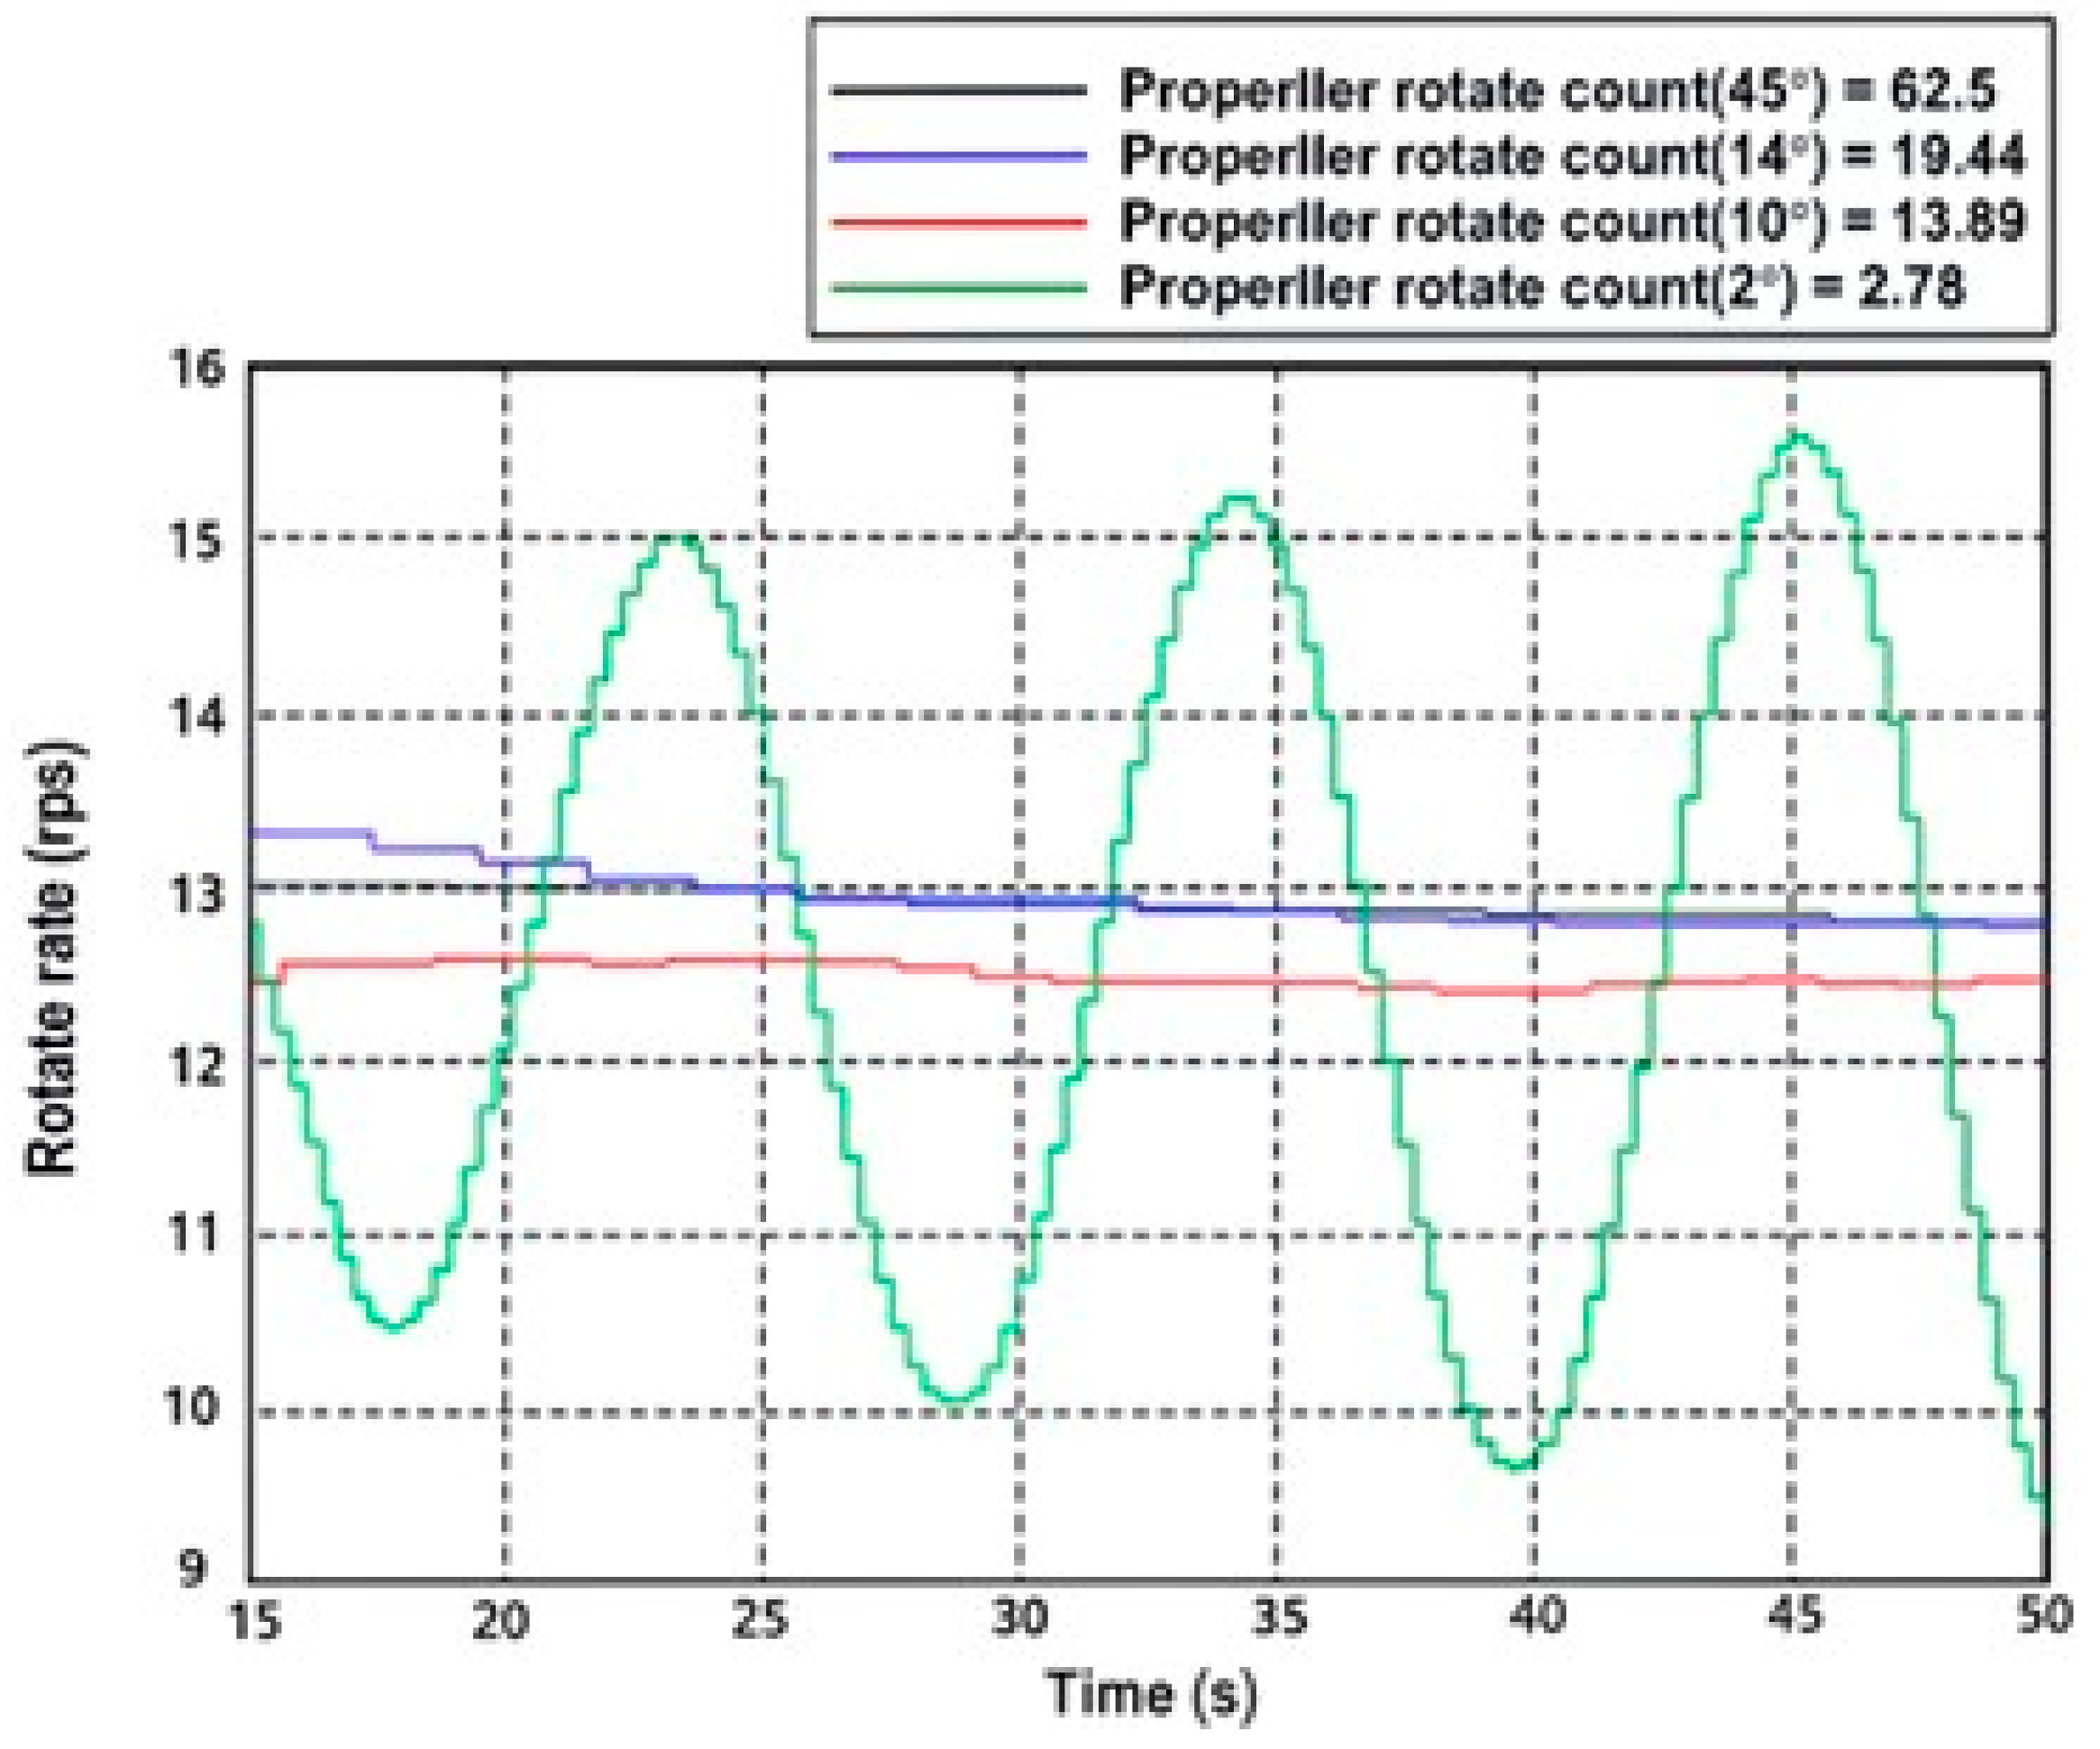
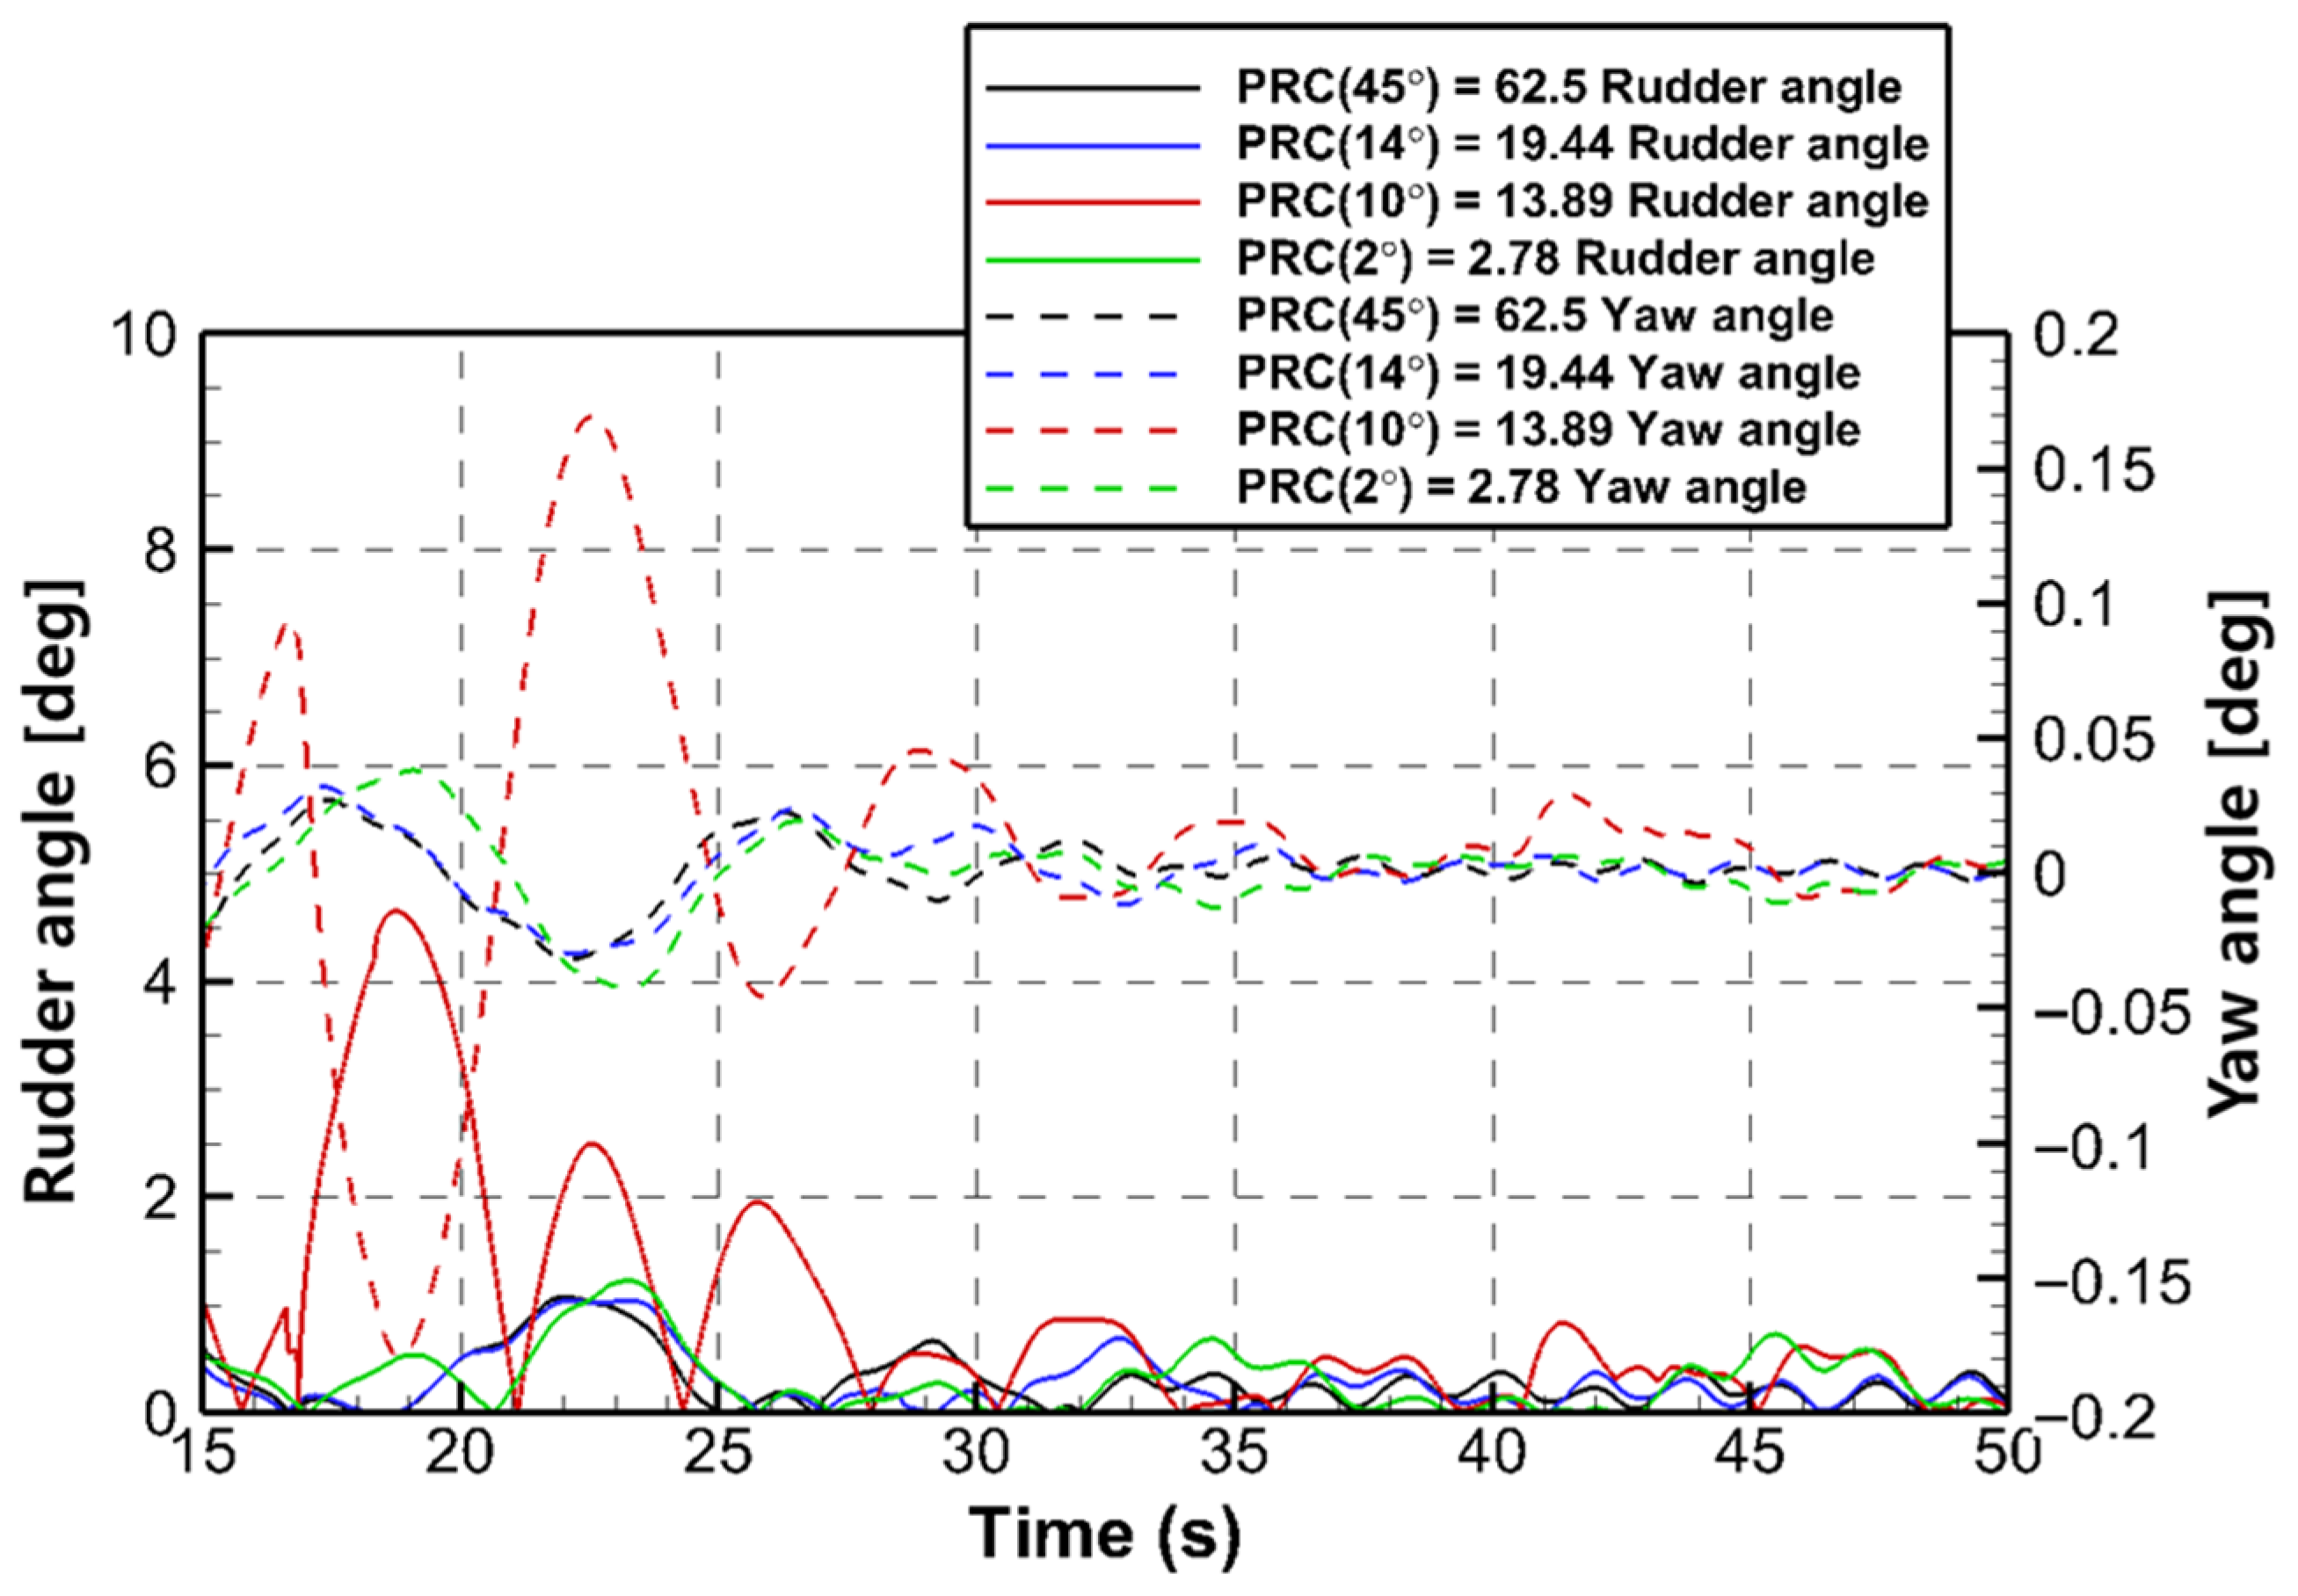
When implementing PID control using the Simulation Operation function, the PID control period can be adjusted by modifying the value of the fixed step in the Time Scale setting within the program, while maintaining a constant time step for the simulation. In the comparison of PID control periods, it was observed that when the propeller rotate count was set to 13.89 (corresponding to a PID control period of 1.495 s), the error value converged to zero approximately 10 s faster than with other control periods. As shown in Figure 19, for propeller rotate counts of 62.5 and 19.44, the error value reached zero at around 40 s, whereas with a propeller rotate count of 13.89, the error value also approached zero at approximately 40 s, indicating a similar convergence trend. Figure 20 illustrates the stepwise variation in RPS values according to changes in the PID control period, demonstrating that shorter control periods result in larger oscillations in the RPS values. The changes in propeller rotate count had no significant impact on the variations in rudder angle or yaw angle, as shown in Figure 21, which displays the convergence of the yaw angle to zero.

3.4. Ship Speed Condition

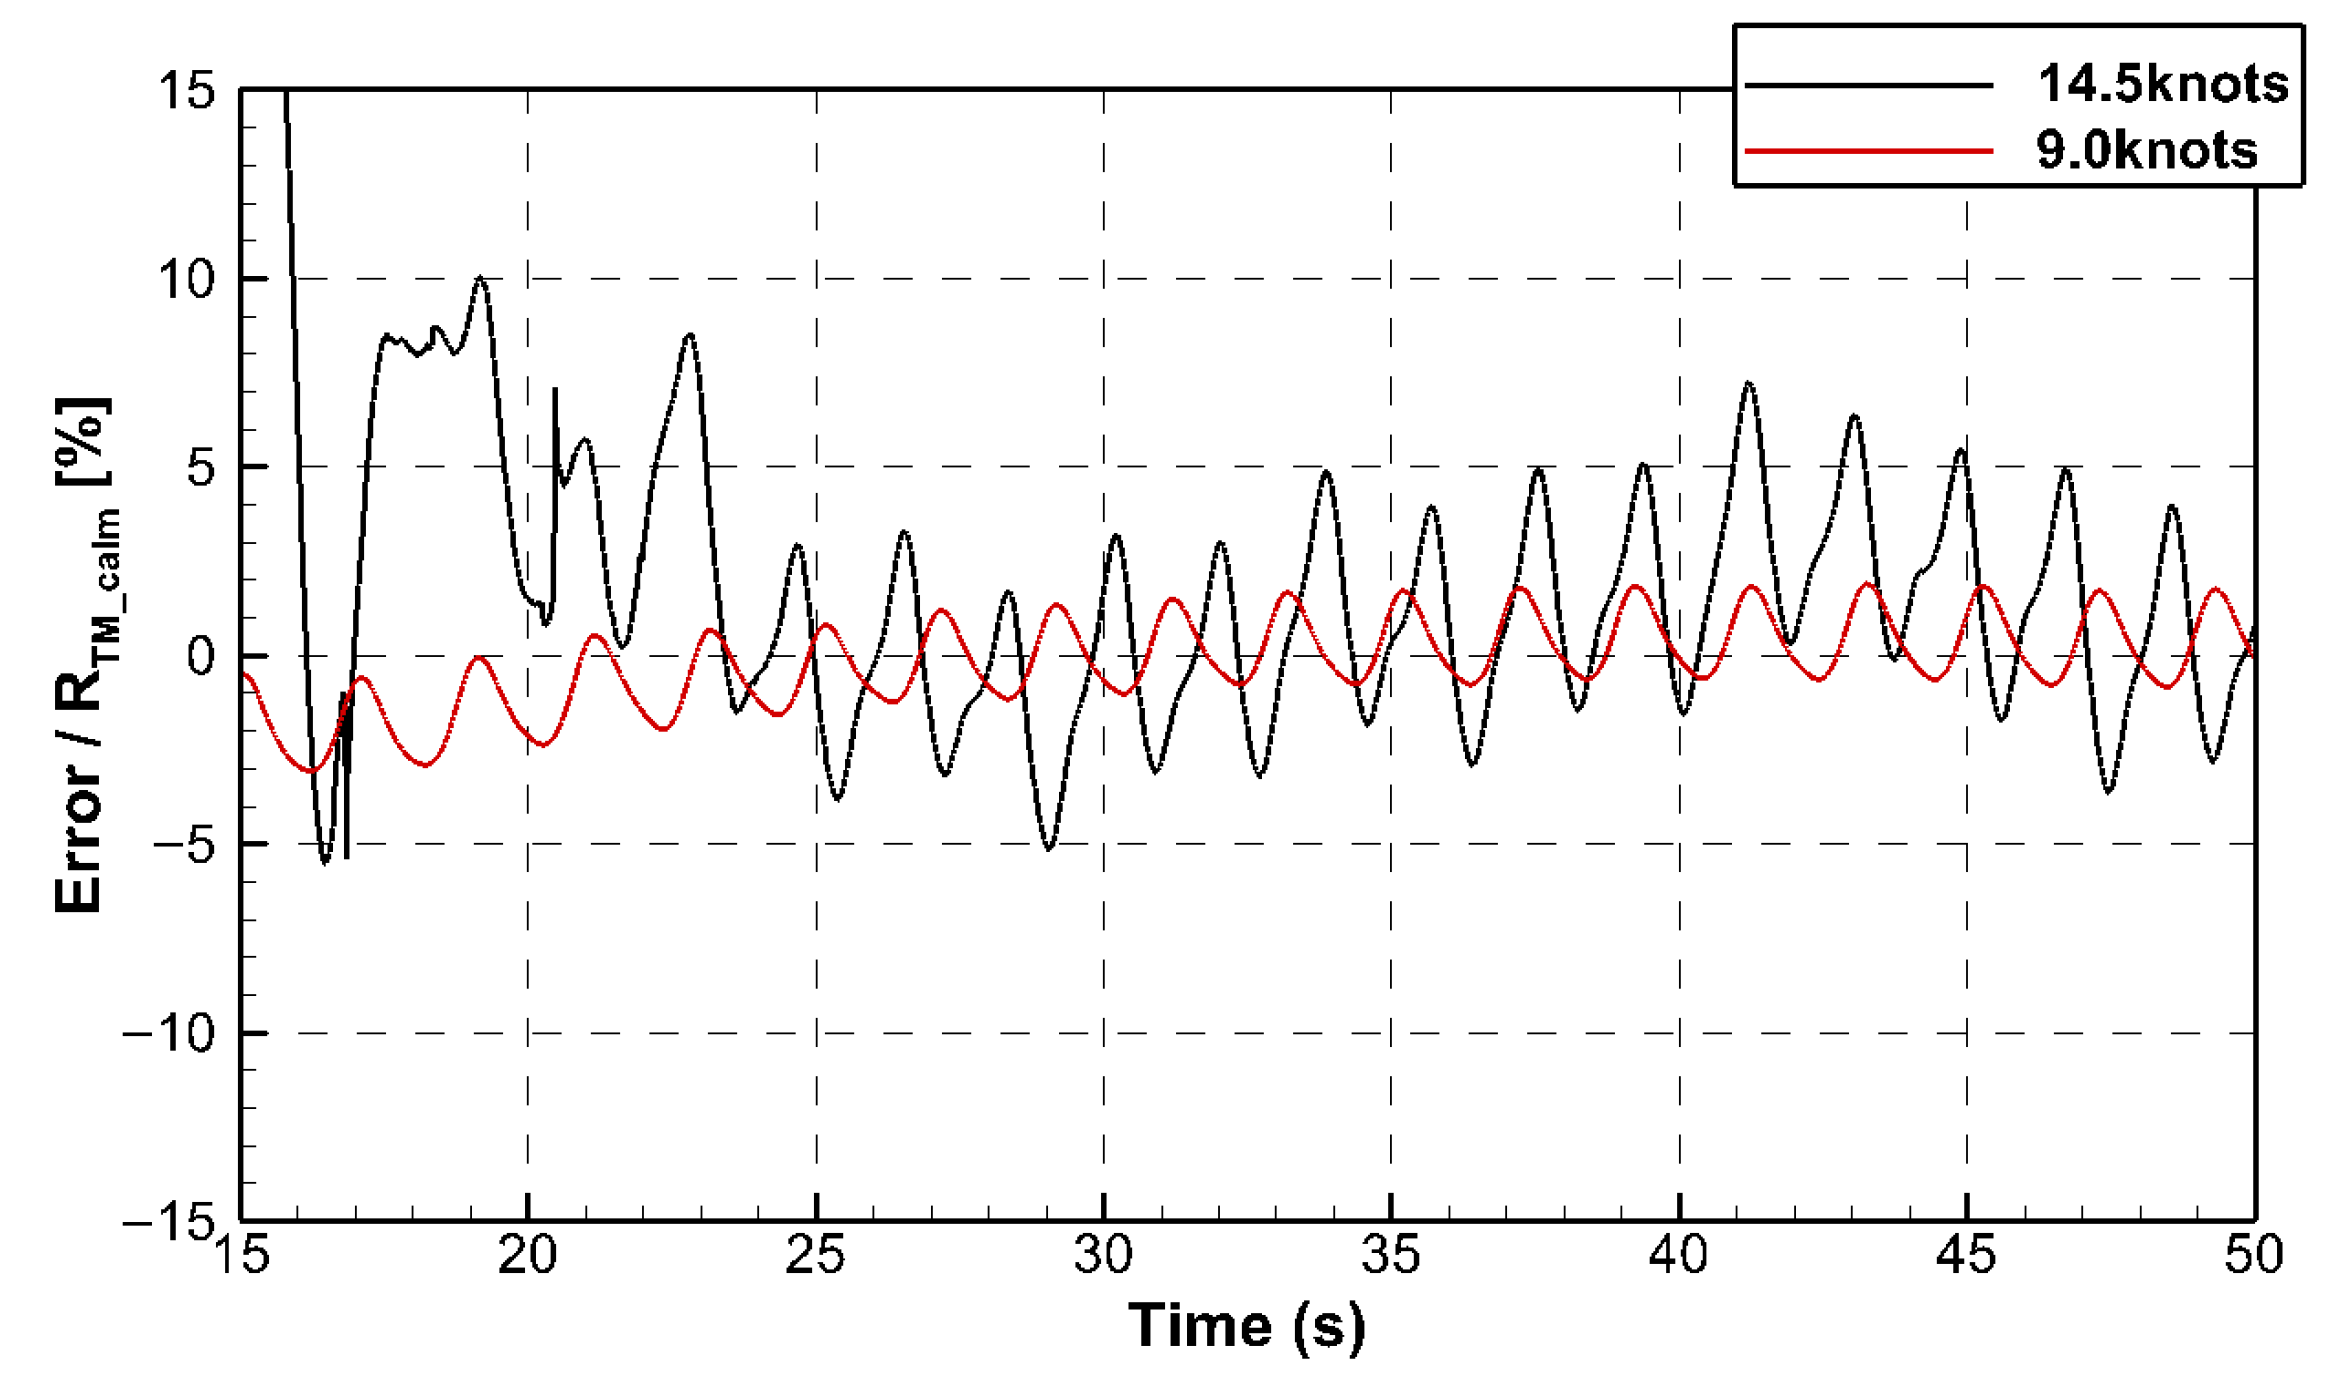
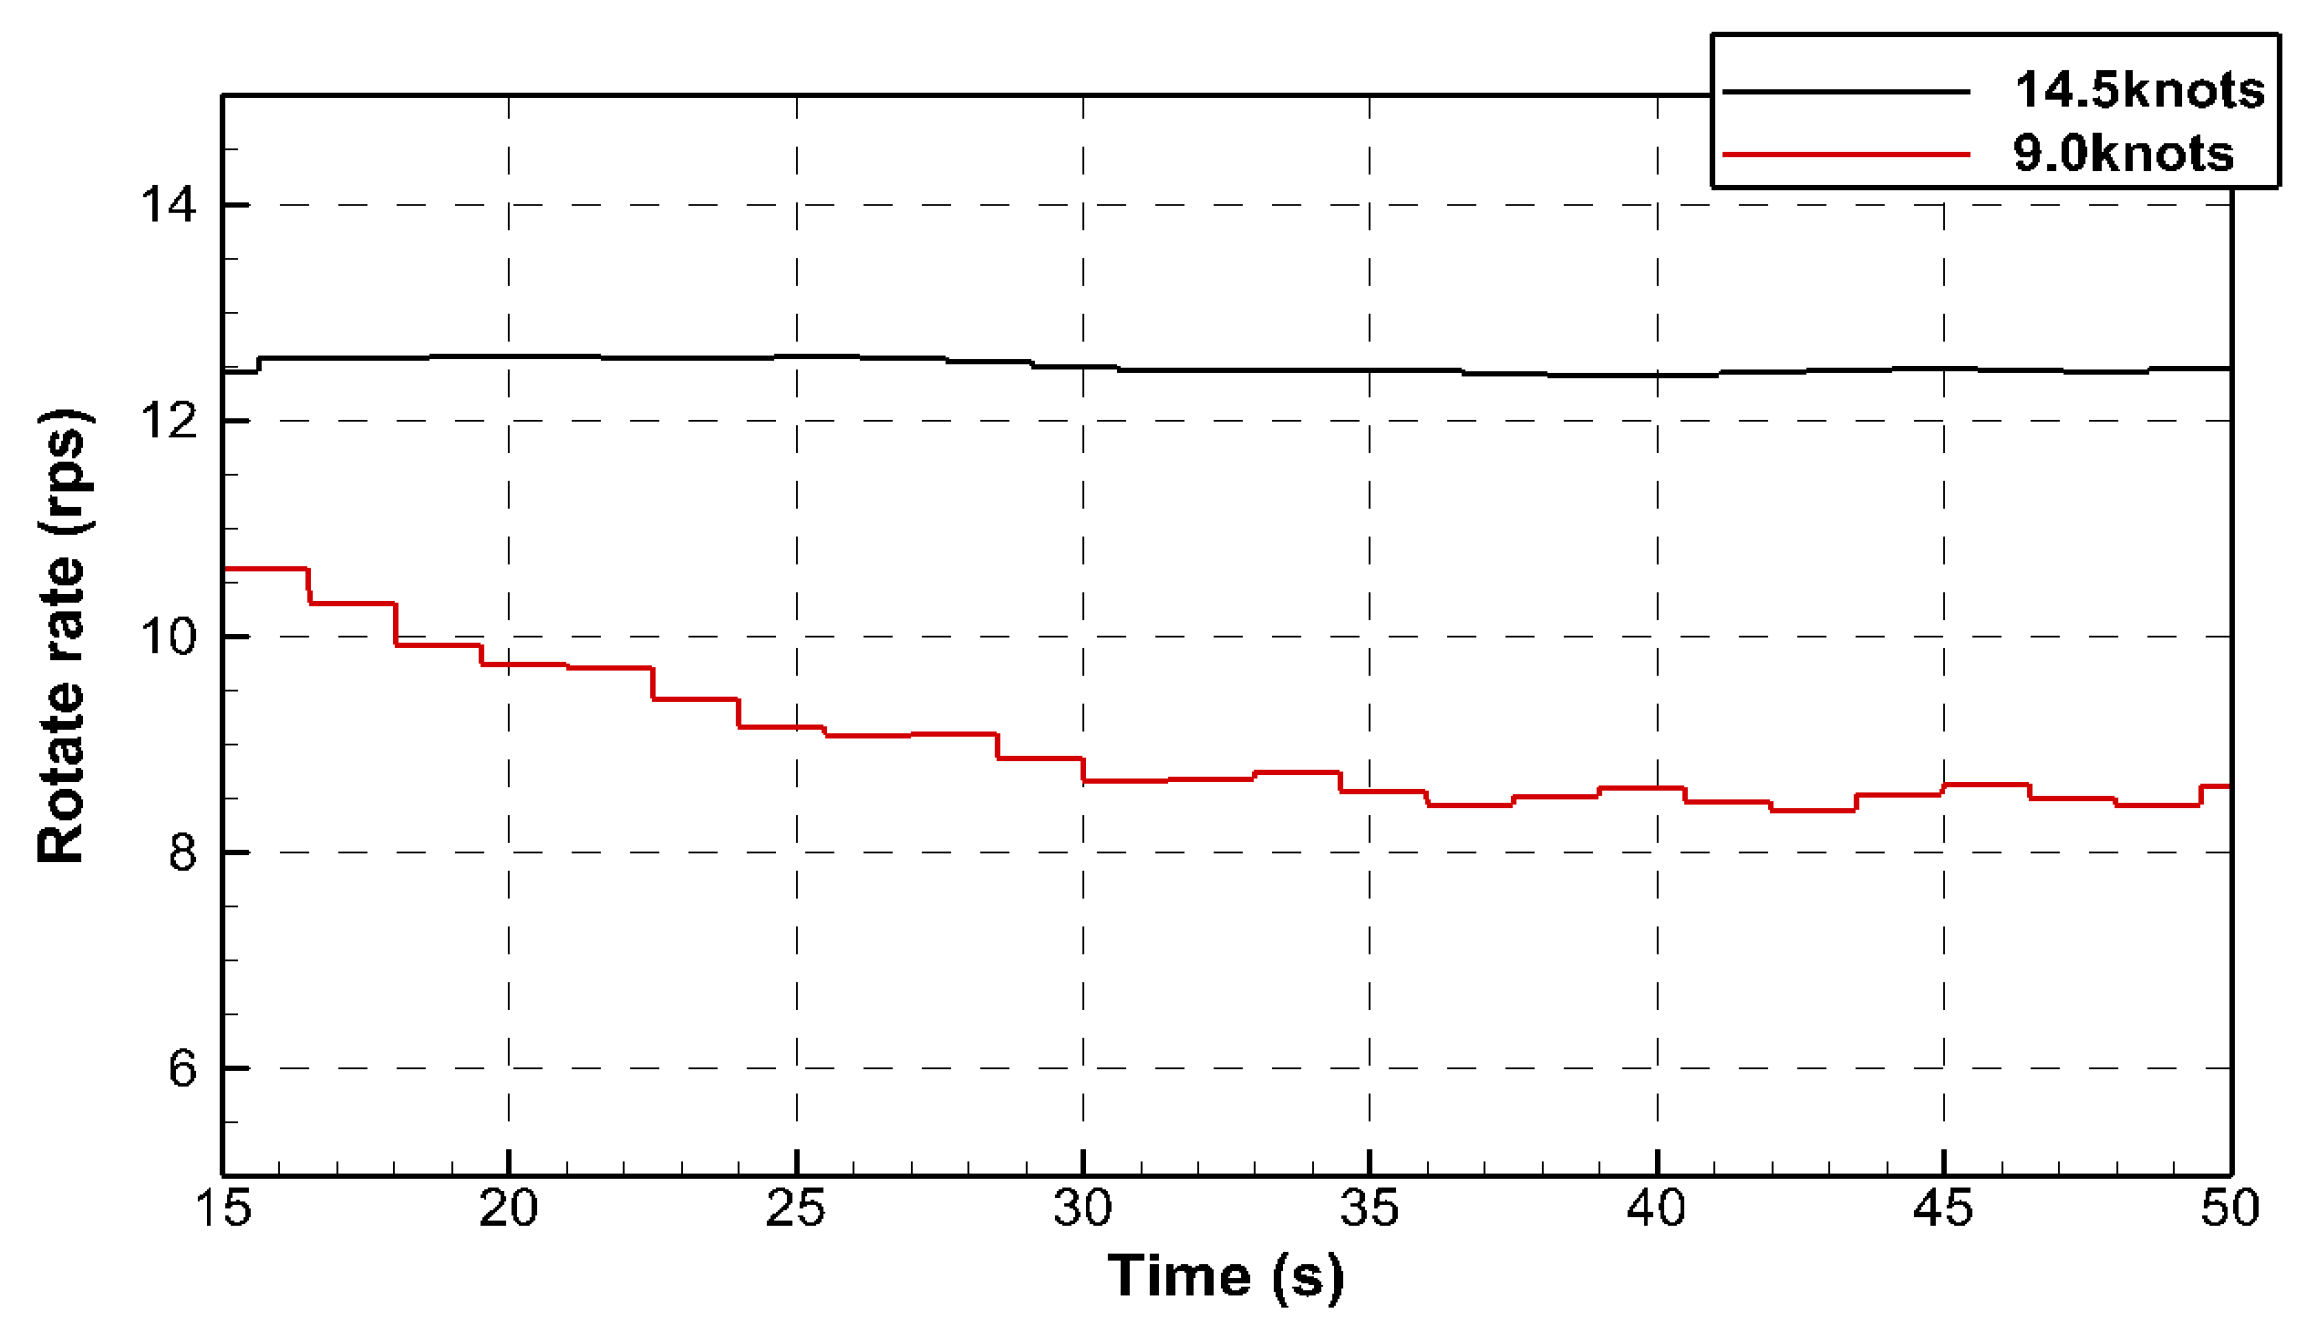
This analysis examined the convergence of error values under varying ship speeds while maintaining the same PID control coefficients. Most simulation conditions remained consistent with those of the standard condition, and the rudder and revolution PID control coefficients were applied, as listed in Table 7. Furthermore, the PID control period was set to 1.495 s, corresponding to a propeller rotation count of 13.89, as determined in the previous analysis. On the other hand, the ship speed condition was modified from the previously used 14.5 knots to a lower speed of 9 knots while keeping all other parameters unchanged. Figure 22 and Figure 23 present the time series of error values and RPS variations under different speed conditions, where the 9 knots condition is marked in red, and the design speed of 14.5 knots is shown in black. The results suggested that applying the same PID control coefficients under low-speed conditions (9 knots) resulted in a smaller error fluctuation range and more stable convergence than the design speed condition (14.5 knots). Figure 24 shows the variations in the rudder and yaw angle under different ship speed conditions. As the ship speed decreases, the time required to reach the target value (yaw angle = 0) is slightly longer than the design speed. Nevertheless, the overall trend remained stable, and the yaw angle successfully converged to zero without significant issues.

3.5. Scale Ratio Condition

This analysis evaluated the variations in error values when applying the same PID control coefficients to a different scale ratio while maintaining the same hull conditions. The simulation was performed under the same conditions as the standard condition, with the scale ratio of the K-Supramax set to 40.42, corresponding to LPP = 4.75 m. In addition, the percentage error was compared by conducting a resistance analysis in calm water for the scale ratio of 40.42. The total resistance coefficient (CTM) was obtained and compared with the experimental data. The comparison showed an error rate of less than 1%, as shown in Table 11.
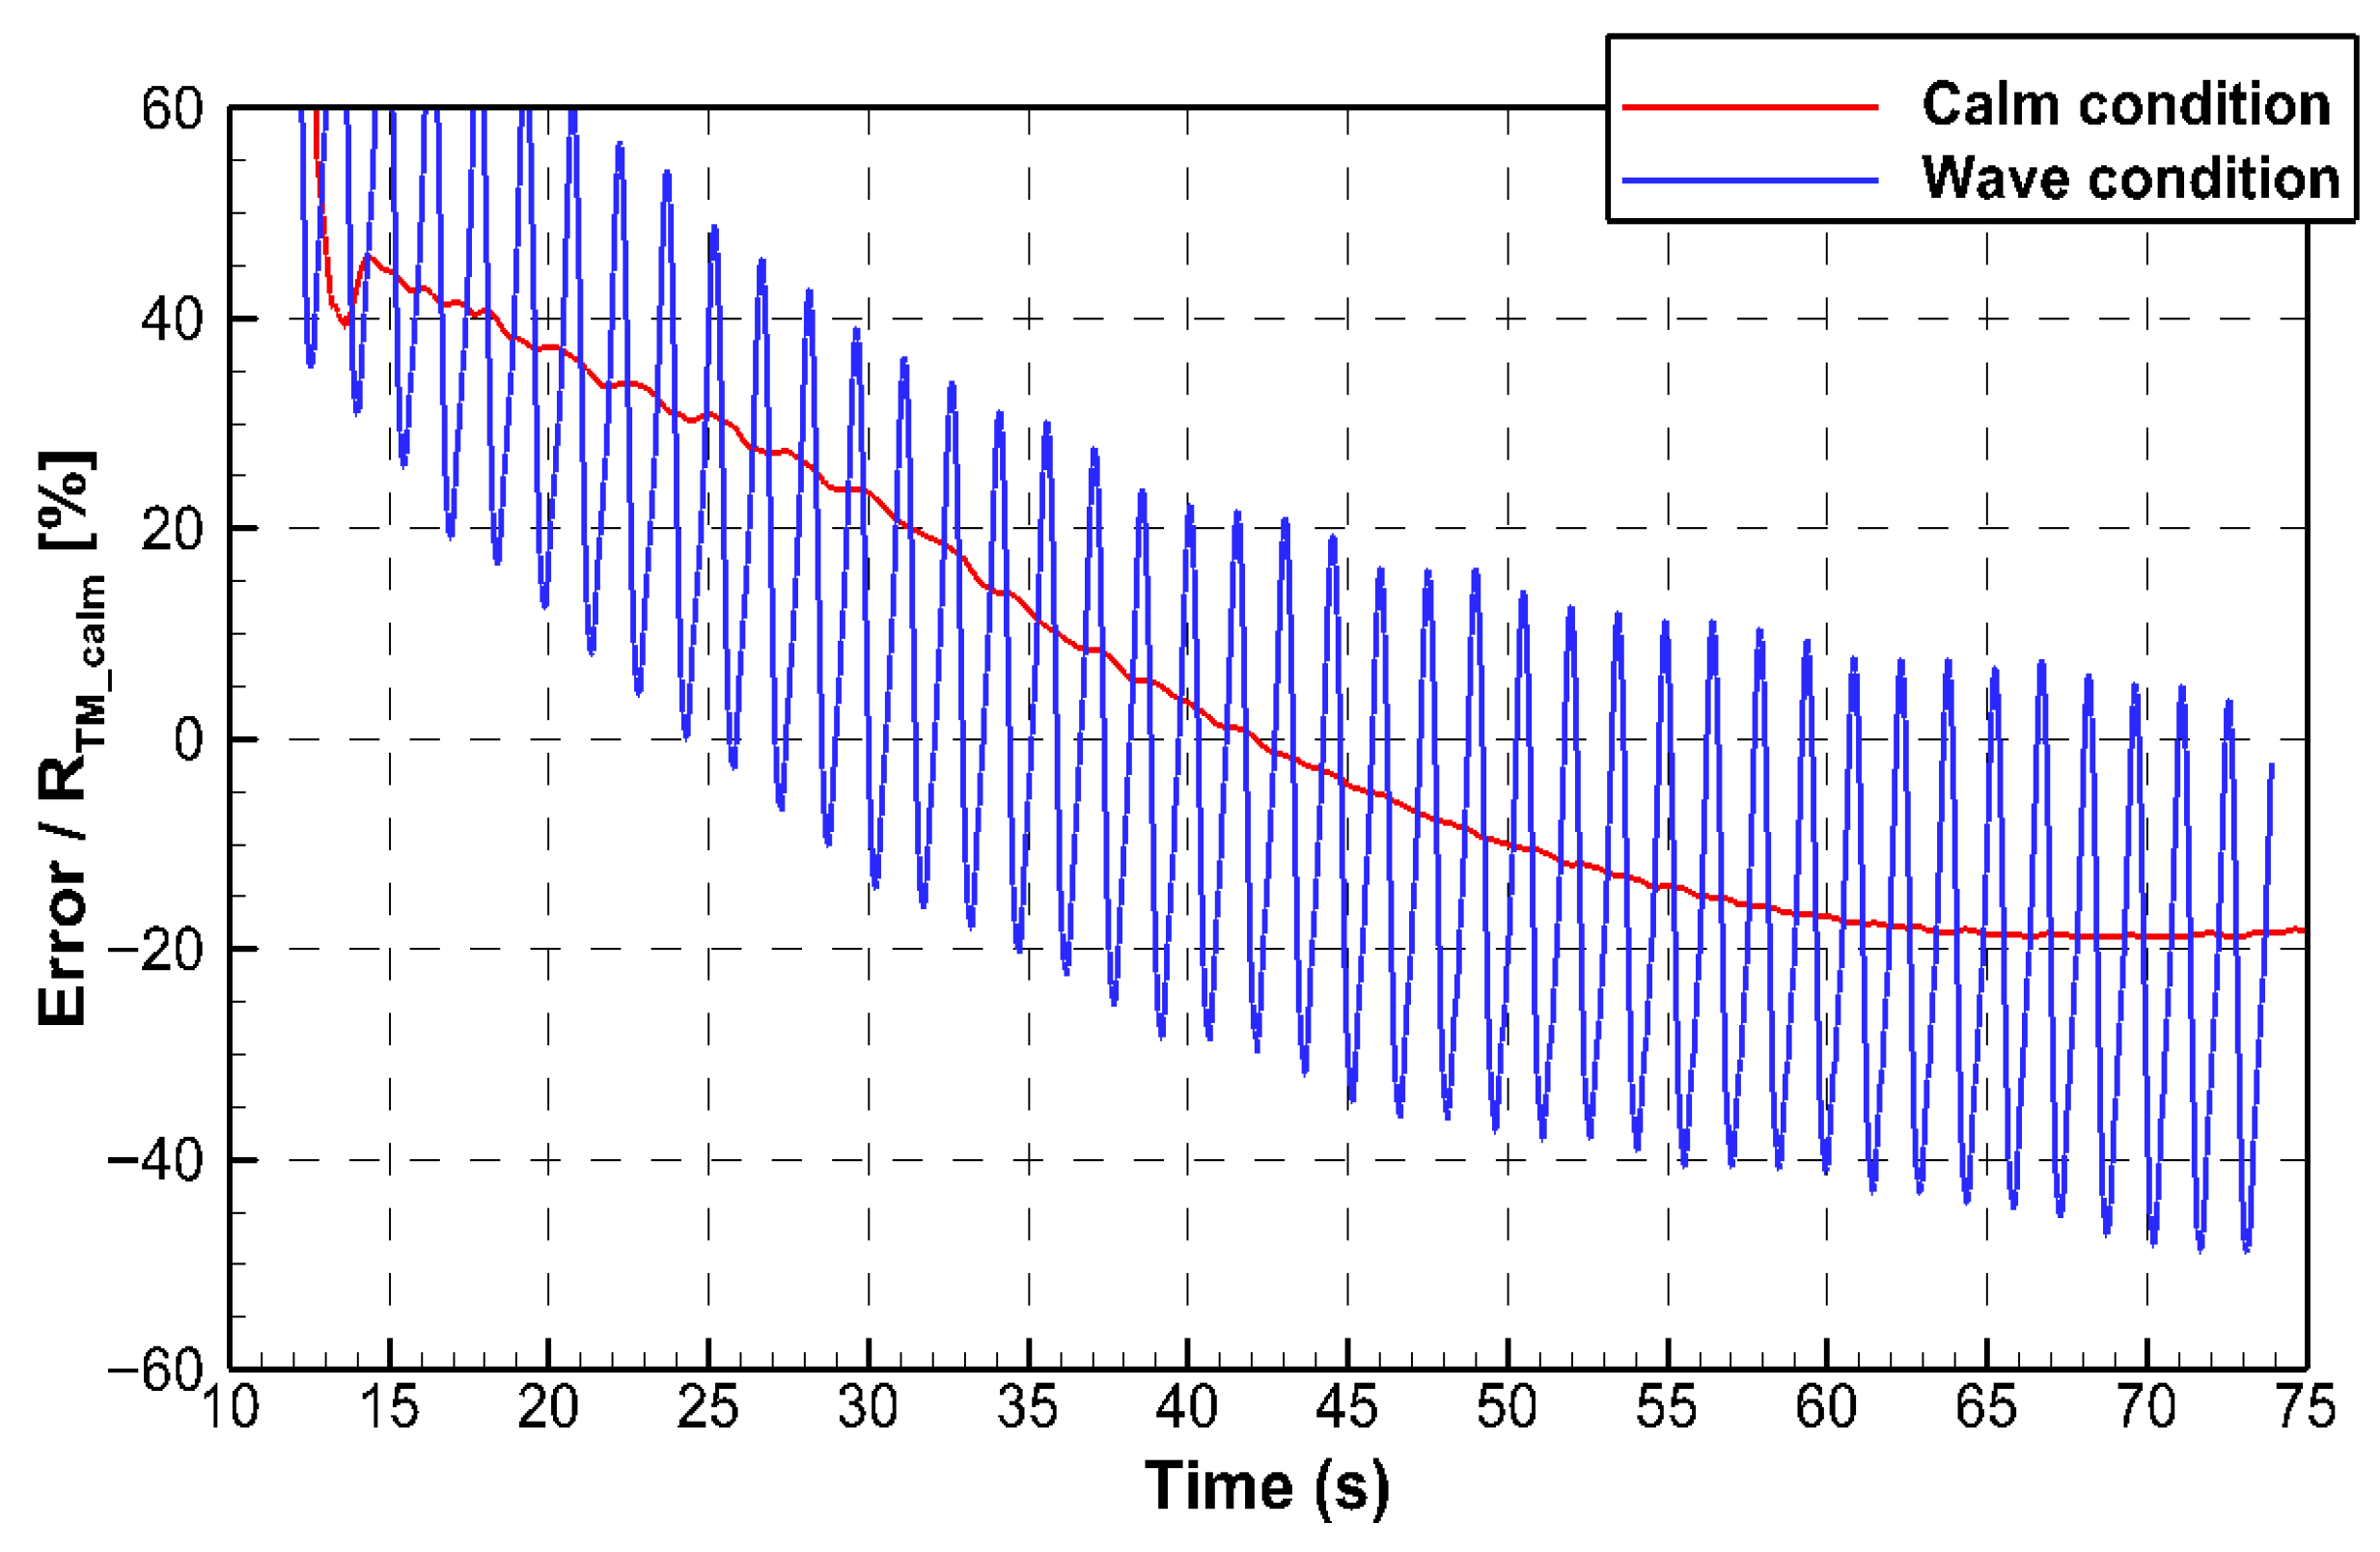
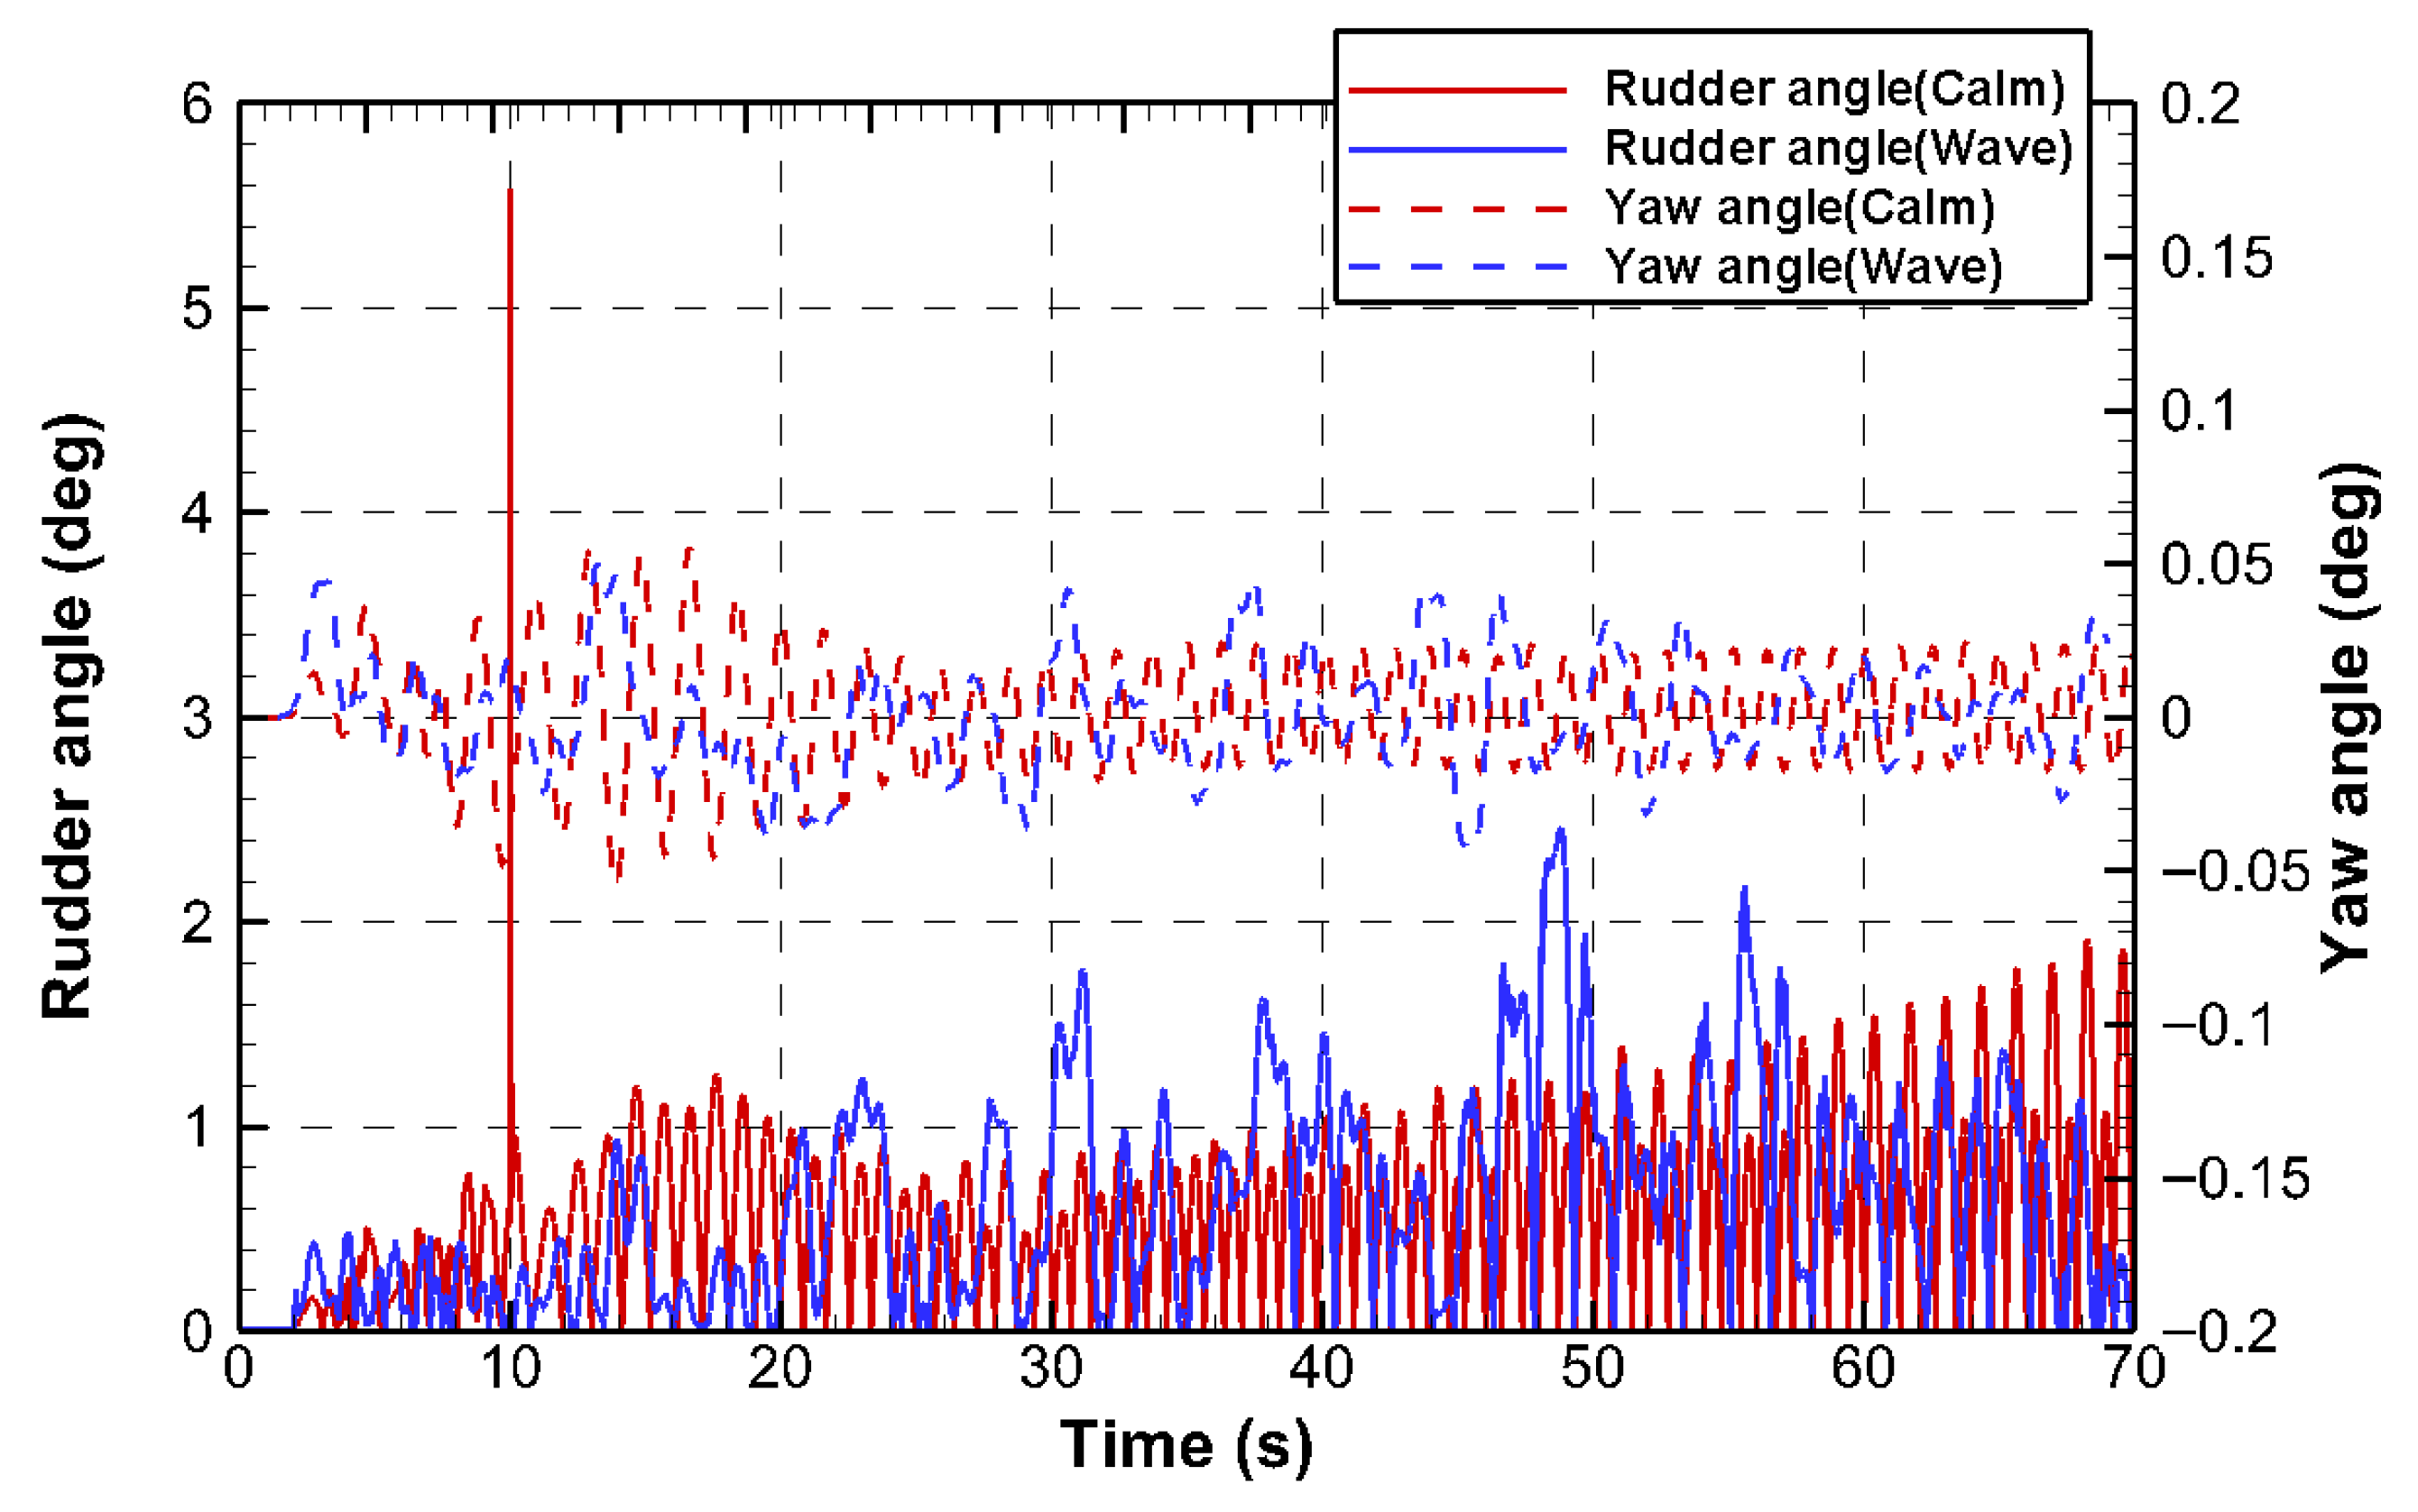
Ultimately, when applying the same rudder and revolution PID control coefficients, the revolution control did not fully reach the target error value of zero under calm water and wave conditions. Instead, it converged with an approximate 20% error, as shown in Figure 25. In contrast, rudder control showed a stable trend despite the different scale ratios, with the yaw angle converging to zero, as shown in Figure 26.
This study applied PID control to maintain the ship in a self-propelled state. The equation used for revolution control is expressed as Equations (13) and (14). Here, n represents the propeller rotational speed while n 0 denotes the initial rotational speed. The parameters K P p r o p , T i p r o p , and T d p r o p correspond to the proportional, integral, and derivative coefficients for revolution control, respectively. In addition, e represents the error between the target and actual rotational speed, which is defined as the difference between total resistance and thrust.
  n = n 0 ( 1 + K P p r o p e + T i p r o p 0 t e d t + T d p r o p e ˙ )
e = T o t a l   r e s i s t a n c e T h r u s t [ N ]
The equation used for rudder angle control is expressed in Equation (15), where δ represents the current rudder angle. The parameters K P r u d , T I r u d , and T D r u d correspond to the proportional, integral, and derivative coefficients for rudder angle control, respectively. ψ represents the error between the target and the actual rudder angle, which corresponds to the yaw angle.
δ = K P r u d ψ + T i r u d 0 t ψ d t + T i r u d ψ ˙
ψ = y a w   a n g l e   [ d e g ]
The standard condition (scale ratio = 24) was defined as λ2 to non-dimensionalize the PID control gain values with respect to scale ratio variations. This approach allows for determination of the PID control gain values under different scale ratios using a simple formula, provided that well-calibrated PID control gains are available for reference conditions. Accordingly, the rudder and revolution PID control coefficients were formulated, and the corresponding equations are expressed as Equations (17)–(22).
K P r u d _ 2 = K P r u d _ 1
T i r u d _ 2 = T i r u d _ 1 ( λ 2 λ 1 ) 1 / 2
T d r u d _ 2 = T d r u d _ 1 ( λ 1 λ 2 ) 1 / 2
K i p r o p _ 2 = K i p r o p _ 1 ( λ 2 λ 1 ) 3
T i p r o p _ 2 = T i p r o p _ 1 ( λ 1 λ 2 ) 5 / 2
T d p r o p _ 2 = T d p r o p _ 1 ( λ 1 λ 2 ) 7 / 2
These equations enable the application of PID control gain values to different scale ratios, provided that well-calibrated values have been determined for a reference condition. This method ensured a stable and effective tuning of rudder and revolution PID control coefficients under varying scale ratios when the target values were set, as in Equations (14) and (16). Table 12 lists the PID control gain values obtained for the scale ratio = 40.42 using the above equations. Figure 27 and Figure 28 show the resulting error in calm water and the time series of the rudder and yaw angle.
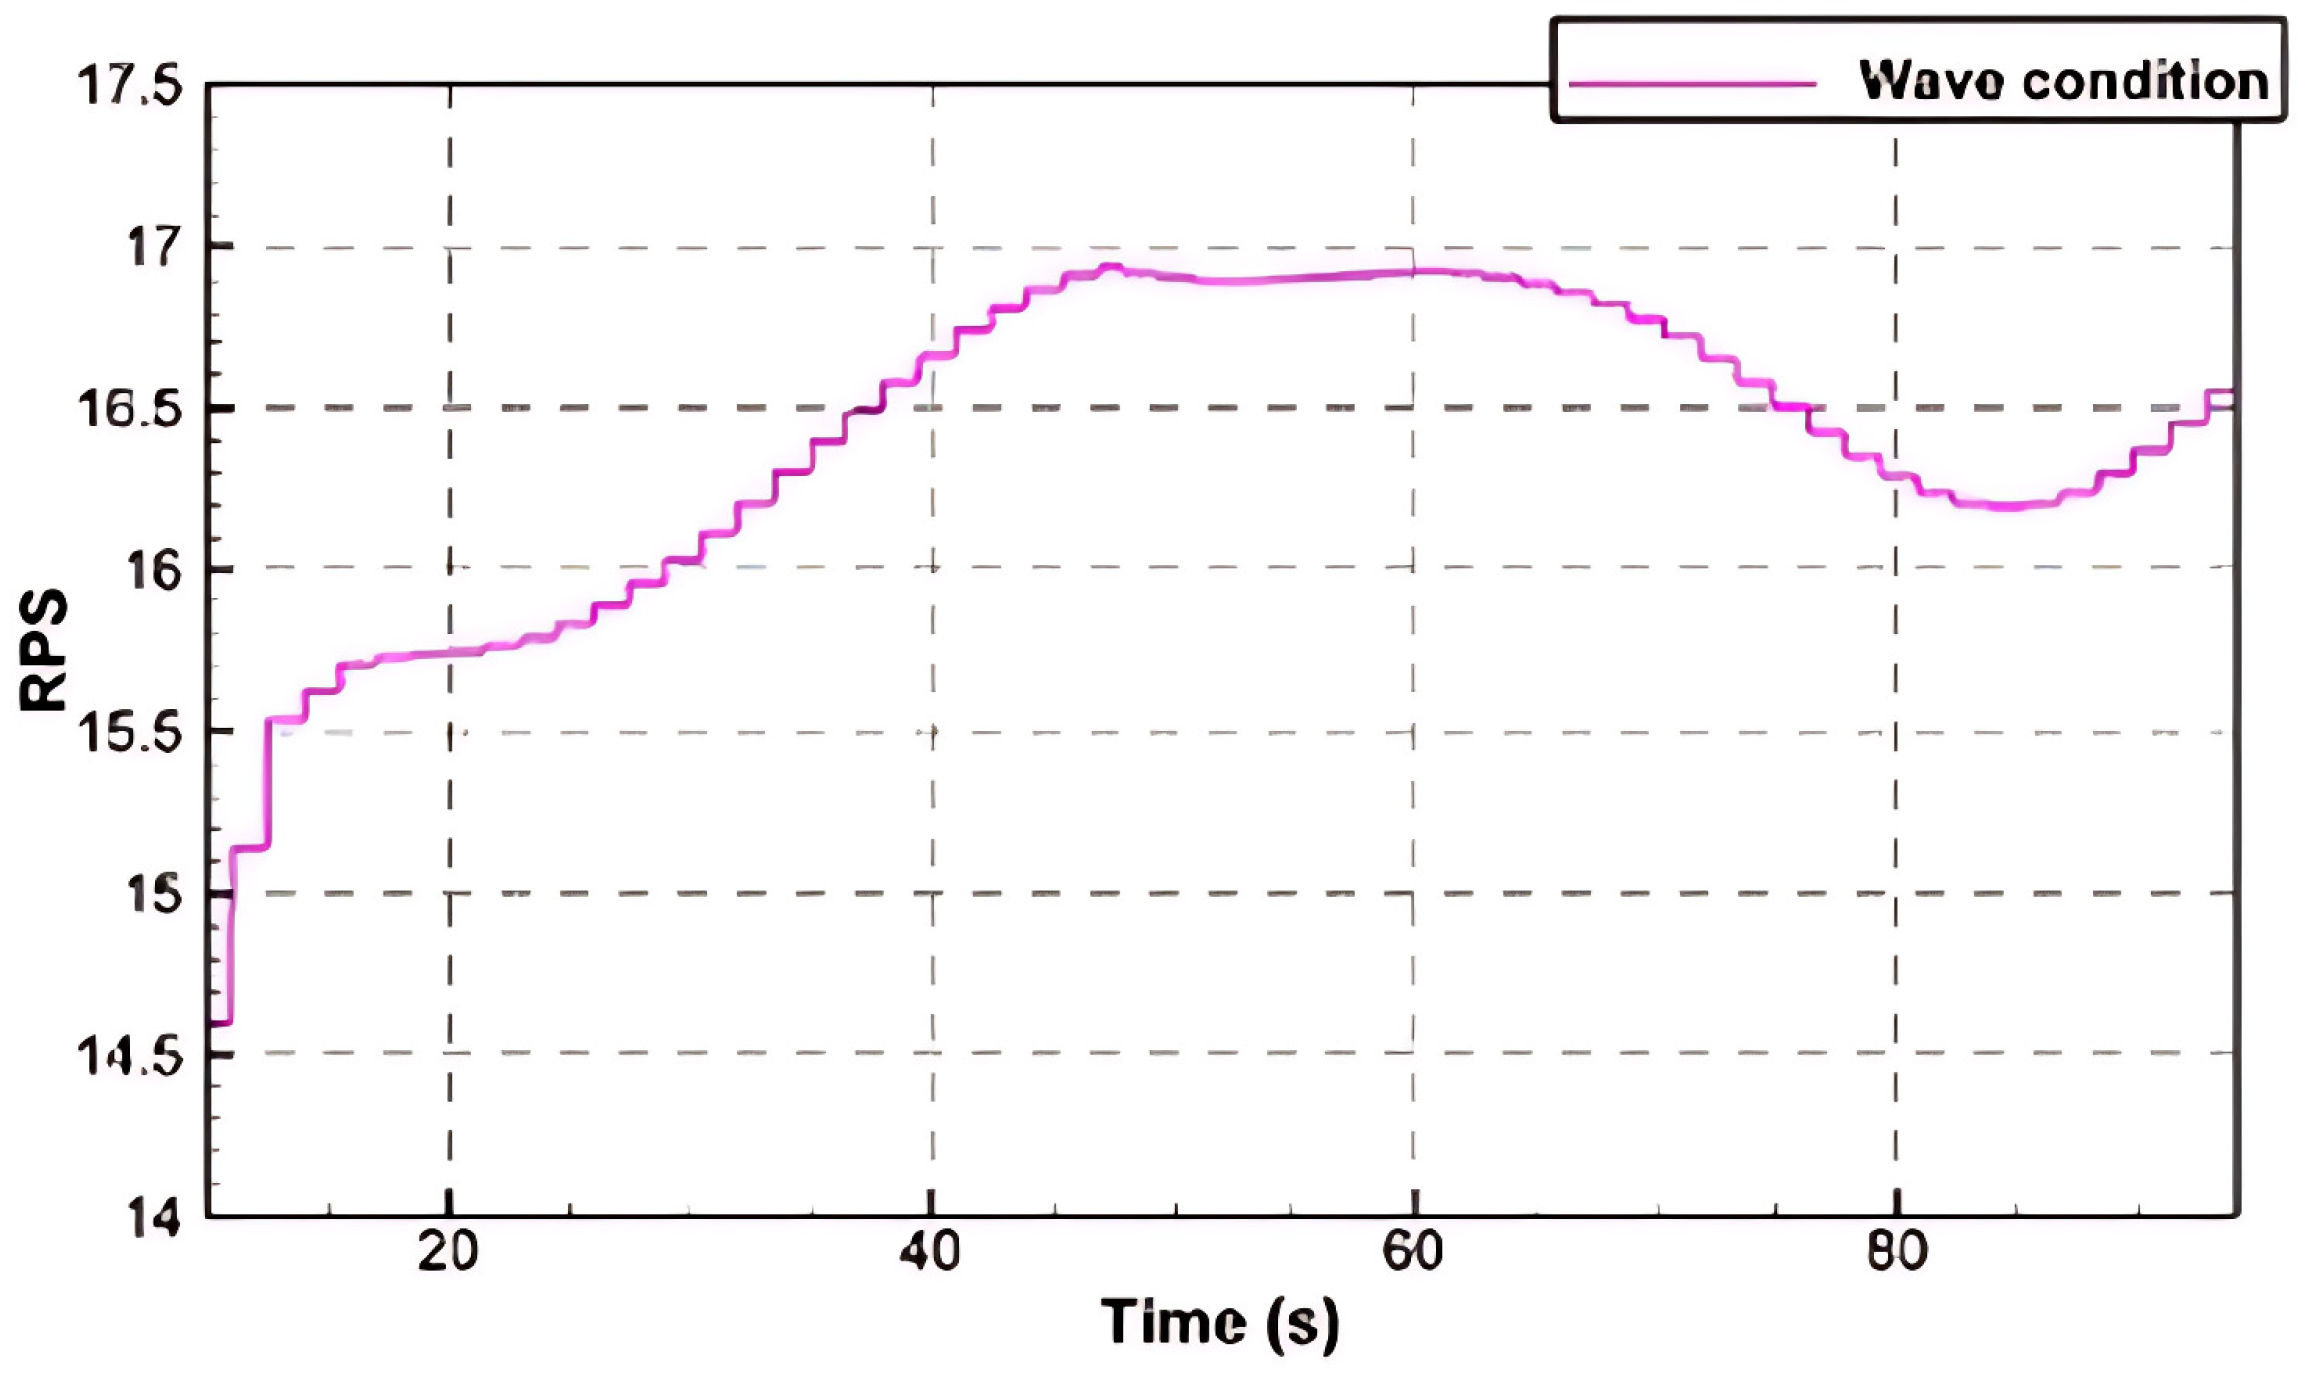
Under calm water conditions, the application of PID control coefficients derived using the scale ratio formula resulted in a stable convergence of the error value to zero. In addition, the rudder and yaw angles exhibited minimal fluctuations and converged to the target yaw angle = 0, confirming the feasibility of applying the scale ratio formula under calm water conditions. Figure 29 and Figure 30 show the time series of error values under wave conditions obtained using the PID control coefficients from Table 12. In revolution control, the system did not immediately reach the target error (error = 0). On the other hand, the mean error variation under wave conditions exhibited oscillations but eventually converged to zero, as shown in Figure 31. Figure 30, which illustrates the real-time variations in RPS, shows that the RPS oscillate around the target value of RPS = 0. In revolution control, smaller scale ratios result in smaller variations with a larger impact on the error because the error is defined as the difference between the total resistance and thrust, leading to a slower convergence rate.
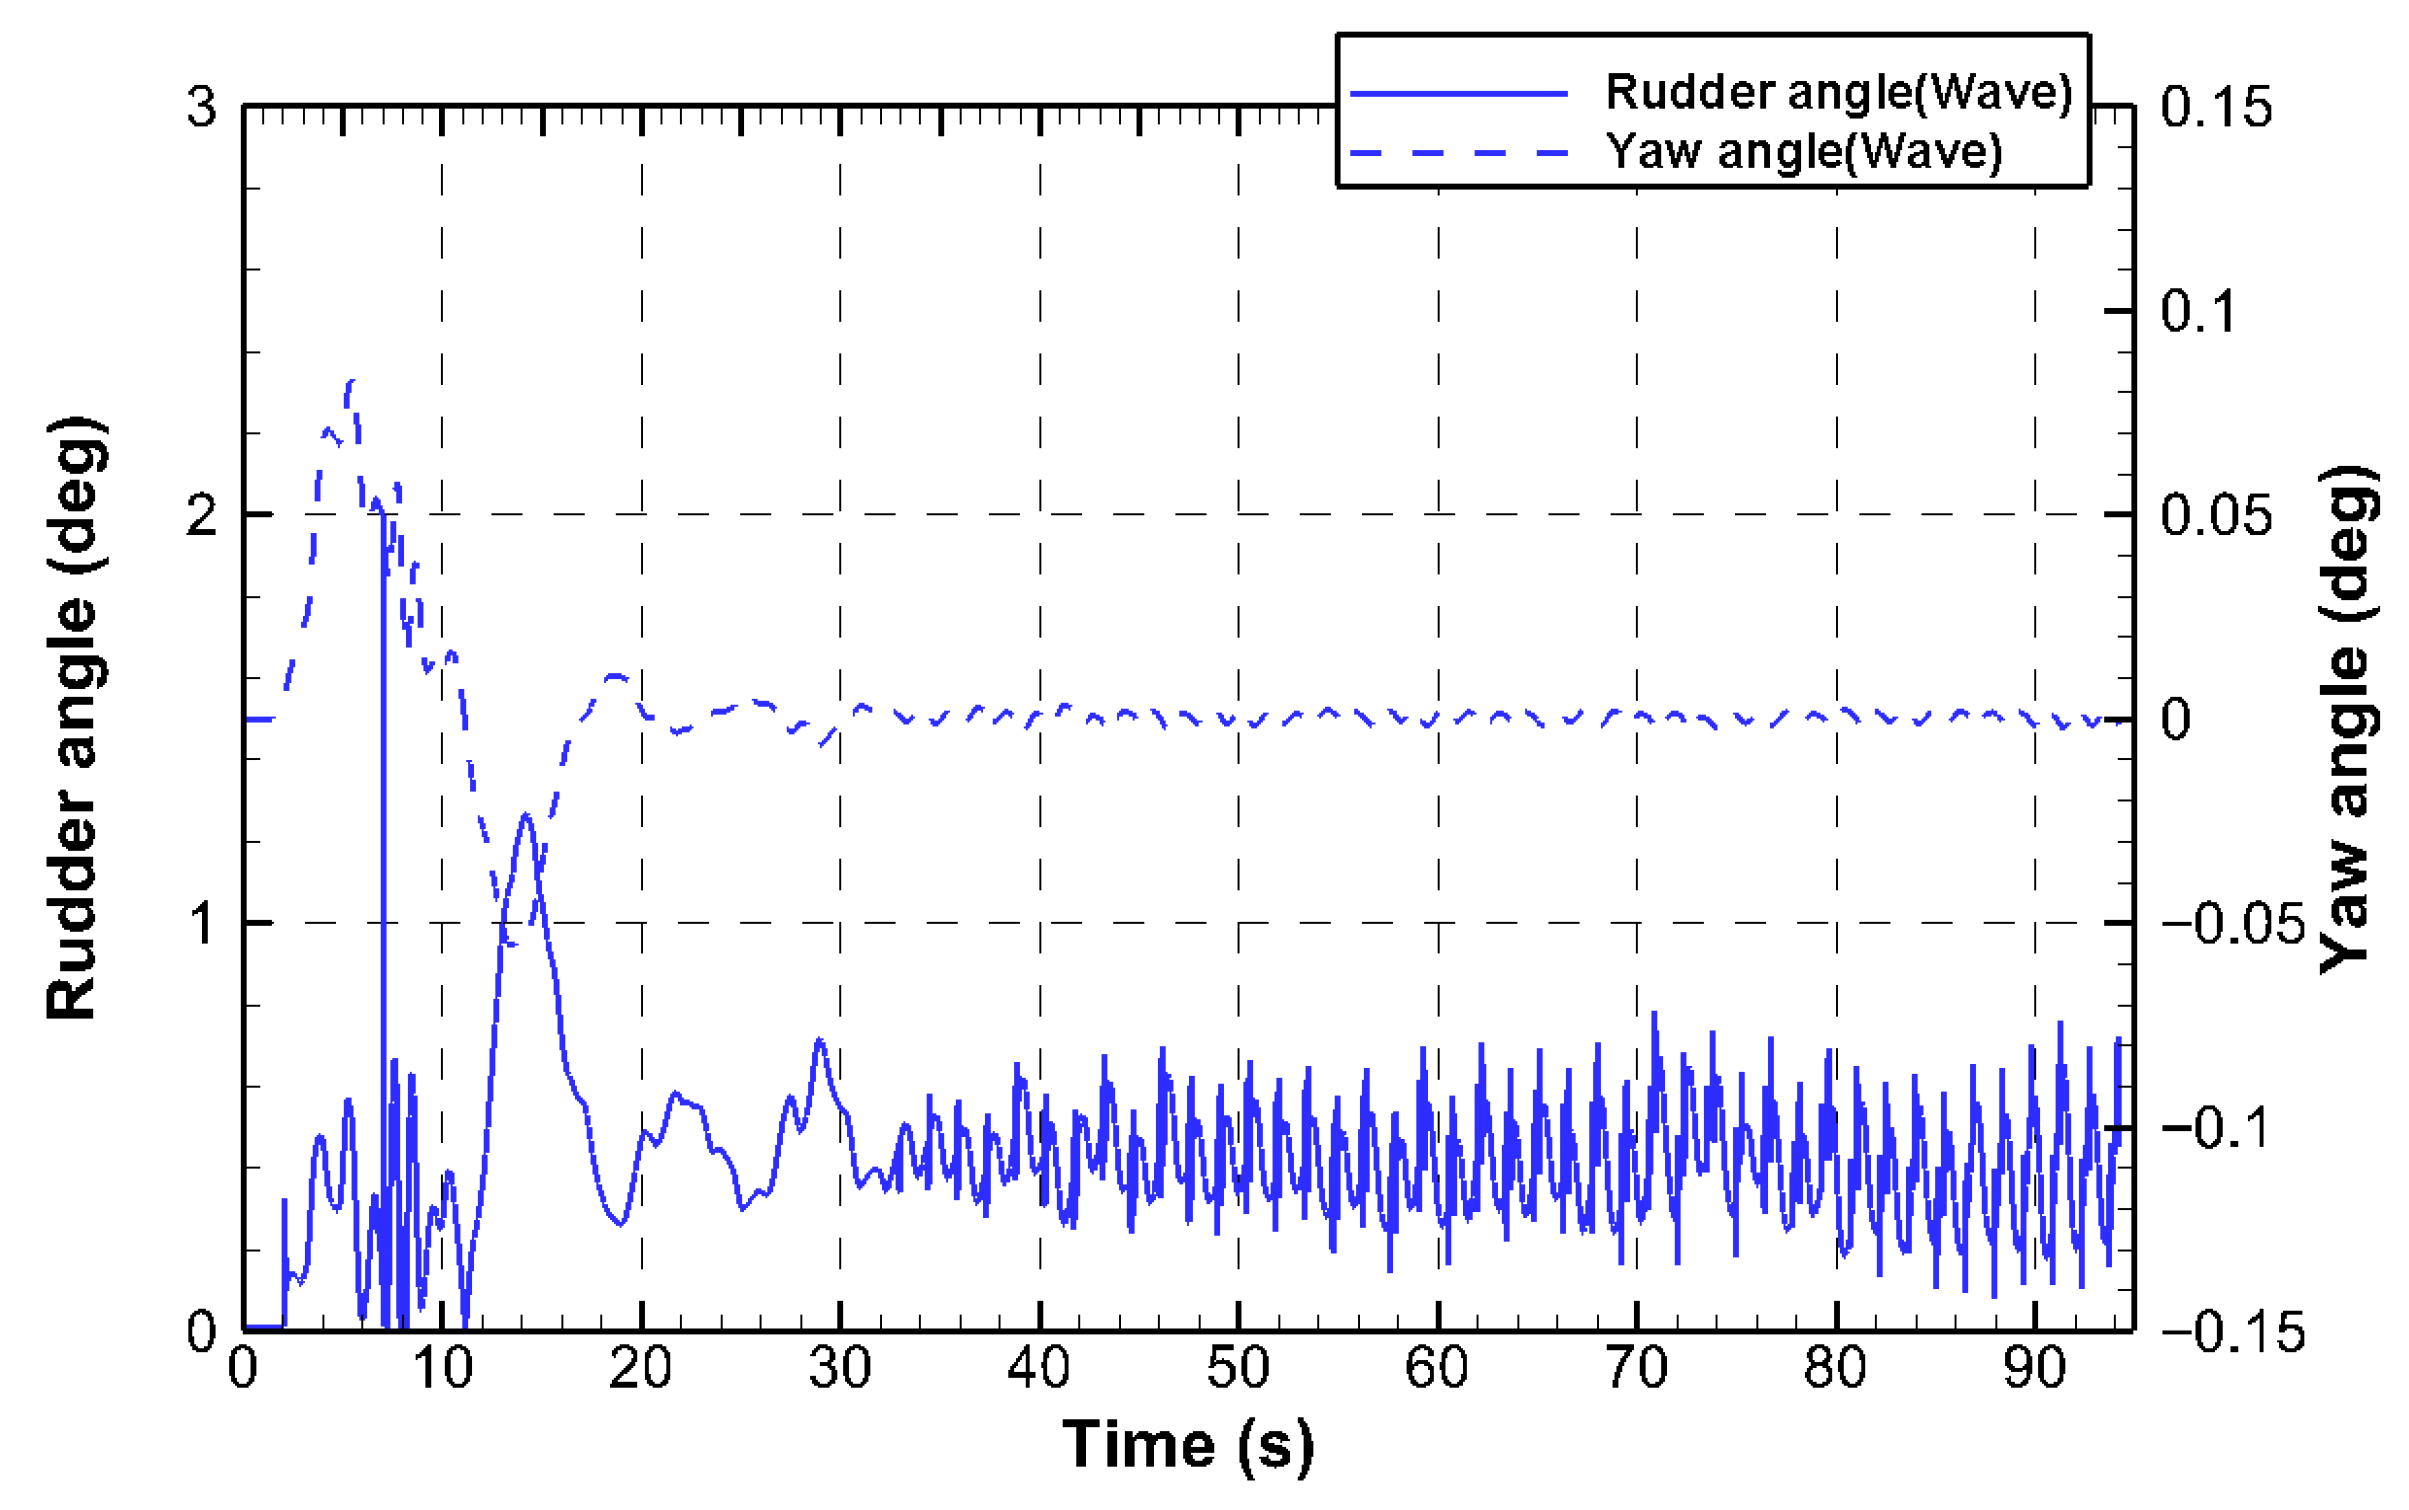
Figure 32 shows the time series of the rudder and yaw angle values under wave conditions obtained using the PID control coefficients from Table 12. For rudder angle control, the PID control coefficients derived considering scale ratio and those obtained under standard conditions showed stable trends, with the yaw angle successfully converging to zero in both cases. Specifically, Figure 32 shows rapid fluctuations in the rudder angle with a small amplitude. These fluctuations indicate that the PID controller is highly sensitive to minor deviations. Within the simulation’s resolution limits, such small-amplitude, high-frequency fluctuations can be interpreted as fine adjustments occurring during active rudder control in real ships. The effect of the PID control coefficients on rudder control aimed at maintaining straight-line performance is therefore considered relatively insignificant.

4. Conclusions

This study analyzed the characteristics of rudder and revolution PID control gains under various operational conditions in free-running simulations. The rudder and revolution control systems were implemented within the commercial CFD software STAR-CCM+, and PID control coefficients were systematically compared across different simulation environments. For stable revolution control, the ‘Simulation Operation Method’ was applied to implement interval-based feedback, and the ‘Ziegler–Nichols Method’ was used to establish a standardized tuning procedure.
The PID control gains derived under the medium wave standard condition showed stable oscillation amplitudes and successful convergence to the target values when applied to simulations under short wave and long wave conditions. In addition, low-speed simulations conducted at 9 knots (Fr = 0.1067) showed that the same PID coefficients resulted in smaller oscillation amplitudes and faster convergence compared to the design speed condition (14.5 knots), confirming the robustness of the derived gains across different speeds.
By varying only the PID period while keeping the PID gains constant, it was found that a control period corresponding to a propeller rotate count of 13.89 (based on the self-propulsion point) resulted in the fastest convergence to the desired target. Both revolution and rudder control showed convergence toward zero error and zero yaw angle with stable oscillation. For rudder control, the PID coefficients determined under the standard condition produced stable rudder angle behavior and consistent convergence of the yaw angle to zero under all conditions tested, indicating that a single set of rudder PID gains is applicable across a wide range of simulation scenarios.
Simulations were performed to assess scalability by modifying only the scale ratio to 40.42. While rudder control showed stable convergence of the yaw angle to zero, revolution control exhibited approximately 20% deviation in error convergence, indicating limitations when applying the original PID gains directly. A non-dimensional scaling formula was proposed to address this. Applying PID coefficients recalibrated by this formula restored stable oscillations around the target values of error = 0 and yaw angle = 0.
This study utilized the Ziegler–Nichols method as an initial estimation and standardized tuning procedure for PID control coefficients, verifying its validity through simulations conducted under various frequencies and wave conditions. However, there is a need to improve the accuracy and effectiveness of PID tuning by integrating more systematic and robust control design methods, such as mathematical model-based optimization techniques or adaptive control, rather than relying solely on empirical approaches.

Author Contributions

Conceptualization, K.-J.P.; methodology, K.-J.P. and H.-S.K.; investigation, J.-H.A. and H.-S.K.; formal analysis, J.-H.A.; software, J.-H.A. and H.-S.K.; data curation, J.-H.A. and H.-S.K.; writing—original draft, J.-H.A. and H.-S.K.; writing—review and editing, J.-H.A., H.-S.K. and K.-J.P.; supervision, K.-J.P.; funding acquisition, K.-J.P. All authors have read and agreed to the published version of the manuscript.

Funding

This research was supported by an INHA UNIVERSITY Research Grant (74055).

Data Availability Statement

Data are contained within the article.

Conflicts of Interest

The authors declare no conflicts of interest. The funders had no role in the design of the study; in the collection, analyses, or interpretation of data; in the writing of the manuscript; or in the decision to publish the results.

References

  1. Richter, F. The Steep Rise in Global Seaborne Trade. Statista, 16 October 2019. Available online: https://www.statista.com/chart/24527/total-volume-of-global-sea-trade/ (accessed on 7 March 2025).
  2. Resolution MSC.137(76); Standards for Ship Manoeuvrability. International Maritime Organization (IMO); Maritime Safety Committee: London, UK, 2002.
  3. SIMMAN 2020 Workshop. Available online: http://simman2020.kr (accessed on 30 March 2025).
  4. Okuda, R.; Qiu, W.; Yamashita, K.; Arai, M.; Kitada, K.; Ohara, K.; Kinoshita, T.; Fukasawa, T. Study of shallow-water effects on ship maneuverability without external disturbances. J. Mar. Sci. Technol. 2025, 30, 123–135. [Google Scholar] [CrossRef]
  5. Im, N.; Seo, J.-H. Ship manoeuvring performance experiments using a free running model ship. TransNav 2010, 4, 325–330. [Google Scholar] [CrossRef]
  6. Eloot, K.; Vantorre, M.; Verwilligen, J. Validation of ship manoeuvring in shallow water through free running model tests. In Proceedings of the ASME 2015 34th International Conference on Ocean, Offshore and Arctic Engineering (OMAE2015), St. John’s, NL, Canada, 31 May–5 June 2015; ASME: New York, NY, USA, 2015. [Google Scholar]
  7. Kim, D.; Song, S.; Tezdogan, T. Free Running CFD Simulations to Investigate Ship Manoeuvrability in Waves. Ocean Eng. 2021, 236, 109567. [Google Scholar] [CrossRef]
  8. Kim, I.-T.; Lee, J.; Kim, D.; Kim, J. Free-running CFD simulations to assess a ship-manoeuvring control method with motion forecast in waves. Ocean Eng. 2023, 275, 114250. [Google Scholar] [CrossRef]
  9. Woo, S.-C.; Hwang, J.-S. An experimental study on the manoeuvrability of a ship in heeled condition. J. Soc. Nav. Archit. Korea 2019, 56, 273–280. [Google Scholar]
  10. Yoon, H.-K.; Lee, G.-J.; Son, N.-S.; Yang, Y.-H. Development of free running model ship for evaluation of the performance of anti-rolling devices. J. Korean Soc. Nav. Archit. 2004, 28, 33–39. [Google Scholar]
  11. Yun, K.; Choi, H.; Kim, D.J. An Experimental Study on the Manoeuvrability of KCS with Different Scale Ratios by Free Running Model Test. J. Soc. Nav. Archit. Korea 2021, 58, 415–423. [Google Scholar] [CrossRef]
  12. Lee, J.-H.; Kim, Y.; Kim, B.-S.; Gerhardt, F. Comparative study on analysis methods for added resistance of four ships in head and oblique waves. Ocean Eng. 2021, 236, 109552. [Google Scholar] [CrossRef]
  13. Paramesh, S.; Rajendran, S. A Unified Seakeeping and Manoeuvring Model with a PID Controller for Path Following of a KVLCC2 Tanker in Regular Waves. Appl. Ocean Res. 2021, 116, 102860. [Google Scholar] [CrossRef]
  14. Roberts, G.N. Trends in Marine Control Systems. Annu. Rev. Control 2008, 32, 263–269. [Google Scholar] [CrossRef]
  15. Kwon, Y.; Park, S.; Lee, J. PID Compensating Model for Design of Ship’s Autopilot. In Proceedings of the 2016 16th International Conference on Control, Automation and Systems (ICCAS), Gyeongju, Republic of Korea, 16–19 October 2016; pp. 1337–1339. [Google Scholar]
  16. Zhang, C.; Wan, L.; Liu, Y. Ship Heading Control Based on Fuzzy PID Control. In Proceedings of the 2019 19th International Conference on Control, Automation and Systems (ICCAS), Jeju, Republic of Korea, 15–18 October 2019; pp. 607–612. [Google Scholar]
  17. Tomera, M. Fuzzy Self-Tuning PID Controller for a Ship Autopilot. In Proceedings of the 12th International Conference on Marine Navigation and Safety of Sea Transportation (TRANSNAV 2017), Gdynia, Poland, 21–23 June 2017; pp. 93–103. [Google Scholar]
  18. Wilcox, D.C. Turbulence Modeling for CFD, 3rd ed.; DCW Industries: La Cañada, CA, USA, 2006. [Google Scholar]
  19. Patankar, S.V. A calculation procedure for heat, mass and momentum transfer in three-dimensional parabolic flows. Int. J. Heat Mass Transf. 1972, 15, 1787–1806. [Google Scholar] [CrossRef]
  20. Hirt, C.W.; Nicholls, B. Volume of Fluid (VOF) Method for the Dynamics of Free Boundaries. J. Comput. Phys. 1981, 39, 201–225. [Google Scholar] [CrossRef]
  21. Bakica, A.; Gatin, I.; Vukčević, V.; Jasak, H.; Vladimir, N. Accurate assessment of ship-propulsion characteristics using CFD. Ocean Eng. 2019, 175, 149–162. [Google Scholar] [CrossRef]
  22. Simens. STAR-CCM+ User Guide, Version 16.06; Simens: Munich, Germany, 2021. [Google Scholar]
  23. Lee, S.H.; Paik, K.-J.; Kim, M.-M.; Hwang, S. A numerical study on estimation of ship performance under actual sea conditions considering added resistance and power of various wave conditions. Ocean. Eng. 2025, 340, 122340. [Google Scholar] [CrossRef]
  24. Kim, G.-H.; Hwang, S.; Lee, S.-H.; Lee, J.-H.; Hwangbo, J.; Kim, K.-S.; Paik, K.-J. A Numerical Study on the Performance of the 66k DWT Bulk Carrier in Regular and Irregular Waves. J. Mar. Sci. Eng. 2023, 11, 1913. [Google Scholar] [CrossRef]
  25. Lee, J.-H.; Hwang, S.; Lee, Y.-Y.; Jin, W.-S.; Kim, M.-C. Self-Propulsion Factors for Minimum Propulsion Power Assessment in Adverse Conditions. J. Mar. Sci. Eng. 2025, 13, 595. [Google Scholar] [CrossRef]
  26. ITTC. 1978 ITTC Performance Prediction Method. ITTC Recommended Procedures and Guidelines 7.5-02-03-01.4. 2018. Available online: https://www.wartsila.com/encyclopedia/term/ittc-performance-prediction-method (accessed on 21 June 2025).
  27. Lee, C.-M.; Park, S.-C.; Yu, J.-W.; Choi, J.-E.; Lee, I. Effects of Diffraction in Regular Head Waves on Added Resistance and Wake Using CFD. Int. J. Nav. Archit. Ocean Eng. 2019, 11, 736–749. [Google Scholar] [CrossRef]
  28. Ziegler, J.G.; Nichols, N.B. Optimum Settings for Automatic Controllers. Trans. ASME 1942, 64, 759–768. Available online: www.driedger.ca (accessed on 15 June 2025). [CrossRef]
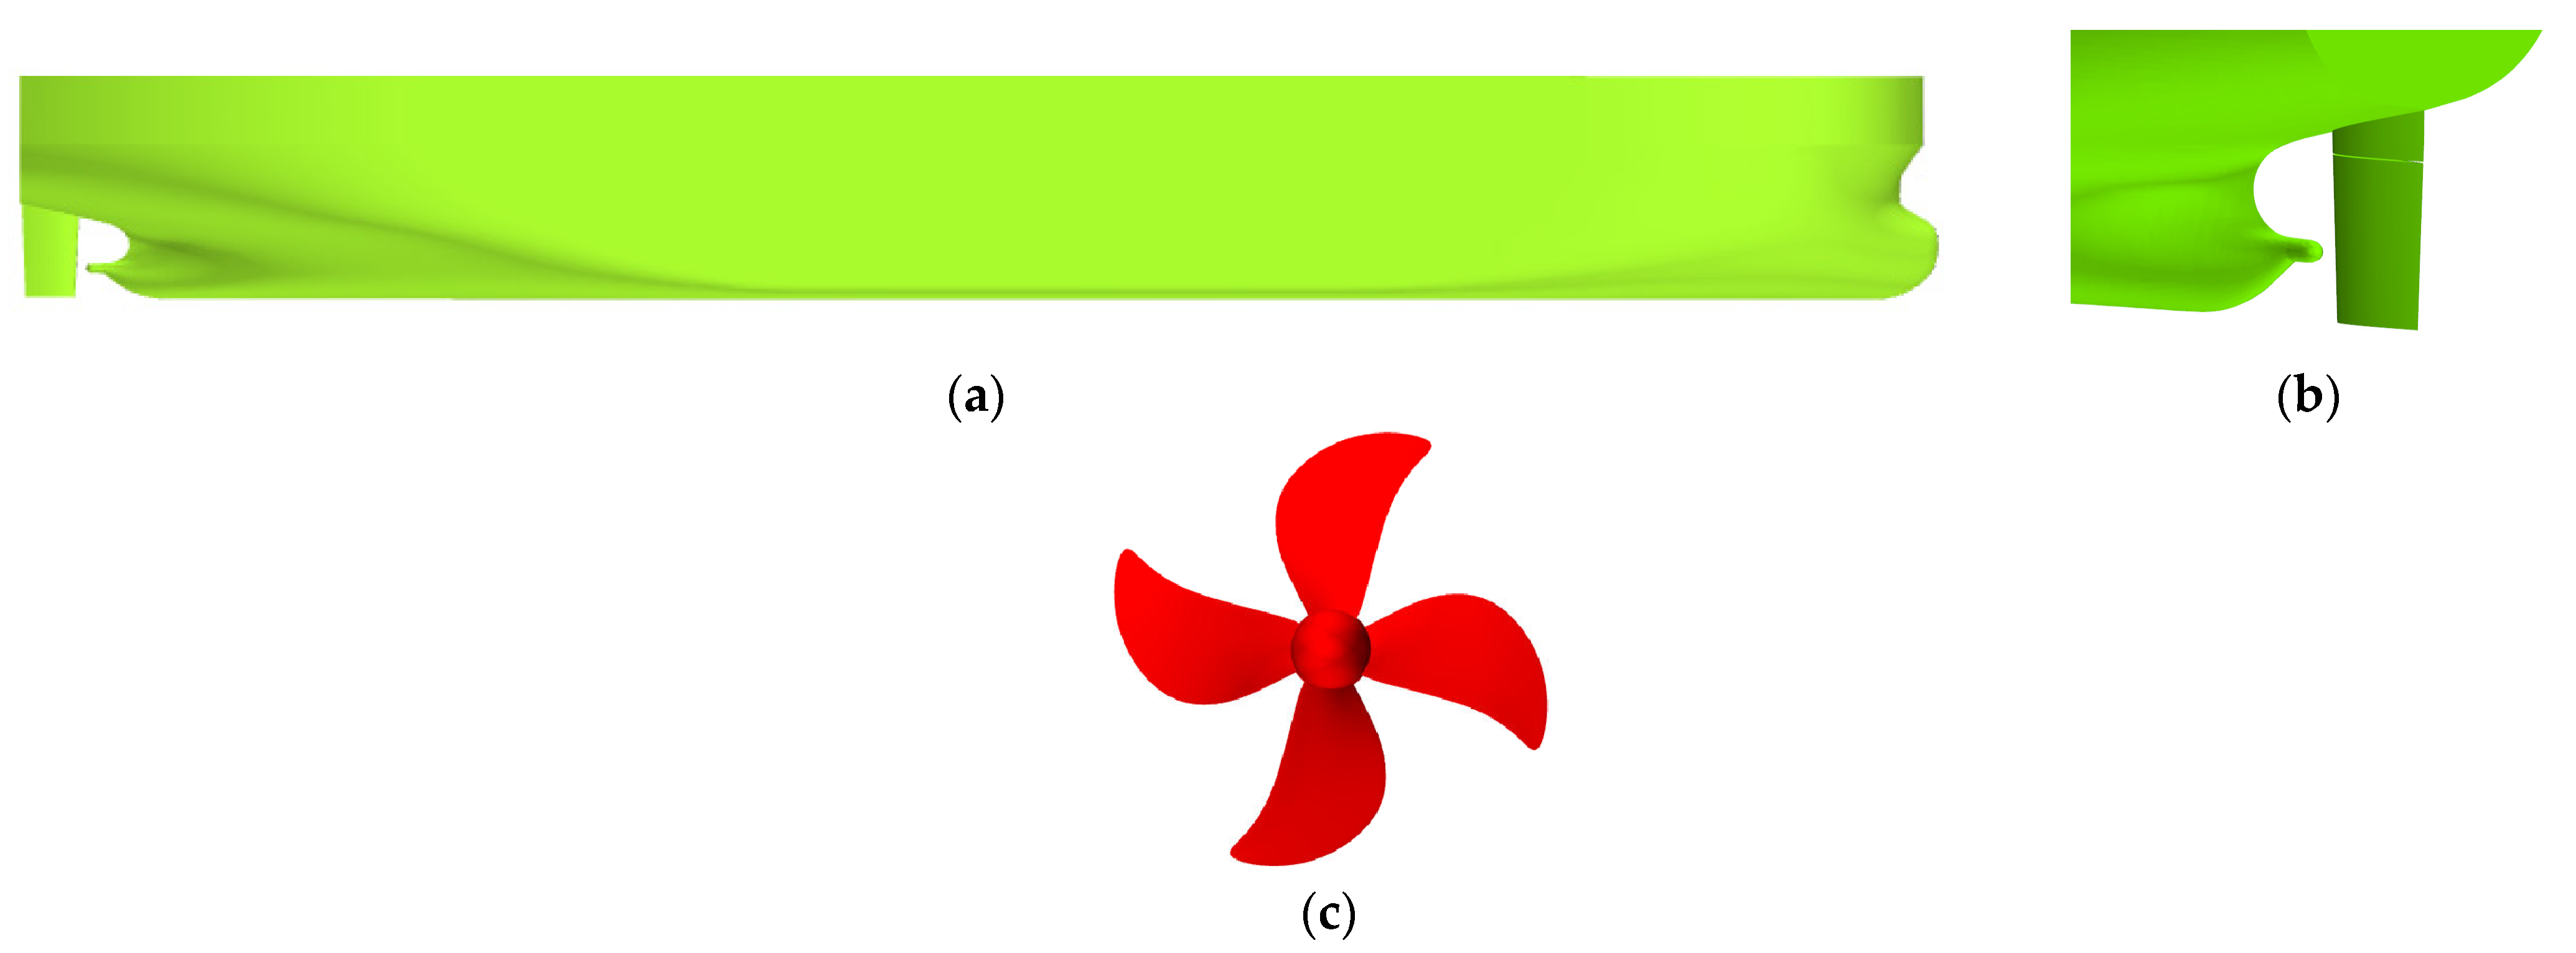
Figure 1. Target ship and propeller model geometry: (a) 66 k DWT K-Supramax hull; (b) rudder; (c) KP1306 propeller.
Jmse 13 01813 g001
Figure 2. Grid distribution and boundary condition for the resistance: (a) resistance domain; (b) free-running domain; (c) free-running test domain (side view).
Jmse 13 01813 g002
Figure 3. Grid distribution and boundary condition for the POW simulation.
Jmse 13 01813 g003
Figure 4. The resistance and motion in calm water: (a) resistance; (b) sinkage and trim.
Jmse 13 01813 g004
Figure 5. Comparison of the POW curves between the experiment and simulation.
Jmse 13 01813 g005
Figure 6. Comparison of the Qcriterion distribution in selfpropulsion analysis: (a) propeller rotating; (b) virtual disk.
Jmse 13 01813 g006
Figure 7. Validation of simulation results under regular wave conditions: (a) added resistance coefficients; (b) heave motion coefficients; (c) pitch motion coefficients (adapted from Refs. [12,24,27]).
Jmse 13 01813 g007
Figure 8. PID control coefficient tuning method based on sustained oscillation response curve.
Jmse 13 01813 g008
Figure 9. Method for determining the critical period ( P c r ) using the sustained oscillation response curve.
Jmse 13 01813 g009
Figure 10. Application process of the Ziegler–Nichols method for P gains of 0.1.
Jmse 13 01813 g010
Figure 11. Time series of the error variations according to P gain values.
Jmse 13 01813 g011
Figure 12. Time series of the rudder and yaw angle variations according to P gain changes.
Jmse 13 01813 g012
Figure 13. Time series of error values with varying P c r under the condition of P gain = 0.05.
Jmse 13 01813 g013
Figure 14. Time series of error values under calm and wave conditions using the final PID control gains.
Jmse 13 01813 g014
Figure 15. Time series of RPS under calm and wave conditions using the final PID control gains.
Jmse 13 01813 g015
Figure 16. Time series of rudder angles and yaw angles using the final PID control gains.
Jmse 13 01813 g016
Figure 17. Time series of error values under short wave condition according to revolution rate PID control gains.
Jmse 13 01813 g017
Figure 18. Time series of error values under long wave condition according to revolution rate PID control gains.
Jmse 13 01813 g018
Figure 19. Time series of error values according to propeller rotate count.
Jmse 13 01813 g019
Figure 20. Time series of RPS values according to propeller rotate count.
Jmse 13 01813 g020
Figure 21. Time series of rudder and yaw angles according to propeller rotate count.
Jmse 13 01813 g021
Figure 22. Time series of error values based on the ship speed conditions.
Jmse 13 01813 g022
Figure 23. Time series of RPS values based on the ship speed conditions.
Jmse 13 01813 g023
Figure 24. Time series of rudder and yaw angles based on the ship speed conditions.
Jmse 13 01813 g024
Figure 25. Time series of error values under different wave conditions for K-Supramax (scale ratio = 40.42).
Jmse 13 01813 g025
Figure 26. Time series of rudder and yaw angles for K-Supramax (scale ratio = 40.42).
Jmse 13 01813 g026
Figure 27. Time series of error values in calm water using PID control gains derived from the scale ratio formula.
Jmse 13 01813 g027
Figure 28. Time series of rudder and yaw angle in calm water using the PID control gains derived from the scale ratio formula.
Jmse 13 01813 g028
Figure 29. Time series of the error values under wave conditions using PID control gains derived from the scale ratio formula.
Jmse 13 01813 g029
Figure 30. Time series of the error mean values under wave conditions using PID control gains derived from the scale ratio formula.
Jmse 13 01813 g030
Figure 31. Time series of the RPS values under wave conditions using PID control gains derived from the scale ratio formula.
Jmse 13 01813 g031
Figure 32. Time series of the rudder and yaw angles under wave conditions using PID control gains derived from the scale ratio formula.
Jmse 13 01813 g032
Table 1. Principal particulars of the target ship.
ParticularsUnitFull ScaleModel Scale
Scale ratio, λ 124
Length   between   perpendiculars ,   L P P m1928
Breadth, B m361.50
Draft, T m11.20.47
Wetted surface area (w/rudder), S m2991217.0
Displacement, m365,0284.704
Block   coefficient ,   C B 0.840
Roll   radius   of   gyration ,   K x x 14.40.6
Yaw   radius   of   gyration ,   K Z Z 482
Design speed, V knots14.5
Table 2. Principal particulars of the target propeller.
ParticularsUnitFull ScaleModel Scale
Number of blades, Z 4
Diameter ,   D P m60.25
Pitch   ratio   ( 0.7 R P ) ,   P / D P 0.727
Thickness   ratio   ( 0.7 R P ) ,   t / D P 0.012
Chord   ratio ,   c / D P 0.266
Direction of rotationRight-handed
Table 3. Comparison of self-propulsion factors in calm water.
KRISO [EFD]Present [CFD]
Model Propeller
Present [CFD]
Virtual Disk
W T M 0.4370.418 (−4.3%)0.420 (−3.9%)
W T S 0.3520.346
t 0.2090.221 (5.7%)0.204 (−2.4%)
η H 1.2011.217
η R 1.0121.061 (4.8%)1.006 (−0.6%)
η O 0.5720.561
η B 0.5860.564
η D 0.7040.686
R P M 120.2119.5
E H P   [ k w ] 5592.385592.38
D H P   [ k w ] 7948.658147.10
Table 4. Wave conditions for added resistance analysis in regular waves.
2 DOF6 DOF
H / L P P = 0.00800 λ / L P P   = 0.3 ,   0.4 ,   0.5 ,   0.6 ,   0.7 ,   0.8 ,   0.9 ,   1.0 λ / L P P = 0.5 ,   1.0
H / L P P = 0.00667 λ / L P P   = 0.2 ,   1.1 ,   1.25 ,   1.4 ,   1.6 ,   2.0 λ / L P P = 1.25 ,   1.4 ,   1.6
Table 5. Ziegler–Nichols method for determining PID control coefficients.
K P T i T d
P 0.5 K c r 00
P I 0.45 K c r 1 / 1.2 P c r 0
P I D 0.6 K c r 0.5   P c r 0.125   P c r
Table 6. PID control gain values selected based on the gain-based application.
Rudder GainPropeller RPS Gain (P Gain = 0.05)
K P 0.02 K P 0.060
T i 1.00 T i 0.904
T d 5.00 T d 0.226
Table 7. Final PID control gains determined using the Ziegler–Nichols method under standard conditions.
Rudder GainPropeller RPS Gain (P Gain = 0.0141)
K P 0.02 K P 0.0600
T i 1.00 T i 0.0071
T d 5.00 T d 0.0018
Table 8. PID control gains for short wave condition ( λ / L P P =   0.5 ,   H / λ   = 0.008 ).
Standard Condition
( λ / L P P = 1.25 ,   H / λ = 0.008 )
Short Wave Condition
( λ / L P P = 0.5 ,   H / λ = 0.008 )
P c r / 2 7 0.0143 P c r / 2 7 0.0078
K P 0.0600 K P 0.0600
T i 0.0071 T i 0.0039
T d 0.0018 T d 0.0010
Table 9. PID control gains for short wave conditions ( λ / L P P = 0.5 ,   H / λ = 0.008 ).
Standard Condition
Propeller RPS Gain
( λ / L P P = 1.25 ,   H / λ = 0.008 )
Long Wave Condition
Propeller RPS Gain
( λ / L P P = 1.6 ,   H / λ = 0.008 )
Version 1Version 2
P c r / 2 7 0.0143 P c r / 2 7 0.01670.00780.0021
K P 0.0600 K P 0.06000.06000.0600
T i 0.0071 T i 0.00830.00390.0010
T d 0.0018 T d 0.00210.00100.0003
Table 10. PID control period according to propeller rotate count.
Degree [deg]Time [s]Propeller Rotate CountFixed StepPID Period [s]
P c r / 2 7 0.0143 P c r / 2 7 0.00786.726
K P 0.0600 K P 0.06002.093
T i 0.0071 T i 0.00391.495
T d 0.0018 T d 0.00100.299
Table 11. Total resistance coefficient (CTM) of K-Supramax in calm water at different scales.
Scale C T M × 10 3
INHA [CFD]24 ( L P P = 8.00 m)3.992 (0.73%)
40.42 ( L P P = 4.75 m)4.057 (−0.89%)
Table 12. PID control coefficients were derived using the scale ratio-based formulation (scale ratio = 40.42).
Rudder GainPropeller RPS Gain
K P 0.02000 K P 0.28662
T i 1.29775 T i 0.00193
T d 3.85281 T d 0.00029
Disclaimer/Publisher’s Note: The statements, opinions and data contained in all publications are solely those of the individual author(s) and contributor(s) and not of MDPI and/or the editor(s). MDPI and/or the editor(s) disclaim responsibility for any injury to people or property resulting from any ideas, methods, instructions or products referred to in the content.