Abstract
Marine soft clay is characterized by a high water content and low strength, exhibiting pronounced creep deformation under long-term loading that threatens the serviceability and durability of coastal infrastructure. Accordingly, this study develops a creep constitutive model that combines elastic, plastic, and viscous effects and quantitatively evaluates time-dependent deformation under varying water contents and stress levels to provide reliable prediction tools for tunnel, excavation, and pile-foundation design. Cyclic creep tests were carried out on reconstituted marine soft clay with water contents of 40–60% and stress ratios of 0.4–1.2 using a pneumatic, fully digital, closed-loop triaxial apparatus. A “nonlinear spring–Bingham slider–dual viscous dashpot in parallel with a standard Kelvin dashpot” element assembly was proposed, and the complete stress–strain relationship was derived. Experimental data were fitted with Python to generate a creep-strain polynomial and verify the model accuracy. The predicted–measured creep difference remained within 10%, and the surface-fit coefficient of determination reached R2 = 0.97, enabling rapid estimation of deformation for the given stress and time conditions. The findings offer an effective method for the precise long-term settlement prediction of marine soft clay and significantly enhance the reliability of the deformation assessments in coastal civil-engineering projects.
1. Introduction
Marine soft clay, extensively found in coastal zones, is characterized by a high water content, low shear strength and stiffness, and pronounced time-dependent deformation under sustained loads [1,2]. This creep behavior—governed by moisture content, void ratio, and stress history—can lead to excessive settlements, differential displacements, and stability failures in foundations, tunnels, and embankments. Existing rheological frameworks (e.g., Kelvin–Voigt, Burgers, Nishihara and Bingham models) often treat moisture content implicitly, neglect post-yield plasticity, or cannot capture multiple viscous time-scales, resulting in limited predictive accuracy and poor site-specific adaptability.
Creep is the time-dependent deformation of soils under sustained load and constitutes a critical aspect of soil mechanical behavior. Over recent decades, numerous constitutive models have been developed to describe and predict long-term soil deformation. These models are typically grouped into four categories: (1) rheological element models, which combine springs, dashpots, and sliders; (2) empirical models, derived solely from experimental curve-fitting; (3) semi-empirical/semi-theoretical models, which integrate theoretical frameworks with empirical calibration; and (4) yield-surface creep models, which incorporate plasticity theory alongside time-dependent hardening or softening mechanisms [3,4]. To capture marine clay behavior in Shanghai, Xu introduced the Fractional Derivative Merchant (FDM) model by embedding fractional elements into the classic Merchant formulation, yielding excellent agreement with laboratory creep tests [5]. Jozefiak K extended a one-dimensional sedimentation framework to account for overconsolidation, plastic deformation, and non-classical rheology, deriving new constitutive relationships between the effective stress, strain, and void ratio [6]. Zou SF proposed an elasto-plastic–viscoelastic model based on homotopy theory and the Nishihara model; this formulation introduces a novel viscoelastic element to represent delayed elastic deformation in marine clays, enabling evaluation of consolidation–creep coupling, strain-rate dependence, and stress relaxation [7]. Jerman J’s viscoelastic model further addresses strength anisotropy and rate effects via anisotropic asymptotic state boundary surfaces [8]. Building on the Merchant concept, Huang W developed a lateral-unloading creep model that effectively describes the soft-soil response under varying excess pore pressures [9]. Thermomechanical creep has also been studied: Huancollo HJM used a thermal triaxial apparatus to assess gain-drained shear strength and subsequent thermal creep of reorganized, normally consolidated clays from the Santos Basin [10]. Under cyclic loading, Coelho BZ hierarchically extended the Creep-SClay1S model to simulate long-term permanent deformation in natural soft clays [11], while Tahershamsi H introduced nonlinear small-strain stiffness for overconsolidated states and a modified cyclic stiffening law to improve the prediction of strain accumulation at low stress amplitudes [12]. Finally, fracture-mechanics approaches have been applied to creep characterization: Wang JJ determined the mode-I fracture toughness (K_IC) of compacted clays via notched bending tests [13]; Choo J analyzed shear fracture energy and the characteristic slip from triaxial tests on hard clays and shales [14]; and Tiennot M examined how clay-mineral expansion affects crack propagation by evaluating its influence on Young’s modulus and fracture toughness [15].
This study introduces a rheological-element model to describe the creep behavior of marine soft clay. The model consists of a nonlinear spring, in series with a Bingham slider, to capture both nonlinear elasticity and post-yield plastic flow. A double-layer viscous element is added in series to reproduce long-term creep under sustained loading, while a standard dashpot arranged in parallel with the spring–slider assembly accounts for the dominant viscous response during initial loading. This series–parallel configuration seamlessly integrates elasticity, plasticity, and time-dependent viscosity, yielding a flexible and accurate framework for simulating the complex mechanical response of marine soft clay. By representing all the key deformation mechanisms—elastic, plastic, creep, and viscous—the proposed model delivers a comprehensive characterization of soil behavior and a solid theoretical foundation for engineering analysis, design, and construction in marine soft clay settings.
2. Creep Testing of Marine Soft Clay
The creep characteristics of marine soft clay were investigated using a pneumatic fully digital closed-loop controlled cyclic triaxial testing system. The apparatus comprises a triaxial pressure chamber, axial deformation measurement system, axial load application system, data acquisition unit, and computer. Marine soft soil specimens were cored from the central borehole of a metro-station foundation pit in Shenzhen, Guangdong Province, China. The site, originally an intertidal mudflat, is overlain by reclaimed fill of variable thickness. Beneath the fill, the stratigraphy comprises Holocene marine soft clay, organic silty sand, and Upper Pleistocene alluvial soft clay with sandy interbeds. Samples were obtained at depths of 6.2–12.4 m, corresponding to the marine soft soil horizon. The soil’s mineral composition primarily includes quartz, feldspar, montmorillonite, kaolinite, and illite. Microstructurally, it exhibits honeycomb, spongy, and flocculated structures, with soil particles forming curved flake-like flocculated aggregates interspersed with abundant micropores. The clay demonstrates high sensitivity, an elevated water content, large void ratio, high compressibility, low strength, and low permeability, as summarized in Table 1 [16,17]. The maximum particle size was limited to 2 mm as per standard geotechnical practice (e.g., ASTM D2487-17 [18]). Soil particles larger than 2 mm (gravel-size particles) were removed prior to testing to ensure the uniformity and representativeness of the fine-grained marine soft soil samples. The particle-size distribution, characterized by high silt content with moderate clay and sand fractions, is typical of natural marine soft soil deposits.
2.1. Testing Methodology
The cyclic creep test was conducted according to the following procedure:
- (1)
- Specimen Preparation: Cylindrical specimens (61.8 mm in diameter, 125 mm in height) were prepared with five moisture content levels: 40%, 45%, 50%, 55%, and 60%.
- (2)
- Back-Pressure Saturation: Specimens were saturated under back pressure for 24 h. After saturation, the Skempton B-value was determined via an undrained loading step at a confining pressure of 100 kPa by monitoring the ratio of the pore-water pressure increment to the applied cell pressure increment. The average B-value obtained was 0.97 (range 0.96–0.98), confirming full saturation of all samples.
- (3)
- Specimen Installation: The specimen was positioned within the triaxial pressure chamber, ensuring minimal disturbance during handling. The sealed chamber was then initialized for testing.
- (4)
- Consolidation Phase: Isotropic consolidation was applied under a confining pressure of 100 kPa until pore pressure dissipation was achieved through drained consolidation.
- (5)
- Waveform Selection: A trapezoidal waveform was selected as the cyclic loading pattern (Figure 1), based on the characteristics of common low-frequency cyclic loading and the operational specifications of the testing apparatus.
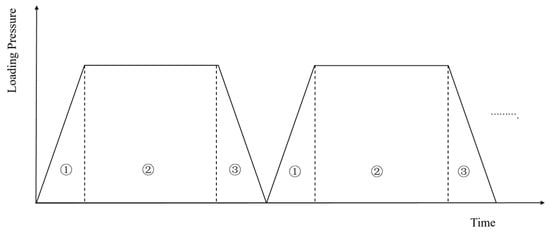 Figure 1. Schematic diagram of loading for creep test.
 - (6)
- Loading Protocol:
- ①
- The cyclic loading periods were set to 1 h and 24 h.
- ②
- The trapezoidal waveform comprised three phases (Figure 2):
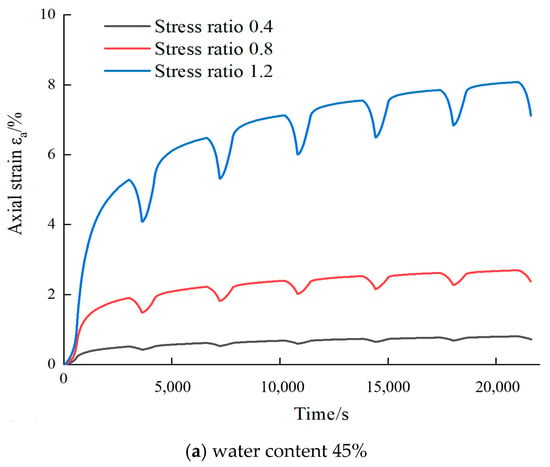
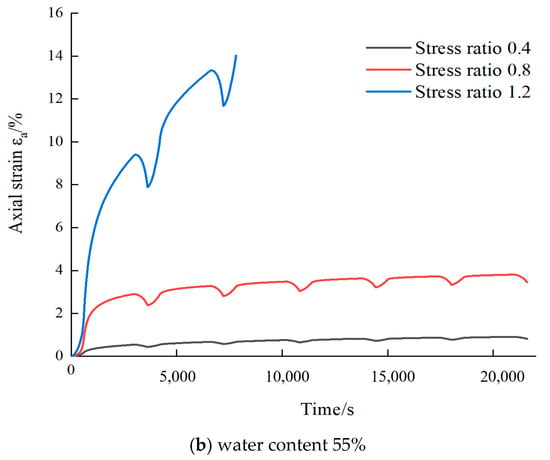 Figure 2. The ε-t curve of marine soft soil at 45%, 55% water content.Phase a (ramp-up phase): The stress increases linearly from the lower limit to the peak of the cycle, which should be 1/6 of the cycle.Phase b (Constant Load): The stress is held constant at the peak stress level and should be 4/6 of the cycle for observing creep or steady state response.Phase c (unloaded section): the stress is reduced linearly from the peak back to the lower limit and should be 1/6 of the cycle to capture the elastic recovery and hysteresis effects.
 - ③
- The time proportions for Phases a, b, and c were set to 1/6, 4/6, and 1/6 of the total cycle duration, respectively. Stepwise loading was applied incrementally based on predefined cyclic stress amplitudes [16].
To ensure comparability among test groups, all the specimens underwent the same preparation and loading protocol: back-pressure saturation for 24 h (Skempton’s B-value ≈ 0.97), a constant confining pressure of 100 kPa, and creep testing at room temperature using an identical three-stage stepped loading scheme, with only the water content and stress ratio varied.
2.2. Analysis of Test Results
Figure 2 illustrates the axial strain–time (ε-t) curves of marine soft clay under varying moisture content conditions. The ε-t curves at 40%, 45%, 50%, 55%, and 60% water content can be found in the results of the experimental study carried out by the authors’ team [16]. The axial strain and time relationship curves were selected for creep characterization for water contents of 45% and 55%. The following observations are derived from the results: (1) Water content 45%: In Figure 2a, the curves represent how the soil’s axial strain develops over time at different stress ratios (Stress ratio is defined as the ratio of the deviatoric stress to the confining stress) for a water content of 45%. The strain increases with time, with a notable difference between the curves. The curve for stress ratio 1.2 shows the highest strain increase, followed by the stress ratio 0.8, and finally, the stress ratio 0.4 shows the least strain development. This suggests that with an increasing stress ratio, the soil undergoes more deformation. (2) Water content 55%: Similarly, in Figure 2b, this graph shows the axial strain versus time for a higher water content of 55%. The general trend follows the same pattern as in graph (a), with the curve for stress ratio 1.2 showing the most pronounced strain increase. However, the strain values at a higher water content (55%) are larger compared to those at 45%, which suggests that increased water content makes the soil more susceptible to deformation under the same stress levels. Figure 3 shows that as the applied stress ratio rises, the axial strain of marine soft soil also increases. Higher water content further amplifies this deformation under the same loading. Understanding these combined effects is essential for reliable foundation design, tunnel excavation, and soil stabilization strategies.

Figure 3.
A schematic diagram of the creep mechanics model of marine soft soil.
Moisture content and stress magnitude are the two primary drivers governing the creep response of marine soft clays. As the water content rises, the inter-particle cohesion diminishes, the clay skeleton softens, and its capacity to deform increases; thus, soils with higher pore-water ratios display far more pronounced time-dependent strains because weakened bonding promotes viscous flow. Likewise, elevated stress levels accelerate creep: sustained loading mobilizes larger strains, and the cumulative deformation expands steadily as the micro-structure reorganizes and the pores collapse with time. This time-dependent behavior has direct ramifications for engineering works-tunnels, foundations, embankments, and other coastal facilities where unchecked creep can trigger differential settlement, compromise the bearing capacity, or, in extreme cases, precipitate failure. Consequently, designers must explicitly incorporate creep into analysis and detailing. Rigorous laboratory testing, robust constitutive modeling, and project-specific verification are indispensable for developing mitigation strategies and ensuring the long-term serviceability and safety of infrastructure founded in marine soft clays.
3. Basic Assumptions and Mathematical Modeling
3.1. Rheological Element–Based Creep Model for Marine Soft Clay
Marine soft clay, characterized by its high water content and low strength, exhibits significant creep deformation under sustained loading. Creep models play a pivotal role in predicting the long-term deformation behavior of soft soils, enabling precise long-term settlement forecasts that inform foundation design. Furthermore, these models provide a theoretical foundation for understanding the soil’s mechanical responses under varying stress and time conditions. By developing advanced constitutive models, it becomes possible to more accurately capture the nonlinearity, time-dependence, and plastic flow inherent to marine soft clay, thereby guiding subsequent geomechanical research. To address these challenges, this study proposes a rheological element-based model to simulate the creep behavior of marine soft clay:
- (1)
- Nonlinear Elasticity: A nonlinear spring is employed to represent the soil’s stress-dependent elastic behavior.
- (2)
- Post-Yield Plasticity: A Bingham slider is connected in series with the spring to simulate plastic deformation after yielding.
- (3)
- Long-Term Creep: A double-layer viscous element is added in series to capture time-dependent creep under prolonged loading.
- (4)
- Initial Viscous Dominance: A standard dashpot is placed in parallel with the spring–slider assembly to account for viscous effects during early-stage loading.
By strategically combining these elements—nonlinear spring, Bingham slider, double-layer viscous element, and standard dashpot—through series-parallel configurations, the model offers a versatile and robust framework to simulate the complex mechanical behavior of marine soft clay. This approach not only enhances the fidelity of creep predictions but also provides actionable insights for optimizing engineering designs in marine environments. This is shown in Figure 3.
3.2. Basic Assumptions
The following assumptions underpin the development of the proposed rheological element-based creep model for marine soft clay:
- (1)
- Nonlinear elasticity at low stresses, with post-yield rate-dependent plastic flow modeled by a Bingham slider.
- (2)
- Creep under sustained loading governed by a series double-layer viscous element, while a parallel dashpot represents the viscous-dominated response during initial loading.
- (3)
- Assumes isotropic material behavior and monotonically increasing loads, neglecting environmental factors such as temperature.
- (4)
- Explicitly captures time-dependent strain accumulation, encompassing both plastic yielding and long-term creep phases.
3.3. Mathematical Modeling
3.3.1. Basic Elements
- (1)
- Spring (Linear Elastic) Element
In the creep model, the spring element is used to represent the elastic response of the soil, simulating its recoverable deformation under small stresses. Specifically, the spring element follows Hooke’s law, where stress is directly proportional to strain:
where σ is stress (Pa); E is Young’s modulus (Pa), quantifying the material’s resistance to elastic deformation; ϵ is strain (dimensionless), representing the degree of deformation.
- (2)
- Dashpot (Viscous) Element
In the rheological model, the dashpot element characterizes the soil’s viscous behavior, particularly its time-dependent deformation under sustained stress. Viscous behavior manifests as continuous deformation over time, where the strain rate gradually decays until reaching a stabilized value. The dashpot’s resistance is proportional to the strain rate, expressed as:
where F is applied force; η is Viscosity coefficient (Pa·s), defining the resistance force per unit strain rate and governing the viscous response; and is strain rate (s−1), representing the temporal evolution of deformation. The dashpot element simulates the long-term viscous flow of marine soft clay, capturing creep deformation under static or low strain-rate conditions. It quantifies the soil’s tendency to undergo irreversible, time-dependent strain accumulation due to internal particle rearrangements and pore fluid migration.
- (3)
- Bingham Slider (Plastic Element)
The Bingham slider is a critical component in soil rheological models for simulating yield-induced plastic flow. Derived from the Bingham fluid model, it captures viscoplastic behavior where materials transition from elastic/viscous to plastic deformation upon exceeding a yield stress. For soft soils, this mechanism represents the onset of irreversible plastic flow when the applied stress surpasses a critical threshold. When the stress on the soil body is less than the yield stress τy, the soil body will not undergo plastic flow, and only shows elastic or viscoelastic deformation. When the stress exceeds the yield stress, the soil body immediately enters the plastic flow state, and irrecoverable plastic deformation occurs. In the Bingham model, once the stress exceeds the yield stress τy, the material will continue to deform or flow at a certain rate, which is usually proportional to (τ − τy), similar to the behavior of viscous materials. In a more general expression, this can be written as:
In the formula, gamma point represents the shear strain rate or plastic flow rate; τ is the current stress; and ηp is the viscosity coefficient of plastic flow, which represents the resistance of the soil to plastic flow after yielding. When the soil is subjected to external loading and the shear stress from this loading does not exceed τy, the Bingham slider is in a “locked” state, no plastic flow occurs, and only the other elastic or viscous elements act. When the stress exceeds τy, the Bingham slider is unlocked, and the soil body begins to produce irrecoverable plastic deformation. This “unlocking” process corresponds to the key point in the transition from the elastic-viscous phase to the plastic flow phase of the soil.
- (4)
- Exponential nonlinear spring is a nonlinear mechanical element, the relationship between its restoring force and displacement is in the form of an exponential function, which is commonly used to describe the behavior of certain materials or structures under large deformations, and its expression is mainly through the exponential relationship between the restoring force and displacement:where F(x) denotes the restoring force; x is the displacement of the spring; k is the spring constant, which describes the basic stiffness of the system; and α is a nonlinear parameter to regulate the extent to which the spring’s stiffness increases rapidly at large displacements. At small displacements, the spring exhibits a minor stiffness, but the stiffness increases rapidly as the displacement increases, which gives the system an obvious stiffening characteristic at large deformations, i.e., it simulates the nonlinear elastic behavior of the soil and is able to reflect the change of the stiffness of the soil in different strain intervals, especially at larger deformations, where the nonlinearities of the soft soil are more pronounced.
- (5)
- Double-layer cohesive element, which simulates the creep response of a soil on different time scales by means of two viscous elements. Typically, this approach captures both the short-term and long-term strain effects, reflecting the slow deformation behavior of soft soils. The viscous elements generally satisfy the relationship that the damping force is proportional to the velocity, as shown in Equation (2). When two elements are connected in series, if the viscous coefficients of the two elements are ηe and ηq, respectively, the total equivalent viscous coefficient ηeq can be obtained from the “parallel” equivalent equation of the two:
When connected in parallel, the total damping force is the superposition of the two damping forces, i.e.,
3.3.2. Soft Soil Creep Modeling
The model first connects a nonlinear spring in series with a Bingham slider to capture the soil’s elastic–plastic response and then adds a double-layer viscous element in series to represent long-term creep under sustained loading. A standard dashpot is placed in parallel with the spring–slider assembly to model the viscous-dominated deformation during the initial loading phase, resulting in a comprehensive rheological framework for soft soil creep. It can be seen that the whole soft soil creep model consists of two major branches: (1) Branch I (main branch), which contains nonlinear springs, Bingham sliders, and double-layer viscous elements, which are connected in series to describe the cumulative effects of the elastic phase, plastic deformation after yielding, and long-time creep of the material. (2) Branch II (parallel branch), which consists of a standard viscous pot that is connected in parallel with Branch I to capture the fast viscous response during the initial loading. In the parallel combination, the strains in each branch are the same, while the overall stress is the sum of the stresses in each branch.
- (1)
- Total strain within a series (branch I) In a series combination, each element is subjected to the same stress (denoted as σ1), and the strain is the accumulation of the strains in each element. That is, the total strain ϵ1 in branch I isϵ1 = ϵel + ϵpl + ϵv
The material exhibits recoverable, nonlinear elastic behavior throughout loading; therefore each stress increment dσ1 is related to the corresponding elastic-strain increment dεel by a Hooke-type relation
where Et is the current tangent Young’s modulus.
Experimental results show that Et is not constant but can be well approximated by the linear function
Bringing Equation (9) into Equation (8) and integrating completely for 0→σ₁ yields:
The elastic strain expression is obtained by collapsing:
The evolution of the plastic strain ϵpl is given by the Bingham slider with a rate of change of
Creep viscous strain, which can be generated by a double-layer viscous element, has a strain rate of:
The cumulative viscous strain is obtained after integration:
Thus, the total strain of the branch I can be written in integral form:
- (2)
- Total strain within the parallel-series combination (branch II)
In the parallel structure, the strain is the same for all the branches, i.e.,
where ϵ is the total system strain, i.e., Equation (15).
ϵ = ϵ1 = ϵd
- (3)
- Total Stress
The total system stress σ is the superposition of the branch stresses, i.e.,
σ = σ1 + σd
The stress in the standard sticky pot branch is known, i.e.,
Therefore, the total stress can be expressed as
It follows that the overall stress incorporates both the stress σ1 (t) applied to the elements within branch I (nonlinear spring, Bingham slider, and double-layer viscous element) and the contribution ηdϵ (t) from the parallel branch (standard viscous pot).
- (4)
- Stress–strain relationship equation
Total strain expression:
where
The total stress expression is shown in Equation (19). Equation (20) is obtained by taking the time derivative:
3.4. Test Verification
Figure 4 gives the comparison and analysis graph between the creep test and the calculation data of the constitutive model for marine soft soil under different water content and equal stress ratio conditions. The axial strain–time relationship curves for marine soft soils with water contents of 45%, 50%, and 55% are the results of the tests that have been completed by the author’s team [16]. Among them, the values of the relevant parameters of the creep principal structure prediction model for marine soft soil are shown in Table 2. From the figure, it can be seen that: The average absolute error of the intrinsic model of creep of marine soft soil established in the present study is about 0.14%, and the average difference between the creep strain predicted by the model and the measured value of the test is about one-thousandth of an order of magnitude of the strain, so the overall fitting effect of the model is better, and it can be used for the characterization of creep of marine soft soil.
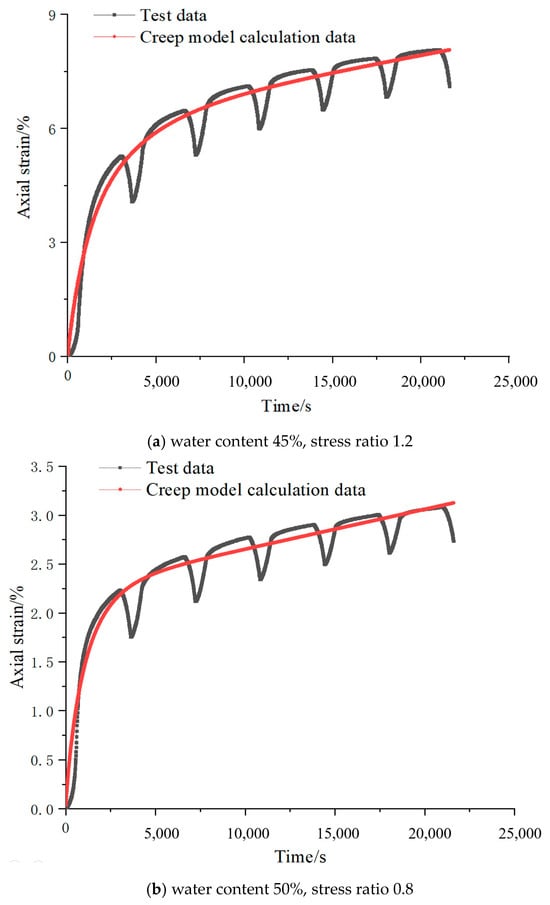
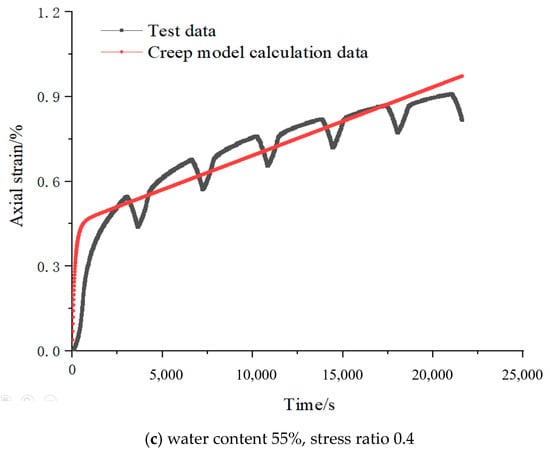
Figure 4.
Comparison of creep model calculation and test data.

Table 2.
Parameters of creep principal structure prediction model for marine soft soil.
4. Discussion
Taking marine soft soil with a 50% water content as an example, Figure 5 illustrates the creep characteristic curves obtained using the established intrinsic creep model under various stress ratios. The X-axis represents the cyclic stress ratio—the ratio of the applied load amplitude to the soil’s initial effective stress (or yield strength), reflecting the loading intensity. The Y-axis shows the test duration in seconds, i.e., how long the soil is kept under that stress level. The Z-axis gives the axial strain as a percentage, quantifying the soil’s deformation during loading and creep. In other words, higher stress ratios or longer loading times yield larger Z-axis values, clearly illustrating the accelerated creep deformation of marine soft clay under intense, prolonged loading. The following observations can be made: (1) Low Stress Ratio: At lower stress ratios, the axial strain remains minimal even over extended periods. This indicates that under relatively low stress levels, the marine soft soil exhibits only minor deformation and maintains a low creep rate. (2) Moderate to High Stress Ratio: As the stress ratio increases to a critical threshold, the curve exhibits a pronounced upward trend, signifying a rapid increase in the axial strain over time. This behavior implies that when the applied load reaches or exceeds a specific threshold, the soil undergoes intensified creep deformation, potentially entering an accelerated creep phase. (3) Time-Dependent Accumulation: Although the initial deformation is small, the creep strain continuously accumulates with time, especially under high-stress conditions. This cumulative effect, often referred to as the “delay” or “hysteresis” phenomenon in creep behavior, underscores the importance of considering time-dependent deformation in the design and analysis of soft soil engineering projects. Overall, these observations highlight that both the stress level and duration critically influence the creep behavior of the marine soft soil, and such factors must be integrated into the engineering design to ensure long-term stability.
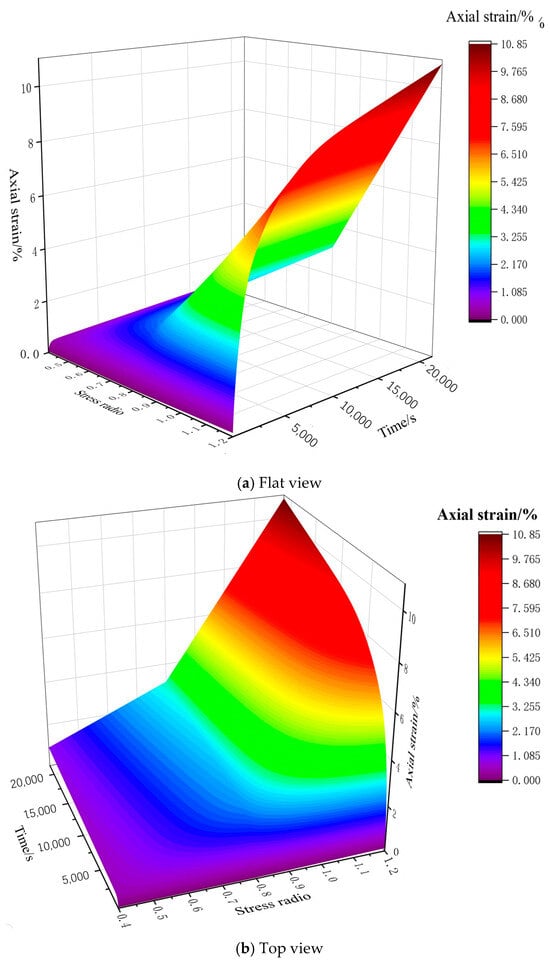
Figure 5.
Three-dimensional surface of creep characteristics of marine soft soil.
Further, a Python 3.12 program was used for 3D surface fitting to derive the mathematical expression of the surface as:
Z = 3.7731 − 14.5318x + 13.1007x2 + 0.0003xy
This expression provides a quantitative representation of the surface, facilitating further analysis and modeling in the context of marine soft soil behavior.
In summary, employing three-dimensional surface fitting and the corresponding mathematical expressions to capture the creep characteristics of marine soft soil offers several key benefits:
- (1)
- Quantification of Creep Behavior: The derived polynomial expression quantifies the creep law of marine soft soil, enabling rapid predictions of deformation. Given a specific stress state and duration, engineers can quickly estimate the creep deformation without resorting to extensive on-site testing or repetitive calculations.
- (2)
- Long-Term Settlement and Stability Assessment: The polynomial model serves as a tool for predicting and comparing settlements under varying construction schemes (i.e., different stress levels) and service periods. This capability aids in evaluating whether excessive settlement might occur during the operational life of a structure, thereby ensuring stability.
- (3)
- Identification of Creep-Sensitive Zones and Design Optimization: By analyzing the fitted surface, engineers can identify zones that are particularly sensitive to creep. This insight facilitates the development of optimized design strategies, such as graded loading, pre-compression, and improved drainage and consolidation measures, to maintain soil stress within a safe range and avoid overloading critical areas.
- (4)
- Basis for Reinforcement and Monitoring Strategies: The mathematical expression can also predict future deformation trends, informing the timing and degree of necessary reinforcement. Real-time on-site monitoring data can be compared with the fitted surface predictions, and any significant deviations may indicate the need for adjustments in the construction program or reinforcement strategy.
To ensure the model accuracy, all the rheological element parameters were calibrated by fitting to triaxial creep test data. Nonlinear spring parameters were obtained from the low-stress static σ–ε curve: The initial elastic segments of specimens at 45%, 50%, and 55% water content were fitted to an exponential law using least-squares regression. The yield stress was directly read from the stress corresponding to the transition from primary to secondary creep on the ε–t curves, and the plastic viscosity coefficient was back-calculated from the slope of the strain rate in the secondary creep stage. For the double-layer viscous element, the tertiary creep stage ε–t data were fitted with a two-dashpot-in-series model, and the two viscosity coefficients were solved separately via least-squares fitting. Finally, the viscosity coefficient of the parallel dashpot was determined by linearly fitting the slope of the initial linear portion of the ε–t curve during the primary loading stage. Although the model accurately predicts the creep behavior of reconstituted marine soft clay (w = 40–60% and σ′/σ′ₚ = 0.4–1.2) under drained, isothermal, sustained loading over time spans from hours to years—with mean errors below 10% and R2 = 0.97—its reliability diminishes when the water content, stress level, or strain exceed the calibrated bounds. Furthermore, under cyclic or dynamic loading, temperature or chemical coupling, or in soils exhibiting pronounced fabric anisotropy or intact structure, the model should be recalibrated using site-specific data.
5. Conclusions
This study systematically investigates the creep behavior of marine soft clay through the development of a constitutive model based on rheological elements. The following key conclusions can be drawn:
- (1)
- Influence of Moisture Content and Stress Levels: The creep behavior of marine soft clay is markedly influenced by both moisture content and applied stress. An increase in moisture content reduces soil cohesion, thereby enhancing the susceptibility to creep deformation. Concurrently, higher stress levels lead to significantly amplified creep deformation. These findings highlight the necessity of accounting for both the moisture and stress conditions in geotechnical design.
- (2)
- Efficacy of the Rheological Constitutive Model: The proposed model, which integrates a nonlinear spring, a Bingham slider, a double-layer viscous element, and a standard dashpot, effectively simulates the complex creep behavior observed in laboratory tests. The model demonstrates excellent agreement with experimental data, accurately capturing nonlinear elastic deformation, plastic yielding, and time-dependent viscous flow.
- (3)
- Quantitative Tool for Creep Prediction: The mathematical expression derived from the three-dimensional creep surface provides a valuable quantitative tool for rapidly estimating creep deformation. This expression enables the prediction of settlements under various stress conditions and over different service lifetimes, significantly reducing the need for extensive field testing and computational analyses.
In summary, the rheological model and its derived quantitative expressions significantly enhance the understanding of creep behavior in marine soft clay. These insights provide critical guidance for mitigating long-term geotechnical risks in marine and coastal environments.
Author Contributions
Software, Y.Z. and H.L.; Validation, Y.L. and V.Q.V.; Formal analysis, Y.Z.; Investigation, Y.L.; Resources, K.W.; Data curation, N.F. and H.L.; Writing—original draft, N.F.; Writing—review & editing, K.W. and R.C. All authors have read and agreed to the published version of the manuscript.
Funding
This work was supported by National Natural Science Foundation of China (52179106).
Data Availability Statement
Data is contained within the article.
Conflicts of Interest
The authors declare no conflict of interest.
References
- Zhou, C.; Cui, G.; Liang, W.; Liu, Z.; Zhang, L. A Coupled Macroscopic and Mesoscopic Creep Model of Soft Marine Soil Using a Directional Probability Entropy Approach. J. Mar. Sci. Eng. 2021, 9, 224. [Google Scholar] [CrossRef]
- Garoushi, A.H.B.; Uygar, E. Simplified analysis of creep for preloaded reconstituted soft alluvial soil from Famagusta Bay. Geomech. Eng. 2022, 28, 157–169. [Google Scholar]
- Zhang, X.W.; Wang, C.M.; Li, J.X. Experimental study of coupling behaviors of consolidation-creep of soft clay and its mechanism. Rock Soil Mech. 2011, 32, 3584–3590. [Google Scholar]
- Zhang, X.W.; Wang, C.M. Study on Direct Shearing Creep Characteristics of Zhangzhou Soft Clay and Creep Parameters. J. Sichuan Univ. (Eng. Sci. Ed.) 2011, 43, 71–76. [Google Scholar]
- Xu, X.B.; Cui, Z.D. Investigation of a fractional derivative creep model of clay and its numerical implementation. Comput. Geotech. 2020, 119, 103387. [Google Scholar] [CrossRef]
- Jozefiak, K.; Zbiciak, A.; Brzezinski, K.; Maslakowski, M. A Novel Approach to the Analysis of the Soil Consolidation Problem by Using Non-Classical Rheological Schemes. Appl. Sci. 2021, 11, 1980. [Google Scholar] [CrossRef]
- Zou, S.F.; Xie, X.Y.; Li, J.Z.; Wang, Z.J.; Wang, H.Y. Rheological characteristics and one-dimensional isotache modelling of marine soft clays. Mar. Georesour. Geotechnol. 2019, 37, 660–670. [Google Scholar] [CrossRef]
- Jerman, J.; Masín, D. Hypoplastic and viscohypoplastic models for soft clays with strength anisotropy. Int. J. Numer. Anal. Methods Geomech. 2020, 44, 1396–1416. [Google Scholar] [CrossRef]
- Huang, W.; Wen, K.J.; Deng, X.J.; Li, J.J.; Jiang, Z.J.; Li, Y.; Li, L.; Amini, F. Constitutive Model of Lateral Unloading Creep of Soft Soil under Excess Pore Water Pressure. Math. Probl. Eng. 2020, 2020, 5017546. [Google Scholar] [CrossRef]
- Huancollo, H.J.M.; Saboya, F., Jr.; Tibana, S.; McCartney, J.S.; Borges, R.G. Thermal Triaxial Tests to Evaluate Improvement of Soft Marine Clay through Thermal Consolidation. Geotech. Test. J. 2023, 46, 579–597. [Google Scholar] [CrossRef]
- Coelho, B.Z.; Dijkstra, J.; Karstunen, M. Viscoplastic cyclic degradation model for soft natural soils. Comput. Geotech. 2021, 135, 104178. [Google Scholar]
- Tahershamsi, H.; Naghadeh, R.A.; Coelho, B.Z.; Dijkstra, J. Low amplitude strain accumulation model for natural soft clays below railways. Transp. Geotech. 2023, 42, 101011. [Google Scholar] [CrossRef]
- Wang, J.J.; Huang, S.Y.; Guo, W.L.; Qiu, Z.F.; Kang, K. Experimental study on fracture toughness of a compacted clay using semi-circular bend specimen. Eng. Fract. Mech. 2020, 224, 106814. [Google Scholar] [CrossRef]
- Choo, J.; Sohail, A.; Fei, F.; Wong, T.F. Shear fracture energies of stiff clays and shales. Acta Geotech. 2021, 16, 2291–2299. [Google Scholar] [CrossRef]
- Tiennot, M.; Mertz, J.D.; Bourgès, A. Influence of Anisotropic Microcracking Due to Swelling on the Fracture Toughness of a Clay-Bearing Sandstone. Rock Mech. Rock Eng. 2017, 50, 2861–2870. [Google Scholar] [CrossRef]
- Xu, W.; Wu, K.; Xiao, W.; Liu, Y.; Chen, R. Experimental study on creep characteristic of remolded marine soft soil under cyclic loading. Eng. Technol. Res. 2024, 23, 15–18. [Google Scholar]
- Xiao, W.; Wu, K.; Xu, W.; Liu, Y.; Lu, H.; Chen, R. Experiment and analysis on dynamic characteristics of marine soft clay. Mar. Georesour. Geotechnol. 2024, 43, 705–725. [Google Scholar] [CrossRef]
- ASTM D2487-17; Standard Practice for Classification of Soils for Engineering Purposes (Unified Soil Classification System). ASTM International: West Conshohocken, PA, USA, 2017.
Disclaimer/Publisher’s Note: The statements, opinions and data contained in all publications are solely those of the individual author(s) and contributor(s) and not of MDPI and/or the editor(s). MDPI and/or the editor(s) disclaim responsibility for any injury to people or property resulting from any ideas, methods, instructions or products referred to in the content. |
© 2025 by the authors. Licensee MDPI, Basel, Switzerland. This article is an open access article distributed under the terms and conditions of the Creative Commons Attribution (CC BY) license (https://creativecommons.org/licenses/by/4.0/).