Abstract
This study investigates the environmental and economic performance of integrating a proton exchange membrane fuel cell, battery systems, and an organic Rankine cycle-based waste heat recovery system for ship electrification. The analysis examines an onboard ammonia decomposition system for hydrogen production and ammonia production pathways. Additionally, the study benchmarks the effectiveness of onboard ammonia decomposition against green hydrogen bunkering scenarios (H2-BS). The analysis is based on data collected over two years from a bulk carrier provided by Laskaridis Shipping Co., Ltd. The environmental analysis includes well-to-wake emissions calculations. At the same time, economic performance is assessed through levelised cost of energy (LCOE) computations for 2025 and 2040, factoring in different fuel and carbon price scenarios. Consequently, the analysis utilises the Complex Proportional Assessment method to compare configurations featuring various ammonia production pathways across economic cases. The results indicate that green and pink ammonia feedstocks achieve maximum equivalent carbon dioxide reductions in the electrification plant of up to 47.28% and 48.47%, respectively, compared to H2-BS and 95.56% and 95.66% compared to the base scenario. Ammonia decomposition systems prove more economically viable than H2-BS due to lower storage and fuel costs, leading to competitive LCOE values that improve under higher carbon pricing scenarios.
1. Introduction
Maritime transportation has been crucial to carrying cargo and passengers for decades, and its worldwide capacity has increased drastically recently [1]. The increased fossil fuel usage for marine vessels’ propulsion and electricity generation significantly contributes to global warming [2]. The International Maritime Organization (IMO) has instituted regulations designed to advance sustainable shipping practices while establishing ambitious targets for the reduction of waterborne emissions [3]. The short-term objectives for 2030 include a 40% reduction in carbon dioxide (CO2) emissions and a 20% decrease in overall greenhouse gases (GHG), with the intention of achieving 30%. Additionally, there is a target for 5% utilisation of zero-emission fuels, striving for 10%. In the midterm, the goals are to achieve a 70% reduction in total GHG emissions, with aspirations for an 80% decrease, ultimately leading to net-zero emissions by 2050 [4].
In recent years, ammonia (NH3) and NH3-involved compounds have emerged as a popular zero-carbon alternative fuel for marine vessels [5,6]. Its use in marine diesel engines (MDEs) and as a hydrogen (H2) carrier has been a timely topic for the maritime sector [6]. NH3 contains 17.6 wt.% H2, and it is a gas at room temperature and pressure, becoming liquid at 263 K or 1000 kPa [7]. Its well-established industrial production, primarily for fertiliser, makes it a cost-effective option [8].
NH3 has been prominent as an H2 carrier in maritime applications, mainly due to the technical and safety challenges associated with storing H2 onboard ships. H2 storage is complicated by its low volumetric energy density and high flammability, which demand either cryogenic conditions for liquefaction or high-pressure containment systems. These requirements introduce significant engineering and safety concerns on marine vessels [9].
The most significant disadvantage of NH3 is its toxicity and dangerous nature for human health. Considerable health consequences, including blindness, lung damage, brain damage, and maybe even death, can arise from exposure to elevated levels of NH3 in the air [10,11]. Consequently, NH3 leaks can quickly escalate into a significant risk to the accommodations and crew members on board [12].
Despite its high toxicity and corrosiveness [13], NH3 is an effective H2 carrier [6]. However, its properties require an improved design meeting specific codes and rules, in addition to increased requirements [12]. The production methodology of NH3 is also a significant subject since green (renewables-sourced) or pink (nuclear-sourced) NH3 has been required to meet the net-zero targets. The clean NH3 capacity and prices to meet the demand of the maritime sector have been a remarkable challenge for the utilisation in shipping operations [14]. Compared to the bunkering, storage, and transfer operations for H2, producing it from NH3 would be much more cost-effective and applicable [15].
1.1. Literature Review
Several research papers about the onboard utilisation of NH3-based systems to generate H2 on marine vessels have been published. Over the past few years, the utilisation of NH3 as an H2 carrier or as a direct fuel for fuel cells (FCs) in marine applications has attained prominence, driven by the IMO’s targets for maritime decarbonisation.
Boggs and Botte [16] applied NH3 electrolysis with an NH3 electrolytic cell to generate H2 onboard vessels in a Proton Exchange Membrane Fuel Cell (PEMFC). H2 can be extracted from NH3 via electrolysis, which theoretically requires 95% less energy than water electrolysis. Specifically, NH3 electrolysis consumed 1.55 Whg−1 of H2, whereas water electrolysis requires 33 Whg−1 of H2.
Wang et al. [17] demonstrated the combined usage of NH3 auto-thermal reforming and selective NH3 oxidation to produce H2 by utilising the waste heat in the exhaust gas of diesel engines. H2 production at 2.5–3.2 L/min was achieved when the NH3 was supplied steadily at a 3 L/min flow rate.
McKinlay et al. [18] presented a dynamic simulation of NH3 decomposition to produce H2 for PEMFCs on marine vessels. The analysis included a detailed assessment of NH3 demand, revealing that the reference cargo ship would require 150 t of NH3 per voyage, necessitating a 586 m3 storage tank.
Ye et al. [19] compared conventional diesel engines with FC propulsion systems using NH3 and H2 as fuels for a small ship working as a sea taxi. The storage options of H2 were evaluated while the presentation of an NH3 cracking system was ensured in the study. The FC options met the demand of the vessel overall with significant equivalent CO2 (CO2e) reduction ratios.
Zhu et al. [20] compared methanol and NH3 as H2 sources using the life cycle approach, using commercial software. Methanol and NH3 were evaluated as H2 carriers compared to coal, natural gas, and renewable energy sources. The solar energy-based NH3 plant produced the lowest CO2e per MJ at 43.9 g.
Spatolisano et al. [21] assessed the potential of NH3 as a zero-carbon H2 carrier, analysed the maritime transportation of feedstocks and products, and evaluated the maturity of decomposing technologies for the industry.
Duong et al. [22] presented an innovative multigeneration system that utilises NH3 as the primary fuel for marine applications. The integration of various components, including PEMFC, solid-oxide FC (SOFC), gas turbines, and waste heat recovery systems (WHRSs) based on diverse thermodynamic cycles, was ensured. The analysis revealed an energy efficiency of 60.69% and an exergy efficiency of 57.50%, with waste heat recovery contributing 1634.46 kW, which accounts for 30.07% of the total power output.
Restelli et al. [23] performed a comprehensive thermo-economic assessment of NH3 as a green H2 source onboard ships. The transport cost for the industrial application was between 5.49 and 6.34 EUR/kg, whereas for the mobility end use, it varied between 6.80 and 12.22 EUR/kg.
Di Micco et al. [24] investigated the design and viability of NH3-based propulsion systems for maritime applications, focusing on two FC technologies: PEMFC and SOFC. The findings revealed that implementing these NH3 systems increases weight and volume, decreasing cargo capacity by 3.3% to 4.8%.
Duong et al. [25] examined the techno-economic feasibility of a direct NH3 SOFC system, enhanced by a gas turbine and integrated with a multi-generation framework that includes various energy recovery systems. Key findings indicated that the levelised cost of energy (LCOE) ranges from USD 0.482 to USD 0.554 per kWh, with a variation of about 6.2%. At the same time, the discounted payback period for unsubsidised and subsidised scenarios falls between 6.7 and 9.5 years.
Research on NH3 utilisation for H2 production in marine vessels can be broadly categorised into electrolysis-based, thermo-chemical, and system-integrated approaches. Electrolytic systems highlighted the energy efficiency potential of NH3 electrolysis compared to water electrolysis [16]. Thermo-chemical methods, including auto-thermal reforming [17,18], demonstrated effective H2 generation using onboard waste heat, though storage and logistics remain challenging.
Integrated system designs have taken a broader view of NH3 as a fuel or carrier, balancing efficiency, emissions, and cost. Studies comparing NH3-based systems to conventional marine fuels and H2 alternative carriers, such as methanol, demonstrated that NH3 frequently emerges as a lower-emission option when renewable sources are used for NH3 production [19,20]. Techno-economic [23,25] and system-level assessments [21,22] have shown promising efficiencies and payback periods but have also highlighted concerns regarding volume, weight, and infrastructure demands [24].
In summary, NH3 is a technically viable H2 source and direct fuel, offering substantial emission reduction potential, especially when integrated into hybrid or WHRSs. Economic feasibility varies, with performance and system complexity depending heavily on technology choice and operating conditions.
Various research papers have focused on the PEMFC applications on ships apart from NH3 usage, exploring their potential to enhance energy efficiency, reduce emissions, and improve overall performance in maritime operations.
Sarı et al. [26] established a “Reference Energy System” for a chemical tanker to analyse energy flow from various sources. It evaluated a baseline scenario and introduced two alternatives, including one focused on H2 PEMFCs. The findings indicated that H2 PEMFCs can achieve a 60% reduction in carbon emissions compared to diesel generators as a primary propulsion system.
Vieira et al. [27] determined the best configuration for a ship’s power system, integrating FCs and batteries, considering battery cycles. The focus was on a retrofitted platform supply vessel with its original generators and additional FCs and batteries. Simulations using commercial software showed that the optimal setup, main and auxiliary generators, a 3119-kW lithium nickel manganese cobalt battery, a 250 kW PEMFC, and 581 kg of H2 achieved a 10.69% reduction in CO2 emissions.
Bang et al. [28] examined methane (CH4) with PEMFCs for their performance and cost advantages over hydrogen. CH4 was reformed using steam reforming and evaluated through five gas treatment systems. The results showed that combining water–gas shift and partial oxidation reforming keeps carbon monoxide below 10 ppm and prevents CH4 in the exhaust.
Bagherabadi et al. [29] developed a model for a marine power system using PEMFCs and batteries. It validated the model against a 500 kW PEMFC and demonstrated its effectiveness for performance analysis and control design. The model supported flexibility in configuration and could assess various manoeuvring scenarios.
Lee et al. [30] introduced a PEMFC system combined with an organic Rankine cycle (ORC) that utilises cold exergy from liquid H2 and waste heat from the PEMFC for marine applications. Findings indicated that the system can produce an additional 221 kW of power, with energy and exergy efficiencies of 40.45% and 43.52%, respectively. Economic analysis suggests a payback period of 11.2 years and a net present value of USD 295,268, demonstrating the system’s potential viability.
Wang et al. [31] assessed FC technologies for ship power, focusing on energy efficiency and environmental impact. Low-temperature PEMFCs emerged as the most viable option for sustainable propulsion, with the lowest Energy Efficiency Design Index value at 10.05 g CO2/t-km.
Penga et al. [32] explored the potential of hybrid systems combining PEMFCs and battery packs as a cleaner alternative to diesel propulsion for marine vessels. A numerical model was developed to optimise a hybrid power system for a specific route, featuring a 300 kWe PEMFC stack and a 424-kWh battery. The results demonstrated that this new system significantly reduced emissions, requiring only 284.7 kg of H2 compared to 1524 kg of diesel previously consumed.
Yuksel et al. [33] evaluated the integration of various FC technologies with battery storage systems and WHRS for retrofitting marine electricity generation plants. The study employed mathematical modelling and real-time operational data from a Kamsarmax bulk carrier. The analysis showed that hybrid configurations combining PEMFC and SOFC, powered by liquefied green H2, can reduce well-to-wake equivalent CO2 emissions from the ship’s electrification system by up to 91.79%.
Aziz et al. [34] presented a coordinated control strategy for a hybrid shipboard power system using PEMFCS and batteries. The strategy improved operational efficiency and stabilised power during load changes, achieving a 14.16% increase in system efficiency over traditional methods while maintaining stable voltage tracking.
PEMFCs have received considerable attention for marine decarbonisation, with studies focusing on propulsion replacement, hybridisation, and system optimisation. Initial work [18,26,27] showed that replacing diesel generators with PEMFCs could significantly reduce emissions. Hybrid configurations combining PEMFCs with batteries or other FCs enhanced operational flexibility and emission reduction outcomes [32,33].
Performance modelling and control strategies [29,34] supported system adaptability and efficiency under variable marine conditions. Integration with WHRSs [30] and comparative assessments of PEMFCs against other FC types [31] further confirmed their strong potential in meeting environmental and regulatory targets. Overall, PEMFCs are a well-supported and adaptable low-emission option for marine applications, especially when deployed in hybrid systems or with energy recovery enhancements.
The literature review on PEMFC and NH3 utilisation in marine vessels reveals a significant surge in research publications in recent years, driven by IMO decarbonisation objectives and growing environmental awareness. NH3 evaluations as a fuel in power systems have focused on economic and environmental performance.
The studies investigated onboard H2 production from NH3 decomposition and evaluated the financial performance, required NH3 capacity, and ecological benefits. The presented designs have been proposed as a concept for the propulsion system. A gap in the literature has been identified regarding the integrated design evaluation of onboard NH3 cracking systems and FCs for marine electricity generation plants. The existing literature has been notably deficient in comprehensive analyses that integrate well-to-wake environmental evaluations alongside assessments of economic factors and design requirements for the combined configuration of an integrated NH3 decomposer and H2 PEMFC, battery, and WHRS.
1.2. Objectives, Motivation and Novelty
This study presents a comparative analysis of conventional marine diesel generators (D/Gs) utilising heavy fuel oil (HFO), with FCs that employ green H2 bunkering and NH3 decomposition systems for onboard H2 production derived from diverse NH3 production pathways. Previous research conducted by the authors of [33] evaluated the potential of liquefied natural gas (LNG) reform for H2 production in FCs, alongside the performance of FCs utilising green H2 bunkering. The top-ranked configurations utilising green H2 bunkering from the prior study [33] were employed in this analysis.
This research aims to present an integrated design involving the onboard H2 production and PEMFC/battery/WHRS hybrid configuration to meet the electricity demand of a Kamsarmax bulk carrier. The analysis has been performed using a robust system for real-time data collection. The feasibility of the proposed hybrid electrification system’s economic and environmental performance has been assessed. The financial viability and bunkering challenges of H2 systems have rendered them unfeasible for current vessels. The study’s objective is to reduce fuel costs, increase fuel availability, and thereby enhance the economic performance of H2 configurations by implementing NH3-craking systems for the ships.
The upstream (well-to-tank) emissions arising from H2 generation concerning the NH3 production methodology and operational emission reductions have been examined to ascertain whether this configuration can serve as a viable option for meeting forthcoming decarbonisation targets. The tank capacities have been identified to illustrate the implementation’s specific design and operational challenges. This article distinguishes itself from existing literature by presenting a comprehensive design structure that encompasses both H2 production and consumption to address the electricity demands of a commercial marine vessel. The system’s operational performance was evaluated, and the various NH3 production methodologies were analysed across different economic projection scenarios using a multi-criteria decision-making (MCDM) algorithm. This paper’s innovative aspect lies in integrating a streamlined well-to-wake environmental approach with a multi-criteria decision-making (MCDM) framework for the onboard NH3 decomposition system. This framework is designed for PEMFC/battery/WHRS configurations within the ship electrification system, accompanied by a discussion of its merits and disadvantages. The thorough investigation of various facets of the system contributes to the existing literature while acting as a significant resource for ship owners, managers, and designers to identify the decarbonisation pathway for their fleets.
2. Materials and Methods
This section provides an overview of the analytical framework and context underlying the research findings, detailing the description of the system utilised in the study. The case study focuses on the Kamsarmax bulk carrier M/V KASTOR, operated by Laskaridis Shipping Co. Ltd. (Athens, Greece) built in 2020, the vessel has a deadweight of 80,996 tonnes and an overall length of 229 metres. Its propulsion system features a HYUNDAI 6S60ME-C8.5 (Ulsan, South Korea) engine with a maximum power output of 9930 kW. The ship also includes an electrification plant comprising three YANMAR 6EY22LW D/Gs (Almere, The Netherlands) operating HFOs, each with a terminal power capacity of 720 kW. Ship particulars and sample data are provided in Yuksel et al. [33].
A bulk carrier without cargo handling gear (gearless bulk carrier) was selected for this study due to its structural potential and further suitability for integrating alternative energy systems, such as photovoltaic (PV) panels or wind turbines, given the available deck space and minimal obstructions. Additionally, these vessels typically exhibit a more stable electrical load profile during port operations, which supports consistent performance evaluation of onboard energy systems. The selection was also driven by the availability of high-quality, long-term sensor data, essential for robust analysis and validation of the proposed methods. Figure 1 demonstrates the application process of the techniques used in the study.
Figure 1.
Methodology flowchart.
A data acquisition system was implemented to reliably gather information from sensors and control mechanisms on the case study ship. This system functions through a wireless network, facilitating efficient data collection and monitoring. It has been certified by Bureau Veritas and complies with maritime safety and operational standards. Major components include the Quax 8S Node, which records voyage-specific metrics such as vessel speed and navigation information; the Quax G Node, which tracks the MDEs’ performance; and the Quax S Node, which captures data on flow and revolutions to enhance overall monitoring abilities [35].
The data acquisition period spanned from 1 February 2021 to 10 February 2023. After preprocessing, the dataset was refined to comprise 1,003,490 entries, representing 1.96 years of operational metrics. The collected parameters included measures involving fuel flow, temperature, density, and engine powers, complemented by analyses of electrical load and exhaust data. Furthermore, details related to FC/battery curves, converter voltage, and conversion efficiencies were sourced from the literature and commercial system datasheets.
In the initial stage of the analysis, data on prices, emission coefficients, and properties of the NH₃ cracker were collected. The two PEMFC/battery/WHRS configurations for the marine electricity generation unit were proposed. Subsequently, the design of the NH₃ decomposition system, including the tank and production capacity for H₂, was determined.
The environmental performance of the cracker-involved operations was assessed, considering nitrous oxide (NOx) emissions from NH₃ combustion and the sulphur oxides (SOx) and CO2e resulting from the NH3 production methodology. System economic viability was evaluated by calculating the LCOE for 2025 and 2040 using different colour-coded NH3 as the feedstock. This financial performance was compared with the green H₂ bunkering scenarios (H2-BS). The outcomes of these analyses were combined in an MCDM analysis, and the configurations were ranked regarding the NH3 colour codes.
The integration of the PEMFC/battery/WHRS system into the ship electrification plant was achieved using a simulation created in the Python 3.11 programming environment. It benchmarks the hybrid systems’ emission reductions against conventional diesel engines.
The simulation workflow begins with importing required libraries and reading input data. Initial parameters for the hybrid system are defined, and writable lists for logging results are prepared. The algorithm first checks whether the WHRS can generate power based on the main engine (M/E) load. If so, it interpolates the exhaust flow and temperature according to the engine power, then calculates the power generation from the ORC-based WHRS. If not, the WHRS power supply is set to zero. The number of working FCs and D/Gs (if needed) and battery support, including charging and discharging, are determined depending on the power demand. As described above, the hierarchy in PEMFC/battery/WHRS hybrid configurations begins with WHRS and prioritises the PEMFCs. If the required power is within the capacity of the PEMFCs, the FC plant solely meets the load, and the number of active FCs is determined based on the demanded power. The PEMFC H2 consumption is calculated based on the power–H2 curves provided by the manufacturer [36]. If the required power exceeds the capacity of the PEMFC plant, the batteries are activated. However, the necessary charging power is added to the required grid power if the batteries need to be charged. Battery charging and discharging operations are determined by assessing the state-of-charge (SoC). Additionally, batteries are used to compensate for instantaneous load demands. If the PEMFC/battery/WHRS plant cannot meet the required power, D/Gs are utilised. The required D/G power is determined by subtracting the required total power from the available PEMFC/battery/WHRS supply. Then, depending on the required D/G power, the specific fuel consumption (SFC) is interpolated, and fuel consumption is calculated. Subsequently, the model computes the utilisation times of each equipment, fuel consumption, and emissions for the PEMFC/battery/WHRS hybrid configurations. Finally, the results are logged, structured into data frames, and exported to spreadsheets for further analysis. The algorithmic framework, which visually elucidates the processes, is presented in Appendix A. The energy management strategy deciding the hierarchy between power equipment is detailed in a simplified format in Appendix B. Table 1 indicates the analysed configurations.

Table 1.
Configurations analysed in the case study.
The selection of FC types and sizes in this study was based on a comprehensive prior analysis ranking configurations by performance and size [33]. The chosen commercially available FCs align with the vessel’s load profile, which ranges from 200 kW to 800 kW per generator (see Figure 2 given in Yuksel et al. [33]), with a critical threshold power of 400 kW. Thus, the selected FC sizes are positioned either in the middle of this range (C2) or fully satisfy the requirements (C1) within this range to meet the specified power output.
Figure 2.
The general system scheme of the investigated hybrid configurations.
Battery sizes were adjusted according to FC sizes and the available average power from the ORC. In the context of the hybrid system, the battery sizes were increased based on the number of generators’ loads that needed to be met by the hybrid configuration. The dimensions of the batteries were determined to ensure that, after the FCs and WHRS fulfil the load profile requirements, any remaining demand can be adequately addressed by the batteries during emergency situations. These batteries can support the system for a minimum of one hour and, in certain cases, can provide extended support at a slower discharge rate, thereby enhancing overall system reliability.
This analysis examines two distinct hybrid designs. C1 features a larger FC system with an enhanced battery capacity that can support the load of two generators. This setup comprises four FC units, each rated at 800 kW, supplemented by a WHRS providing average 197.01 kW and a battery storage capacity of 443 kWh. Together, this configuration effectively meets the combined load of the two generators, totalling 1440 kW.
Configuration C2 integrates an FC, battery, and WHRS to support a single generator’s load of 720 kW. In this setup, two FCs share the load of 400 kW, while the WHRS consistently contributes an average additional 197.01 kW during navigation. The battery system supplies the remaining power requirements. It is important to note that the WHRS has a capacity of up to 449.47 kW at full ME load, equivalent to 354.41 kW at 85% ME load. These configurations were the most prominent in the benchmarking against other FC types and sizes within the electrification plant of the case study vessel, as indicated in the study of Yuksel et al. [33]. Figure 2 illustrates the PEMFC/battery/WHRS integrated system scheme in the marine power distribution system.
The batteries are charged by the WHRS utilising the exhaust waste heat from the M/E, in conjunction with PEMFCs, as illustrated in Figure 2. The direct current (DC) of PEMFCs and batteries is inverted to alternating current (AC) before being given to the grid. The ship electrification components’ specifications and model details were provided in Yuksel and Koseoglu [37].
2.1. Ammonia Decomposition System
NH3 cracking, or decomposition, generates H2 from NH3 over a catalyst at normal pressures and high temperatures. Without a catalyst, thermal processes that facilitate the NH3 decomposition typically commence at temperatures exceeding 773 K [38]. Equation (1) indicates the endothermic reaction of NH3 decomposition [38].
In contrast, the presence of a catalyst allows for catalytic cracking to predominantly occur at temperatures below 698 K, achieving an efficiency rate of approximately 98–99% [15,39]. The key factor is the high cracking purity of H2 (99.9%) since the toxic and corrosive properties of NH3 can harm the FC systems [38].
Nickel-based catalysts (e.g., Ni/Al2O3, Ni/MgO) are among the most widely studied and commercially used due to their cost-effectiveness and reasonable activity, particularly at temperatures above 650 K. These catalysts typically operate with a space velocity of 3000–10,000 h⁻1 and exhibit a deactivation rate influenced by sintering and nitrogen poisoning. In contrast, ruthenium-based catalysts (e.g., Ru/Al2O3, Ru/CeO2) have demonstrated superior activity at lower temperatures (as low as 550–600 K), often achieving near-complete NH3 conversion at lower residence times and with enhanced thermal stability over prolonged operation [40].
The reactor model developed by Devkota et al. [41] in the Aspen Plus V1.2. and the cracker of Crystec [42] was used in the analysis. The feed NH3 at 96.3 kg/h capacity, having 298 K and 10 bars, was utilised in the reactor [42]. The reactor model was validated against the experimental and simulated results reported by Devkota et al. [41], with key performance metrics such as NH₃ conversion and reactor outlet temperature aligning within a ±5% margin. The PSA unit performance was also cross-referenced with industrial data from Crystec [42], ensuring technical feasibility and scale relevance. Figure 3 indicates the simplified NH3 cracker system scheme.
Figure 3.
Basic schematic of NH3 decomposition unit (adapted from [15,41,42]).
The required heat was met by the combustion of NH3, which was 9% of the feedstock. The unused NH3 was mixed with new fuel and air and introduced into the boiler via a pre-heater. A two-bed Temperature Swing Adsorption (TSA) unit separated the remaining NH3 from the degraded H2 and nitrogen gas mixture. The waste heat was extracted from the product and flue gas streams using the air–fuel mixture. Ultimately, more than 99.999% pure H2 at 16.7 kg/h capacity can be produced with a NOx emission generation at 0.021 kg-NH3/kg-H2 by recirculating the flue gas via an eight-step, four-bed Pressure Swing Adsorption (PSA) machine with two pressure equalisations [15,41,42].
The reactor configuration typically involves a packed-bed tubular geometry with internal heating or external jacketed systems to compensate for the endothermic nature of the reaction. Maintaining a uniform temperature distribution in this configuration is critical, as local hot spots may lead to catalyst degradation or uneven NH3 conversion profiles. Catalyst loading, bed porosity, and tube dimensions are optimised to ensure efficient mass and heat transfer throughout the reactor volume [40,41].
2.2. Ammonia Colour Coldes
The Haber–Bosch process is one of the methods to produce NH3 by combining nitrogen and H2 through a thermocatalytic reaction [43]. When the manufacturing was performed using natural gas via steam-methane reforming (SMR), the NH3 was labelled as “Grey”, and the process was assumed to emit 1.88 t-CO2e/t-NH3 in this study. “Blue NH3” manufacturing includes a carbon capture system in the plant and reduces emissions to 1.23 t-CO2e/t-NH3 [44,45]. If the NH3 has been produced utilising renewable/clean energy, it is named green NH3, emitting 0.177 t-CO2e/t-NH3. Nuclear-sourced NH3 is named pink in this study, having an emission level at 0.17 t-CO2e/t-NH3 [44,46].
The emission coefficients used in the analysis were derived from industry reports and peer-reviewed life cycle assessments reflecting current industrial NH3 production processes. These sources were chosen to ensure realistic assumptions. While some variation may exist compared to site-specific data, the impact on overall results is expected to remain within an acceptable range of uncertainty.
2.3. Proton Exchange Membrane Fuel Cell
The PEMFC stack used in the study was the PowerCellGroup Marine System 200; its technical specifications are shown in Table 2 [36].
Table 2.
Specifications of PEMFC.
The H2 consumption of the PEMFC was determined using Equation (2) and performance curves, including the efficiency and SFC curves supplied by the manufacturer [36]. The design of the H2 tank capacity was intended to provide support for two days, covering potential emergencies and maintenance needs of the decomposition plant. This calculation was predicated on the assumption that the hydrogen is stored in a compressed form at 75 kg/m3 [47,48].
The operation time in hours is denoted as t, and SFC is interpolated from the curve. PPEMFC and nPEMFC represent the power and number of PEMFCs, respectively. Equation (3) indicates the emissions of PEMFC.
2.4. Battery Cell
A Panasonic NCR18650GA battery cell with a lithium-ion chemistry capacity of 3.45 Ah was utilised in the stack formation. Lithium-ion batteries, known for their higher specific energy and negligible memory effect, were employed in hybrid operation scenarios [48]. The constant-current constant-voltage charging strategy was employed, and the battery set was modelled accordingly. The cell’s nominal voltage is 3.6 V, and voltage drop was simulated using SoC-voltage curves from the manufacturer’s datasheet [49]. Battery health degradation, represented by state of health (SoH), was obtained from the datasheet.
An energy management strategy (EMS) determined the operational state of batteries and the available SoC. The time-dependent SoC is computed by employing the Coulomb counting method shown in Equation (3) [50].
SoC (0) indicates the initial state of charge at the commencement of the simulation, whereas SoC(t) signifies the revised SoC at t. The EMS keeps the SoC within the range of 20% to 80% during active use to reduce internal resistance, which in turn supports the health and longevity of the battery [50]. The coulombic efficiency () is taken at 1, with the charging or discharging current denoted as I(t), and the available battery capacity in ampere-hours (Ah) represented by in the equation [51].
The reduction in the battery’s capacity was computed throughout its operation, incorporating adjustments influenced by the C-rate. The SoH was determined using Equation (4), which defines SoH as the ratio of the actual battery capacity () after degradation to the initial capacity () at the start of operation.
The SMA Sunny SCS2900 inverter model (SMA, Niestetal, Germany) transforms the DC from the battery to AC for integration into the ship’s grid. This inverter operates at an efficiency of 98.4% when converting from 800 V DC to 450 V AC [52].
2.5. Waste Heat Recovery System
An ORC-based WHRS was utilised to generate electricity from the heat of the M/E exhaust waste. The efficiency of the ORC model () was adapted at 13.2% from the studies of Konur et al. [53], Konur et al. [54]. The exhaust gas temperature after steam production (Tin) in °C and exhaust mass flow rate (ṁex) in kg/s regarding the engine load (%), power (kW), and engine speed (rpm) are indicated in Table 3.
Table 3.
The exhaust gas, power, and speed data of the M/E.
The simulation’s exhaust data, presented in Table 3, was utilised through interpolation based on the acquired real-time M/E data. Equation (5) calculates the generated power by the WHRS () in kW [55].
represents the exit temperature from the ORC, set at 100 °C, while denotes the specific heat capacity of the exhaust gas at constant pressure. This value, taken as 1.089 kJ/kgK, reflects the thermal energy exchanged by a unit mass of exhaust gas per unit temperature change [56].
2.6. Marine Diesel Generators
The simulation determined the required engine power and active generators at 1-min intervals. Generator load and power were simulated for hybrid scenarios, with SFC interpolated from D/G datasheets. Based on the approach of Yuksel and Koseoglu [24], load sharing activated additional generators when power exceeded 85% capacity, balancing load by frequency and power factors. Fuel consumption was calculated by multiplying each generator’s SFC, required power, and operation time.
2.7. Environmental Model
The emissions from the hybrid configurations and base scenario were computed using the emission coefficients. Table 4 demonstrates the upstream emission coefficients (UEC) and operational emission coefficients (OEC) to calculate operational emissions (OEs) and upstream emissions (UEs).
Table 4.
UEC and OEC.
This study adopted a streamlined well-to-wake approach, focusing on the operational and production phase of the fuel pathways and excluding the energy consumption and carbon emissions associated with the manufacturing of FCs and battery systems. While this allows for a consistent and comparable analysis of fuel-related emissions, it introduces limitations, particularly for battery systems, which can involve significant embodied energy and associated emissions during production. The manufacturing phase for FCs and batteries can lead to a deviation of around 20–30% higher emissions compared to the operational phase alone [61]. Upstream and operational emissions were weighted equally, utilising emission coefficients sourced from the literature.
The 100-year global warming potential (GWP100) was demonstrated in the calculation of CO2e, as shown in Equation (6) [62].
The coefficients for CO2e from the 2024 IMO life cycle assessment guidelines [62] were utilised to compute the GWP of nitrous oxide (N2O) and CH4. These gases had GWPs approximately 260–273 times for N2O and 27–30 times for CH4 greater than CO2, respectively [58]. The CO2e coefficients for NH₃ production methods are provided in Section 2.2.
2.8. Economic Model
To reduce uncertainty, a scenario-based approach was employed to calculate the LCOE for 2025 and 2040, incorporating projected energy and carbon prices from reliable sources, including currently limited applications, like the Emission Trading System, and academic literature. The primary aim was to illustrate how variations in price levels influence system performance, particularly identifying the carbon price threshold at which renewable energy options become competitive.
Among various methodologies available for techno-economic evaluation, LCOE was selected due to its ability to provide a single, consistent indicator of economic performance across different fuel and technology configurations. It allows for directly comparing energy generation options by accounting for all relevant costs, capital, operational, maintenance, and fuel over the system’s lifetime. Moreover, LCOE is one of the most widely used and recognised metrics in energy system analysis, which enhances the comparability and relevance of the findings within the broader academic and industry discourse [63].
The LCOEs was used to gauge each configuration’s economic performance. The main instrument of choice for evaluating the unit costs of various baseload technologies at the plant level throughout their operating lives is LCOE [64]. Equation (7) shows how the LCOE is calculated [65].
The installation cost is , the fuel cost is , and operation and maintenance costs are represented by in Equation (7). The plant’s generated total power () and operation time (t) were calculated from the operational data. Plant lifetime (LT) was assumed to be 20 years, and the discount rate (r) was taken at 10% [64,66]. Table 5 demonstrates the and of the equipment.
Table 5.
Lifetime, installation, and operational costs of systems.
The calculation of was done by multiplying the percentage by , and the analysis was carried out using the United States dollar (USD). The pound (GBP) and Euro (EUR) to USD exchange rate were set at 1.27 and 1.1, respectively. The rates from the relevant data year and the most recent Chemical Engineering Plant Cost Index (CEPCI) were used to adjust the prices from prior years. According to Maxwell [75], the most recent CEPCI was 798.8 for June 2024 (the most recently announced value). Table 6 indicates the and carbon price assumptions for 2025 and 2040.
Table 6.
Carbon price and (USD/kg—Fuel) for 2025 and 2040 regarding low/high cases.
The current of HFO was obtained from ShipandBunker [79] for global average. Fuel price data used in this study were obtained from reputable literature sources to ensure consistency with established projections and reflect the most credible and widely accepted estimates. Given the inherent uncertainties of future fuel pricing, both low and high projection cases were adopted. These scenarios were defined based on boundary conditions derived from fuel price trends, offering a more comprehensive understanding of potential economic outcomes. A similar approach was applied to the carbon pricing collected from the literature by fuel price projections.
2.9. Multi-Criteria Decision-Making
The Complex Proportional Assessment (COPRAS) method has effectively ranked the alternatives. This method facilitates a clear and comprehensive comparison by evaluating one alternative’s relative merits and drawbacks against others [81,82]. It ensures the optimisation of criteria influenced by multiple factors by considering the utility level and relative importance [83].
The method relies on linear normalisation, standardising diverse criteria by converting them to a uniform scale, thus facilitating direct comparisons. Additionally, it integrates the weighted significance of each criterion, allowing decision-makers to express and incorporate their preferences and priorities into the evaluation framework [84]. This method is frequently utilised in decision-making contexts characterised by uncertainty or ambiguous outcomes [81,85].
The assessment criteria were determined as total CO2e, total other emissions (summation of SOx and NOx), and LCOE. Since the LCOE depends on the years and economic projection scenarios, the ranking regarding 2025, 2040 Low, and 2040 High cases were assured. The entropy method introduced by Shannon [86] determined criterion weights, which encompass three stages. The initial step is to normalise the decision matrix using Equation (8) [87].
where depicts the data point to be normalised, n is the number of criteria, and represents the normalised data. The next stage is the calculation of entropy () employing Equation (9) [87].
where m represents the total row number. The final stage computes the weights () utilising Equation (10) [87].
After determining the weights, the normalised matrix was multiplied by the relative , and the weighted normalisation matrix () was obtained for the COPRAS. Using Equations (11) and (12), the beneficial () and cost indexes () were obtained [88].
The relative significance of alternatives () was calculated employing Equation (13) [89].
The final stage of the COPRAS involves the calculation of utility degrees () utilising Equation (14) and ranking determination using values [89].
A higher means a higher ranking for the configuration [88]. The validity of the COPRAS methodology has been assessed using a sensitivity analysis technique as proposed by Triantaphyllou and Sánchez [90].
Let (for 1 ≤ I < j ≤ m and 1 ≤ k ≤ n) represent the minimum adjustment required in the assigned weight of criterion k, to achieve a reversal in the ranking positions of alternative Ai and Aj, as illustrated in Equation (15) [90].
Pj and Pi represent the weighted normalised decision matrix elements for the respective rows in this context. The normalised matrix values are defined as and . The following condition in Equation (16) should be met for the value of [90].
No weight adjustment can make Aj rank higher when alternative Ai consistently outperforms Aj across all criteria (aik ≥ ajk for every k). A criterion is classified as redundant if altering its weight has no impact on the rankings of any alternatives, allowing it to be eliminated from consideration [90].
2.10. Uncertainty Analysis
Uncertainty serves as a metric for the validity of results and is vital for assessing the appropriateness of data in informed decision-making across various domains [91]. Statistical techniques, particularly uncertainty analysis, are instrumental in pinpointing scenarios impacted by uncertainty while improving data accuracy [92]. Varying levels of uncertainty are integrated using Equation (17) [93].
In Equation (17), U values denote the partial uncertainties of individual parameters (x1, x2,…xn), UR demonstrates the uncertainty of the merged calculation, while R is the utilised parameter for each independent metric [94].
An uncertainty analysis of the fuel consumption model was conducted to assess its reliability. Two main sources of uncertainty were identified. Initially MDEs’ fuel usage was calculated from the SFC data provided by the manufacturer for proposed systems. In the baseline scenario, the discrepancy between the sensor data and the model outputs was 5.63%. Moreover, the fuel consumption efficiencies exhibited a 2% error margin reflected in the accompanying data sheets. Utilising Equation (17), the overall uncertainty calculated by the model was determined to be 5.98%.
3. Results
The environmental analysis highlights variations in CO2e, NOx, and SOx emissions for systems C1 and C2 using grey, blue, pink, and green NH3 as cracker feedstock. Emissions from the decomposition system influenced upstream and operational pollutant levels. NH3 production emissions were excluded, focusing only on those required by maritime regulations for this study.
The C1 and C2 designs required 304 and 298.12 t of H2 to run PEMFCs for 1.96 years. The current HFO tank capacity (467 m3) powers the D/Gs for 180 days. To maintain the same bunkering capacity with H2, the required tank sizes would be 1199.96 m3 and 1176.76 m3, respectively. These values can be reduced to 650.10 m3 and 624.62 m3 with NH3 cracking, including 40.11 m3 and 39.33 m3 H2 storage tanks for two days. The NH3 requirements of the decomposition system to produce the same amount of H2 on board were set at 1653.43 t for C1 and 1586.47 t for C2. Limiting the capacity to the base value of 467 m3, the NH3 tanks would provide fuel for 125.98 and 131.53 days, respectively, including two days of H2 storage requirements given earlier. The economic analysis was conducted based on the 180-day values. Figure 4 illustrates the hourly power output from the PEMFC plants in both C1 and C2 configurations, along with the corresponding hourly power availability of the WHRS system.
Figure 4.
Power outputs from the PEMFC and WHRS in the examined configurations.
The total electrification operation time reached 17,169.6 h. C1 operates without utilising the MDE, resulting in zero HFO usage, and relies mainly on PEMFCs, with minimal battery usage limited to just 5.38 h. During its operation, C1 primarily employed two FCs, which accounted for 75.74% of the total operational time (13,003.72 h). A single PEMFC was used for 14.20% of the time (2438.63 h), while three and four PEMFCs were utilised for 9.11% (1563.70 h) and 0.94% (161.43 h), respectively.
C2 uses MDEs for 1262.88 h, consuming 37.84 tons of HFO, and relies on batteries for 1868.32 h. During its operation, 85.86% of the total runtime (14,741.73 h) was conducted using two PEMFCs, with the remainder carried out by a single PEMFC. The life spans of PEMFCs were calculated as 9.28 years and 4.91 years for C1 and C2. Since the C1 configuration rarely involves the battery for operations and uses it only for emergency responses, Figure 5 illustrates the changes in SoC and SoH over operational hours.
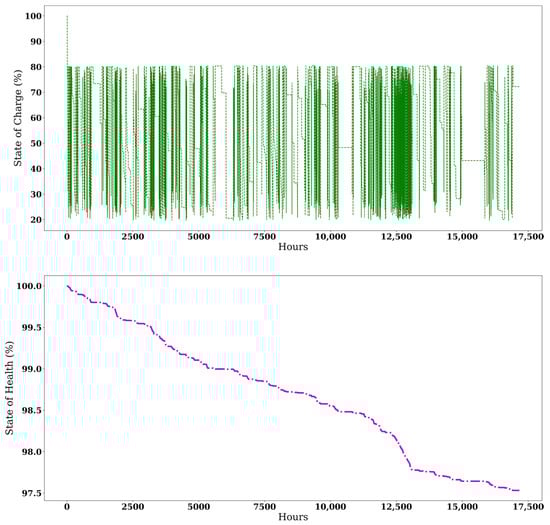
Figure 5.
Variation of battery SoC and SoH during the operation of C2.
Based on the usage profile and the final SoH indicated in Figure 5, the estimated battery lifespan for both configurations was calculated over ten years, assuming that 80% SoH marks the end of battery life. In the economic analysis, battery replacements are assumed to occur every ten years. Figure 4 illustrates the CO2e of each configuration regarding NH3 colour codes for 1.96 years of operation time.
In Figure 6, the emissions represented by the striped bars correspond to operational emissions, while the solid bars indicate upstream emissions. The conventional configuration emitted 5752.82 tonnes of CO2e during operation and 834.56 tonnes upstream, yielding a total of 6587.39 tonnes over 1.96 years. C1 and C2 configurations reduced it by 91.57% and 89.99% by using green H2-BS. C2 exhibited operational emissions of 119.39 tonnes.
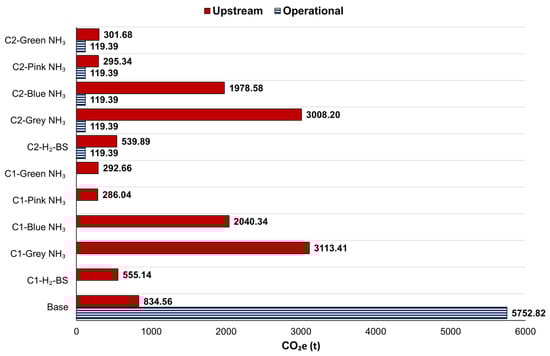
Figure 6.
CO2e of configurations regarding the NH3 production method.
For grey NH3 decomposition, operational emissions remained unchanged compared to H2-BS, but upstream emissions significantly increased compared to both the base case and C1/C2 H2-BS. Upstream CO2e emissions for C1 were 3113.41 tonnes with zero operational CO2e, while for C2, operational CO2e emissions were 119.39 tonnes, and upstream emissions rose to 3127.59 tonnes. This represents CO2e emissions 5.61 times higher for C1 and 4.74 times higher for C2 than their H2-BS cases. However, grey NH3 decomposition with C1 and C2 configurations reduced CO2e by 52.74% and 52.52%, respectively, compared to the MDE configuration.
Blue NH₃ cracking reduced upstream CO2e emissions, with C1 and C2 emitting 2040.34 and 1978.58 tonnes, respectively. Compared to the H2-BS, total CO2e emissions increased 3.68 times for C1 and 3.18 for C2. When benchmarked against the base case, the reduction rates were 69.03% for C1 and 68.15% for C2.
The use of green NH3 for onboard H2 production resulted in CO2e emissions of 292.66 tonnes for C1 and 421.07 tonnes for C2. These values represented 47.28% and 36.13% reductions for C1 and C2 configurations, respectively, compared to their green H2-BS counterparts. Additionally, these emissions corresponded to 95.56% and 93.61% decreases, respectively, compared to the base scenario.
Pink NH3 decomposition achieved further reductions, with CO2e emissions of 286.04 tonnes for C1 and 414.72 tonnes for C2. These emissions represented 48.47% and 36.13% reductions compared to the H2-BS configurations and 95.66% and 93.70% compared to the base scenario. Figure 7 demonstrates the SOx emissions from using different H2 sources in PEMFCs for 1.96 years.
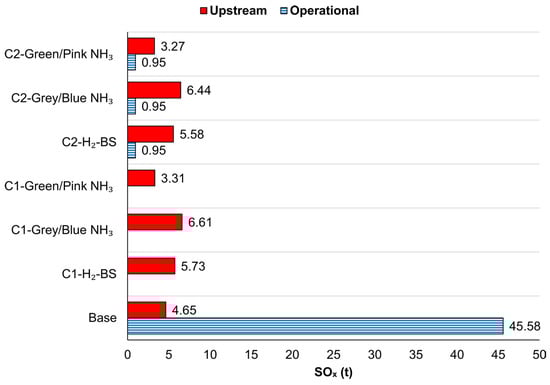
Figure 7.
SOx resulting from configurations regarding the NH3 production method.
In the base case, SOx emissions were at 45.98 tonnes from operational activities, 4.65 tonnes from upstream processes, for a total of 50.23 tonnes, as shown in Figure 7. The C1 and C2 designs, utilising outsourced H2, emitted 5.73 and 6.52 tonnes of SOx, representing significant reductions of 88.59% and 87.02%, respectively.
SOx emissions for grey and blue NH3 were identical. Using grey or blue NH3 generally increased SOx emissions compared to the H2-BS case. C1 and C2 emitted 6.61 and 7.39 tonnes of SOx, corresponding to increases of 15.37% and 28.88%, respectively. Despite this, PEMFCs powered by H2 derived from blue or grey NH3 under the C1 and C2 designs achieved SOx reductions of 86.83% and 85.29% compared to the MDE utilisation scenario.
For green NH3, SOx emissions were identical regardless of whether nuclear or renewable energy sources were used. SOx emissions were calculated at 3.31 tonnes for C1 and 4.22 tonnes for C2, equivalent to decreases of 93.42% and 91.61% compared to the base case. Additionally, reductions of 42.31% for C1 and 26.47% for C2 were observed relative to the H2-BS case. Figure 8 depicts the NOx emission comparison between NH3 decomposition system usage and outsourcing H2.
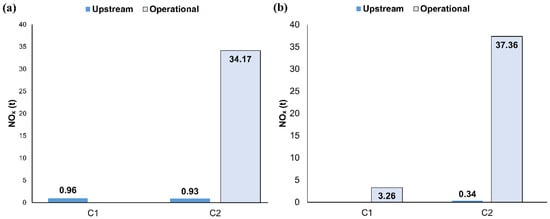
Figure 8.
NOx resulting from (a) H2-BS, (b) H2 derived from NH3 decomposition onboard.
The upstream and operational NOx emissions for the base case were calculated at 1646.31 tonnes and 16.46 tonnes, respectively, resulting in a total of 1662.77 tonnes. In the H2-BS case, C1 emitted only 0.96 tonnes of upstream NOx emissions, as shown in Figure 8a, corresponding to a 99.94% reduction in total NOx emissions compared to the base scenario. For C2, total NOx emissions amounted to 37.70 tonnes, representing a 97.89% reduction. This difference is attributed to the limited consumption of HFO during C2 operations.
The NH3 cracking system uses heat generated by burning NH3 for decomposition, leading to a slight increase in operational NOx emissions. The additional NOx emissions from this process were calculated at 3.26 tonnes for C1 and 3.19 tonnes for C2. However, since H2 is no longer outsourced, upstream NOx emissions were reduced to zero for C1 and 0.34 tonnes for C2, as illustrated in Figure 8b.
For C1, total NOx emissions increased by 2.3 tonnes compared to the H2-BS case, but a 99.8% reduction was still achieved relative to the base scenario. A similar trend was observed for C2, where total emissions increased by 7.43% compared to the H2-BS case, achieving a 97.73% reduction compared to the base configuration. The economic performance of various NH3 feedstocks and the H2-BS case was evaluated by calculating the LCOE as shown in Figure 9 for 2025 and 2040 under low and high projection scenarios.
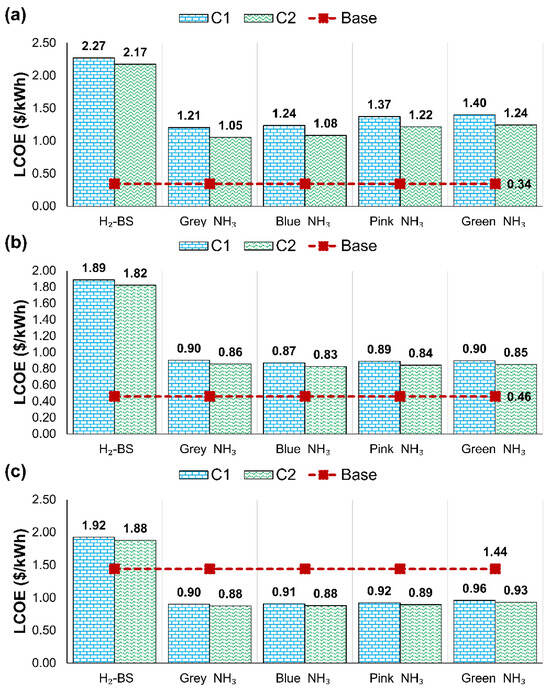
Figure 9.
LCOE of different NH3 feedstocks and H2-BS for (a) 2025, (b) 2040-low, and (c) 2040-high.
The marine power distribution plant generated 3443.51 MWh of energy annually. The LCOE values presented in Figure 9 were derived by calculating the annual fuel and operation costs and the total investment costs in Appendix C. The base scenario was presented only with H2-BS, as it remained unchanged in other calculations. Overall, the NH3 decomposition system was a more economically viable option over the H2-BS due to the decreased storage costs and lower fuel prices.
In 2025, the base scenario had a LCOE at USD 0.34 per kWh, and the PEMFC scenarios performed worse economically. The most feasible option was C2 with the grey NH3 cracking system onboard at 1.05 USD/kWh, as shown in Figure 9a. Blue NH3 with the C2 had a close performance at 1.08 USD/kWh, and considering its environmental superiority over grey NH3 feedstock, it could be a more attractive option. A similar trend was observed for C1 with a higher level of LCOEs over 1.21 USD/kWh.
Due to the slightly increased carbon prices in the 2040 low-economic scenario, as illustrated in Figure 9b, the LCOEs of NH3 decomposition scenarios became more viable options. The base-case LCOE rose to 0.46 USD/kWh, whereas the LCOE for H2-BS decreased to USD 1.89 and USD 1.82 per kWh for scenarios C1 and C2, respectively. Among the decomposition pathways, blue NH3 decomposition offered the lowest LCOE, at 0.83 and 0.87 USD/kWh, followed closely by pink NH3 cracking.
The high economic projection for 2040, as illustrated in Figure 9c, identified the base case as the worst performer, with an LCOE of USD 1.44 per kWh, which was significantly higher than NH3-cracking configurations due to the increased carbon prices. The H2-BS system remained the costliest among all options. Grey and blue NH3 decomposition under scenario C2 achieved an LCOE of USD 0.88 per kWh, while pink NH3 reached USD 0.89 per kWh. For scenario C1, the same feedstocks resulted in LCOEs ranging between USD 0.90 and USD 0.92 per kWh. These findings underscore that only implementing higher carbon taxes makes NH3 decomposition scenarios more cost-competitive than fossil fuel utilisation.
An MCDM analysis using the COPRAS methodology integrated with the entropy weighing method was conducted to combine the environmental and economic studies. The CO2e and other emissions as the environmental indicator and LCOE as the financial performance index were taken in the analysis. Table 7 indicates the criteria weights based on the economic projection scenario and year.
Table 7.
Criteria weights regarding the Entropy Method.
The entropy method successfully assigned weights consistent with the criteria. LCOE received the highest weight, ranging from 0.478 to 0.480, followed by CO2e, which varied between 0.384 and 0.386, and other emissions at 0.134. The LCOE accounted for 48% of the total weight, while the environmental metrics collectively represented 52%. The detailed results of the entropy method are demonstrated in Appendix D. Table 8 shows the outcomes of the COPRAS calculation stages.
Table 8.
COPRAS outcomes.
The computation of was excluded, and it was taken as zero since all the criteria were the non-beneficial or cost type in the analysis. For instance, the was calculated for C1 grey NH3 by computing the ratio of minimum of the criterion and , which was found at 0.10 in 2025. Then, applying Equations (11) and (12), and were calculated at 0.07 and 50.19 for 2025 in Table 8. Figure 10 illustrates the resulting rankings based on the values shown in the table.
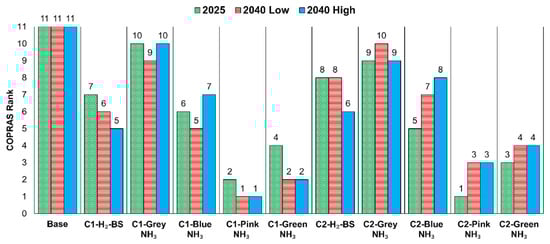
Figure 10.
COPRAS ranks of configurations.
The base configuration consistently placed 11th across all economic cases. Similarly, in every economic scenario, the use of grey NH3 for onboard H2 production with the C1 and C2 configurations held the 10th and 9th positions, respectively. H2-BS also performed poorly, with C1 and C2 designs falling between 7th and 8th. Overall, in 2025, the C2 pink NH3 combination was identified as the most favourable option. However, by 2040, the top position shifted to the C1 pink NH3 combination. Additionally, by 2040, C1 green NH3 rose to second place, overtaking C2 pink NH3, which had previously held that position in 2025.
The sensitivity analysis of COPRAS evaluated 495 instances, classifying them as feasible (F) or non-feasible (NF). Of these, 460 cases were deemed F, while 35 are NF, resulting in a feasibility rate of 92.93%. Among the 460 F instances, 93 were sensitive to changes (with a change rate below 5%), while 367 were resistant to weight changes, demonstrating the validity of the COPRAS method in this analysis. Further details can be found in Appendix E.
4. Discussion
The evaluated hybrid electrification systems reduced ship CO2e emissions to 15.83% with pink NH3 decomposition. It should be noted that the analysis can involve the FC/battery production phase emissions, elevating CO2e emissions by 20–30%. However, this increase is offset by a substantial overall reduction in emissions compared to conventional systems [61]. The potential for emissions reduction increases to approximately 50% with the implementation of zero-carbon electrification alongside LNG-DF engines in the propulsion unit. Furthermore, employing LNG-fuelled DF engines within diesel-electric propulsion systems can lead to a CO2e emission decrease of up to 20% while adhering to the EEXI and CII requirements [95]. The turbine technologies demonstrate greater carbon reduction potential than DF engines. Incorporating carbon-free fuels like NH3 or H2 in their operation is essential for sustainable energy transitions [96]. However, currently available alternative fuels such as LNG or methanol do not meet the 2050 decarbonisation targets. Bridging this gap requires advanced energy systems and a shift to carbon-neutral fuels [69]. FCs for ship electrification present a favourable avenue for enhancing overall ship energy efficiency when combined with DFs or turbines. Additionally, green H2 can be regarded as a promising alternative fuel for the shipping industry, facilitating significant emissions reductions and promoting long-term sustainability [96].
The H2-BS scenario has demonstrated inferior performance compared to the NH3 decomposition process for H2 generation on board, both economically and environmentally, particularly when utilising pink and green NH3 as feedstocks. The H2-BS scenarios for ship electrification are problematic for marine vessels due to shorter bunker intervals, increased volume requirements [33], and the absence of clearly defined safety protocols [97]. Additionally, the existing H2 fuel production, storage, and distribution capacity is inadequate to support the comprehensive global deployment of marine vehicles utilising H2 FC-based hybrid topologies [98]. Consequently, an industrial product such as using NH3 as a H2 carrier can address supply challenges by offering enhanced flexibility for these systems [15].
NH3 is rich in H2 and storable at ambient temperature and pressure and presents an effective medium for H2 storage, even though it is toxic [99]. Nuclear energy has emerged as a significant source of NH₃ production in the analysis, characterised by low costs, and reduced emissions. Green NH3, while following closely in emissions performance, is hindered by its higher production costs, resulting in its lower ranking than pink NH3 options. Nuclear-sourced or pink NH3 demonstrates significantly lower GHG emissions than the currently available and widely used industrial methods [100]. For instance, according to Bicer and Dincer [101], nuclear-based NH3 production results in a significantly lower GWP compared to SMR. Specifically, SMR-based grey NH3 production emits approximately 2.97 kg CO2e per kilogram of NH3, whereas nuclear-based production emits only about 0.23 kg CO2e per kilogram, indicating a 92% reduction in GWP.
The maritime industry has started to see nuclear energy as a viable alternative, and the possible usage of onboard nuclear power is beginning to be considered [102]. Considering the public concerns regarding nuclear energy [103], challenges related to uranium sourcing and waste management issues [104], investments in green NH3 are perceived as a more favourable option [105]. Currently, the Haber–Bosch method, commonly employed for NH3 production, is highly energy-intensive and generates substantial CO2 emissions. Although grey NH3 may provide better economic performance, it does not meet emission targets, making such investments counterproductive. A strategic combination of blue, pink, and grey NH3 will be essential to achieve forthcoming decarbonisation goals effectively. This integrated approach addresses economic viability and aligns with necessary environmental standards [106]. Enhanced carbon capture in blue NH3 production and greater utilisation of green energy sources could further reduce costs and environmental impacts for both types of NH3 [107].
The smaller plant (C2) investment is being prioritised in 2025 due to its immediate benefits. However, projections for 2040 indicate that the larger plant (C1) becomes more advantageous, providing greater long-term returns. The high capital costs of PEMFCs, which require multiple replacements during their lifespan, along with the expenses for WHRS and NH₃ cracking and storage, lead to a higher LCOE for electrification plants, making them less competitive than diesel engines in 2025 economic cases. Nonetheless, by 2040, substantially increased carbon taxes are expected to raise the LCOE of conventional engines, resulting in a more favourable LCOE for FC-based configurations compared to diesel engines [108].
Although there is growing interest in NH3 as a fuel, the current technology is still theoretical and requires practical validation in real-world marine environments. For instance, utilising NH3 in combustion engines presents significant challenges due to its corrosive properties, which can lead to the deterioration of critical engine components such as pistons, cylinders, and valves [14]. Furthermore, the storage and transportation of NH3 necessitate stringent safety measures, as any leaks can pose severe health hazards. These factors underscore the need for careful consideration and robust engineering solutions when integrating NH3 into existing fuel systems [109]. NH3-powered smaller engines and NH3 as an H2 carrier for FC-based ship electrification represent a more feasible initial stage for implementation [110,111].
5. Conclusions
The study evaluated two distinct PEMFC/battery/WHRS configurations within a marine power distribution system integrated with an NH3 decomposition system, considering grey, blue, pink, and green NH3 production methods. The main findings derived from this study can be listed as follows:
Environmental analysis demonstrated that the overall performance of the NH3 decomposition system with pink and green NH3 is superior to that of green H2-BS.
- SOx emissions mildly increased due to grey and blue NH3, while green/pink NH3 cracking performed better than H2-BS.
- NOx emissions slightly rose because of the onboard NH3 decomposition system compared to H2-BS.
- Economic analysis depicted that the NH3 decomposition system is more economically viable than H2-BS due to lower storage costs and fuel prices.
- Increased level of carbon penalties increased the economic viability of a larger PEMFC plant (C1) with pink/green NH3-decomposition system.
- In the 2040-high cases, NH3 cracking onboard was more cost-beneficial than the base case.
Limitations of the study are listed as follows:
- In the economic assessment, it has been postulated that the costs of equipment, for which future projections are lacking, will remain stable.
- The environmental analysis included only emissions from the NH3 cracking system with available emission coefficients.
- The results are based on selected emission and efficiency coefficients sourced from current industrial data and literature; these represent the best available estimates at the time of the study. However, the outcomes may vary as these parameters are subject to change with future technological advancements in NH3 production and related systems.
- This study uses a well-to-wake approach, excluding manufacturing emissions of FCs and batteries. As a result, the systems’ environmental impact may be slightly underestimated due to their production emissions.
- The scrap values of FC and batteries have been excluded from the analysis.
Although based on a bulk carrier, this study’s methodology offers insights applicable to other ship types, including container vessels and tankers. It is important to note that operational differences specific to ship types and equipment, such as tank heating or cargo handling, may affect load demand and influence emission reduction potential slightly.
This research adds to the existing literature by delivering an in-depth analysis of NH3 decomposition systems for the onboard H2 production utilised in PEMFCs within ship electrification systems. The impact of different NH3 production methodologies on the environmental and economic performance was investigated in detail. The study’s findings can benefit academicians working on maritime decarbonisation or NH3 cracking areas, ship designers, and powertrain manufacturers willing to enhance systems for marine vessels.
Future research will investigate the integration of PV systems, power take-in/power take-off (PTI/PTO) technologies, and other suitable alternative energy sources alongside FCs and onboard hydrogen production systems. The optimisation of sizing for these systems will be a key focus of this investigation. A more comprehensive evaluation would benefit from incorporating full life cycle assessments that account for the embodied energy and emissions from the production of battery and FC systems. Incorporating a detailed sensitivity analysis to evaluate the effects of price uncertainties on system performance and investment decisions would constitute a valuable direction for future research, offering deeper insights into the robustness and adaptability of the modelled scenarios.
Another research direction may prioritise a comprehensive risk assessment of the proposed system design, focusing on the bunkering, storage, and transfer of H2 and NH3 onboard. Identifying potential hazards and mitigating associated risks is vital for ensuring safety and regulatory compliance. Given that the analysis primarily considers theoretical aspects in an “ideal environment”, it is crucial to acknowledge that real marine conditions present challenges such as vibrations, impacts, and possible chemical interactions with NH3.
Additionally, exploring various cracking systems and conducting thermodynamic analyses of NH3 decomposition processes can enhance overall system efficiency. This application may aim to identify optimal methods for onboard H2 production, facilitating integration into the broader energy system and promoting sustainability in NH3 utilisation as a marine fuel. Furthermore, implementing FCs in conjunction with decomposition systems across different vessel types presents an opportunity for innovation. Assessing the integration of FCs with diverse vessel designs will provide insights into performance metrics, operational feasibility, and economic viability in various maritime contexts. Enhancing these areas is essential for the safe and efficient adoption of H2 and NH3 as alternative marine fuels, ultimately contributing to the decarbonisation of the shipping industry.
Author Contributions
Conceptualisation, O.Y., E.B.-D. and M.A.; methodology, O.Y., E.B.-D., J.W. and G.V.S.; software, O.Y.; validation, O.Y. and N.T.; formal analysis, O.Y., E.B.-D., M.A., G.V.S., M.C.D.P. and M.P.; investigation, O.Y., E.B.-D., A.S., D.H. and G.V.S.; resources, E.B.-D., J.W., N.T., M.C.D.P. and M.P.; data curation, N.T., O.Y., M.C.D.P. and M.P.; writing—original draft preparation, O.Y., E.B.-D., A.S., D.H., G.V.S. and J.W.; review and editing, O.Y., E.B.-D., A.S., D.H., G.V.S., M.C.D.P., M.P. and J.W.; visualisation, O.Y., E.B.-D., A.S., D.H., G.V.S., M.C.D.P. and J.W.; supervision, J.W., E.B.-D., M.C.D.P. and M.P.; project administration, E.B.-D., A.S. and M.P.; funding acquisition, E.B.-D., A.S., M.A., N.T. and M.P. All authors have read and agreed to the published version of the manuscript.
Funding
This research was funded by Retrofit Solutions to Achieve 55% GHG Reduction by 2030, grant number 10064483 from UKRI and from EU (grant number: Horizon Europe 101096068).
Institutional Review Board Statement
Not applicable.
Informed Consent Statement
Not applicable.
Data Availability Statement
The dataset generated during this study is available in Zenodo and can be accessed via the persistent identifier https://doi.org/10.5281/zenodo.15457758. This dataset is made available under the license: Creative Commons Attribution 4.0 International License (CC-BY 4.0). For additional inquiries regarding the dataset, please contact the corresponding author.
Conflicts of Interest
Author Nikolaos Tsoulakos was employed by the company Laskaridis Shipping Co., Ltd. Milad Armin was the owner of the company Enki Marine Technology Consultancy. The remaining authors declare that the research was conducted in the absence of any commercial or financial relationships that could be construed as a potential conflict of interest.
Nomenclature
| Abbreviation or Symbol | Explanation | Unit |
| Ai, Aj | Assessed alternatives in the sensitivity analysis | - |
| Normalised performance values of alternatives Ai and Aj for criterion k in the sensitivity analysis | - | |
| AC | Alternating current | - |
| Bi | Cost index of beneficial criteria in COPRAS | - |
| Ca | Actual battery capacity | Ah |
| CB | Available battery capacity | Ah |
| Ci | Cost index of non-beneficial criteria in COPRAS | - |
| Cin | Initial maximum capacity | Ah |
| Fuel prices | USD | |
| Co&m | Operation and maintenance cost | USD |
| Cp | Specific heat rate of the exhaust | kJ/kg·K |
| Capital cost of systems | USD | |
| CEPCI | Chemical Engineering Plant Cost Index | - |
| CH4 | Methane | - |
| CO2 | Carbon dioxide | - |
| CO2e | Equivalent carbon dioxide | - |
| COPRAS | Complex Proportional Assessment | - |
| D/G | Diesel generator | - |
| DC | Direct current | - |
| ej | Entropy | - |
| F | Feasible (in sensitivity analysis) | - |
| The data point to be normalised in the entropy method | - | |
| FC | Fuel cell | - |
| GHG | Greenhouse gas | - |
| GWP | Global warming potential for 100 years | - |
| H2 | Hydrogen | - |
| H2-BS | Green hydrogen bunkering scenario | - |
| HFO | Heavy fuel oil | - |
| I | Current | A |
| IMO | International Maritime Organization | - |
| LCOE | Levelised cost of energy | - |
| LNG | Liquefied natural gas | - |
| LT | Plant lifetime | Years or hours |
| m | The number of rows in the entropy method | - |
| Exhaust mass flow rate | kg/s | |
| M/E | Main engine | - |
| M/V | Motor vessel | - |
| MCDM | Multi-criteria decision-making | - |
| MDE | Marine diesel engines | - |
| N2O | Nitrous oxide | - |
| n | Number of criteria in the entropy method | - |
| Weighted normalisation matrix in COPRAS | - | |
| nPEMFC | Number of working PEMFCs | - |
| NF | Non-feasible (in sensitivity analysis) | |
| NH3 | Ammonia | - |
| NOx | Nitrogen oxides | - |
| OE | Operational (tank-to-wake) emissions | g or t |
| OEC | Operational emission coefficient | g emission/g fuel) |
| ORC | Organic Rankine cycle | - |
| Pi. Pj | Aggregate scores for assessed alternatives in the sensitivity analysis in the weighted normalised decision matrix. | - |
| Pgen | The plant’s generated total power | kW |
| PPEMFC | Power output of one PEMFC | kW |
| PEMFC | Proton exchange membrane fuel cell | - |
| PV | Photovoltaic | - |
| r | Discount rate | - |
| R | The utilised parameter for each independent metric in the uncertainty analysis | - |
| rij | Normalised data in the entropy method | - |
| SFC | Specific fuel consumption | |
| SMR | Steam methane reforming | - |
| SOx | Sulphur oxides | - |
| SoC | Stage of charge | - |
| SOFC | Solid oxide fuel cell | - |
| SoH | State of health | - |
| Qi | The relative significance of alternatives in COPRAS | - |
| t | Operation time | h |
| The inlet temperature of the exhaust (after the exhaust boiler) | K | |
| Outlet temperature from ORC | K | |
| U | Uncertainty | - |
| UDi | Utility degrees in COPRAS | |
| UE | Upstream (well-to-tank) emissions | g or t |
| UEC | Upstream emission coefficient | g UE/g OE or g/kWh |
| wj | Criteria weights calculated in the entropy method | - |
| Wk | Criteria weights assessed in the sensitivity analysis | - |
| WHRS | Waste heat recovery system | |
| Greek Symbols | ||
| Minimum required adjustment in weight of criterion k to reverse the ranking between alternatives in the sensitivity analysis | - | |
| Enthalpy change | kJ/mol | |
| Columbic efficiency | - | |
| Efficiency of fuel cell | - | |
| Organic Rankine cycle efficiency | - | |
Appendix A
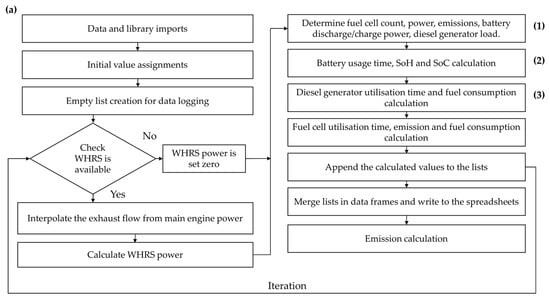
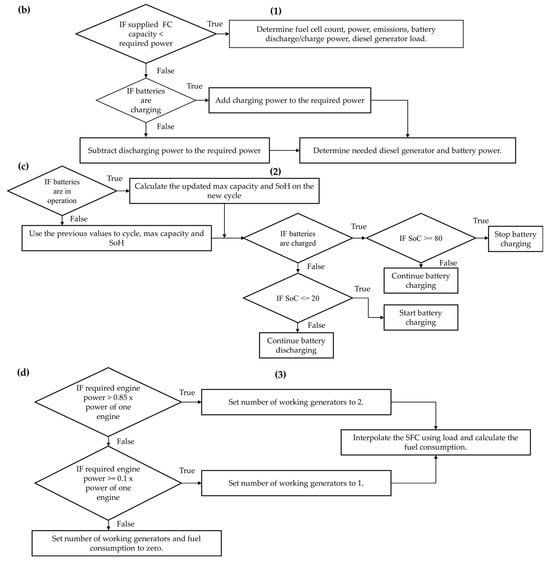
Figure A1.
Simplified algorithm scheme: (a) general process, (b) FC determination details, (c) battery operation, and (d) D/G fuel consumption calculation.
Appendix B
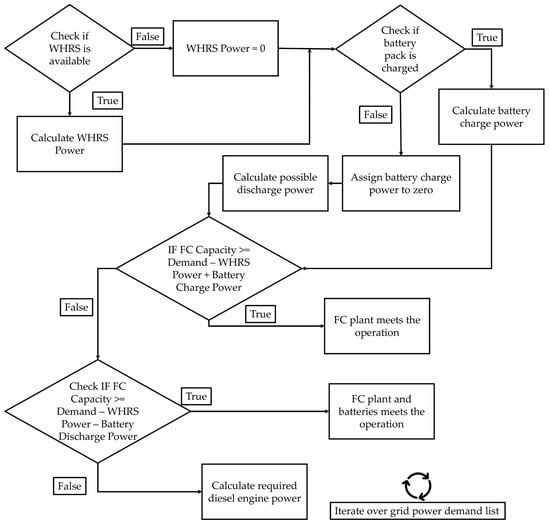
Figure A2.
Simplified energy management strategy for establishing the hierarchy among power equipment.
Appendix C
Table A1.
Installation, operation, and fuel costs of the configurations.
Table A1.
Installation, operation, and fuel costs of the configurations.
| FC | Battery | NH3 Storage P/T | H2 Storage P/T | HFO Storage | NH3 Cracker | WHRS | MDE | Total | ||||||||
|---|---|---|---|---|---|---|---|---|---|---|---|---|---|---|---|---|
| 2025 | 2040 | 2025 | 2040 | 2025 | 2040 | 2025 | 2040 | 2025/2040 | 2025 | 2040 | 2025/2040 | 2025/2040 | 2025 | 2040 | ||
| C1 | 6,097,104 | 3,129,703 | 685,840 | 442,367 | 9,435,707 | 6,086,031 | 8,860,660 | 8,283,109 | 0 | 0 | 2,648,824 | 1,708,491 | 1,348,579 | 1,348,579 | 622,987 | |
| C2 | 5,080,920 | 2,608,086 | 234,401 | 151,189 | 9,053,576 | 5,839,556 | 6,625,170 | 8,205,986 | 14,530 | 14,530 | 2,541,550 | 1,639,300 | 1,348,579 | 1,348,579 | 1,245,974 | |
| Base | N/A | N/A | N/A | N/A | N/A | N/A | N/A | N/A | 700,157 | N/A | N/A | N/A | 1,868,962 | 2,569,119 | 2,569,119 | |
| FC | Battery | NH3 Storage P/T | H2 Storage P/T | HFO Storage | NH3 Cracker | WHRS | MDE | Total | ||||||||
| 2024 | 2040 | 2024 | 2040 | 2024 | 2040 | 2024 | 2040 | 2024/2040 | 2024 | 2040 | 2024/2040 | 2024/2040 | 2024 | 2040 | ||
| C1 | 91,457 | 46,946 | 6858 | 4424 | 94,357 | 60,860 | 217,439 | 211,663 | 0 | 0 | 31,083 | 20,049 | 20,229 | 20,229 | 9345 | |
| C2 | 76,214 | 39,121 | 2344 | 1512 | 90,536 | 58,396 | 130,668 | 125,004 | 145 | 145 | 31,083 | 20,049 | 20,229 | 20,229 | 18,690 | |
| Base | N/A | N/A | N/A | N/A | N/A | N/A | N/A | N/A | 7002 | N/A | N/A | N/A | N/A | 28,034 | 35,036 | 35,036 |
| H2—BS | Grey NH₃ | Blue NH₃ | Pink NH₃ | Green NH₃ | ||||||||||||
| 2024 | 2040 | 2024 | 2040 | 2024 | 2040 | 2024 | 2040 | 2024 | 2040 | 2024 | 2040 | 2024 | 2040—Low | 2040—High | ||
| C1 | 581,633 | 362,008 | 487,641 | 193,182 | 193,182 | 193,182 | 313,815 | 84,359 | 210,897 | 774,414 | 63,269 | 189,807 | 889,985 | 187,277 | 404,922 | |
| C2 | 587,792 | 380,817 | 574,189 | 189,971 | 194,686 | 262,603 | 305,719 | 90,270 | 279,601 | 747,664 | 70,034 | 259,365 | 858,555 | 189,020 | 465,769 | |
| Base | N/A | N/A | N/A | N/A | N/A | N/A | N/A | N/A | N/A | N/A | N/A | N/A | 838,992 | 1,243,776 | 4,624,963 | |
Appendix D
Table A2.
Normalised matrix and entropy results.
Table A2.
Normalised matrix and entropy results.
| CO2e | Other Emissions | LCOE 2025 | LCOE 2040 Low | LCOE 2040 High | |
|---|---|---|---|---|---|
| Base | 0.336 | 0.870 | 0.023 | 0.041 | 0.115 |
| C1 H₂-BS | 0.028 | 0.003 | 0.156 | 0.170 | 0.154 |
| C1 Grey NH₃ | 0.159 | 0.005 | 0.083 | 0.081 | 0.072 |
| C1 Blue NH₃ | 0.104 | 0.005 | 0.085 | 0.078 | 0.072 |
| C1 Green NH₃ -N | 0.015 | 0.003 | 0.094 | 0.080 | 0.074 |
| C1 Green NH₃-R | 0.015 | 0.003 | 0.096 | 0.081 | 0.077 |
| C2 H₂-BS | 0.034 | 0.021 | 0.149 | 0.164 | 0.150 |
| C2 Grey NH₃ | 0.160 | 0.023 | 0.072 | 0.077 | 0.070 |
| C2 Blue NH₃ | 0.107 | 0.023 | 0.074 | 0.074 | 0.070 |
| C2 Green NH₃-N | 0.021 | 0.021 | 0.083 | 0.076 | 0.071 |
| C2 Green NH₃-R | 0.021 | 0.021 | 0.085 | 0.077 | 0.074 |
| CO2e | Other Emissions | LCOE 2025 | LCOE 2040 Low | LCOE 2040 High | |
| Base | -0.37 | −0.12 | −0.09 | −0.13 | −0.25 |
| C1 H₂-BS | −0.10 | −0.02 | −0.29 | −0.30 | −0.29 |
| C1 Grey NH₃ | −0.29 | −0.03 | −0.21 | −0.20 | −0.19 |
| C1 Blue NH₃ | −0.24 | −0.03 | −0.21 | −0.20 | −0.19 |
| C1 Green NH₃ -N | −0.06 | −0.02 | −0.22 | −0.20 | −0.19 |
| C1 Green NH₃-R | 0.00 | −0.02 | −0.22 | −0.20 | −0.20 |
| C2 H₂-BS | −0.11 | −0.08 | −0.28 | −0.30 | −0.28 |
| C2 Grey NH₃ | −0.29 | −0.09 | −0.19 | −0.20 | −0.19 |
| C2 Blue NH₃ | −0.24 | −0.09 | −0.19 | −0.19 | −0.19 |
| C2 Green NH₃-N | −0.08 | −0.08 | −0.21 | −0.20 | −0.19 |
| C2 Green NH₃-R | −0.08 | −0.08 | −0.21 | −0.20 | −0.19 |
Appendix E
Table A3.
Sensitivity analysis results.
Table A3.
Sensitivity analysis results.
| Comparison | CO₂e | SOₓ + NOₓ | LCOE—2025 | CO₂e | SOₓ + NOₓ | LCOE-2040 L | CO₂e | SOₓ + NOₓ | LCOE 2040 H |
|---|---|---|---|---|---|---|---|---|---|
| A1-A2 | −0.02 | 0.00 | −0.10 | −0.10 | 0.00 | 0.00 | −1.19 | −3.25 | 2.27 |
| A1-A3 | −0.27 | 0.00 | 0.09 | −0.08 | −0.23 | 0.20 | −0.01 | 0.00 | −0.09 |
| A1-A4 | −0.08 | 0.20 | −0.11 | −0.08 | −0.20 | 0.16 | −0.18 | −0.46 | 0.24 |
| A1-A5 | 0.04 | 0.12 | −0.20 | −0.19 | 0.00 | 0.01 | −0.04 | −0.04 | −0.13 |
| A1-A6 | 0.04 | 0.11 | −0.19 | −0.19 | −0.04 | 0.04 | −0.03 | 0.00 | −0.16 |
| A1-A7 | −0.25 | 0.00 | 0.03 | −0.03 | 0.00 | −0.18 | −0.15 | −0.03 | 0.02 |
| A1-A8 | −0.20 | 0.04 | −0.05 | −0.04 | −0.04 | −0.14 | −0.14 | 0.00 | 0.00 |
| A1-A9 | −0.30 | 0.00 | 0.03 | −0.25 | 0.00 | 0.00 | −0.20 | −0.03 | 0.02 |
| A1-A10 | −0.26 | 0.03 | −0.03 | −0.25 | −0.03 | 0.02 | −0.20 | 0.00 | 0.00 |
| A1-A11 | −0.40 | −1.07 | 0.08 | −0.35 | −0.95 | 0.05 | −0.37 | −1.01 | −0.04 |
| A2-A3 | −0.45 | 0.01 | 0.24 | −0.08 | −0.24 | 0.21 | 0.30 | 0.85 | −0.70 |
| A2-A4 | −0.10 | 0.26 | −0.12 | −0.08 | −0.21 | 0.17 | −0.01 | 0.00 | −0.09 |
| A2-A5 | 0.05 | 0.13 | −0.21 | −0.20 | 0.00 | 0.01 | −0.03 | 0.00 | −0.16 |
| A2-A6 | 0.04 | 0.12 | −0.20 | −0.19 | −0.04 | 0.04 | −0.01 | 0.04 | −0.19 |
| A2-A7 | −0.26 | 0.00 | 0.04 | −0.03 | 0.00 | −0.18 | −0.14 | 0.00 | 0.00 |
| A2-A8 | −0.21 | 0.04 | −0.04 | −0.04 | −0.04 | −0.14 | −0.13 | 0.03 | −0.02 |
| A2-A9 | −0.31 | 0.00 | 0.03 | −0.25 | 0.00 | 0.00 | −0.19 | 0.00 | 0.00 |
| A2-A10 | −0.27 | 0.03 | −0.03 | −0.25 | −0.03 | 0.02 | −0.19 | 0.02 | −0.01 |
| A2-A11 | −0.41 | −1.10 | 0.08 | −0.35 | −0.95 | 0.05 | −0.37 | −0.99 | −0.05 |
| A3-A4 | 0.12 | 0.41 | −0.34 | −0.03 | 0.00 | −0.10 | −0.51 | −1.41 | 0.91 |
| A3-A5 | 0.18 | 0.16 | −0.32 | −0.22 | 0.04 | −0.04 | −0.04 | −0.04 | −0.14 |
| A3-A6 | 0.15 | 0.15 | −0.30 | −0.22 | 0.00 | 0.00 | −0.03 | 0.00 | −0.16 |
| A3-A7 | −0.25 | −0.01 | 0.02 | −0.02 | 0.04 | −0.25 | −0.16 | −0.03 | 0.03 |
| A3-A8 | −0.19 | 0.04 | −0.06 | −0.03 | 0.00 | −0.20 | −0.15 | 0.00 | 0.01 |
| A3-A9 | −0.30 | 0.00 | 0.02 | −0.27 | 0.03 | −0.03 | −0.21 | −0.03 | 0.02 |
| A3-A10 | −0.26 | 0.03 | −0.05 | −0.27 | 0.00 | 0.00 | −0.21 | 0.00 | 0.01 |
| A3-A11 | −0.41 | −1.14 | 0.08 | −0.38 | −1.01 | 0.04 | −0.38 | −1.04 | −0.04 |
| A4-A5 | 0.21 | 0.00 | −0.31 | −0.22 | 0.04 | −0.03 | −0.03 | 0.00 | −0.17 |
| A4-A6 | 0.17 | 0.00 | −0.28 | −0.22 | 0.00 | 0.01 | −0.02 | 0.04 | −0.19 |
| A4-A7 | −0.31 | −0.08 | 0.08 | −0.02 | 0.04 | −0.25 | −0.15 | 0.00 | 0.01 |
| A4-A8 | −0.23 | 0.00 | −0.03 | −0.03 | 0.00 | −0.20 | −0.14 | 0.03 | −0.01 |
| A4-A9 | −0.35 | −0.05 | 0.06 | −0.28 | 0.03 | −0.03 | −0.20 | 0.00 | 0.01 |
| A4-A10 | −0.30 | 0.00 | −0.02 | −0.28 | 0.00 | 0.00 | −0.20 | 0.02 | −0.01 |
| A4-A11 | −0.44 | −1.24 | 0.10 | −0.38 | −1.03 | 0.04 | −0.38 | −1.03 | −0.05 |
| A5-A6 | −0.02 | 0.00 | −0.14 | −0.17 | −1.05 | 0.85 | 0.90 | 3.00 | −2.22 |
| A5-A7 | −0.49 | −0.10 | 0.22 | 2.30 | 0.05 | −2.73 | −0.59 | −0.01 | 0.62 |
| A5-A8 | −0.34 | −0.01 | 0.04 | 1.45 | −0.33 | −1.51 | −0.53 | 0.12 | 0.50 |
| A5-A9 | −0.46 | −0.06 | 0.14 | −0.44 | 0.00 | −0.02 | −0.55 | −0.01 | 0.34 |
| A5-A10 | −0.39 | 0.00 | 0.04 | −0.43 | −0.14 | 0.09 | −0.53 | 0.07 | 0.28 |
| A5-A11 | −0.51 | −1.36 | 0.15 | −0.51 | −1.90 | 0.10 | −0.81 | −2.27 | 0.08 |
| A6-A7 | −0.53 | −0.11 | 0.25 | 4.96 | 1.23 | −6.58 | −0.66 | −0.16 | 0.77 |
| A6-A8 | −0.35 | −0.01 | 0.05 | 2.32 | 0.06 | −2.78 | −0.60 | −0.01 | 0.63 |
| A6-A9 | −0.49 | −0.07 | 0.15 | −0.48 | 0.17 | −0.16 | −0.58 | −0.09 | 0.41 |
| A6-A10 | −0.41 | 0.00 | 0.04 | −0.46 | 0.00 | −0.02 | −0.56 | −0.01 | 0.35 |
| A6-A11 | −0.52 | −1.39 | 0.15 | −0.52 | −1.93 | 0.07 | −0.83 | −2.35 | 0.12 |
| A7-A8 | 0.04 | 0.23 | −0.39 | −0.34 | −1.13 | 1.05 | 0.39 | 2.36 | −1.51 |
| A7-A9 | −0.43 | 0.00 | 0.02 | −1.43 | −0.02 | 0.96 | −0.50 | 0.00 | 0.00 |
| A7-A10 | −0.29 | 0.10 | −0.15 | −1.35 | −0.20 | 1.04 | −0.46 | 0.16 | −0.10 |
| A7-A11 | −0.51 | −1.89 | 0.12 | −0.73 | −2.05 | 0.32 | −0.92 | −3.40 | −0.19 |
| A8-A9 | −1.22 | −0.39 | 0.71 | −1.66 | 0.21 | 0.94 | −0.57 | −0.18 | 0.12 |
| A8-A10 | −0.54 | 0.00 | 0.02 | −1.54 | −0.02 | 1.04 | −0.52 | 0.00 | 0.00 |
| A8-A11 | −0.63 | −2.34 | 0.22 | −0.74 | −2.08 | 0.29 | −0.96 | −3.58 | −0.15 |
| A9-A10 | 0.01 | 0.32 | −0.54 | −0.11 | −2.75 | 2.25 | 0.10 | 2.50 | −1.60 |
| A9-A11 | −0.54 | −2.61 | 0.15 | −0.53 | −2.60 | 0.14 | −1.23 | −5.89 | −0.33 |
| A10-A11 | −0.66 | −3.23 | 0.30 | −0.54 | −2.60 | 0.10 | −1.30 | −6.33 | −0.26 |
| Comparison | CO₂e | SOₓ + NOₓ | LCOE -2025 | CO₂e | SOₓ + NOₓ | LCOE-2040 L | CO₂e | SOₓ + NOₓ | LCOE 2040 H |
| A1-A2 | F | F | F | F | F | F | F | F | NF |
| A1-A3 | F | F | F | F | F | F | F | F | F |
| A1-A4 | F | NF | F | F | F | F | F | F | F |
| A1-A5 | F | F | F | F | F | F | F | F | F |
| A1-A6 | F | F | F | F | F | F | F | F | F |
| A1-A7 | F | F | F | F | F | F | F | F | F |
| A1-A8 | F | F | F | F | F | F | F | F | F |
| A1-A9 | F | F | F | F | F | F | F | F | F |
| A1-A10 | F | F | F | F | F | F | F | F | F |
| A1-A11 | F | F | F | F | F | F | F | F | F |
| A2-A3 | F | F | F | F | F | F | F | NF | F |
| A2-A4 | F | NF | F | F | F | F | F | F | F |
| A2-A5 | F | F | F | F | F | F | F | F | F |
| A2-A6 | F | F | F | F | F | F | F | F | F |
| A2-A7 | F | F | F | F | F | F | F | F | F |
| A2-A8 | F | F | F | F | F | F | F | F | F |
| A2-A9 | F | F | F | F | F | F | F | F | F |
| A2-A10 | F | F | F | F | F | F | F | F | F |
| A2-A11 | F | F | F | F | F | F | F | F | F |
| A3-A4 | F | NF | F | F | F | F | F | F | NF |
| A3-A5 | F | NF | F | F | F | F | F | F | F |
| A3-A6 | F | NF | F | F | F | F | F | F | F |
| A3-A7 | F | F | F | F | F | F | F | F | F |
| A3-A8 | F | F | F | F | F | F | F | F | F |
| A3-A9 | F | F | F | F | F | F | F | F | F |
| A3-A10 | F | F | F | F | F | F | F | F | F |
| A3-A11 | F | F | F | F | F | F | F | F | F |
| A4-A5 | F | F | F | F | F | F | F | F | F |
| A4-A6 | F | F | F | F | F | F | F | F | F |
| A4-A7 | F | F | F | F | F | F | F | F | F |
| A4-A8 | F | F | F | F | F | F | F | F | F |
| A4-A9 | F | F | F | F | F | F | F | F | F |
| A4-A10 | F | F | F | F | F | F | F | F | F |
| A4-A11 | F | F | F | F | F | F | F | F | F |
| A5-A6 | F | F | F | F | F | NF | NF | NF | F |
| A5-A7 | F | F | F | NF | F | F | F | F | NF |
| A5-A8 | F | F | F | NF | F | F | F | F | NF |
| A5-A9 | F | F | F | F | F | F | F | F | F |
| A5-A10 | F | F | F | F | F | F | F | F | F |
| A5-A11 | F | F | F | F | F | F | F | F | F |
| A6-A7 | F | F | F | NF | NF | F | F | F | NF |
| A6-A8 | F | F | F | NF | F | F | F | F | NF |
| A6-A9 | F | F | F | F | NF | F | F | F | F |
| A6-A10 | F | F | F | F | F | F | F | F | F |
| A6-A11 | F | F | F | F | F | F | F | F | F |
| A7-A8 | F | NF | F | F | F | NF | NF | NF | F |
| A7-A9 | F | F | F | F | F | NF | F | F | F |
| A7-A10 | F | F | F | F | F | NF | F | NF | F |
| A7-A11 | F | F | F | F | F | F | F | F | F |
| A8-A9 | F | F | NF | F | NF | NF | F | F | F |
| A8-A10 | F | F | F | F | F | NF | F | F | F |
| A8-A11 | F | F | F | F | F | F | F | F | F |
| A9-A10 | F | NF | F | F | F | NF | F | NF | F |
| A9-A11 | F | F | F | F | F | F | F | F | F |
| A10-A11 | F | F | F | F | F | F | F | F | F |
| Comparison | CO₂e | SOₓ + NOₓ | LCOE -2025 | CO₂e | SOₓ + NOₓ | LCOE-2040 L | CO₂e | SOₓ + NOₓ | LCOE 2040 -H |
| A1-A2 | −4.16 | 0.00 | −21.04 | −26.52 | 0.00 | −0.48 | −309.56 | −2433.07 | N/F |
| A1-A3 | −68.91 | 2.43 | 19.45 | −21.95 | −172.92 | 42.36 | −3.31 | 0.00 | −18.02 |
| A1-A4 | −20.57 | N/F | −23.81 | −19.88 | −149.30 | 33.79 | −45.67 | −342.08 | 49.74 |
| A1-A5 | 10.97 | 86.42 | −41.15 | −50.43 | −2.73 | 1.07 | −10.18 | −27.36 | −27.94 |
| A1-A6 | 9.51 | 78.97 | −40.13 | −50.22 | −30.63 | 7.38 | −7.25 | −0.10 | −33.16 |
| A1-A7 | −64.74 | −3.50 | 6.22 | −7.22 | −0.10 | −37.03 | −39.31 | −23.91 | 4.54 |
| A1-A8 | −50.98 | 28.82 | −9.82 | −9.70 | −26.13 | −29.14 | −37.60 | −2.03 | 0.61 |
| A1-A9 | −76.77 | −2.58 | 5.63 | −64.02 | −2.15 | −0.15 | −52.60 | −20.40 | 3.99 |
| A1-A10 | −68.19 | 23.22 | −6.96 | −63.63 | −24.74 | 5.01 | −51.82 | −1.73 | 0.64 |
| A1-A11 | −103.13 | −800.74 | 16.36 | −90.91 | −706.10 | 10.42 | −97.16 | −752.76 | −8.21 |
| A2-A3 | −117.76 | 4.27 | 49.99 | −21.74 | −180.60 | 44.26 | 77.16 | N/F | −147.46 |
| A2-A4 | −25.29 | N/F | −24.60 | −19.63 | −154.99 | 35.09 | −2.50 | 0.00 | −19.77 |
| A2-A5 | 13.23 | 99.34 | −44.16 | −50.61 | −2.75 | 1.08 | −6.75 | 0.24 | −33.70 |
| A2-A6 | 11.35 | 89.63 | −42.70 | −50.39 | −30.84 | 7.43 | −3.83 | 27.47 | −38.91 |
| A2-A7 | −68.51 | −3.72 | 7.92 | −7.09 | −0.10 | −37.28 | −36.85 | −1.99 | 0.26 |
| A2-A8 | −53.33 | 30.27 | −9.26 | −9.59 | −26.30 | −29.32 | −35.15 | 19.82 | −3.65 |
| A2-A9 | −80.04 | −2.69 | 6.84 | −64.23 | −2.16 | −0.15 | −50.61 | −1.69 | 0.34 |
| A2-A10 | −70.76 | 24.15 | −6.39 | −63.84 | −24.88 | 5.05 | −49.84 | 16.93 | −3.00 |
| A2-A11 | −105.72 | −821.69 | 17.34 | −91.15 | −708.65 | 10.46 | −95.79 | −741.92 | −11.32 |
| A3-A4 | 31.76 | N/F | −70.62 | −6.84 | 0.00 | −20.39 | −133.92 | −1054.73 | N/F |
| A3-A5 | 45.61 | N/F | −67.43 | −56.21 | 31.78 | −7.30 | −10.58 | −28.93 | −28.51 |
| A3-A6 | 39.47 | N/F | −62.89 | −55.71 | −3.01 | 0.59 | −7.48 | −0.10 | −34.02 |
| A3-A7 | −64.08 | −4.44 | 4.13 | −4.47 | 32.16 | −51.85 | −40.94 | −25.00 | 5.56 |
| A3-A8 | −48.73 | 32.13 | −13.48 | −7.50 | 0.26 | −41.99 | −39.13 | −2.12 | 1.45 |
| A3-A9 | −77.64 | −3.13 | 4.09 | −70.46 | 24.00 | −6.66 | −54.49 | −21.18 | 4.83 |
| A3-A10 | −68.12 | 25.27 | −9.56 | −69.93 | −2.35 | −0.63 | −53.66 | −1.80 | 1.35 |
| A3-A11 | −105.29 | −851.36 | 16.16 | −97.29 | −755.37 | 7.47 | −100.15 | −776.69 | −7.90 |
| A4-A5 | 54.86 | 0.73 | −65.29 | −57.85 | 32.83 | −6.86 | −7.07 | 0.26 | −34.75 |
| A4-A6 | 43.67 | 0.59 | −58.66 | −57.26 | −3.11 | 1.25 | −3.93 | 29.52 | −40.34 |
| A4-A7 | −80.47 | −57.44 | 16.91 | −4.40 | 33.14 | −52.80 | −38.88 | −2.10 | 1.44 |
| A4-A8 | −59.26 | −3.64 | −6.01 | −7.52 | 0.27 | −42.63 | −37.05 | 20.98 | −2.71 |
| A4-A9 | −90.23 | −38.63 | 12.68 | −72.04 | 24.59 | −6.32 | −53.00 | −1.78 | 1.34 |
| A4-A10 | −78.12 | −2.79 | −3.44 | −71.48 | −2.40 | −0.15 | −52.17 | 17.77 | −2.17 |
| A4-A11 | −113.76 | −922.90 | 21.53 | −98.63 | −766.58 | 7.88 | −99.62 | −772.38 | −10.98 |
| A5-A6 | −5.98 | 0.00 | −29.28 | −44.58 | −781.22 | N/F | N/F | N/F | −463.50 |
| A5-A7 | −126.99 | −77.44 | 45.17 | N/F | 36.61 | −568.53 | −152.49 | −10.53 | N/F |
| A5-A8 | −87.03 | −4.71 | 8.42 | N/F | −247.13 | −314.36 | −138.03 | 90.77 | N/F |
| A5-A9 | −120.37 | −46.81 | 28.88 | −114.42 | 0.00 | −4.69 | −142.12 | −5.72 | 71.37 |
| A5-A10 | −101.54 | −3.41 | 7.45 | −110.15 | −102.34 | 18.91 | −137.06 | 50.72 | 59.15 |
| A5-A11 | −130.95 | −1017.04 | 30.38 | −131.70 | −1414.73 | 19.84 | −210.25 | −1695.82 | 17.44 |
| A6-A7 | −137.15 | −83.94 | 51.43 | N/F | N/F | −1371.30 | −171.62 | −122.21 | N/F |
| A6-A8 | −91.74 | −4.98 | 10.61 | N/F | 41.67 | −580.05 | −155.35 | −9.52 | N/F |
| A6-A9 | −126.00 | −49.11 | 31.74 | −125.59 | N/F | −33.75 | −152.01 | −64.92 | 85.43 |
| A6-A10 | −105.49 | −3.55 | 8.97 | −120.04 | 0.00 | −4.92 | −146.52 | −5.21 | 72.47 |
| A6-A11 | −133.89 | −1040.97 | 31.78 | −135.09 | −1439.38 | 13.72 | −217.37 | −1759.02 | 25.15 |
References
- Sánchez, A.; Rengel, M.A.M.; Martín, M. Conceptual Design of a Large Ship Propulsion System Fueled by an Ammonia-Hydrogen Blend: Toward a Decarbonized Shipping Transport. In Proceedings of the 34th European Symposium on Computer Aided Process Engineering/15th International Symposium on Process Systems Engineering, Computer Aided Chemical Engineering, Florence, Italy, 2–6 June 2024; pp. 2143–2148. [Google Scholar]
- Xiong, L.; Tian, L.; Zhang, X.; Lv, Y.; Zhang, H. Application of Microbial Technology for Enhancing Carbon Dioxide Geosequestration in Shallow Seabed Caprock. J. Mar. Sci. Eng. 2025, 13, 574. [Google Scholar] [CrossRef]
- IMO. 2023 IMO Strategy on Reduction of GHG Emissions from Ships. Available online: https://www.imo.org/en/OurWork/Environment/Pages/2023-IMO-Strategy-on-Reduction-of-GHG-Emissions-from-Ships.aspx (accessed on 24 April 2024).
- IMO. IMO’s Work to Cut GHG Emissions from Ships. Available online: https://www.imo.org/en/MediaCentre/HotTopics/Pages/Cutting-GHG-emissions.aspx (accessed on 5 August 2024).
- van Rheenen, E.S.; Padding, J.T.; Kana, A.A.; Visser, K. Comparative energy analysis of hydrogen carriers as energy source on ships. J. Mar. Eng. Technol. 2025, 1–15. [Google Scholar] [CrossRef]
- Van Rheenen, E.S.; Padding, J.T.; Slootweg, J.C.; Visser, K. Hydrogen carriers for zero-emission ship propulsion using PEM fuel cells: An evaluation. J. Mar. Eng. Technol. 2024, 23, 166–183. [Google Scholar] [CrossRef]
- Rivard, E.; Trudeau, M.; Zaghib, K. Hydrogen Storage for Mobility: A Review. Materials 2019, 12, 1973. [Google Scholar] [CrossRef]
- Aziz, M.; Wijayanta, A.T.; Nandiyanto, A.B.D. Ammonia as Effective Hydrogen Storage: A Review on Production, Storage and Utilization. Energies 2020, 13, 3062. [Google Scholar] [CrossRef]
- Van Hoecke, L.; Laffineur, L.; Campe, R.; Perreault, P.; Verbruggen, S.W.; Lenaerts, S. Challenges in the use of hydrogen for maritime applications. Energy Environ. Sci. 2021, 14, 815–843. [Google Scholar] [CrossRef]
- Zhang, M.; Li, M.; Wang, R.; Qian, Y. Effects of acute ammonia toxicity on oxidative stress, immune response and apoptosis of juvenile yellow catfish Pelteobagrus fulvidraco and the mitigation of exogenous taurine. Fish Shellfish Immunol. 2018, 79, 313–320. [Google Scholar] [CrossRef]
- Braissant, O.; McLin, V.A.; Cudalbu, C. Ammonia toxicity to the brain. J. Inherit. Metab. Dis. 2013, 36, 595–612. [Google Scholar] [CrossRef]
- Wang, Y.; Wright, L.A. A Comparative Review of Alternative Fuels for the Maritime Sector: Economic, Technology, and Policy Challenges for Clean Energy Implementation. World 2021, 2, 456–481. [Google Scholar] [CrossRef]
- Duong, P.A.; Jinuk, L.; Rim, R.B.; Kang, H. A preliminary safety assessment of fuel gas supply system in the engine room of the ammonia fuelled ship. J. Mar. Eng. Technol. 2025, 1–20. [Google Scholar] [CrossRef]
- Chavando, A.; Silva, V.; Cardoso, J.; Eusebio, D. Advancements and Challenges of Ammonia as a Sustainable Fuel for the Maritime Industry. Energies 2024, 17, 3183. [Google Scholar] [CrossRef]
- Andriani, D.; Bicer, Y. A Review of Hydrogen Production from Onboard Ammonia Decomposition: Maritime Applications of Concentrated Solar Energy and Boil-Off Gas Recovery. Fuel 2023, 352, 128900. [Google Scholar] [CrossRef]
- Boggs, B.K.; Botte, G.G. On-board hydrogen storage and production: An application of ammonia electrolysis. J. Power Sources 2009, 192, 573–581. [Google Scholar] [CrossRef]
- Wang, W.; Herreros, J.M.; Tsolakis, A.; York, A.P.E. Ammonia as hydrogen carrier for transportation; Investigation of the ammonia exhaust gas fuel reforming. Int. J. Hydrogen Energy 2013, 38, 9907–9917. [Google Scholar] [CrossRef]
- McKinlay, C.J.; Manias, P.; Turnock, S.R.; Hudson, D.A. Dynamic Modelling of Ammonia Crackers and Hydrogen Pem Fuel Cells for Shipping Applications. In Proceedings of the International Conference on Computer Applications in Shipbuilding)(ICCAS) 2022, Yokohama, Japan, 13–15 September 2022. [Google Scholar]
- Ye, M.; Sharp, P.; Brandon, N.; Kucernak, A. System-level comparison of ammonia, compressed and liquid hydrogen as fuels for polymer electrolyte fuel cell powered shipping. Int. J. Hydrogen Energy 2022, 47, 8565–8584. [Google Scholar] [CrossRef]
- Zhu, R.; Wang, Z.; He, Y.; Zhu, Y.; Cen, K. LCA comparison analysis for two types of H2 carriers: Methanol and ammonia. Int. J. Energy Res. 2022, 46, 11818–11833. [Google Scholar] [CrossRef]
- Spatolisano, E.; Pellegrini, L.A.; de Angelis, A.R.; Cattaneo, S.; Roccaro, E. Ammonia as a Carbon-Free Energy Carrier: NH3 Cracking to H2. Ind. Eng. Chem. Res. 2023, 62, 10813–10827. [Google Scholar] [CrossRef]
- Duong, P.A.; Ryu, B.R.; Lee, H.Y.Y.; Kang, H.K. Thermodynamic analysis of integrated ammonia fuel cells system for maritime application. Energy Rep. 2023, 10, 1521–1537. [Google Scholar] [CrossRef]
- Restelli, F.; Spatolisano, E.; Pellegrini, L.A.; de Angelis, A.R.; Cattaneo, S.; Roccaro, E. Detailed techno-economic assessment of ammonia as green H2 carrier. Int. J. Hydrogen Energy 2024, 52, 532–547. [Google Scholar] [CrossRef]
- Di Micco, S.; Cigolotti, V.; Mastropasqua, L.; Brouwer, J.; Minutillo, M. Ammonia-powered ships: Concept design and feasibility assessment of powertrain systems for a sustainable approach in maritime industry. Energy Convers. Manag. X 2024, 22, 100539. [Google Scholar] [CrossRef]
- Duong, P.A.; Ryu, B.R.; Lee, J.; Kang, H. Techno-Economic Analysis of a Direct Ammonia Solid Oxide Fuel Cell–Integrated System for Marine Vessels. Chem. Eng. Technol. 2025, 48, e12013. [Google Scholar] [CrossRef]
- Sarı, A.; Sulukan, E.; Özkan, D.; Sıdkı Uyar, T. Environmental impact assessment of hydrogen-based auxiliary power system onboard. Int. J. Hydrogen Energy 2021, 46, 29680–29693. [Google Scholar] [CrossRef]
- Vieira, G.T.T.; Pereira, D.F.; Taheri, S.I.; Khan, K.S.; Salles, M.B.C.; Guerrero, J.M.; Carmo, B.S. Optimized Configuration of Diesel Engine-Fuel Cell-Battery Hybrid Power Systems in a Platform Supply Vessel to Reduce CO2 Emissions. Energies 2022, 15, 2184. [Google Scholar] [CrossRef]
- Bang, E.-S.; Kim, M.-H.; Park, S.-K. Options for Methane Fuel Processing in PEMFC System with Potential Maritime Applications. Energies 2022, 15, 8604. [Google Scholar] [CrossRef]
- Bagherabadi, K.M.; Skjong, S.; Bruinsma, J.; Pedersen, E. System-level modeling of marine power plant with PEMFC system and battery. Int. J. Nav. Archit. Ocean Eng. 2022, 14, 100487. [Google Scholar] [CrossRef]
- Lee, H.; Ryu, B.; Anh, D.P.; Roh, G.; Lee, S.; Kang, H. Thermodynamic analysis and assessment of novel ORC- DEC integrated PEMFC system for liquid hydrogen fueled ship application. Int. J. Hydrogen Energy 2023, 48, 3135–3153. [Google Scholar] [CrossRef]
- Wang, Z.; Dong, B.; Wang, Y.; Li, M.; Liu, H.; Han, F. Analysis and evaluation of fuel cell technologies for sustainable ship power: Energy efficiency and environmental impact. Energy Convers. Manag. X 2024, 21, 100482. [Google Scholar] [CrossRef]
- Penga, J.; Vidović, T.; Radica, G.; Penga, Ž. Analysis of Hybrid Ship Machinery System with Proton Exchange Membrane Fuel Cells and Battery Pack. Appl. Sci. 2024, 14, 2878. [Google Scholar] [CrossRef]
- Yuksel, O.; Blanco-Davis, E.; Spiteri, A.; Hitchmough, D.; Shagar, V.; Di Piazza, M.C.; Pucci, M.; Tsoulakos, N.; Armin, M.; Wang, J. Optimising the Design of a Hybrid Fuel Cell/Battery and Waste Heat Recovery System for Retrofitting Ship Power Generation. Energies 2025, 18, 288. [Google Scholar] [CrossRef]
- Aziz, M.; Trinh, P.-H.; Hudaya, C.; Chung, I.-Y. Coordinated control strategy for hybrid multi-PEMFC/BESS in a shipboard power system. Electr. Power Syst. Res. 2025, 243, 111495. [Google Scholar] [CrossRef]
- LAROS. How Laros Works? Available online: https://www.laros.gr/ (accessed on 20 December 2024).
- PowerCellGroup. Marine System 200. Available online: https://powercellgroup.com/product/marine-system-200/ (accessed on 1 May 2024).
- Yuksel, O.; Koseoglu, B. Numerical simulation of the hybrid ship power distribution system and an analysis of its emission reduction potential. Ships Offshore Struct. 2023, 18, 78–94. [Google Scholar] [CrossRef]
- Ristig, S.; Poschmann, M.; Folke, J.; Gómez-Cápiro, O.; Chen, Z.; Sanchez-Bastardo, N.; Schlögl, R.; Heumann, S.; Ruland, H. Ammonia Decomposition in the Process Chain for a Renewable Hydrogen Supply. Chem. Ing. Tech. 2022, 94, 1413–1425. [Google Scholar] [CrossRef]
- Cha, J.; Park, Y.; Brigljević, B.; Lee, B.; Lim, D.; Lee, T.; Jeong, H.; Kim, Y.; Sohn, H.; Mikulčić, H.; et al. An efficient process for sustainable and scalable hydrogen production from green ammonia. Renew. Sustain. Energy Rev. 2021, 152, 111562. [Google Scholar] [CrossRef]
- Xu, Y.-F.; Duchesne, P.N.; Wang, L.; Tavasoli, A.; Ali, F.M.; Xia, M.; Liao, J.-F.; Kuang, D.-B.; Ozin, G.A. High-performance light-driven heterogeneous CO(2) catalysis with near-unity selectivity on metal phosphides. Nat. Commun. 2020, 11, 5149. [Google Scholar] [CrossRef]
- Devkota, S.; Shin, B.-J.; Mun, J.-H.; Kang, T.-H.; Yoon, H.C.; Mazari, S.A.; Moon, J.-H. Process design and optimization of onsite hydrogen production from ammonia: Reactor design, energy saving and NOX control. Fuel 2023, 342, 127879. [Google Scholar] [CrossRef]
- Crystec. Ammonia Cracker for the Generation of Forming Gas. Available online: https://www.crystec.com/kllhyame.htm#Hydrogen_PSA (accessed on 7 August 2024).
- Nami, H.; Hendriksen, P.V.; Frandsen, H.L. Green ammonia production using current and emerging electrolysis technologies. Renew. Sustain. Energy Rev. 2024, 199, 114517. [Google Scholar] [CrossRef]
- Ochoa, N. Comparative Life Cycle Assessment of Ammonia Production Pathways. Master’s Thesis, Aalto University, Espoo, Finland, 2023. [Google Scholar]
- Hatzell, M.C. The Colors of Ammonia. ACS Energy Lett. 2024, 9, 2920–2921. [Google Scholar] [CrossRef]
- Lee, K.; Liu, X.; Vyawahare, P.; Sun, P.; Elgowainy, A.; Wang, M. Techno-economic performances and life cycle greenhouse gas emissions of various ammonia production pathways including conventional, carbon-capturing, nuclear-powered, and renewable production. Green Chem. 2022, 24, 4830–4844. [Google Scholar] [CrossRef]
- Rambert, O.; Febvre, L. The Challenges of Hydrogen Storage on a Large Scale. Available online: https://hysafe.info/uploads/papers/2021/189.pdf (accessed on 21 June 2024).
- Raucci, C.; Calleya, J.; Suarez De La Fuente, S.; Pawling, R. Hydrogen on Board Ship: A First Analysis of Key Parameters and Implications. Available online: https://decarbonisingfreight.co.uk/wp-content/uploads/2023/05/Raucci-et-al-2015-Hydrogen-on-board-ship.pdf (accessed on 21 June 2024).
- Panasonic. Specifications for NCR18650GA. Available online: https://www.orbtronic.com/content/Datasheet-specs-Sanyo-Panasonic-NCR18650GA-3500mah.pdf (accessed on 1 May 2024).
- Saxena, S.; Hendricks, C.; Pecht, M. Cycle life testing and modeling of graphite/LiCoO2 cells under different state of charge ranges. J. Power Sources 2016, 327, 394–400. [Google Scholar] [CrossRef]
- Sepasi, S.; Ghorbani, R.; Liaw, B.Y. Inline state of health estimation of lithium-ion batteries using state of charge calculation. J. Power Sources 2015, 299, 246–254. [Google Scholar] [CrossRef]
- SMA. Sunny Central Storage. Available online: https://files.sma.de/assets/275864.pdf (accessed on 23 May 2024).
- Konur, O.; Yuksel, O.; Aykut Korkmaz, S.; Ozgur Colpan, C.; Saatcioglu, O.Y.; Koseoglu, B. Operation-dependent exergetic sustainability assessment and environmental analysis on a large tanker ship utilizing Organic Rankine cycle system. Energy 2023, 262, 125477. [Google Scholar] [CrossRef]
- Konur, O.; Yuksel, O.; Korkmaz, S.A.; Colpan, C.O.; Saatcioglu, O.Y.; Muslu, I. Thermal design and analysis of an organic rankine cycle system utilizing the main engine and cargo oil pump turbine based waste heats in a large tanker ship. J. Clean. Prod. 2022, 368, 133230. [Google Scholar] [CrossRef]
- Konur, O.; Saatcioglu, O.Y.; Korkmaz, S.A.; Erdogan, A.; Colpan, C.O. Heat exchanger network design of an organic Rankine cycle integrated waste heat recovery system of a marine vessel using pinch point analysis. Int. J. Energy Res. 2020, 44, 12312–12328. [Google Scholar] [CrossRef]
- Lyu, L.; Kan, A.; Chen, W.; Zhang, Y.; Fu, B. Energy, Exergy and Environmental Analysis of ORC Waste Heat Recovery from Container Ship Exhaust Gases Based on Voyage Cycle. J. Mar. Sci. Eng. 2023, 11, 2029. [Google Scholar] [CrossRef]
- Gilbert, P.; Walsh, C.; Traut, M.; Kesieme, U.; Pazouki, K.; Murphy, A. Assessment of full life-cycle air emissions of alternative shipping fuels. J. Clean. Prod. 2018, 172, 855–866. [Google Scholar] [CrossRef]
- Yuksel, O. A comprehensive feasibility analysis of dual-fuel engines and solid oxide fuel cells on a tanker ship considering environmental, economic, and regulation aspects. Sustain. Prod. Consum. 2023, 42, 106–124. [Google Scholar] [CrossRef]
- Pavlenko, N.; Comer, B.; Zhou, Y.; Clark, N. The Climate Implications of Using LNG as A Marine Fuel; International Council on Clean Transportation: Washington, DC, USA, 2020. [Google Scholar]
- Kuzu, S.L.; Bilgili, L.; Kiliç, A. Estimation and dispersion analysis of shipping emissions in Bandirma Port, Turkey. Environ. Dev. Sustain. 2021, 23, 10288–10308. [Google Scholar] [CrossRef]
- Dulău, L.-I. CO2 Emissions of Battery Electric Vehicles and Hydrogen Fuel Cell Vehicles. Clean Technol. 2023, 5, 696–712. [Google Scholar] [CrossRef]
- IMO. 2024 Guidelines on Life Cycle Ghg Intensity of Marine Fuels (2024 LCA Guidelines). Available online: https://wwwcdn.imo.org/localresources/en/KnowledgeCentre/IndexofIMOResolutions/MEPCDocuments/MEPC.391(81).pdf (accessed on 13 November 2024).
- Shen, W.; Chen, X.; Qiu, J.; Hayward, J.A.; Sayeef, S.; Osman, P.; Meng, K.; Dong, Z.Y. A comprehensive review of variable renewable energy levelized cost of electricity. Renew. Sustain. Energy Rev. 2020, 133, 110301. [Google Scholar] [CrossRef]
- IEA. Projected Costs of Generating Electricity. Available online: https://www.oecd-nea.org/upload/docs/application/pdf/2020-12/egc-2020_2020-12-09_18-26-46_781.pdf (accessed on 27 June 2024).
- Hansen, K. Decision-making based on energy costs: Comparing levelized cost of energy and energy system costs. Energy Strategy Rev. 2019, 24, 68–82. [Google Scholar] [CrossRef]
- Shu, G.; Liu, P.; Tian, H.; Wang, X.; Jing, D. Operational profile based thermal-economic analysis on an Organic Rankine cycle using for harvesting marine engine’s exhaust waste heat. Energy Convers. Manag. 2017, 146, 107–123. [Google Scholar] [CrossRef]
- Gianni, M.; Pietra, A.; Taccani, R. Outlook of future implementation of PEMFC and SOFC onboard cruise ships. In Proceedings of the E3S Web of Conferences, 100RES 2020—Applied Energy Symposium (ICAE), Pisa, Italy, 25–30 October 2020; 2021. [Google Scholar]
- Wang, Y.; Pang, Y.; Xu, H.; Martinez, A.; Chen, K.S. PEM Fuel cell and electrolysis cell technologies and hydrogen infrastructure development—A review. Energy Environ. Sci. 2022, 15, 2288–2328. [Google Scholar] [CrossRef]
- Ammar, N.R.; Seddiek, I.S. Hybrid/dual fuel propulsion systems towards decarbonization: Case study container ship. Ocean Eng. 2023, 281, 114962. [Google Scholar] [CrossRef]
- Seo, Y.; Han, S. Economic Evaluation of an Ammonia-Fueled Ammonia Carrier Depending on Methods of Ammonia Fuel Storage. Energies 2021, 14, 8326. [Google Scholar] [CrossRef]
- Jackson, C.; Fothergill, K.; Gray, P.; Haroon, F.; Makhloufi, C.; Kezibri, N.; Davey, A.; LHote, O.; Zarea, M.; Davenne, T.; et al. Ammonia to Green Hydrogen Project. 2020. Available online: https://assets.publishing.service.gov.uk/media/5ea1705fd3bf7f7b4cadb7c5/HS420_-_Ecuity_-_Ammonia_to_Green_Hydrogen.pdf (accessed on 25 April 2025).
- Richard, S.; Ramirez Santos, A.; Olivier, P.; Gallucci, F. Techno-economic analysis of ammonia cracking for large scale power generation. Int. J. Hydrogen Energy 2024, 71, 571–587. [Google Scholar] [CrossRef]
- Terlouw, T.; Bauer, C.; McKenna, R.; Mazzotti, M. Large-scale hydrogen production via water electrolysis: A techno-economic and environmental assessment. Energy Environ. Sci. 2022, 15, 3583–3602. [Google Scholar] [CrossRef]
- Korkmaz, S.A.; Erginer, K.E.; Yuksel, O.; Konur, O.; Colpan, C.O. Environmental and economic analyses of fuel cell and battery-based hybrid systems utilized as auxiliary power units on a chemical tanker vessel. Int. J. Hydrogen Energy 2023, 48, 23279–23295. [Google Scholar] [CrossRef]
- Maxwell, C. Cost Indices. Available online: https://toweringskills.com/financial-analysis/cost-indices/ (accessed on 25 June 2024).
- Cesaro, Z.; Ives, M.; Nayak-Luke, R.; Mason, M.; Bañares-Alcántara, R. Ammonia to power: Forecasting the levelized cost of electricity from green ammonia in large-scale power plants. Appl. Energy 2021, 282, 116009. [Google Scholar] [CrossRef]
- Navarrete, A.; Zhou, Y. The Price of Green Hydrogen: How and Why We Estimate Future Production Costs. Available online: https://theicct.org/the-price-of-green-hydrogen-estimate-future-production-costs-may24/ (accessed on 14 August 2024).
- Helgason, R.; Cook, D.; Davíðsdóttir, B. An evaluation of the cost-competitiveness of maritime fuels—A comparison of heavy fuel oil and methanol (renewable and natural gas) in Iceland. Sustain. Prod. Consum. 2020, 23, 236–248. [Google Scholar] [CrossRef]
- ShipandBunker. World Bunker Prices. Available online: https://shipandbunker.com/prices (accessed on 25 June 2024).
- Zou, J.; Yang, B. Evaluation of alternative marine fuels from dual perspectives considering multiple vessel sizes. Transp. Res. Part D Transp. Environ. 2023, 115, 103583. [Google Scholar] [CrossRef]
- Taherdoost, H.; Mohebi, A. A Comprehensive Guide to the COPRAS method for Multi-Criteria Decision Making. J. Manag. Sci. Eng. Res. 2024, 7, 1–14. [Google Scholar] [CrossRef]
- Zavadskas, E.K.; Kaklauskas, A.; Vilutienė, T. Multicriteria Evaluation of Apartment Blocks Maintenance Contractors: Lithuanian Case Study. Int. J. Strateg. Prop. Manag. 2009, 13, 319–338. [Google Scholar] [CrossRef]
- Podvezko, V. The Comparative Analysis of MCDA Methods SAW and COPRAS. Eng. Econ. 2011, 22, 134–146. [Google Scholar] [CrossRef]
- Zavadskas, E.K.; Turskis, Z.; Kildienė, S. State of Art Surveys of Overviews on Mcdm/Madm Methods. Technol. Econ. Dev. Econ. 2014, 20, 165–179. [Google Scholar] [CrossRef]
- Ghorabaee, M.K.; Amiri, M.; Zavadskas, E.K.; Turskis, Z. Multi-criteria group decision-making using an extended edas method with interval type-2 fuzzy sets. E+M Ekon. A Manag. 2017, 20, 48–68. [Google Scholar] [CrossRef]
- Shannon, C.E. A mathematical theory of communication. Bell Syst. Tech. J. 1948, 27, 379–423. [Google Scholar] [CrossRef]
- Zou, Z.-h.; Yun, Y.; Sun, J.-n. Entropy method for determination of weight of evaluating indicators in fuzzy synthetic evaluation for water quality assessment. J. Environ. Sci. 2006, 18, 1020–1023. [Google Scholar] [CrossRef]
- Sagiroglu, A.; Caliskan Demir, M.; Taskin, A. Assessing collaboration performance of NGOs by a decomposed Fuzzy approach utilizing AHP and COPRAS methods: Turkiye case. Int. J. Disaster Risk Reduct. 2024, 111, 104744. [Google Scholar] [CrossRef]
- Kumar, R.; Kumar, S.; Ağbulut, Ü.; Gürel, A.E.; Alwetaishi, M.; Shaik, S.; Saleel, C.A.; Lee, D. Parametric optimization of an impingement jet solar air heater for active green heating in buildings using hybrid CRITIC-COPRAS approach. Int. J. Therm. Sci. 2024, 197, 108760. [Google Scholar] [CrossRef]
- Triantaphyllou, E.; Sánchez, A. A Sensitivity Analysis Approach for Some Deterministic Multi-Criteria Decision-Making Methods. Decis. Sci. 1997, 28, 151–194. [Google Scholar] [CrossRef]
- Esen, H.; Inalli, M.; Esen, M.; Pihtili, K. Energy and exergy analysis of a ground-coupled heat pump system with two horizontal ground heat exchangers. Build. Environ. 2007, 42, 3606–3615. [Google Scholar] [CrossRef]
- Taner, T.; Sivrioglu, M. Energy–exergy analysis and optimisation of a model sugar factory in Turkey. Energy 2015, 93, 641–654. [Google Scholar] [CrossRef]
- Taner, T. Optimisation processes of energy efficiency for a drying plant: A case of study for Turkey. Appl. Therm. Eng. 2015, 80, 247–260. [Google Scholar] [CrossRef]
- Akpinar, E.K. Mathematical modelling of thin layer drying process under open sun of some aromatic plants. J. Food Eng. 2006, 77, 864–870. [Google Scholar] [CrossRef]
- Issa, M.; Ilinca, A.; Martini, F. Ship Energy Efficiency and Maritime Sector Initiatives to Reduce Carbon Emissions. Energies 2022, 15, 7910. [Google Scholar] [CrossRef]
- Alzayedi, A.M.T.; Alkhaledi, A.N.F.N.R.; Sampath, S.; Pilidis, P. TERA of Gas Turbine Propulsion Systems for RORO Ships. Energies 2023, 16, 5875. [Google Scholar] [CrossRef]
- Snustad, I.; Berstad, D.; Nekså, P. Hydrogen bunkering from a fuel island onto fishing vessels. Int. J. Hydrogen Energy 2024, 92, 1248–1255. [Google Scholar] [CrossRef]
- Panić, I.; Cuculić, A.; Ćelić, J. Color-Coded Hydrogen: Production and Storage in Maritime Sector. J. Mar. Sci. Eng. 2022, 10, 1995. [Google Scholar] [CrossRef]
- van Biert, L.; Godjevac, M.; Visser, K.; Aravind, P.V. A review of fuel cell systems for maritime applications. J. Power Sources 2016, 327, 345–364. [Google Scholar] [CrossRef]
- Bicer, Y.; Dincer, I.; Vezina, G.; Raso, F. Impact Assessment and Environmental Evaluation of Various Ammonia Production Processes. Environ. Manag. 2017, 59, 842–855. [Google Scholar] [CrossRef]
- Bicer, Y.; Dincer, I. Life cycle assessment of nuclear-based hydrogen and ammonia production options: A comparative evaluation. Int. J. Hydrogen Energy 2017, 42, 21559–21570. [Google Scholar] [CrossRef]
- Bayraktar, M.; Yüksel, O. Analysis of the nuclear energy systems as an alternative propulsion system option on commercial marine vessels by utilizing the SWOT-AHP method. Nucl. Eng. Des. 2023, 407, 112265. [Google Scholar] [CrossRef]
- Brook, B.W.; Bradshaw, C.J.A. Key role for nuclear energy in global biodiversity conservation. Conserv. Biol. 2015, 29, 702–712. [Google Scholar] [CrossRef]
- Lenzen, M. Life cycle energy and greenhouse gas emissions of nuclear energy: A review. Energy Convers. Manag. 2008, 49, 2178–2199. [Google Scholar] [CrossRef]
- Jin, T.; Kim, J. What is better for mitigating carbon emissions—Renewable energy or nuclear energy? A panel data analysis. Renew. Sustain. Energy Rev. 2018, 91, 464–471. [Google Scholar] [CrossRef]
- Yuksel, O.; Bayraktar, M.; Seyhan, A. Environmental and economic analysis of cold ironing using renewable hybrid systems. In Clean Technologies and Environmental Policy; Springer Nature: Berlin, Germany, 2024. [Google Scholar] [CrossRef]
- Capros, P.; Zazias, G.; Evangelopoulou, S.; Kannavou, M.; Fotiou, T.; Siskos, P.; De Vita, A.; Sakellaris, K. Energy-system modelling of the EU strategy towards climate-neutrality. Energy Policy 2019, 134, 110960. [Google Scholar] [CrossRef]
- Bayraktar, M. Investigation of alternative fuelled marine diesel engines and waste heat recovery system utilization on the oil tanker for upcoming regulations and carbon tax. Ocean Eng. 2023, 287, 115831. [Google Scholar] [CrossRef]
- Masia, B.; Yang, M.; Cozzani, V. Risk Assessment of Ammonia Fueled Ships: Consequences on Human Health of Ammonia Releases from Damaged Fuel Storage Tanks. ACS Chem. Health Saf. 2024, 31, 503–520. [Google Scholar] [CrossRef]
- Furstenberg Stott, C. The NH3 Kraken: Amogy’s Ammonia-Powered Tugboat. Available online: https://ammoniaenergy.org/articles/the-nh3-kraken-amogys-ammonia-powered-tugboat/?utm_source=chatgpt.com (accessed on 29 April 2025).
- Mcdermott, J.; Hill, M. Tugboat Powered by Ammonia Sails for the First Time, Showing How to Cut Emissions from Shipping. Available online: https://apnews.com/article/ammonia-fuel-diesel-amogy-shipping-60beccfb8894c79ddc624026fbf0a8e5 (accessed on 29 April 2025).
Disclaimer/Publisher’s Note: The statements, opinions and data contained in all publications are solely those of the individual author(s) and contributor(s) and not of MDPI and/or the editor(s). MDPI and/or the editor(s) disclaim responsibility for any injury to people or property resulting from any ideas, methods, instructions or products referred to in the content. |
© 2025 by the authors. Licensee MDPI, Basel, Switzerland. This article is an open access article distributed under the terms and conditions of the Creative Commons Attribution (CC BY) license (https://creativecommons.org/licenses/by/4.0/).