Abstract
Vulnerability impacts have increased in an unprecedented way with the effects of global warming, climate change, erosion, sea level rise, tsunami, flood, and drought—natural events that jointly cause geomorphological changes, especially in coastal zones. There are no analytical mathematical formulations under a set of assumptions due to the complexity of the interactive associations of these natural events, and the only way that seems open in the literature is through empirical formulations that depend on expert experiences. Among such empirical formulations are the Coastal Vulnerability Index (CVI), the Environmental Vulnerability Index (EVI), the Socioeconomic Vulnerability Index (SVI), and the Integrated Coastal Vulnerability Index (ICVI), which is composed of the previous indices. Although there is basic experience and experimental information for the establishment of these indices, unfortunately, logical aspects are missing. This paper proposes a Coastal Fuzzy Vulnerability Index (CFVI) based on fuzzy logic, aiming to improve the limitations of the traditional Coastal Vulnerability Index (CVI). Traditional CVI relies on binary logic and calculates vulnerability through discrete classification (such as “low”, “medium”, and “high”) and arithmetic or geometric means. It has problems such as mutation risk division, ignoring data continuity, and unreasonable parameter weights. To this end, the author introduced fuzzy logic, quantified the nonlinear effects of various parameters (such as landforms, coastal slope, sea level changes, etc.) through fuzzy sets and membership degrees, and calculated CFVI using a weighted average method. The study showed that CFVI allows continuous transition risk assessment by fuzzifying the parameter data range, avoiding the “mutation” defect of traditional methods. Taking data from the Gulf of Mexico in the United States as an example, the calculation result range of CFVI (0.38–3.04) is significantly smaller than that of traditional CVI (0.42–51), which is closer to the rationality of actual vulnerability changes. The paper also criticized the defects of traditional CVI, being that it relies on subjective experience and lacks a logical basis, and pointed out that CFVI can be expanded to integrate more variables or combined with other indices (such as the Environmental Vulnerability Index (EVI)) to provide a more scientific basis for coastal management decisions. This study optimized the coastal vulnerability assessment method through fuzzy logic, improved the ability to handle nonlinear relationships between parameters, and provided a new tool for complex and dynamic coastal risk management. Further research possibilities are also mentioned throughout the text and in the Conclusion section.
1. Introduction
It is known that about one-third of the world’s population lives within a few kilometers of coastal areas, which are exposed to hazards, due not only to population density but also to risky natural hazardous events. In coastal areas, as a result of landslides, wave effects, sea level rise, and climate change, annual coastal beach sandy area retreat and sediment accretion cause geomorphological changes, including erosion.
In general, coastal zones are subject to highly dynamic and complex natural and human effects in the light of non-linear effective parameters. With the growing impact of climate change and its expected effects, coastal zones are gaining more importance for managers and decision-makers in terms of vulnerability assessments [1,2]. Pethick and Crooks [3] presented a deterministic approach to achieve a geomorphologically sustainable coastal system. They suggested a vulnerability index using local data to show how much human activity or intervention an area can withstand without causing harm. In this way, it is possible to assess the sensitivity of coastal landforms and guide monitoring results.
Coastal areas are vulnerable to extreme events such as storms, sea level rise, ecosystem losses, and erosion [4]. Various seawater impacts as flooding, seawater intrusion into drinkable groundwater resources, erosion, landslides, and maximum wave impact, are observed in coastal areas due to the rise in sea water as an effect of climate change. Human expert experience provides highly subjective concepts and judgments for the vulnerability of coastal areas by considering different risk sources from natural (especially geomorphology), anthropogenic (socio-economic), and environmental conditions. Coastal areas have geological, hydrogeological, natural geomorphological, and human-impacted activities that need to be considered separately for risk assessment, but vulnerability has a more general content that includes all these risk factors and, therefore, cannot be precisely calculated with analytical mathematical approaches.
Different vulnerability indices are proposed to simplify very complex and sophisticated issues, but they can be developed in a better way. Unfortunately, there is no common basis for comparing various vulnerability indices, especially if the research area is coastal zones. There are no widely recognized vulnerability variables, and there may be additional variables depending on the study area, but, in general, six are widely used, namely geomorphology, coastal slope, relative sea level change, shoreline erosion, mean tidal range (if any), and mean wave height [5,6]. Pantusa et al. [7] further developed a coastal vulnerability index formulation (CVI) by integrating eleven variables that are divided into three typological groups, namely, geological, hydro-physical process, and vegetation, and redefining three variables to improve the suitability of the index for low-lying coasts.
On the other hand, Dan Cin and Simeoni [8] suggested that the more variables that are considered, the more accurate the vulnerability results will be. The authors of this article do not agree with this statement, because instead of increasing the number of variables, it is necessary to consider their significance levels and to adapt the optimum number of representative variables. In this direction, some authors have used more than 50 variables [9], and some have depended on 3 variables [10]. It is recommended to adapt the independent variables so that their contribution to the overall vulnerability can be more effective.
Unfortunately, low CVI values do not clearly tell us whether the coastal zone in question has low flooding, erosion, and socioeconomic vulnerability in a site-specific coastal region. For this reason, the vulnerability study of each variable could be assessed separately. Another reason is that a variable affecting coastal flooding may not be an influential variable for other vulnerability variables [11]. Alcantara-Carrio et al. [12] presented a detailed review of the variables and mathematical suitability of the classical CVI. They proposed new vulnerability indices such as the integrated CVI (ICVI) and the integration with the Environmental Vulnerability Index (EVI) along with the Socioeconomic Vulnerability Index (SVI). On the other hand, Theocharidis et al. [13] demonstrated the application of the CVI developed during their study and suggested that it can be used by coastal managers and decision-makers to empower them to increase coastal zone resilience to explain environmental changes. Koroglu et al. [14] focused on the comparison and evaluation of different methodologies to determine the most suitable alternative to CVI and thus proposed the most suitable alternative for coastal zone vulnerability assessment and calculation. The study by Oloyede et al. [15] applied CVI to coastal vulnerability assessment for Nigerian coastlines and concluded that their study would help identify vulnerable segments for coastal zone planners and decision-makers to make predictions in the study area. The approach proposed by Mullick et al. [16] is suitable for addressing uncertainty vulnerability analysis by normalization of featured factors by applying fuzzy membership functions in geospatial analysis. In another paper, Tahri et al. [17] proposed a method to assess the coastal risk vulnerability by applying Fuzzy Analytic Hierarchy Process (FAHP) with a GIS system. None of the fuzzy-based vulnerability assessments of coastal areas are based on detailed fuzzification of each influential variable as in this paper.
In the very classical application of CVI, each variable is associated with absolute risk numbers such as 1, 2, 3, 4, and 5, which denote the qualitative classes of “Very low”, “Low”, “Moderate”, “High”, and “Very high”. Such a calculation approach introduces significant biases in risk calculation, as only real numbers are considered. There is no overlapping transition between successive risk levels, and the same risk level applies to the consecutive sets of numbers of each variable.
The main purpose of this paper is first to explain the bivalent logic (BL) rules of each variable in classical CVI calculations and then propose a fuzzy logic (FL)-based approach, addressing the same problem but with overlapping fuzzy sets instead of rectangles. Such an approach provides decimal vulnerability levels and membership degrees (MDs) of each variable’s numerical data range. In this way, each number in any range will provide different MDs instead of the BL 0 or 1 case as used in all classical vulnerability studies. Two basic formulations for CVI calculations, one an arithmetic average and the other a pseudo-geometric mean, are criticized, and instead, a new CVI definition based on FL is proposed as the Coastal Fuzzy Vulnerability Index (CFVI), which is based on a weighted average, because the FL approach provides weights. It is shown that in the case of extremely low and high variable values, the arithmetic average formulation is valid. It is shown based on USGS CVI ranking variable values that CFVI results are confined in a short range compared to the traditional CVI’s very large range.
2. Coastal Vulnerability Approaches
Coastal zones and, more importantly, cliffs and beach areas, are the most vulnerable land masses against natural hazards and risks. Their vulnerability arises due to meteorological events occurring throughout the hydrological cycle, atmospheric events in climatic aspects due to the most important effects of global warming and climate change, surface events such as soil and rock erosions, and sea surface behavior as a result of thunderstorms. Under the collective effect of each of these dynamisms, coastal zones become vulnerable to undesirable consequences such as demography, ecology, environmental characteristics, social activities, and economic losses.
These zones are exposed to risky hazardous events (sea level rise, wave height, geomorphology, vegetation, storms, sea water intrusion, floods, inundations, droughts, erosion of land subsidence, earthquake potential, etc.) and, therefore, it is necessary to develop a vulnerability index that will reflect the joint behavioral result of the relevant variables. Therefore, the Coastal Vulnerability Index (CVI) proposal, although not analytical, provides empirical guidance that helps in practical studies.
There are many types of coastal vulnerability measures, and the resulting indices reflect the joint response of different variables. Some of the vulnerability indices related to coastal zones are listed below:
- (1)
- Coastal Vulnerability Index (CVI)
- (2)
- Physical Vulnerability Index (FVI)
- (3)
- Socioeconomic Vulnerability Index (SVI)
- (4)
- Environmental Vulnerability Index (EVI)
- (5)
- Integrated Coastal Vulnerability Index (ICVI)
- (6)
- Multi-hazard Vulnerability Index (MVI)
Of course, there are many important variables for different coastal vulnerability assessments. It is important to be able to decide the weight of each influential parameter. What are the ways of accurate variable measurements? Coastal slope in the seaward direction depends on different factors such as flooding, erosion, socioeconomic status, and saltwater intrusion, especially into fresh groundwater aquifers in the coastal zones.
Among the short-term events, flooding due to storm surge and heavy and intensive rainfall on and near the coastal area is of the greatest importance. As for erosion, loose sands and alluvial channels are easily eroded, while rocks in cliffs resist erosion considerably. The useful and beneficial parts of a coastal area will differ economically depending on whether the land is sandy or rocky. Although there are potential subjectivities and biases in the CVI classification due to expert opinion judgment in the literature, it is well accepted that the CVI provides decision-makers with a common tool to take at least preliminary actions to increase the resilience of coastal areas and allows for better assessments in the future.
3. Coastal Vulnerability Indices Empirical Mathematics
Although the coastal zone meteorological, social, economic, environmental, hydrological, storm, climate change, erosion, geomorphology, cliff, sand beach, and many other parameters are effective individually, their joint effects are too complex and complicated for reliable mathematical derivation. Based on the experience, knowledge, and partly on the use of remote sensing, satellite imagery, digital elevation map (DEM), and some other descriptive measures, researchers have proposed vulnerability indices to experimentally evaluate the final corresponding numerical values for the situation. In Table 1, six parameters with five classifications of “Low”, “Very Low”, “Moderate”, “High”, and “Very High” are considered, and numerical values are given for coastal slope, relative sea level change, shoreline erosion, mean tidal range, and mean wave height.

Table 1.
U.S. ranking of CVI variables [18].
Under the classifications, each class is expressed linguistically and is also underlined with numbers. It should be noted that the table contains qualitative (verbal) and quantitative (numerical) information. Particularly the geomorphological variable is based on expert opinion based on the subjective but experiential views of the researcher. In general, any coastal zone in the world will not contain all the variables in the same class, and therefore, each variable will have different class numbers. Depending on the number of variables, six different classes emerge from this table and are indicated in the literature by letters a to f. However, it is worth noting that parameters shown in this table can either be as large as a hundred or as small as three. The quality of the CVI data in Table 1 has been verified in detail by Hammer-Klose and Thieler [18], and the same data are used in this paper.
Empirical mathematical expressions for CVI are given by Hammar-Klose and Thieler [18] on two means: arithmetic and pseudo-geometric, as follows:
and
where a = geomorphology, b = coastal slope, c = relative sea-level rise rate, d = shoreline erosion/accretion rate, e = mean tide range, and f = mean wave height. According to Equation (2), when a = b = c = d = e = f = 1, CVI has the lowest value equal to 0.4 and the highest value at 51 when a = b = c = d = e = f = 5. Hamid et al. [19] defined Equation (2) as the square root of the geometric mean, or the square root of the product of the ranked variables divided by the total number of variables, which cannot be accepted due to following reasons:
- (1)
- The geometric mean implication is not correct because it is not the square root, but rather the square root of 6th order, as follows:
- (2)
- If the logarithm of both sides in Equation (2) are taken, then the nonlinearity relationship between CVI and each of the variable appears in the same form of nonlinearity equally, which may not correspond to physical effects in the natural coastal zones
- (3)
- Why is such an artificial nonlinearity integrated and what is the logical base or empirical basis of Equation (2) is not explained in open literature
- (4)
- Why are only the vulnerability classes 1, 2, 3, 4, and 5 are considered as inputs into Equations (1) and (2) and the variable available data values are not considered individually?
4. Coastal Vulnerability Indices Logical Structures
All the proposed CVI and similar indices including EVI, SVI, ICVI, and others are quite mechanical, subjective, and without any logical rule. In the following sections, bivalent and fuzzy logic representations are presented for each variable. The reader can compare the two sets to see the distinction between them.
4.1. Bivalent Logic (BL)
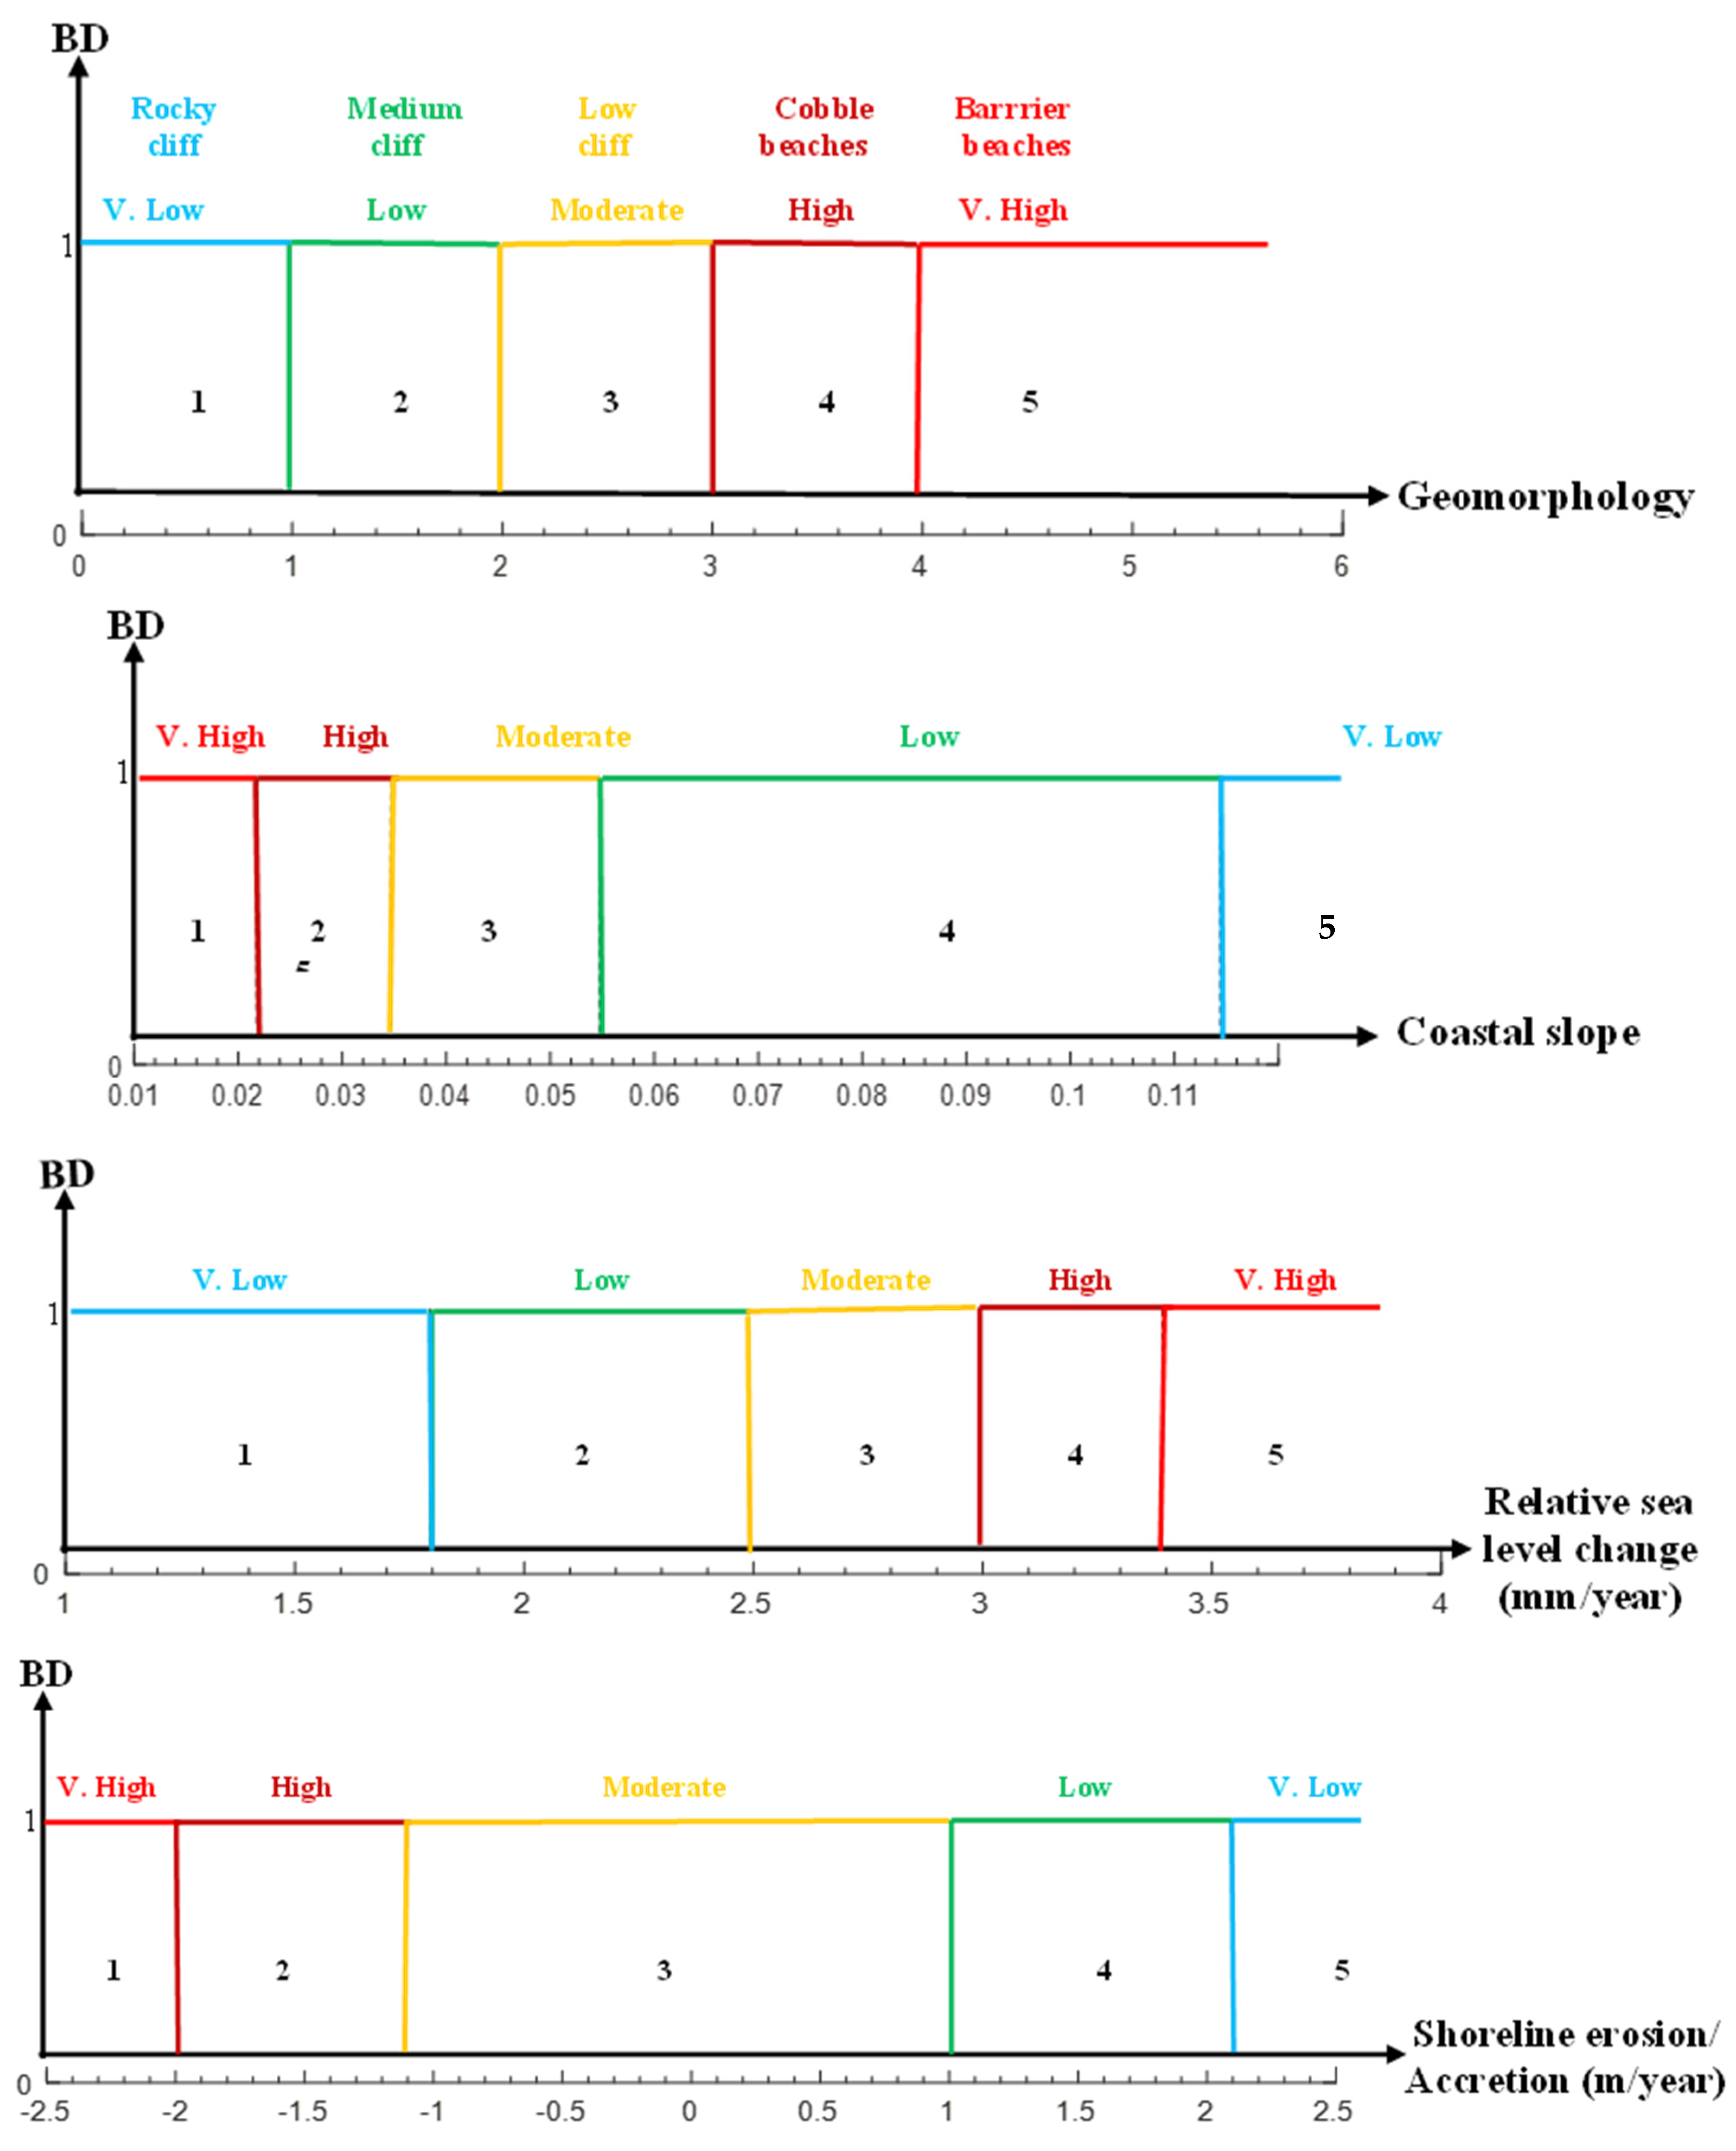
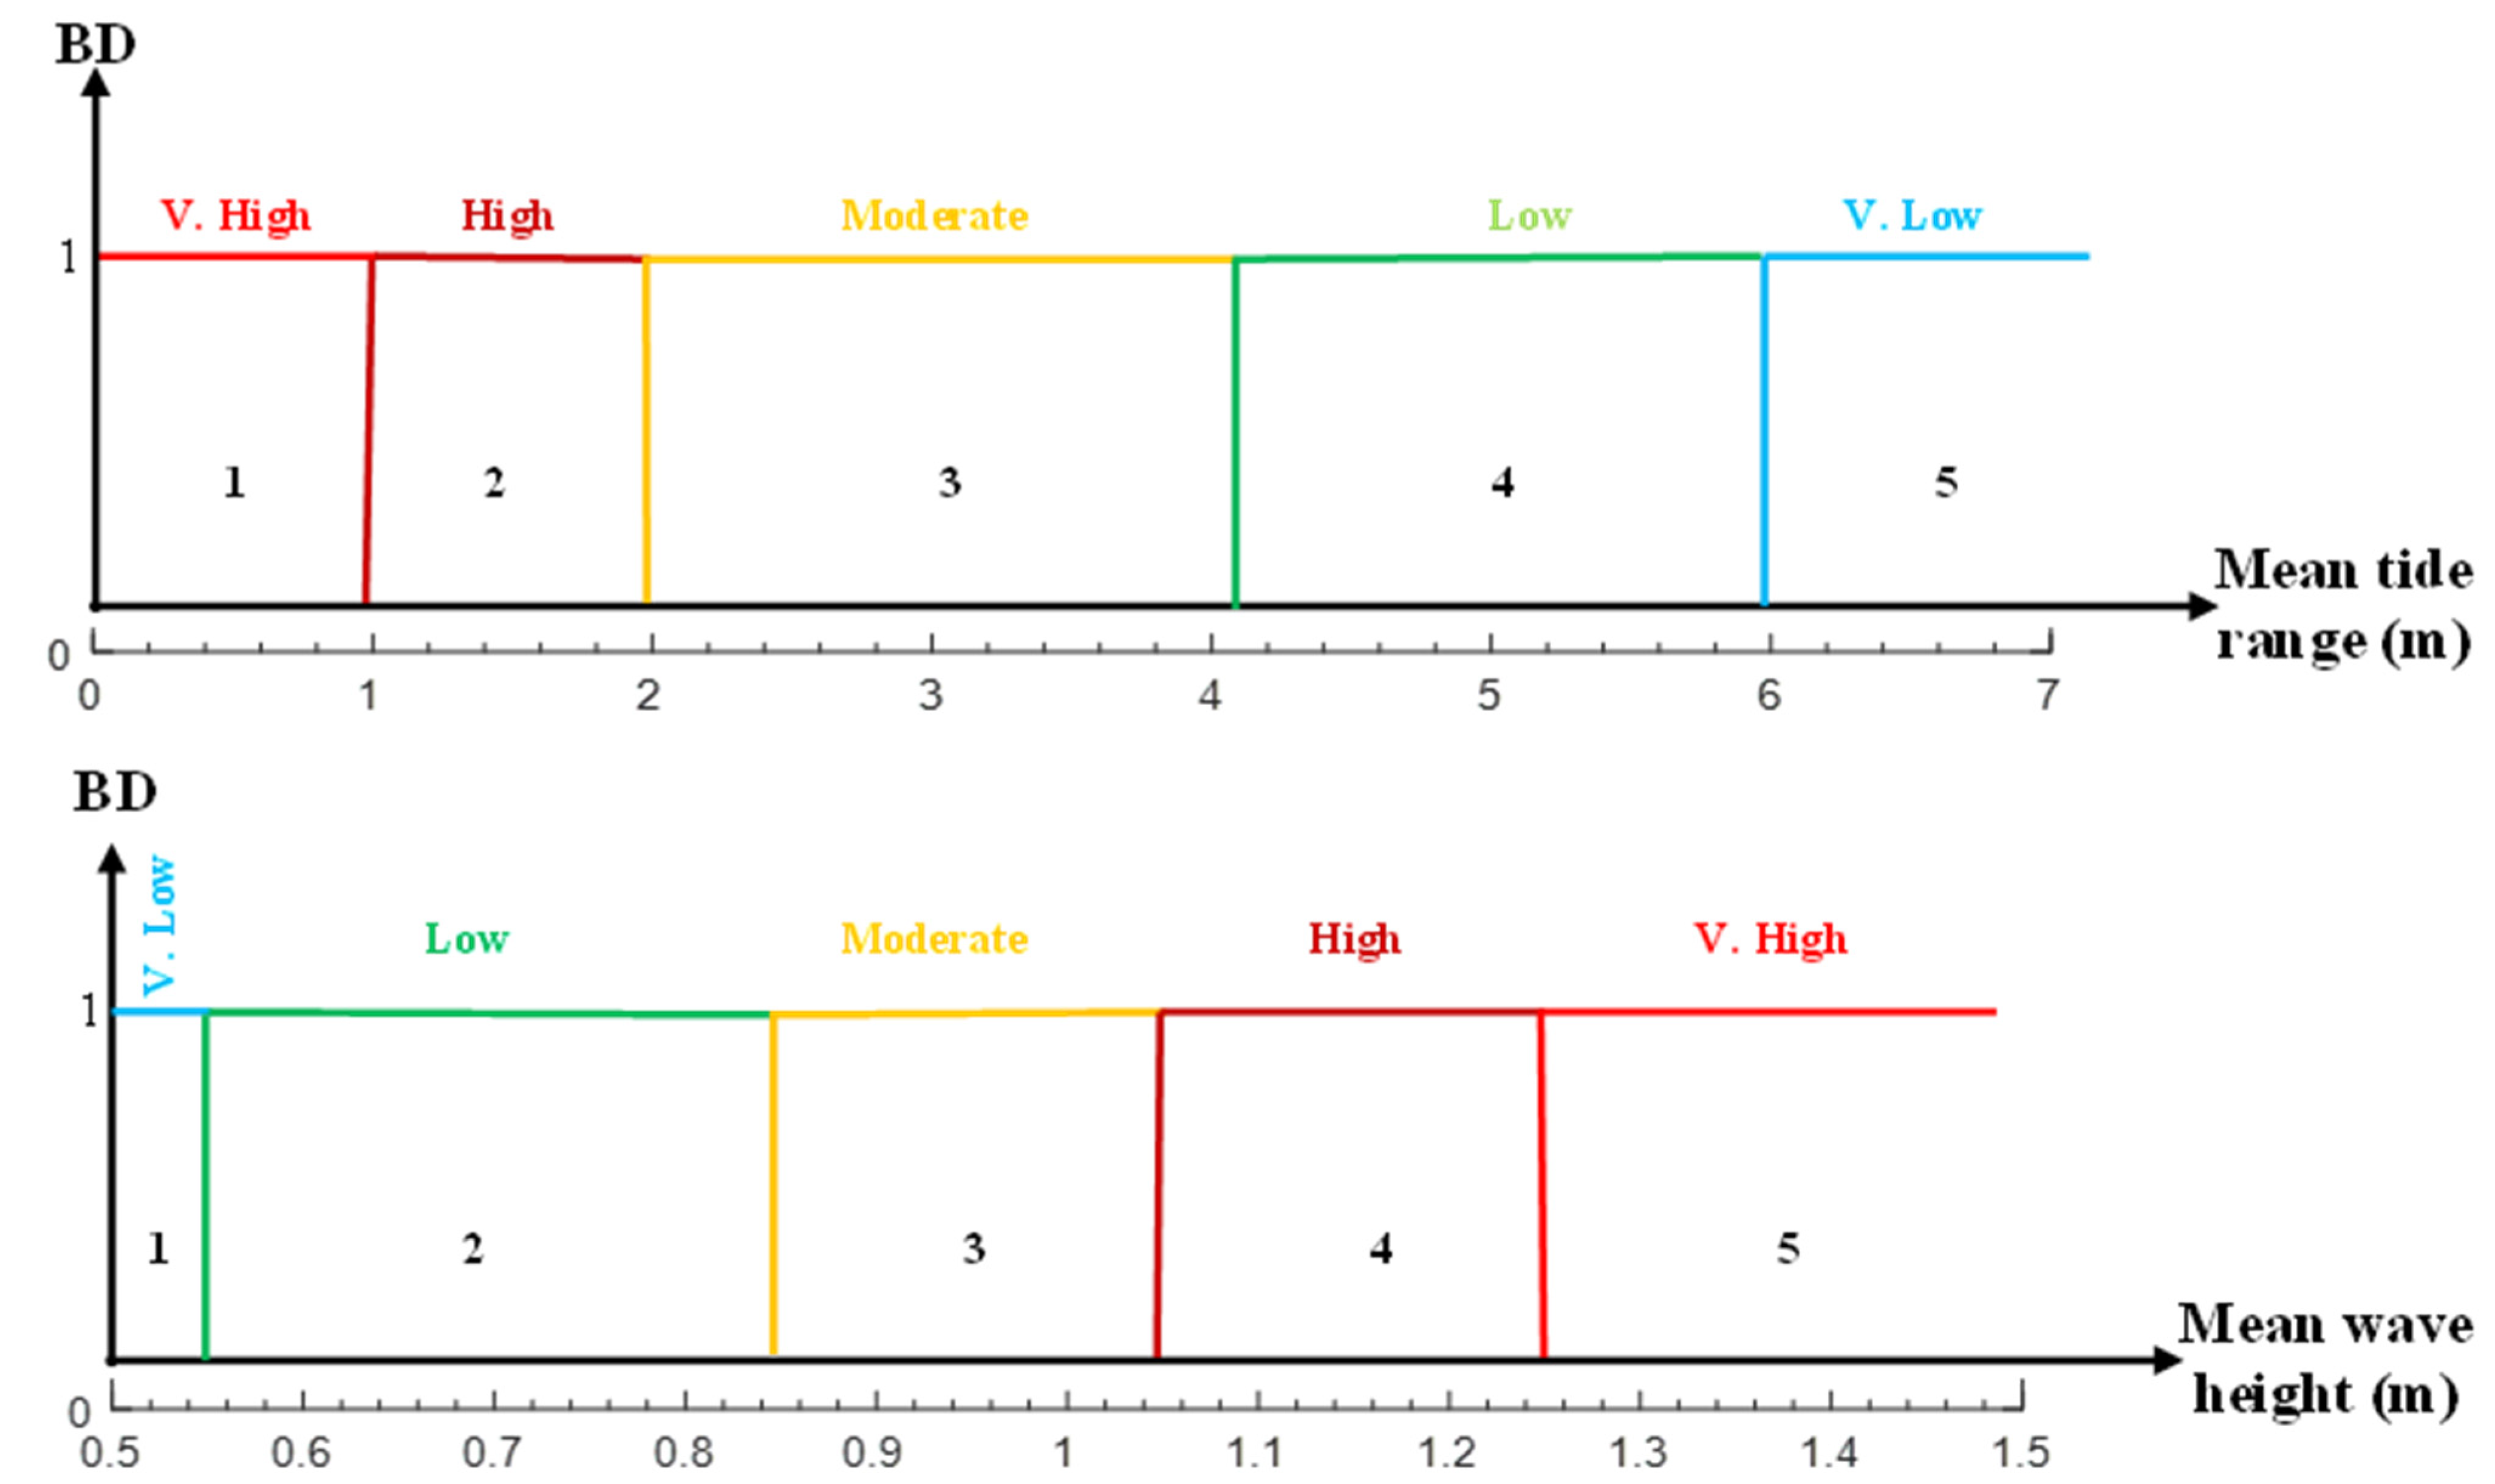
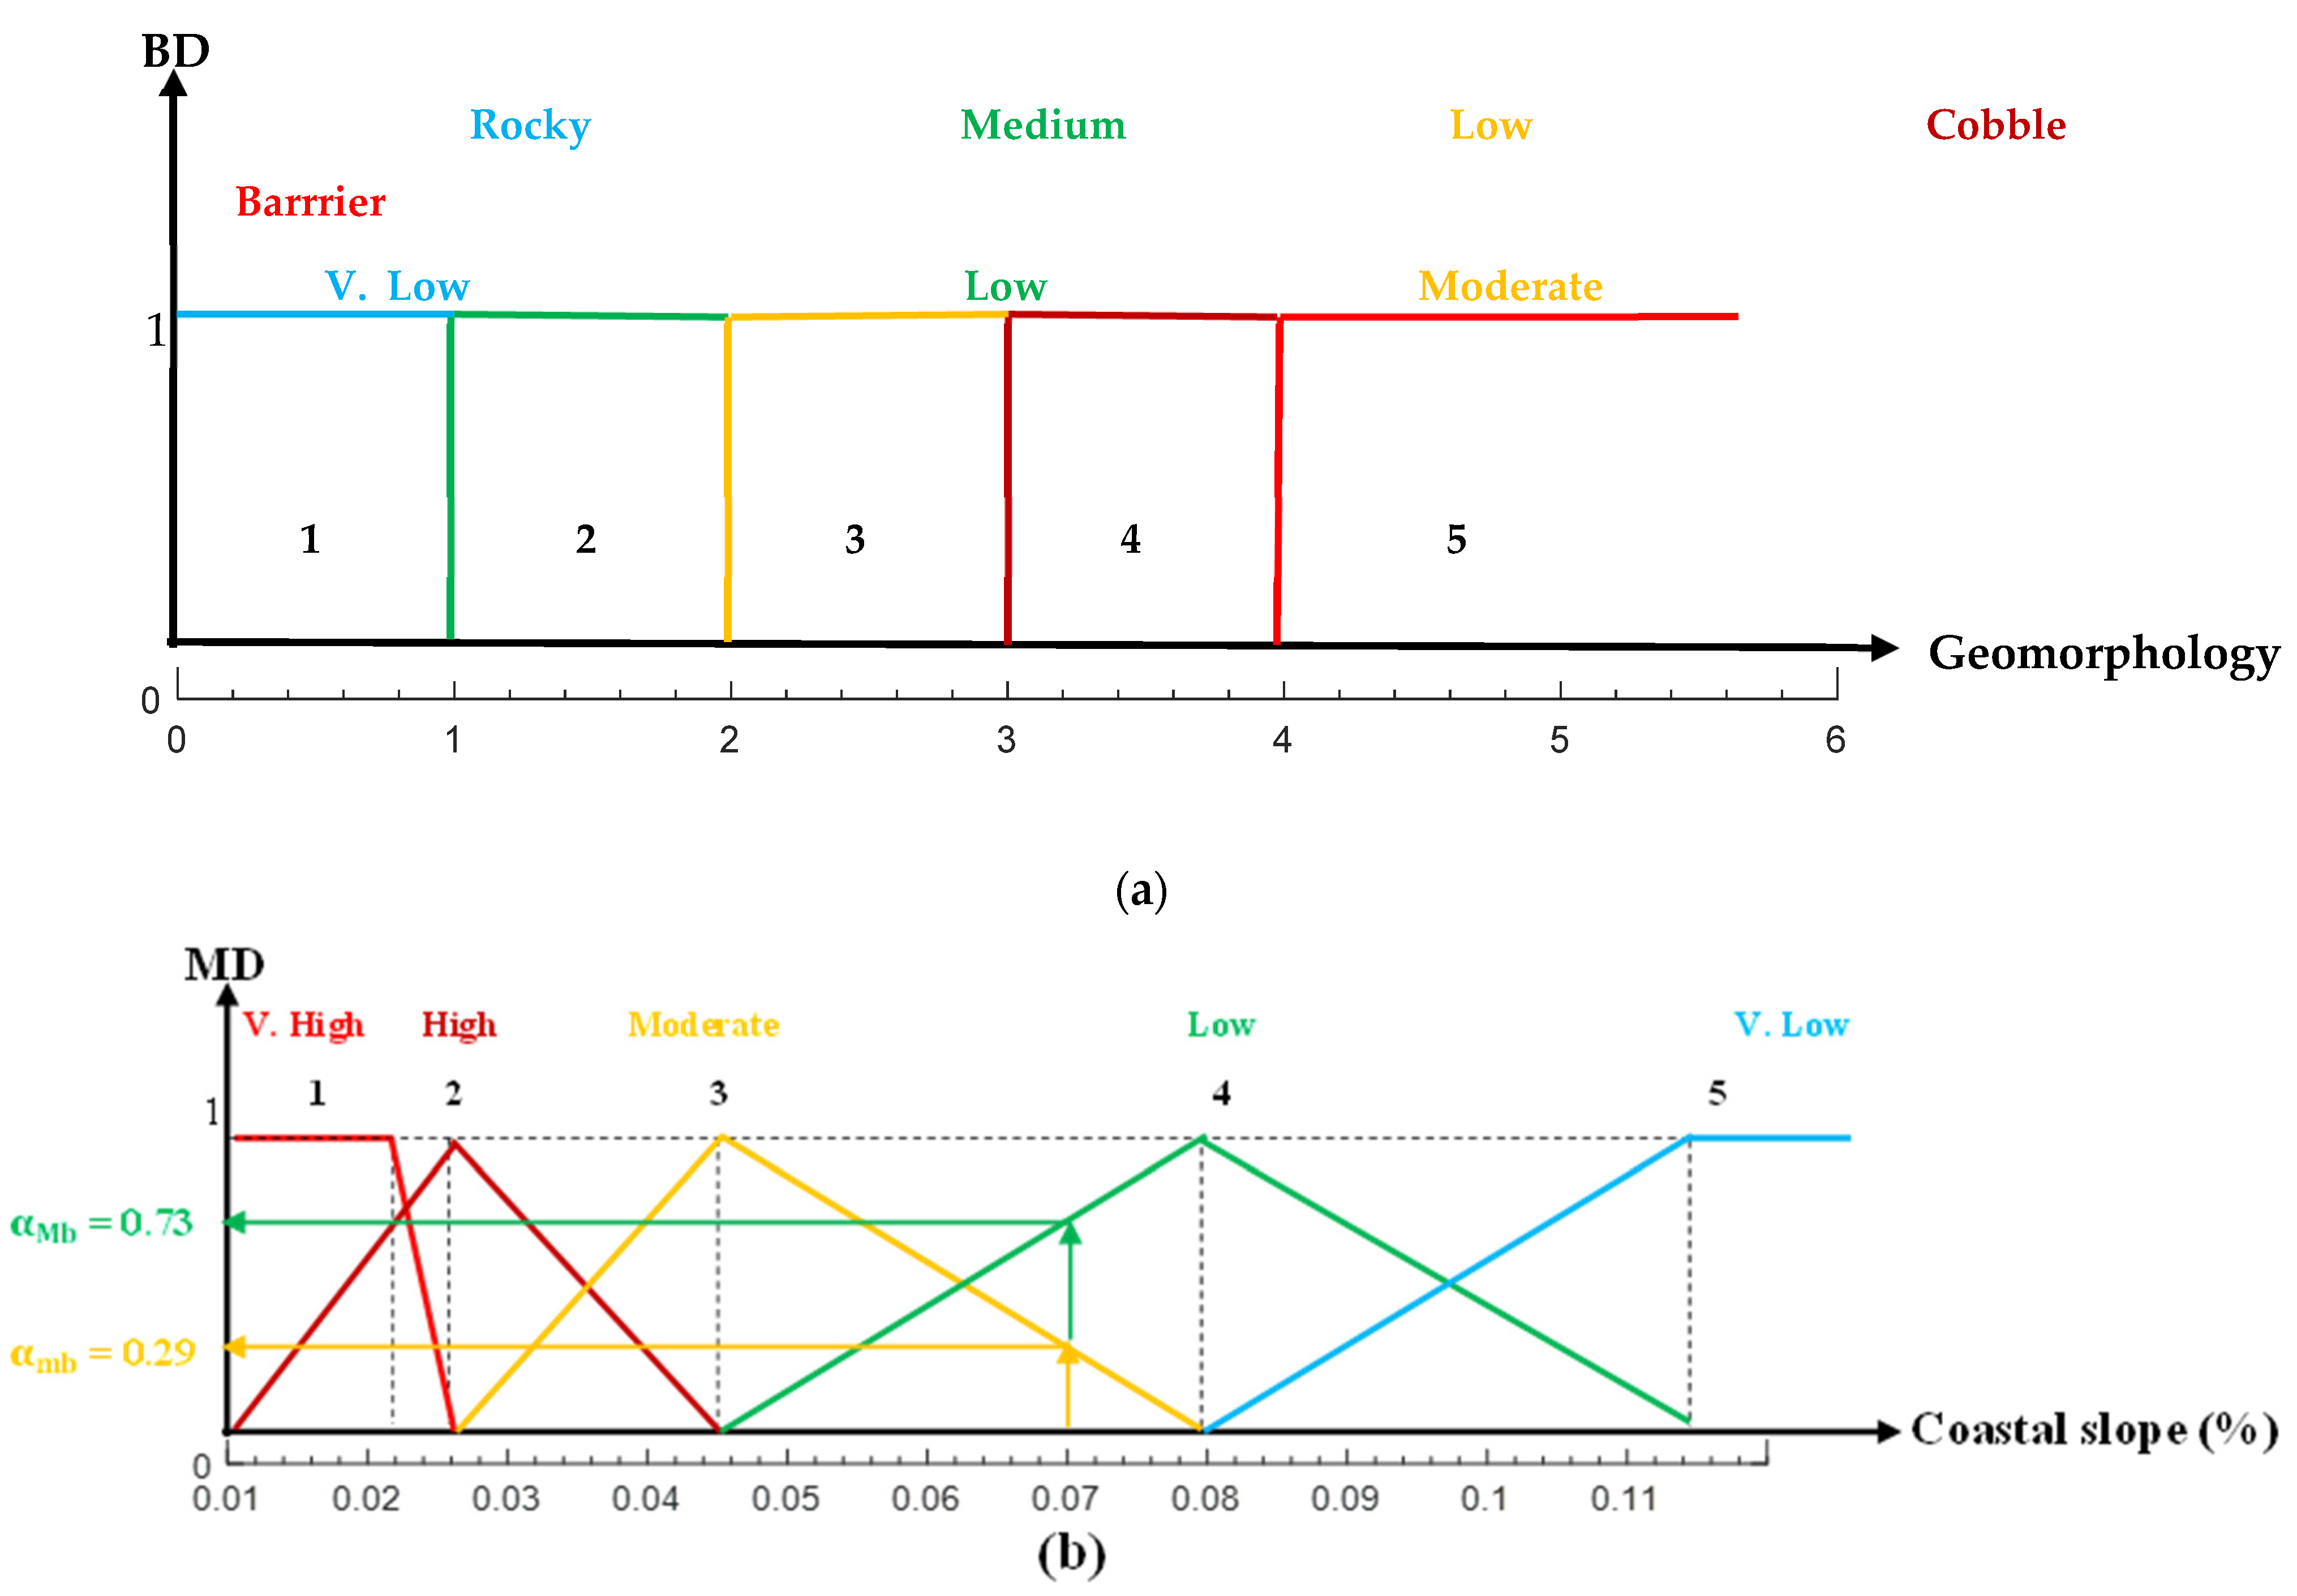
All vulnerability indices (coastal, environmental, socioeconomic, and integrated modes) are based on empirical equations criticized in the previous section, based on a bivalent logic (BL) (two-valued, true-false) that is not clearly stated in the open literature concerning CVI. This logic works lump-wise by considering belonging degree (BD) as either 0 or 1. Considering the descriptive numerical values given in Table 1, Figure 1 shows the BL basis for each of the variables. Six of the parameters are presented in rectangular forms for each class, as in Table 1.
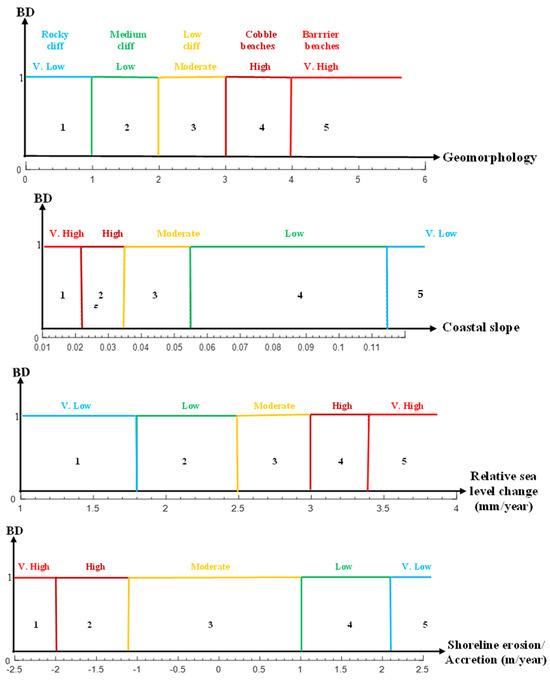

Figure 1.
Bivalent logical expression of each coastal vulnerability parameter.
The visualization of each graph shows some of the shortcomings of these BL explanations along the following points:
- (1)
- All five classifications, “V. Low”, “Low”, “Moderate”, “High”, and “V. High”, have the same belonging values: 0 (false), implying no risk, or 1 (true), implying risk
- (2)
- All data values have an equal belonging degree in each classification group. Although there are wide data ranges, any value falling in this range is not different from the others, so their effects concern the vulnerability calculation. Once a class is considered risky, all the values in this class have the same effect without distinction among them. This point shows that in CVI calculation, the direct effect of each data value is not considered at all
- (3)
- There is an abrupt transition between neighboring classes, which is quite illogical, but can be considered as an assumption that does not match the real natural situation. There should be smooth transitions between classes, as will be explained in the next section
- (4)
- Each class is considered as mutually exclusive and without any overlapping, i.e., no relationship between the successive classes
- (5)
- In Table 1, four variables have increasing direction from right to left, but shoreline erosion and mean tide length have opposite increasing direction. Thus, it is not possible to compare them graphically, but the bivalent logical graphs, in Figure 1 are shown along the same direction and hence ready for comparison of variables without with the classification labels of “V. low”, “Low”, “Moderate”, “High”, and “V. high” labels that may be in reverse order with other four variables.
What is explained in this section shows that traditional CVI is based on lump class consideration rather than subjectively.
4.2. Fuzzy Logic (FL)
The content of this section is inspired by the principles of FL proposed by the pioneer Zadeh [20,21]. On the contrary of BL, the essence of this logic is based on the following procedural steps:
- (1)
- Each data set in five risk class is attached with a membership degree (MD) that includes all decimal numbers between 0 and 1. Thus, each data value has its contribution to the overall vulnerability calculation
- (2)
- The middle value of each data range is considered to have the highest MD value equal to 1, and the others include all decimal values between 0 and 1
- (3)
- Each data range is represented by triangular forms instead of rectangles, and the zero MDs on both sides interact with neighboring data range triangle peak values as having 0 MDs
- (4)
- Since at both ends of data ranges in each variable has > and < extreme signs, the end fuzzy sets are arranged as trapezium fuzzy sets
- (5)
- The whole procedure of fuzzy sets is referred to as the fuzzification of the data ranges, which helps to consider not a lump procedure but individual data assessment for each data range, as specified in Table 1.
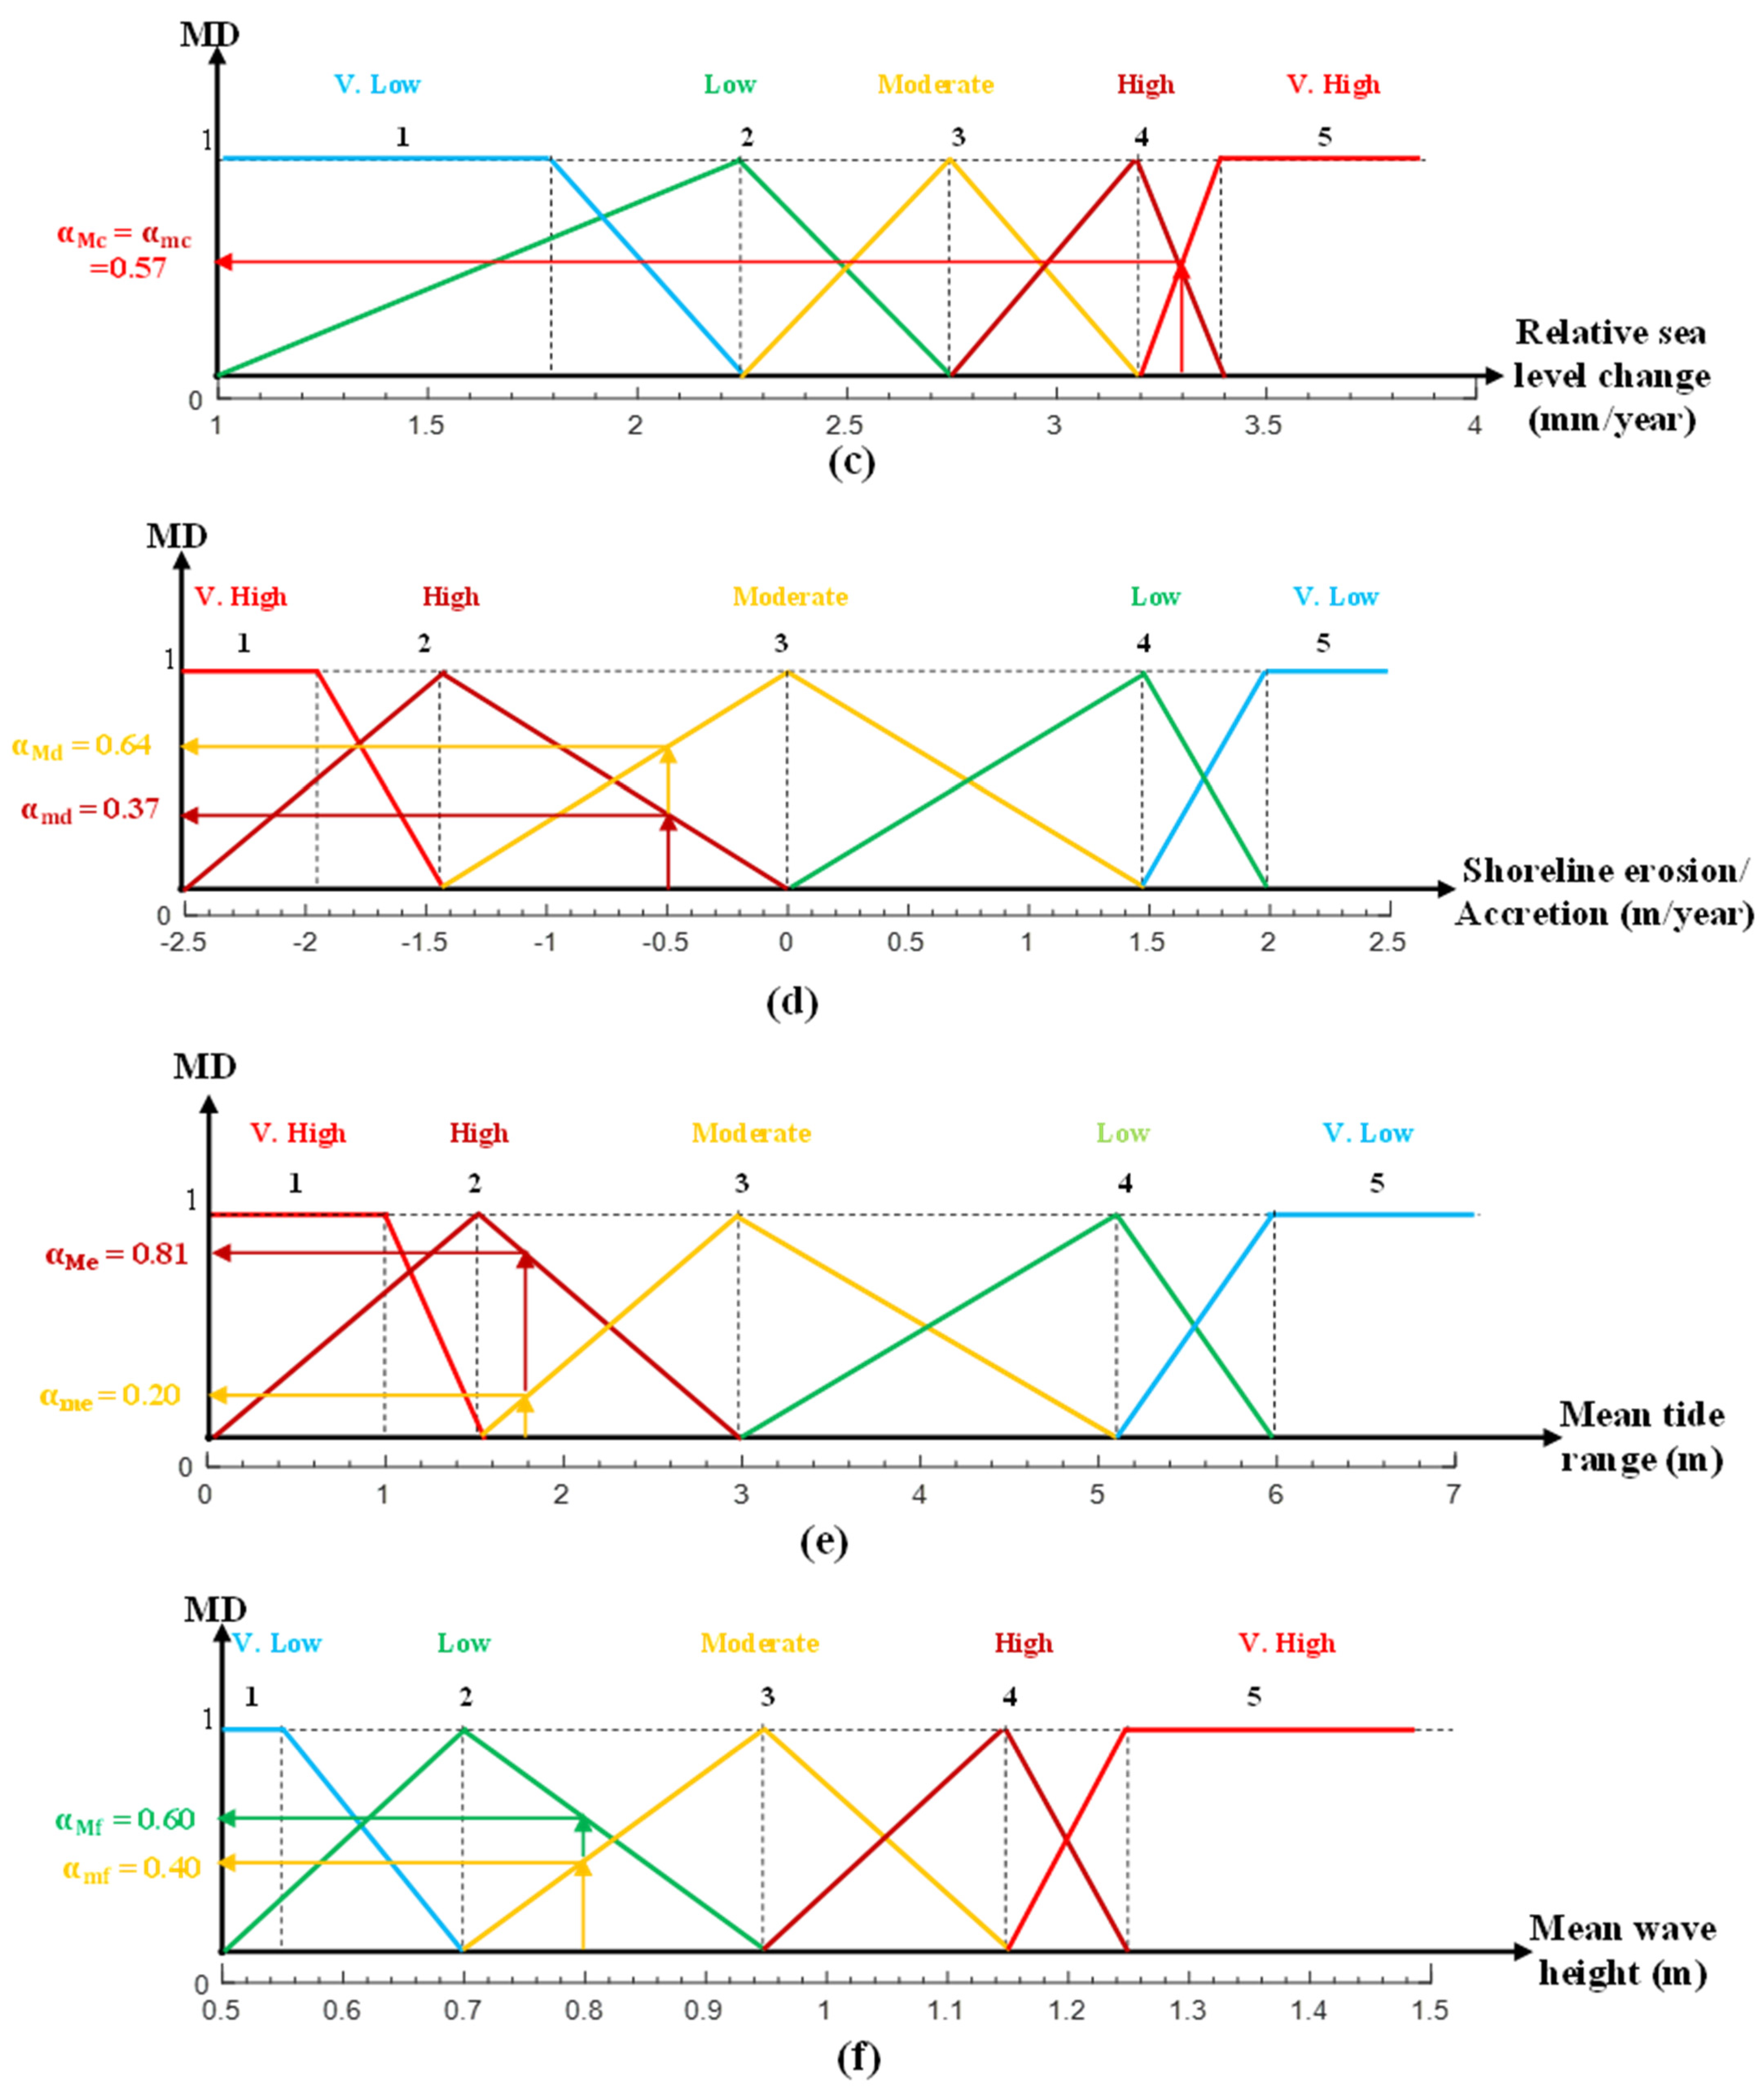
In Figure 2, all the BL representations in Figure 1 are transformed into mutually inclusive fuzzy sets in the form of triangles in the middle, bounded by trapezoidal sets at both ends.

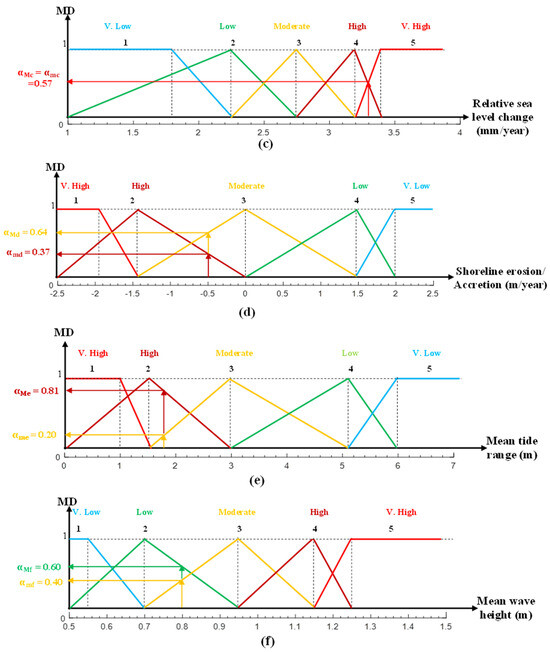
Figure 2.
Fuzzy logical expression of each coastal vulnerability parameters.
In the case of BL, there was only one class value out of five alternatives for each variable data range, but in the case of fuzzy sets, there are two classes with different MDs. Therefore, a problem of choice arises as to which one to adopt for CFVI calculation. The following points are important features of the CFVI procedure:
- (1)
- In the BL approach, five crisp classes (1-“Very low”, 2-“Low”, 3-“Moderate”, 4-“High”, and 5-“Very high”) are represented in the form of FL sets as (see Figure 2)
- (2)
- Fuzzification of classes leads to two MDs for any variable numerical data value within each of the five classes
- (3)
- The decision regarding the choice between these two values depends on the researcher’s purpose. If the higher value is adopted, the ORing procedure (membership maximization, ) procedure of fuzzy inference is used. This means that the variable higher-class MD is adapted for CFVI calculation
- (4)
- In the case of adaptation of the decision of small MD selection, the ANDing connection (minimization of membership, ) of FL [22] is effective, which means that a smaller CFVI value than the previous step will be obtained
- (5)
- Considering the last two steps, the initial equation expressions can be written not in the form of arithmetic mean as in Equation (1), but in the form nonlinear logarithm as in Equation (2). If each of the variable MD is symbolized as , and six variable data values as a, b, c, d, e, and f, then the maximum CFVI, CFVIMax, and the minimum CFVImin can be expressed as follows:
It should be noted that in these expressions, the sum of the weights is not equal to one, but all of them are less than one as MDs. The following points help the reader to conceptualize the CFVI procedure on sound grounds:
- (1)
- Equation (4) does not have linearity like Equation (1); they are based on nonlinearity, because there are no specific mathematical formulations in FL procedures, but there are different MDs for each variable data values. Since nonlinearity is hidden in FL procedures [23], there is no need for Equation (4)’s artificial importation of nonlinearity as in Equation (2), explained in Section 2
- (2)
- If the same extreme values are applied to Equation (4) with extreme a, b, c, d, e, and f data value MDs, one can obtain the minimum and maximum CFVI values, and all other data sets in between will remain between these two values, as will be explained in the next section
- (3)
- In extreme cases, all the extremely high (low) data values for each variable in Table 1 will have MDs equal to 1; therefore, Equation (4) will have the arithmetic average forms as was in Equation (1), because equality of MDs to 1 will eliminate the nonlinearity structure of these equations, and the final equations in terms of extremely high and low data values will result in the form of Equation (2):
- (4)
- One can deduct from this result that Equation (2) is valid outside the high and low variable extremes, because there is no vulnerability classification for these ranges in Table 1.
5. Results
The implementation in this paper will be based on the variability values already given in Table 1 for the US Gulf of Mexico [18]. In this section, only the numerical implementation for CFVI will be described. For this purpose, let us consider as an example the six variables as a = 2.6, b = 0.07, c = 3.3, d = −0.5, e = 1.8, and f = 0.8. Figure 2 shows the following six steps to obtain FL clusters for each variable with maximum and minimum MD values
- (1)
- Let provide a value on the horizontal axis in Figure 2a. It can be seen that = 0.55 and = 0.39
- (2)
- In Figure 2b, the input of the coastal slope as % on the horizontal axis gives the maximum and minimum MDs as = 0.39 and = 0.73, respectively
- (3)
- In Figure 2c, the input value of 3.3 mm/year relative sea level gives = 0.57; thus, the MDs are equal
- (4)
- For the erosion rate d = −0.5, the MDs are shown in Figure 2d, and their values are = 0.64 and = 0.37, respectively
- (5)
- The mean tidal range is fitted as 1.8 m, which leads to the MD values in Figure 2e as = 0.81 and = 0.20
- (6)
- Finally, the MD in Figure 2e values 2f yield = 0.60 and = 0.40 for a 1.8 m mean wave height.
After completing these steps, it is now possible to apply Equation (4) for numerical calculations. The detailed results are presented in Table 2.
Table 2.
Example 1.
The classical CVI calculation according to Equation (2) yields CVI = 9.80.
One more example is shown in Table 3 for detailed conceptualization of the CFVI procedure.
Table 3.
Example 2.
For the values in this table, traditional CVI calculation according to Equation (2) gives CVI = 13.42. Similar calculations can be done for any of the sets of variable value sets a, b, c, d, e, and f. It is also interesting to know the extremely high and low variable values’ calculations, in which case, according to the FL set groups in Figure 2, all the lowest and highest values will have MDs equal to 1. Thus, Table 4 shows the CFVI extreme value calculations.
Table 4.
CFVI extreme values according to FL sets.
It is clear from this table and its comparison with the previous two tables that the data ranges in Table 1 yield the maximum and minimum CFVI values as 3.04 and 0.38, respectively. All other alternatives will lie between these two extremes. Therefore, instead of the wide range of 0.4 and 51 from Equation (2), a more reasonable range is reached by the CFVI procedure.
6. Discussion
The CVI procedure is understandable because, in addition to some qualitative information sources such as Digital Elevation Model (DEM) satellite and remote sensing facilities, there are many factors affecting coastal zone vulnerability under the influence of qualitatively expressible variables. The classical approximation calculation methods are rather simple arithmetic mean or biased geometric mean procedures. All classical vulnerability calculations are limited to rather subjective approaches and do not include weighting factors, and the basis of the procedure is the principles of bivalent logic.
The traditional methodologies for calculating different vulnerability indices mentioned in the Introduction section are based on a rather empirical approach, and although there is a clear explanation about their calculations, the results do not distinguish between data values in each classification range in Table 1. All data values for any variable in any class are treated as a lump without any distinction between these data values, and in CVI calculations, according to Equations (1) and (2), the data themselves are not taken into consideration in the calculations. All traditional calculations are summarized so that the application of these equations can be quantitatively based on the five risk classifications of qualitative “V. low”, “Low”, “Moderate”, “High”, and “V. high”, which are represented numerically by natural numbers as 1, 2, 3, 4, and 5, respectively. Unfortunately, real numbers in the form of decimals between these numbers are not considered at all. Such strict and lumpy numbers provide a restriction on the final calculations.
Furthermore, comparisons with other vulnerability indices such as ICVI or SVI reveal further insights. While ICVI attempts to synthesize geological, hydro-physical, and socioeconomic factors, it retains the limitations of the bivalent logic and empirical formulations of the classical CVI [12]. In contrast, CFVI offers a unified framework that can potentially integrate additional variables (e.g., vegetation or human activity) without the compounding errors seen in multivariate indices such as ICVI. Although this scalability positions CFVI as a versatile tool for holistic vulnerability assessments, its application to such extended datasets was not tested in this study.
Unfortunately, in the traditional CVI procedural calculations, equations are provided subjectively without any logical basis. In science, after linguistic explanations, the second stage requires reliance on logical rules that are missing in CVI formulations.
One of the simple and frequently used assessment vulnerability methods is the Coastal Vulnerability Index (CVI), which takes into consideration several variables, including erosion, coastal slope, inundation, shoreline characteristics, and, if available, mean tidal range [24,25]. As suggested by the U.S. Geological Survey (USGS) and others, there are various steps that deal with the quantification of some variables, whereas others are qualitative expert view judgements, and thus the CVI procedure is a semi-qualitative score that has been classified into five scales, as in Table 1. Unfortunately, traditional CVI numerical data can neither be related to physical effects nor a logical basis, except based on suggestive empirical formulations. In this paper, the bivalent logical and improved fuzzy logic foundations are explained in detail. The basic fuzzy vulnerability system approach presented in this paper can also be adopted for EVI and SVI indices if their underlying variables are defined and their numerical value ranges are specified.
In this paper, the existing basic dataset was used to develop the CFVI methodology. In future studies, the number of variables can be increased with valid numerical data and thus providing more detailed studies.
The reliability of the method is validated by comparing it with the bivalent alternative in terms of uncertainty and sensitivity analysis, and the sensitivity of the CFVI method to changes in input data is found to be acceptable, as explained in Section 5.
The fuzzy logic aggregation process requires a choice between “OR” and “AND” rules, and this decision is at the discretion of the researcher. This subjectivity carries the risk of producing inconsistent vulnerability results depending on the aggregation choice, potentially compromising the repeatability and objectivity of the indicator.
7. Conclusions
It is known that vulnerability in coastal areas can cause loss of life and property and the collapse of socio-economic activities. Therefore, it is very important to make possible and valid assessments not only against the duration and frequency of natural events (wave height, geomorphological feature changes, erosion, etc.), but also against such vulnerabilities in coastal zones. Although vulnerability assessments are quite complex and involve complicated issues, the Coastal Vulnerability Index (CVI) is widely used in the literature to express the combined vulnerability of a set of variables. They represent geomorphologic, coastal and sea level, as well as time and wave heights. In the literature, CVI calculation is based on arithmetic and more often on so-called geometric mean concepts in the form of mathematical equations that do not have any analytical, physical, or logical basis, but through empirically suggested expert recommendation formulations. This article first criticizes the basic approach in the classical CVI procedure and then presents its bivalent logic (BL) rules in the form of graphs for each variable. After mentioning the limitations in CVI, a new procedure based on fuzzy logic (FL) sets is proposed as the Coastal Fuzzy Vulnerability Index (CFVI) procedure. It is shown that the FL approach provides weights in terms of membership degrees (MDs), and the vulnerability index is calculated according to the weighted average mathematical expression. Each fuzzy set provides a distinctive contribution to each variable data set, and therefore, a nonlinearity is introduced by different weights that are all values between 0 and 1. It is shown in the paper that the arithmetic average formulation suggestion is valid only for extremely low class and very high class outliers. In the traditional CVI procedure, maximum and minimum CVI values lie between 0.42 and 51, whereas in the CFVI procedure, they are 3.04 and 0.38, respectively; thus, there is a very significant reduction in the final vulnerability calculations. After all these findings, the number of input variables can be increased without any restriction. Future research directions can be considered as the reflection of CFVI on other valid indices such as the Environmental Vulnerability Index (EVI), the Socioeconomic Vulnerability Index (SVI), and others. Further empirical validation using observed damage and impact data and case studies in different coastal environments would increase confidence in the usefulness of CFVI.
Funding
This research received no external funding.
Data Availability Statement
The data presented in this study are available on request from the corresponding author.
Conflicts of Interest
The author declares no conflict of interest.
References
- Pachauri, R.K.; Mayer, L. Intergovernmental Panel on Climate Change, IPCC Climate Change 2014: Synthesis Report; Contribution of Working Groups I, II and III to the Fifth Assessment Report of the Intergovernmental Panel on Climate Change; Core Writing Team, Pachauri, R.K., Meyer, L.A., Eds.; IPCC: Geneva, Switzerland, 2014; p. 151. [Google Scholar]
- Intergovernmental Panel on Climate Change. Climate Change 2007: The Physical Science Basis. Contribution of Working Group I to the Fourth Assessment Report of the Intergovernmental Panel on Climate Change; IPCC Summary for Policy Makers; Solomon, S., Qin, D., Manning, M., Chen, Z., Marquis, M., Averyt, K.B., Tignor, M., Miller, H.L., Eds.; Cambridge University Press: Cambridge, UK, 2007. [Google Scholar]
- Pethick, J.S.; Crooks, S. Development of a coastal vulnerability index: A geomorphological perspective. Environ. Conserv. 2019, 27, 359–367. [Google Scholar] [CrossRef]
- Nicholls, R.J.; Wong, P.P.; Burkett, V.R.; Codignotto, J.O.; Hay, J.E.; Ragoonaden, S.; Woodroffe, C.D. Coastal systems and low-lying areas. In Climate Change 2007: Impacts, Adaptation and Vulnerability. Contribution of Working Group II to the Fourth Assessment Report of the Intergovernmental Panel on Climate Change; Parry, M.L., Canziani, O.F., Palutikof, J.P., van der Linden, P.J., Hanson, C.E., Eds.; Cambridge University Press: Cambridge, UK, 2007; pp. 315–356. [Google Scholar]
- Simac, N.; Faivre, S. Overview of Coastal Vulnerability Indices with Reference to Physical Characteristics of the Croatian Coast of Istria. Hydrology 2023, 10, 14. [Google Scholar] [CrossRef]
- Kuleli, T.; Bayazit, S. An integrated approach to the spatial distribution of the coastal infrastructure vulnerability by using coastal vulnerability index and hot spot analysis: A case study of Kusadasi-Selcuk. Nat. Hazards 2024, 120, 14117–14151. [Google Scholar] [CrossRef]
- Pantusa, D.; D’Alessandro, F.; Frega, F.; Francone, A.; Tomasicchio, G.R. Improvement of a coastal vulnerability index and its application along the Calabria Coastline, Italy. Sci. Rep. 2022, 12, 21959. [Google Scholar] [CrossRef] [PubMed]
- Dal Cin, R.; Simeoni, U. Coastal zoning and vulnerability: Application to the Middle Adriatic (Italy). Coast. Zone 1989, 89, 98–110. [Google Scholar]
- Williams, A.T.; Davies, P.; Chrr, R.; Koh, A.; Bodéré, J.C.; Hallegouet, B. A checklist assessment of dune vulnerability and protection in Devon and Cornwall, UK. Coast. Zone 1993, 93, 3394–3408. [Google Scholar]
- Quelennec, R.E. The Corine ‘Coastal Erosion Project’: Identification of coastal erosion problems and data base on the littoral environment of eleven European countries. Coast. Zone 1989, 89, 4594–4601. [Google Scholar]
- Kantamaneni, K. Coastal infrastructure vulnerability: An integrated assessment model. Nat. Hazards 2014, 84, 139–154. [Google Scholar] [CrossRef]
- Alcántara-Carrió, J.; Echavarría, L.M.G.; Jaramillo-Vélez, A. Is the coastal vulnerability index a suitable index? Review and proposal of alternative indices for coastal vulnerability to sea level rise. Geo-Mar. Lett. 2024, 44, 8. [Google Scholar] [CrossRef]
- Theocharidis, C.; Doukanari, M.; Kalogirou, E.; Christofi, D.; Mettas, C.; Kontoes, C.; Hadjimitsis, D.; Argyriou, A.V.; Eliades, M. Coastal Vulnerability Index (CVI) Assessment: Evaluating Risks Associated with Human-Made Activities along the Limassol Coastline, Cyprus. Remote Sens. 2024, 16, 3688. [Google Scholar] [CrossRef]
- Köroğlu, A.; Ranasinghe, R.; Jimenez, J.; Dastgheib, A. Comparison of coastal vulnerability index applications for Barcelona. Ocean Coast. Manag. 2019, 178, 104799. [Google Scholar] [CrossRef]
- Oloyede, M.O.; Williams, A.B.; Ode, G.O.; Benson, N.U. Coastal Vulnerability Assessment: A Case Study of the Nigerian Coastline. Sustainability 2022, 14, 2097. [Google Scholar] [CrossRef]
- Mullick, R.A.; Tanim, A.H.; Islam, S.M.S. Coastal vulnerability analysis of Bangladesh coast using fuzzy logic based geospatial techniques. Ocean. Coast. Manag. 2019, 174, 154–169. [Google Scholar] [CrossRef]
- Tahri, M.; Maanan, M.; Bouksim, H.; Hakdaoui, M. Using Fuzzy Analytic Hierarchy Process multi-criteria and automatic computation to analyse coastal vulnerability. Prog. Phys. Geogr. 2017, 41, 268–285. [Google Scholar] [CrossRef]
- Hammar-Klose, E.S.; Thieler, E.R. Coastal Vulnerability to Sea-Level Rise: A preliminary Database for the US Atlantic, Pacific and Gulf of Mexico Coasts. US Geological Survey, Coastal and Marine Geology Program. 2001. Available online: https://pubs.usgs.gov/dds/dds68/htmldocs/project.htm (accessed on 30 March 2019).
- Hamid, A.I.A.; Din, A.H.M.; Yusof, N.; Abdullah, N.M.; Omari, A.H.; Khanan, M.F.A. Coastal Vulnerability Index Development: A review. In Proceedings of the International Archives of the Photogrammetry, Remote Sensing and Spatial Information Sciences, 2019 6th International Conference on Geomatics and Geospatial Technology (GGT 2019), Kuala Lumpur, Malaysia, 1–3 October 2019; Volume XLII-4/W16. [Google Scholar]
- Zadeh, L.A. Fuzzy algorithms. Inf. Control 1968, 12, 94–102. [Google Scholar] [CrossRef]
- Zadeh, L.A. Towards a theory of fuzzy systems. In Aspects of Network and System Theory; Kalman, R.E., DeClaris, N., Eds.; World Scientific Publishing Co Pte Ltd.: Singapore, 1971. [Google Scholar]
- Ross, J.T. Fuzzy Logic with Engineering Applications; McGraw-Hill, Inc.: New York, NY, USA, 1995; p. 593. [Google Scholar]
- Şen, Z. Fuzzy Logic and Hydrological Modeling; CRC Press: Boca Raton, FL, USA; Taylor and Francis Group: Oxfordshire, UK, 2020; p. 340. [Google Scholar]
- Gornitz, V.; Daniels, R.C.; White, T.W.; Birdwell, K.R. The Development of a Coastal Risk Assessment Database: Vulnerability to Sea-Level Rise in the U.S. Southeasts (DE-AC05-84OR21400); US Government Report, Oak Ridge National Laboratory: Oak Ridge, TN, USA, 1993. [Google Scholar]
- Shaw, J.; Taylor, R.B.; Forbes, D.L.; Ruz, M.H.; Solomon, S. Sensitivity of the Coasts of Canada to Sea-Level Rise; Geological Survey of Canada: Ottawa, Canada, 1998; Volume 505, pp. 1–7. [Google Scholar]
Disclaimer/Publisher’s Note: The statements, opinions and data contained in all publications are solely those of the individual author(s) and contributor(s) and not of MDPI and/or the editor(s). MDPI and/or the editor(s) disclaim responsibility for any injury to people or property resulting from any ideas, methods, instructions or products referred to in the content. |
© 2025 by the author. Licensee MDPI, Basel, Switzerland. This article is an open access article distributed under the terms and conditions of the Creative Commons Attribution (CC BY) license (https://creativecommons.org/licenses/by/4.0/).