Abstract
Drop hammer impact tests were conducted to study crack features and the ductile–brittle transition in sea ice under low-speed impact. Crack images were analyzed using Hessian filtering and Hough transform methods, and a finite element model was created. Material parameters were validated using the crack tip strength factor. Energy dissipation, focusing on kinetic energy, was analyzed to understand energy conversion and crack propagation in sea ice during low-speed impact. The results indicate that the angular distribution of the crack mode exhibits central symmetry, with the peak frequency at each angle approximately 5°. As the initial impact kinetic energy increases, the dynamic response of the sea ice plate transitions from toughness to brittleness; the kinetic energy dissipation increases linearly, while its utilization efficiency declines. The variation in the kinetic energy conversion rate (η) is associated with the mode of ice plate failure. The crack propagation rate follows a normal distribution in relation to changes in time and kinetic energy. The stress wave effect predominates in the fracture formation mode, further elucidating the ductile–brittle transition behavior of sea ice. This research holds significant implications for ice-breaking operations.
1. Introduction
In winter, coastal areas frequently suffer from sea ice disasters, causing significant economic losses and safety hazards []. Figure 1 shows the sea ice disasters in certain regions of the Bohai Bay []. Common ice-breaking methods, including those using icebreakers, ice-breaking projectiles, and mechanical impacts, are all classified as low-speed impact processes []. EM Schulson’s quasi-static tests have shown that sea ice exhibits mechanical behaviors ranging from ductility to brittleness under different strain rates. As G Dong’s study []. The ductile–brittle transition node of river ice in Harbin section of Songhua River in the process of strain rate evolution is obtained. Additionally, research by Zhang has proposed that sea ice also demonstrates such behaviors during impact processes. The mechanical properties of sea ice pose a challenging issue for ice-breaking operations. Therefore, it is particularly important to study the crack characteristics and ductile–brittle transition mechanism of sea ice under low-speed impact conditions [].

Figure 1.
Winter sea ice disaster in Bohai Bay.
In the research on the mechanical response behaviors of sea ice [], scholars have described the laws of crack morphology from a subjective perspective through theoretical derivation and mechanical tests. Previous studies have made substantial fruitful efforts in investigating the mechanical response behaviors of ice during impact processes: A Banik [] in the research on low-speed impact of ice impactors and CFRP sandwich composites. It was found that the degree of damage of ice at different freezing temperatures under the same load was quite different. A Combescure [] studied the fracture modes of ice under high-speed impacts and analyzed the dynamic fracture phenomena of equiaxed ice and single-crystal ice; J. Dong et al. [] designed a cylindrical pile ice load test affected by drift ice to establish the relationship between impact and kinetic energy, and finally determined the design ice load for the pile; DG Matskevitch [] discussed an ice-structure interaction model, and the results showed that compared with head-on collisions, the eccentricity of collisions leads to a significant reduction in the maximum ice load; JB Kennedy [] used the rigid-plastic theory and Tresca yield criterion to study the deformation response of floating ice under high strain rate loads, and derived expressions for the total response time and final deformation morphology of floating ice; F Müller [] investigated the ice-structure interaction process from the perspective of ice shape and discussed the influence of the initial ice contact shape on local loads; Yiheng Zhang [] systematically explored the effects of impact velocity, ice sample thickness, and constraint conditions on the dynamic fracture process and failure mode; Junzheng Yue [] analyzed the process of low-speed penetration of sea ice by steel projectiles using the CDEM method. While the aforementioned studies have explored the dynamic response modes of ice under high strain rate loads from different angles and revealed the failure behaviors of ice under various impact conditions, they lack research conducted from the perspective of the physical property of ice’s ductile–brittle transition mechanism. However, this property has been reflected in studies on quasi-static loads: RA Batto [] proposed a ductile–brittle transition model of ice under uniaxial compression, which can well explain the ductile–brittle transition mechanism of ice under static loads; C Wang et al. [] conducted uniaxial compression tests on single-crystal freshwater ice under different strain rates and crystal orientations, and the results showed that within the ductile–brittle transition range, the propagation mode of cracks is related to the strain rate. The stress concentration at the crack tip is released through basal sliding, which inhibits crack propagation and manifests as ductile failure with multiple cracks; when the strain rate is high, the crack tip cannot grow stably, leading to the generation of inclined cracks and resulting in spalling or axial splitting failure, with ice exhibiting a brittle failure mode; LI Zhijun et al. [] studied the influence of ice porosity on the ductile–brittle transition of sea ice under uniaxial compression; EM Schulson [] proposed two criteria for the transition strain rate, one phenomenological and the other more physical, with the included parameters covering the macroscopic size of ice features, fracture toughness, friction coefficient, creep rate, and microstructural scale. In the above studies, quantitative statistics and regularity analysis of sea ice crack morphology have not been realized. In order to study the ductile–brittle transition behavior of sea ice from the perspective of crack propagation law, this paper realizes the quantification of sea ice crack by Hough transform method. This method has a wide range of application prospects in other fields, such as: R.E. Rizzo [] developed the Fracpaq toolbox using the Hough method; this toolbox characterized the crack attribute distribution of two fractured rock masses in the Santa Cruz region of the United States and conducted statistical characterization via maximum likelihood estimation and K-S test methods. It is evident that the Hough transform method enables both the detection of crack morphology and statistical quantitative analysis.
Current research on sea ice faces three primary limitations: insufficient studies on the ductile–brittle transition under impact loads, a lack of investigations into image recognition for crack morphologies, and a scarcity of research regarding crack morphology and energy conversion during low-speed impacts. To address these issues, drop hammer impact tests were performed with varying kinetic energy and ice plate thickness. A novel sea ice crack detection method based on Hessian matrix filtering was proposed, facilitating quantitative crack analysis through the Hough transform. The study examined crack characteristics, including length, angle distribution, fragmentation degree, and statistical laws under low-speed impact loads. Additionally, finite element simulations were employed to investigate crack propagation and the mechanical behavior of sea ice, thereby enhancing the understanding of the ductile–brittle transition and providing a theoretical foundation for emergency risk mitigation operations in port ice conditions.
2. Materials and Methods
2.1. Specimen Preparation
Sea ice samples are typically collected using in situ sampling methods in research. However, challenges associated with climate and transportation can result in inaccuracies and data variability. To address these issues, artificial freezing was employed to prepare sea ice samples, with the goal of replicating the properties of natural sea ice. This method is straightforward to implement and contributes to the stabilization of test results to some extent [].
Sea ice plate specimens were created using the rectangular mold freezing method. The seawater salinity in the Bayuquan area was recorded at 33.4 ppt. To prepare the brine, sea salt was dissolved in water and then frozen in a mold at −25 °C for 24 h. After freezing, the mold was briefly immersed in water for 1 min to facilitate demolding and release prestress. Once demolded, the ice plate was polished. It had an average density of 1.02 g/cm3 and a uniaxial compressive strength of 2.12 MPa. The samples measured 34 × 21.5 cm with thicknesses of 3 cm, 4.5 cm, and 6 cm. Indoor impact tests should commence at −10 °C to ensure reliable data.
2.2. Test Scheme
As shown in Figure 2. The JZ-5011 drop hammer (Luoyang Dahua Heavy Type Machinery, Luoyang, China) impact testing machine consists of a main frame, guide rod, lifting system, anti-secondary impact mechanism, automatic drop hammer mechanism, scale, and electrical control box. The apparatus has an overall height of 3.5 m and features a 9.5 kg drop hammer with a hemispherical impact head. Data collection is facilitated by a dynamic strain gauge. A load sensor with a 10 kN range and ±0.01 kN accuracy measures impact load. Impact velocity is adjusted by altering release heights, ensuring a 5% maximum deviation within test groups. Data is acquired at 50 kHz due to the instantaneous impact nature.
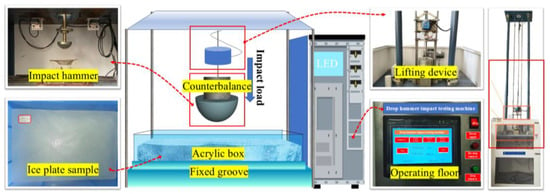
Figure 2.
Testing equipment.
Five drop hammer release heights (0.3 m, 0.6 m, 0.9 m, 1.2 m, and 1.5 m) resulted in impact velocities of 2.43 m/s, 3.43 m/s, 4.20 m/s, 4.85 m/s, and 5.42 m/s, respectively. These velocities were tested on sea ice plates with thicknesses of 3 cm, 4.5 cm, and 6 cm, creating a total of 15 test groups. Detailed information about the test design is provided in Table 1. For example, “I-3.0-0.3” denotes a sea ice plate “I” with a 3 cm thickness and a 0.3 m drop height. After each impact test, images were taken, followed by preprocessing of the crack images and analysis of the test results.

Table 1.
Impact test group and variable combination.
2.3. Test Method
To address the unclear boundaries of fracture sea ice cracks and better quantify their shapes, we propose a comprehensive image processing workflow, illustrated in Figure 3. The process begins by importing the original sea ice plate image and converting it to grayscale. A built-in 2D filter in MATLAB v2020 is then used for initial noise reduction [], followed by an erosion algorithm, a morphological image processing technique, to remove edge artifacts. At this stage, crack-related features become visible []. Next, Gaussian smoothing and Frangi filtering are applied to further reduce noise, although some remain at the edges []. The image’s overall contrast is enhanced by emphasizing the gray difference between crack and non-crack areas, aiding in distinguishing the crack from the background. Once the contrast-enhanced image is obtained [], a one-step erosion operation is conducted to remove small noise components within the crack image []. Following image skeleton pruning rules, the main crack regions are preserved []. Finally, the Otsu method converts the processed image into a binary format, allowing the final crack to be quantified using the Hough transform [,,].

Figure 3.
Crack identification flow chart.
2.3.1. Crack Quantification Method
- Crack Enhancement
The image of sea ice crack after impact is preprocessed, and the characteristics of the target linear structure size are analyzed, and the most suitable spatial scale factor is selected. When determining ψ, we should select the most matching ψ with the sea ice crack in the image to ensure that the filter output is the largest. After the pixels in the image are integrated with their output, the enhanced processing image is obtained to facilitate next analysis and discussion [].
Table 2 shows the properties of Hessian eigenvalues. In the process of image processing, because most of the images to be processed usually contain linear structures of multiple scales, in order to more accurately detect various linear structures at different scales, the difference operation of the Hessian matrix is combined with the Gaussian function, and the linear enhancement filtering is enhanced by changing the different scales of the spatial scale factor ψ of the Gaussian function. According to the convolution property of the Gaussian function, the scale space derivative Ixy is obtained by the convolution of the input image and the second derivative of the Gaussian filter [].

Table 2.
Characteristics of Hessian eigenvalues.
The Hessian matrix is the square matrix of the second-order partial derivative of the scalar function, which is composed of the horizontal, vertical and diagonal second-order partial derivatives of the image. At the same time, the eigenvalue estimation of the matrix can be used to determine the probability of sea ice cracks in the image area.
H denotes the Hessian matrix; Ixx, Ixy, Iyx and Iyy denote four second-order partial derivatives in the region of the image, respectively [].
When enhancing sea ice crack images, the output results vary with different scale factors. Test results, as illustrated in Figure 4, present the image outputs corresponding to different spatial scale factors (ψ). It is evident that when ψ ≤ 0.5, the general shape and direction of sea ice cracks can be roughly identified. However, when ψ ≥ 0.5, the output images appear uniformly gray—making it difficult to distinguish clear sea ice cracks or their directions. Such images suffer from severe distortion and fail to provide useful information for subsequent processing and analysis. When ψ = 0.2, the image exhibits a dark overall grayscale tone, with even darker grayscale in sea ice crack regions. Although the approximate shape and direction of cracks are visible, the information content of image features remains limited. Notably, when the spatial scale factor is set to ψ = 0.4, the extraction of image-related features becomes significantly more accurate. Based on the output results of sea ice crack characteristics in the images, the spatial scale factor ψ is determined to be 0.4. This value is better suited for enhancing sea ice crack features: it allows for a more intuitive visualization of crack shape and direction, while the image enhancement degree is moderate—providing optimal conditions for subsequent feature extraction and analysis.
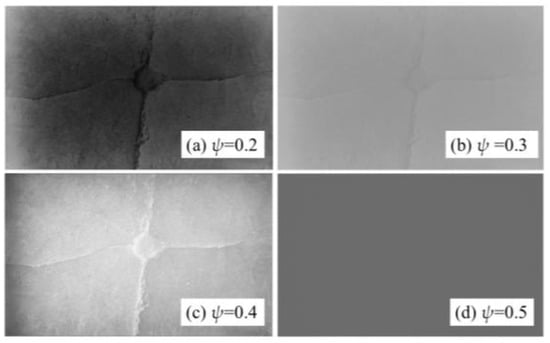
Figure 4.
The output results of Hessian matrix under different ψ.
- 2.
- Identify region deletion rules
Following the extraction of crack features from sea ice images, residual noise persists in the non-crack regions of the image. The presence of such noise compromises the accuracy of sea ice crack extraction. To mitigate the interference of irrelevant noise points on sea ice crack extraction results, the following postprocessing steps are implemented: First, the preprocessed image is represented as a crack skeleton—a structural abstraction that outlines the approximate shape and direction of the cracks. Next, the image is divided into a regular grid. Grids that overlap with the crack skeleton are marked, while grids with no skeleton overlap (i.e., uncovered grids) are discarded. Finally, the retained grids are used to visualize the target crack features, effectively isolating and presenting the cracks to be extracted from the image.
The total number of grid cells influences the count of cells covered by the crack skeleton. It is evident that as the total number of grid cells increases, the number of grid cells not covered by the crack skeleton also increases, resulting in an overall downward trend in the corresponding curve. Following the elimination of these uncovered grid cells, the final processed result is obtained, as presented in Figure 5.

Figure 5.
Mesh skeleton denoising.
- 3.
- Hough transform method
To further quantify the morphological characteristics of the crack after recognition, Hough transform is performed on the binary image. The basic principle is that the geometric principle of Hough transform is based on point-line duality. Using the one-to-one correspondence between the rectangular coordinate system of the image space and the polar coordinate system of the Hough parameter space, the feature points needed in the image space are converted to the parameter space for extraction. The geometric principle is as Figure 6, a sine curve ρ = x0 cosθ + y0 sinθ in the parameter space (θ, ρ) corresponding to a point (x0, y0) in the image space. If multiple points in the image space are collinear, their corresponding sine curves in the parameter space will intersect at a point, and the coordinate of the point is the parameter of the straight line where these points are located. By discretizing the parameter space into an accumulator array, the cells passed by all the edge point mapping curves are counted, and the peak cells correspond to the straight lines in the image [].

Figure 6.
Geometric principle and threshold determination of Hough transform.
To ensure the accuracy of the crack extraction process. It is necessary to select the appropriate threshold coefficient according to the feature extraction of the target image. The interval between the number of retained cracks and the total number of cracks accounted for 0~1 is used as the threshold value range. Figure 6 to determine the threshold tv = 0.33. The optimal crack recognition results were generated by adjusting key parameters (including the spatial scale factor, Hough threshold, and parameter ratio) The final output results are summarized in Figure 7.
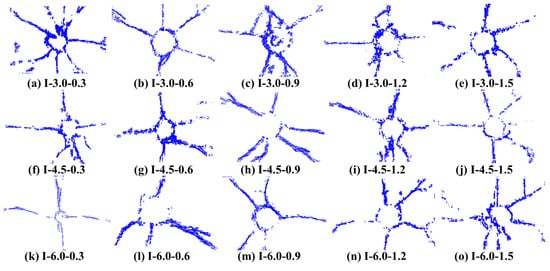
Figure 7.
Results of crack identification in each group.
2.3.2. Numerical Simulation
Due to limitations in measuring experimental data, quantifying damage on a three-dimensional scale using only image processing is challenging [], making it difficult to analyze the damage process and its corresponding time scale. To overcome this, finite element numerical simulation was used to reconstruct the tests. The previously identified crack morphology helped calibrate the material parameters of sea ice for the isotropic elastic damage constitutive model. Based on observed crack propagation behavior, the study investigated the internal crack characteristics of sea ice and its dynamic ductile–brittle transition behavior from the perspective of energy dissipation []. LS-DYNA v2019 was chosen as the analysis platform for the numerical simulation, and given the study’s focus on low-velocity impact problems, the updated Lagrangian formulation was employed [,,,]. This paper constructs the impact process for sea ice with a thickness of 6 cm. Five different impact heights—0.3 m, 0.6 m, 0.9 m, 1.2 m, and 1.5 m—were categorized into groups a, b, c, d, and e, respectively, within the 6 cm thickness sea ice group.
- 1.
- Geometric models and meshes
A geometric model was developed for impact testing, featuring an Impact Hammer (Impactor) and a Sea Ice Specimen. The Impact Hammer is designed as a hollow hemispherical structure with outer and inner diameters of 4.5 cm and 4.2 cm, respectively, and employs a 3 mm mesh size. The Sea Ice Specimen is a cuboid measuring 34 × 21.5 cm with a thickness of 6 cm, using a 2 mm mesh size. Both components are oriented vertically and discretized with Lagrangian solid 8-node hexahedral elements. The boundary conditions include reflective conditions for the lateral surfaces of the sea ice plate, global constraints to maintain the sea ice specimen’s position, and rotational constraints about three axes for the impactor to ensure stability during impact. Model details and mesh dimensions are depicted in Figure 8.

Figure 8.
Establishment of geometric model.
- 2.
- Constitutive parameter calibration
The drop hammer, designed as a rigid body with a mass of 9.5 kg, was calibrated to align with the specified volume. Sea ice, which behaves as a brittle material under dynamic loading, was examined using an isotropic elastic damage constitutive model. As shown in Figure 9. To address numerical challenges in Lagrangian elements, hourglass control was implemented. This control is essential to prevent abnormal deformations and calculation issues. It is advised to maintain the hourglass energy below 10% of the internal energy, and a setting of 6% was applied in this study [].

Figure 9.
Principle of hourglass energy in finite element.
For sea ice, the ls-dyan material library No. 13 *MAT ISOTROPIC ELASTIC FAILURE is adopted as the anisotropic linear elastic model. When the load reaches the failure pressure, the element is deleted, and this is also used to simulate the crack propagation of sea ice [].
Table 3 lists the parameters of sea ice materials. Due to the special strength of sea ice under low-speed impact, the plastic failure strain and failure stress in the table were obtained by trial and error, while the remaining parameters are referred to in reference []. Figure 10 shows the crack propagation under different conditions through comparative test results, image recognition and numerical simulation. The simulated damage cloud map is highly compatible with the crack morphology identified through test image processing, as evidenced by the number of major cracks observed in the ice plate.

Table 3.
Sea ice material parameters.

Figure 10.
Comparison of crack propagation.
- 3.
- Feasibility verification
Fracture toughness is a crucial mechanical property of materials, assessed through the fracture strength factor at the sea ice crack tip. Low-velocity impacts cause a transition in sea ice behavior from toughness to brittleness, limiting plastic deformation capacity. A small plastic zone near the crack tip aligns with linear elastic fracture mechanics (LEFM) []. In LEFM, cracks are considered boundary conditions defined by a stress intensity factor, K. Crack propagation stops when K surpasses the material’s toughness, KIC.
For a falling height of 0.3 m, primarily type I cracks are observed. In this scenario, an impact hammer creates small craters on the ice surface, reducing the problem to a two-dimensional plane. Infinitely fine cracks develop in the infinite domain plate. While stress is absent within the cracks, it is present in other regions. Refer to Figure 11 for the model illustrating this boundary condition.
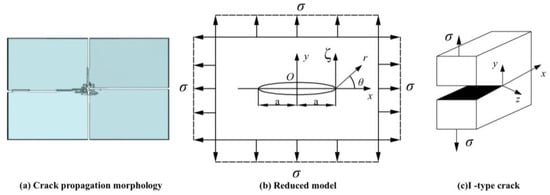
Figure 11.
LEFM diagram.
On the surface of any point into polar coordinates, LEFM has []:
Figure 12 shows the KI time history curve in the X -axis direction of the unit at a = 5 cm on the upper surface of the sea ice plate in the 0.3 m drop height group. It indicates that the sea ice unit near the crack tip reaches the material fracture toughness KIC at 0.5 ms, and continues to expand in the X-axis direction at 0.6 ms. Figure 12 only shows the change in the strength factor at the fixed tip of a crack in one working condition. In order to observe the dynamic propagation behavior of the whole crack, the stress and crack length in the unit propagation direction of the mode I crack under five different initial kinetic energy conditions are selected, and the tip KIC curve of the mode I crack with a length of 2 cm is drawn. As shown in the following figure, it can be seen in Figure 10 that the cracks of this form appear in five working conditions. Taking the initial kinetic energy Ek = 28 J as an example, the X-axis of Figure 13b below is the distance between the crack tip and the sea ice boundary time during the crack propagation process.
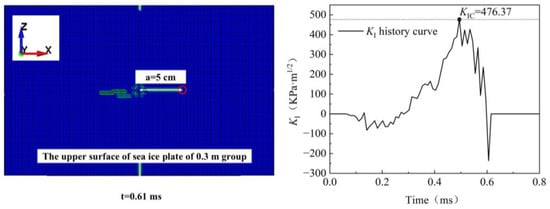
Figure 12.
KI time history curve in x-axis direction.
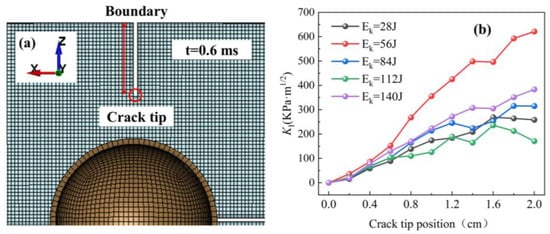
Figure 13.
KIC curves of different initial kinetic energy: (a) Crack propagation at 0.6 ms; (b) The KI of 6 cm sea ice under different impact kinetic energy.
The crack examined extends inward from the sea ice boundary, aligned with the negative z-axis. The average KIC value varies between 140–153 Kpa·m1/2 []. Zhang’s previous research reported KIC values for pure water ice under high strain rate loads ranging from 800–100 Kpa·m1/2, and around 100 Kpa·m1/2 under quasi-static loads []. This study focuses on artificially frozen sea ice, which exhibits lower mechanical strength than pure water ice due to sea salt, which weakens its structure. As a result, the KIC value of sea ice under low-velocity impact loads falls between these values. Notably, data peaks with an initial kinetic energy of 56 J do not exceed the KIC value of pure water ice under high-stress loads.
3. Results
3.1. Effect of Impact on Crack Angle
Statistical results of crack angles in sea ice specimens after impact depict the proportion of sea ice crack angles across different impact velocities. Figure 14 shows the crack Angle distribution diagrams of three ice thicknesses: 3 cm, 4.5 cm, and 6cm. The position of the bar represents the crack Angle, and the length of the bar represents the percentage of cracks at this Angle to all cracks—this avoids ambiguity between “orientation” and the core focus of “crack angles” in the analysis. The distribution of crack angles clearly exhibits central symmetry and relative uniformity: the frequency of each angle is primarily around 5%. For the three thickness groups (3 cm, 4.5 cm, and 6 cm), the peak frequencies are 9.98%, 11.71%, and 12.72%, All peak frequencies correspond to a crack angle of 108°. Notably, the proportion of cracks within the angle ranges of 0–60° and 300–360° is relatively low; specifically, this translates to fewer vertical cracks and a higher number of horizontal cracks. Under dynamic impact loading, the ice crystal structure of the sea ice is fully fractured, and the brittle characteristics of the ice become more prominent—consistent with the observed dominance of brittle crack propagation in the statistical results.

Figure 14.
The statistical results of sea ice crack angles of three thicknesses.
3.2. Effect of Impact on Crack Length
The data results after image processing are processed and statistically estimated by maximum likelihood estimation. The statistical results obtained are shown in the following Figure 15. The three sets of statistical results are subjected to maximum likelihood estimation statistics, and the obtained exponential distribution model is shown as follows. The calculated rate parameters are shown in the following Table 4 [].

Figure 15.
The statistical results of exponential distribution of three kinds of thickness ice plate.

Table 4.
Rate parameter results under different conditions.
15 sets of rate parameters obtained by maximum likelihood estimation under different conditions, with an average value of 0.0311 and 95% confidence intervals of [0.0279, 0.0343]. From the maximum likelihood estimation (MLE) results, the β-values across all test groups range from 0.016 to 0.042, with minimal variations between groups. This indicates that the crack length distribution of sea ice specimens is consistent across different test conditions. Based on the statistical results and the corresponding model formula, crack length probabilities follow a consistent pattern: specifically, a larger β-value corresponds to a higher probability of short cracks and a lower probability of long cracks in the images, and vice versa. As illustrated in Figure 15, the proportion of long cracks in sea ice specimens of 3 cm, 4.5 cm, and 6 cm thicknesses are relatively low—indicating that long cracks are scarce across all specimens, with the majority being short cracks. However, the length proportion of cracks varies across groups under different impact velocities. For specimens with a thickness of 3 cm, the β-values exhibit an overall upward trend with increasing impact velocity. This confirms that for 3 cm thick sea ice, the rate parameter β increases concomitantly with impact velocity, showing a consistent upward tendency. In contrast, for specimens of 4.5 cm and 6 cm thicknesses, the β-values fluctuate as impact velocity increases. These observations demonstrate that both impact velocity and sea ice specimen thickness influence the length proportion of cracks.
3.3. Analysis of Kinetic Energy Dissipation
The following Figure 16a is the energy time history curve with the falling height of 1.5 m as an example. The whole impact process satisfies the law of conservation of energy. The energy input to the ice sheet is the kinetic energy dissipated by the impact hammer. The main paths are the kinetic energy obtained by sea ice and the internal energy of sea ice. A part of the internal energy is stored in the sea ice unit in the form of elastic and plastic strain energy. When it reaches the strain limit of the material, a part of the internal energy is dissipated in the form of fracture energy through the new surface formed by crushing cracks. The energy conservation formula is as follows.
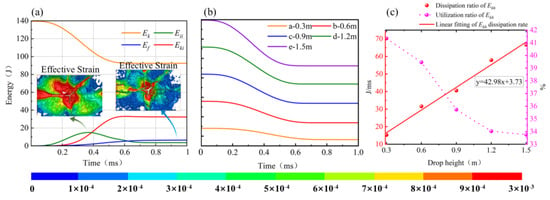
Figure 16.
Kinetic energy dissipation law: (a) Energy trend of impact load; (b) Kinetic energy dissipation at different impact drop heights; (c) Kinetic energy dissipation law of impact hammer.
At 0.4 ms in Figure 16a, the sea ice plate exhibits its highest rates of kinetic energy increase, internal energy, and fracture energy. After the change point, most of the energy stored in the sea ice dissipates as kinetic and fracture energy, consistent with the behavior of brittle materials. In Figure 16b, the kinetic energy dissipation curves for five working conditions are presented. The absence of directional fixed constraints at the base of the sea ice results in the impact hammer ceasing operation when the kinetic energy is fully dissipated, just prior to the fracture of the sea ice. The highlighted area in the figure represents the interval from the moment the impact hammer contacts the sea ice until the ice ultimately fractures. The remaining area corresponds to the kinetic energy wasted by the ice plate following its failure. In the drop hammer impact test, this method is employed to enlarge the circular damage zone at the center of the ice plate that is in direct contact with the impact hammer. It is evident that as the initial kinetic energy increases—indicating a higher load strain rate—the amount of kinetic energy dissipated also increases. Figure 16c illustrates the linear relationship between the kinetic energy dissipation rate and the kinetic energy utilization rate. It is evident that as the drop height of the impact hammer increases, the kinetic energy dissipation rate generally rises in a linear manner. The linear equation derived from the data fitting is y = 42.98x + 3.73. Both the duration of kinetic energy action and the amount of kinetic energy dissipation are contingent upon the initial velocity of the impact hammer. Specifically, a higher initial impact velocity results in greater kinetic energy dissipation and an extended duration of energy dissipation. Notably, despite the increase in the kinetic energy dissipation rate with higher initial kinetic energy, the utilization rate exhibits a downward trend. This suggests that an increase in impact kinetic energy does not enhance its effective utilization rate. It demonstrates that during the impact loading process, the sea ice in the 1.5 m group exhibits more brittle material characteristics, whereas the 0.3 m group tends to display more ductile material characteristics.
3.4. Propagation Law of Crack
The dissipated fracture energy is used to quantify the damage degree of sea ice, and the kinetic energy conversion rate is expressed by the ratio of the fracture energy dissipated by the unit failure to the kinetic energy dissipation of the impact hammer for a period of time. In order to quantify the crack propagation law, it is necessary to calculate the fracture energy of the ice plate material for crack propagation. In the fracture mechanics theory of brittle materials, the fracture energy is defined as follows:
The definition of kinetic energy conversion rate is as follows:
The event of the model and the time of the event are recorded in the solution result file messag. The number of unit failures is counted and the following (Figure 17a–e) 5 diagrams are drawn. The histogram represents the distribution of the number of new failed units in time, and the curve represents the cumulative crack volume. The kinetic energy conversion rate η under various working conditions is calculated, and a 3D waterfall diagram is drawn to observe the law of η more intuitively.
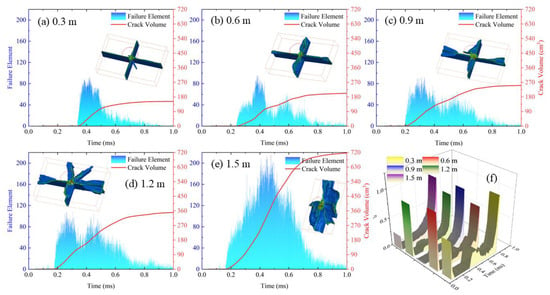
Figure 17.
Sea ice crack evolution and time distribution and η at different impact heights: (a–e) Number of failed sea ice units and changes in crack volume at different falling heights. (f) The evolution law of sea ice η at different impact heights.
Figure 17a–e illustrate the distribution of crack volume over time. Take Figure 16a as an example, The kinetic energy imparted to sea ice 0.4 ms ago is converted into plastic and elastic strain energy stored within the ice. During this interval, crack formation and energy dissipation occur as fracture energy. As impact velocity increases, the rate of kinetic energy dissipation rises linearly. The number of instantaneous failures per unit fluctuates around 100 for drop heights ranging from 0.3 m to 1.2 m; however, at a height of 1.5 m, failures peak at 220. Sea ice exhibits a stable response within a specific range of impact velocities; beyond this range, crack propagation accelerates, and the growth of cumulative crack volume deviates from linearity as kinetic energy dissipates.
η represents the degree of energy conversion of sea ice plates over time. The graph indicates that the overall trend of η is consistent and shows no correlation with the initial impact kinetic energy. Three distinct peaks are observed within the 0–1 ms range, located at the front, middle, and back positions of the curve. The first peak arises from the compression of the ice body when the impact hammer initially contacts the ice plate, resulting in the formation of a pit. During this phase, no significant tensile cracks develop in the sea ice. The second peak marks a transition point where the ice plate shifts from ductile to brittle behavior. Beyond this point, numerous tensile cracks begin to propagate in a specific direction on the ice plate, consistent with the characteristics of brittle failure. The third peak results from crack propagation predominantly driven by tensile failure, with minimal reliance on the dissipation of kinetic energy from the impact hammer.
To investigate the crack propagation rate law of sea ice subjected to low-speed impact loads, Figure 18 illustrates the crack propagation rate across five distinct impact velocities. In Figure 18a, the X-axis represents kinetic energy dissipation, while the Y-axis indicates crack propagation velocity, measured in cm3/μs. Each point on the curve reflects the spatial relationship between kinetic energy and crack propagation velocity at specific moments within the 1 ms range in a two-dimensional rectangular coordinate system, with each peak corresponding to the crack propagation velocity at a given time node. In Figure 18b, the X-axis denotes time, expressed in micro-seconds (μs).

Figure 18.
Sea ice crack propagation velocity of kinetic energy dissipation process: (a) Sea ice crack propagation velocity at different impact heights (under kinetic energy evolution); (b) Sea ice crack propagation velocity at different impact heights (under time evolution).
As illustrated in Figure 18, the peaks occur at the midpoint as kinetic energy dissipates, and the overall crack growth rate stabilizes when the drop height is less than 1.2 m. The crack growth rate exhibits three distinct stages during the dissipation of kinetic energy. Taking the working conditions of Group b as an example, the first stage is characterized by a steady fluctuation of the expansion speed within a specific range, indicating relatively stable expansion rates. Following the peak, the second stage commences, during which the expansion rate fluctuates between 0.27 and 0.77 cm3/μs. Stage Three: During this stage, the crack propagation rate exhibits a downward trend. Generally, the crack propagation rate reflects the damage mode of sea ice subjected to impact loading. Analysis of the b, c, and d groups reveals that the propagation rate curves each display two peaks. These peaks arise from two distinct failure modes induced by compression and tensile waves: the circular pit opening resulting from compression failure and the radial and circumferential cracks generated by tensile failure. The two peaks observed in Group e are nearly identical, resulting from the proximity of the compression wave and the stretching wave in the time domain. In contrast, Group a displays only a single peak due to the low peak value of the stretching wave, which renders it less discernible in the graph. Notably, the peak crack growth rates for all groups, with the exception of e group, fluctuated between 0.75 and 1 cm3/μs. In comparison, the peak crack growth rate for Group e was nearly double that of the other groups. This exceptionally high crack growth rate is indicative of brittle fracture. These findings further substantiate the notion that sea ice materials undergo ductile–brittle transformation when subjected to loading at varying strain rates during low-speed impacts.
4. Discussion
The dynamic behavior of sea ice is elucidated by the stress wave action law, which illustrates the mechanism of crack initiation. Upon impact by a drop hammer, a strong stress wave is generated, leading to the formation of a crushing cone beneath the impact site. Near the free boundary, the reflected tensile wave readily initiates radial cracks.
Figure 19 is the pressure cloud map of the ice plate with a thickness of 6 cm. Taking group a as an example, 0.2 ms shows that with the application of impact load, the crushing cone begins to appear in the center of the ice plate, and the surrounding ice body begins to be compressed. The compression wave propagates to the free surface, and the compression wave reaches the free surface at about 0.6 ms. The tensile wave is reflected by the free surface to form a pressure extension zone, and the 0.8 ms crack is basically formed. It can be observed from Figure 19 that the unit around the crack propagation front is accompanied by a blue tensile stress field, and the crack propagation direction is from the crack tip to the free surface. There is a funnel-shaped red pressure extension zone.

Figure 19.
Pressure nephogram.
Figure 20 presents stress–time history curves for elements along the x and y axes, using the e group as an example, with observation points spaced 1.5 cm apart. In the y-axis direction, where compression directly impacts, the stress curve resembles that of uniaxial compression, featuring elastic, compaction, and failure phases. This indicates energy storage and material toughness, consistent with the rising section in Figure 17e. The material stores energy and fails under compression when subjected to a low-speed impact load. Stress along the x-axis is perpendicular to the impact. A stress–time curve reveals that crack expansion begins at 0.4 ms, peaking between 0.35 and 0.55 ms, indicating the most severe damage to the ice plate. Compression and reflected tensile waves produce mixed-mode cracks (types I, II, and III), evident as double peaks during the stress wave stages. Further damage occurs in the front and back segments over 0.6 ms due to the influence of vibration waves. Combined with the above phenomena, stress wave action, crack propagation law, kinetic energy dissipation and other results, it is considered that the sea ice material has a ductile–brittle transition phenomenon under the conditions of strain rate and stress wave action stage. When the strain rate is constant, taking the e group as an example, at the time scale, the ice plate is in the energy storage stage until 0.33 ms after the impact. The material belongs to the ductile feature, 0.33~0.55 ms basically completes the transition from toughness to brittleness, and the post-peak sea ice plate is almost brittle; under the condition of strain rate, especially when the initial kinetic energy reaches 140 J, the peak value of crack velocity of sea ice plate is twice that of other groups, and the crack volume also increases from 360 cm3 to 720 cm3, which is also the behavior of ductile–brittle transition of materials.
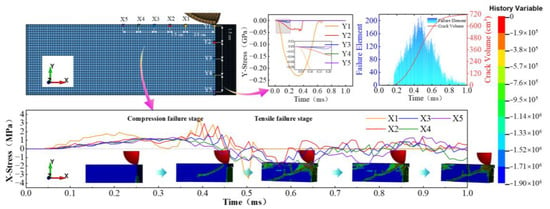
Figure 20.
Stress wave action and free surface strain cloud diagram.
Sea ice material undergoes a ductile-to-brittle transition influenced by different strain rates and stress wave actions. For example, in the e group, the ice plate transitions from ductile to brittle behavior between 0.33 ms and 0.55 ms after impact. At a constant strain rate, when the initial kinetic energy is 140 J, both the crack velocity and the volume of the sea ice plate reach their maximum, signifying the shift from ductile to brittle characteristics.
5. Conclusions
Cracks in sea ice plates of varying thicknesses were quantified using image processing techniques following low-velocity impacts. The analysis encompassed crack length, angular distribution, and statistical modeling. A finite element numerical simulation was employed to reconstruct the impact process on a 6 cm thick sea ice plate, which was validated by the fracture strength factor. This study elucidated the ductile–brittle transition mechanism in sea ice through an examination of kinetic energy dissipation and crack propagation. Key conclusions:
(1) A combined approach utilizing Hessian matrix filtering and the Hough transform effectively identifies and quantifies sea ice cracks. The morphology of these cracks exhibits central symmetry, with the majority oriented horizontally. Thinner sea ice plates, measuring 3 cm in thickness, develop a greater number of cracks, including microcracks, following impact.
(2) Higher initial kinetic energy results in greater kinetic energy dissipation and an extended duration of dissipation during low-velocity impacts. However, the effective utilization rate of kinetic energy diminishes as impact kinetic energy increases. The kinetic energy conversion rate (η) is linked to the mode of crack formation rather than the initial kinetic energy.
(3) At an initial kinetic energy of 140 J, the peak crack velocity of the sea ice plate is twice that observed in the other test groups. This finding suggests that sea ice demonstrates ductile–brittle transition behavior under the strain rate conditions associated with low-velocity impact.
(4) In the context of a constant strain rate, the ice plate, with a focus on a 1.5 m group, demonstrates ductile characteristics during the energy storage phase until 0.33 ms post-impact. The transition from ductility to brittleness occurs between 0.33 and 0.55 ms, resulting in the post-peak sea ice sheet being predominantly brittle.
Author Contributions
Z.X.: Supervision, Funding acquisition, Conceptualization. H.C.: Writing—original draft, Methodology, Investigation. F.R.: Writing—review and editing, Formal analysis. J.Z. (Jiuyang Zhang): Investigation, Formal analysis. X.W.: Conceptualization, Investigation. W.L.: Investigation, Supervision, Methodology. J.Z. (Jianyu Zhao): Methodology. All authors have read and agreed to the published version of the manuscript.
Funding
This work was supported by the National Natural Science Foundation of China [grant number 52574150]; The Liaoning Revitalization Talents Program [grant number XLYC2203173].
Data Availability Statement
Data will be made available on request.
Conflicts of Interest
The authors declare no conflicts of interest.
Nomenclature
| Nomenclature | Ef | The fracture energy (J) | |
| Ixy | derivative of scale space | gf | Fracture energy of unit volume crack (J) |
| G | Gaussian function | Veff | Effective damage volume (m3) |
| KI | The strength factor of mode I crack | a | Crack length (cm) |
| ρ0 | Material density (kg/m3) | Δt | Time |
| G | Elastic modulus (GPa) | tv | Hough threshold |
| Y | Yield stress (MPa) | Greek symbols | |
| P | Plastic hardening modulus (GPa) | ψ | Space scale factor |
| B | Buik modulus (GPa) | ꞵ | The rate parameter |
| Ekh | The kinetic energy dissipated of impact hammer (J) | η | Kinetic energy conversion rate |
| Eki | The kinetic energy obtained of ice plate (J) | σ | Stress |
| Eii | The internal energy of the ice plate (J) | ε | Strain |
References
- Zhang, X.L.; Zhang, Z.H.; Xu, Z.J.; Li, G.; Sun, Q.; Hou, X.J. Sea ice disasters and their impacts since 2000 in Laizhou Bay of Bohai Sea. China Nat. Hazards 2013, 65, 27–40. [Google Scholar] [CrossRef]
- Schulson, E.M.; Nickolayev, O.Y. Failure of columnar saline ice under biaxial compression: Failure envelopes and the brittle-to-ductile transition. J. Geophys. Res. Atmos. 1995, 1002, 22383–22400. [Google Scholar] [CrossRef]
- Jang, H.-S.; Hwang, S.; Yoon, J.; Lee, J.H. Numerical Analysis of Ice–Structure Impact: Validating Material Models and Yield Criteria for Prediction of Impact Pressure. J. Mar. Sci. Eng. 2024, 12, 229. [Google Scholar] [CrossRef]
- Dong, G.; Lai, R.; Dai, Y.; Guo, Z.; Wu, M. Experimental Study of the Mechanical Properties of River Ice in the Harbin Section of the Songhua River. J. Cold Reg. Eng. 2025, 39, 2. [Google Scholar] [CrossRef]
- Chen, X.; Ji, S.; Wang, A. Comparative study of the brittle-ductile transition between level ice and rafted ice based on uniaxial compression experiments. Int. J. Mater. Struct. Integr. 2021, 14, 255. [Google Scholar] [CrossRef]
- Epifanov, V.P. Rupture and dynamic hardness of ice. Dokl. Physics. 2004, 49, 86–89. [Google Scholar] [CrossRef]
- Banik, A.; Zhang, C.; Khan, M.H.; Wilson, M.; Tan, K.T. Low-velocity ice impact response and damage phenomena on steel and CFRP sandwich composite. Int. J. Impact Eng. 2022, 162, 104134. [Google Scholar] [CrossRef]
- Combescure, A.; Chuzel-Marmot, Y.; Fabis, J. Experimental study of high-velocity impact and fracture of ice. Int. J. Solids Struct. 2011, 48, 2779–2790. [Google Scholar] [CrossRef]
- Dong, J.; Li, Z.; Lu, P.; Jia, Q.; Wang, G.; Li, G. Design ice load for piles subjected to ice impact. Cold Reg. Sci. Technol. 2012, 71, 34–43. [Google Scholar] [CrossRef]
- Matskevitch, D.G. Eccentric impact of an ice feature: Linearized model. Cold Reg. Sci. Technol. 1997, 25, 159–171. [Google Scholar] [CrossRef]
- Kennedy, J.B.; Iyengar, K.J. Rigid-plastic analysis of floating ice sheets under impact loads. Can. J. Civ. Eng. 2011, 8, 409–415. [Google Scholar] [CrossRef]
- Müller, F.; Böhm, A.; Herrnring, H.; von Bock und Polach, R.; Ehlers, S. Influence of the ice shape on ice-structure impact loads. Cold Reg. Sci. Technol. 2024, 221, 104175. [Google Scholar] [CrossRef]
- Zhang, Y.; Liu, R.; Yuan, L.; Li, J.; Jing, C.; Han, D. Ice breaking by low-velocity impact with a rigid sphere. Int. J. Impact Eng. 2023, 182, 104786. [Google Scholar] [CrossRef]
- Yue, J.; Huang, C.; Wu, X. Low-velocity penetration behavior of ice by slender steel projectiles with different noses. Int. J. Impact Eng. 2025, 206, 105438. [Google Scholar] [CrossRef]
- Batto, R.A.; Schulson, E.M. On the ductile-to-brittle transition in ice under compression. Acta Met. Mater. 1993, 41, 2219–2225. [Google Scholar] [CrossRef]
- Wang, C.; Han, D.; Wang, Q.; Wang, Y.; Zhang, Y.; Jing, C. Study of elastoplastic deformation and crack evolution mechanism of single-crystal ice during uniaxial compression using 3D digital image correlation. Eng. Fract. Mech. 2023, 293, 109712. [Google Scholar] [CrossRef]
- Li, Z.J.; Zhang, L.M.; Lu, P.; Leppäranta, M.; Li, G.W. Experimental study on the effect of porosity on the uniaxial compressive strength of sea ice in Bohai Sea. Sci. China Technol. Sci. 2011, 54, 2429–2436. [Google Scholar] [CrossRef]
- Yang, D.; Gao, S.; Feng, W.; Ding, S.; Li, J.; Jiao, H. Effect of prefabricated fractured rock dip angles on mechanical properties and failure modes under dynamic and static loads. Green Smart Min. Eng. 2025, 2, 184–195. [Google Scholar] [CrossRef]
- Rizzo, R.E.; Healy, D.; De Siena, L. Benefits of maximum likelihood estimators for fracture attribute analysis: Implications for permeability and up-scaling. J. Struct. Geol. 2017, 95, 17–31. [Google Scholar] [CrossRef]
- Lu, W.; Løset, S.; Shestov, A.; Lubbad, R. Design of a field test for measuring the fracture toughness of sea ice. In Proceedings of the 23rd International Conference on Port and Ocean Engineering Under Arctic Conditions (POAC ‘15), Trondheim, Norway, 14–18 June 2015. [Google Scholar]
- Yichi, Z.; Lv, W.; Xuedong, L. Defects Detection of Cold-roll Steel Surface Based on MATLAB. In Proceedings of the 2011 International Conference on Measuring Technology and Mechatronics Automation (ICMTMA), Shanghai, China, 6–7 January 2011; IEEE: New York, NY, USA, 2011. [Google Scholar] [CrossRef]
- Shaukat, F.; Raja, G.; Gooya, A.; Frangi, A.F. Fully automatic and accurate detection of lung nodules in CT images using a hybrid feature set. Med. Phys. 2017, 44, 3615–3629. [Google Scholar] [CrossRef]
- Kollem, S.; Reddy, K.R.; Rao, D.S. A novel diffusivity function-based image denoising for MRI medical images. Multimed. Tools Appl. 2023, 82, 32057–32089. [Google Scholar] [CrossRef]
- Tang, S.; Liu, J. Denoising Method for Microscopic Image of Caenorhabditis Elegans Based on Skeleton-pruning. In Proceedings of the 3rd International Conference on Computer Science and Application Engineering, Sanya, China, 22–24 October 2019. [Google Scholar] [CrossRef]
- Talab, A.M.A.; Huang, Z.; Xi, F.; HaiMing, L. Detection crack in image using Otsu method and multiple filtering in image processing techniques. Optik 2016, 127, 1030–1033. [Google Scholar] [CrossRef]
- Xie, D.H.; Lu, M.; Xie, Y.F.; Li, X. A fast threshold segmentation method for froth image base on the pixel distribution characteristic. PLoS ONE 2019, 14, e0210411. [Google Scholar] [CrossRef] [PubMed]
- Lin, Z.; Yu, H. The Pupil Location Based on the OTSU Method and Hough Transform. Procedia Environ. Sci. 2011, 8, 352–356. [Google Scholar] [CrossRef]
- Hamad, S.I. Comparative between the binary thresholding technique and the Otsu method for the people detection. Int. J. Comput. Technol. Sci. 2025, 2, 98–111. [Google Scholar] [CrossRef]
- Mathavan, S.; Vaheesan, K.; Kumar, A.; Chandrakumar, C.; Kamal, K.; Rahman, M.; Stonecliffe-Jones, M.; Kumar, A. Detection of pavement cracks using tiled fuzzy Hough transform. J. Electron. Imaging 2017, 26, 053008. [Google Scholar] [CrossRef]
- Reddy, P.V.G.D.P. Blood vessel extraction in fundus images using hessian eigenvalues and adaptive thresholding. Evol. Intell. 2020, 14, 577–582. [Google Scholar] [CrossRef]
- Cheng, Y.Y.; Liu, L.; Fu, X.M. Eigenvalue Blending for Projected Newton. Comput. Graph. Forum 2025, 44, e70027. [Google Scholar] [CrossRef]
- Yang, S.F.; Cheng, C.H. Fast computation of Hessian-based enhancement filters for medical images. Comput. Methods Programs Biomed. 2014, 116, 215–225. [Google Scholar] [CrossRef]
- Mukhopadhyay, P.; Chaudhuri, B.B. A survey of Hough Transform. Pattern Recognit. 2015, 48, 993–1010. [Google Scholar] [CrossRef]
- Cai, W.; Zhu, L.; Yu, T.X.; Li, Y. Numerical simulations for plate under ice impact based on a concrete constitutive ice model. Int. J. Impact Eng. 2020, 143, 103594. [Google Scholar] [CrossRef]
- Shi, C.; Hu, Z.; Ringsberg, J.; Luo, Y. Validation of a temperature-gradient-dependent elastic-plastic material model of ice with finite element simulations. Cold Reg. Sci. Technol. 2017, 133, 15–25. [Google Scholar] [CrossRef]
- Gogoladze, D.Z.; Bekker, A.T. Numerical Modeling of the Ice-Conical Structure Interaction Process Using Element Erosion Technique. IOP Conf. Ser. Earth Environ. Sci. 2022, 988, 052056. [Google Scholar] [CrossRef]
- Balandin, V.V. Numerical modeling of shock interaction of elastic cylinder with ice. Probl. Strength. Plast. 2017, 79, 93–103. [Google Scholar]
- Carney, K.S.; Benson, D.J.; Dubois, P.; Lee, L. A phenomenological high strain rate model with failure for ice. Int. J. Solids Struct. 2006, 43, 7820–7839. [Google Scholar] [CrossRef]
- Orlov, M.Y.; Orlova, Y.N. Deep penetration of low velocity metal penetrators into ice: Proceedings of the Institution of Mechanical Engineers, Part C. J. Mech. Eng. Sci. 2022, 236, 2949–2956. [Google Scholar] [CrossRef]
- Cangiani, A.; Manzini, G.; Russo, A.; Sukumar, N. Hourglass stabilization and the virtual element method. Int. J. Numer. Methods Eng. 2015, 102, 404–436. [Google Scholar] [CrossRef]
- LSTC. LS-DYNA User’s Manual, version 971 R5; Livermore Soft Technology Corp.: Livermore, CA, USA, 2011. [Google Scholar]
- Grinevich, D.V.; Buznik, V.M.; Nyzhnyi, G.A. Numerical simulation of ice fracture by compression using of the discrete element method. Mater. Phys. Mech. 2023, 51, 75–87. [Google Scholar] [CrossRef]
- Pook, L.P. Linear Elastic Fracture Mechanics for Engineers: Theory and Applications; WIT Press: Southampton, UK, 2000. [Google Scholar]
- Soderholm, K.J. Review of the fracture toughness approach. Dent. Mater. 2010, 26, e63–e77. [Google Scholar] [CrossRef]
- Zhang, Y.; Li, X.; Chen, W.; Wang, Q.; Han, D.; Hu, Y. Dynamic mixed mode I/II fracture toughness and failure behaviour of freshwater ice under impact loading. Theor. Appl. Fract. Mech. 2025, 135, 104769. [Google Scholar] [CrossRef]
- Zhang, Y.H.; Wang, Q.; Han, D.F.; Li, J.B.; Wang, C.Y. Investigation on the mixed mode fracture toughness of freshwater ice using the semi-circular bend method. Cold Reg. Sci. Technol. 2023, 205, 103718. [Google Scholar] [CrossRef]
- Myung, I.J. Tutorial on maximum likelihood estimation. J. Math. Psychol. 2003, 47, 90–100. [Google Scholar] [CrossRef]
Disclaimer/Publisher’s Note: The statements, opinions and data contained in all publications are solely those of the individual author(s) and contributor(s) and not of MDPI and/or the editor(s). MDPI and/or the editor(s) disclaim responsibility for any injury to people or property resulting from any ideas, methods, instructions or products referred to in the content. |
© 2025 by the authors. Licensee MDPI, Basel, Switzerland. This article is an open access article distributed under the terms and conditions of the Creative Commons Attribution (CC BY) license (https://creativecommons.org/licenses/by/4.0/).