Abstract
Suction embedded plate anchors (SEPLAs) are widely used in offshore engineering, but their keying process is often accompanied by embedment loss, which reduces the holding capacity. To minimize embedment loss, inwardly rotating keying flaps have been introduced, though their kinematics and effects on embedment loss remain insufficiently understood. In this study, transparent soil model tests, combined with particle image velocimetry (PIV), were conducted to directly visualize the keying behavior of SEPLAs with inwardly rotating keying flaps. Five anchor configurations were tested, including a reference model without flaps and four models with flap lengths ranging from 0.2 to 0.5 times the anchor breadth. The results show that inwardly rotating keying flaps significantly reduce embedment loss, with the configuration featuring a flap length of 0.4 times the anchor breadth exhibiting the optimal performance. The findings provide valuable insight into the influence of flap length on SEPLA keying behavior and embedment loss, offering practical guidance for optimizing flap design.
1. Introduction
The suction embedded plate anchor (SEPLA) is a promising foundation solution widely adopted in deepwater applications, including floating production systems (FPSs) and floating offshore wind turbines (FOWTs), owing to its precise positioning capability, cost-effectiveness, and high holding capacity [,,,,]. A typical SEPLA consists of two primary components: a plate anchor, which mobilizes bearing capacity to resist external loads, and a suction caisson, which facilitates installation, as shown in Figure 1a. During installation, the plate anchor is positioned vertically at the base of the suction caisson and driven to the target depth by generating negative pressure within the caisson through water extraction. Once the target depth is reached, water is reintroduced into the caisson, allowing the plate anchor to detach from the suction caisson. The mooring chain attached to the plate anchor is then tensioned, causing the plate to rotate to an orientation nearly perpendicular to the loading direction and mobilize its full bearing capacity. This post-installation process, known as keying, induces upward movement of the anchor and a corresponding loss of embedment, typically ranging from 0.5 to 1.7 times the anchor breadth [,]. In offshore sediments, the undrained shear strength generally increases linearly with depth, therefore, increased embedment loss may reduce the holding capacity of the plate anchor by up to 20% []. Therefore, a comprehensive understanding of keying kinematics and strategies to reduce embedment loss is essential for optimal SEPLA design.
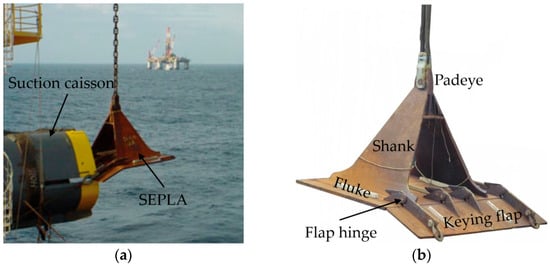
Figure 1.
SEPLA assembly and components: (a) SEPLA and suction caisson assembly; (b) SEPLA and key components.
The keying process of SEPLAs has been extensively investigated. Gaudin et al. [,] and O’Loughlin et al. [] conducted centrifuge tests to examine the effects of suction caisson installation, loading inclination, and padeye eccentricity on the SEPLA keying process. Cassidy et al. [], Tian et al. [], and Peng et al. [] developed plasticity and elastoplastic models to predict the keying trajectory and the ultimate embedment depth of SEPLAs. Wang et al. [] performed large-deformation finite element (LDFE) analyses to examine the influence of anchor geometry, soil properties, and loading eccentricity and inclination on embedment loss during keying. Tian et al. [] and Cheng et al. [] conducted LDFE analyses to investigate the effects of padeye offset on the behavior of SEPLAs. However, in most of these studies, the plate anchor was simplified as a flat plate, and the influence of keying flaps was not considered.
To reduce embedment loss, current industry practice commonly incorporates a keying flap on the fluke, as shown in Figure 1b. The keying flap is typically designed to rotate outward by up to 20° relative to the shank, while inward rotation is mechanically constrained. The primary aim of the flap is to increase the vertical bearing area upon activation (i.e., the relative rotation between the flap and the fluke), thereby reducing the upward displacement of the anchor. However, centrifuge tests [] demonstrated that outwardly rotating flaps were not activated during keying and thus did not reduce embedment loss. Consistent with these observations, LDFE analyses also indicated that, because the outwardly rotating flaps were not activated during keying, they contributed little to the reduction in embedment loss. Moreover, when the flaps eventually activated after keying, their outward rotation reduced the effective bearing area of the anchor, decreasing its holding capacity [,,]. These findings consistently demonstrate that outwardly rotating flaps provide limited benefit in improving anchor performance.
To address this limitation, Tian et al. [] introduced an inwardly rotating keying flap designed to rotate up to 20° toward the shank, while outward rotation was mechanically constrained. LDFE analyses conducted by Tian et al. [] demonstrated that the inward configuration effectively reduced embedment loss compared with conventional outward flap designs, and further parametric studies examined the influence of flap length during keying. However, experimental investigations of inwardly rotating keying flaps remain limited, as the opacity of natural soils prevents direct observation of flap behavior during keying. This highlights a clear gap in experimental research, particularly the lack of direct visualization of flap kinematics and their influence on embedment loss.
This study presents a series of transparent soil model tests to observe the keying process of SEPLAs equipped with inwardly rotating keying flaps and to investigate the influence of flap length on embedment loss. To achieve these objectives, five SEPLA models were fabricated: one without keying flaps and four with inwardly rotating keying flaps of varying lengths, ranging from 0.2 to 0.5 times the anchor breadth. Transparent soil with properties similar to those of soft marine clay was used to facilitate direct observation of anchor keying, with particular emphasis on the kinematics of the inwardly rotating keying flaps. Particle image velocimetry (PIV) was employed to analyze anchor–soil interaction and characterize failure mechanisms during keying. The experimental results provide valuable insights into the behavior of inwardly rotating keying flaps and offer practical guidance for optimizing SEPLA flap design.
2. Materials and Methods
2.1. Transparent Soil Material and Properties
The transparent soil used in this study consisted of Laponite RD, sodium pyrophosphate (SPP), and deionized water. Laponite RD is a synthetic layered silicate with structural characteristics similar to those of the natural clay mineral hectorite []. SPP was incorporated as a rheological modifier to reduce the viscosity of the suspension, thereby enabling the preparation of Laponite mixtures at higher concentrations. This transparent soil exhibits geotechnical properties comparable to those of soft cohesive soils, particularly in terms of undrained shear strength, consolidation behavior, and permeability [,]. Its effectiveness has also been validated through torpedo anchor model tests [,] and drag anchor model tests []. The mixing process began with the dissolution of 0.52 wt% SPP in deionized water, followed by the gradual addition of 10 wt% Laponite RD under continuous stirring at 600 rpm to ensure homogeneous dispersion. Subsequently, 0.05 wt% polyamide resin particles (PSP) were incorporated as tracer particles for PIV analysis. The prepared transparent soil mixture was then allowed to consolidate under self-weight for four weeks prior to testing. A total of five samples were prepared following the same procedure. The basic physical and mechanical properties of the transparent soil used in this study, determined through geotechnical laboratory testing, are summarized in Table 1.

Table 1.
Transparent Soil Properties.
T-bar tests were conducted to determine the undrained shear strength of the prepared samples and to assess the uniformity among the five samples. The undrained shear strength (su) of the transparent soil was measured using a miniature T-bar penetrometer (length Lt = 65 mm; diameter D = 13 mm). All T-bar tests were conducted to a penetration depth of 200 mm at a constant rate (vₜ = 0.3 mm/s), corresponding to a dimensionless velocity V = vₜ D/cᵥ ≈ 1617, which exceeds 30 and thus satisfies the criterion for undrained conditions []. The coefficient of consolidation (cv) of the transparent soil was 0.076 m2/yr, as determined from one-dimensional consolidation tests conducted in accordance with ASTM D2435/D2435M-11 (2020) []. The undrained shear strength (su), calculated using a T-bar factor (Nt-bar) of 10.5 [], is plotted against depth (z) in Figure 2a, based on the results of five replicate tests. The average undrained shear strength and the corresponding standard deviation at each depth are presented in Figure 2b. The standard deviation ranged from 0.84% to 2.41%, with an overall mean of approximately 1.38%, confirming the excellent repeatability of the prepared samples.
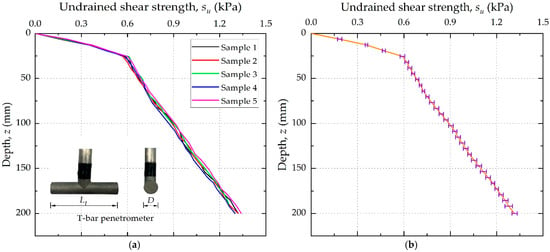
Figure 2.
Undrained shear strength profiles: (a) results from five replicate samples; (b) average undrained shear strength with standard deviation.
2.2. SEPLA Model Anchors
Figure 3 shows the SEPLA model anchors used in the transparent soil tests. Each model anchor was fabricated at a 1:100 geometric scale, with a total breadth (B, including the fluke and flaps) and length (L) of 40 mm, and thickness (t) of 2 mm. The padeye was designed with a diameter of 2 mm and positioned at a normal distance en = 25 mm and a tangential distance ep = 7.5 mm from the centroid of the plate, representing the padeye eccentricity and offset, respectively. Four anchors were equipped with keying flaps capable of rotating inward by up to 20° toward the shank, while outward rotation was mechanically constrained. The flap lengths (hp) were set to 0.2B (8 mm), 0.3B (12 mm), 0.4B (16 mm), and 0.5B (20 mm). A plate anchor without keying flaps (hp/B = 0) was used as a reference. All anchors were designed with the same total projected area, ensuring that the differences in performance resulted solely from flap geometry rather than plate size. Each model was 3D-printed using an aluminum alloy with a density of 2700 kg/m3. The anchor cable was made of 1.5-mm-diameter stainless steel wire with a length of 400 mm.

Figure 3.
SEPLA model anchors.
2.3. Experimental Setup
The experimental setup for SEPLA keying tests in transparent soil consisted of a model box, an actuator, a load cell, a camera, and two linear lasers, as illustrated in Figure 4. The model box was constructed from 8 mm-thick transparent plexiglass panels, allowing clear observation of anchor kinematics and the associated failure mechanisms, with internal dimensions of 280 mm × 200 mm × 350 mm (length × width × height). The actuator (DLP65E, Suzhou Dolepu Automation Equipment Co., Ltd., Kunshan, China), used to pull the anchors, was capable of operating at velocities ranging from 0.01 mm/s to 5 mm/s and applying a maximum load of 5 kN. A load cell (DYLY-109, Bengbu Dayang Sensing System Engineering Co., Ltd., Bengbu, China) with a capacity of 50 N and an accuracy of 0.01 N was used to measure the tensile load during keying. A CCD camera (Manta G-505B, Allied Vision Technologies GmbH, Stadtroda, Germany) with a resolution of 2452 × 2056 pixels and a maximum frame rate of 15 fps was used to capture image sequences during testing. Two linear lasers (GL-N-532, Changchun New Industries Optoelectronics Technology Co., Ltd., Changchun, China) with a beam thickness of 1 mm and a wavelength of 532 nm were used to illuminate the tracer particles, producing a distinct speckle pattern in the transparent soil for PIV analysis.
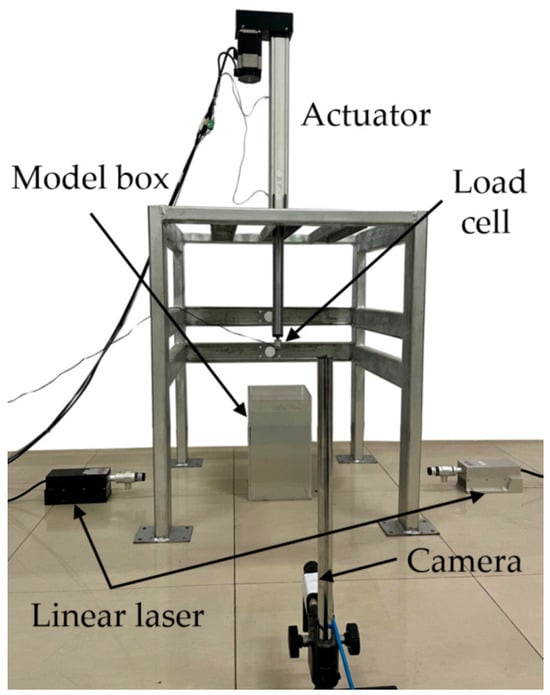
Figure 4.
Experimental setup for SEPLA keying tests in transparent soil.
2.4. Experimental Procedure
To reduce disturbance to the surrounding soil, the SEPLA model was vertically embedded in the transparent soil prior to consolidation. The embedment depth (H), measured from the mudline to the anchor centroid, was 200 mm, corresponding to a normalized embedment ratio (H/B) of 5, which ensured deep anchor behavior []. To reduce boundary effects, the distance between the anchor and the inner surfaces of the model box was maintained at not less than twice the anchor breadth [].
All tests were conducted in a darkroom to obtain a clear speckle field. As shown in Figure 5, two linear lasers were positioned 800 mm from the side of the model box and aligned horizontally to generate a 1 mm-thick laser sheet illuminating a vertical plane within the transparent soil. A CCD camera was placed 1000 mm in front of the model box, with its optical axis perpendicular to the laser-illuminated plane. Focus and exposure settings were adjusted prior to testing to ensure image clarity. The CCD camera captured image sequences at an average frame rate of 5 fps. The tensile load data were recorded at a sampling frequency of 5 Hz, synchronized with the image acquisition. The anchor pullout angle (θₐ) was set to 90°, and the pulling velocity (v) was maintained at 0.3 mm/s. This corresponded to a dimensionless velocity V = vB/cv ≈ 4979, ensuring undrained conditions during testing [].

Figure 5.
Schematic of the test layout for SEPLA keying in transparent soil: (a) front view; (b) top view.
2.5. PIV Analysis
Particle image velocimetry (PIV) was employed to analyze the evolution of soil displacement during the SEPLA keying process. The analysis covered the entire region along the anchor trajectory to capture soil deformation around the fluke and keying flap. Image sequences recorded by the CCD camera were processed using GeoPIV-RG [], a MATLAB-based image analysis module.
The subset size and overlap ratio were optimized through preliminary trials to achieve a balance between spatial resolution and correlation stability. An interrogation window size of 60 × 60 pixels and an overlap of 30 pixels were adopted for all image analyses. Image calibration was conducted by placing a ruler with known graduations inside the transparent soil chamber. The pixel count corresponding to a known physical length was extracted from the recorded images, and the resulting pixel-to-length conversion factor (mm/px) was subsequently applied to all displacement measurements in the PIV analysis. For visualization purposes, wild vectors were removed, and the displacement vectors were magnified by a factor of five to clearly illustrate the progressive evolution of failure mechanisms during anchor keying.
3. Results and Discussion
3.1. Keying Kinematics of Anchor with Inwardly Rotating Keying Flaps
Figure 6 presents experimental images showing the keying kinematics of anchor without keying flaps (hp/B = 0) and with inwardly rotating keying flaps at hp/B = 0.2 and 0.4, corresponding to relatively short and long flap configurations. Regardless of flap configuration, the fluke exhibits coupled rotational, horizontal, and vertical movements during the keying process, as shown in Figure 6a–c.
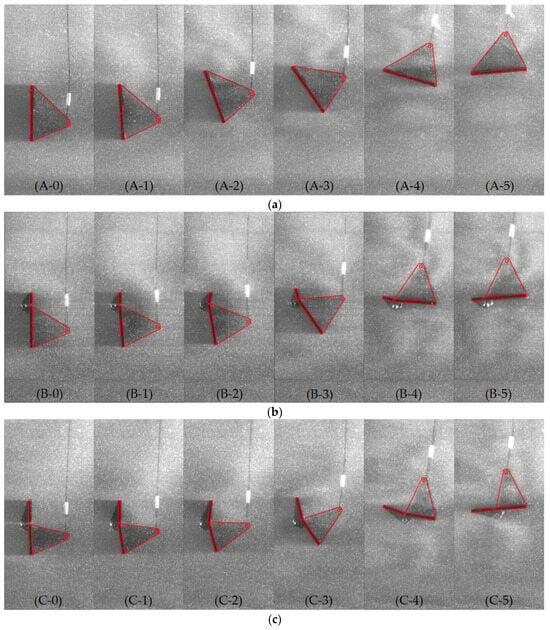
Figure 6.
Experimental images showing the SEPLA keying process in transparent soil for anchors with varying flap lengths: (a) hp/B = 0; (b) hp/B = 0.2; (c) hp/B = 0.4.
For anchors equipped with inwardly rotating keying flaps, the keying process can be further divided into five distinct phases based on the relative motion between the fluke and flap:
3.2. Anchor Trajectories During Keying
Based on the observed keying process, the trajectories of the anchor centroid were further analyzed to quantify and characterize the overall anchor movement. Figure 7 illustrates the centroid trajectories of five anchor models during keying. The initial centroid position of each anchor was set as the origin of the normalized coordinate system (x/B, z/B), where the x-axis is directed toward the shank and the z-axis is taken as positive upward. The phase points presented in Figure 6 are also marked along the centroid trajectories in Figure 7 for clarity.
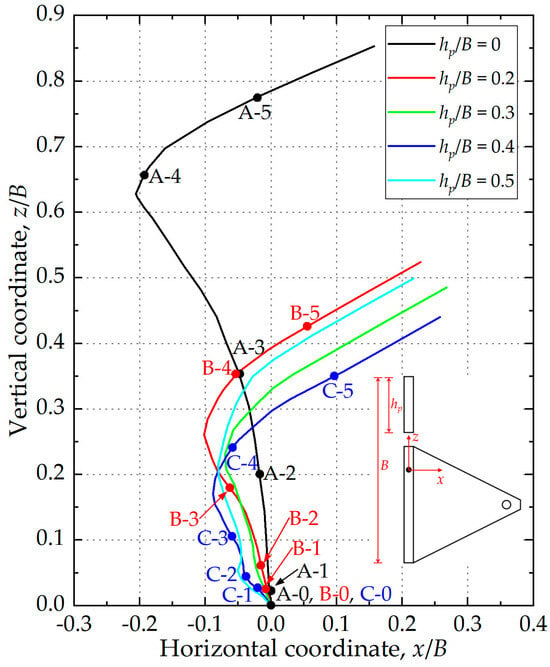
Figure 7.
Anchor centroid trajectories for SEPLAs with varying flap lengths.
At the beginning of keying, all anchors experienced backward displacement (opposite to the shank direction), mainly due to the padeye eccentricity (en). As keying progressed, the padeye offset (ep) drove the anchors forward (toward the shank direction). Distinct differences were observed between anchors with and without inwardly rotating keying flaps. The anchor without flaps (hp/B = 0) exhibited the largest upward displacement during keying. In contrast, anchors equipped with inwardly rotating keying flaps (hp/B = 0.2–0.5) exhibited significantly smaller vertical displacements. This reduction is attributed to the increased bearing area mobilized during flap activation, which effectively restrained upward movement.
3.3. Anchor Rotation and Loss of Embedment
Following the trajectory analysis, the influence of flap configuration on anchor rotation was further investigated. Figure 8 illustrates the relationship between anchor inclination angle (β) and normalized loss of embedment (Δz/B) for five anchor models during the keying process. The normalized loss of embedment (Δz/B) is defined as the vertical displacement of the anchor centroid during keying, normalized by the anchor breadth B. The phase points shown in Figure 6 are also marked on the curves in Figure 8. All anchors initially rotated from a vertical orientation (β = 90°) and continued beyond the horizontal position (β = 0°), driven by the moment generated by the tangential padeye offset (ep).
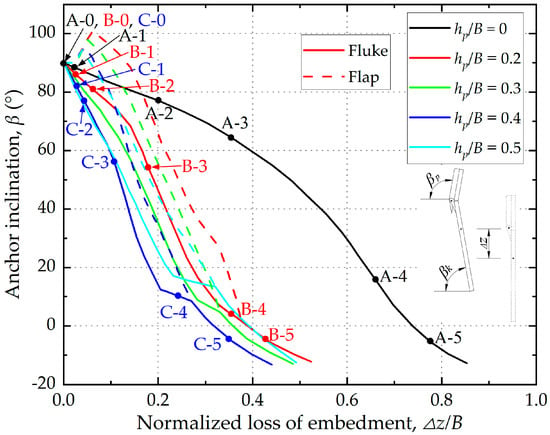
Figure 8.
Anchor rotation during keying.
Although all anchors exhibited similar overall rotational patterns, the vertical displacement required to achieve the same rotation varied significantly. The anchor without flaps (hp/B = 0) required the largest Δz/B, indicating lower rotational efficiency, i.e., requiring greater embedment loss (Δz/B) to mobilize rotation to a given inclination angle (β), compared with anchors equipped with inwardly rotating flaps. In contrast, anchors fitted with inwardly rotating flaps (hp/B = 0.2–0.5) reached comparable inclination angles at smaller vertical displacements, demonstrating that flap activation enhances the rotational efficiency of the fluke and reduces embedment loss. The anchor with hp/B = 0.4 exhibited the highest rotational efficiency, achieving the same inclination angle with the least loss of embedment.
For anchors equipped with inwardly rotating keying flaps (hp/B = 0.2–0.5), flap activation was observed when the fluke inclination angle was approximately between 86° and 80°. Increasing flap length delayed the initiation of activation, with longer flaps initiating inward rotation at smaller fluke inclination angles. This indicates that flap geometry not only affects the extent of rotation but also governs the timing of flap activation during keying. Flap closure occurred as the fluke rotated from approximately 17° to 7°, and full alignment between the flap and the fluke was achieved before reaching the horizontal orientation (β = 0°). Longer flaps closed at larger fluke inclination angles, indicating that flap length affects the timing of closure. This closure restored the effective bearing area of the anchor.
3.4. Soil Resistance and Loss of Embedment
Following the analyses of centroid trajectories and anchor rotation, the load–displacement response of the five anchor models was examined to further assess the influence of flap configuration on anchor performance. Figure 9 presents the relationship between the normalized loss of embedment (Δz/B) and the bearing capacity factor (Nc). The bearing capacity factor is defined as Nc = (F-W’)/(BLsu), where F is the applied pulling force, W’ is the effective weight of the anchor and su denotes the undrained shear strength at the depth of the anchor centroid. The phase points identified in Figure 6 are also depicted in Figure 9.
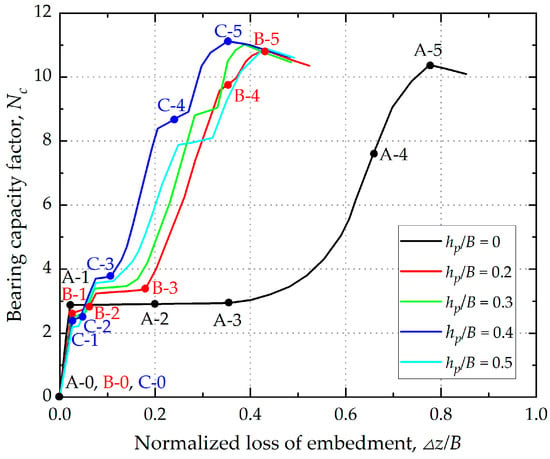
Figure 9.
Load–displacement curves.
The load–displacement response of the anchor without keying flaps was divided into four distinct stages:
- Stage I: Initial Mobilization (A0–A1). The anchor exhibited limited vertical displacement, while Nc increased rapidly, reflecting the elastic response of the surrounding soil.
- Stage II: Plateau Phase (A1–A3). Nc remained approximately constant as embedment loss progressed.
- Stage III: Peak Resistance (A3–A5). With continued vertical displacement, Nc increased again and eventually reached a peak, marking the completion of the keying process.
- Stage IV: Post-Peak Decline (after A5). Following the peak, Nc gradually decreased with increasing embedment loss.
The load–displacement response of anchors with inwardly rotating keying flaps followed a similar pattern but exhibited distinct variations in bearing response. At the end of Stage I, anchors with inwardly rotating keying flaps exhibited a lower bearing capacity factor because the flaps remained inactive, with only the fluke mobilized. Additionally, the greater the flap length ratio (hp/B), the smaller the effective fluke area before flap activation, which leads to lower bearing capacity factors during this stage. During Stage II, flap activation increased the vertical bearing area, resulting in a rise in the bearing capacity factor that surpassed that of the anchor without flaps. This reflects the intended function of the flaps in improving resistance. In Stage III, a temporary reduction in the rate of increase of the bearing capacity factor was observed, corresponding to the gradual closure of the flap against the fluke. The flaps became fully aligned with the fluke before the completion of the keying process, and no longer influenced the bearing area of the anchor once aligned. At the completion of the keying process, the ultimate bearing capacity factors were Nc = 10.38, 10.85, 11.02, 11.12, and 10.89 for flap length ratios hp/B ranging from 0 to 0.5, consistent with the typical range Nc = 10.1–11.9 reported in centrifuge and numerical studies [,,].
Figure 10 presents the embedment loss at the completion of the keying process for anchors with flap lengths ranging from 0.2B to 0.5B, in comparison with the LDFE predictions by Tian et al. []. The embedment losses were 0.78B for the anchor without flaps, and 0.43B, 0.39B, 0.35B, and 0.43B for flap length ratios of hp/B = 0.2, 0.3, 0.4 and 0.5. Embedment loss decreased with increasing flap length up to 0.4B, beyond which a slight increase occurred. The anchor with a 0.4B flap length exhibited the smallest embedment loss, corresponding to a 55% reduction relative to the anchor without flaps. In contrast to previous studies showing that outwardly rotating keying flaps were ineffective [,,,], the present results demonstrate that the inwardly rotating flap design provides a markedly improved reduction in embedment loss during keying.
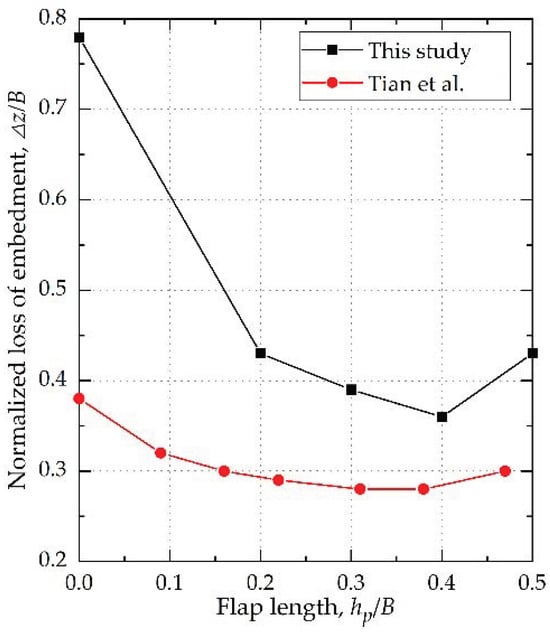
Figure 10.
Embedment loss at the completion of the keying process for varying flap lengths [].
Although differences in magnitude were observed between the experimental and LDFE results, these discrepancies are primarily attributed to differences in the loading schemes. In the experimental tests, loading was applied through the mooring cable, whereas a prescribed vertical displacement was imposed in the LDFE analyses. Nevertheless, the experimental and LDFE results exhibit consistent trends regarding the effect of flap length on embedment loss, confirming that the minimum embedment loss occurs at a flap length of approximately 0.4B, beyond which an increasing trend in embedment loss is observed, suggesting potential adverse effects of excessively long flaps. An excessively long flap may increase the structural stiffness of the anchor, which can hinder fluke rotation during keying and lead to premature flap closure, thereby limiting the effectiveness of the flap in controlling embedment loss.
3.5. Failure Mechanisms
To further investigate the soil–anchor interaction mechanisms during SEPLA keying, PIV analysis was conducted. The analysis focused on three anchor configurations: an anchor without flaps (hp/B = 0) and anchors equipped with inwardly rotating keying flaps of hp/B = 0.2 and 0.4. As illustrated in Figure 11, Figure 12 and Figure 13, representative soil displacement fields were extracted for key stages of the keying process to reveal the evolution of failure mechanisms. The phase points identified in Figure 6 are also represented in Figure 11, Figure 12 and Figure 13, allowing a direct correlation between the observed failure mechanisms and the keying stages.
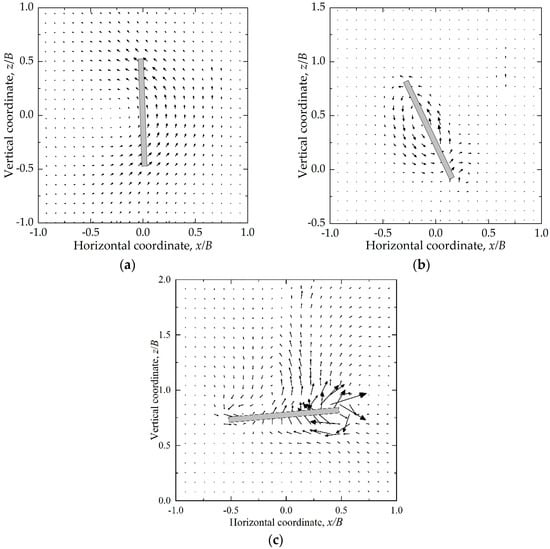
Figure 11.
Failure mechanisms during keying for the anchor without flaps: (a) A-1; (b) A-3; (c) A-5.
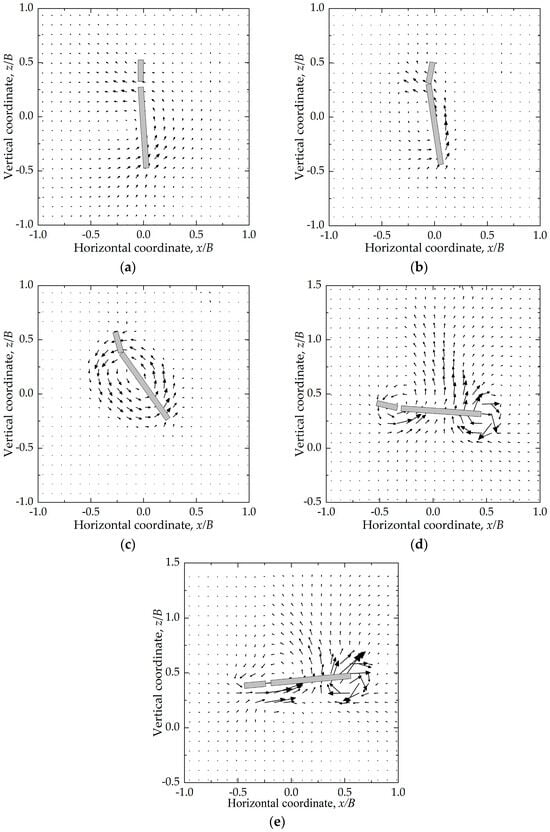
Figure 12.
Failure mechanisms during keying for the anchor with flap lengths of 0.2B: (a) B-1; (b) B-2; (c) B-3; (d) B-4; (e) B-5.
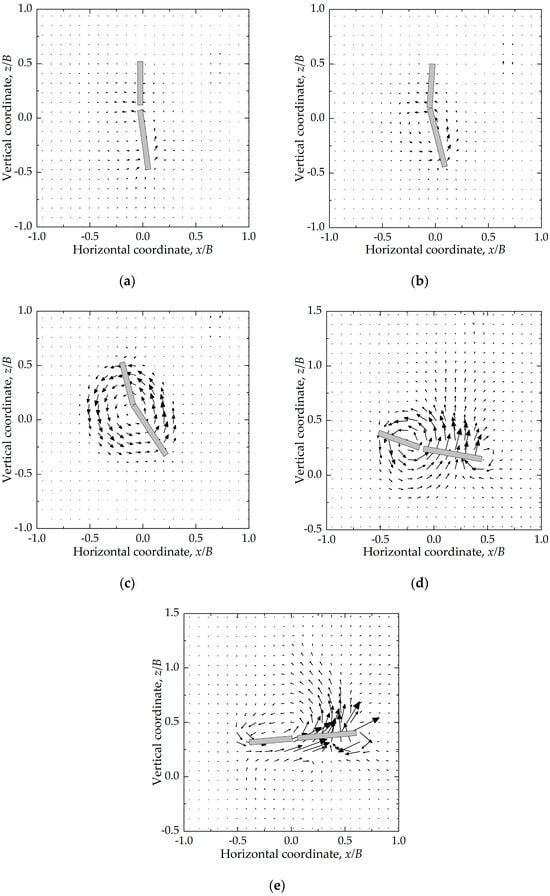
Figure 13.
Failure mechanisms during keying for the anchor with flap lengths of 0.4B: (a) C-1; (b) C-2; (c) C-3; (d) C-4; (e) C-5.
Figure 11a, Figure 12a and Figure 13a (A-1, B-1, C-1) illustrate the failure mechanisms corresponding to Stage I of the load–displacement response. During this stage, for the anchor without flaps, the soil in front of the anchor is mobilized, and soil flow develops in a counterclockwise direction around the anchor, forming a semicircular failure mechanism. For anchors equipped with inwardly rotating keying flaps, soil movement is primarily concentrated in front of the fluke, while only limited flow is observed near the flaps.
Figure 12b and Figure 13b (B-2, C-2) illustrate the failure mechanisms associated with flap activation for anchors with flap lengths of 0.2B and 0.4B, respectively. Soil flow is observed around the flaps, indicating soil–flap interaction during this stage. The flaps are activated as the anchor moves backward (opposite to the shank direction), driven by passive soil pressure acting on the back face of the flaps.
Figure 11b, Figure 12c and Figure 13c (A-3, B-3, C-3) illustrate the failure mechanisms corresponding to Stage II of the load–displacement response. At this stage, the soil exhibits a rotational ellipsoidal failure mechanism. This mechanism is characterized by a circular rotational flow of soil around the plate, forming an ellipsoidal flow zone centered on the anchor and corresponding to a rotation-dominated motion pattern, in which the anchor undergoes pronounced rotation. Under this mechanism, the bearing capacity factor remains nearly constant.
Figure 12d and Figure 13d (B-4, C-4) illustrate the failure mechanisms corresponding to the rotation of the flaps toward the fluke for anchors with flap lengths of 0.2B and 0.4B. The inward rotation and gradual closure of the flaps occur as the anchor translates forward (along the shank direction), during which the passive soil pressure acting on the front face of the flaps becomes dominant.
Figure 11c, Figure 12e and Figure 13e (A-5, B-5, C-5) illustrate the failure mechanisms at the end of Stage III of the load–displacement response (peak resistance stage). At this stage, the influence zone above the anchor expands upward, and an asymmetric soil flow pattern develops along both ends of the plate, indicating a sliding failure mechanism. Due to the horizontal offset of the padeye relative to the plate centroid, an additional moment is introduced, which alters the rotation of the anchor and affects the mobilization of the bearing capacity. As a consequence of this padeye offset (ep), the plate anchor reaches its peak bearing capacity at an inclination of approximately −5° relative to the horizontal, resulting in a reduced effective bearing area and a corresponding reduction in the ultimate capacity.
4. Conclusions
This study presented a detailed experimental investigation of the keying process of SEPLAs equipped with inwardly rotating keying flaps, using transparent soil model tests combined with PIV analysis. The influence of flap length on anchor kinematics, failure mechanisms, and embedment loss was systematically evaluated across five anchor configurations, including a reference anchor without flaps and four anchors with flap length ratios ranging from 0.2B to 0.5B.
Direct visualization of flap activation and closure during keying was achieved, providing new insights into the interaction between flap kinematics and anchor–soil interaction mechanisms. The experimental results demonstrated that inwardly rotating keying flaps effectively reduced embedment loss compared with the anchor without keying flaps. Among the tested configurations, a flap length ratio of 0.4B exhibited the optimal performance within the studied range. PIV analysis further revealed the staged evolution of failure mechanisms across different load–displacement stages, contributing to a more comprehensive understanding of SEPLA performance.
The results provide design guidance for SEPLAs. The findings show that the length of the inwardly rotating keying flap controls the reduction in embedment loss, which directly influences the ultimate holding capacity of the anchor. Therefore, optimizing flap design can improve SEPLA performance and enhance the safety and stability of floating offshore structures.
It should be noted that the experiments were conducted under 1g conditions, using transparent soil with uniform properties and a single loading direction. Future studies should adopt approaches such as large-deformation finite element (LDFE) analysis, centrifuge modelling, and field testing to examine the effects of complex soil conditions and anchor design parameters on the keying behavior of SEPLAs. On the soil side, attention should be given to variations in strength, density, and stiffness, as well as stratification and anisotropy. On the anchor side, systematic investigations of parameters including flap rotation angle, anchor shape, and padeye offset position are recommended to further clarify their influence on anchor performance.
Author Contributions
Conceptualization, C.Z.; methodology, X.Z.; validation, W.Z. and B.Z.; investigation, Z.L.; writing—original draft preparation, X.Z.; writing—review and editing, C.Z. All authors have read and agreed to the published version of the manuscript.
Funding
This research was funded by the Hebei Provincial Natural Science Foundation of China (Grant E2023208053).
Data Availability Statement
The original contributions presented in this study are included in the article. Further inquiries can be directed to the corresponding author.
Acknowledgments
We would like to express our sincere appreciation to the anonymous reviewers for their insightful and constructive comments, which have significantly improved the quality of this manuscript. We also thank the editor for the efficient and professional handling of the review process.
Conflicts of Interest
The authors declare no conflicts of interest.
References
- Dove, P.; Treu, H.; Wilde, B. Suction embedded plate anchor (SEPLA): A new anchoring solution for ultra-deepwater mooring. In Proceedings of the Deep Offshore Technology Conference, Houston, TX, USA, 4–7 May 1998. [Google Scholar]
- Wei, Q.; Cassidy, M.J.; Tian, Y.; Gaudin, C. Incorporating shank resistance into prediction of the keying behavior of suction embedded plate anchors. J. Geotech. Geoenviron. Eng. 2015, 141, 04014080. [Google Scholar] [CrossRef]
- Zhou, Z.; O’Loughlin, C.D.; White, D.J.; Stanier, S.A. Improvements in plate anchor capacity due to cyclic and maintained loads combined with consolidation. Géotechnique 2020, 70, 732–749. [Google Scholar] [CrossRef]
- Yi, J.T.; Lin, H.N.; Cheng, Q.Q.; Liu, W.H.; Ding, L.; Li, X.B.; Yang, Q.S. A large deformation finite element investigation of SEPLA: Failure mechanism and bearing capacities when loaded differently. Appl. Ocean Res. 2024, 143, 103864. [Google Scholar] [CrossRef]
- Maitra, S.; Tian, Y.; Cassidy, M.J.; Cassidy, M. An efficient approach to tackle the challenges of LDFE modelling of plate anchor-chain system during installation process. Comput. Geotech. 2024, 166, 105974. [Google Scholar] [CrossRef]
- Wilde, B.; Treu, H.; Fulton, T. Field testing of suction embedded plate anchors. In Proceedings of the 11th International Offshore and Polar Engineering Conference, Stavanger, Norway, 17–22 June 2001. [Google Scholar]
- Song, Z.; Hu, Y.; O’Loughlin, C.D.; Randolph, M.F. Loss in anchor embedment during plate anchor keying in clay. J. Geotech. Geoenviron. Eng. 2009, 135, 1475–1485. [Google Scholar] [CrossRef]
- Randolph, M.F.; Gaudin, C.; Gourvenec, S.M.; White, D.J.; Boylan, N.; Cassidy, M.J. Recent advances in offshore geotechnics for deep water oil and gas developments. Ocean Eng. 2011, 38, 818–834. [Google Scholar] [CrossRef]
- Gaudin, C.; O’Loughlin, C.D.; Randolph, M.F.; Lowmass, A.C. Influence of the installation process on the performance of suction embedded plate anchors. Géotechnique 2006, 56, 381–391. [Google Scholar] [CrossRef]
- Gaudin, C.; Tham, K.H.; Ouahsine, S. Keying of plate anchors in NC clay under inclined loading. Int. J. Offshore Pol. Eng. 2009, 19, 135–142. [Google Scholar]
- O’Loughlin, C.D.; Lowmass, A.; Gaudin, C.; Randolph, M.F. Physical modelling to assess keying characteristics of plate anchors. In Proceedings of the 6th International Conference on Physical Modelling in Geotechnics, Hong Kong, China, 4–6 August 2006. [Google Scholar]
- Cassidy, M.J.; Gaudin, C.; Randolph, M.F.; Wong, P.C.; Wang, D.; Tian, Y. A plasticity model to assess the keying of plate anchors. Géotechnique 2012, 62, 825–836. [Google Scholar] [CrossRef]
- Tian, Y.; Randolph, M.F.; Cassidy, M.J. Analytical solution for ultimate embedment depth and potential holding capacity of plate anchors. Géotechnique 2015, 65, 517–530. [Google Scholar] [CrossRef]
- Peng, M.; Yin, Z.Y. An elastoplastic model for predicting kinematics and trajectories of suction-embedded plate anchors under eccentric loading in clay. J. Geotech. Geoenviron. Eng. 2024, 150, 04024044. [Google Scholar] [CrossRef]
- Wang, D.; Hu, Y.; Randolph, M.F. Keying of rectangular plate anchors in normally consolidated clays. J. Geotech. Geoenviron. Eng. 2011, 137, 1244–1253. [Google Scholar] [CrossRef]
- Tian, Y.; Gaudin, C.; Randolph, M.F.; Cassidy, M.J. Influence of padeye offset on bearing capacity of three-dimensional plate anchors. Can. Geotech. J. 2015, 52, 682–693. [Google Scholar] [CrossRef]
- Cheng, L.; Niu, F.; Hossain, M.S.; Wang, Q.; Kim, Y. Effect of padeye offset ratio on keying behaviours and capacity of square plate anchors in clay. Ocean Eng. 2024, 304, 117902. [Google Scholar] [CrossRef]
- Gaudin, C.; Simkin, M.; White, D.J.; O’Loughlin, C.D. Experimental investigation into the influence of a keying flap on the keying behaviour of plate anchors. In Proceedings of the 20th International Offshore and Polar Engineering Conference, Beijing, China, 20–26 June 2010. [Google Scholar]
- Wang, D.; Gaudin, C.; Randolph, M.F. Large deformation finite element analysis investigating the performance of anchor keying flap. Ocean Eng. 2013, 59, 107–116. [Google Scholar] [CrossRef]
- Tian, Y.; Gaudin, C.; Cassidy, M.J.; Randolph, M.F. Considerations on the design of keying flap of plate anchors. J. Geotech. Geoenviron. Eng. 2013, 139, 1156–1164. [Google Scholar] [CrossRef]
- Liu, J.; Lu, L.; Yu, L. Keying behavior of suction embedded plate anchors with flap in clay. Ocean Eng. 2017, 131, 231–243. [Google Scholar] [CrossRef]
- Tian, Y.; Gaudin, C.; Cassidy, M.J. Improving plate anchor design with a keying flap. J. Geotech. Geoenviron. Eng. 2014, 140, 04014009. [Google Scholar] [CrossRef]
- Pierozan, R.C.; Almikati, A.; Araujo, G.L.S.; Zornberg, J.G. Optical and physical properties of laponite for use as clay surrogate in geotechnical models. Geotech. Test. J. 2022, 45, 79–100. [Google Scholar] [CrossRef]
- Wallace, J.F.; Rutherford, C.J. Geotechnical Properties of Laponite RD®. Geotech. Test. J. 2015, 38, 574–587. [Google Scholar] [CrossRef]
- Almikati, A.; Pierozan, R.C.; Sadek, S.; Zornberg, J.G. Geotechnical characterization of Laponite as transparent clay surrogate. Geotech. Test. J. 2023, 46, 535–558. [Google Scholar] [CrossRef]
- Ads, A.; Bless, S.; Iskander, M. Shape effects on penetration of dynamically installed anchors in a transparent marine clay surrogate. Acta Geotech. 2023, 18, 3043–3059. [Google Scholar] [CrossRef]
- Ads, A.; Iskander, M.; Bless, S.; Omidvar, M. Effect of fin width on torpedo anchor penetration and pullout using model tests with transparent soils. Ocean Eng. 2024, 298, 117247. [Google Scholar] [CrossRef]
- Nanda, S.; Fanning, J.; Sivakumar, V.; Gavin, K.; Donohue, S.; Tripathy, S.; Black, J.A. Drag Anchor Behaviour in Soft Clay Deposits: Model Investigation in Transparent Clay Surrogate and Analytical Predictions. Can. Geotech. J. 2025, 62, 1–19. [Google Scholar] [CrossRef]
- Finnie, I.M.S.; Randolph, M.F. Punch-through and liquefaction induced failure of shallow foundations on calcareous sediments. In Proceedings of the 17th International Conference on the Behavior of Offshore Structures, Oxford, UK, 12–15 July 1994. [Google Scholar]
- ASTM D2435/D2435M-11; Standard Test Methods for One-Dimensional Consolidation Properties of Soils Using Incremental Loading. ASTM International: West Conshohocken, PA, USA, 2020.
- Martin, C.M.; Randolph, M.F. Upper bound analysis of lateral pile capacity in cohesive soil. Géotechnique 2006, 56, 141–145. [Google Scholar] [CrossRef]
- Merifield, R.S.; Lyamin, A.V.; Sloan, S.W.; Yu, H.S. Three-dimensional lower bound solutions for stability of plate anchors in clay. J. Geotech. Geoenviron. Eng. 2003, 129, 243–253. [Google Scholar] [CrossRef]
- Gaudin, C.; Tham, K.H.; Ouahsine, S. Plate anchor failure mechanism during keying process. In Proceedings of the 18th International Offshore and Polar Engineering Conference, Vancouver, BC, Canada, 6–11 July 2008. [Google Scholar]
- Stanier, S.A.; Blaber, J.; Take, W.A.; White, D.J. Improved image-based deformation measurement for geotechnical applications. Can. Geotech. J. 2016, 53, 727–739. [Google Scholar] [CrossRef]
- Song, Z.; Hu, Y.; Wang, D.; O’Loughlin, C.D. Pullout capacity and rotational behavior of square anchors. In Proceedings of the 6th International Conference on Physical Modelling in Geotechnics, Hong Kong, China, 4–6 August 2006. [Google Scholar]
Disclaimer/Publisher’s Note: The statements, opinions and data contained in all publications are solely those of the individual author(s) and contributor(s) and not of MDPI and/or the editor(s). MDPI and/or the editor(s) disclaim responsibility for any injury to people or property resulting from any ideas, methods, instructions or products referred to in the content. |
© 2025 by the authors. Licensee MDPI, Basel, Switzerland. This article is an open access article distributed under the terms and conditions of the Creative Commons Attribution (CC BY) license (https://creativecommons.org/licenses/by/4.0/).