Article

Prediction Analysis on the Sediment Erosion and Energy Dissipation Inside a Three-Stage Centrifugal Pump

1
College of Hydraulic Science and Engineering, Yangzhou University, Yangzhou 225100, China
2
Jiangsu Province General Irrigation Canal Management, Huaian 223200, China
3
Hongze Lake Water Conservancy Project Management Office of Jiangsu Province, Huaian 223200, China
*
Author to whom correspondence should be addressed.
J. Mar. Sci. Eng. 2025, 13(12), 2248; https://doi.org/10.3390/jmse13122248
Submission received: 20 September 2025 / Revised: 11 November 2025 / Accepted: 13 November 2025 / Published: 26 November 2025
(This article belongs to the Section Ocean Engineering)

Abstract

Centrifugal pumps are essential to modern marine engineering systems for fluid transport. This study is to analyze the typical failure causes of sediment erosion and energy dissipation in a multi-stage centrifugal pump with different blade installation angles α using numerical simulation approach and on-site testing. Three different schemes with α = 0°, 10.85°, and 21.7° were designed. The installation angle of the blade influenced sediment erosion and energy dissipation through three key aspects: turbulent flow, particle motion, and wall roughness. Turbulent and friction dissipation, which are related to the blade angle and sediment erosion, are the leading causes of the pump failure. The symmetrical blade installation, turbulence intensity, particle impact velocity, and wall friction inside the unit were the highest, resulting in the most severe turbulence loss, wall loss, and sediment erosion under this scheme, with the maximum friction loss being 320 W·m−3·K−1. Complex turbulence intensifies the intensity of particle motion, with the maximum sediment erosion rate E = 0.000052 kg·m−2·s−1. Compared to Plan 1 and Plan 3, the performance can be improved by more than 20% and 23%, respectively. There was a positive correlation between the friction loss and erosion rate. The research presented in this study provides a novel perspective on the operation of a pump to prevent sediment erosion failure.

1. Introduction

Marine engineering, as a core field for the development and utilization of ocean resources, consistently faces extreme, complex, and corrosive environmental challenges in its equipment and technology. Against this backdrop, centrifugal pumps have become indispensable fluid transportation devices in modern marine engineering systems due to their compact structure, uniform flow, stable operation, and relatively simple maintenance [1]. Their applications are deeply integrated into various aspects of marine engineering: In offshore oil and gas development, centrifugal pumps play an “arterial” role in platform water injection systems, crude oil transportation, drilling fluid circulation, and firefighting systems, ensuring the continuity and safety of production processes. On ships and offshore platforms, they are widely used in ballast water transfer, bilge drainage, cooling water circulation, fuel transportation, and domestic water supply systems, serving as lifelines for maintaining platform buoyancy, stability, and daily operations. With the advancement of deep-sea exploration and development, high-head, high-pressure-resistant multistage centrifugal pumps are increasingly critical in deep-sea mining applications, such as ore slurry transportation and subsea boosting [2].
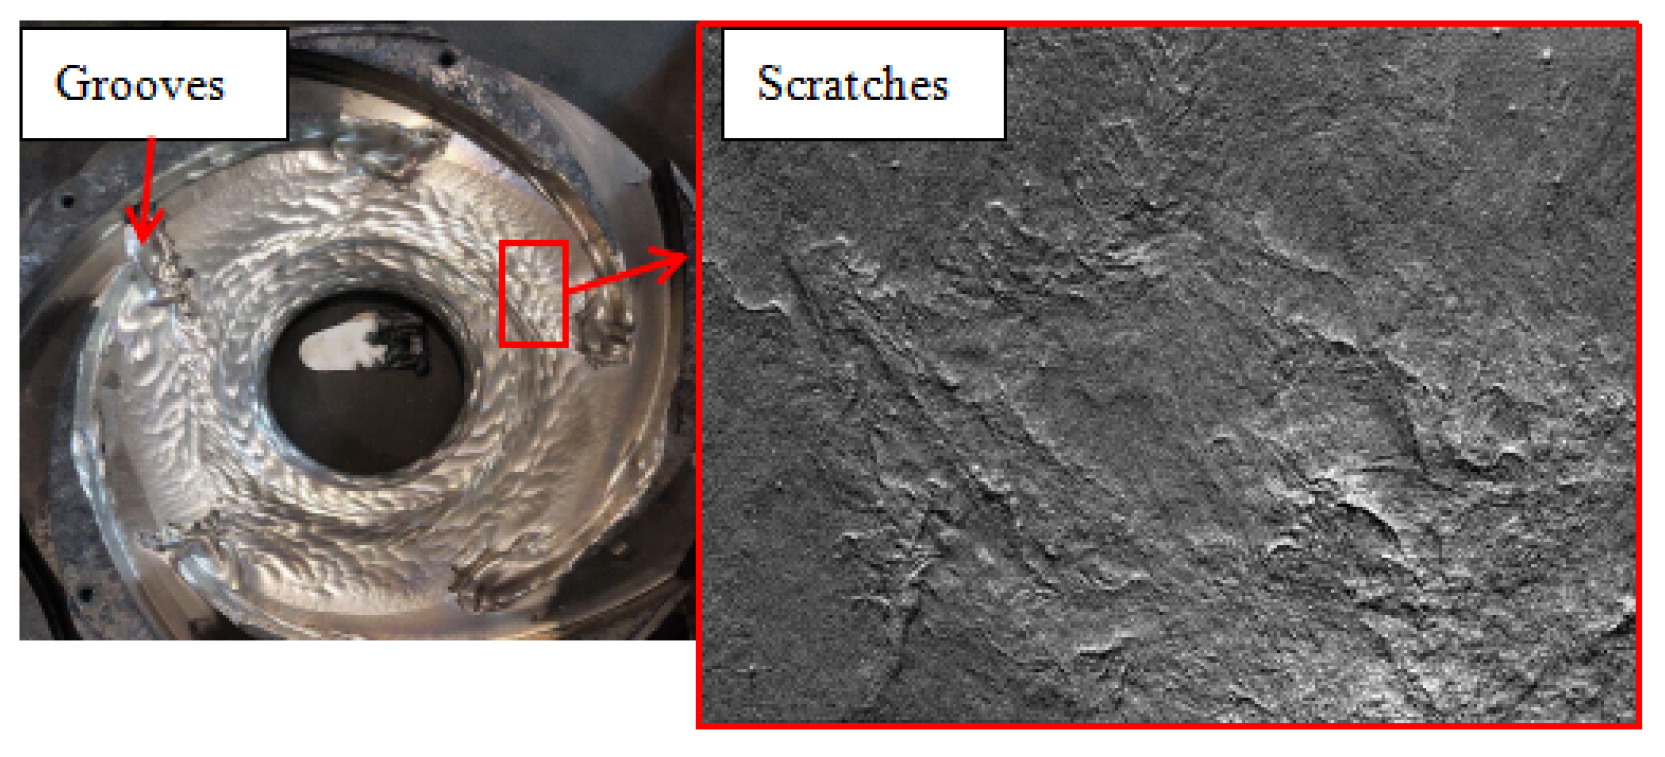
However, during actual operation, when handling fluids with high sediment content, multistage centrifugal pumps often face sediment erosion-induced failure issues caused by sand and silt, which severely affect their performance and service life, as shown in Figure 1.
Sediment erosion-induced failure primarily manifests in the following aspects: reduced flow rate and head due to sediment particles impacting and eroding flow-passing components such as impellers and pump casings, causing surface deformation, sediment erosion, and blockages that weaken the pump’s flow capacity, increased leakage as sediment erosion enlarges clearances between internal components, reducing sealing performance and potentially causing environmental pollution or safety hazards, decreased efficiency with escalating friction losses from intensified sediment erosion, leading to higher energy consumption per unit flow rate and increased operating costs, structural damage to impellers including blade deformation, fracture, or severe sediment erosion from continuous sediment impact, exacerbated vibration and noise from sediment erosion-induced flow instability and rotor imbalance, potentially damaging equipment and compromising operator safety, and elevated energy consumption with higher maintenance costs due to increased flow resistance and accelerated component failure requiring frequent repairs and replacements [3,4,5,6,7,8].
Among various methods to enhance the sediment erosion resistance of water pumps, sediment erosion-resistant design based on hydraulic models stands out as one of the most direct and effective approaches. Specific measures include optimizing the impeller blade profile to reduce the relative velocity of particles near the wall surfaces, as well as implementing localized sediment erosion-resistant designs in the flow channels to facilitate the smooth passage of sediment particles and mitigate localized scouring. Research indicates that the installation configuration of the impeller significantly influences the sediment erosion resistance of multistage centrifugal pumps [9]. Different installation methods alter flow velocity distribution, flow direction, and force conditions, thereby affecting the extent of sediment-induced sediment erosion on the impeller [10]. Currently, the commonly used double-suction impeller, featuring an axial double-inlet arrangement, contributes to balanced water flow, reduced radial forces and vibrations, and demonstrates superior sediment erosion resistance [11].
It should be noted that the actual operating conditions of water pumps and sediment characteristics can significantly influence their sediment erosion resistance [12]. Therefore, practical applications should comprehensively consider specific working conditions to select appropriate impeller installation configurations and complementary measures, thereby holistically enhancing the sediment erosion resistance of multistage centrifugal pumps [13]. It can be asserted that, among the current array of anti-sediment erosion strategies, impeller optimization based on hydraulic design remains one of the most direct and effective approaches [14].
In recent years, Computational Fluid Dynamics (CFD) technology has been widely applied to sediment erosion prediction in hydraulic machinery, where the selection of sediment erosion models is crucial for prediction accuracy [15]. The Tabakoff sediment erosion model and the Finnie sediment erosion model are two commonly used models with extensive application in engineering practice. The Finnie model, proposed by Finnie et al. in the 1990s, is primarily used for predicting sediment erosion on pump impeller blades. Based on the distribution of pressure and friction forces on the blade surface, this model comprehensively considers multiple mechanisms such as pressure-induced sediment erosion, impact sediment erosion, and fatigue sediment erosion, enabling quantitative assessment of blade sediment erosion and holding significant value for performance evaluation and maintenance decision-making [16]. The Tabakoff model, developed by Tabakoff et al. in the 1980s, is widely used in the design, operation, and maintenance of centrifugal pumps. By integrating sediment erosion mechanisms such as impact, erosion, and fatigue, and incorporating fluid parameters, material properties, and operating conditions, this model allows for quantitative evaluation of impeller sediment erosion [17]. Overall, the Tabakoff model is more suitable for sediment erosion prediction in the field of water pumps and can provide effective guidance for equipment maintenance and lifespan assessment.
Existing research primarily focuses on single impellers or single-stage pumps, with insufficient attention paid to the mutual influence of flow and wear between stages in multistage pump systems [18]. Variations in blade installation angles cascade into the inflow conditions and wear patterns of subsequent stages, yet systematic studies in this area remain scarce [19]. The coupling mechanism remains unclear: how blade installation angles alter internal unsteady flow structures (such as vortices, jets, and wakes) to simultaneously affect sediment particle trajectories and the location and intensity of hydraulic losses, with the underlying microphysical mechanisms still poorly understood [20]. Quantitative correlation models between wear and hydraulic losses are urgently needed. Synergistic optimization of design parameters: blade installation angles interact with other parameters such as wrap angle, load distribution, and outlet width. Currently, there is a lack of a unified design framework to coordinate and optimize these parameters, achieving the best balance among multiple objectives including high hydraulic efficiency, strong erosion resistance, and operational stability [21].
This paper focuses on investigating the effects of blade installation angles in an intermediate-stage double-suction centrifugal pump within a three-stage pump unit on the flow characteristics, sediment erosion distribution, and hydraulic losses in the flow passage. The purpose of this study is to analyze the typical failure causes of sediment erosion and energy dissipation in a multi-stage centrifugal pump with different blade installation angles α using numerical simulation approach and on-site testing. Through numerical simulations and experimental analysis, the sediment erosion characteristics under different blade installation configurations are systematically studied. The research aims to propose an optimized blade arrangement scheme, thereby providing theoretical foundations and engineering references for addressing sediment erosion-induced failures in multistage centrifugal pumps.

2. Physical Model

2.1. Mathematical Method Settings

2.1.1. Governing Equation

The fluid motion was mathematically modeled using the Navier–Stokes equations [22], which served as the governing equations to predict the velocity, pressure, and overall flow behavior of water within the centrifugal pump.
( ρ u ) t + · ρ u u = p + ρ v u ρ · τ + S t
where u is velocity, t is time, ρ is density, p is pressure, ν is kinematic viscosity, St is source term. τ is the Reynolds stress defined as:
τ = τ d + 2 k 3 δ
where τd is Reynolds stress, k is turbulent kinetic energy, δ is Kronecker delta. Based on viscosity (νt) assumption, Equation (2) can be written as:
τ = 2 v t S + 2 k 3 δ
where S is the train-rate tensor,
S = 1 2 ( u + T u )
However, since the current calculations do not involve energy exchange, the governing equations mainly consist of the mass conservation equation and the momentum conservation equation.

2.1.2. Particle Track Model and Erosion Model

During the process of conveying sediment-laden water in pumps, solid particle erosion caused by sediment particles on flow-passing components is a critical factor leading to material damage and performance degradation [23].
m p d u p d t = F D + F B + F G + F V + F P + F X
where t is time, mp is particle mass, up is particle velocity, FD is drag force, FB is Basset force, FG is gravity, FV is virtual mass force, FP is pressure gradient force and FX is the sum of other external forces considered.
This study employs the classical Tabakoff erosion model to quantitatively predict this wear process [24]. Based on the dynamics of particle–wall collisions, the model characterizes the erosion rate by calculating the material loss per unit area per unit time [25,26]. It comprehensively considers the coupled effects of particle characteristics (such as size, shape, and concentration), flow parameters, and material properties (such as hardness and toughness) on the erosion process. The model can effectively simulate the distribution and evolution of erosion wear on pump surfaces, such as impellers and volutes, in complex multiphase flow fields. The Tabakoff erosion model is shown as follows:
E = f γ V p V 1 2 c o s 2 γ 1 ( 1 V p V 3 sin γ ) 2 + ( V p V 2 sin γ ) 4
f ( γ ) = [ 1 + k 1 k 12 s i n γ π / 2 γ 0 ] 2
k 1 = 1     γ 2 γ 0 0     γ > 2 γ 0
where E is the dimensionless erosion mass; k1 and k12 are model constants; VP is the particle impact velocity, γ is the impact angle, f(γ) is a dimensionless function of the impact angle; V1, V2 and V3 are particle collision velocity parameters.

2.2. Numerical Simulation Setup

2.2.1. Geometric Model

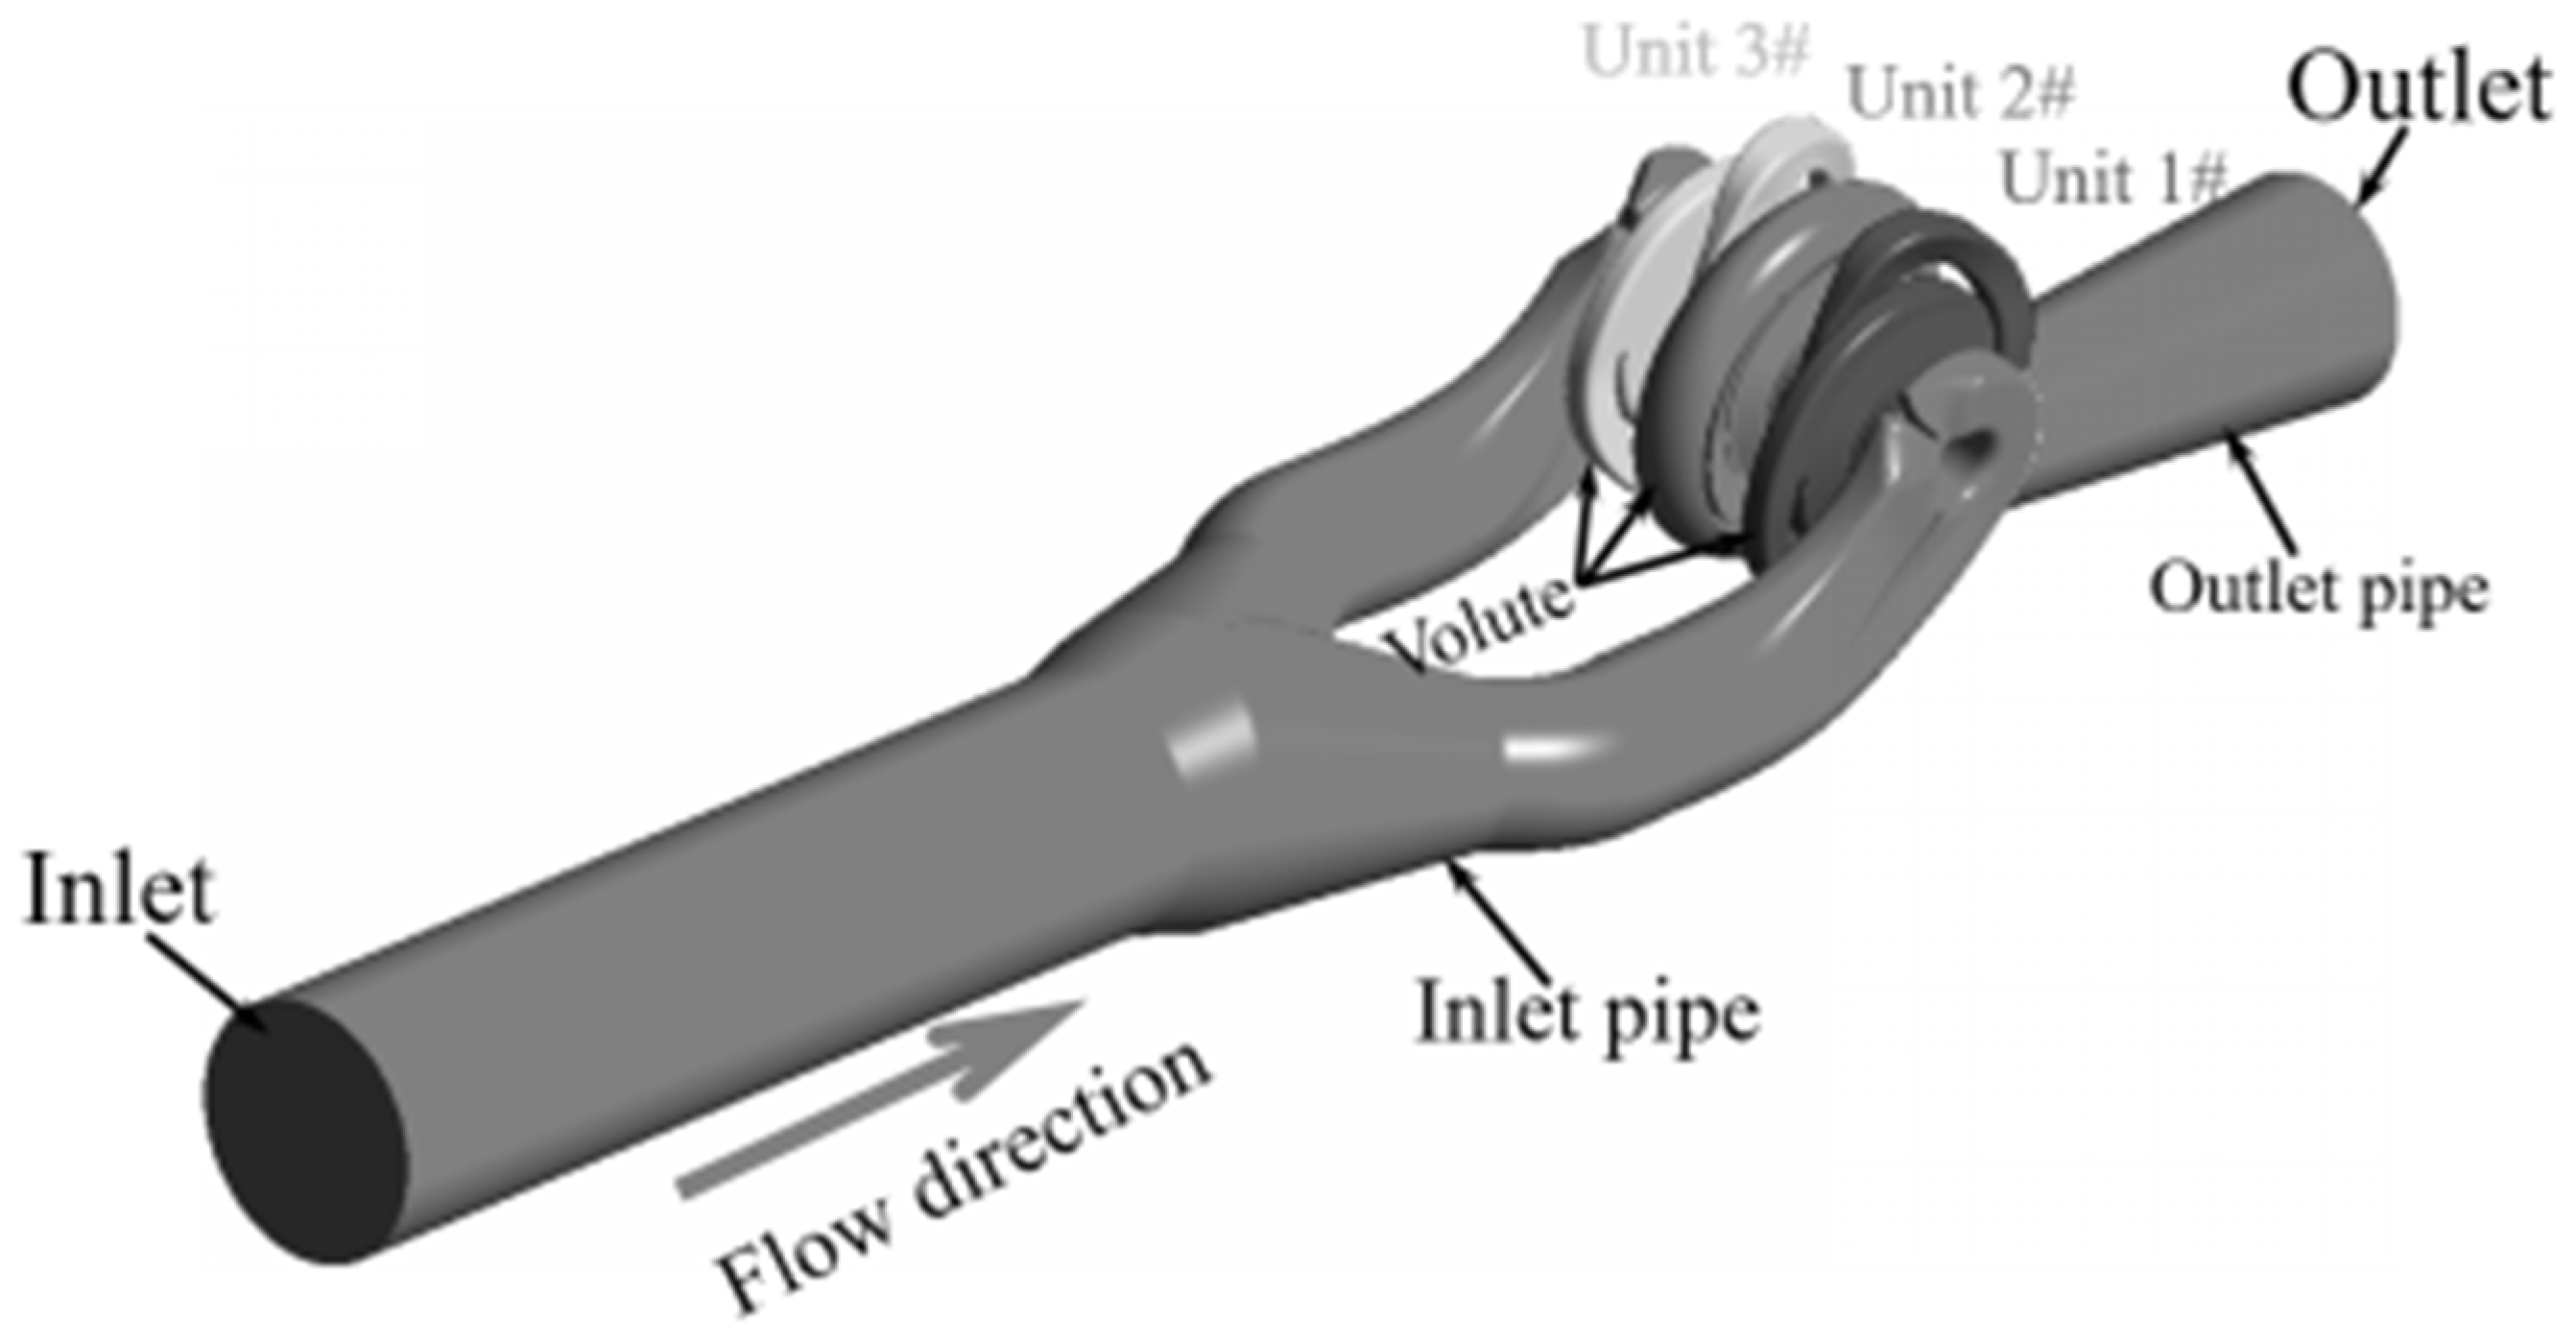
The study focuses on a three-stage double-suction centrifugal pump with a rated flow rate of 300 m3/h, a head of 137 m, and an impeller rotation speed of 100 r/min. The unit consists of an inlet chamber, guide vanes, front chamber, rear chamber, impeller, outlet chamber, and balancing drum. For clarity in analysis, extended sections were added both upstream and downstream of the pump, while each pump stage is designated as Unit #1, Unit #2, and Unit #3, as shown in Figure 2. The inlet diameter of the water pump is 0.4 m, the outlet diameter of the water pump is 0.8 m, and the height of the water pump is 2.3 m. The main design parameters of the multistage centrifugal pump are listed in Table 1.
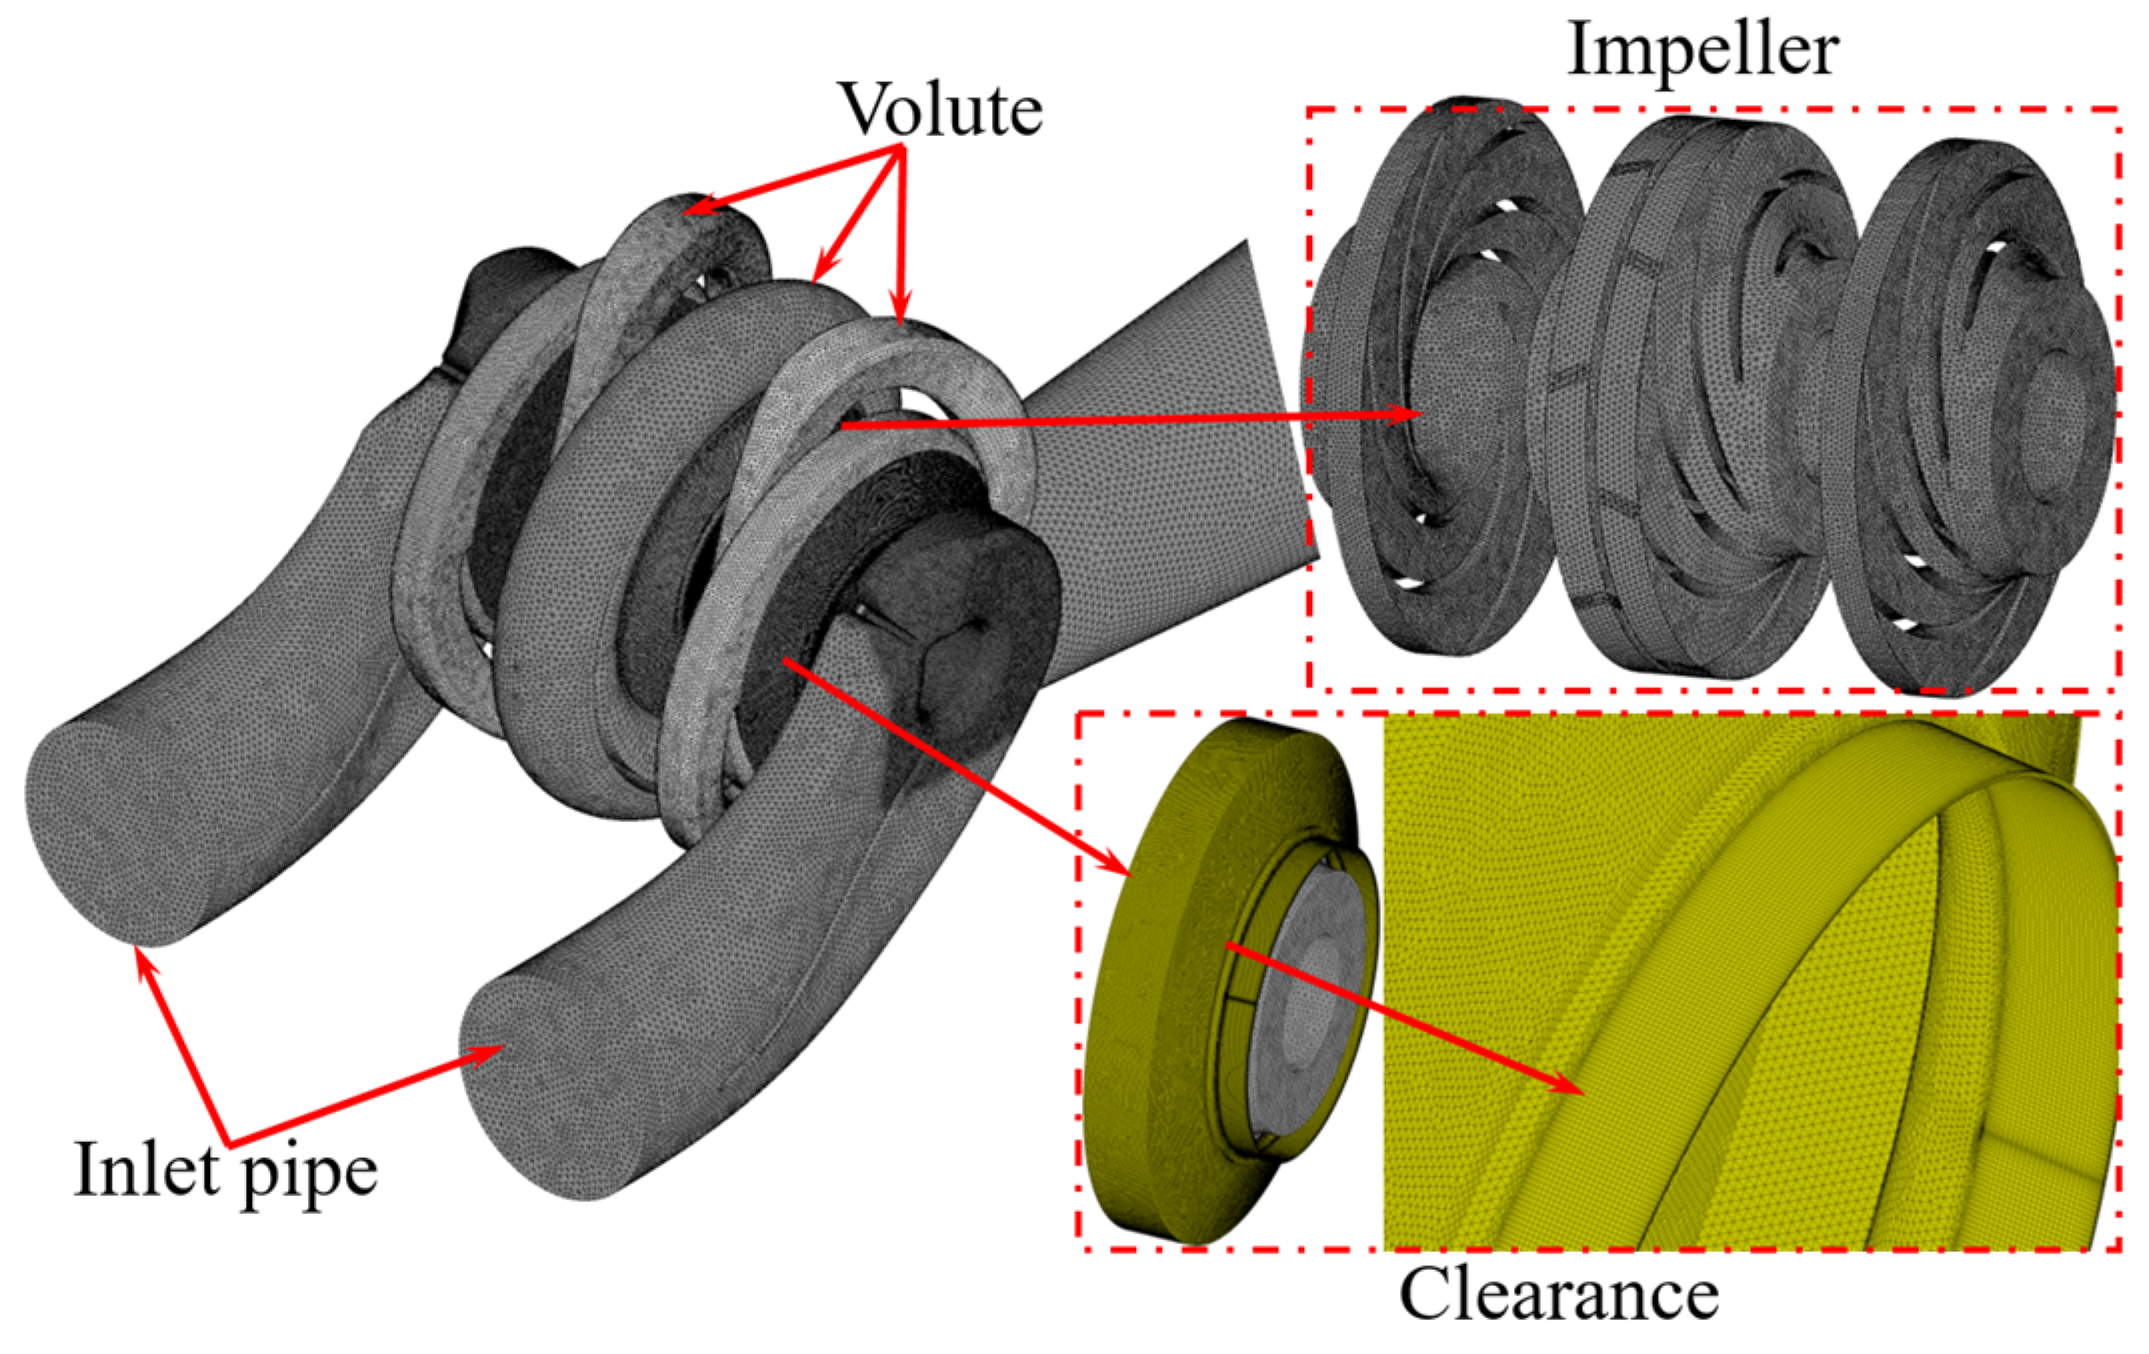
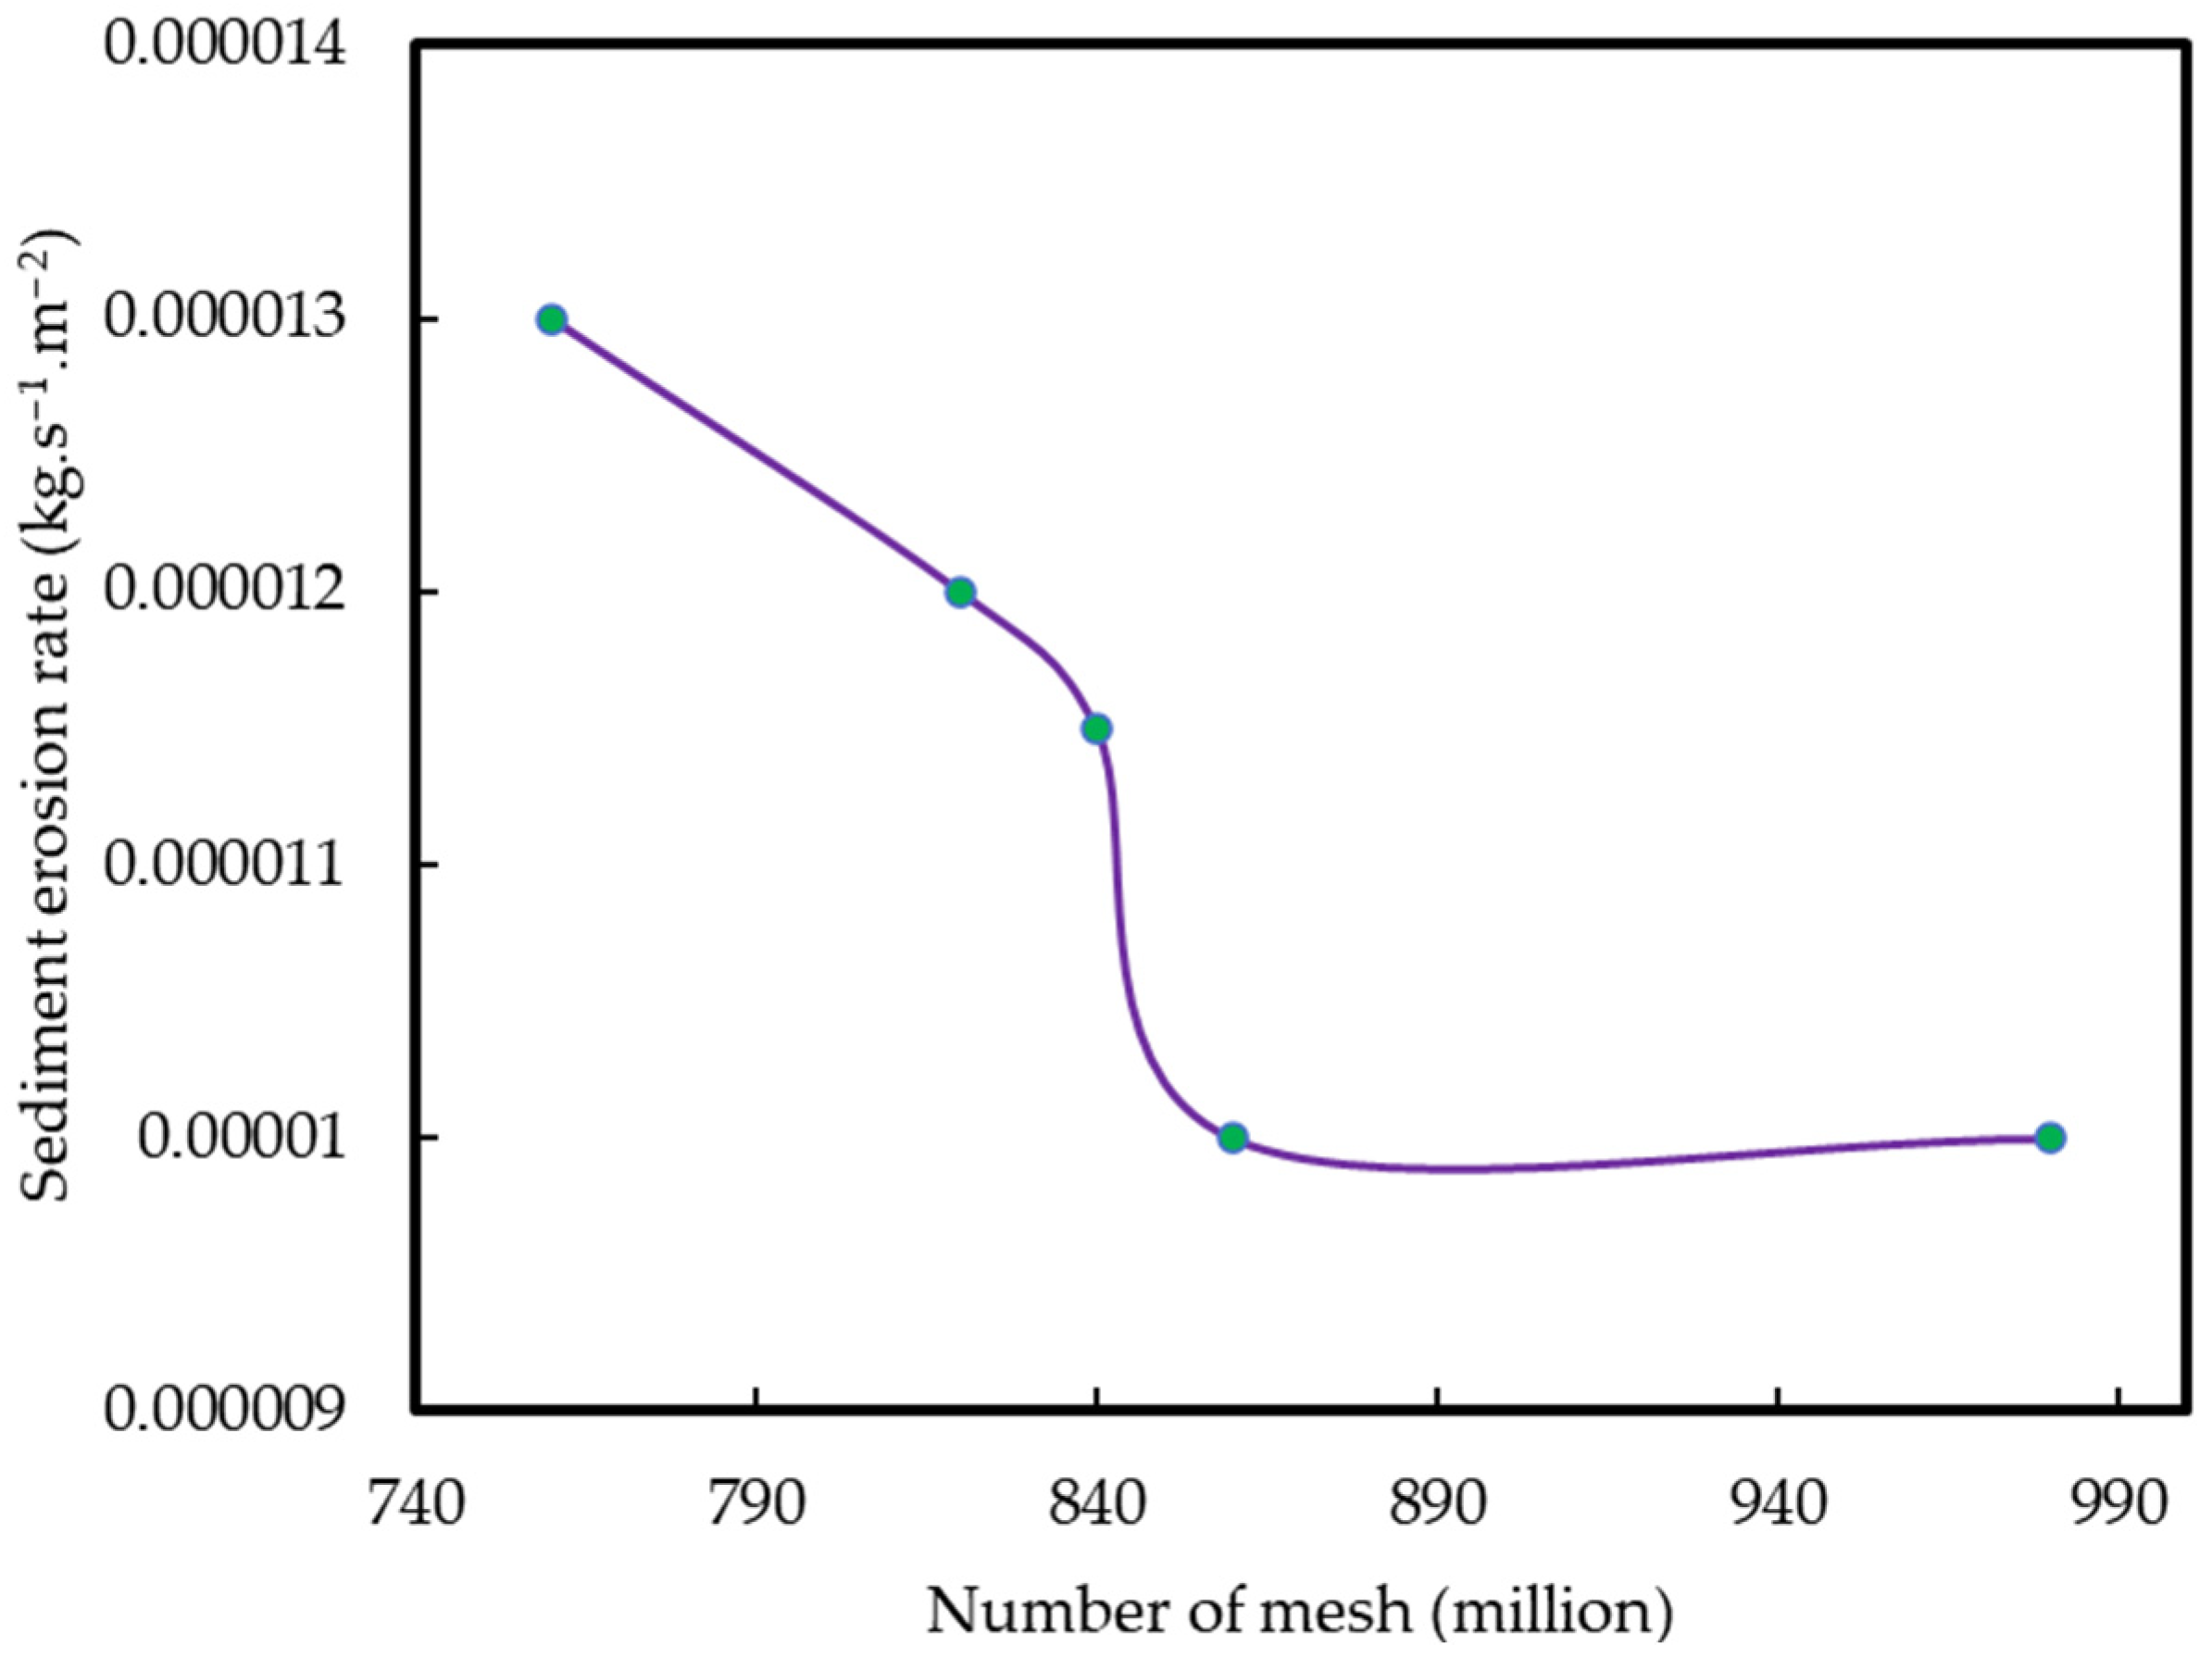
In the numerical simulation of centrifugal pumps, high-precision meshing is fundamental requirement. Given the complex geometry of the multistage centrifugal pump investigated in this study, a hybrid meshing strategy combining structured and unstructured grids was employed, as shown in Figure 3. For flow domains with relatively regular geometries, such as the inlet chamber, outlet chamber, and extended sections between stages, high-quality structured hexahedral meshes were used for discretization. Strict boundary layer refinement was implemented near all wall surfaces, generating multiple layers of prismatic cells to accurately capture key flow characteristics within the boundary layer, such as velocity gradients and shear stresses. By meticulously controlling the near-wall mesh scale, the y+ values across the entire computational domain were consistently maintained within 120. This approach not only meets the requirements for resolving near-wall flow details but also aligns with the wall-treatment methods of the selected turbulence model. Ultimately, by assembling the high-quality meshes of individual components at their interfaces, a complete and reliable full-flow passage numerical model of the multistage pump was constructed, laying a solid foundation for obtaining high-fidelity flow field structures and performance predictions. For the critical gap region of 1.2 mm, a five-layer mesh was implemented based on established engineering practice. The above grid division method was used for grid division, and the blade wall wear rate was used for grid independence verification. When the total number of grids exceeded 8.6 million, the wall wear rate no longer changed. The final number of grids was chosen to be 8.6 million for calculation, as shown in Figure 4.

2.2.2. Boundary and Parameter

In this paper, the software is Ansys CFX 2022R1. The Shear Stress Transport (SST) k-ω model, based on the Reynolds-Averaged Navier–Stokes (RANS) equations, was employed as the turbulence model. This model effectively captures adverse pressure gradients and shear stresses within the flow passage, making it well-suited for predicting complex flow separations and vortex phenomena in rotating machinery.
The definition of sediment particles is a discrete model, and the fluid adopts a homogeneous flow model. The interaction between sediment particles and fluids manifests as discrete motion of particles in the fluid.
Key boundary conditions were defined as follows: the inlet was specified as a mass-flow inlet, with its value set according to the pump’s design operating point, along with a turbulence intensity of 5% and hydraulic diameter. The outlet was set as a static pressure outlet, where the back pressure was estimated based on the head and reverse flow was allowed to enhance computational stability. A transient rotor–stator model to accurately capture rotor–stator interaction. A pressure-based coupled algorithm was selected for the solver, with the PRESTO! scheme used for pressure discretization, and second-order upwind schemes adopted for both momentum and turbulence terms to improve computational accuracy. Convergence was determined based on residual monitoring (reduced below 10−4) and inlet–outlet mass flow balance (with a deviation of less than 0.5%), while the stability of key performance parameters such as head and torque was monitored in real time.
This density proved sufficient to capture the flow dynamics influenced by the 0.2 mm particles.

2.2.3. Research Proposal

The influence of blade placement angle on energy dissipation and sediment erosion of water pumps is studied in this paper. Three different design schemes are proposed: Scheme I with α = 0°, Scheme II with α = 10.85°, and Scheme III with α = 21.7°.

2.3. Reliability Verification

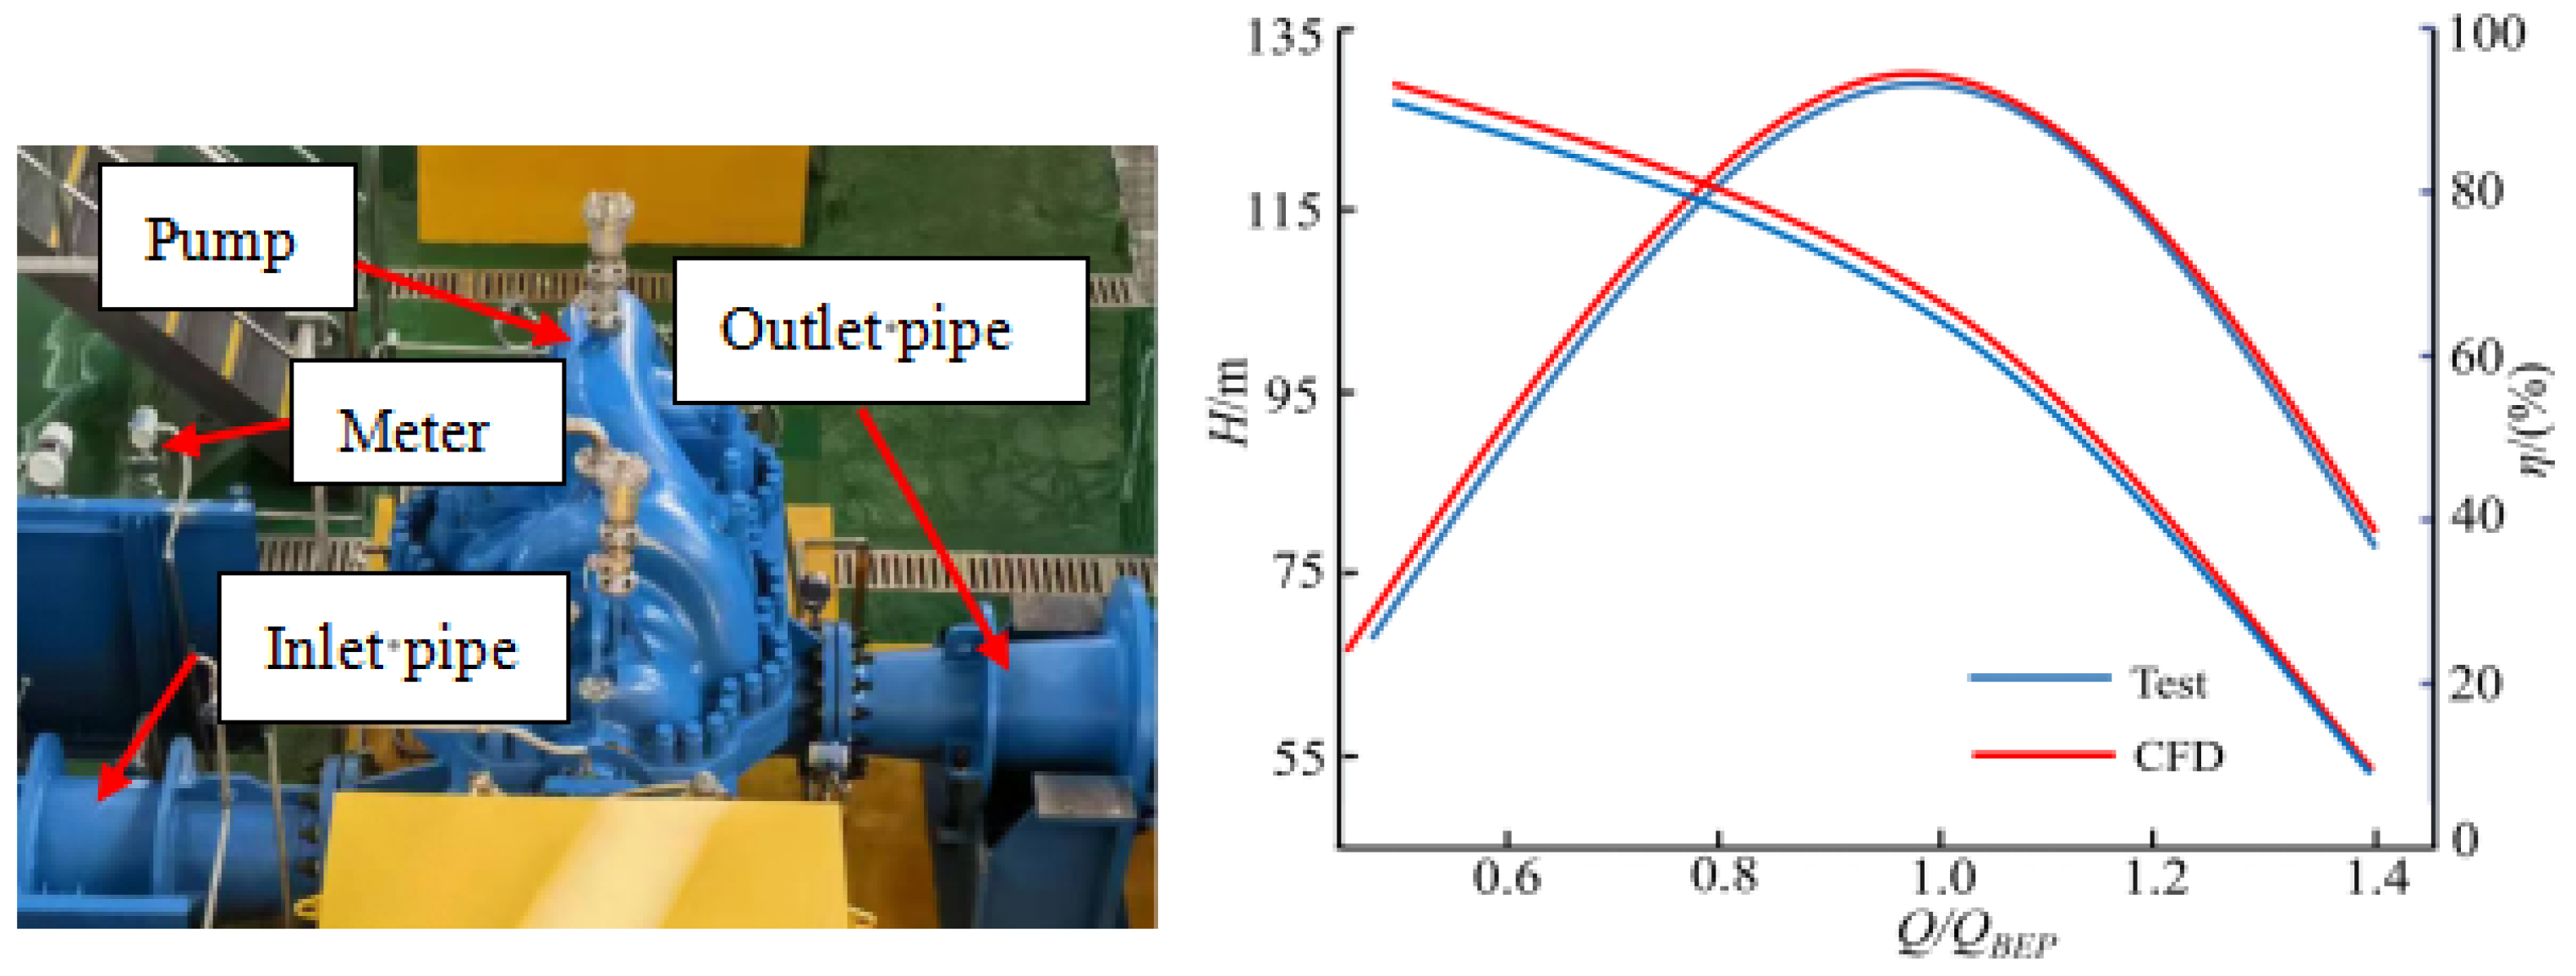
Validate the energy performance data of the unit obtained from numerical simulation and on-site experimental testing, which is presented in Figure 5. The simulated values of head and efficiency are consistent with actual operating data. The numerical simulation error for head remains within 3% across all operating flow points, with a maximum efficiency error of 4.2%. These results confirm the reliability of the numerical model. Based on this validated model, this study evaluates the influence of the blade installation angle on erosion failure in multi-stage centrifugal pumps.

2.4. Entropy Production Theory

In recent years, entropy generation theory has been widely applied in hydraulic machinery [27,28,29,30]. This theory provides a core framework for evaluating energy losses by quantifying system irreversibility, with its entropy generation components primarily including three mechanisms: turbulent dissipation S ˙ D ¯ , fluctuating dissipation S ˙ D , and wall entropy generation S ` W . Turbulent dissipation originates from momentum transport and energy dissipation caused by turbulent fluctuations, reflecting the process where turbulent kinetic energy is converted into internal energy through viscous effects. Fluctuating dissipation results from transient fluctuations of physical quantities such as pressure and velocity. Wall entropy generation is concentrated in near-wall regions, mainly comprising contributions from wall viscous dissipation and heat conduction, with its intensity jointly influenced by wall shear stress, turbulence intensity, and boundary layer characteristics. The local total entropy production is expressed as
S ˙ D = S ˙ D ¯ + S ˙ D + S ˙ w
S ˙ D ¯ = μ T u ¯ y + v ¯ x 2 + u ¯ z + w ¯ x 2 + w ¯ y + v ¯ z 2 + 2 μ T u ¯ x 2 + v ¯ y 2 + w ¯ z 2
S ˙ D = μ e f f T u y + v x 2 + u z + w x 2 + w y + v z 2 + 2 μ e f f T u x 2 + v y 2 + w z 2
S ` W = τ w u p T
where μ e f f = μ + μ t , u ¯ , v ¯ , and w ¯ are the components of the time-averaged velocity in the x, y, and z directions, m/s. u′, v′ and w′ are the components of the pulsation velocity in the x, y, and z directions, respectively (m/s). T is temperature, K. μeff is the effective dynamic viscosity of the fluid, Pa·s. μt is the turbulent dynamic viscosity, Pa·s. τw is the wall shear force, Pa. up is the velocity of the first grid node near the wall, m/s.
In this study, the flow medium used was sediment-containing water. Considering the collision and internal friction between the particles, u, v, and w in Equations (2) and (3), adopt the relative velocity in the flow field. The entropy production theory indicates that the turbulence intensity in the flow passage is a fundamental factor affecting the performance of the units; therefore, it is necessary to analyze the turbulence characteristics in the flow passage.

3. Results and Discussions

3.1. Sediment Erosion of Water Pump

The sediment conditions primarily depend on the particle size, hardness, impact velocity, and impact angle. In the initial stage of the impact of the sediment particles on the metal surface, there were apparent grooves, scratches, and plows on the structural surface. After long-term sediment erosion, it penetrates the structure, as shown in Figure 6.

3.2. Impact of Blade Interlocking Angle on Unit Performance

(1) Scheme I
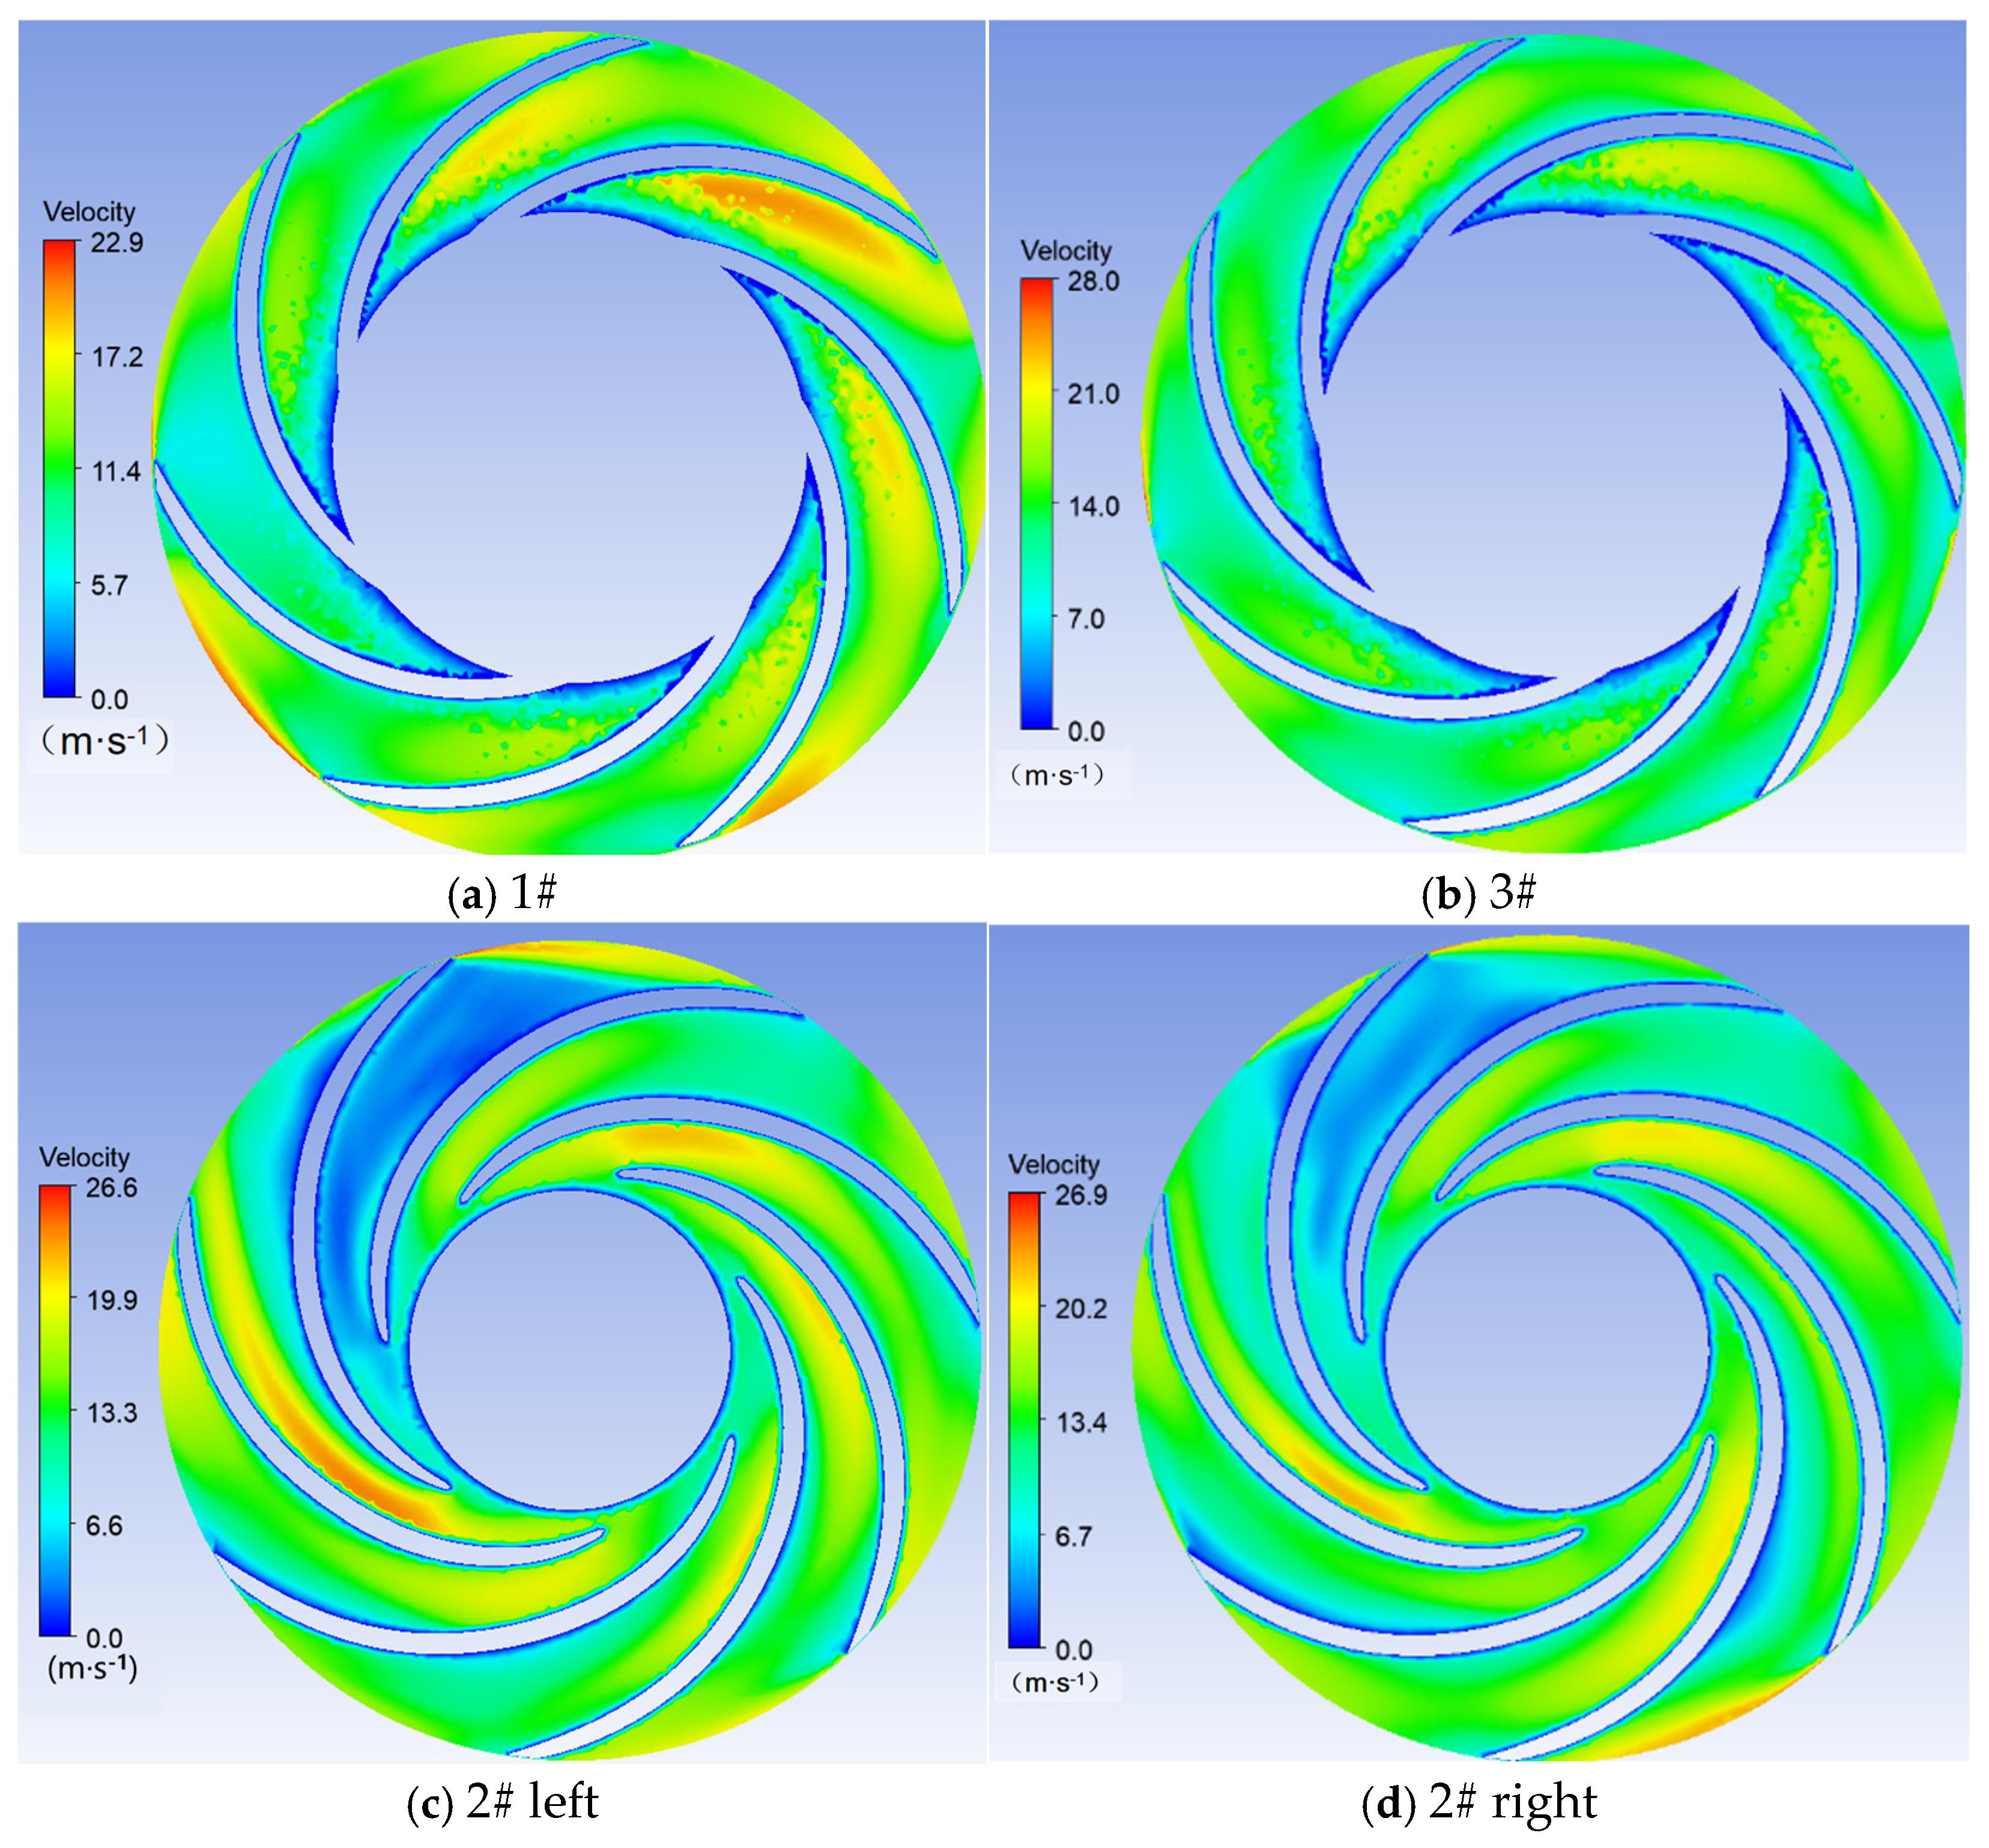
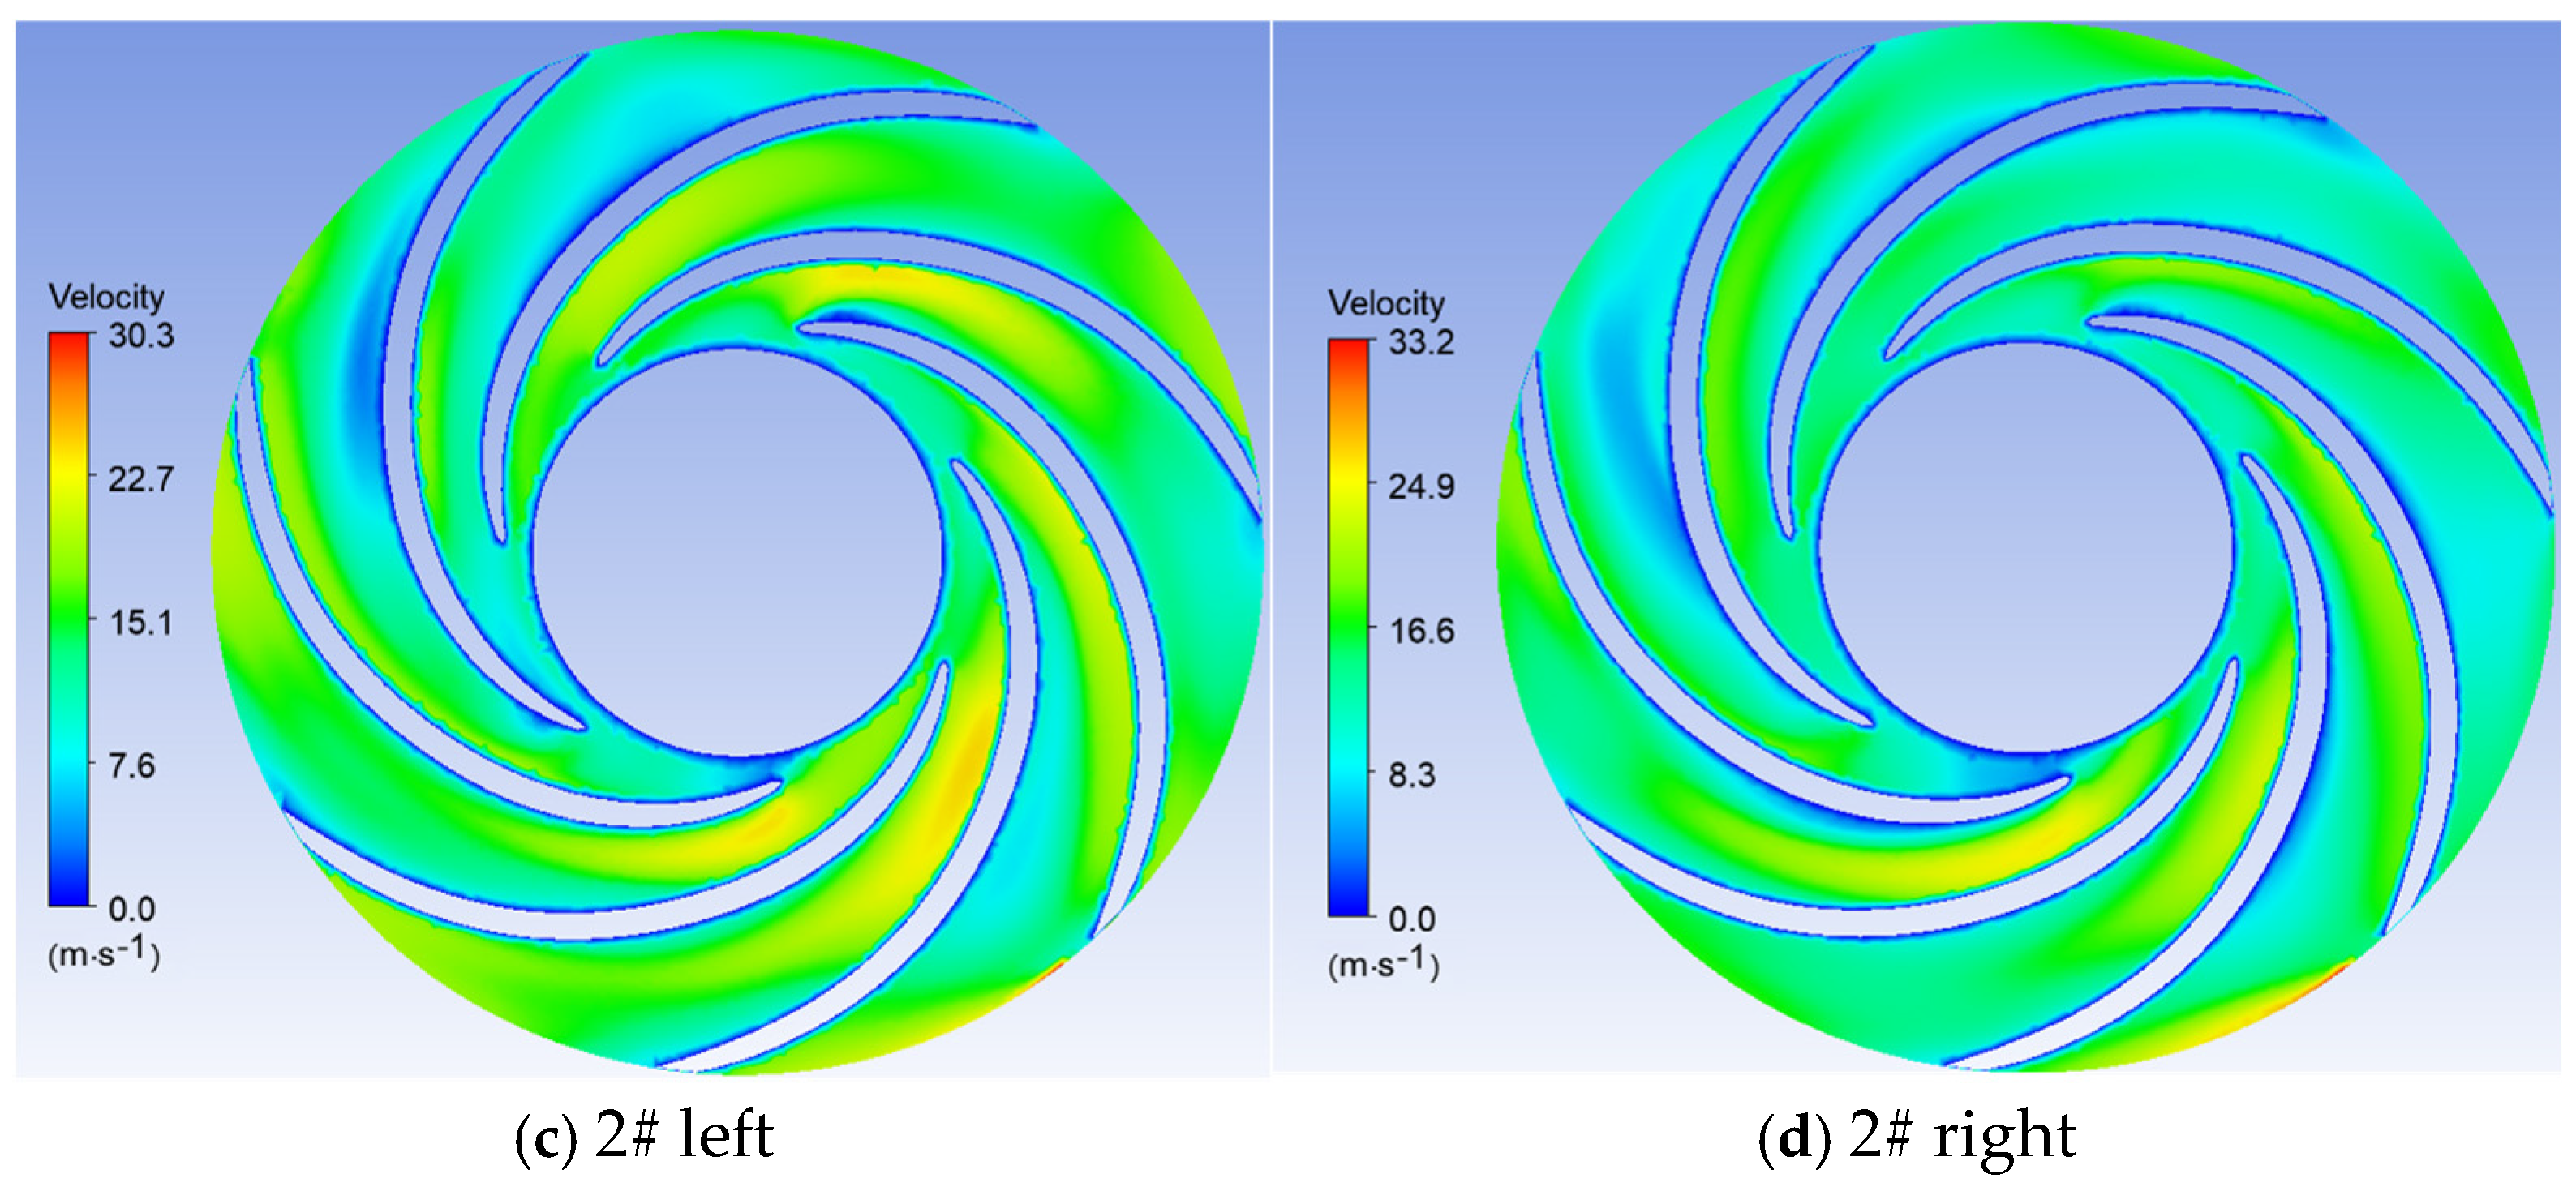
Figure 7 present the flow velocity distributions at the central cross-section of Impeller 1#, the central cross-sections on both sides of Impeller 2#, and the central cross-section of Impeller 3# under the operating condition of flow rate Q = 0.715 m3/s. At this flow rate, the velocity distributions within Impeller 1# and Impeller 3# of the respective units are highly uniform. However, the velocity distribution in Impeller 2# indicates the presence of a low-velocity zone with local recirculation. The flow velocity in Unit 1 is the lowest overall, with most values remaining below 30 m/s.
(2) Scheme II
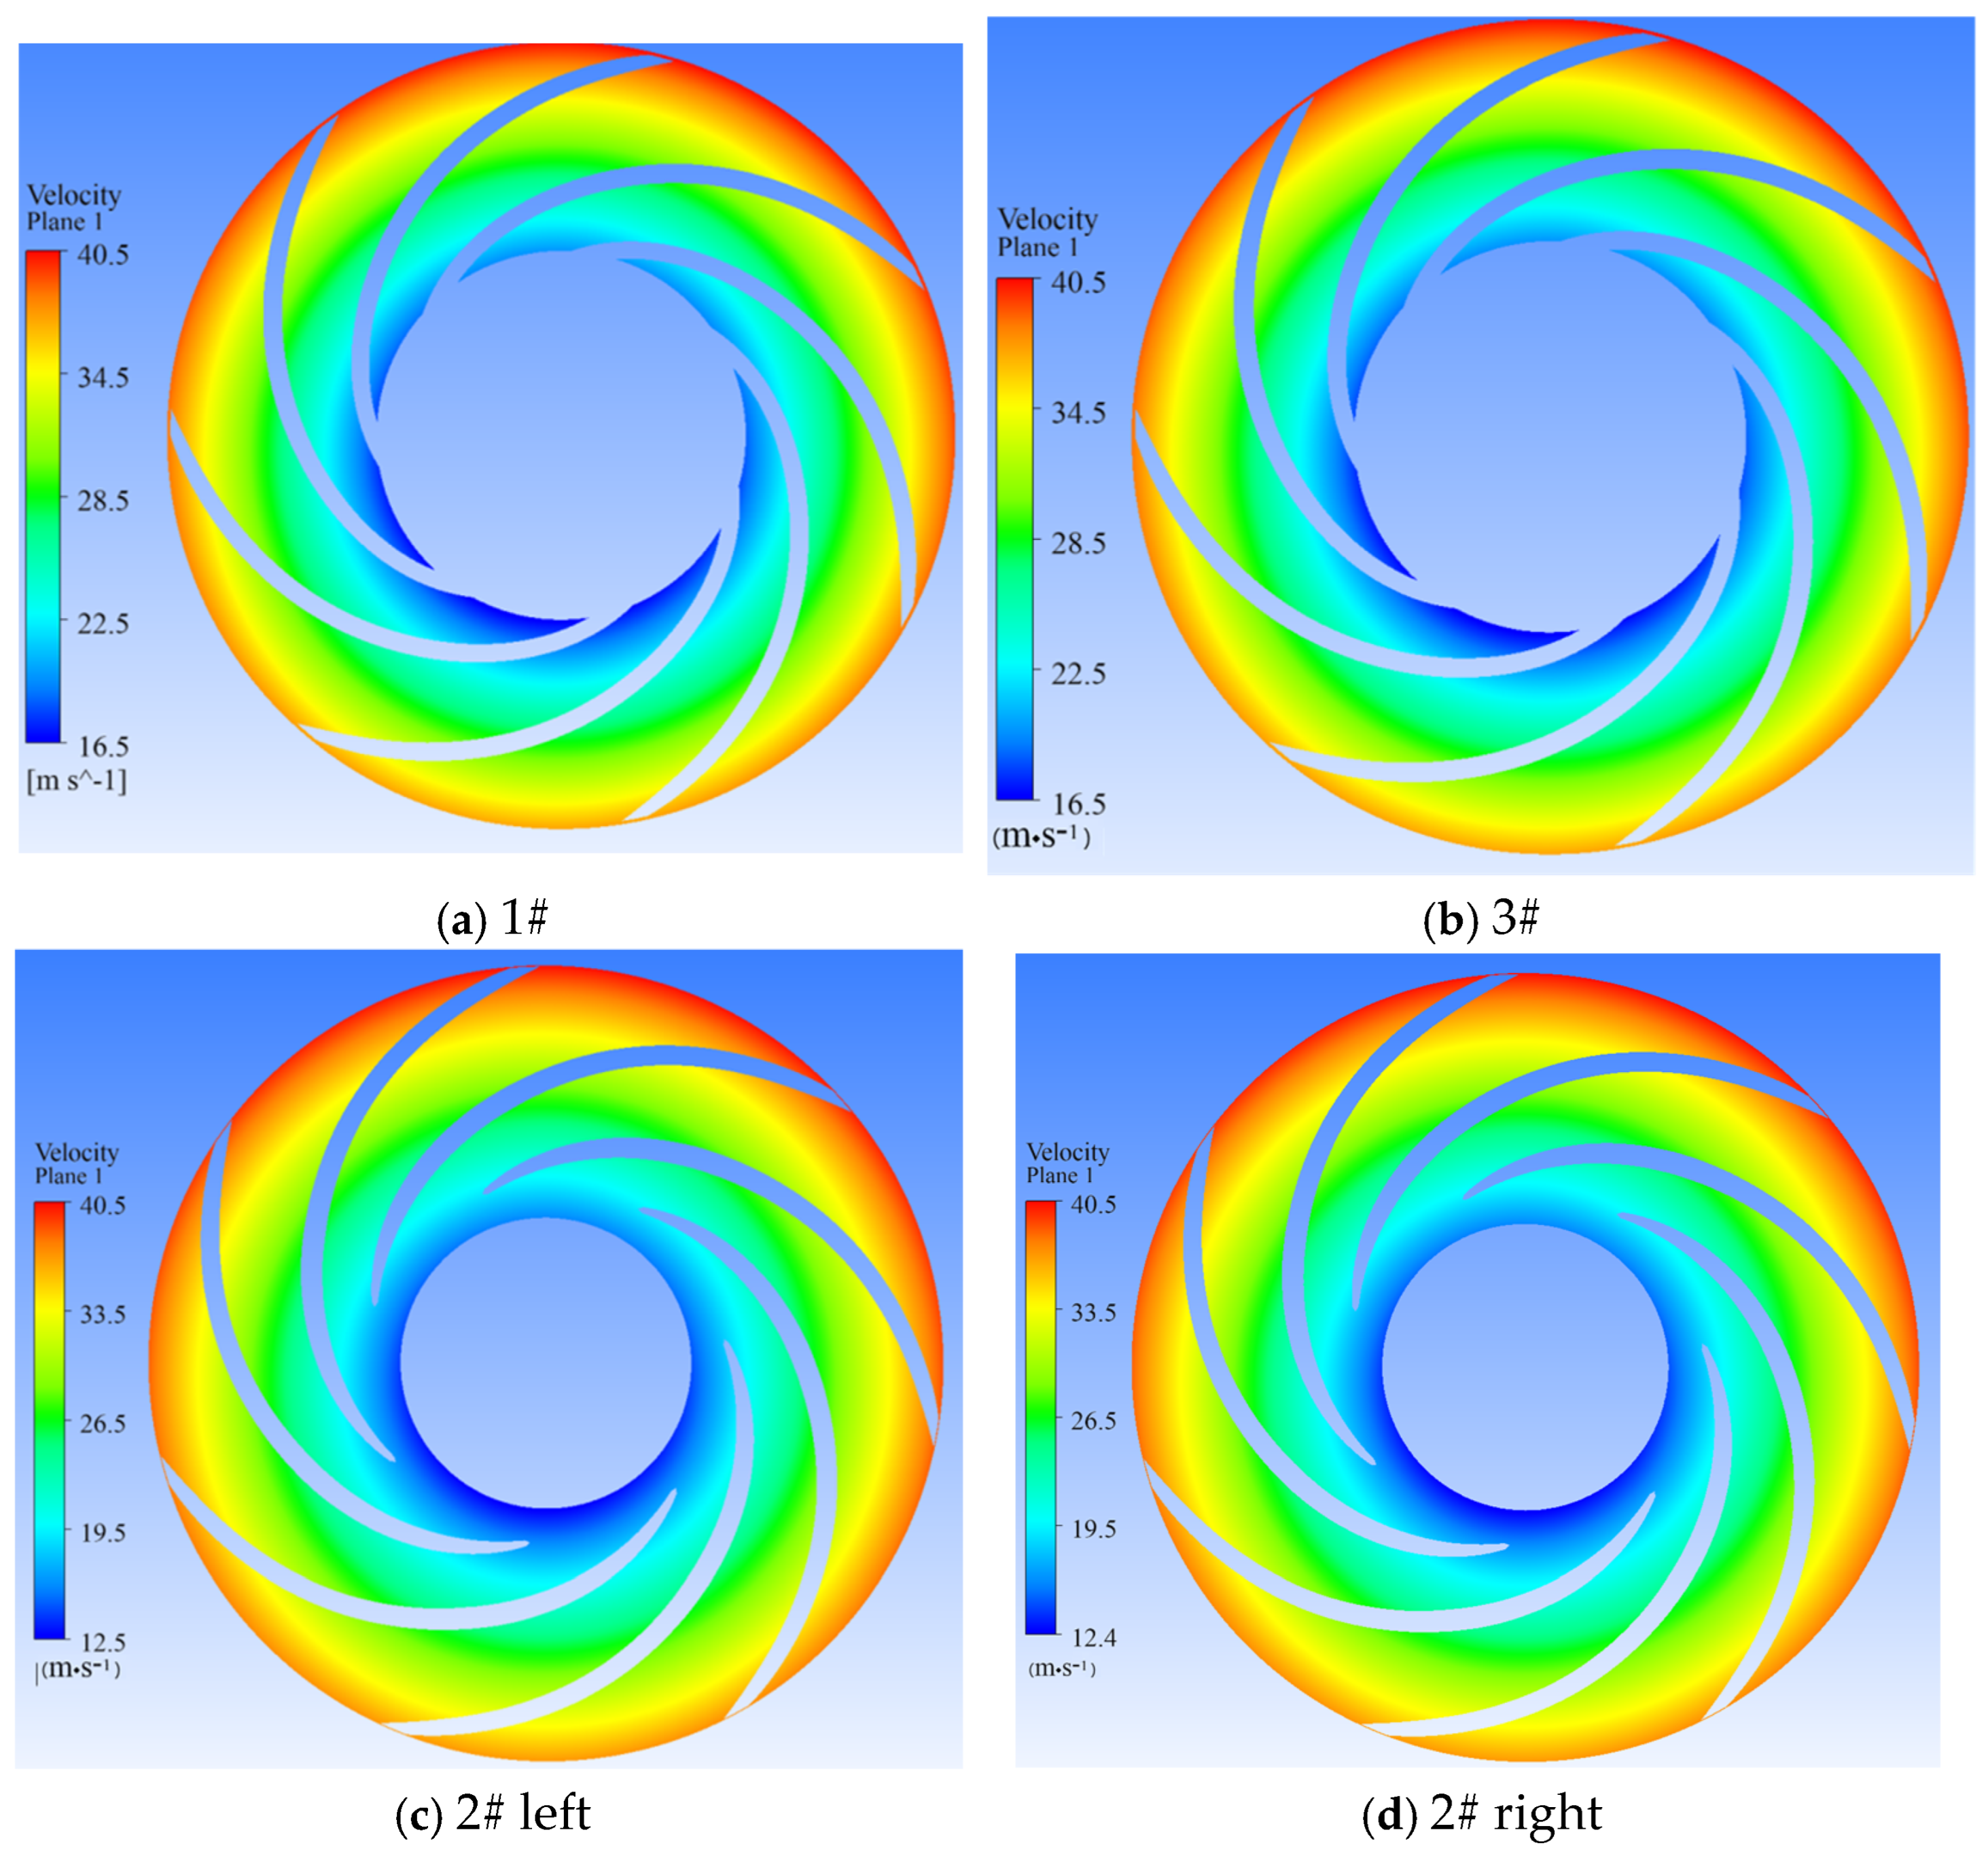
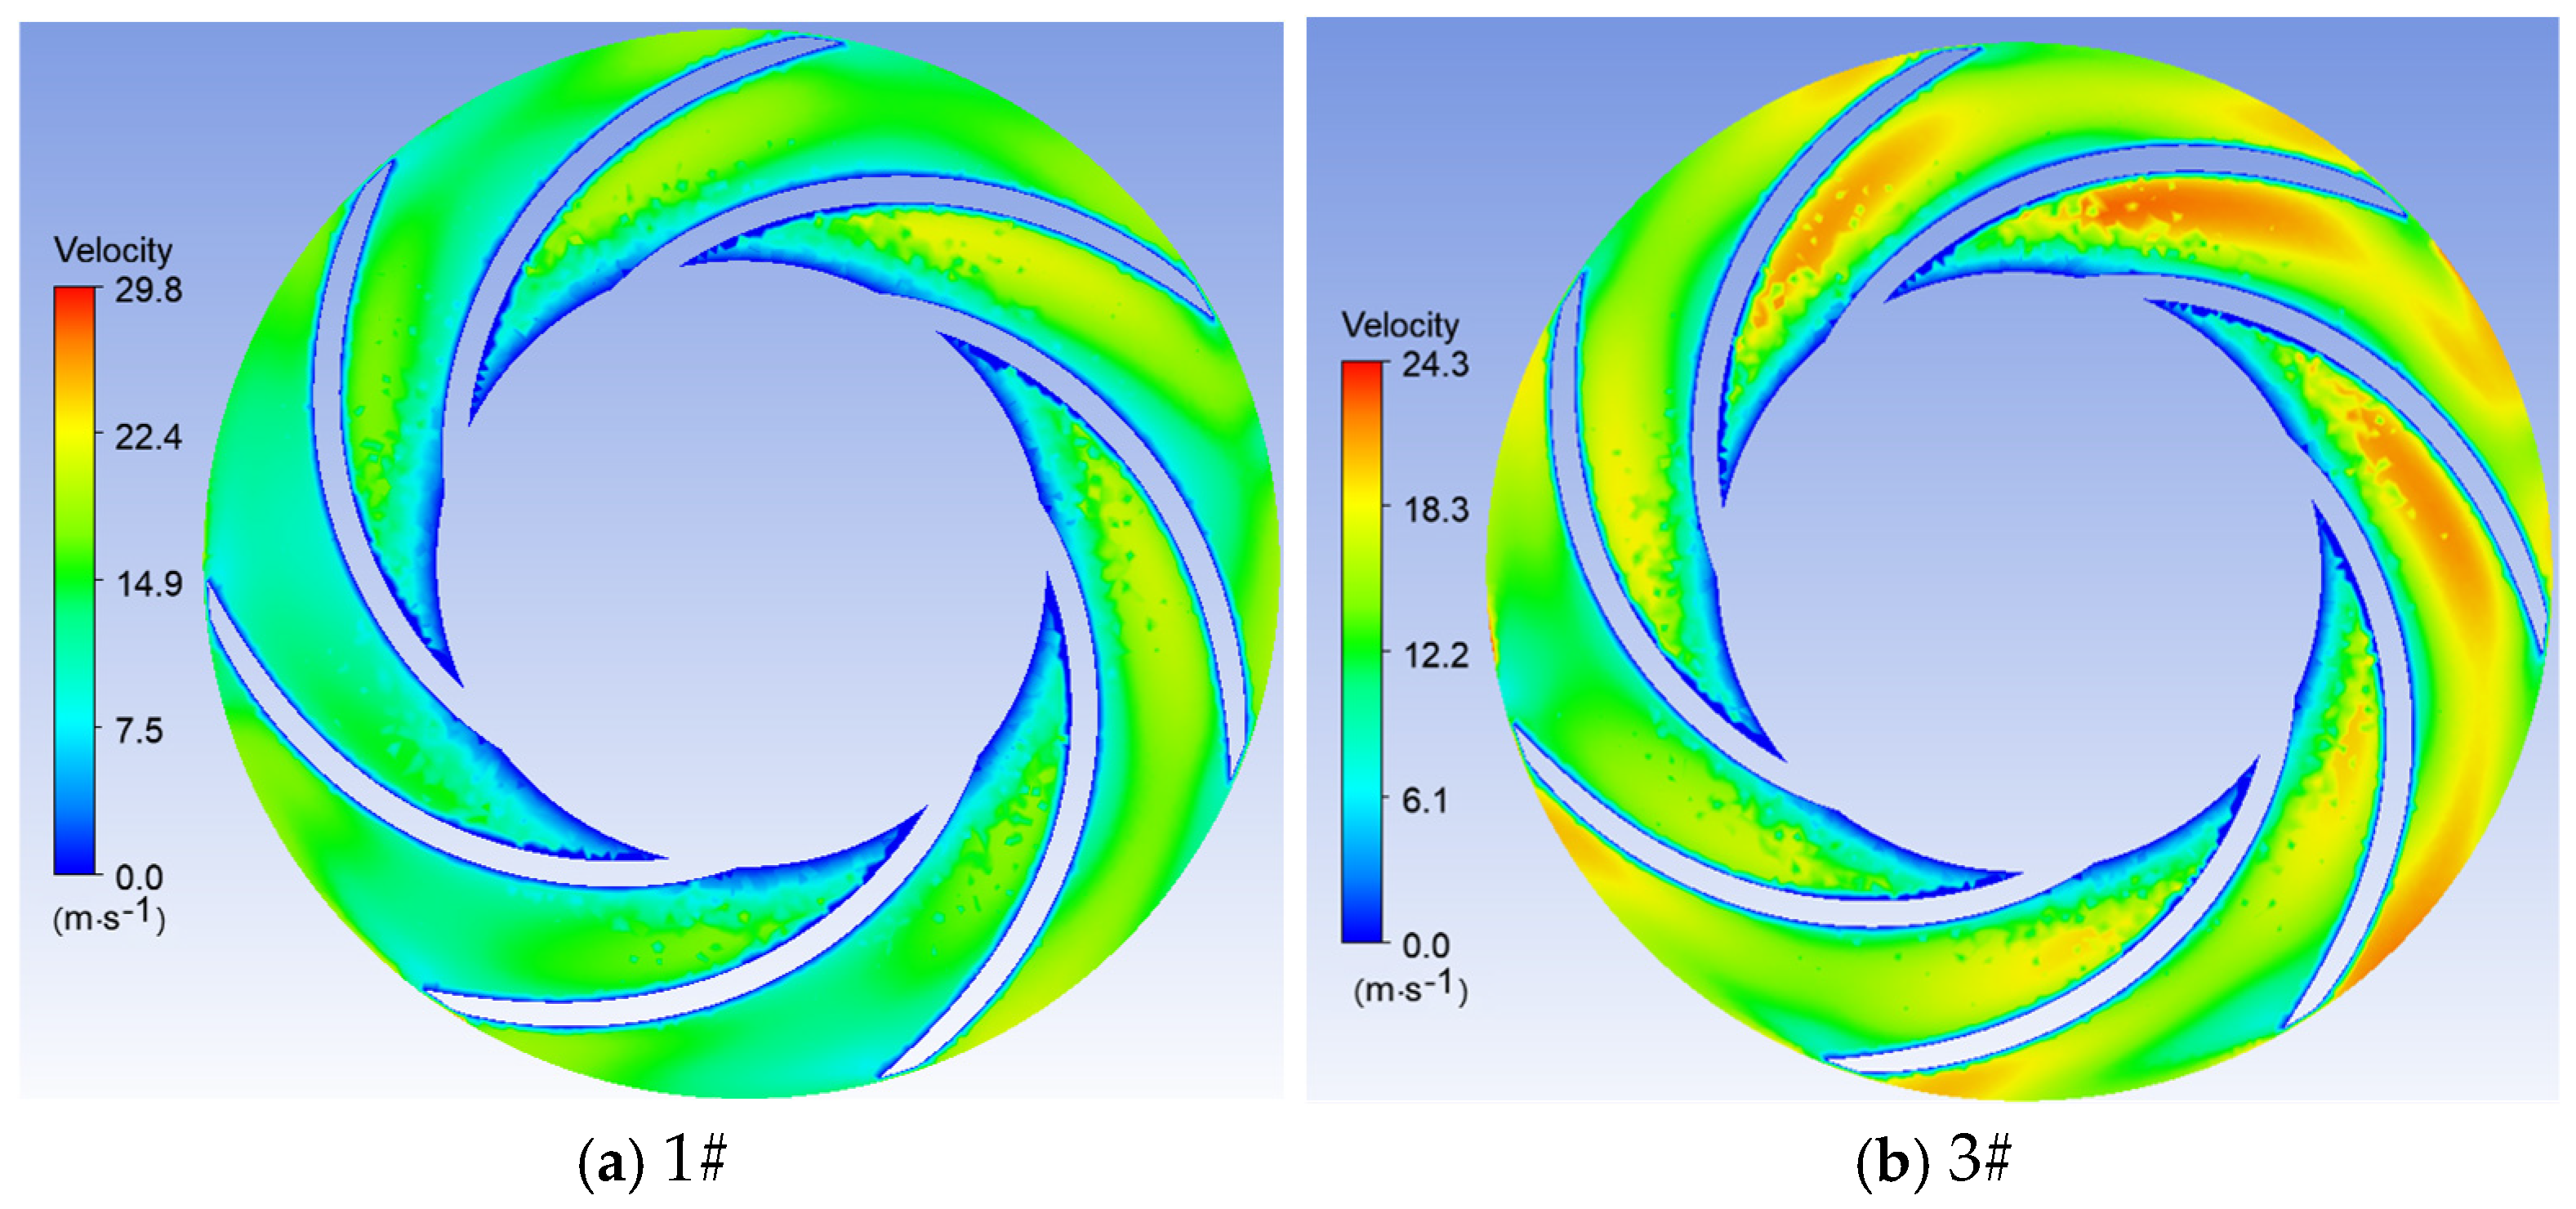
Figure 8 present the flow velocity distributions at the central cross-section of Impeller 1#, the central cross-sections on both sides of Impeller 2#, and the central cross-section of Impeller 3# under the rated flow rate condition of Q = 0.83 m3/s. At this flow rate, the velocity distributions within Impeller 1#, Impeller 2#, and Impeller 3# are highly uniform. The flow velocity in Unit 3 is the lowest, with all values remaining below 28 m/s. When the staggered angle increases to 10.57°, the primary reason for the reduction in relative flow velocity within the impeller is the elongation of the fluid’s flow path due to blade misalignment. As the fluid passes through the impeller, it must flow around each blade, and the staggered blade arrangement results in more complex flow patterns inside the impeller. Since the fluid is required to circumvent the blades, regions with relatively lower flow velocity increase, leading to an overall reduction in relative flow velocity within the impeller. Furthermore, the increase in blade staggered angle also promotes better flow distribution, which consequently minimizes energy losses and sediment erosion while contributing to enhanced operational reliability.
(3) Scheme III
Figure 9 present the flow velocity distributions at the central cross-section of Impeller 1#, the central cross-sections on both sides of Impeller 2#, and the central cross-section of Impeller 3# under the operating condition with flow rate Q = 0.92 m3/s. At this flow rate, the velocity distributions within the impellers of both Unit 1 and Unit 3 exhibit improved uniformity, while that of Unit 2 remains approximately 33 m/s. The lowest flow velocities are observed in the impellers of Unit 1 and Unit 2, with all values generally below 24 m/s.
In Scheme III, when the staggered blade angle on both sides of the centrifugal pump increases to 26.57°, the further reduction in relative flow velocity within the impeller is primarily attributed to the more complex and tortuous flow path of the fluid caused by enhanced blade misalignment. The increased staggered angle forces the fluid to bypass more blades as it passes through the impeller, resulting in a longer flow path and the generation of additional vortices and turbulence. This intricate flow pattern leads to a further decrease in the relative flow velocity within the impeller. The reduction in relative velocity helps mitigate fluid impact forces and pressure fluctuations, thereby further enhancing the efficiency and performance of the centrifugal pump. Moreover, the larger staggered blade angle improves flow distribution between the impeller and the pump volute, reducing energy losses and sediment erosion. It is important to note that the selection of the specific staggered blade angle should be comprehensively considered based on actual conditions and design requirements. For practical applications, it is recommended to refer to professional engineering design guidelines or consult experts in the field to obtain more accurate and detailed information.

3.3. Effect of Blade Symmetry Angle on Sediment Erosion

(1) Scheme I
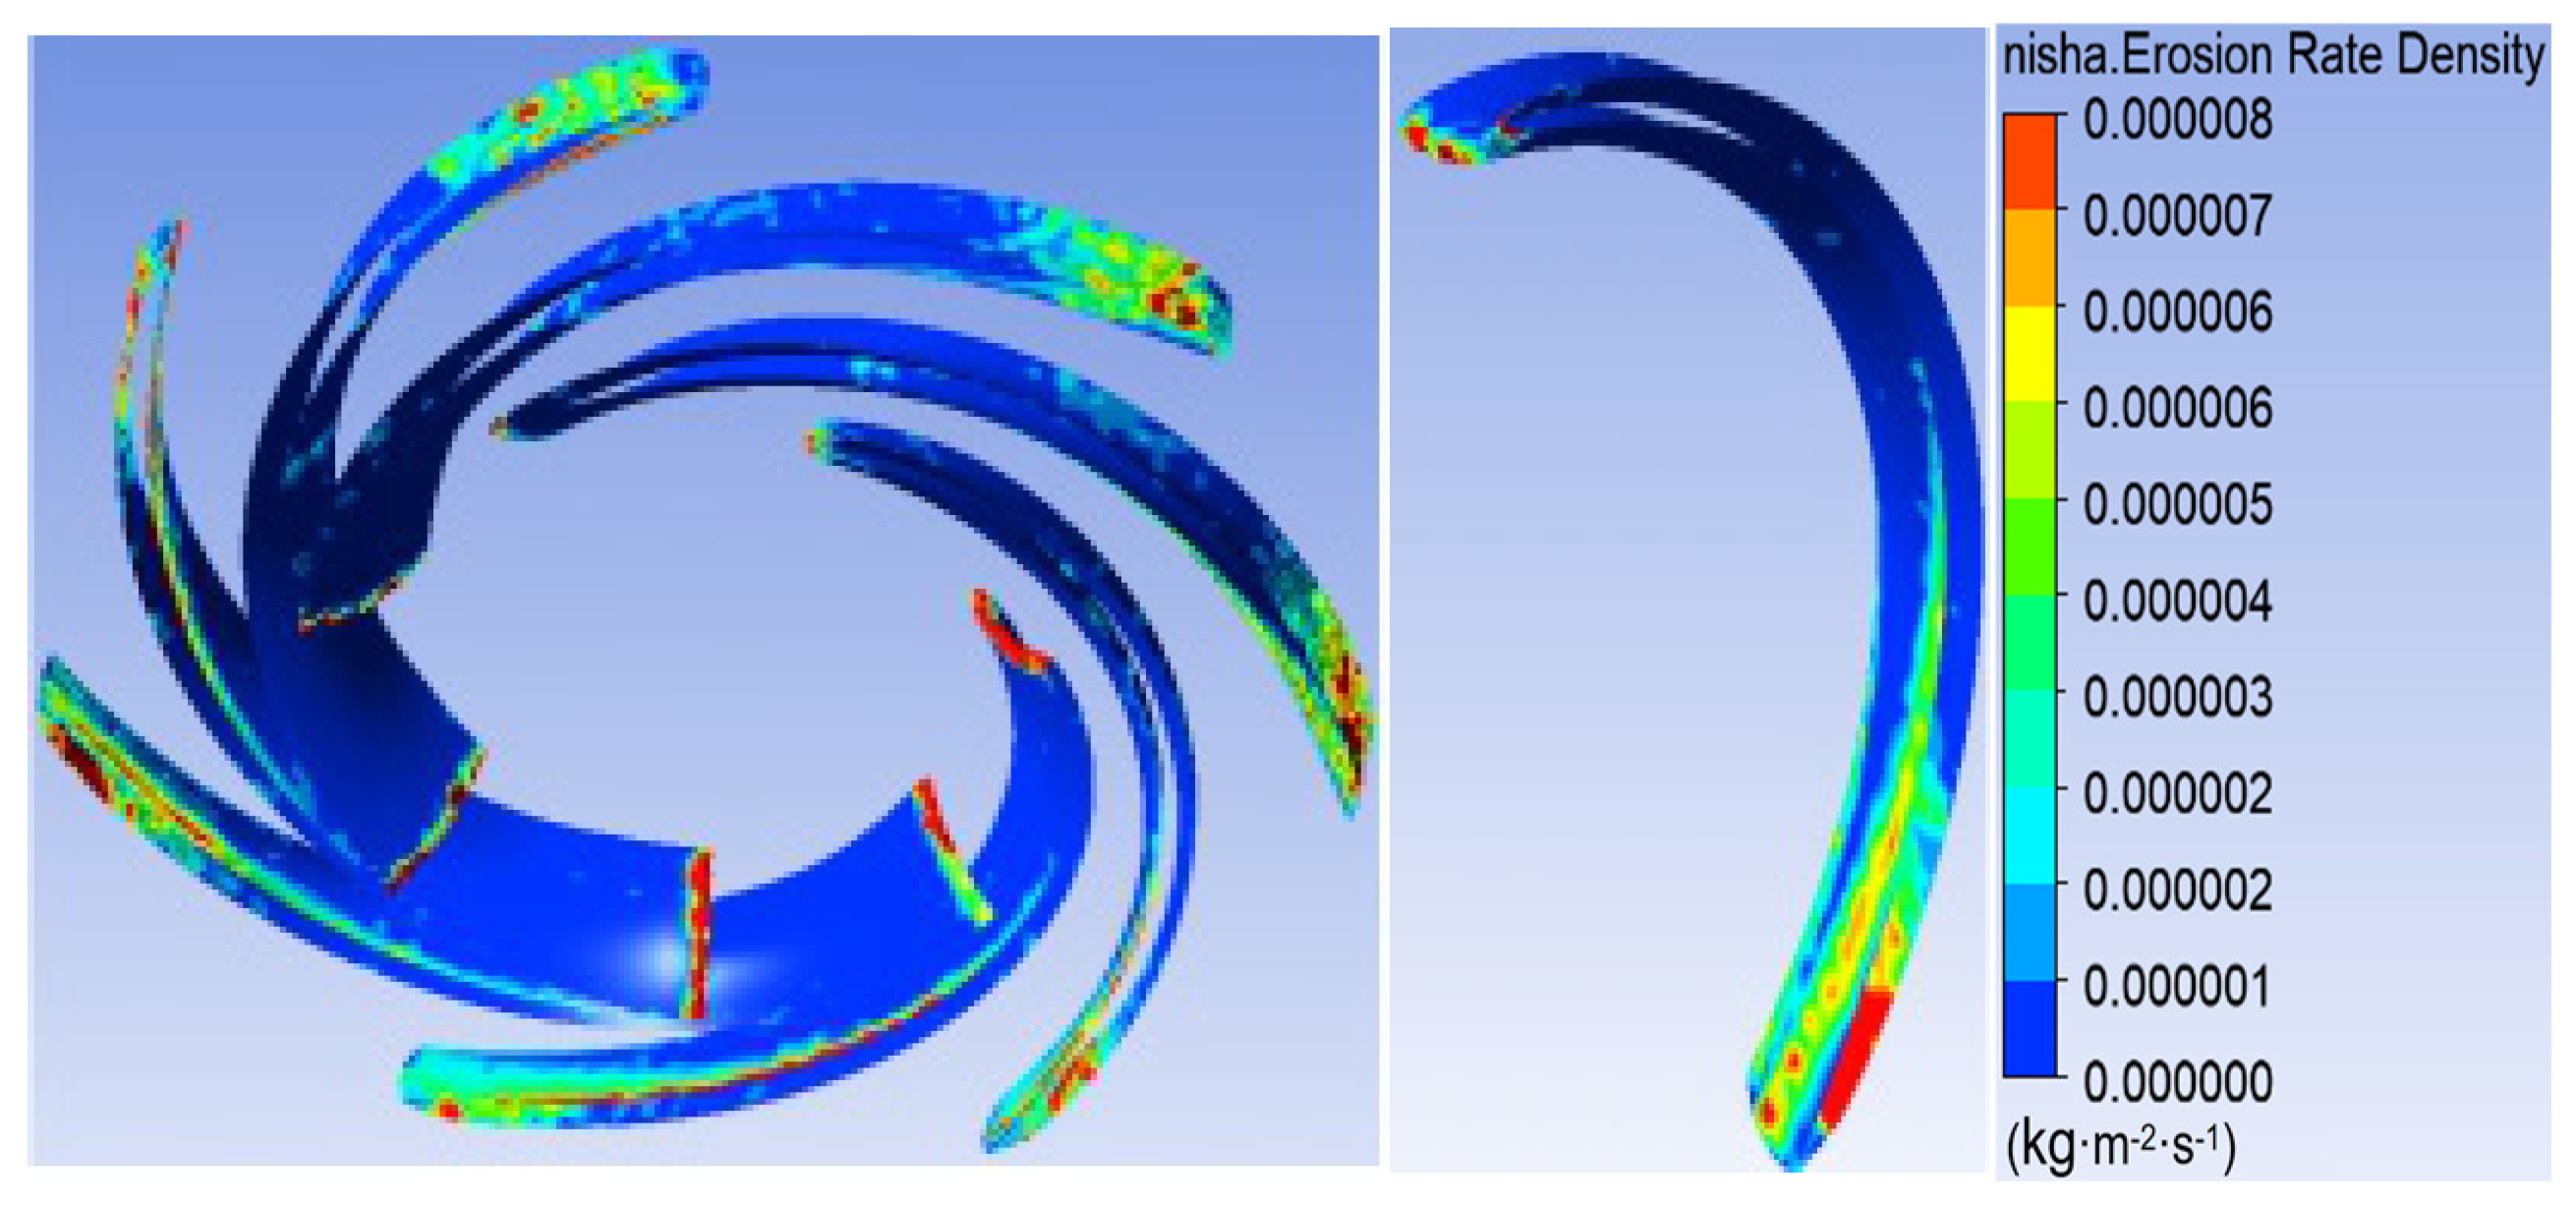
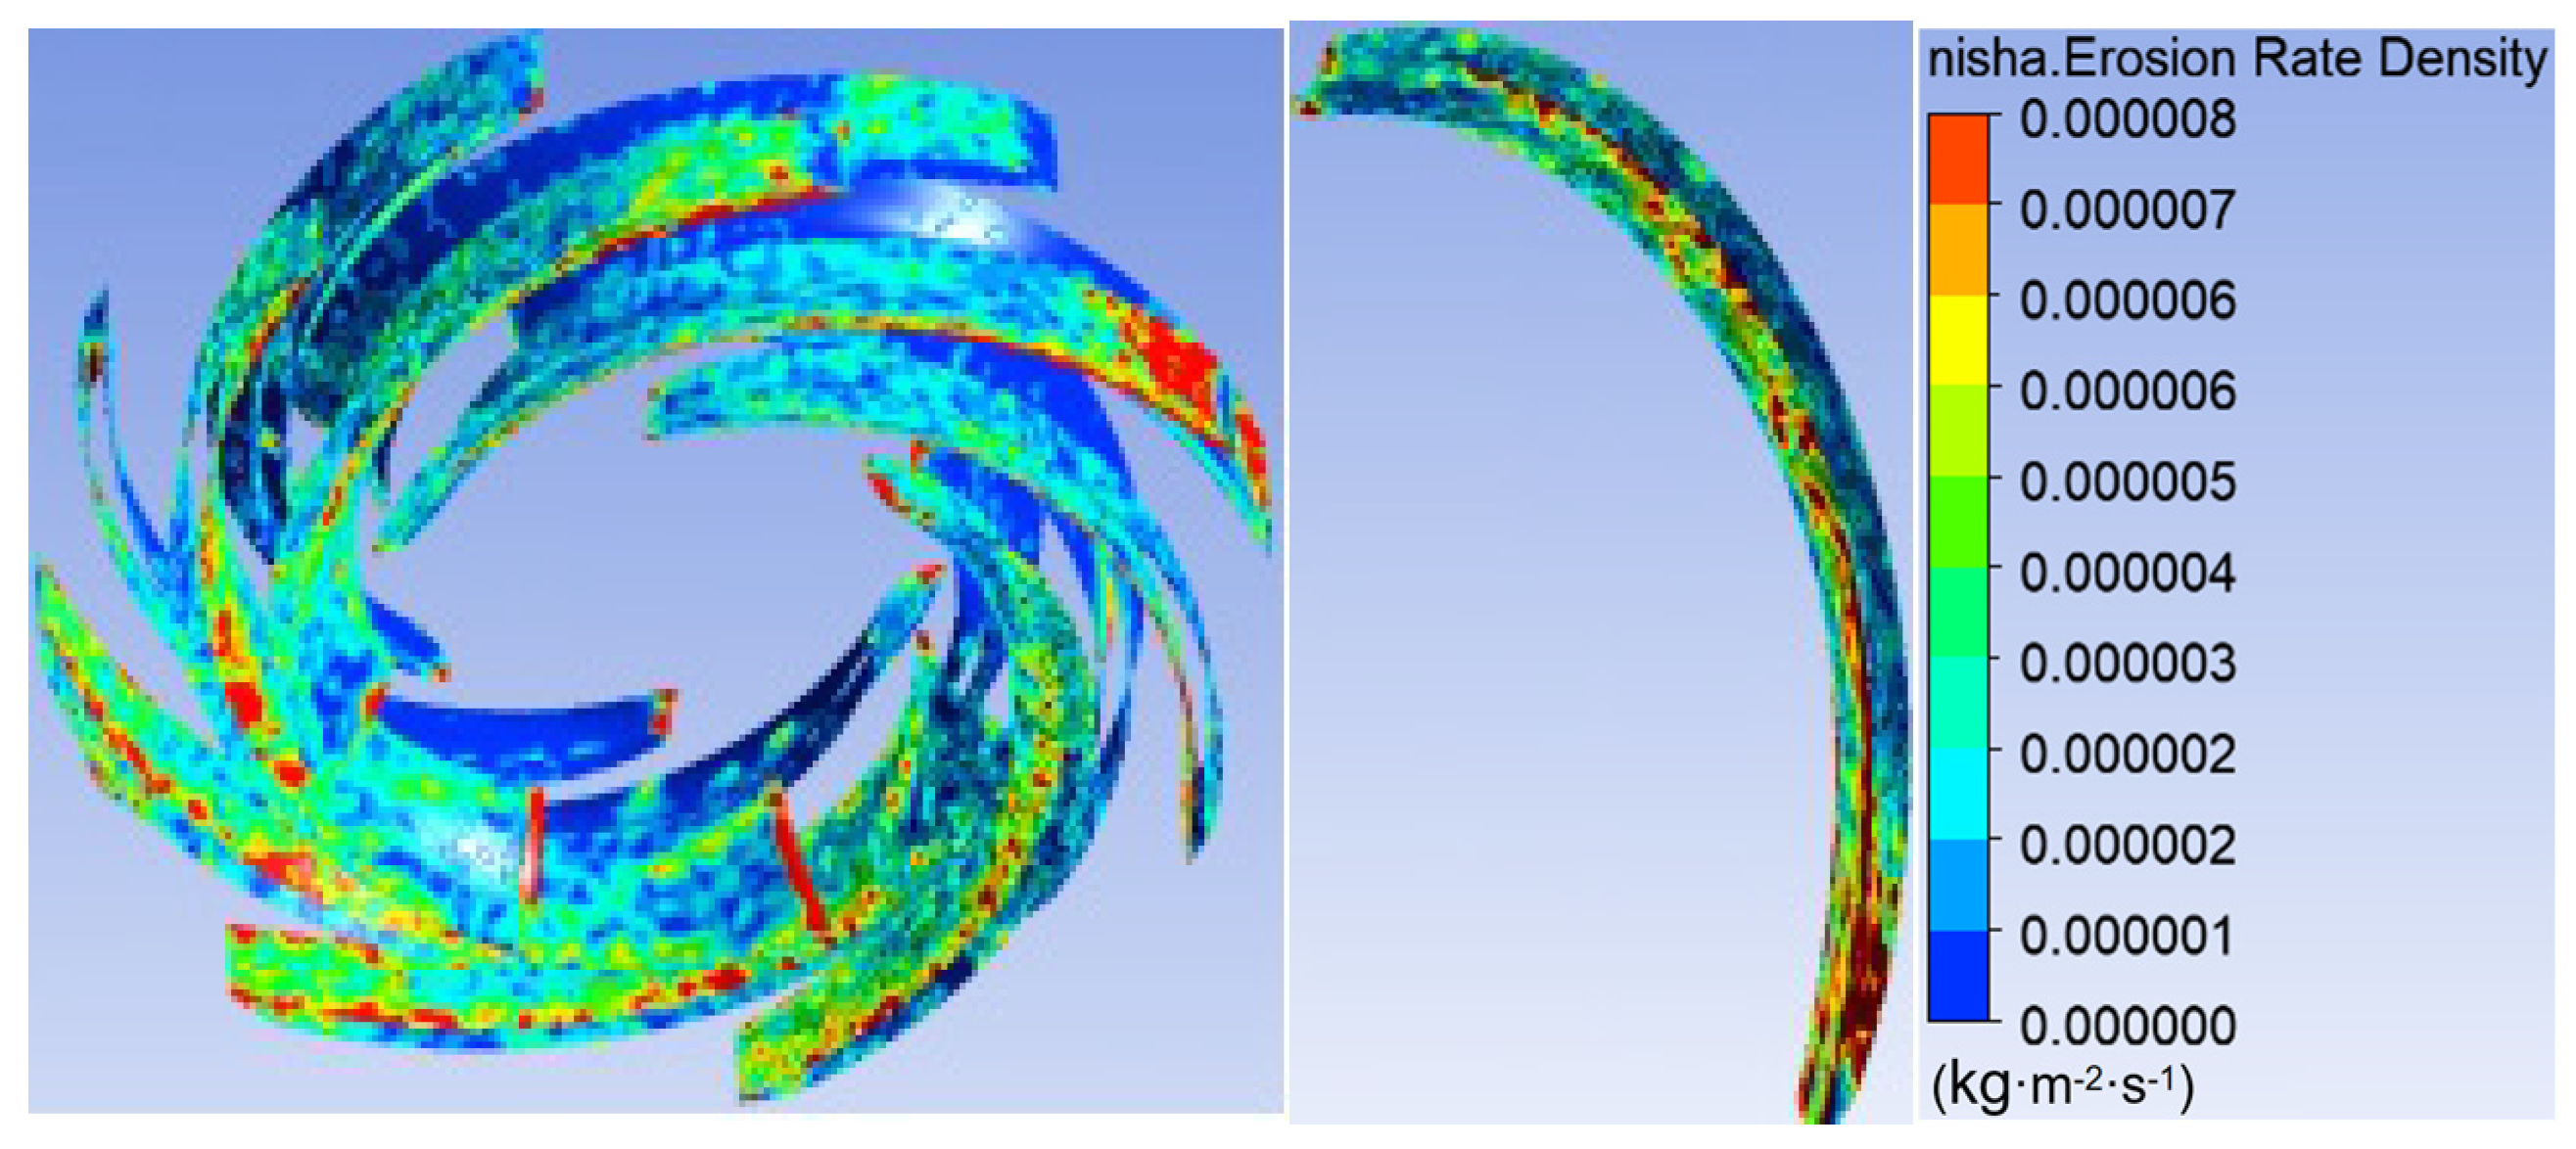
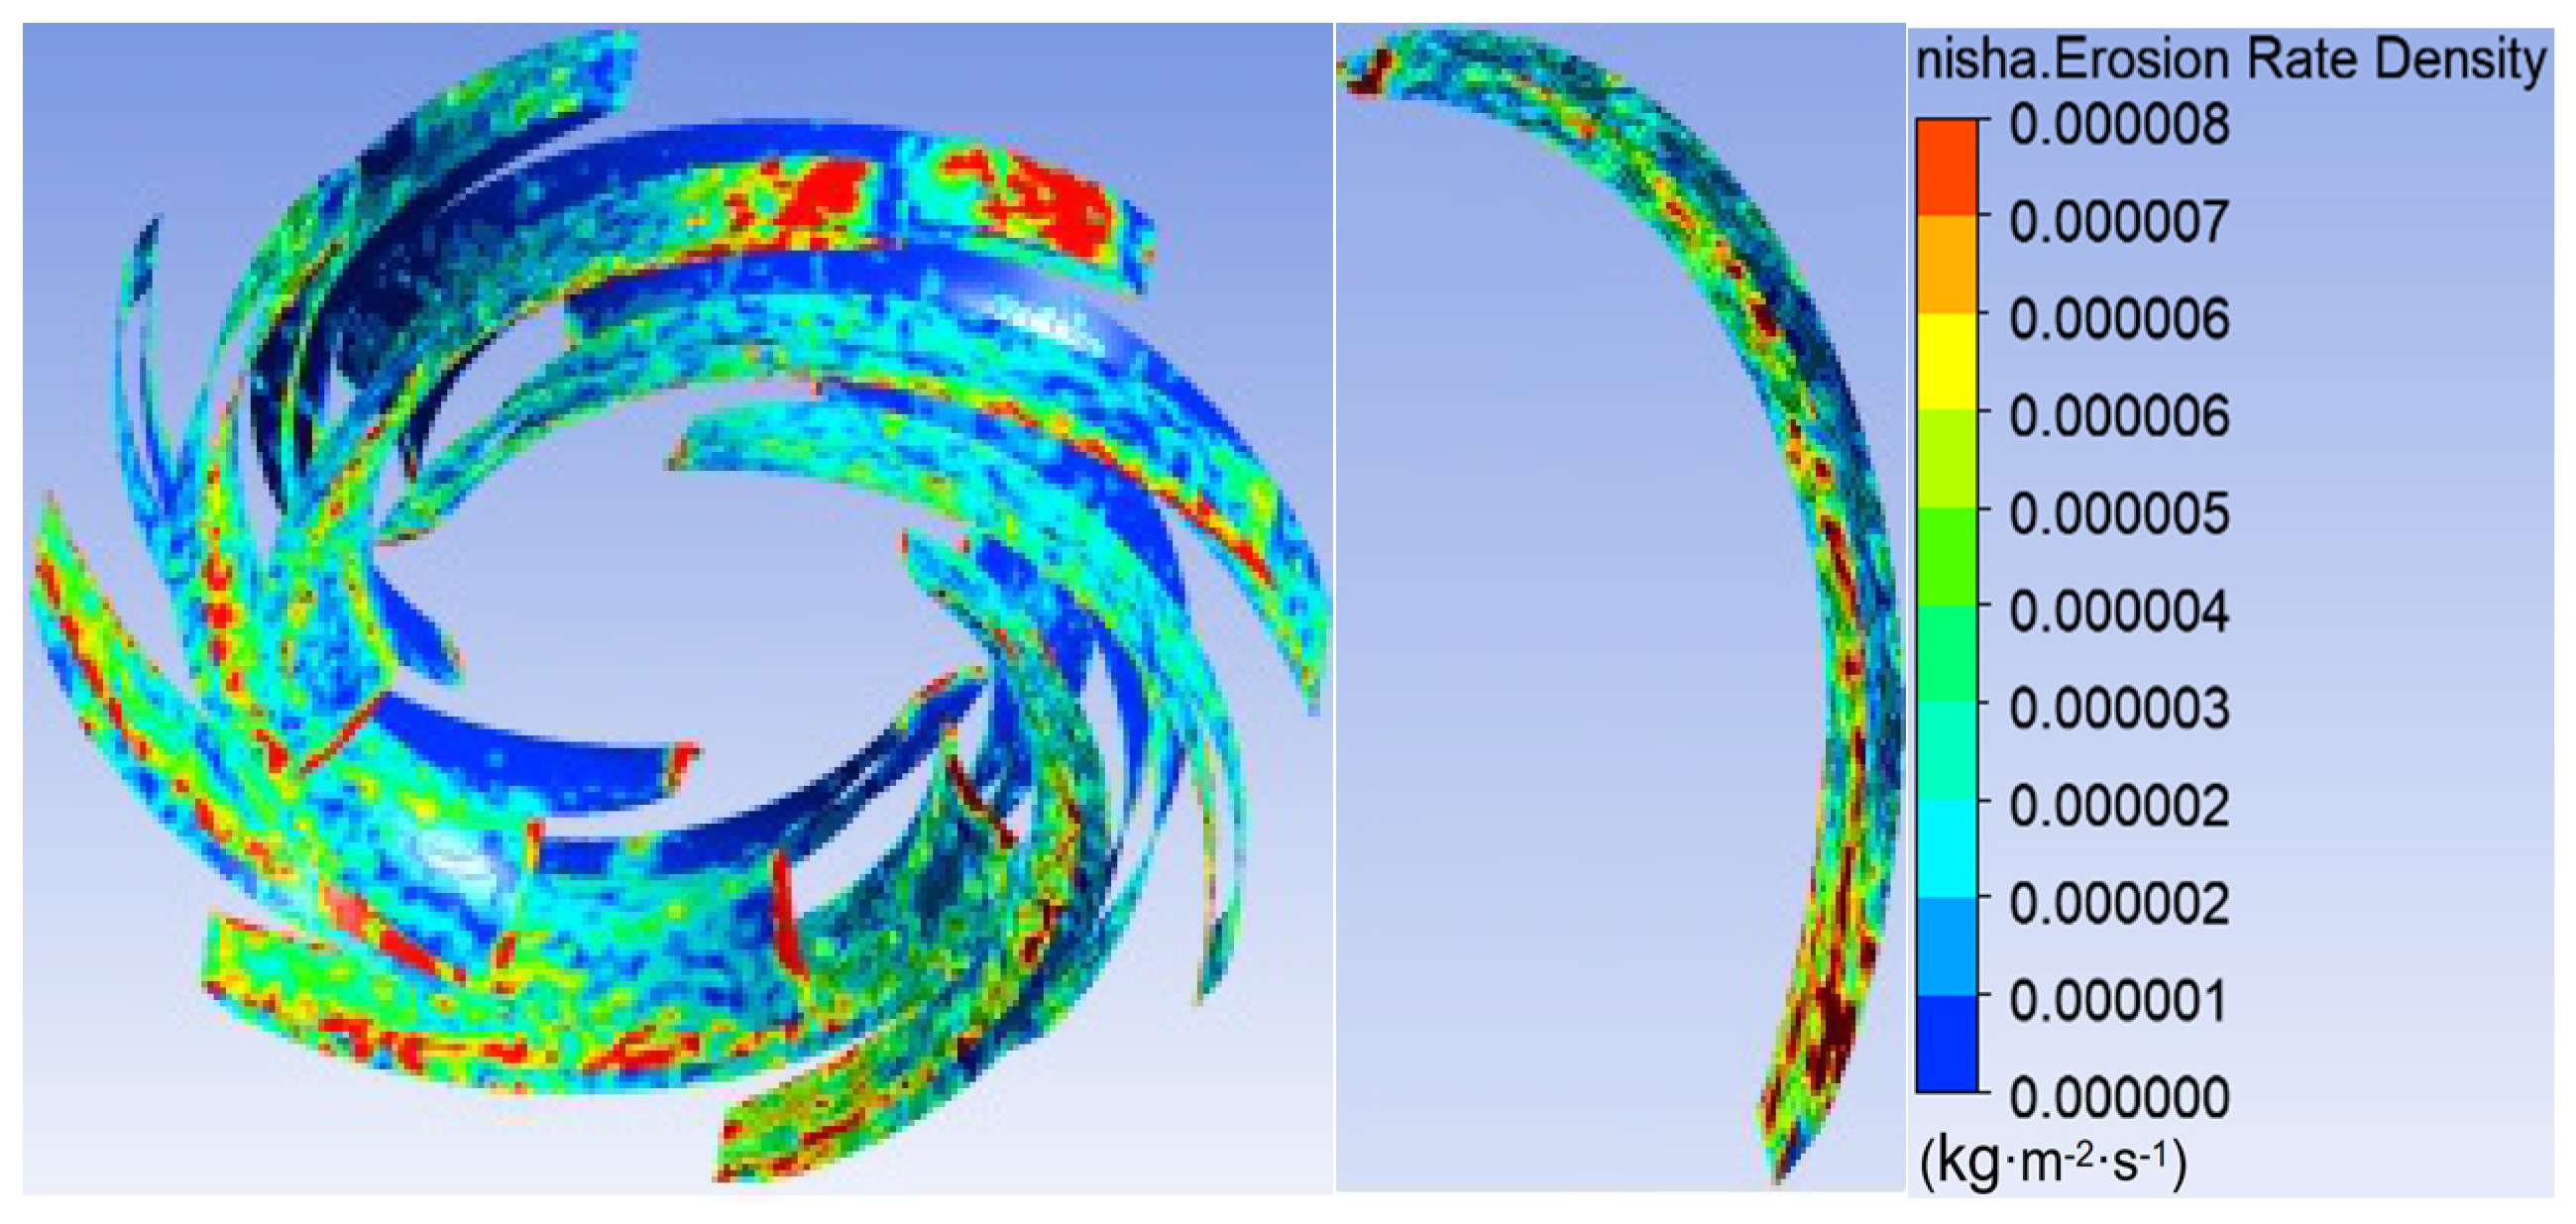
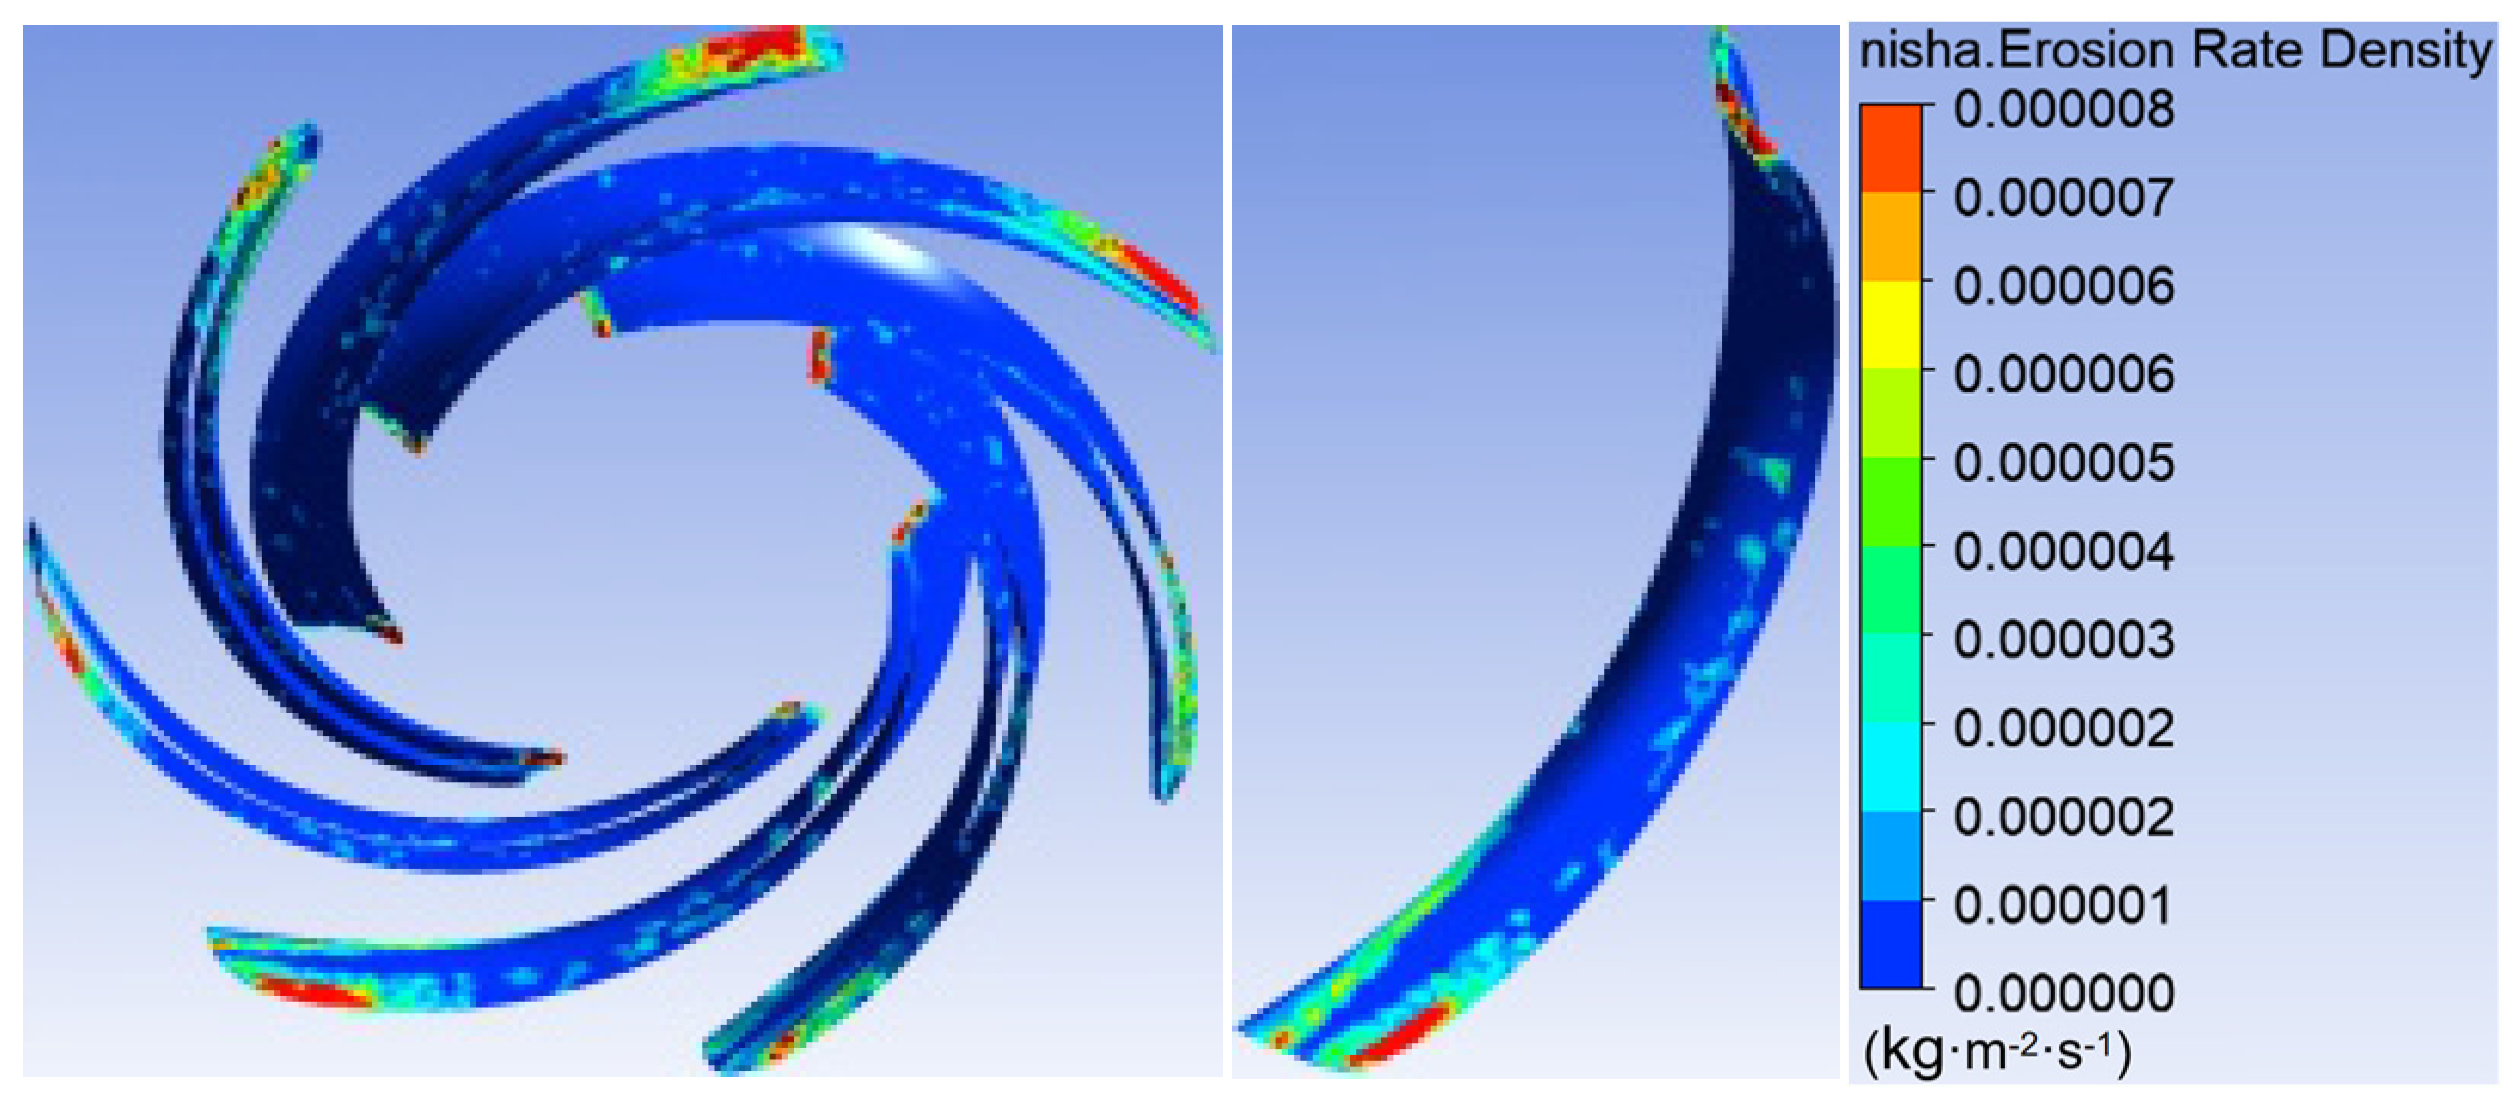
Figure 10, Figure 11 and Figure 12 show the blade sediment erosion rate distribution of Impeller 1#, Impeller 2#, and Impeller 3# under the flow rate condition of Q = 0.715 m3/s. Across different flow conditions, the sediment erosion on the impeller blades is most severe in Unit 2 and least in Unit 1. Sediment erosion is primarily concentrated at the blade inlet and outlet. The sediment erosion pattern at the blade inlet indicates that the main sediment erosion mechanism is impact sediment erosion, extending approximately 5–10 mm along the blade direction. The sediment erosion at the blade outlet is predominantly abrasive sediment erosion, distributed on the blade pressure side within a length of about 15 mm. Slight abrasive sediment erosion is also observed on the suction side near the outlet, as well as minor abrasive sediment erosion features in other areas of the blade.
For centrifugal pumps, a blade staggered angle of 0° means the blades are arranged on the same plane without misalignment. This configuration leads to uneven flow between the impeller and the pump volute, resulting in reduced unit performance. Additionally, due to the absence of blade staggering, the blades on one side are more exposed to sediment particles, making them more susceptible to sediment erosion and damage.
(2) Scheme II
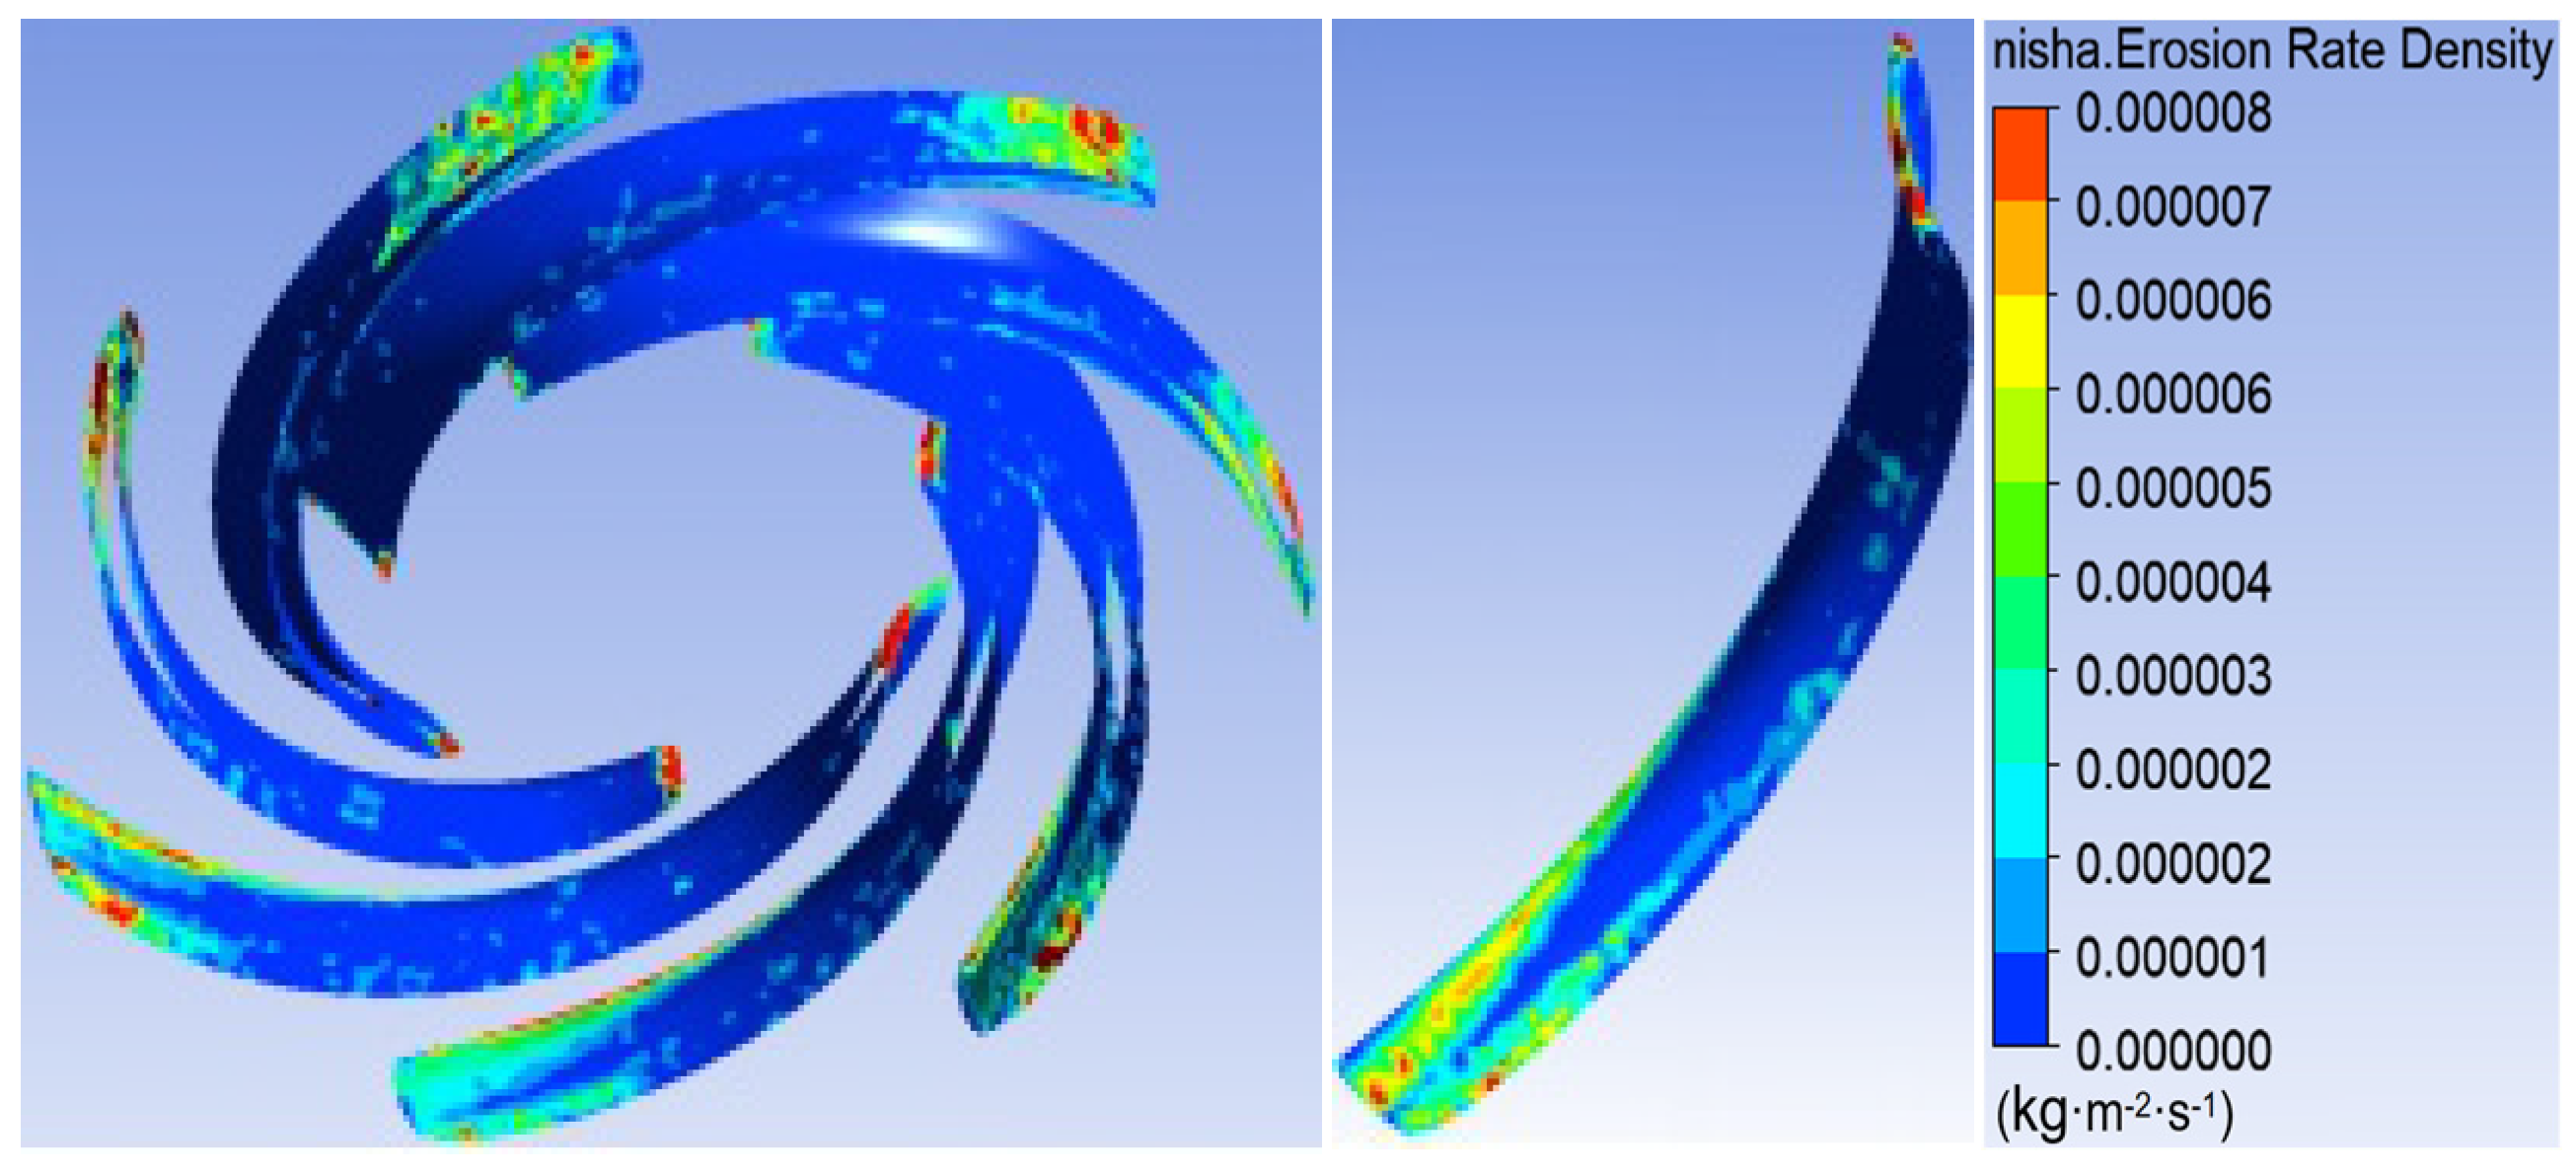
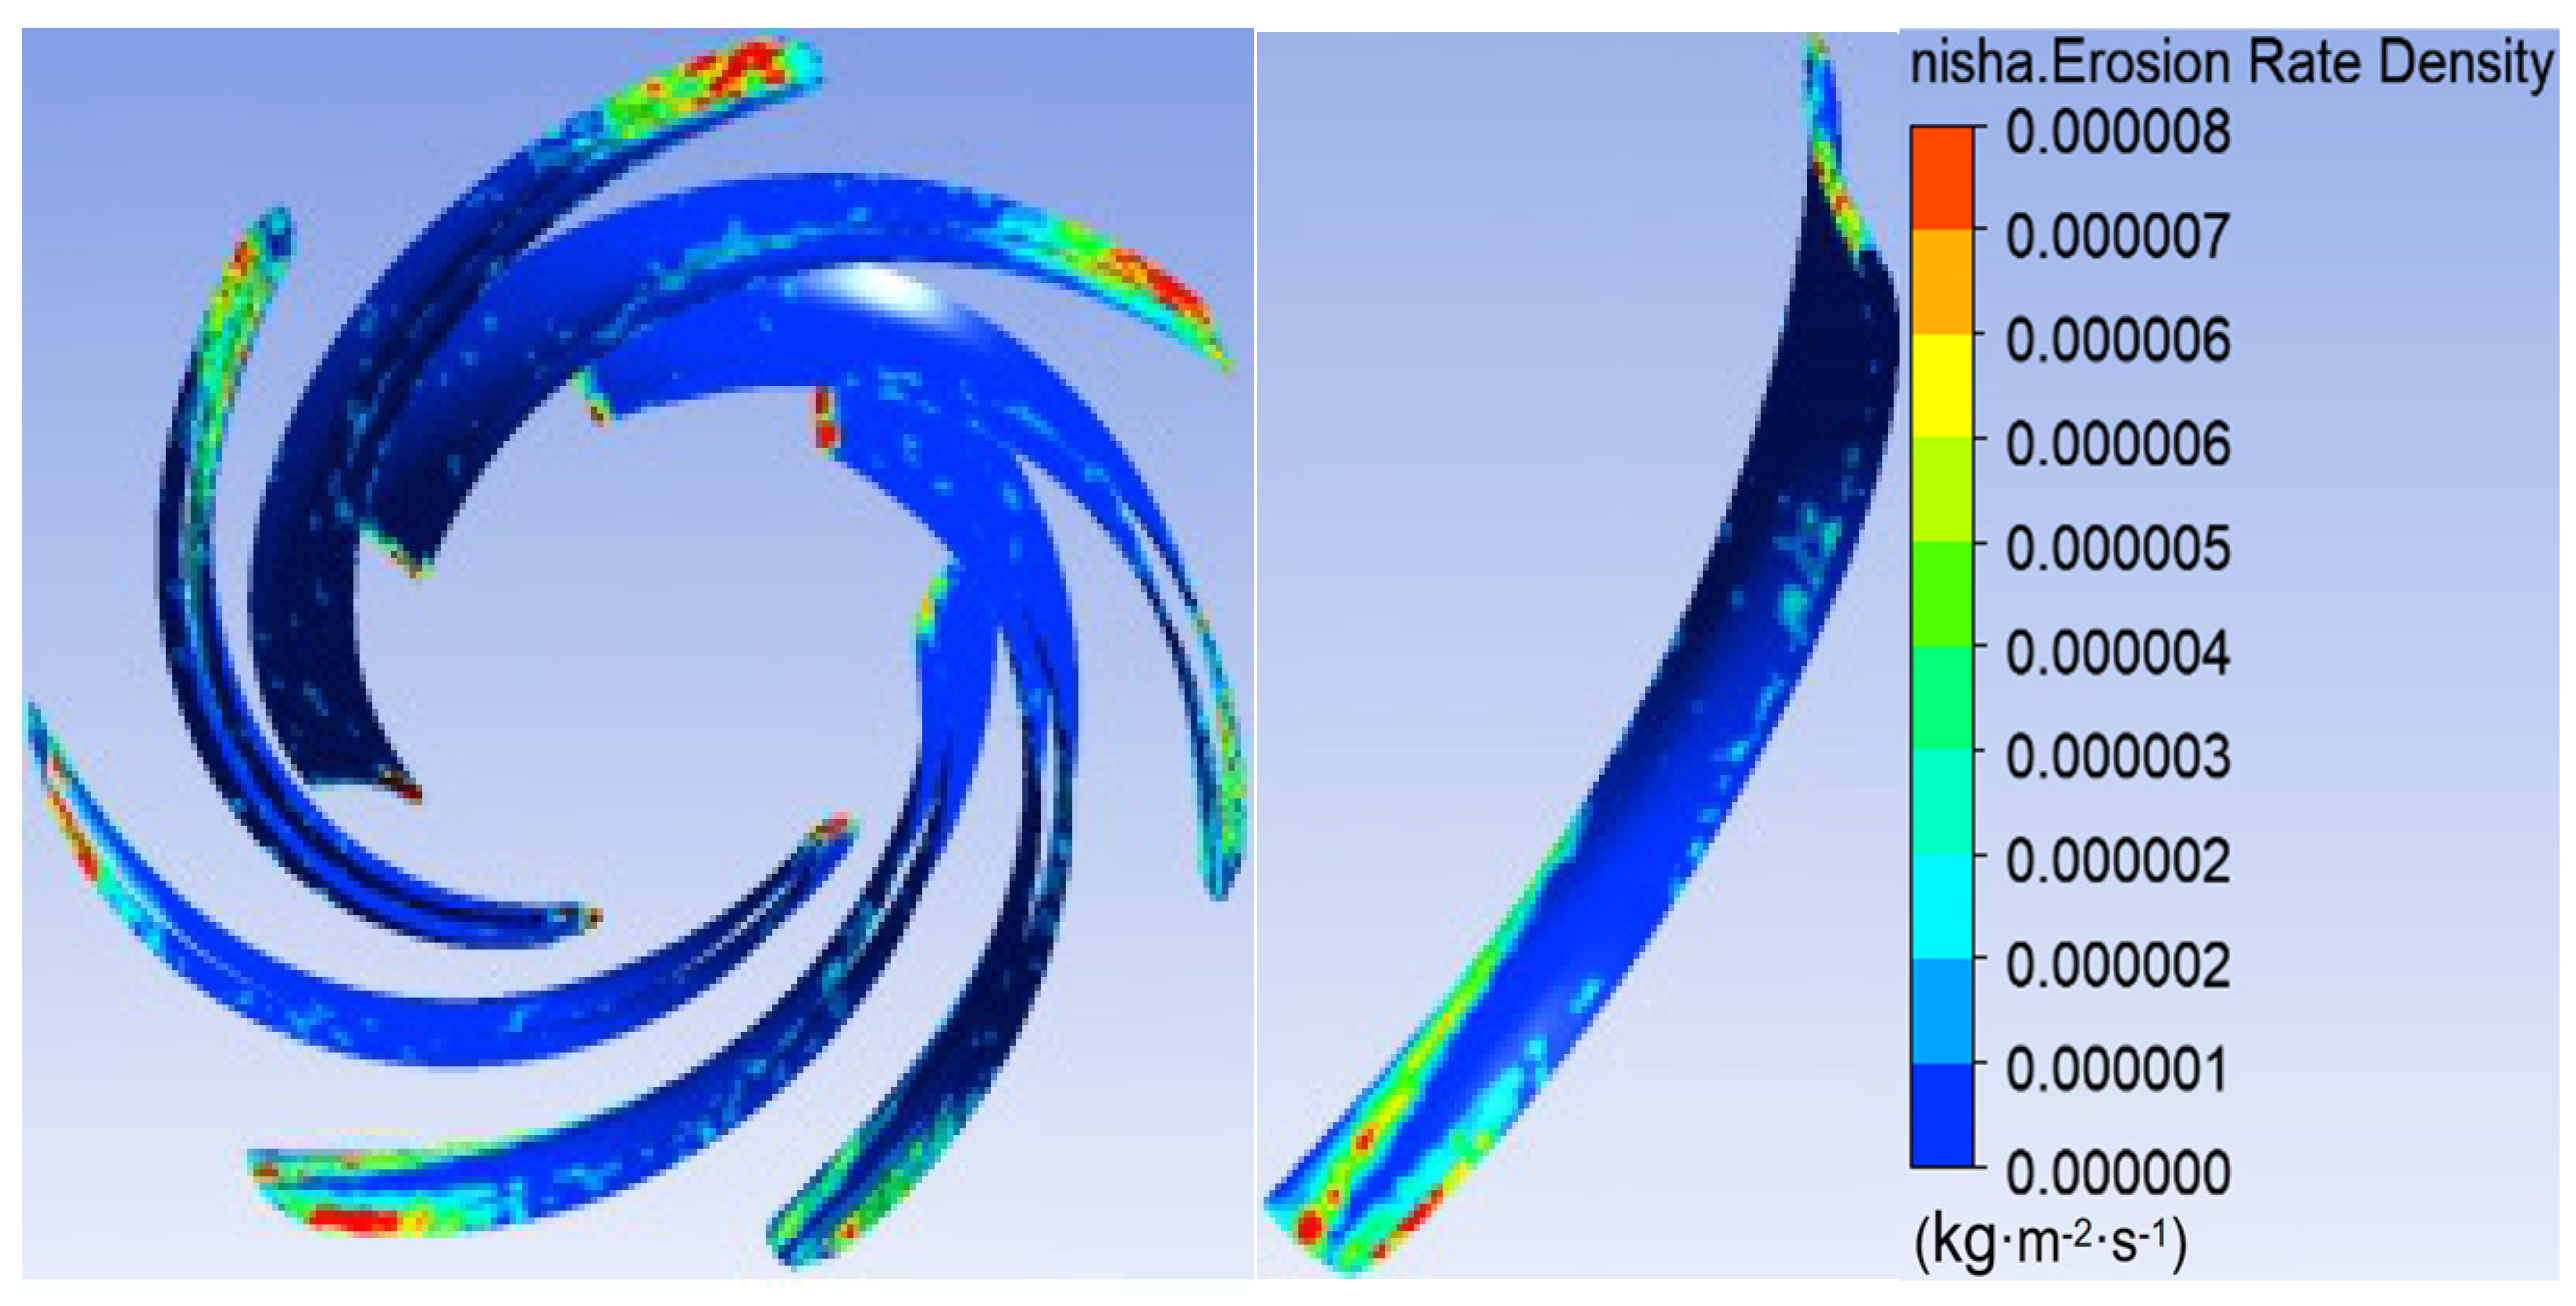
Figure 13, Figure 14 and Figure 15 present the blade sediment erosion rate distribution of Impeller 1#, Impeller 2#, and Impeller 3# under the rated flow rate condition of Q = 0.83 m3/s. Similarly to the sediment erosion patterns observed at the flow rate of Q = 0.715 m3/s, sediment erosion is primarily concentrated at the blade inlet and outlet. The sediment erosion characteristics at the blade inlet indicate that the main sediment erosion mechanism is impact sediment erosion, while the sediment erosion at the blade outlet is predominantly abrasive sediment erosion, distributed on the blade pressure side. Minor abrasive sediment erosion is also observed on the suction side near the outlet, as well as in other areas of the blade. However, under the rated operating condition, both the extent and severity of sediment erosion are the least pronounced.
(3) Scheme III
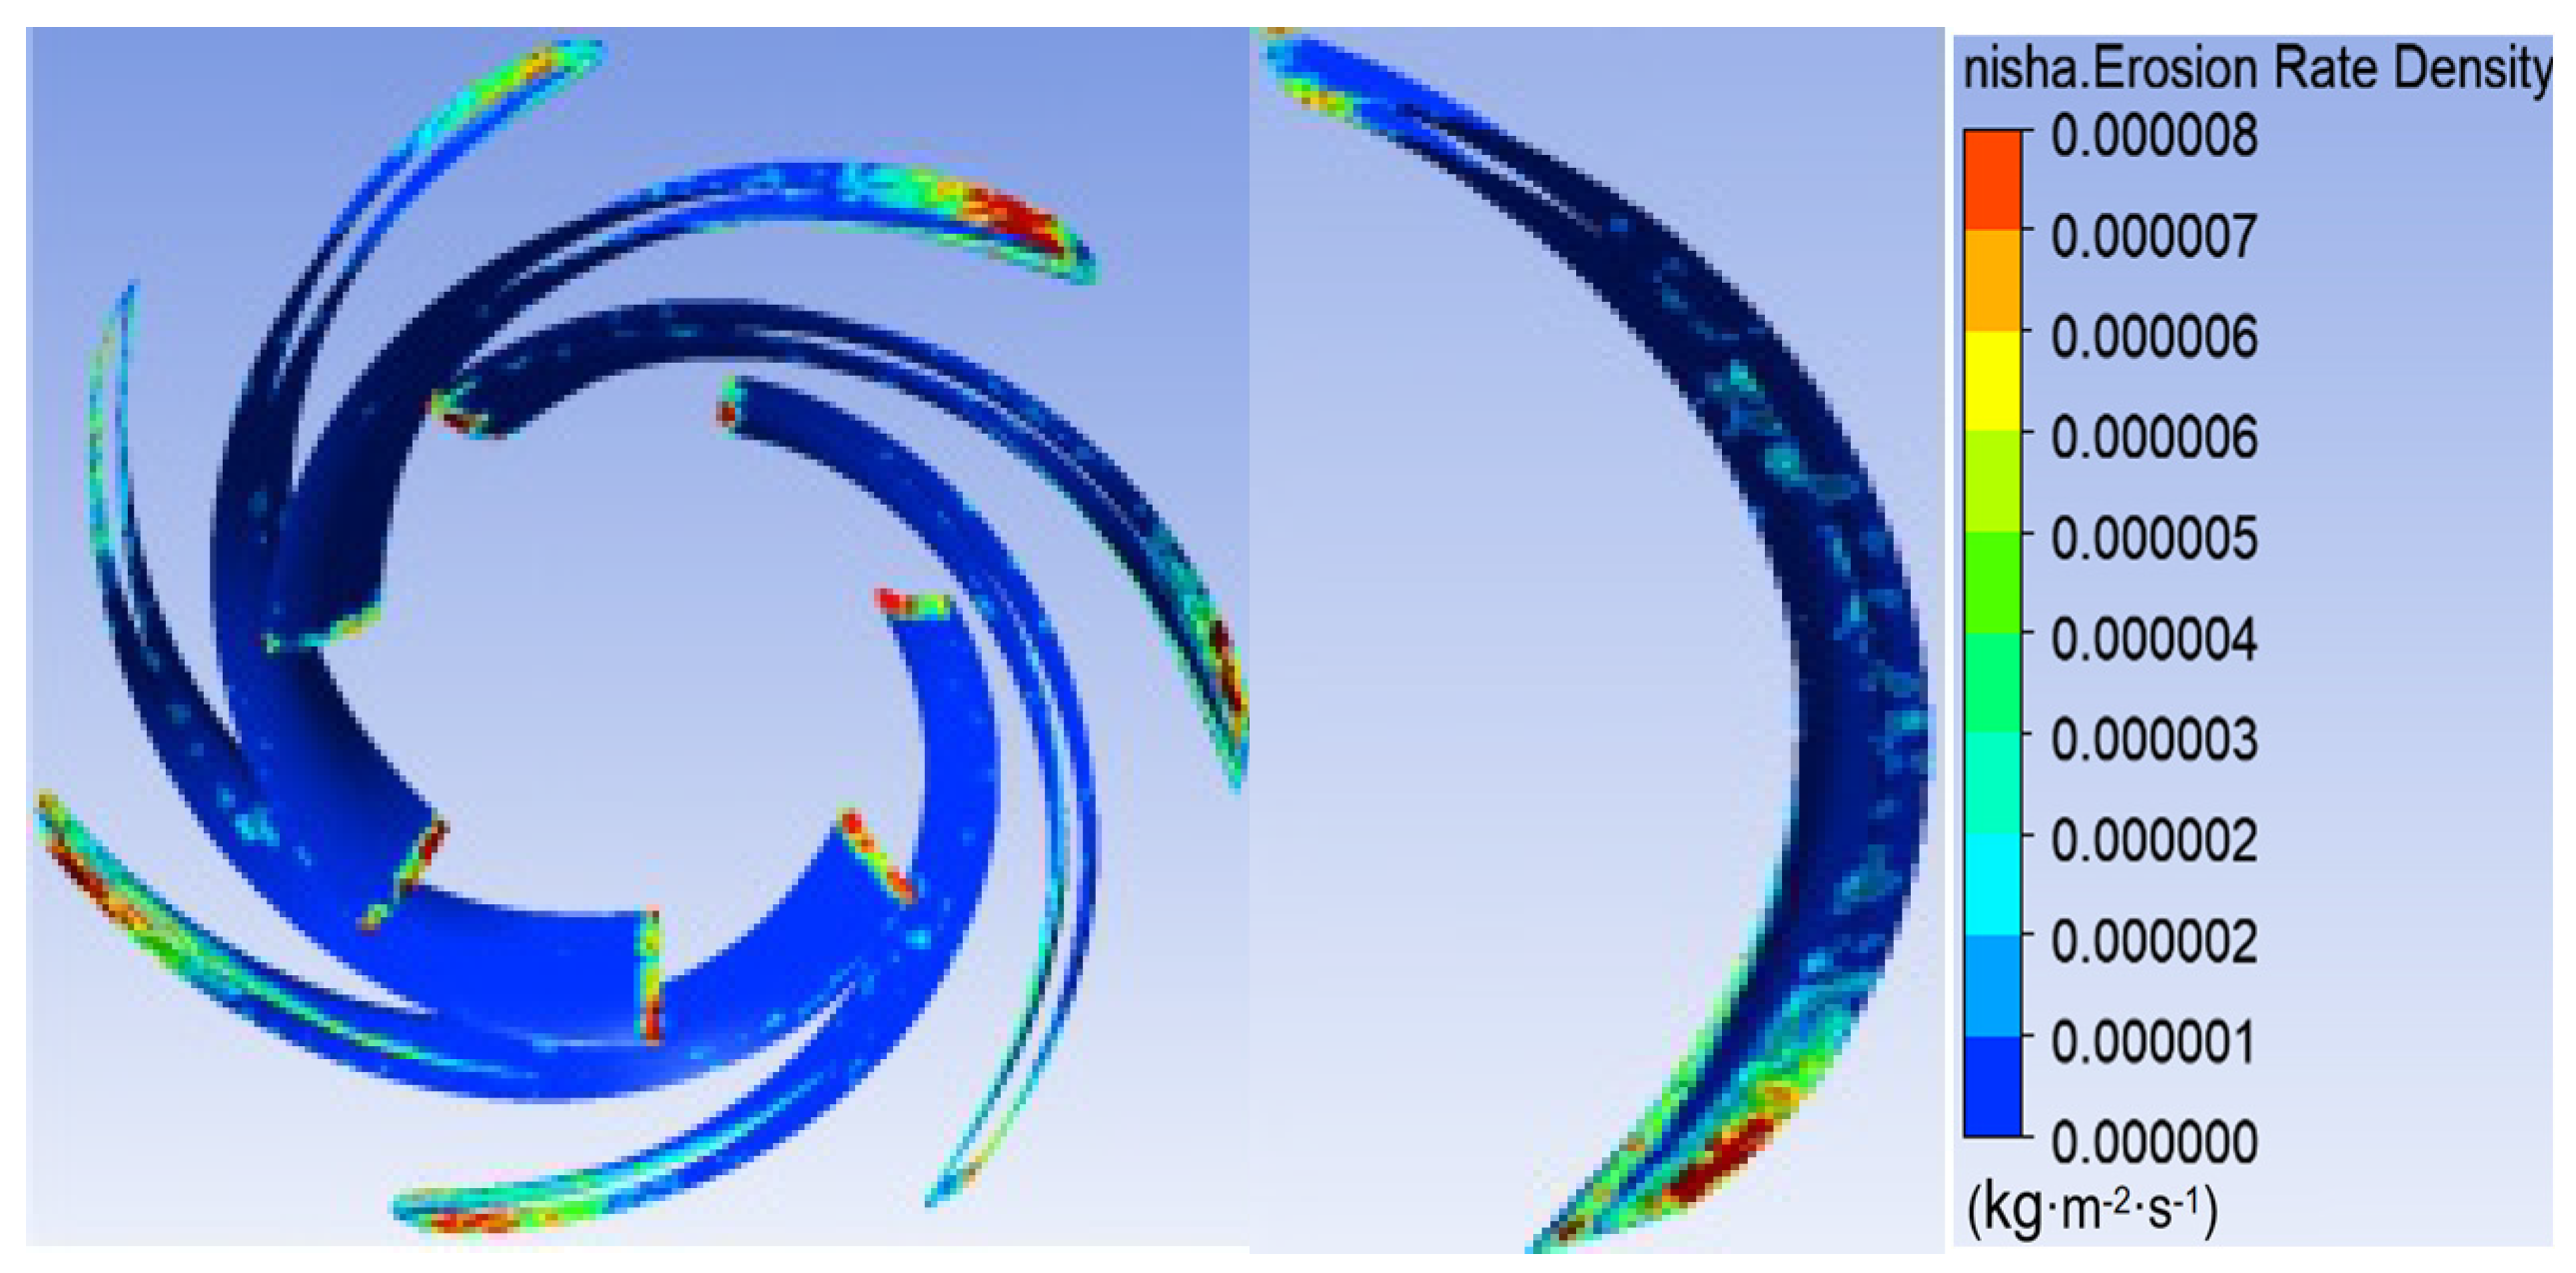
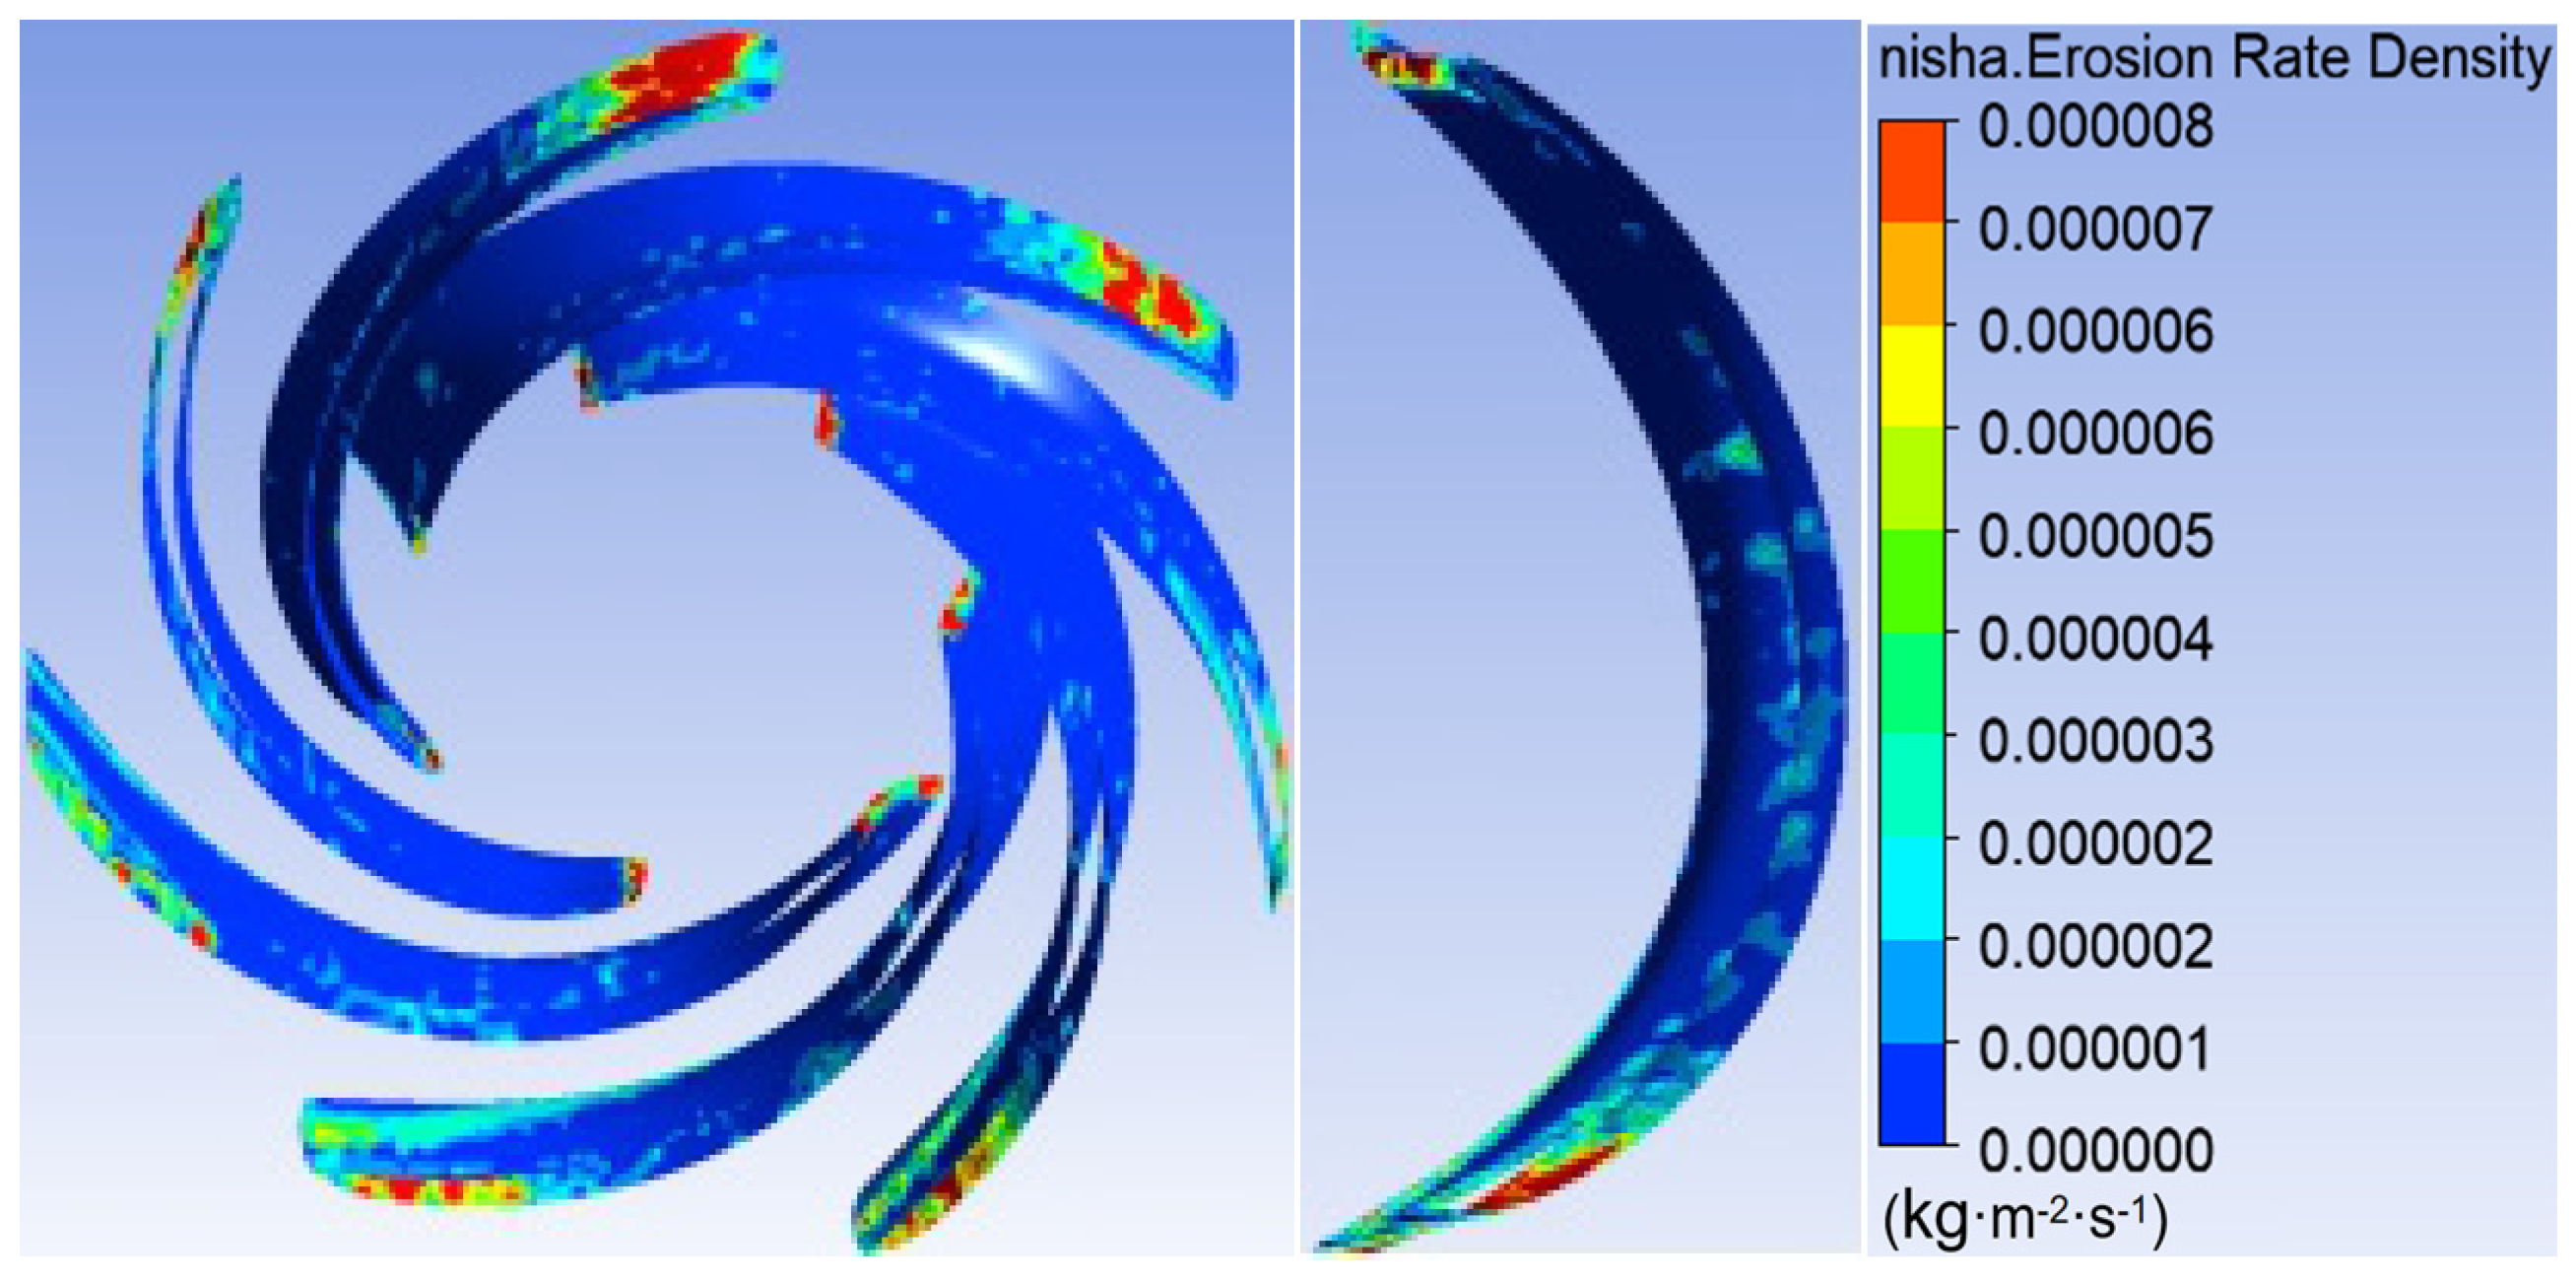
Figure 16, Figure 17 and Figure 18 show the blade sediment erosion rate distribution of Impeller 1#, Impeller 2#, and Impeller 3# under the flow rate condition of Q = 0.92 m3/s. At this flow rate, the sediment erosion on the impeller blades is the most severe. Sediment erosion is primarily concentrated at the blade inlet and outlet. The sediment erosion pattern at the blade inlet indicates that the main sediment erosion mechanism is impact sediment erosion, extending approximately 8–12 mm along the blade direction. The sediment erosion at the blade outlet is predominantly abrasive sediment erosion, distributed on the blade pressure side within a length of about 17 mm. Slight abrasive sediment erosion is also observed on the suction side near the outlet, as well as minor abrasive sediment erosion features in other areas of the blade.

3.4. Energy Dissipation Analysis in Water Pump

(1) Dissipation and spread of turbulence kinetic energy
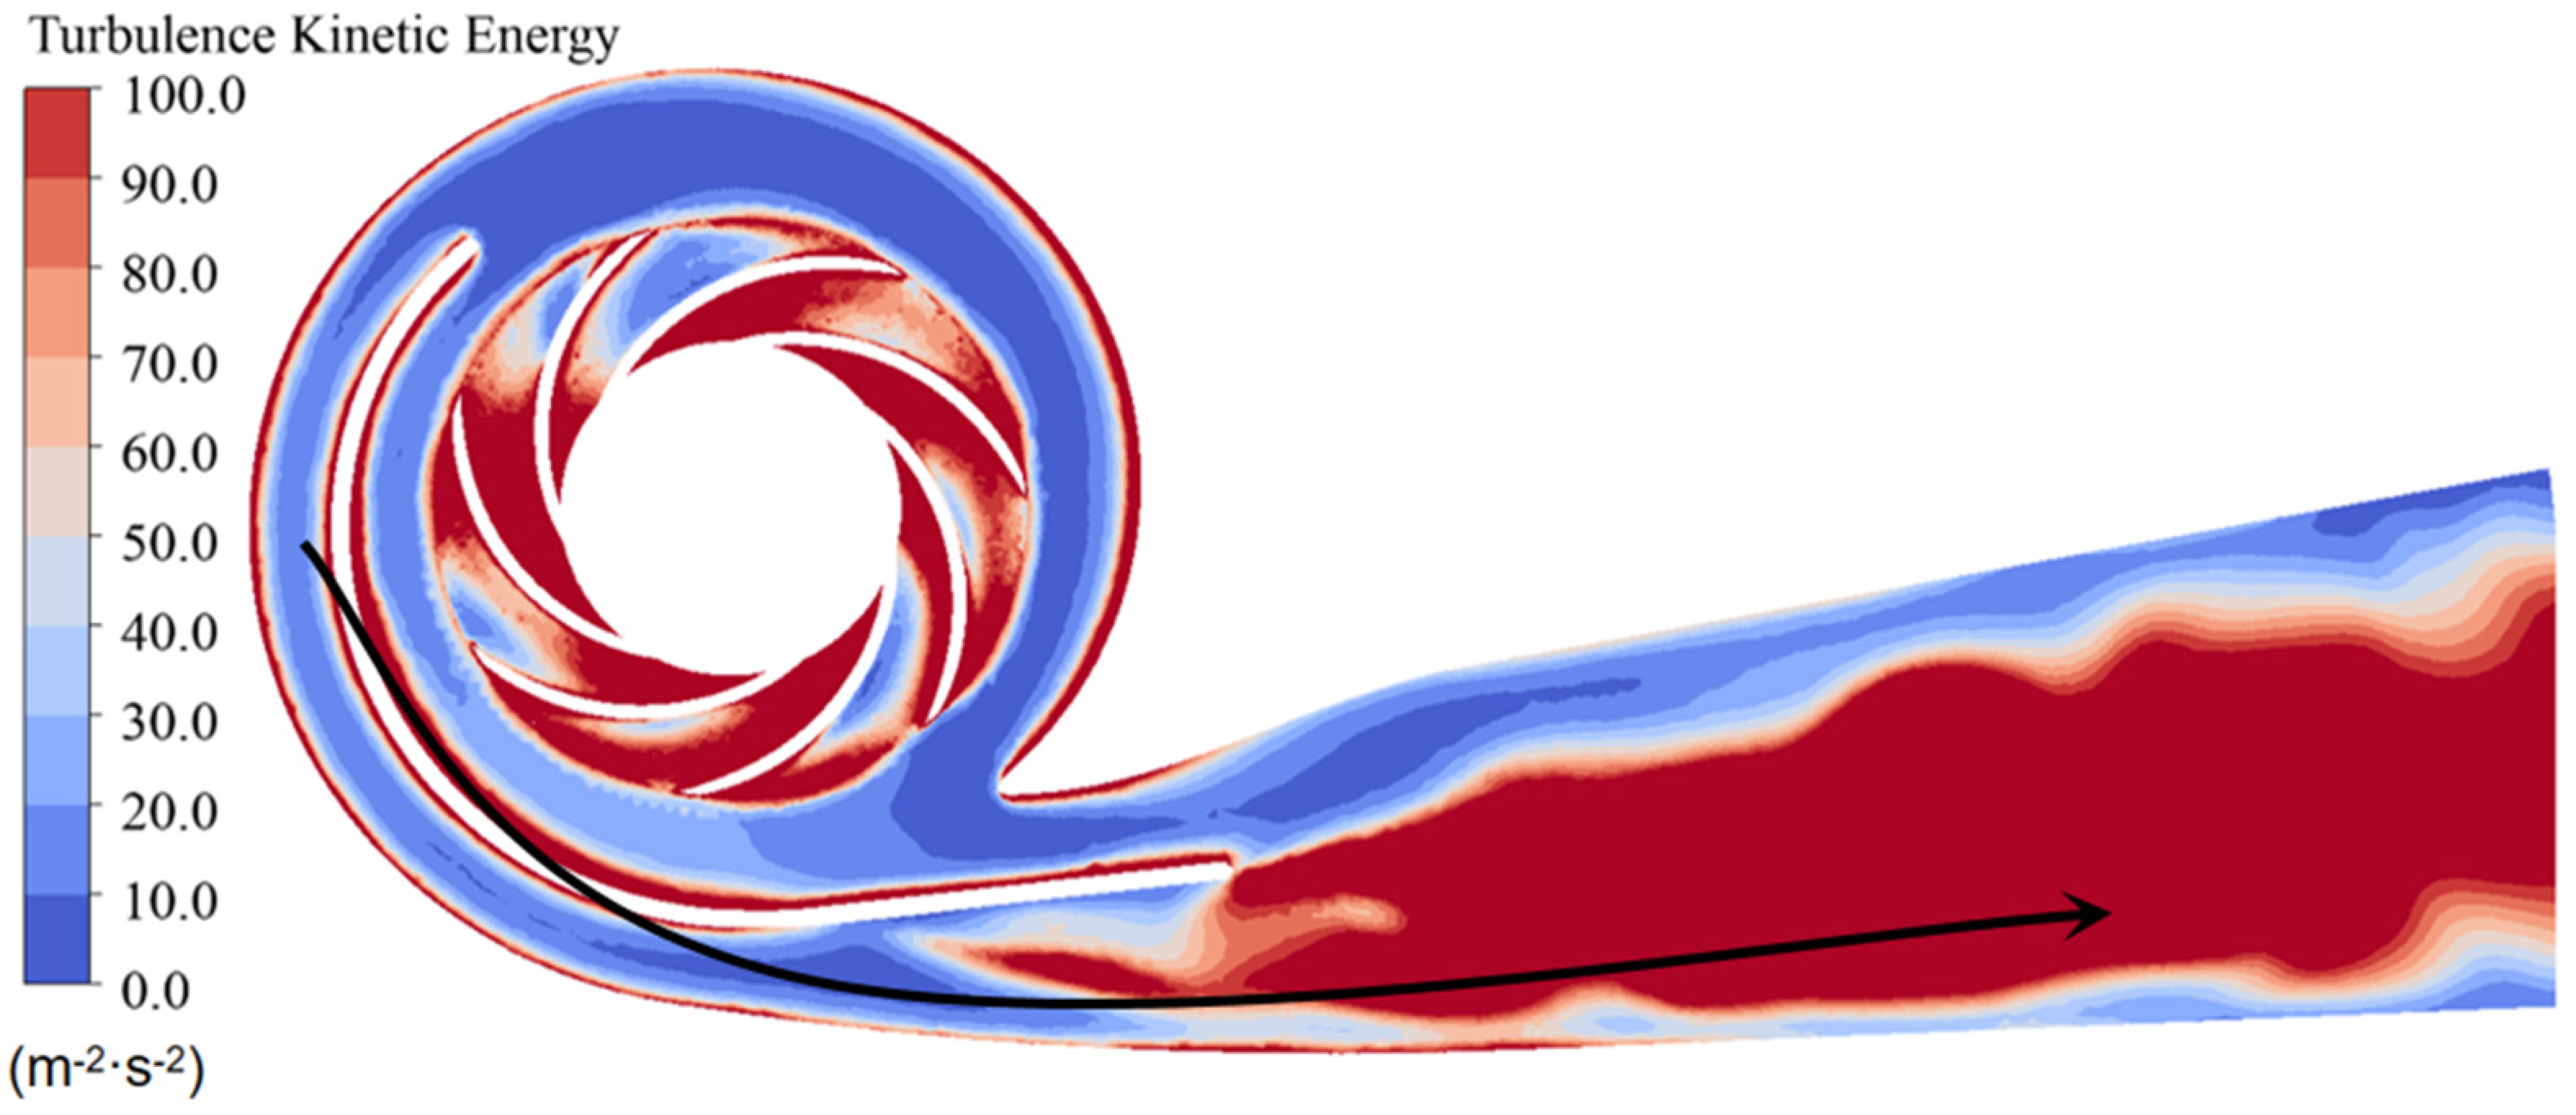
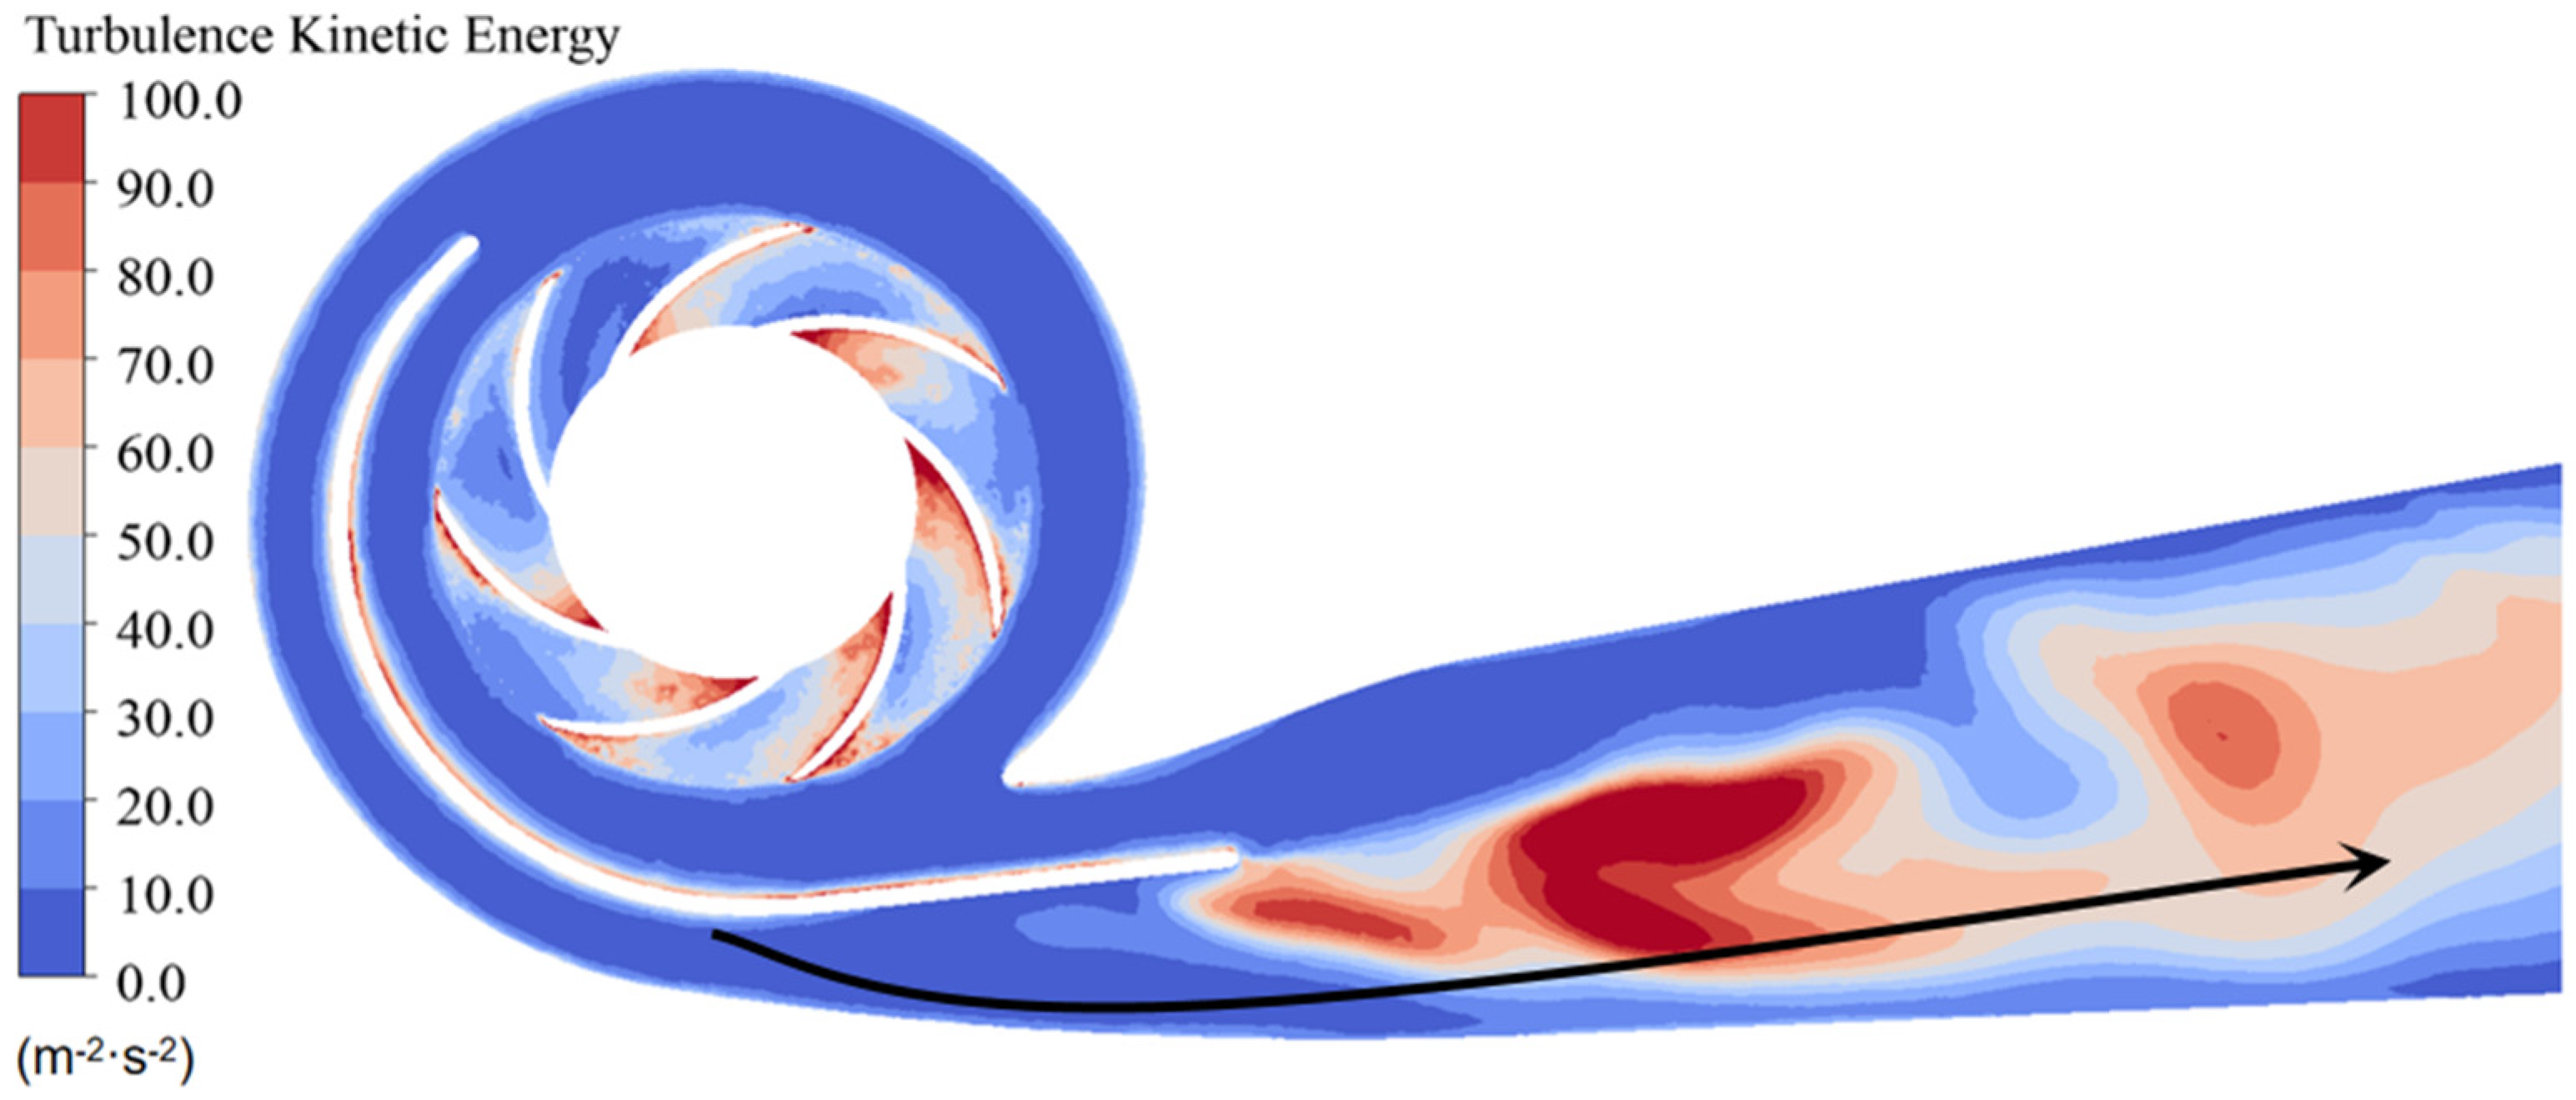
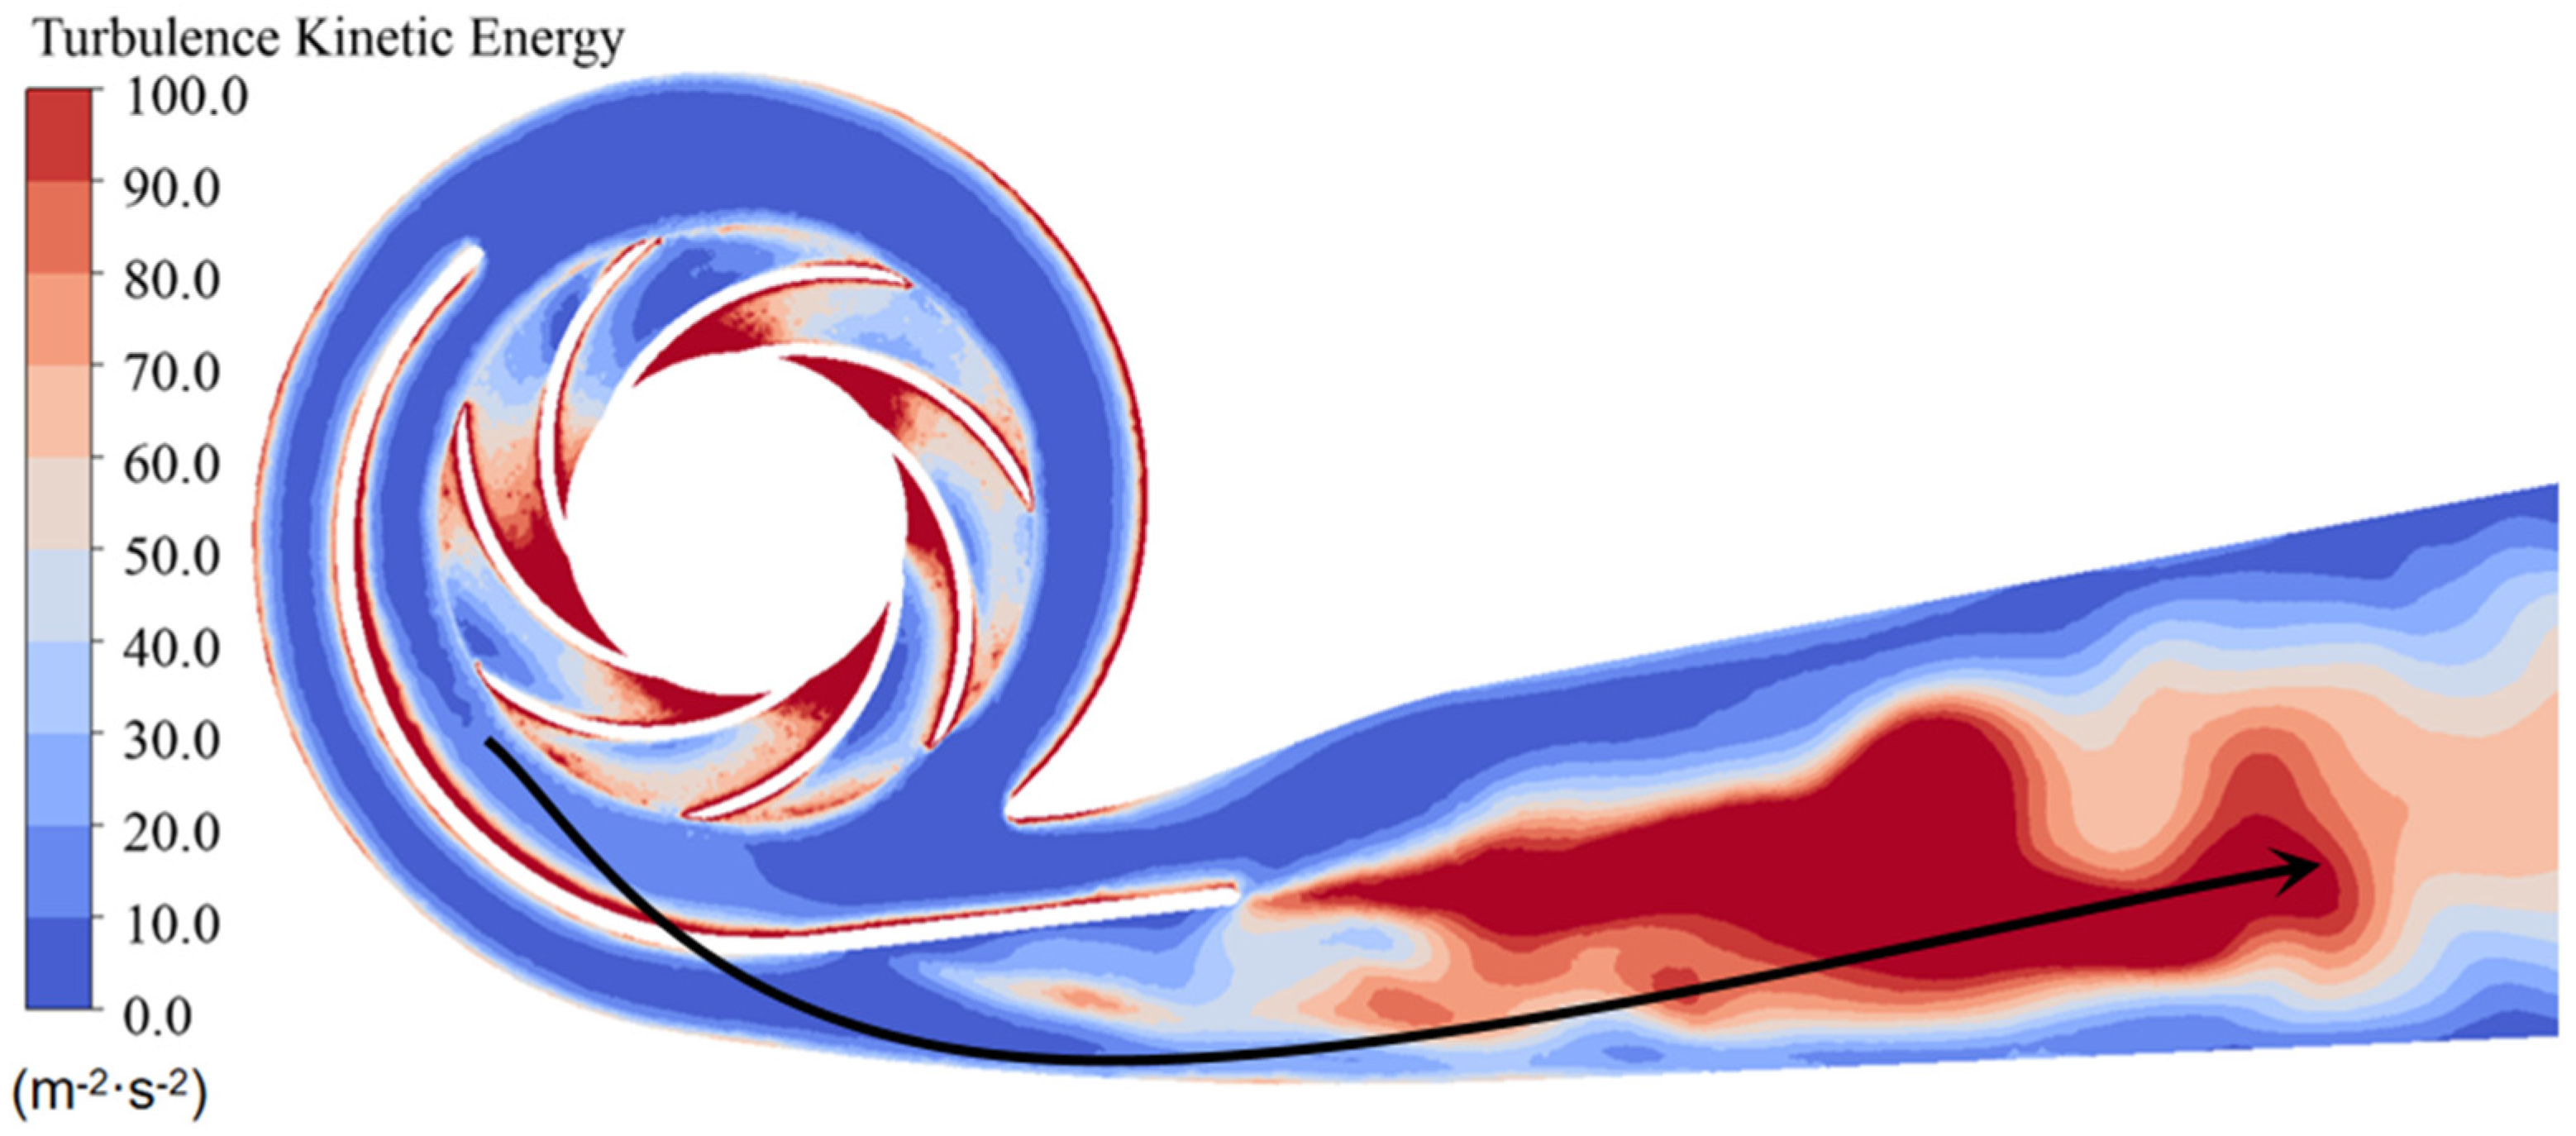
Previous analysis shows that under various schemes, the flow passage within the unit exhibits different levels of turbulent flow characterized by numerous disturbances, including vortices, blade channel vortices, and flow splits. In fluid dynamics, turbulence kinetic energy is commonly used to characterize turbulence intensity. Figure 19, Figure 20 and Figure 21 show the distribution of the turbulence kinetic energy in the flow passage of the unit under different schemes. The hydraulic loss in the multi-stage centrifugal pump was mainly due to the poor flow in the main flow area. The turbulent kinetic energy in the impeller spreads to the outlet passage along with the flow of water, resulting in a severe turbulent flow. The turbulence distribution of each component of the unit was strongest under Scheme I. Owing to the reasonable distribution of the blade interlocking angle under Scheme II, the turbulence intensity in the flow passage was reduced, and the turbulence intensity at each position was the smallest. In Scheme III, the turbulence intensity increases, which is consistent with the changes in the flow distribution under each scheme in the previous sections.
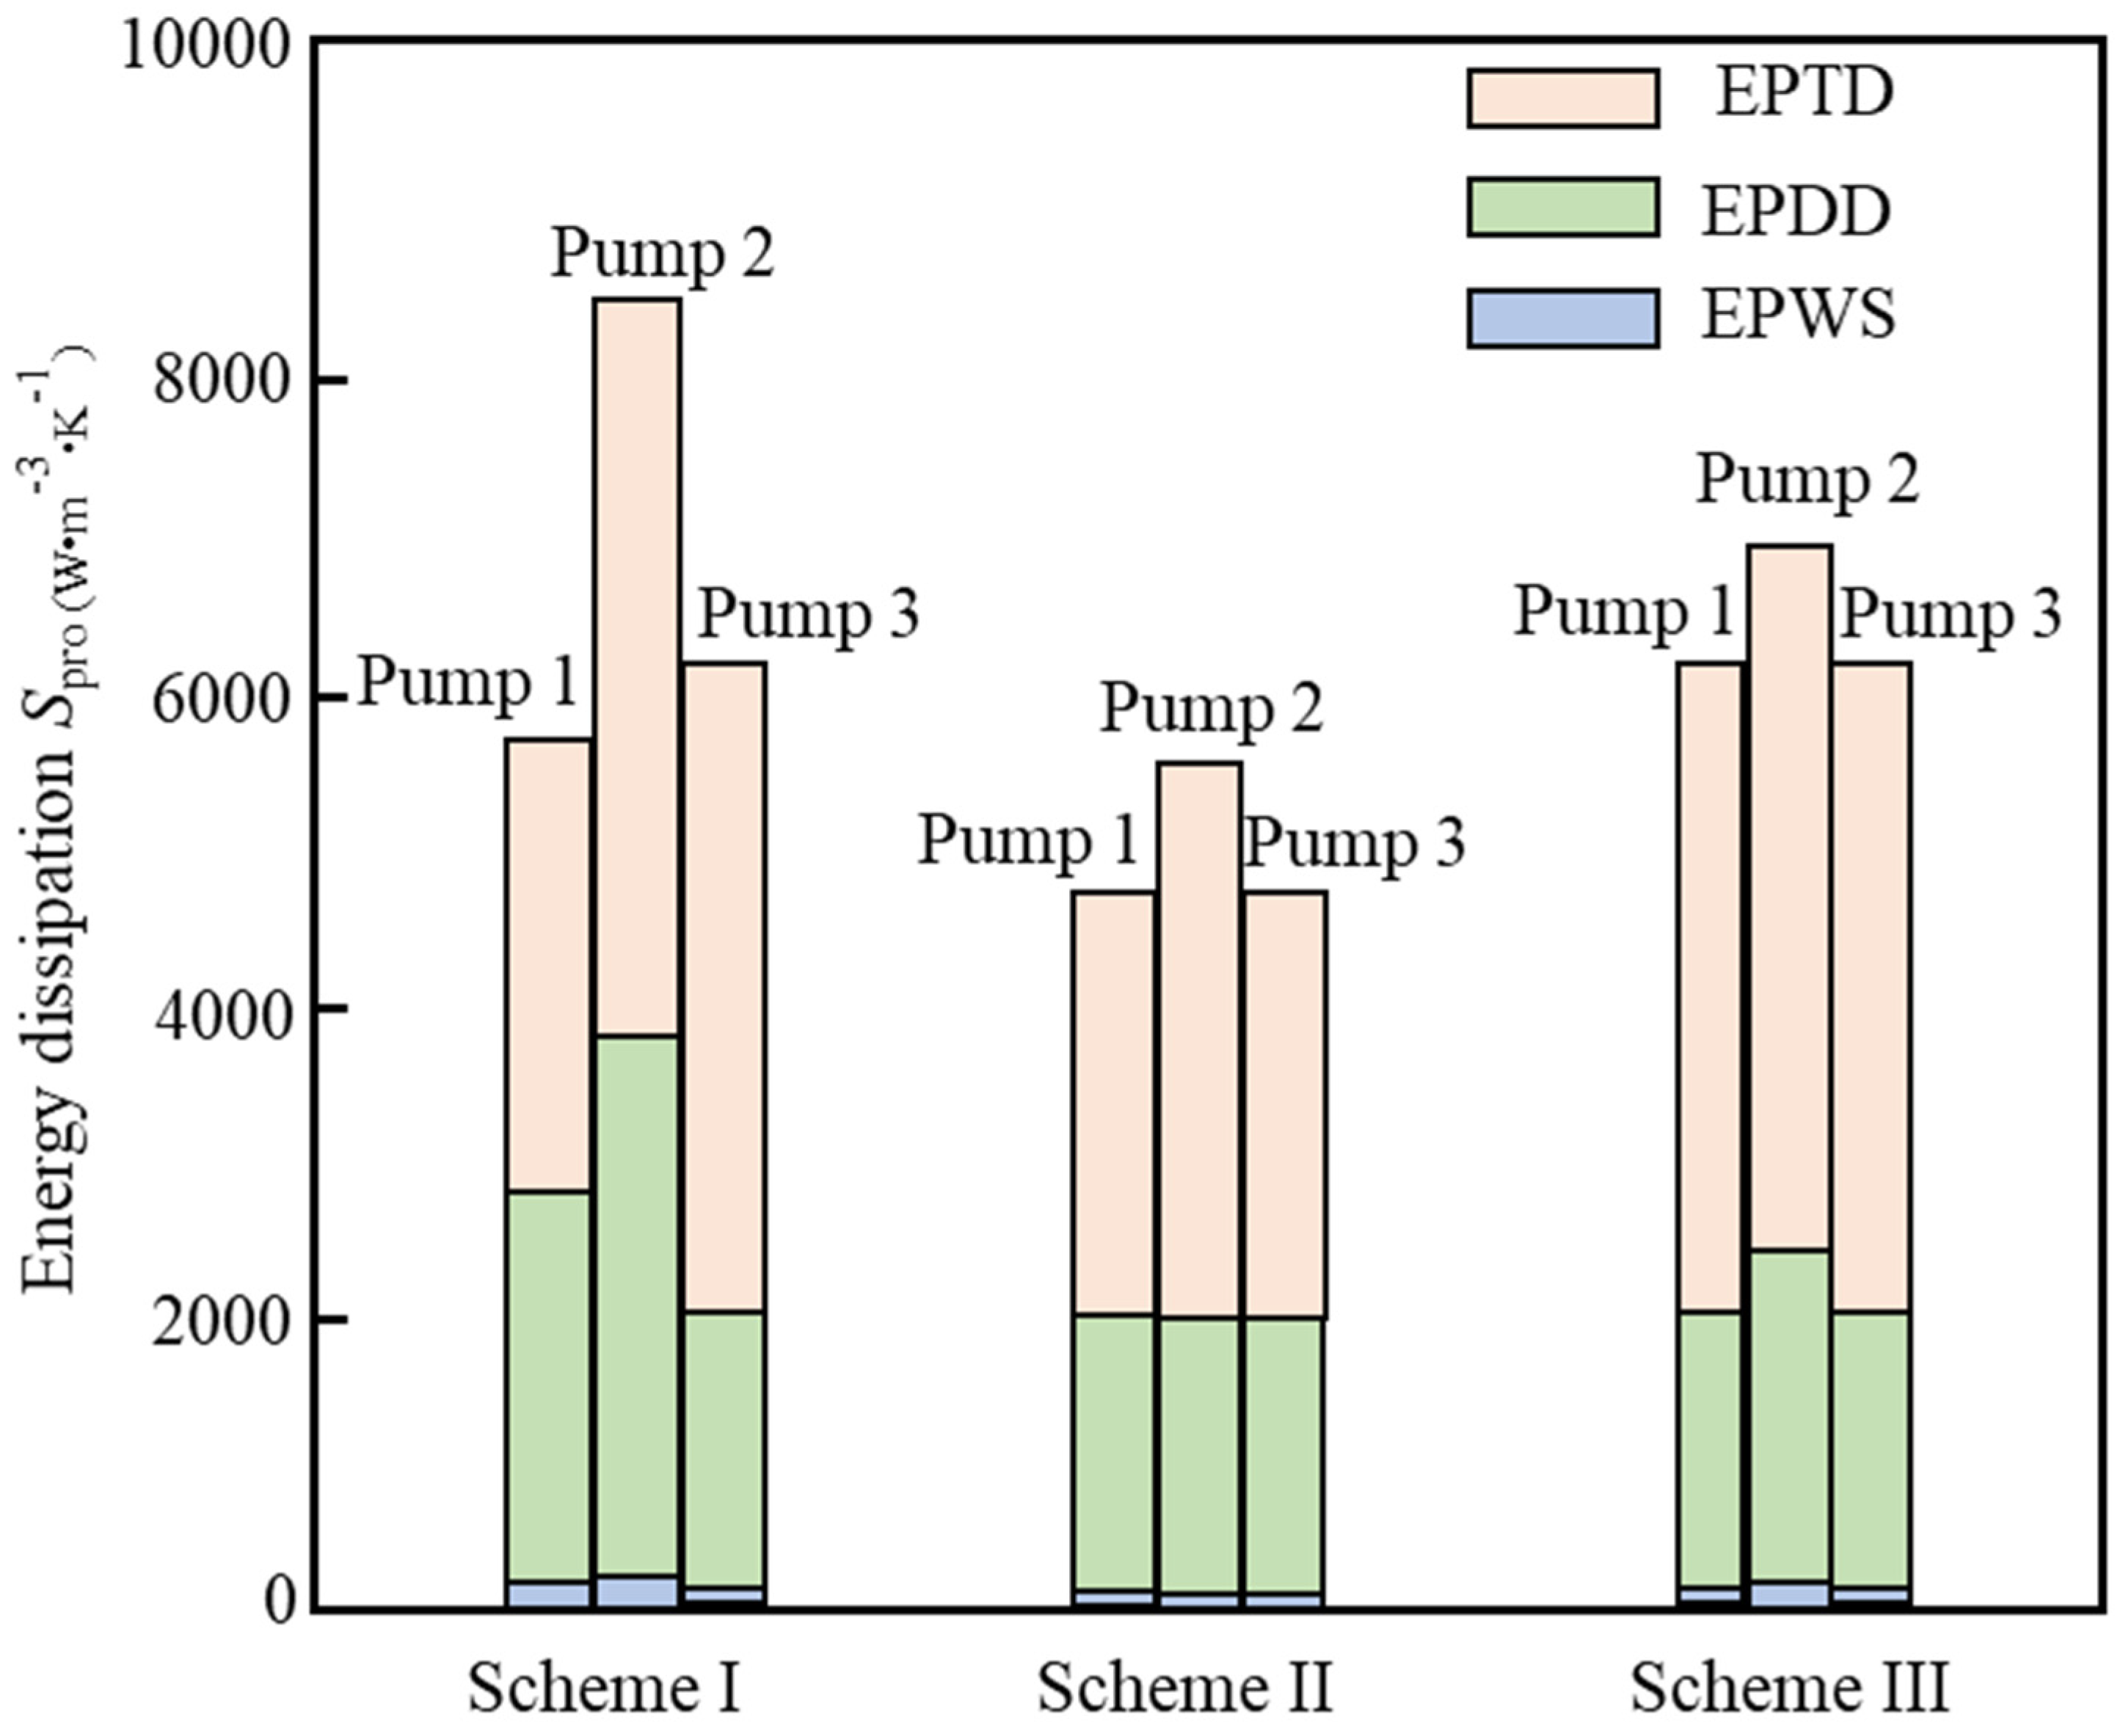
To further measure the influence of the blade angle on the two sides of the impeller of Unit 2# on the energy loss, the total entropy production in each impeller under different schemes was statistically analyzed, as shown in Figure 22. Under each scheme, the energy loss in Unit 2# is the largest, and the maximum entropy production value reaches 9100 W·m−3·K−1. Total entropy production values per unit One and 3 were not significantly different. The total entropy production value in the units under scheme I is the highest, which reaches 21200 W·m−3·K−1, and the total entropy production value under scheme III is the lowest. This further verified the differential change rules of each scheme, indicating that the energy loss inside the units was maximized when the middle unit in the multi-stage centrifugal pump was installed symmetrically.

4. Discussion Between Erosion and Energy Dissipation

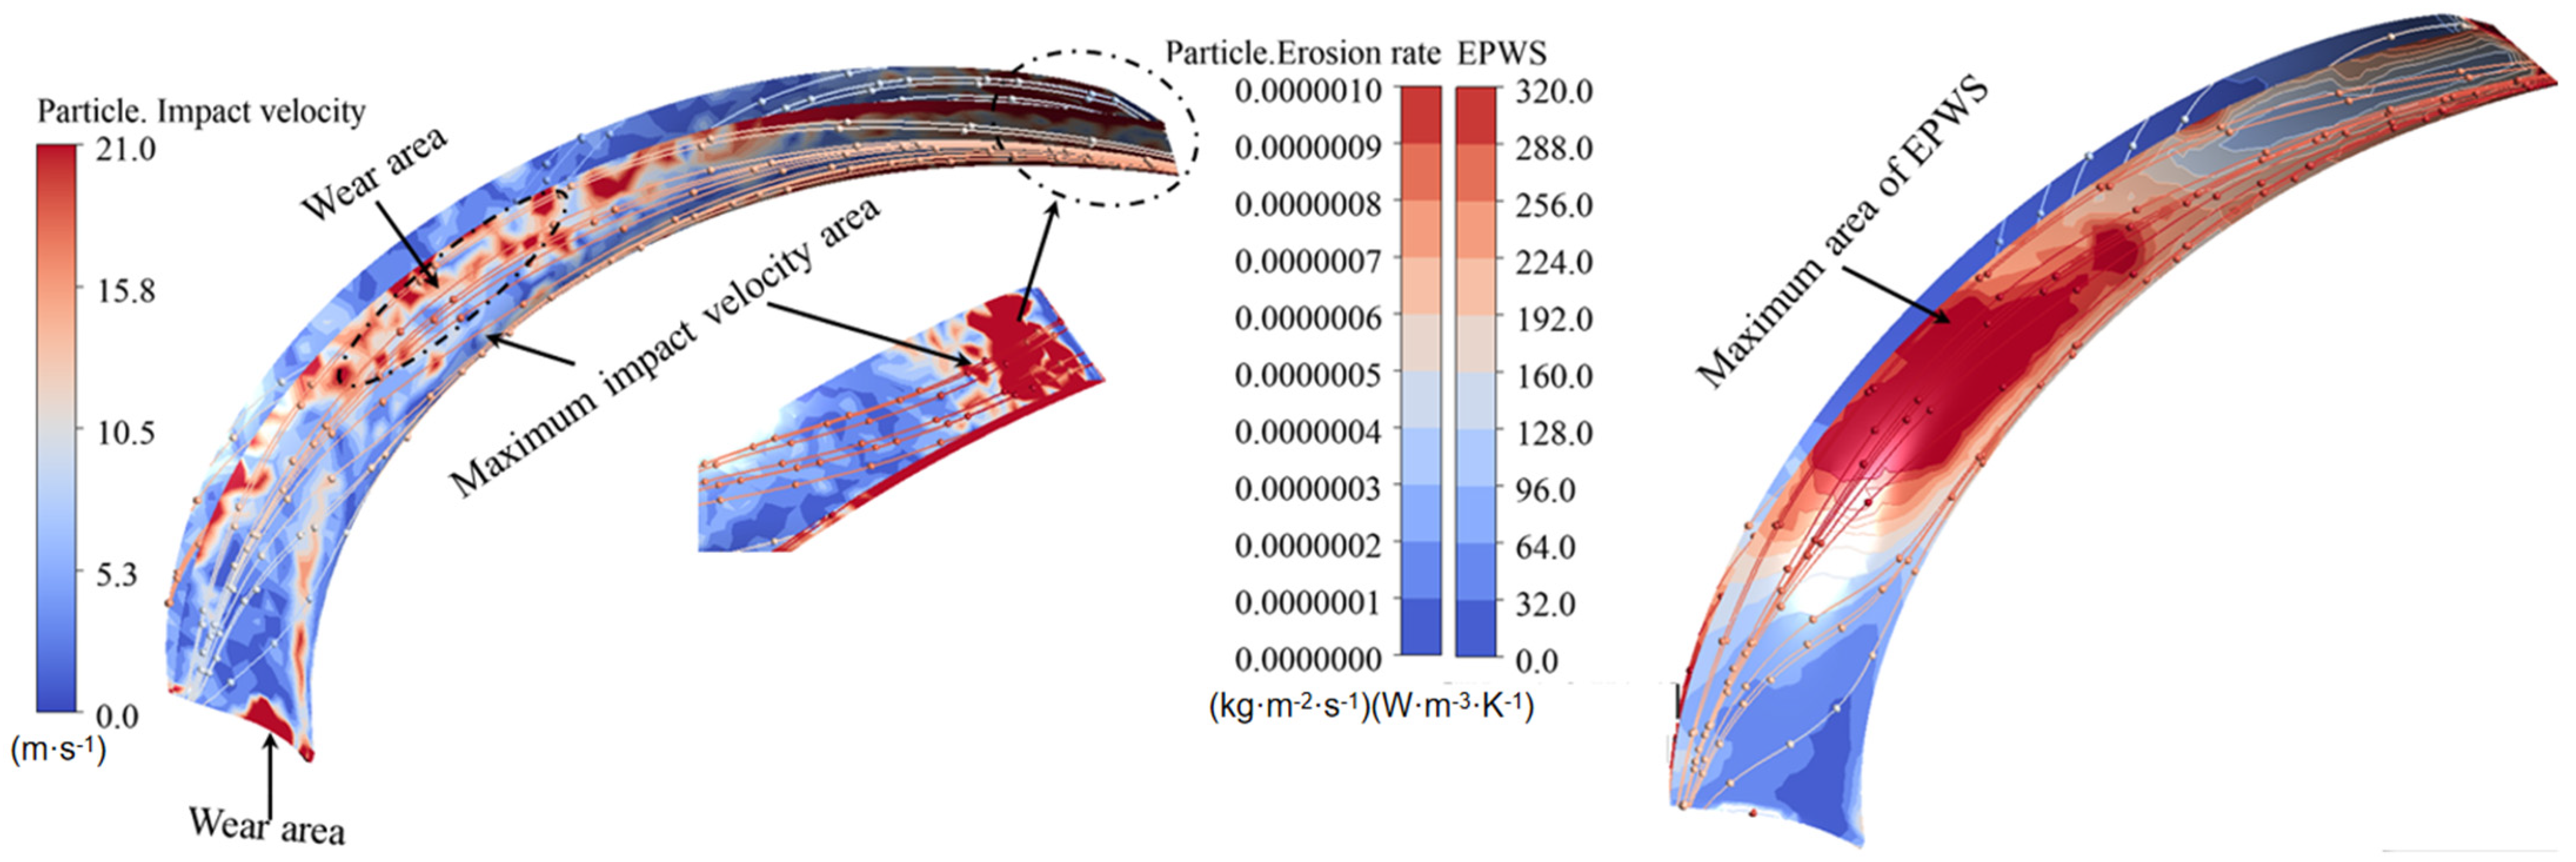
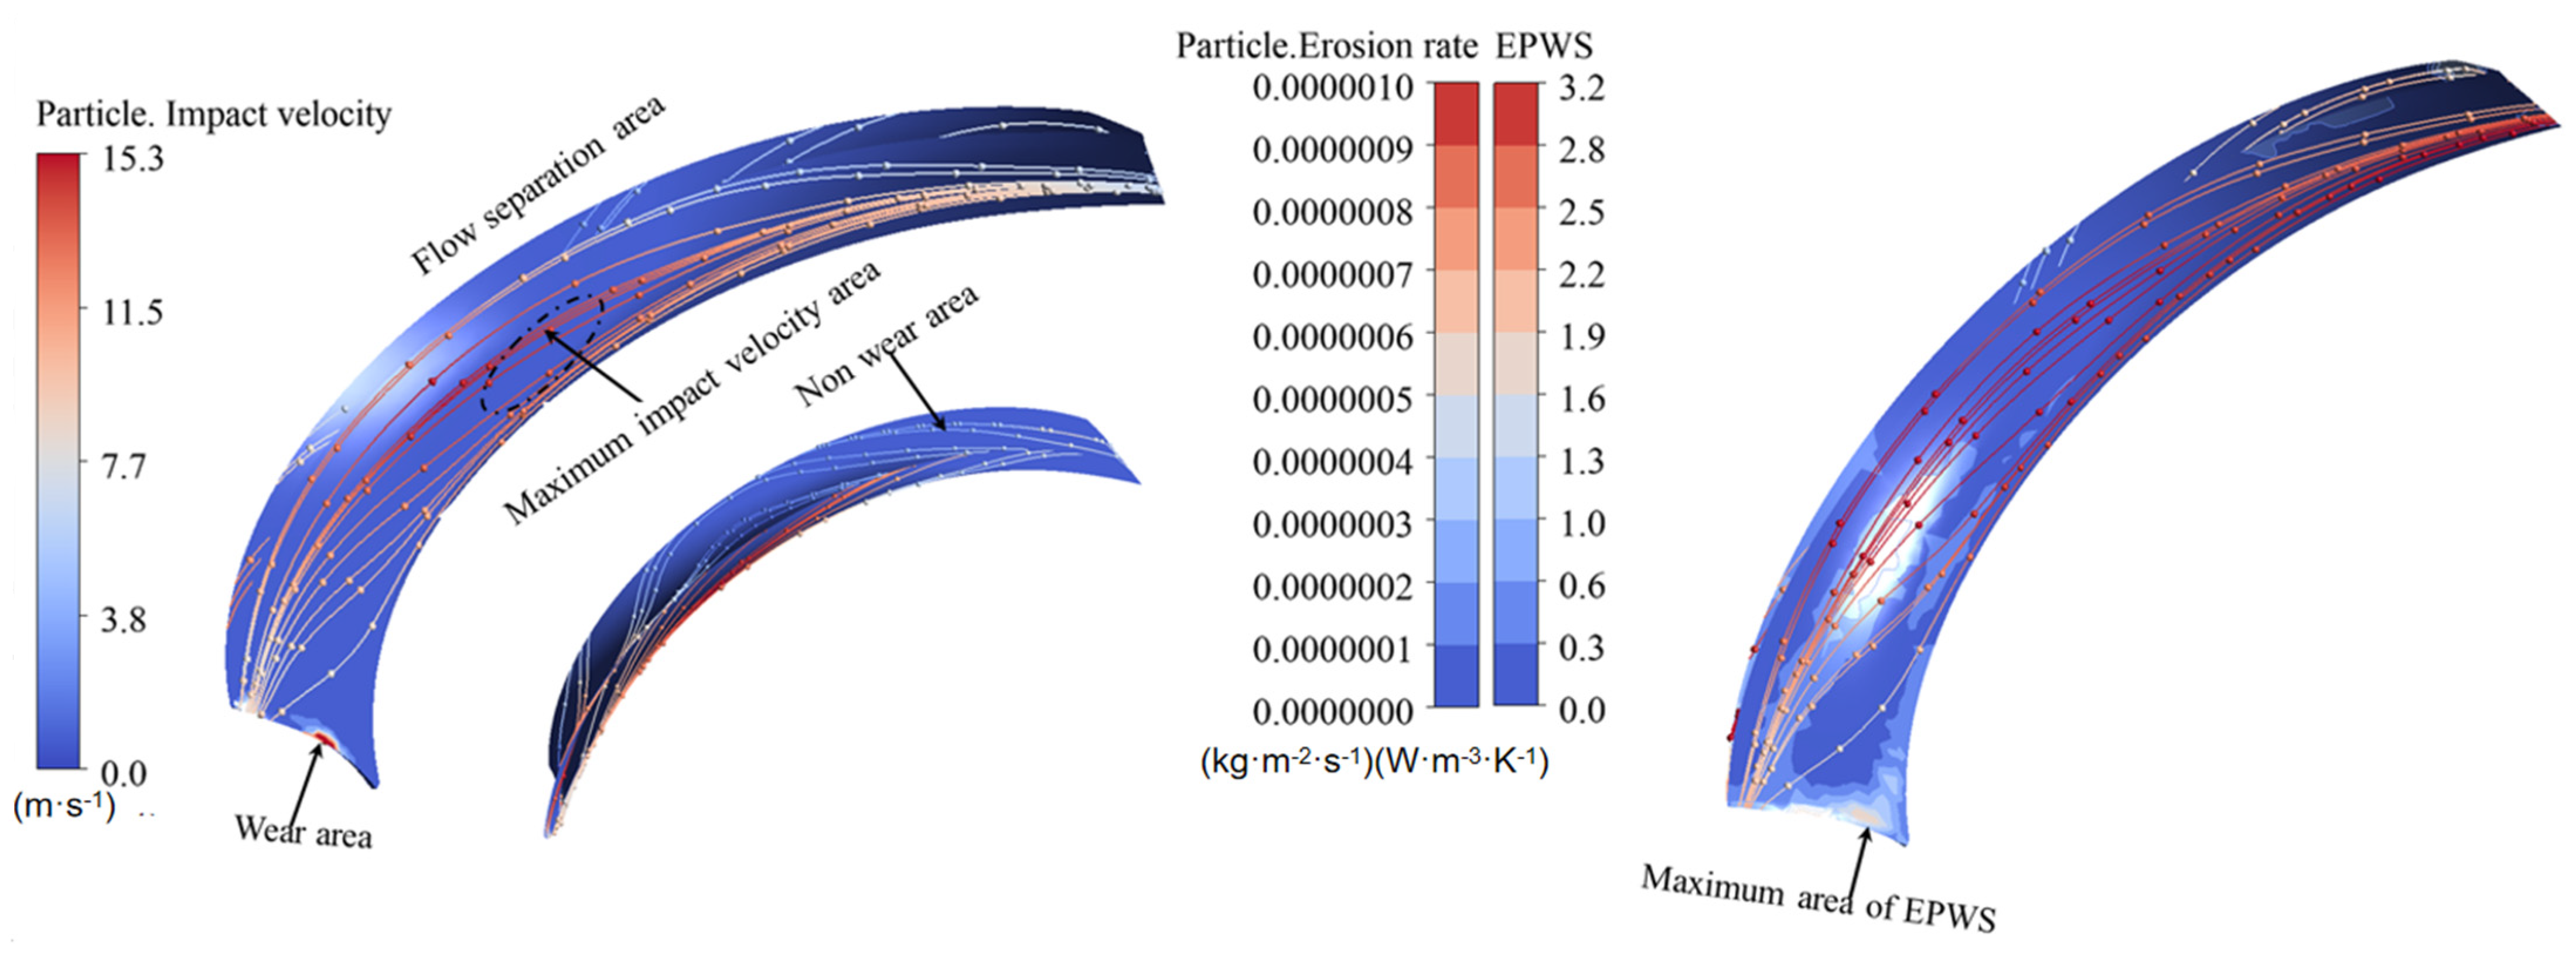
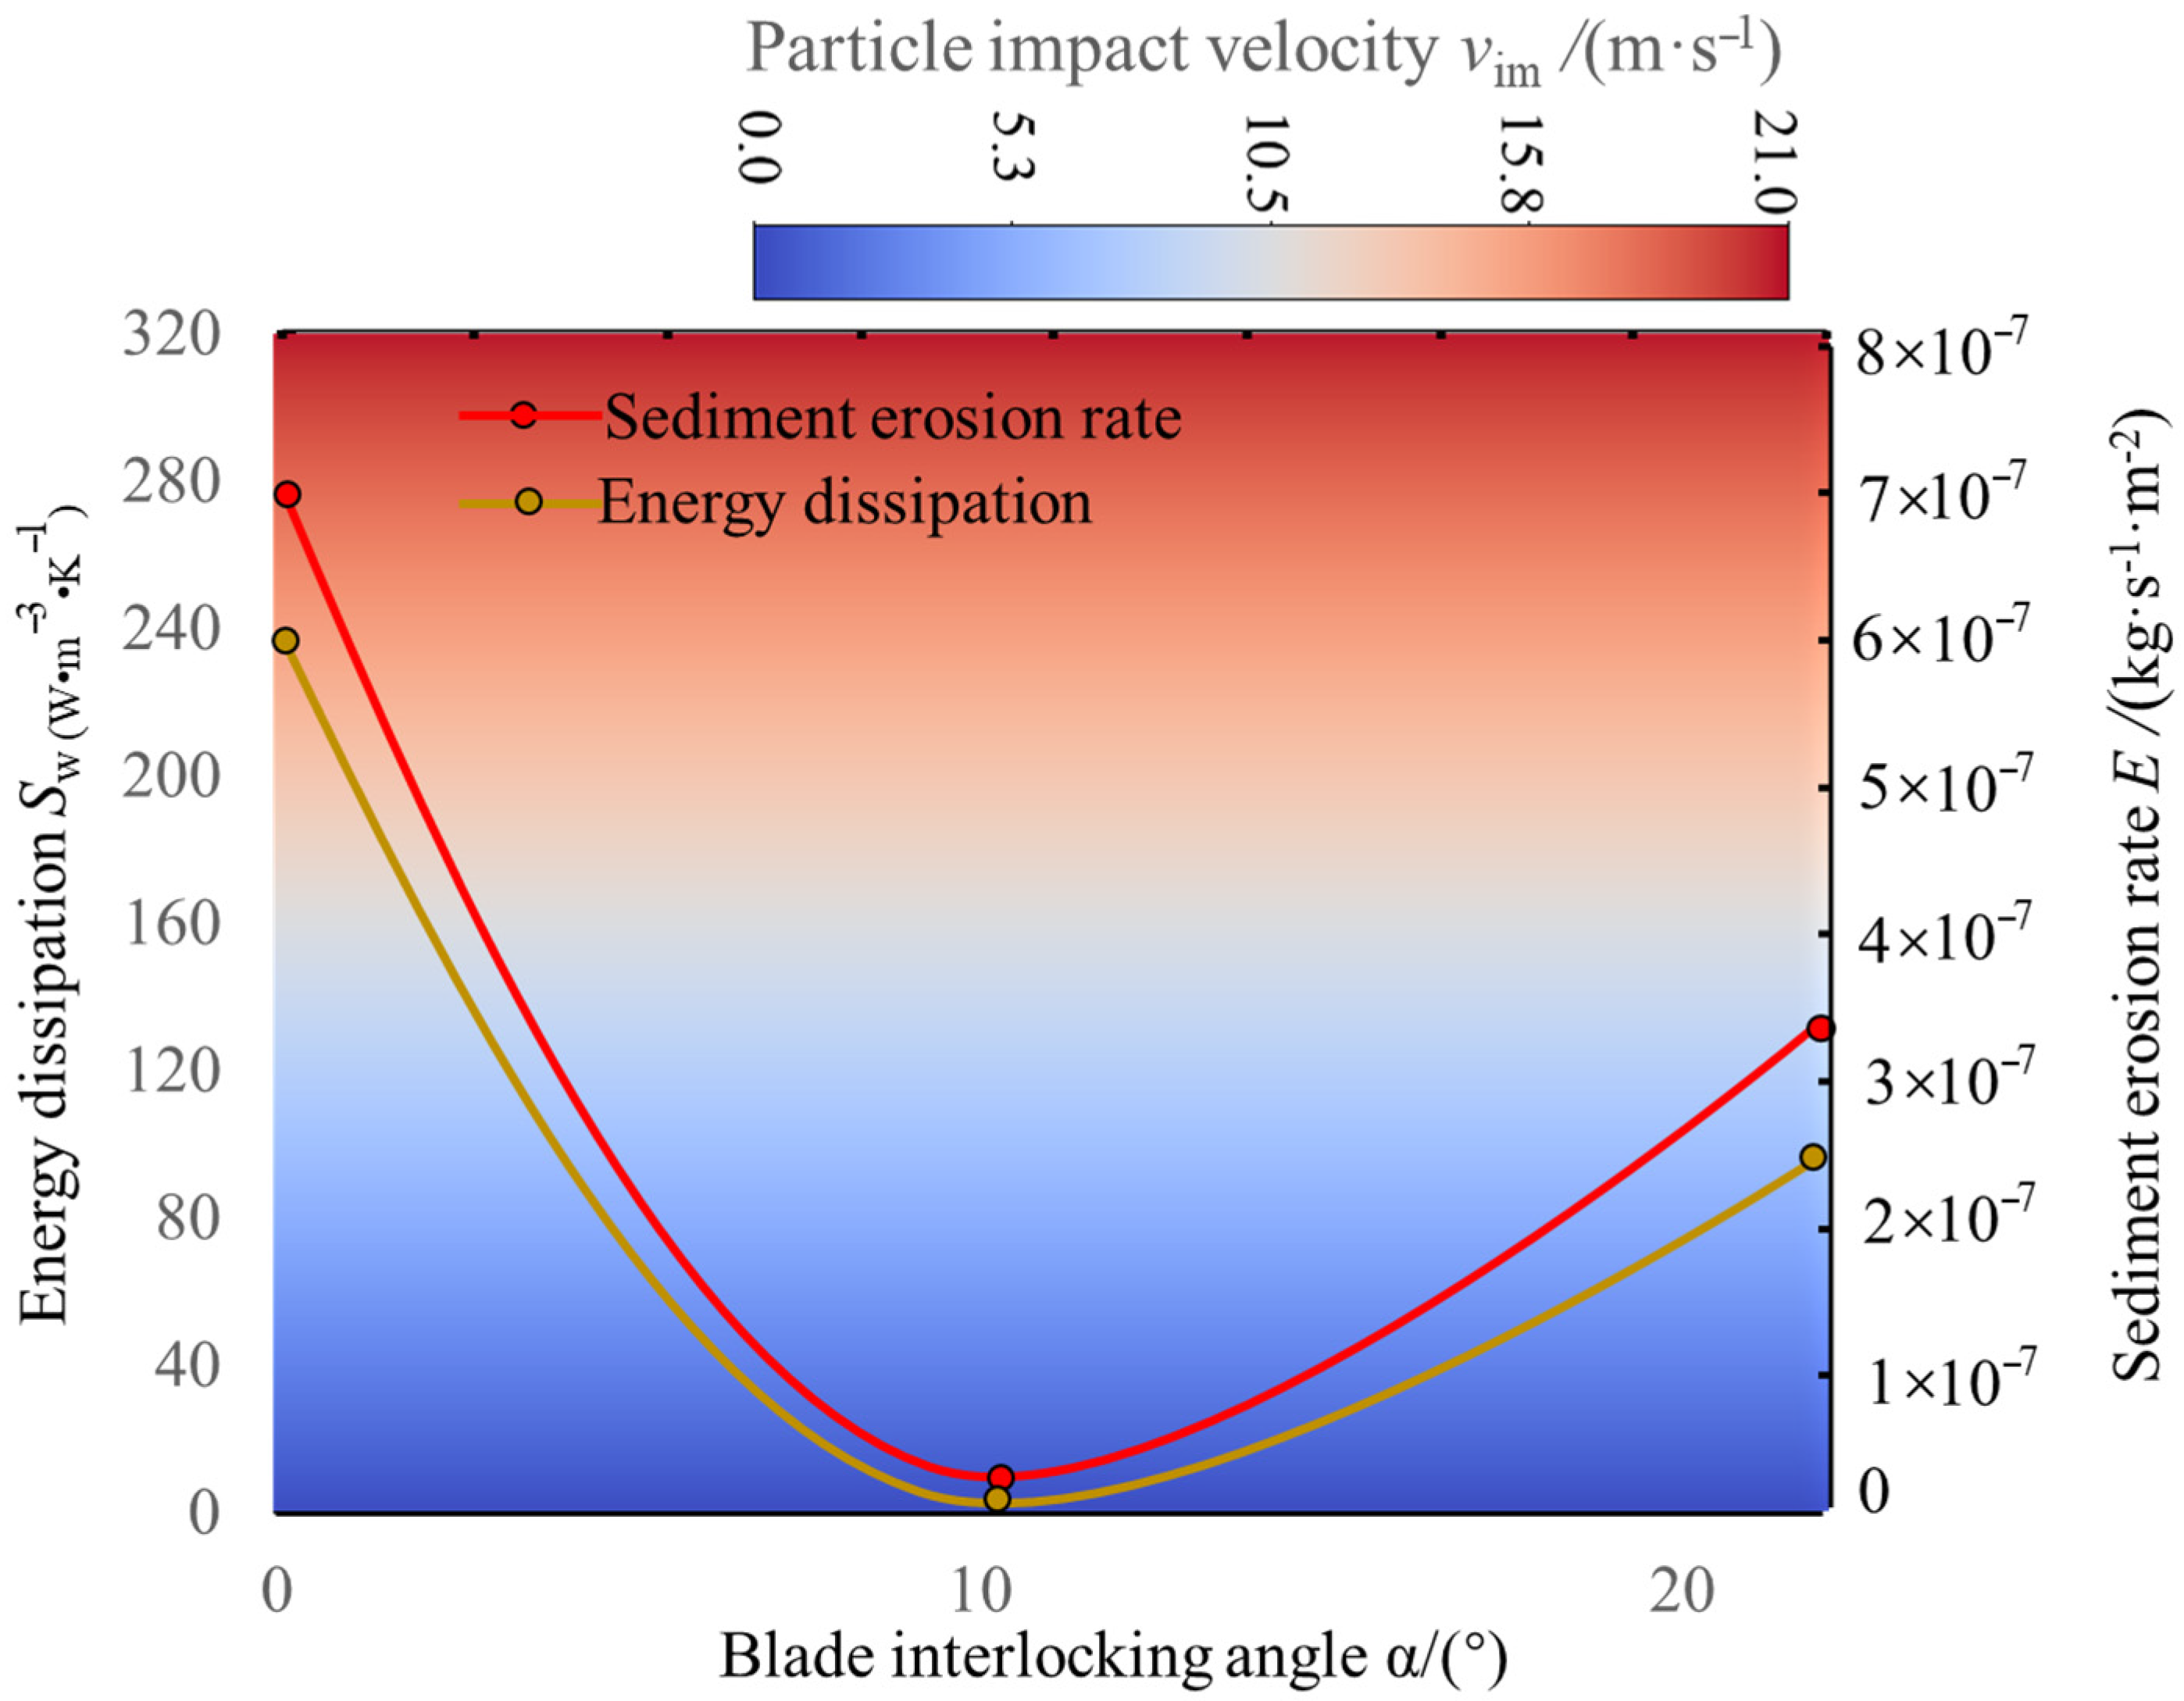
The previous sections analyzed and studied the flow, erosion, and energy dissipation characteristics of the unit under different schemes. Research has shown that blades are the main components contributing to differences in pump performance. In this section, the erosion characteristics, sediment particle movement, and wall friction loss on a single blade are selected for the correlation analysis. Figure 23, Figure 24 and Figure 25 show the distribution of the particle flow on the blade wall under different schemes. The area with the highest erosion rate on the blade surface under Scheme I was mainly concentrated in the middle of the blade suction surface, which was also the area with the most significant wall friction loss. The maximum friction loss is 320 W·m−3·K−1. It was also the area with the most considerable particle impact velocity, with a maximum relative impact velocity of 21.0 m·s−1. The particle flow trajectory indicated that the erosion on the blade surface was mainly frictional and that the particles slid along the blade surface, causing damage to the wall surface. In Scheme II, the distribution of the erosion rate on the blade wall is mainly concentrated in extremely small areas, such as the blade inlet and outlet. The friction loss on the blade surface was minimal, much smaller than that shown in Scheme I. The maximum movement speed of the particles is 15.3 m·s−1, and the particle flow trajectory shows that the particles move away from the blade wall without frictional contact with the blade surface. The maximum friction loss is 3.2 W·m−3·K−1. In Scheme III, the erosion rate and friction loss were between those in Schemes I and II. Figure 26 shows the variations in the blade wall particle impact velocity, erosion rate, and energy dissipation rate with the blade angle under different schemes. As the blade interlocking angle increases, the energy dissipation and erosion rates on the blade surface initially decrease. When the blade interlocking angle exceeded 10.85°, the energy dissipation and erosion rates on the blade surface gradually increased with the blade interlocking angle. The area with the most significant impact velocity was also the area with the highest erosion and energy dissipation rates.

5. Conclusions

This paper conducts numerical simulations of solid–liquid two-phase flow to predict and analyze the correlation between energy dissipation and sediment erosion in a multistage centrifugal pump. The conclusions of this study are as follows:
  • The study reveals an evolutionary pattern in flow velocity distribution across the stages of a three-stage centrifugal pump: the first-stage impeller inlet exhibits high but uneven velocity, prone to local high-speed jets; the second stage shows more uniform distribution due to improved inflow, yet with a strengthened velocity gradient in the impeller passage; the final stage develops high-speed zones induced by secondary flows and separation vortices near the blade pressure side trailing edge and the tongue region. This progression from disorder to order and then to complex structures directly influences particle trajectories and energy transfer efficiency.
  • The study reveals how blade angles affect wear and energy loss by altering flow patterns and particle impacts. In Scheme I, particles slide along the pressure surface, causing banded wear and increased turbulence. Scheme II’s symmetrical blade arrangement localizes wear to the trailing edge and reduces energy loss through improved flow attachment. Scheme III’s staggered angles lead to direct suction surface impacts, creating pit-shaped erosion and significantly higher turbulence dissipation.
  • Sediment erosion and energy dissipation in multistage centrifugal pumps are coupled through flow irreversibility. High-erosion regions spatially coincide with high entropy production zones. Particle impacts increase wall roughness, inducing flow separation and turbulence, thereby raising viscous dissipation by 15–25%. Flow disturbances from particles amplify turbulent dissipation, with fluctuating entropy production exceeding 35% in later stages. Optimizing blade angles simultaneously reduces both erosion and entropy production, demonstrating feasible synergistic improvement through flow control.

Author Contributions

Conceptualization, X.S.; methodology, X.S.; software, H.L.; validation, B.Z.; formal analysis, B.Z.; investigation, B.Z.; resources, B.Z.; data curation, B.Z.; writing—original draft preparation, X.S.; writing—review and editing, B.X.; supervision, M.L.; funding acquisition, X.S. All authors have read and agreed to the published version of the manuscript.

Funding

This research was funded by National Natural Science Foundation of China (Grant number 52306042).

Data Availability Statement

The data that support the findings of this study are available from the corresponding author upon reasonable request.

Conflicts of Interest

The authors declare that they have no known competing financial interests or personal relationships that could have appeared to influence the work reported in this paper.

References

  1. Shen, Z.; Chu, W.; Li, X.; Dong, W. Sediment erosion in the impeller of a double-suction centrifugal pump—A case study of the Jingtai Yellow River Irrigation Project, China. Wear 2019, 422–423, 269–279. [Google Scholar] [CrossRef]
  2. Shen, Z.; Li, R.; Han, W.; Quan, H.; Guo, R. Erosion Wear on Impeller of Double-Suction Centrifugal Pump due to Sediment Flow. J. Appl. Fluid Mech. 2020, 13, 1131–1142. [Google Scholar] [CrossRef]
  3. Bandi, S.; Banka, J.; Kumar, A.; Rai, A.K. Effects of sediment properties on abrasive erosion of a centrifugal pump. Chem. Eng. Sci. 2023, 277, 118873. [Google Scholar] [CrossRef]
  4. El-Emam, M.A.; Zhou, L.; Yasser, E.; Bai, L.; Shi, W. Computational Methods of Erosion Wear in Centrifugal Pump: A State-of-the-Art Review. Arch. Comput. Methods Eng. 2022, 29, 3789–3814. [Google Scholar] [CrossRef]
  5. Fetrati, M.; Pak, A. Numerical simulation of sanding using a coupled hydro-mechanical sand erosion model. J. Rock Mech. Geotech. Eng. 2020, 12, 811–820. [Google Scholar] [CrossRef]
  6. Gautam, S.; Acharya, N.; Lama, R.; Chitrakar, S.; Neopane, H.P.; Zhu, B.; Dahlhaug, O.G. Numerical and experimental investigation of erosive wear in Francis runner blade optimized for sediment laden hydropower projects in Nepal. Sustain. Energy Technol. Assess. 2022, 51, 101954. [Google Scholar] [CrossRef]
  7. Gautam, S.; Neopane, H.P.; Acharya, N.; Chitrakar, S.; Thapa, B.S.; Zhu, B. Sediment erosion in low specific speed francis turbines: A case study on effects and causes. Wear 2020, 442–443, 203152. [Google Scholar] [CrossRef]
  8. Han, W.; Kang, J.; Wang, J.; Peng, G.; Li, L.; Su, M. Erosion estimation of guide vane end clearance in hydraulic turbines with sediment water flow. Mod. Phys. Lett. B 2018, 32, 1850100. [Google Scholar] [CrossRef]
  9. Hong, G.; Zhang, Q.; Yu, G. Trajectories of coarse granular sediment particles in a simplified centrifugal dredge pump model. Adv. Mech. Eng. 2016, 8, 1687814016680143. [Google Scholar] [CrossRef]
  10. Lu, J.L.; Guo, P.C.; Zheng, X.B.; Zhao, Q.; Luo, X.Q. Numerical simulation of flow in centrifugal pump under cavitation and sediment condition. IOP Conf. Ser. Earth Environ. Sci. 2012, 15, 032056. [Google Scholar] [CrossRef]
  11. Song, X.; Yao, R.; Shen, Y.; Bi, H.; Zhang, Y.; Du, L.; Wang, Z. Numerical Prediction of Erosion Based on the Solid-Liquid Two-Phase Flow in a Double-Suction Centrifugal Pump. J. Mar. Sci. Eng. 2021, 9, 836. [Google Scholar] [CrossRef]
  12. Pang, J.; Liu, H.; Liu, X.; Yang, H.; Peng, Y.; Zeng, Y.; Yu, Z. Study on sediment erosion of high head Francis turbine runner in Minjiang River basin. Renew. Energy 2022, 192, 849–858. [Google Scholar] [CrossRef]
  13. Aponte, R.; Teran, L.; Grande, J.; Coronado, J.; Ladino, J.; Larrahondo, F.; Rodríguez, S. Minimizing erosive wear through a CFD multi-objective optimization methodology for different operating points of a Francis turbine. Renew. Energy 2020, 145, 2217–2232. [Google Scholar] [CrossRef]
  14. Qian, Z.; Su, J.; Guo, Z.; Yang, B.; Dong, J. Experimental investigation of sediment erosion in a double-suction centrifugal pump in sandy rivers. IOP Conf. Ser. Earth Environ. Sci. 2021, 774, 012049. [Google Scholar] [CrossRef]
  15. Mamazhonov, M.; Shakirov, B.; Matyakubov, B.; Makhmudov, A. Polymer materials used to reduce waterjet sediment erosion of pump parts. J. Phys. Conf. Ser. 2022, 2176, 012048. [Google Scholar] [CrossRef]
  16. Serrano, R.O.P.; Santos, L.P.; Viana, E.M.d.F.; Pinto, M.A.; Martinez, C.B. Case study: Effects of sediment concentration on the wear of fluvial water pump impellers on Brazil’s Acre River. Wear 2018, 408–409, 131–137. [Google Scholar] [CrossRef]
  17. Wang, Y.; Wang, X.; Chen, J.; Li, G.; Liu, H.; Xiong, W. An experimental insight into dynamic characteristics and wear of centrifugal pump handling multi-size particulate slurry. Eng. Fail. Anal. 2022, 138, 106303. [Google Scholar] [CrossRef]
  18. Pan, J.; Pan, Y.; Liu, Q.; Yang, S.; Tao, R.; Zhu, D.; Xiao, R. FED evaluation in a small double-suction reversible pump turbine considering sediment erosion. J. Energy Storage 2024, 76, 109549. [Google Scholar] [CrossRef]
  19. Wu, X.; Su, P.; Wu, J.; Zhang, Y.; Wang, B. Research on the Relationship between Sediment Concentration and Centrifugal Pump Performance Parameters Based on CFD Mixture Model. Energies 2022, 15, 7228. [Google Scholar] [CrossRef]
  20. Xiao, Y.; Guo, B.; Ahn, S.-H.; Luo, Y.; Wang, Z.; Shi, G.; Li, Y. Slurry Flow and Erosion Prediction in a Centrifugal Pump after Long-Term Operation. Energies 2019, 12, 1523. [Google Scholar] [CrossRef]
  21. Yang, C.X.; Dong, F.D.; Cheng, X.R. Numerical investigation of sediment erosion to the impeller in a double-suction centrifugal pump. IOP Conf. Ser. Mater. Sci. Eng. 2013, 52, 062004. [Google Scholar] [CrossRef]
  22. Zhao, W.; Zhao, G. Numerical investigation on the transient characteristics of sediment-laden two-phase flow in a centrifugal pump. J. Mech. Sci. Technol. 2018, 32, 167–176. [Google Scholar] [CrossRef]
  23. Song, X.; Wang, Z. Numerical prediction of the effect of free surface vortex air-entrainment on sediment erosion in a pump. Proc. Inst. Mech. Eng. Part A J. Power Energy 2022, 236, 1297–1308. [Google Scholar] [CrossRef]
  24. Cao, J.; Luo, Y.; Presas, A.; Mao, Z.; Wang, Z. Numerical analysis on the modal characteristics of a pumped storage unit runner in cavitating flow. J. Energy Storage 2022, 56, 105998. [Google Scholar] [CrossRef]
  25. Song, X.; Qi, D.; Xu, L.; Shen, Y.; Wang, W.; Wang, Z.; Liu, Y. Numerical Simulation Prediction of Erosion Characteristics in a Double-Suction Centrifugal Pump. Processes 2021, 9, 1483. [Google Scholar] [CrossRef]
  26. Kan, K.; Yang, Z.; Lyu, P.; Zheng, Y.; Shen, L. Numerical study of turbulent flow past a rotating axial-flow pump based on a level-set immersed boundary method. Renew. Energy 2021, 168, 960–971. [Google Scholar] [CrossRef]
  27. Kan, K.; Xu, Z.; Chen, H.; Xu, H.; Zheng, Y.; Zhou, D.; Muhirwa, A.; Maxime, B. Energy loss mechanisms of transition from pump mode to turbine mode of an axial-flow pump under bidirectional conditions. Energy 2022, 257, 124630. [Google Scholar] [CrossRef]
  28. Li, D.; Wang, H.; Qin, Y.; Han, L.; Wei, X.; Qin, D. Entropy production analysis of hysteresis characteristic of a pump-turbine model. Energy Convers. Manag. 2017, 149, 175–191. [Google Scholar] [CrossRef]
  29. Li, D.; Gong, R.; Wang, H.; Han, L.; Wei, X.; Qin, D. Analysis of vorticity dynamics for hump characteristics of a pump turbine model. J. Mech. Sci. Technol. 2016, 30, 3641–3650. [Google Scholar] [CrossRef]
  30. Rosenberg, G.; Siedlecki, C.A.; Jhun, C.; Weiss, W.J.; Manning, K.; Deutsch, S.; Pierce, W. Acquired Von Willebrand Syndrome and Blood Pump Design. Artif. Organs 2018, 42, 1119–1124. [Google Scholar] [CrossRef]
Figure 1. Erosion of the three-stage double suction centrifugal pump unit.
Jmse 13 02248 g001
Figure 2. Simulation model of the three-stage pump.
Jmse 13 02248 g002
Figure 3. Three-dimensional entire flow passage model grid.
Jmse 13 02248 g003
Figure 4. Erosion rate variation curve under different mesh numbers.
Jmse 13 02248 g004
Figure 5. Comparison of numerical simulation and experiment.
Jmse 13 02248 g005
Figure 6. Sediment erosion and tear on the surface of water pumps.
Jmse 13 02248 g006
Figure 7. Flow velocity distribution within the impeller of Scheme I.
Jmse 13 02248 g007
Figure 8. Flow velocity distribution within the impeller of Scheme II.
Jmse 13 02248 g008
Figure 9. Flow velocity distribution within the impeller of Scheme III.
Jmse 13 02248 g009aJmse 13 02248 g009b
Figure 10. Blade sediment erosion rate distribution of Impeller 1# (Q = 0.715 m3/s).
Jmse 13 02248 g010
Figure 11. Blade sediment erosion rate distribution of Impeller 2# (Q = 0.715 m3/s).
Jmse 13 02248 g011
Figure 12. Blade sediment erosion rate distribution of Impeller 3# (Q = 0.715 m3/s).
Jmse 13 02248 g012
Figure 13. Blade sediment erosion rate distribution of Impeller 1# (Q = 0.83 m3/s).
Jmse 13 02248 g013
Figure 14. Blade sediment erosion rate distribution of Impeller 2# (Q = 0.83 m3/s).
Jmse 13 02248 g014
Figure 15. Blade sediment erosion rate distribution of Impeller 3# (Q = 0.83 m3/s).
Jmse 13 02248 g015
Figure 16. Blade sediment erosion rate distribution of Impeller 1# (Q = 0.92 m3/s).
Jmse 13 02248 g016
Figure 17. Blade sediment erosion rate distribution of Impeller 2# (Q = 0.92 m3/s).
Jmse 13 02248 g017
Figure 18. Blade sediment erosion rate distribution of Impeller 3# (Q = 0.92 m3/s).
Jmse 13 02248 g018
Figure 19. Distribution of turbulence kinetic energy in the flow passage under Scheme I.
Jmse 13 02248 g019
Figure 20. Distribution of turbulence kinetic energy in the flow passage under Scheme II.
Jmse 13 02248 g020
Figure 21. Distribution of turbulence kinetic energy in the flow passage under Scheme III.
Jmse 13 02248 g021
Figure 22. Total entropy production value in each impeller of the pump under different schemes.
Jmse 13 02248 g022
Figure 23. Distribution of particle impact velocity, erosion rate, and wall friction loss on the blade wall under Scheme I.
Jmse 13 02248 g023
Figure 24. Distribution of particle impact velocity, erosion rate, and wall friction loss on the blade wall under Scheme II.
Jmse 13 02248 g024
Figure 25. Distribution of particle impact velocity, erosion rate, and wall friction loss on the blade wall under Scheme III.
Jmse 13 02248 g025
Figure 26. Variations in particle impact velocity, erosion rate and energy dissipation rate on the blade wall with blade interlocking angle.
Jmse 13 02248 g026
Table 1. Design parameters of the multi-stage centrifugal pump.
Flow rate Q (m3/h)Head H (m)Rotation Speed N (r/min)Efficiency ƞ (%)
30013710094.2
Disclaimer/Publisher’s Note: The statements, opinions and data contained in all publications are solely those of the individual author(s) and contributor(s) and not of MDPI and/or the editor(s). MDPI and/or the editor(s) disclaim responsibility for any injury to people or property resulting from any ideas, methods, instructions or products referred to in the content.