Abstract
This study employs the storm surge numerical model originally developed for the Bohai Sea. In contrast to the previous work, the current simulation focuses on the South China Sea and severe weather events, with a case study conducted through the numerical simulation of the storm surge induced by Typhoon “Mangkhut” on 15–17 September 2018. The typhoon wind field serves as a critical forcing factor influencing simulation accuracy. Therefore, five different wind fields were employed as driving conditions: the ERA5 reanalysis wind field (EWF), the parameterized Jelesnianski (JWF) and Holland (HWF) wind fields, and two hybrid wind fields (JEWF and HEWF) combining EWF with JWF and HWF, respectively. And the adjoint data assimilation method was applied to invert a physically more consistent wind stress drag coefficient (CD). The results indicate the model effectively reproduced this dynamic process. After assimilation, the simulated water levels showed significantly improved agreement with measurements, with errors reduced by 50% (EWF), 47% (JWF), 48% (JEWF), 26% (HWF), and 42% (HEWF), respectively. And JWF not only exhibited a smaller MAE than HWF but also yielded a more reasonable CD, demonstrating its superior performance in this typhoon case. The hybrid strategy further reduced errors to 0.14 m, effectively mitigating the limitations of individual wind fields. This study offers a new perspective on adjoint assimilation-based numerical modeling of storm surges in the South China Sea.
1. Introduction
Storm surges are typically triggered by intense coastal storms and meteorological disturbances, with low atmospheric pressure and strong winds being the primary contributing factors [1,2,3]. Storm surges induced by typhoons are among the most destructive and deadliest coastal natural disasters due to their high frequency, broad impact scope, and intense destructive power, generally accompanied by extreme winds, enormous waves, and severe flooding [4,5]. According to statistics, approximately 80 to 90 tropical cyclones occur globally each year, resulting in significant economic losses and casualties in affected coastal areas [6,7,8]. On average, between 0.8 and 1.1 million people worldwide are affected by storm surge disasters annually, and even the most severe storm surge events have caused hundreds of thousands of fatalities and enormous economic damage [9]. The western North Pacific is the most active region for tropical cyclones globally, and the southeastern coast of China is one of the areas most severely affected by these events [10,11,12,13]. The South China Sea, in particular, is among the world’s most frequent typhoon breeding grounds [14]. It is a large semi-enclosed marginal basin in the western Pacific, characterized by an extensive continental shelf. It connects to the East China Sea via the Taiwan Strait and neighbors the northeastern Pacific through the Luzon Strait [15]. The climate of the South China Sea is strongly influenced by the East Asian monsoon system, with the southwestern monsoon prevailing from May to August and the powerful northeastern monsoon persisting from September to April [16,17]. For instance, Super Typhoon “Yagi” (2024) made landfall in Hainan Province with a maximum wind speed of 62 m/s, affecting approximately 1.2 million people and resulting in direct economic losses of around 80 billion CNY [18]. Typhoon “Hato” (2017) induced an extreme storm surge of 2.79 m at the Zhuhai Station, setting the highest water level ever recorded at that site. The event caused significant casualties, including six fatalities in Guangdong Province, and direct economic losses exceeding 800 million CNY [19]. Therefore, conducting numerical simulation studies on storm surges is of great practical significance and application value.
The formation and evolution of storm surges involve complex interactions among multiple driving factors, such as meteorological forcing, water depth, astronomical tides, and wave effects, which often induce significant nonlinear responses [4]. Therefore, understanding the development and dynamic mechanisms of typhoon-induced storm surges requires an integrated consideration of atmosphere-ocean interactions [20]. Numerical modeling serves as an effective technical approach, capable of simulating storm surge heights and flood inundation extents based on typhoon parameters and regional geographical features [21,22]. For instance, Wu et al. (2018) developed a fully coupled two-way atmosphere–ocean model adapted to the South China Sea region to analyze atmospheric dynamic processes and typhoon-induced storm surges, thereby revealing structural characteristics of wind and pressure fields as well as spatiotemporal evolution patterns of storm surges and wind-driven currents [23]. Li et al. (2020) employed the coupled ADCIRC + SWAN model to investigate the influence of typhoon intensity and size on storm surge and wave setup in the South China Sea, using Super Typhoon Hato (2017) as a case study [24]. Wang et al. (2020) applied the Finite Volume Coastal Ocean Model (FVCOM) to simulate the storm surge triggered by Typhoon Hato in the Pearl River Estuary and southern Guangdong coastal waters, providing a systematic understanding of the hydrodynamic mechanisms [19]. Hu et al. (2024) conducted high-resolution numerical experiments on Typhoon In-fa (2021) using the Regional Ocean Modeling System (ROMS), offering a comprehensive analysis of key factors influencing hydrodynamic processes in the region [25]. To enhance the accuracy of ocean numerical models, the adjoint data assimilation method has been extensively utilized as a powerful tool to integrate measured data with dynamical models, thereby reducing the discrepancies between model predictions and actual measurements [26,27]. This technique directly assimilates spatiotemporally varying measured data into numerical models while maintaining consistency with model dynamics and physical constraints, with the aim of providing an optimal representation of the time-varying marine environment [28,29]. For instance, Li et al. (2013) utilized a three-dimensional ocean model and its adjoint to simultaneously optimize the initial conditions and wind stress drag coefficient in the South China Sea, demonstrating the feasibility of this approach in improving storm surge forecasting accuracy [30]. Gao et al. (2015) utilized the adjoint data assimilation method to optimize the bottom friction coefficients and internal tidal dissipation rates in the South China Sea [31]. Jiang et al. (2018) employed the adjoint data assimilation method to optimize the deployment locations of submerged buoys based on the existing observation network in the South China Sea, which can provide a scientific reference for designing future buoy deployment strategies in the region [32]. It is evident that numerical models for storm surge simulation have been widely employed in the South China Sea region with increasingly high precision, while the application of adjoint data assimilation methods remains relatively limited in this context.
The magnitude and evolution of typhoon-induced storm surges are governed by a combination of factors, among which the intrinsic meteorological properties of the storm are considered the most influential [33]. The quality of the typhoon wind field data largely determines the accuracy of numerical models [34,35,36]. Currently, parametric wind field models are generally classified into two main categories: the first type utilizes empirical wind profile functions to recreate the spatial wind structure using the maximum wind speed as a key input, exemplified by the Jelesnianski and Rankine models; the second type is based on atmospheric pressure distribution models and derives wind speed by numerically solving the gradient wind balance equation, as implemented in the frameworks introduced by Holland [37,38,39]. For example, Shao et al. (2018) developed Holland model wind fields using observations from 10 buoys in the South China Sea and East China Sea between 2011 and 2014 and compared them with ERA-Interim reanalysis, showing that the model performs well near the cyclone center but underestimates wind speed in peripheral regions [40]. Furthermore, reanalysis datasets often underestimate tropical cyclone intensity and fail to accurately represent the wind speed structure near the typhoon center [41,42]. In contrast, parametric typhoon wind field models are typically focused on the cyclone core region. Therefore, effectively integrating both approaches offers a more realistic representation of the wind field. For instance, Jiang et al. (2023) simulated typhoon wave–current interactions near Hainan Island using the coupled ADCIRC + SWAN model driven by a hybrid wind field (integrating parametric and ERA5 reanalysis data), which showed strong agreement with observations [43]. Although the hybrid wind field approach is relatively mature, it nevertheless has inherent limitations. However, as a typhoon approaches shallow coastal areas or undergoes landfall, factors including topography and varying surface conditions result in more complex asymmetric wind structures.
Building upon previous work, this study extends a storm surge model originally applied to the Bohai Sea to the South China Sea region. Unlike earlier simulations focused on weaker meteorological conditions, the present research takes Super Typhoon Mangkhut (international code: 1822) as a case study to reconstruct the storm surge dynamics associated with this severe weather event [44]. The typhoon entered the South China Sea on 15 September Beijing Time (BT), and the simulation period spans 66 h from 03:00 BT on 15 September to 20:00 BT on 17 September. To investigate the influence of wind fields on simulation results, the Jelesnianski (JWF) and Holland (HWF) parametric wind models were constructed and, respectively, blended with the ERA5 reanalysis wind field (EWF) to produce two hybrid wind products (JEWF and HEWF). Each hybrid wind product was incorporated into the model to evaluate its feasibility. In addition, the adjoint data assimilation technique was applied to all five wind field products. This method inversely optimizes key parameters through the back propagation of discrepancies between simulated results and field measurements. Specifically, the differences between simulated and measured water levels (η) were used to inversely calibrate the wind stress drag coefficient (CD), thereby systematically evaluating its impact on the reconstruction of typhoon-induced storm surges in the South China Sea.
2. Materials and Methods
2.1. Data
The study area encompasses nearly the entire South China Sea (98.5° E–121.5° E, 2.0° N–25.0° N). Tropical cyclone track data were sourced from the CMA Best Track Dataset maintained by the Tropical Cyclone Data Center of the China Meteorological Administration (https://tcdata.typhoon.org.cn/zjljsjj.html, accessed on 23 July 2025). This dataset provides six-hour position and intensity data for tropical cyclones in the North Pacific basin since 1949. Since 2018, the temporal resolution of best track data for landfalling typhoons in China has been increased to 3 h during the 24 h pre-landfall period and the inland phase. Key parameters include the longitude and latitude of the typhoon center, the central minimum pressure, and the maximum 2 min mean sustained wind speed near the center.
According to the CMA Best Track Dataset, Typhoon “Mangkhut” originated as a tropical storm over the northwestern Pacific Ocean at 20:00 Beijing Time (BT) on 7 September 2018, with its initial center located at 12.9° N, 165.3° E. Following its formation, the typhoon moved predominantly west-northwestward and underwent rapid intensification. It reached its peak intensity on 11 September, with a maximum sustained wind speed of 65 m/s. Around 2:00 BT on 15 September, Typhoon “Mangkhut” made landfall along the northeastern coast of Luzon Island, Philippines, at super typhoon intensity. Due to interaction with the mountainous terrain of Luzon, it entered the South China Sea on 15 September after traversing the northern region of Luzon, Philippines. It subsequently made landfall in Jiangmen, Guangdong Province, China (22.3° N, 112.5° E) at 17:00 BT on 16 September. At landfall, the maximum 2 min sustained wind speed near the center was recorded at 42 m/s, corresponding to a Category 14 tropical cyclone on the Chinese intensity scale, with a central minimum sea-level pressure of 955 hPa. Due to the degradation of its convective structure and increased difficulty in identifying a well-defined circulation center, the CMA discontinued issuing warnings for the system at 20:00 BT on 17 September. Throughout its influence period, Typhoon “Mangkhut” induced substantial and prolonged storm surges, causing extensive impacts on both the marine environment of the South China Sea and the coastal regions (Figure 1).
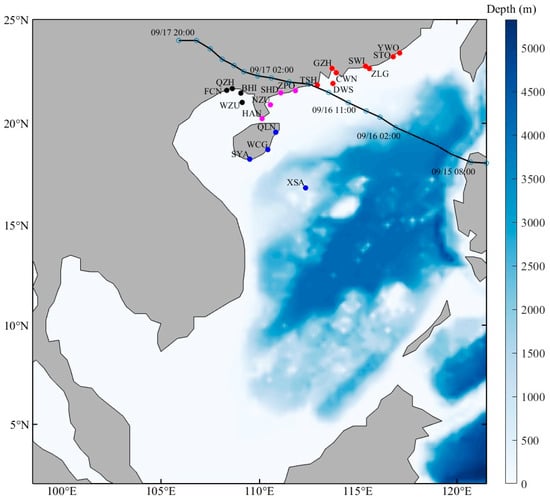
Figure 1.
Spatial distribution of water depth and 20 tide gauge stations in the South Sea (the gray part represents the land, and the black line represents the typhoon track, the blue hollow circles on the black line represent the positions of the typhoon center, the time is Beijing Time. The dot colors in the figure distinguish the geographical locations of the stations: red indicates stations on the right side of the typhoon track, magenta indicates those on the left side, blue represents stations near Hainan Island, and black denotes stations in the Beibu Gulf region).
And hourly water level data were obtained from in situ measurements at 20 tide gauge stations along the southeastern coast of China (BHI, CWN, DWS, FCN, GZH, HAN, NZU, QLN, QZH, SHD, STO, SWI, SYA, WCG, WZU, XSA, YWO, ZLG, and ZPO). The exact geographic coordinates of all stations are summarized in Table A1 of Appendix A for consultation. Furthermore, the T-tide tidal analysis toolbox was employed in this study to extract tidal signals from the hourly water level observations at all the above stations [45]. The tidal component was then subtracted from each water level record to derive the hourly non-tidal residual data at each station. Based on geographical locations, the 20 stations were categorized into four groups: Group 1 comprises eight stations located on the right side of the typhoon track (TSH, DWS, GZH, CWN, SWI, ZLG, STO, and YWO); Group 2 consists of four stations on the left side of the track (ZPO, SHD, NZH, and HAN); Group 3 includes four stations near Hainan Island (QLN, WCG, SYA, and XSA); and Group 4 contains four stations in the Beibu Gulf region (WZU, BHI, QZH, and FCN). The temporal evolution of storm surge water levels (η) across the four defined categories is illustrated in Figure 2.
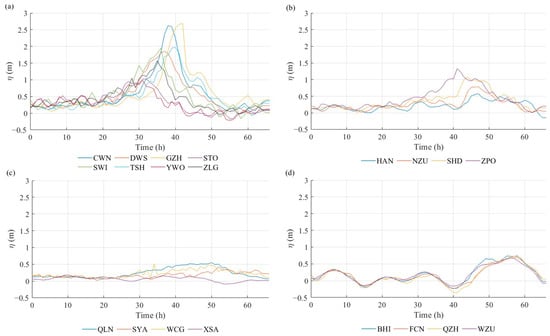
Figure 2.
The temporal evolution of storm surge water levels across the four defined categories: (a) stations located on the right side of the typhoon track, (b) stations located on the left side of the typhoon track, (c) stations near Hainan Island, (d) stations in the Beibu Gulf region.
Figure 2 demonstrates the amplitude of storm surge water level exhibits considerable variability across different stations due to their distinct geographical locations. The stations situated on the right side of the typhoon track (Group 1) experienced significantly greater water level amplification compared to the other three groups. During the typhoon’s landfall, some stations in this region recorded maximum water level heights exceeding 2 m. Additionally, the northwestward propagation of the typhoon resulted in a temporal sequence of responses at the various stations, which propagated from west to east aligned with their respective longitudes. Although several stations on the left side also measured maximum water level surpassing 1 m, the peak values lagged by approximately 6 h on average. This pattern indicates that the storm surge induced on the right side of Typhoon “Mangkhut” was more intense than that on the left, consistent with the asymmetric characteristics commonly observed in tropical cyclones [46]. In contrast, the storm surge amplitudes were relatively small in the deep-water regions around Hainan Island and the Beibu Gulf, with the Beibu Gulf region exhibiting a more pronounced time lag effect.
2.2. Methods
2.2.1. Numerical Adjoint Model
The numerical framework in this study is based on a two-dimensional depth-averaged model, incorporating the adjoint data assimilation method. Both the governing equations and adjoint data assimilation equations employed in this storm surge model remain consistent with those used in a previously established model for the Bohai Sea [44]. The crux of the adjoint data assimilation process lies in deriving the correct adjoint equations and the equations pertaining to the control parameters. Therefore, this model first constructs a cost function that describes the discrepancy between the modeling results and measurements. A Lagrange function is then formulated to seek the values of the model’s control parameters that minimize this cost function. In this study, the primary application of this adjoint data assimilation method is to inversely optimize the wind stress drag coefficient (CD) by back-propagating the errors between the simulated and measured water levels. This modeling system has been thoroughly validated in prior studies and demonstrates reliable performance and applicability.
To improve computational performance and enable a fine-resolution examination of storm surge development in both space and time, the full simulation duration (66 h) was partitioned into 11 sequential 6 h segments in this study. A temporal resolution of 60 s was used in the model to precisely represent surge dynamics. Spatially, a uniform grid configuration with a resolution of 0.25° × 0.25° was adopted.
2.2.2. Model Construction
Wind Field Configuration
Given the demonstrated superiority of ECMWF Reanalysis v5 (ERA5) reanalysis data, hourly 10 m wind fields above sea level during September 2018 were employed, featuring a 0.25° × 0.25° spatial resolution (https://cds.climate.copernicus.eu/datasets/reanalysis-era5-single-levels?tab=overview, accessed on 23 July 2025).
For the numerical simulation of typhoon-induced storm surges, the classical typhoon wind field model Jelesnianski (1965) model and Holland (1980) model were adopted, both being extensively applied in global typhoon research and storm surge numerical simulations [37,39].
The typhoon wind fields were calculated following Jelesnianski:
where r is the distance from the computational grid point to the typhoon center, and are the instantaneous translational velocity components of the typhoon center, and is the maximum wind speed at the typhoon center. R is the radius of maximum winds, it has multiple empirical formulations [47,48]. This model implements the expression proposed by Graham [47]:
where is the latitude of typhoon center, is the translational velocity of typhoon center, and M is the threshold radius for wind profile computation.
And gradient wind components are defined as:
where is the inflow angle of gradient wind, parameterized as in this model:
And the typhoon wind fields were calculated following Holland:
where is the gradient wind speed, is the air density (specified as 1.225 kg·m−3), R is the radius of maximum winds, which is likewise determined using Equation (3), r is the distance from the typhoon center, and f is the Coriolis parameter. The Holland B parameter predominantly governs typhoon intensity and determines the pressure gradient solution. According to Holland, the B parameter is calculated as follows:
where WR is the maximum wind speed at the typhoon center.
To more accurately approximate real wind fields and resolve asymmetric wind distribution during typhoon movement, the parameterization scheme proposed by Miyazaki (1962) was employed to quantify the typhoon translation speed [49]:
Therefore, the total typhoon wind field is obtained by superimposing the gradient wind field and the translational wind field:
Moreover, atmospheric pressure, as another key parameter for characterizing typhoons, plays a critical role in representing the structure of typhoons. Parametric typhoon wind field models are generally constructed by assuming different atmospheric pressure distribution models. Among them, the parametric atmospheric pressure field proposed by Jelesnianski:
And that proposed by Holland is:
where is the ambient peripheral pressure (set at 1013.25 hPa), is the typhoon central pressure.
It is noteworthy that the parametric typhoon models exhibit superior accuracy near the storm center, whereas the reanalysis wind field demonstrates superior performance at larger radial distances. Consequently, a hybrid approach that integrates both techniques offers an optimal framework for reconstructing the complete typhoon wind field. Accordingly, a similar fusion strategy has been applied to the pressure field [34,50,51,52].
where is the hybrid wind field, is the ERA5 wind field, is the parametric typhoon wind field, is the pressure field from ERA5 reanalysis, is parametric pressure field, is the weighting coefficient, is the typhoon influence coefficient, and typically ranges from 9 to 10, with this study adopting .
Based on this, the spatial distribution of wind vectors and pressure corresponding to the five wind fields are presented in Figure 3: ERA5 reanalysis wind field (EWF), Jelesnianski parametric wind field (JWF), Jelesnianski-ERA5 hybrid wind field (JEWF), Holland parametric wind field (HWF), and Holland-ERA5 hybrid wind field (HEWF), with 17:00 (BT) on 16 September taken as an illustrative example.
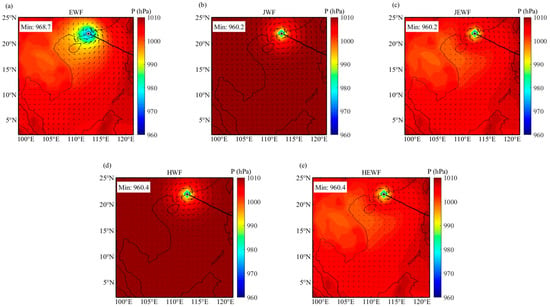
Figure 3.
Spatial distribution of wind vectors and pressure across five wind fields at 17:00 (BT) on 16 September: (a) EWF, (b) JWF, (c) JEWF, (d) HWF, and (e) HEWF (the black line represents the typhoon track).
As shown in Figure 3, the influence of Super Typhoon “Mangkhut” generated a distinct cyclonic wind field and a central low-pressure area over the South China Sea. The location of the minimum central pressure largely coincided with the center of the wind field. The wind field generated by the parametric typhoon model is primarily concentrated near the cyclone’s core, and its outer wind field differs noticeably from the EWF. Furthermore, the minimum pressure represented in the EWF is slightly higher than that in the parametric model. To address these discrepancies, the EWF is incorporated as a background field into the parametric model field. The hybrid wind field not only accurately preserves the high-wind core near the eyewall but also reconstructs a spatially coherent structure consistent with the ambient environment. This hybrid wind field exhibits a more continuous horizontal structure and smoother wind speed gradients, suggesting its spatial distribution pattern aligns more closely with reality.
Numerical Experiment Configuration
Regarding model experiment configuration, it is very similar to the previous one [44].The bottom friction coefficient (k) was uniformly set to 0.001, and the seawater density was set to 1025 kg/m3. For the parameterization of the sea surface wind stress drag coefficient (CD), four comparative experiments were designed:
E1 scheme: A constant drag coefficient was adopted, with CD uniformly set to 0.0026 across the entire domain.
E2 scheme: To evaluate the impact of empirical formulas on model accuracy, another wind-speed-dependent linear parameterization was employed as an additional experiment based on Smith’s formula, expressed as [53]:
where the values of a, b are 0.61 and 0.063, respectively.
E3 scheme: A wind-speed-dependent linear parameterization was employed based on Wujin’s formula, expressed as [54]:
where a, b are empirical coefficients with values of 0.8 and 0.065, respectively, and U10 is the wind speed at 10 m above the sea surface.
E4 scheme: Based on E3 scheme (Equation (13)), the model computes the simulated storm surge water levels through numerical calculations. The discrepancy between the simulated and measured water levels is used as the forcing term to drive the adjoint equations, and backward integration of these equations iteratively optimizes coefficients a and b. This process is repeated until the average error between the simulated and measured water levels is reduced to an acceptable threshold, at which point the inversion is terminated, yielding the optimized coefficients a and b within the CD field.
3. Results
Five wind fields were individually used as the meteorological forcing to drive the numerical model, and storm surge simulations were conducted under four distinct configuration schemes. Figure 4 presents a comparison between the simulated water levels driven by the five wind fields and the measured values under the four configuration schemes, using six representative stations (SWI, TSH, NZU, HAN, SYA and BHI) as an example. Stations SWI and TSH are situated on the right side of the typhoon track, while stations NZU and HAN are on the left side. Station SYA is primarily located on Hainan Island, and station BHI is in the Beibu Gulf. The residuals (ε) between the simulated and measured water levels are further illustrated in Figure 5. Furthermore, the mean absolute error (MAE), root mean square error (RMSE), and correlation coefficient (R) were calculated for each wind field across all 20 tide gauge stations, as summarized in Table 1.
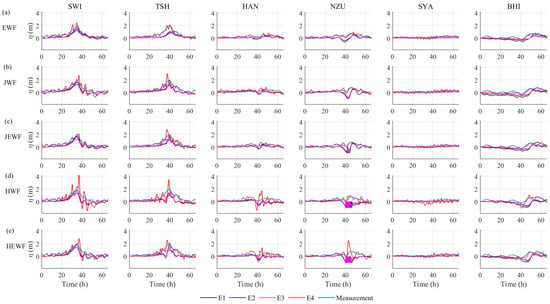
Figure 4.
Comparison of simulated and measured water levels driven by five wind fields (exemplified with six stations, (a) EWF, (b) JWF, (c) JEWF, (d) HWF, and (e) HEWF, E1–E4: Four CD parameterization schemes (see Numerical Experiment Configuration for definitions)).
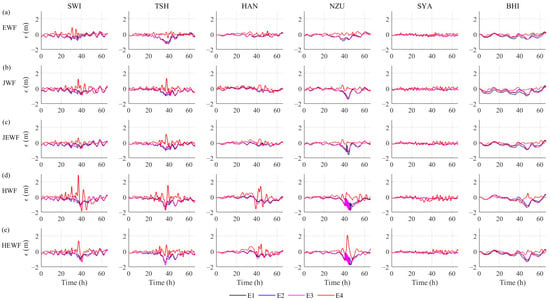
Figure 5.
Residuals between simulated and measured water levels driven by five wind fields (exemplified with six stations, (a) EWF, (b) JWF, (c) JEWF, (d) HWF, and (e) HEWF).

Table 1.
Average values of MAE, RMSE, and R of water levels at 20 tide gauge stations for five wind fields under four schemes.
As evidenced in Table 1 and Figure 4, notable temporal shifts and amplitude discrepancies exist between the simulated and measured water levels for E1, E2 and E3 schemes. In contrast, the E4 scheme, which incorporates the adjoint data assimilation, demonstrates superior performance across all wind fields. In contrast, the E4 scheme incorporating adjoint data assimilation demonstrated superior performance across all wind field configurations. It reduced the MAE to 0.12 m (EWF), 0.16 m (JWF), 0.14 m (JEWF), 0.25 m (HWF), and 0.18 m (HEWF), corresponding to error reductions of 50% (EWF), 47% (JWF), 48% (JEWF), 26% (HWF), and 42% (HEWF) compared to the E3 scheme. The results indicate that the E4-based adjoint data assimilation achieved the best agreement with observed water level time series, exhibiting consistency in both the magnitude and timing of peak water level events. Similarly, for the R, the E4 scheme also demonstrates significant improvement, with simulated results exhibiting a higher grade of correlation with observed data and superior consistency compared to all other schemes.
Furthermore, the residuals presented in Figure 5 indicate that, overall, the E4 scheme produces more stable and smaller errors compared to the other three schemes. And the simulated water levels and residuals of E1, E2, and E3 show considerable similarity. Although higher-frequency oscillations and slight instability during the water level growth phase are observed in E4 under all five wind fields, their amplitudes are significantly smaller than those in the E1, E2 and E3 schemes. This behavior can be primarily attributed to the optimized, spatiotemporally varying empirical coefficients (a and b) in the E4 scheme achieved through the adjoint data assimilation. In contrast, the CD remains constant in the E1 scheme, while coefficients a and b are set to constant values in the E2 and E3 schemes. The quantitative metrics (MAE, RMSE, and R) listed in Table 1 further substantiate the superiority of the E4 scheme. It achieves markedly lower MAE and RMSE values alongside a significantly higher R value than the other schemes. This result is consistent with the conclusion from a previous study under milder weather conditions [44]. In conclusion, the adjoint data assimilation method maintains its effectiveness in enhancing simulation accuracy even during severe weather events, demonstrating considerable potential for applications.
More notably, as indicated by the metrics in Table 1, after excluding the E4 scheme, both the HWF and HEWF schemes exhibit the MAE exceeding 0.3 m. And the RMSE generally remains around 0.4 m, while the R values are consistently low. This may be related to an inappropriate wind stress drag coefficient (CD). These results further indicate that both schemes consistently demonstrate inferior performance. Although the data assimilation method effectively reduces the errors in both wind fields, particularly leading to a notable improvement in HEWF, the final simulation results remain lower than that of the other wind field schemes. The results in Figure 4 and Figure 5 further confirm this conclusion, showing that simulations driven by these wind fields are susceptible to significant bias and oscillation, as seen at station NZU. The underlying cause likely lies in the station’s specific geographical and meteorological conditions: it is situated in shallow waters on the left side of the typhoon’s track and experienced northwesterly winds during the landfall phase. The Holland model’s potential simulation errors under these conditions may lead to model instability. In contrast, the JWF and JEWF demonstrated a superior capability in replicating Typhoon “Mangkhut” within the study area, producing more reliable and stable simulation results. This can likely be attributed to the fundamental differences in the theoretical foundations of the Holland and Jelesnianski models, leading to deviations in both the magnitude and direction of the wind vectors simulated at the station locations. Furthermore, parametric typhoon models are sensitive to parameters such as the radius of maximum wind, which introduces additional uncertainty.
Furthermore, the wind speed is calculated by
where is the wind in the east–west direction (along longitude), and is the wind in the north–south direction (along latitude). Although the EWF demonstrates superior performance in both quantitative metrics and Figure 4 and Figure 5, its maximum wind speed estimated by Equation (14) is only about 32 m/s, which is considerably lower than the observed maximum wind speed of approximately 52 m/s during Typhoon “Mangkhut” over the South China Sea. As a result, the EWF exhibits significant underestimation of intensity in the typhoon core region, leading to overly smoothed simulation results and a failure to capture the realistic dynamic forcing of the storm [55]. Parametric typhoon models accurately capture the peak winds near the typhoon core but are less reliable in the outer regions. The blending scheme overcomes the inherent limitations of both the reanalysis data and the parametric typhoon model by leveraging their complementary strengths. This leads to a more realistic simulation through improvements in both the wind speed range and spatial distribution. Based on the preceding findings, Figure 6 presents the simulated water levels and their residual sequences at six representative tide gauge stations under Scheme E4, as forced by the EWF, JWF, and JEWF.
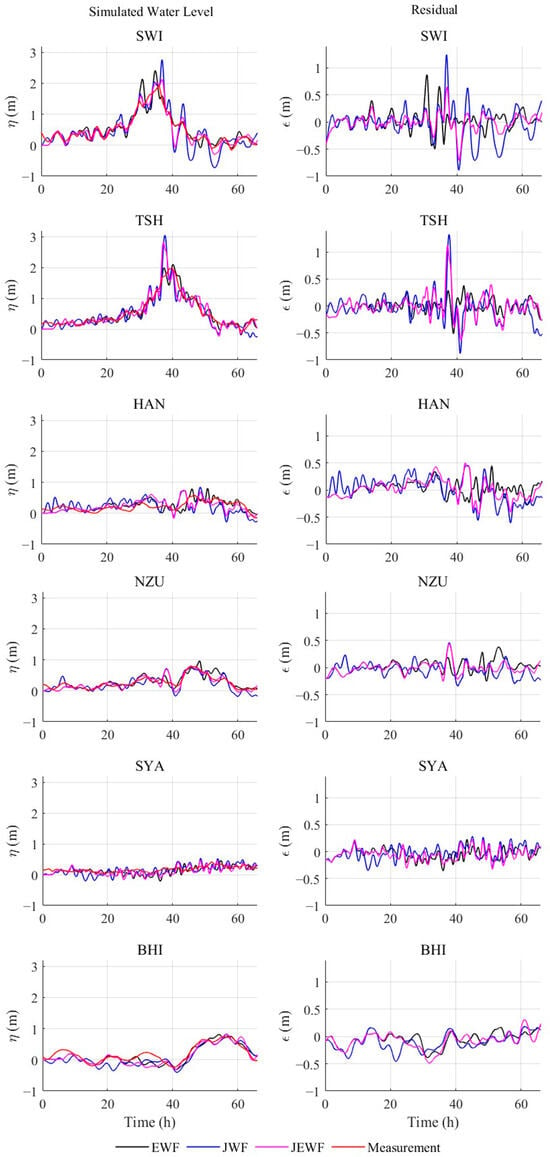
Figure 6.
Simulated water levels and residuals for the EWF, JWF, and JEWF under the E4 assimilation scheme (Columns 1: simulated water levels; Columns 2: residuals).
As illustrated in Figure 6, all three wind fields generally performed well in simulating the storm surge induced by Typhoon “Mangkhut”. In terms of simulating the extreme values of storm surge water level amplitude, the simulation scheme based on the EWF with adjoint data assimilation demonstrated the stability, while both JWF and JEWF exhibited certain high-frequency oscillations and abrupt extreme peaks. This discrepancy may be attributed to the fact that JWF and JEWF are parameterized wind fields that do not fully account for topographic effects on the typhoon, leading to instability in nearshore simulations [56]. It can also be observed that JEWF mitigated the magnitude of extremes to some extent compared to JWF. This improvement benefits from JEWF’s integration of the advantages of both wind fields: it retains the wind speed performance of JWF in the typhoon core region while incorporating the superior representation of peripheral wind speeds in EWF, thereby effectively reducing simulation errors [57]. And the spatial distribution of the CD values for these three wind fields is illustrated in Figure 7.
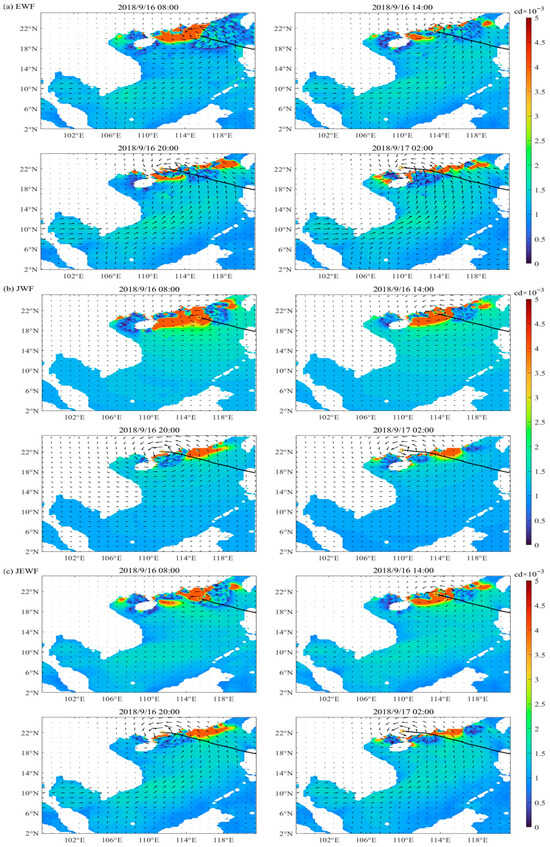
Figure 7.
Spatial distribution of the drag coefficient (CD) derived from the three wind fields. The black line denotes the typhoon track, and the yellow circles mark the positions of the typhoon center.
The time period shown in Figure 7, Figure 8 and Figure 9 encompass the pre-landfall, landfall, and post-landfall stages of Typhoon “Mangkhut”, corresponding to the most significant storm surge water level period at the tide gauge station. The drag coefficient (CD) values computed from three wind field groups based on the E4 scheme consistently remain on the order of 5 × 10⁻³, while exhibiting considerable spatiotemporal complexity [58]. After adjoint data assimilation, the empirical parameters a and b also demonstrate distinct spatiotemporal variations, with their extreme values collocating remarkably well with regions of high CD values, primarily along continental boundaries. Thereby, this approach overcomes the limitation of conventional empirical formulas that account for temporal variation but lack spatial differentiation. However, the value ranges of a and b are relatively narrow compared to that of CD. This likely indicates a saturation and subsequent decay trend in the CD value at wind speeds exceeding 32 m/s [59]. All three wind fields generate extreme CD values, which are predominantly concentrated along the coastline where the typhoon made landfall. This may be one of the reasons for the simulated water levels being higher than the measured values. After the typhoon’s landfall, a notable increase in CD values occurred on the right side of its moving path, which was particularly evident. Comparative analysis indicates that the extreme values simulated by the EWF covered a larger area, while those from the JWF were more concentrated. This discrepancy may be attributed to the high wind speed areas in JWF being significantly concentrated near the typhoon center, reflecting a more centralized energy distribution. In contrast, the JEWF produced intermediate results between these two extremes: its simulated CD values were neither excessively dispersed nor did they exhibit large-scale abrupt variations, showing better agreement with actual measurements. Therefore, in representing the spatial distribution of the CD, the JEWF demonstrated the highest consistency with the actual wind field.
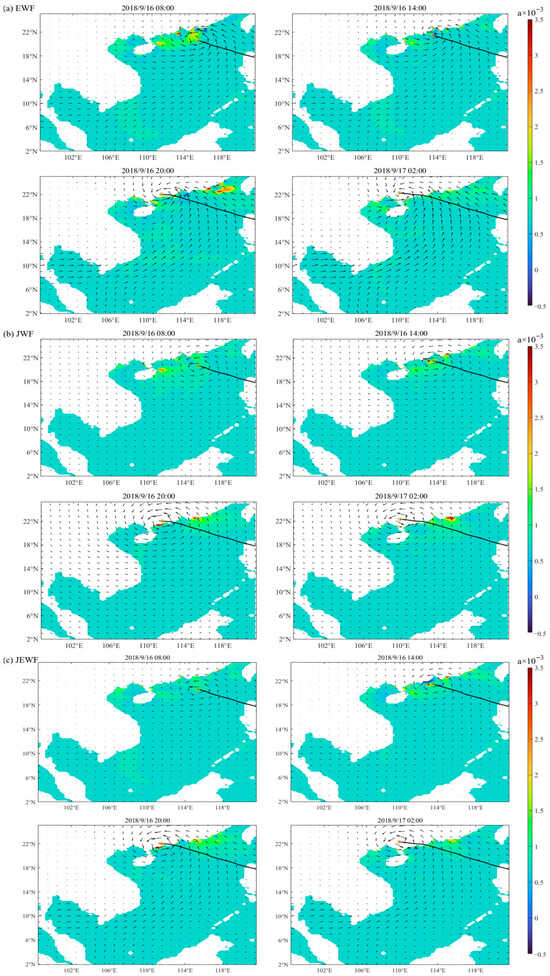
Figure 8.
Spatial distribution of the a values derived from the three wind fields. The black line denotes the typhoon track, and the yellow circles mark the positions of the typhoon center.
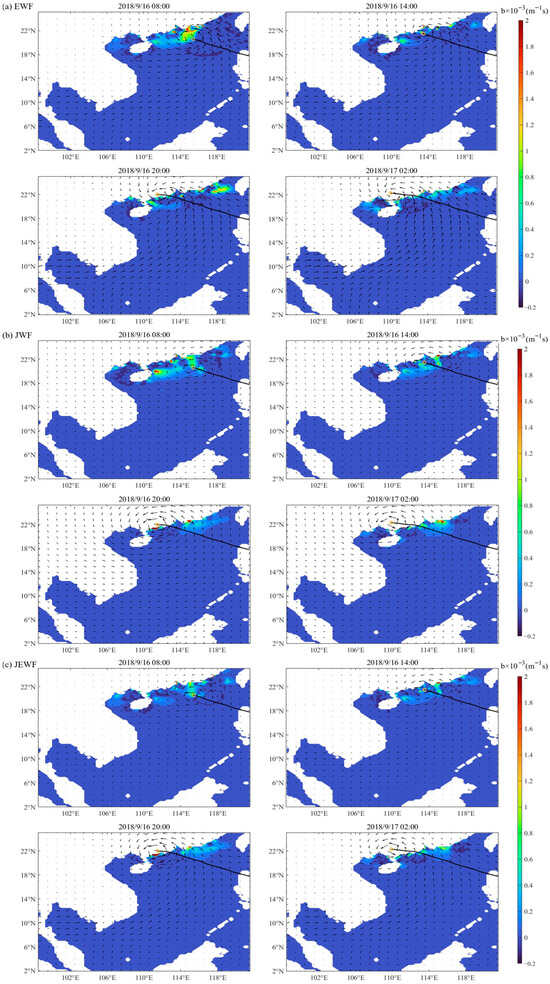
Figure 9.
Spatial distribution of the b values derived from the three wind fields. The black line denotes the typhoon track, and the yellow circles mark the positions of the typhoon center.
It is noteworthy that, as shown in Figure 6, after applying the adjoint data assimilation method, the simulated water levels driven by different wind fields exhibited consistent bias patterns across all stations during the typhoon’s movement, particularly around the 39 h mark during landfall. Specifically, stations on the right side of the typhoon track showed continuously increasing water levels as the typhoon moved northwest, producing extreme values higher than observations. In contrast, stations on the left side (including those near Hainan Island and in the Beibu Gulf) exhibited weaker surge amplitudes and a noticeable lag. The simulation errors were generally larger for right-side stations, especially during landfall, likely related to wind field asymmetry (stronger winds and more complex directional changes on the right) and variations in the radius of maximum winds [56,60]. And the fact that these stations are located in shallow nearshore areas may have reduced model stability and amplified computational errors. The smaller water level amplitude near Hainan Island might be associated with greater local water depth. Additionally, significant errors were observed in the simulated water levels at the Beibu Gulf stations during the initial phase of the simulation, which may also be related inaccuracies in the wind field data. The significant lagged storm surge response observed in this region is likely attributable to its unique semi-enclosed bay geography and the complex dynamic processes it induces. For instance, resonance between persistent wind stress and water motion in shallow areas, and significant wave-current interactions generated by the strait topography, prolongs the duration of water level increase. Simultaneously, nonlinear interactions occur between the storm surge signal and the nearshore tidal phase [61,62,63,64,65]. Future research should prioritize investigating storm surge dynamics in the Beibu Gulf by incorporating tidal effects into models to elucidate the underlying physical processes, thereby enhancing the accuracy and applicability of numerical storm surge models for the South China Sea. Furthermore, the simulated results for the ERA5 wind field are relatively smooth. Future studies will build upon the hybrid approach by further examining the ERA5 data itself, such as conducting error calibration for different wind speeds and regions, or integrating high-resolution observations.
4. Discussion
Owing to the remarkable adaptability of the adjoint data assimilation method, the JEWF demonstrates high simulation accuracy. Figure 10 displays the spatial distribution characteristics of the storm surge water level simulated under the E4 scheme and driven by this wind field.
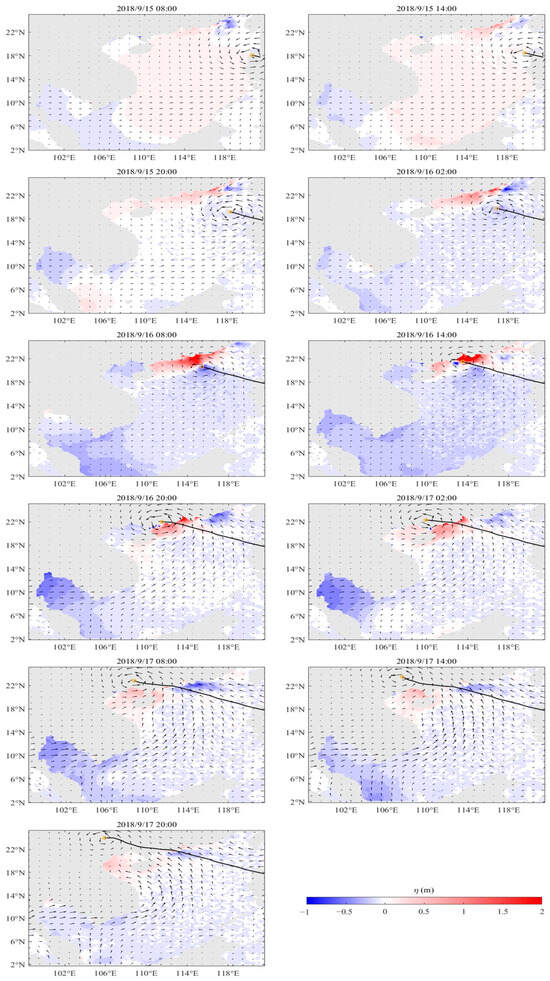
Figure 10.
The spatial distribution of simulated water level driven by JEWF under the E4 scheme. The black line denotes the typhoon track, and the yellow circles mark the positions of the typhoon center.
Figure 10 illustrates the spatial distribution of the storm surge across the South China Sea induced by Typhoon “Mangkhut”. After entering the South China Sea from the Philippine Islands, the typhoon maintained its intensity without significant decay, sustaining wind speeds above 40 m/s until its landfall in Guangdong Province. As the typhoon approached land, both the spatial extent and intensity of the storm surge increased significantly. Along the Pearl River Delta, located on the right side of the typhoon track, the area was initially influenced by northeasterly winds. Starting on 16 September, the wind direction shifted to southeasterly, leading to a rapid rise in water levels. As the typhoon moved toward the northwest, the storm surge inundation area shifted correspondingly westward. By the time of landfall at 17:00 BT, the maximum storm surge water level height along parts of the right-side coastline reached 2 m. In contrast, areas on the left side of the track, including the Beibu Gulf, were initially dominated by northwesterly winds, which subsequently rotated to southwesterly. A noticeable storm surge water level, approximately 1 m in amplitude, occurred after landfall. In deep-water regions, the typhoon’s influence on water levels was minimal, with little storm surge response observed. Consequently, a pronounced right-side bias in storm surge is evident, with the amplitude being significantly higher on the right side of the typhoon track than on the left. This asymmetry may be primarily attributed to the inherent asymmetry of the typhoon wind field. A noticeable surge phenomenon was observed in the Beibu Gulf region following the typhoon’s landfall, which may be largely attributed to the prevailing southeasterly winds that facilitated water transport into the bay and contributed to localized water accumulation. However, due to the complex topography of the Beibu Gulf, the precise dynamic sources and formation mechanisms of these storm surge events require further investigation and verification.
Furthermore, Figure 11 illustrates the spatial variation in water levels simulated by the EWF, JWF, and JEWF wind fields before and after typhoon landfall. It can be observed that the storm surge water levels and the affected area simulated by EWF are generally lower than those of the other two, indicating that this wind field does not fully meet the intensity requirements for typhoon simulation. The JWF, an artificially constructed wind field, exhibits a circular, regular, symmetric, and smooth structure. As a result, it tends to overestimate the magnitude and spatial extent of storm surges during landfall, leading to certain inaccuracies in coastal simulations. In contrast, JEWF incorporates adjustments based on EWF, providing a more realistic representation of the total water level variation. Nevertheless, the JEWF-driven simulation still yields local maximum values of nearly 3 m in extreme surge regions. This phenomenon may be attributed to a combination of factors, including persistent strong wind forcing, uncertainty in the radius of maximum wind estimation, and amplification effects related to the wind stress drag coefficient [33,44,60,66]. Additionally, the complex geometry of the continental coastline in the South China Sea may introduce errors during the CD inversion process, thereby affecting the accuracy of the simulation results [19]. This method has also been utilized in current research for the optimization of parameters like the bottom friction coefficient [67,68,69,70]. In subsequent research, we will incorporate more cases to systematically and progressively deepen the investigation into these issues. Furthermore, the adjoint data assimilation method employed in this study is primarily applied to estimate the parameters a and b based on a predetermined empirical function. This approach allows for a more effective, stepwise definition of the relationship between the coefficients and wind speed compared to directly assimilating CD itself [71]. In future work, we aim to accumulate more case studies, with the ultimate goal of developing more reliable and practical region-specific empirical formulas for the CD parameterization in storm surge models of the South China Sea.
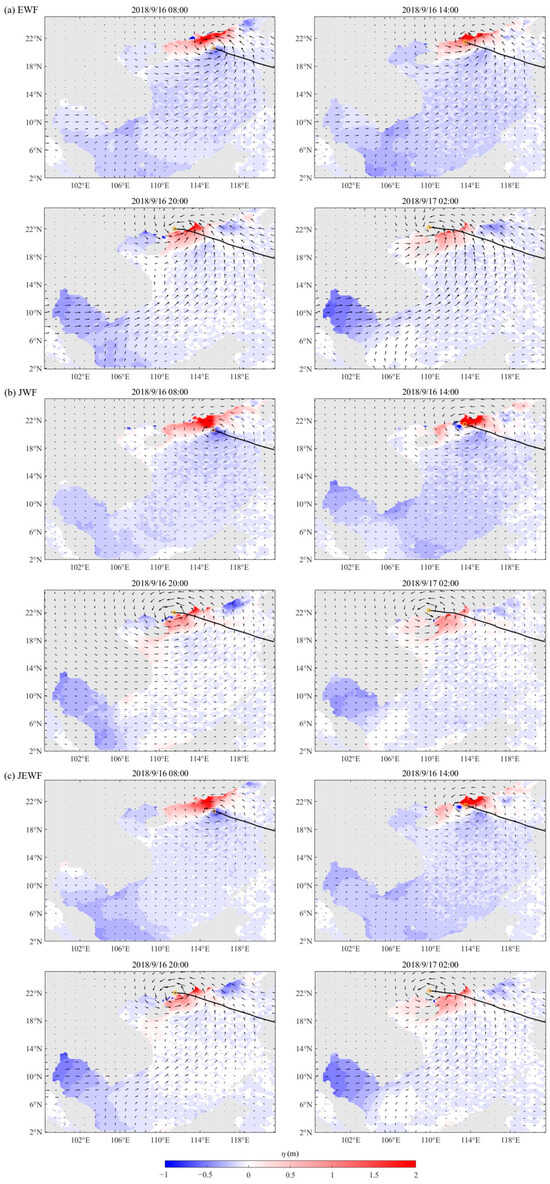
Figure 11.
The partial spatial distribution of simulated water level driven by EWF, JWF and JEWF under the E4 scheme. The black line denotes the typhoon track, and the yellow circles mark the positions of the typhoon center.
5. Conclusions
This study employs a storm surge numerical model, originally applied for the Bohai Sea. In contrast to a previous simulation of a weak weather event in the Bohai region, the present work simulates a severe weather event caused by Typhoon “Mangkhut” as it entered the South China Sea from 15 to 17 September 2018. Given the complexity of typhoon wind fields, five different wind fields were used as forcing inputs: the ERA5 reanalysis wind field, the Jelesnianski typhoon wind field, the Holland typhoon wind field, and two hybrid wind fields produced by merging each parametric typhoon wind field with the ERA5 reanalysis. For the treatment of the CD, four different parameterization schemes were implemented. An adjoint data assimilation method was introduced to inversely optimize the CD by back-propagating the errors between simulated and measured water levels, thereby retrieving a physically more reasonable CD distribution. The results demonstrate that the model successfully reconstructed the storm surge process in the South China Sea, yielding simulated water levels that agree well with measurements.
- (1)
- The model successfully reconstructed the storm surge process induced by Typhoon “Mangkhut” in the South China Sea, demonstrating its capability and regional adaptability. Through continuous parameter optimization by the adjoint data assimilation method, the simulated water level errors under the E4 scheme were substantially reduced for all five wind fields. Compared to the E3 scheme, the Mean Absolute Error (MAE) decreased by 50% for EWF, 47% for the JWF, 48% for the JEWF, 26% for the HWF, and 42% for the HEWF. The overall error reduction indicates that the adjoint data assimilation method is also highly applicable in the South China Sea region, significantly improving the agreement between simulated results and measured data.
- (2)
- Among the constructed typhoon wind fields, the JWF performed noticeably better than the HWF. Among all schemes, JWF consistently exhibited lower MAE and RMSE values than HWF, along with higher R values. Moreover, the adjoint data assimilation method effectively reduced the errors in both the HWF and HEWF schemes, with particularly notable improvement in HEWF. This scheme achieved an MAE of 0.18 m, an RMSE of 0.26 m, and an R of 0.67. Nevertheless, both schemes still underperformed compared to the JWF and JEWF schemes in simulating Typhoon “Mangkhut” over the South China Sea.
- (3)
- To address the declining accuracy of the JWF with increasing distance from the typhoon center and the overall low intensity of the EWF, this study constructed a hybrid wind field, JEWF, by blending the JWF with the EWF. The results show that the JEWF achieved an MAE of 0.14 m, an RMSE of 0.19 m, and an R of 0.76, compared to the JWF, which yielded a MAE of 0.16 m, RMSE of 0.22 m, and R of 0.72. The JEWF exhibits lower errors and higher correlation than the JWF, demonstrating its better agreement with actual conditions. Moreover, the optimized CD derived from the JEWF is also more physically reasonable. This integration effectively overcomes the individual limitations of both wind fields.
Although the model can generally simulate the spatiotemporal variation in water levels induced by Typhoon “Mangkhut” with continuity and accuracy, local extrema remain present in the results. This may be attributed to the complex topography and intricate coastline of the South China Sea, which are not explicitly accounted for in the constructed typhoon wind field. Furthermore, the specification of key parameters such as the radius of maximum wind may also introduce uncertainty in simulating nearshore storm surge water level variations. Therefore, future research will undertake multi-case studies in the South China Sea to find parametrization schemes better suited to this region, thereby enhancing model performance and providing novel methodologies for improving storm surge forecasting.
Author Contributions
Conceptualization, L.J. and C.L.; methodology, X.L.; software, L.J., C.L. and X.L.; validation, L.J., C.L. and X.L.; formal analysis, L.J. and C.L.; investigation, X.L., D.J. and X.Z.; resources, C.L.; data curation, L.J. and C.L.; writing—original draft preparation, L.J.; writing—review and editing, L.J., C.L., X.Z., D.J. and X.L.; visualization, L.J. and C.L.; supervision, X.L., D.J. and X.Z.; project administration, X.L., D.J. and X.Z.; funding acquisition, D.J. and X.Z. All authors have read and agreed to the published version of the manuscript.
Funding
This research was funded by the Self-Initiated Research of Naval Aviation University, the National Natural Science Foundation of China (Grant No. 42506024), the National Key Research and Development Program of China (Grant No. 2022YFC3105003) and the National Natural Science Foundation of China (Grant No. 42076011 and Grant No. U2006210).
Data Availability Statement
The ECMWF Reanalysis v5 (ERA5) reanalysis data are provided by Copernicus Climate Change Service (C3S; https://cds.climate.copernicus.eu/ accessed on 23 July 2025). Tropical cyclone track data were sourced from the CMA Best Track Dataset maintained by Tropical Cyclone Data Center of the China Meteorological Administration (https://tcdata.typhoon.org.cn/zjljsjj.html accessed on 23 July 2025).
Acknowledgments
We express our gratitude to Copernicus Climate Change Service and tropical Cyclone Data Center of the China Meteorological Administration for providing valuable data support.
Conflicts of Interest
The authors declare no conflicts of interest.
Appendix A
The specific longitude and latitude coordinates for all stations are provided in detail in Table A1 for reference.

Table A1.
Latitude and longitude of the 20 tide gauge stations.
Table A1.
Latitude and longitude of the 20 tide gauge stations.
| Name | Longitude/°E | Latitude/°N |
|---|---|---|
| BHI | 109.05 | 21.47 |
| CWN | 113.88 | 22.45 |
| DWS | 113.72 | 21.93 |
| FCN | 108.33 | 21.60 |
| GZH | 113.68 | 22.66 |
| HAN | 110.13 | 20.23 |
| NZU | 110.55 | 20.90 |
| QLN | 110.82 | 19.56 |
| QZH | 108.62 | 21.68 |
| SHD | 111.07 | 21.48 |
| STO | 116.76 | 23.22 |
| SWI | 115.37 | 22.77 |
| SYA | 109.50 | 18.25 |
| WCG | 110.42 | 18.72 |
| WZU | 109.12 | 21.02 |
| XSA | 112.33 | 16.84 |
| YWO | 117.10 | 23.40 |
| ZLG | 115.57 | 22.65 |
| ZPO | 111.82 | 21.58 |
References
- Saha, K.K.; Kumar, P.; Singh, A.; Kamranzad, B.; Young, I.R.; Rajni. Assessment and future projections of storm surge using CMIP6 models in the Indo-Pacific region. Ocean Model. 2025, 196, 102560. [Google Scholar] [CrossRef]
- Muis, S.; Verlaan, M.; Winsemius, H.C.; Aerts, J.C.J.H.; Ward, P.J. A global reanalysis of storm surges and extreme sea levels. Nat. Commun. 2016, 7, 11969. [Google Scholar] [CrossRef]
- Losada, I.J.; Reguero, B.G.; Méndez, F.J.; Castanedo, S.; Abascal, A.J.; Mínguez, R. Long-term changes in sea-level components in Latin America and the Caribbean. Glob. Planet. Change 2013, 104, 34–50. [Google Scholar] [CrossRef]
- Yang, J.; Yan, F.; Chen, M. Effects of sea level rise on storm surges in the south Yellow Sea: A case study of Typhoon Muifa (2011). Cont. Shelf Res. 2021, 215, 104346. [Google Scholar] [CrossRef]
- Chou, J.; Dong, W.; Tu, G.; Xu, Y. Spatiotemporal distribution of landing tropical cyclones and disaster impact analysis in coastal China during 1990–2016. Phys. Chem. Earth Parts A/B/C 2020, 115, 102830. [Google Scholar] [CrossRef]
- Woo, W.C.; Wong, W.K. Operational Application of Optical Flow Techniques to Radar-Based Rainfall Nowcasting. Atmosphere 2017, 8, 48. [Google Scholar] [CrossRef]
- Feng, J.L.; von Storch, H.; Jiang, W.S.; Weisse, R. Assessing changes in extreme sea levels along the coast of China. J. Geophys. Res. Ocean. 2015, 120, 8039–8051. [Google Scholar] [CrossRef]
- Yin, B.; Xu, Z.; Huang, Y.; Lin, X. Simulating a typhoon storm surge in the East Sea of China using a coupled model. Prog. Nat. Sci. 2009, 19, 65–71. [Google Scholar] [CrossRef]
- Hinkel, J.; Lincke, D.; Vafeidis, A.T.; Perrette, M.; Nicholls, R.J.; Tol, R.S.J.; Marzeion, B.; Fettweis, X.; Ionescu, C.; Levermann, A. Coastal flood damage and adaptation costs under 21st century sea-level rise. Proc. Natl. Acad. Sci. USA 2014, 111, 3292–3297. [Google Scholar] [CrossRef] [PubMed]
- Shi, P.; Yang, X.; Xu, W.; Wang, J.a. Mapping Global Mortality and Affected Population Risks for Multiple Natural Hazards. Int. J. Disaster Risk Sci. 2016, 7, 54–62. [Google Scholar] [CrossRef]
- Su, C.; Sahoo, B.; Mao, M.; Xia, M. Machine Learning Techniques for Predicting Typhoon-Induced Storm Surge Using a Hybrid Wind Field. J. Geophys. Res. Mach. Learn. Comput. 2025, 2, e2024JH000507. [Google Scholar] [CrossRef]
- Guan, S.; Li, S.; Hou, Y.; Hu, P.; Liu, Z.; Feng, J. Increasing threat of landfalling typhoons in the western North Pacific between 1974 and 2013. Int. J. Appl. Earth Obs. Geoinf. 2018, 68, 279–286. [Google Scholar] [CrossRef]
- Wang, S.; Toumi, R. Recent migration of tropical cyclones toward coasts. Science 2021, 371, 514–517. [Google Scholar] [CrossRef]
- Guan, S.D.; Jin, F.F.; Tian, J.W.; Lin, I.-I.; Pun, I.F.; Zhao, W.; Huthnance, J.; Xu, Z.; Cai, W.J.; Jing, Z.; et al. Ocean internal tides suppress tropical cyclones in the South China Sea. Nat. Commun. 2024, 15, 3903. [Google Scholar] [CrossRef]
- Hu, J.; Pan, J.; Guo, X.; Zheng, Q. Introduction to the special section on regional environmental oceanography in the South China Sea and its adjacent areas (REO-SCS). J. Oceanogr. 2011, 67, 359–363. [Google Scholar] [CrossRef]
- Hu, J.; Wang, X.H. Progress on upwelling studies in the China seas. Rev. Geophys. 2016, 54, 653–673. [Google Scholar] [CrossRef]
- Wang, G.; Su, J.; Ding, Y.; Chen, D. Tropical cyclone genesis over the south China sea. J. Mar. Syst. 2007, 68, 318–326. [Google Scholar] [CrossRef]
- Jin, W.; Guan, S.; Chen, L.; Tang, Z.; Huang, M.; Xu, X.; Zhao, W. Joint risk analysis of typhoon hazards based on coupled ADCIRC-SWAN model simulations around Hainan, China. J. Sea Res. 2025, 205, 102587. [Google Scholar] [CrossRef]
- Wang, Y.; Gao, T.; Jia, N.; Han, Z. Numerical study of the impacts of typhoon parameters on the storm surge based on Hato storm over the Pearl River Mouth, China. Reg. Stud. Mar. Sci. 2020, 34, 101061. [Google Scholar] [CrossRef]
- Lü, Z.; Wu, Z.; Jiang, C.; Zhang, H.; Gao, K.; Yan, R. Numerical investigation of the super typhoon Mangkhut based on the coupled air-sea model. J. Mar. Sci. 2023, 41, 21–31. [Google Scholar] [CrossRef]
- Fu, C.; Liu, Q.; Gao, Y.; Cao, H.; Liang, S. Numerical Simulation of Storm Surge Inundation in Estuarine Area Considering Multiple Influencing Factors. Sustainability 2024, 16, 2274. [Google Scholar] [CrossRef]
- Kerr, P.C.; Martyr, R.C.; Donahue, A.S.; Hope, M.E.; Westerink, J.J.; Luettich Jr, R.A.; Kennedy, A.B.; Dietrich, J.C.; Dawson, C.; Westerink, H.J. U.S. IOOS coastal and ocean modeling testbed: Evaluation of tide, wave, and hurricane surge response sensitivities to mesh resolution and friction in the Gulf of Mexico. J. Geophys. Res. Ocean. 2013, 118, 4633–4661. [Google Scholar] [CrossRef]
- Wu, Z.; Jiang, C.; Deng, B.; Cao, Y. Simulation of the storm surge in the South China Sea based on the coupled sea-air model. Chin. Sci. Bull. 2018, 63, 3494–3504. [Google Scholar] [CrossRef]
- Li, A.; Guan, S.; Mo, D.; Hou, Y.; Hong, X.; Liu, Z. Modeling wave effects on storm surge from different typhoon intensities and sizes in the South China Sea. Estuar. Coast. Shelf Sci. 2020, 235, 106551. [Google Scholar] [CrossRef]
- Hu, S.; Li, Y.; Hu, P.; Zhang, H.; Zhang, G.; Gong, W. The Impacts of Far-Field Typhoon-Generated Coastal Trapped Waves on the Hydrodynamics in the Northern South China Sea: A Case Study of Typhoon In-Fa. J. Geophys. Res. Ocean. 2024, 129, e2024JC021359. [Google Scholar] [CrossRef]
- Wang, J.; Wang, Y.; Gao, X.; Pan, H.; Sun, J.; Xu, T.; Ren, P. An optimization method of adjoint assimilation based on the cumulative gradient: An application for correction of the bottom friction coefficient in the tidal wave model. Ocean Model. 2023, 183, 102202. [Google Scholar] [CrossRef]
- Stammer, D.; Balmaseda, M.; Heimbach, P.; Köhl, A.; Weaver, A. Ocean Data Assimilation in Support of Climate Applications. Annu. Rev. Mar. Sci. 2016, 8, 491–518. [Google Scholar] [CrossRef]
- Gao, X.; Wei, Z.; Lu, X.; Wang, Y.; Fang, G. Applications of Adjoint Data-assimilation Method to Ocean Numerical Simulation for China Adjacent Seas. Adv. Mar. Sci. 2010, 28, 545–553. [Google Scholar]
- Wu, X.; Xu, M.; Gao, G.; Yin, B.; Lv, X. Application of the Trigonometric Polynomial Interpolation for the Estimation of the Vertical Eddy Viscosity Coefficient Based on the Ekman Adjoint Assimilation Model. J. Mar. Sci. Eng. 2022, 10, 1165. [Google Scholar] [CrossRef]
- Li, Y.; Peng, S.; Yan, J.; Xie, L. On improving storm surge forecasting using an adjoint optimal technique. Ocean Model. 2013, 72, 185–197. [Google Scholar] [CrossRef]
- Gao, X.; Wei, Z.; Lv, X.; Wang, Y.; Fang, G. Numerical study of tidal dynamics in the South China Sea with adjoint method. Ocean Model. 2015, 92, 101–114. [Google Scholar] [CrossRef]
- Jiang, D.; Chen, H.; Lv, X. Optimization of the Position of Observation Stations in the South China Sea with Adjoint Assimilation Method. Period. Ocean Univ. China 2018, 48, 13–23. [Google Scholar]
- Mo, D.X.; Li, J.; Hou, Y.J.; Hu, P. Modeling the Sea Level Response of the Northern East China Sea to Different Types of Extratropical Cyclones. J. Geophys. Res. Ocean. 2023, 128, e2022JC018728. [Google Scholar] [CrossRef]
- Pan, Y.; Chen, Y.; Li, J.; Ding, X. Improvement of wind field hindcasts for tropical cyclones. Water Sci. Eng. 2016, 9, 58–66. [Google Scholar] [CrossRef]
- Kang, X.Y.; Xia, M. The Study of the Hurricane-Induced Storm Surge and Bay-Ocean Exchange Using a Nesting Model. Estuaries Coasts 2020, 43, 1610–1624. [Google Scholar] [CrossRef]
- Lockwood, J.W.; Lin, N.; Oppenheimer, M.; Lai, C.Y. Using Neural Networks to Predict Hurricane Storm Surge and to Assess the Sensitivity of Surge to Storm Characteristics. J. Geophys. Res. Atmos. 2022, 127, e2022JD037617. [Google Scholar] [CrossRef]
- Jelesnianski, C.P. A Numerical Calculation of Storm Tides Induced by a Tropical Storm Impinging on a Continental Shelf. Mon. Weather Rev. 1965, 93, 343–358. [Google Scholar] [CrossRef]
- Chen, K. A computation method fortyphoon wind field. Trop. Oceanol. 1994, 13, 41–48. (In Chinese) [Google Scholar]
- Holland, G.J. An Analytic Model of the Wind and Pressure Profiles in Hurricanes. Mon. Weather Rev. 1980, 108, 1212–1218. [Google Scholar] [CrossRef]
- Shao, Z.X.; Liang, B.C.; Li, H.J.; Wu, G.X.; Wu, Z.H. Blended wind fields for wave modeling of tropical cyclones in the South China Sea and East China Sea. Appl. Ocean Res. 2018, 71, 20–33. [Google Scholar] [CrossRef]
- Aarons, Z.S.; Camargo, S.J.; Strong, J.D.O.; Murakami, H. Tropical Cyclone Characteristics in the MERRA-2 Reanalysis and AMIP Simulations. Earth Space Sci. 2021, 8, e2020EA001415. [Google Scholar] [CrossRef]
- Hodges, K.; Cobb, A.; Vidale, P.L. How Well Are Tropical Cyclones Represented in Reanalysis Datasets? J. Clim. 2017, 30, 5243–5264. [Google Scholar] [CrossRef]
- Jiang, F.; Tian, Z.; Zhang, Y.; Udo, K. Risk map of typhoon induced wave fields around Hainan Island. Appl. Ocean Res. 2023, 137, 103603. [Google Scholar] [CrossRef]
- Jiao, L.Q.; Wang, Y.Q.; Jiang, D.; Liu, Q.R.; Gao, J.; Lv, X.Q. Numerical Simulation of Storm Surge-Induced Water Level Rise in the Bohai Sea with Adjoint Data Assimilation. Remote Sens. 2025, 17, 2054. [Google Scholar] [CrossRef]
- Pawlowicz, R.; Beardsley, B.; Lentz, S. Classical tidal harmonic analysis including error estimates in MATLAB using T_TIDE. Comput. Geosci. 2002, 28, 929–937. [Google Scholar] [CrossRef]
- Liu, J.; Zhang, H.; Zhong, R.; Han, B.; Wu, R. Impacts of wave feedbacks and planetary boundary layer parameterization schemes on air-sea coupled simulations: A case study for Typhoon Maria in 2018. Atmos. Res. 2022, 278, 106344. [Google Scholar] [CrossRef]
- Graham, H.E. Meteorological Considerations Pertinent to Standard Project Hurricane, Atlantic and Gulf Coasts of the United States; U.S. Department of Commerce, Weather Bureau: Washington, DC, USA, 1959.
- Willoughby, H.E.; Rahn, M.E. Parametric Representation of the Primary Hurricane Vortex. Part I: Observations and Evaluation of the Holland (1980) Model. Mon. Weather Rev. 2004, 132, 3033–3048. [Google Scholar] [CrossRef]
- Miyazaki, M.; Ueno, T.; Unoki, S. Theoretical investigations of typhoon surges along the Japanese coast. Oceanogr. Mag. 1962, 13, 103–117. [Google Scholar]
- Wang, Q.; Deng, J.; Liu, C.; Yan, J.; Ye, R.; Chen, X. Application of superimposed wind fields to the hindcast modelling of typhoon-induced waves in the South China Sea. Haiyang Xuebao 2017, 39, 70. [Google Scholar] [CrossRef]
- Tian, Z.; Zhang, Y. Numerical estimation of the typhoon-induced wind and wave fields in Taiwan Strait. Ocean Eng. 2021, 239, 109803. [Google Scholar] [CrossRef]
- Roldán, M.; Montoya, R.D.; Rios, J.D.; Osorio, A.F. Modified parametric hurricane wind model to improve the asymmetry in the region of maximum winds. Ocean Eng. 2023, 280, 114508. [Google Scholar] [CrossRef]
- Smith, S.D. Wind Stress and Heat Flux over the Ocean in Gale Force Winds. J. Phys. Oceanogr. 1980, 10, 709–726. [Google Scholar] [CrossRef]
- Wu, J. Wind-Stress coefficients over Sea surface near Neutral Conditions—A Revisit. J. Phys. Oceanogr. 1980, 10, 727–740. [Google Scholar] [CrossRef]
- Xiong, J.; Yu, F.; Fu, C.; Dong, J.; Liu, Q. Evaluation and improvement of the ERA5 wind field in typhoon storm surge simulations. Appl. Ocean Res. 2022, 118, 103000. [Google Scholar] [CrossRef]
- Chen, Y.; Miao, Y.; Xie, P.; Zhang, Y.; Li, Y. Tide-surge interactions in Northern South China Sea: A comparative study of Barijat and Mangkhut (2018). Front. Mar. Sci. 2024, 11, 1423294. [Google Scholar] [CrossRef]
- Chen, X.; Ni, Y.; Shen, Y.; Ying, Y.; Wang, J. The research on the applicability of different typhoon wind fields in the simulation of typhoon waves in China’s coastal waters. Front. Mar. Sci. 2024, 11, 1492521. [Google Scholar] [CrossRef]
- Peng, S.; Li, Y. A parabolic model of drag coefficient for storm surge simulation in the South China Sea. Sci. Rep. 2015, 5, 15496. [Google Scholar] [CrossRef]
- Jarosz, E.; Mitchell, D.A.; Wang, D.W.; Teague, W.J. Bottom-Up Determination of Air-Sea Momentum Exchange Under a Major Tropical Cyclone. Science 2007, 315, 1707–1709. [Google Scholar] [CrossRef]
- Li, J.; Hou, Y.; Mo, D.; Liu, Q.; Zhang, Y. Influence of Tropical Cyclone Intensity and Size on Storm Surge in the Northern East China Sea. Remote Sens. 2019, 11, 3033. [Google Scholar] [CrossRef]
- Wei, C.; Bao, X.; Ding, Y.; Chen, B. Mechanism of Typhoon-Driven Storm Jet Driven by Typhoon Nesat in the Gulf of Beibu. Period. Ocean Univ. China 2022, 52, 28–39. [Google Scholar]
- Li, H.; Wei, K. Effect of wave–current–surge interactions on simulated wave conditions in a strait via an optimal WRF typhoon model. Ocean Eng. 2025, 326, 120962. [Google Scholar] [CrossRef]
- Zhang, H.; Cheng, W.; Qiu, X.; Feng, X.; Gong, W. Tide-surge interaction along the east coast of the Leizhou Peninsula, South China Sea. Cont. Shelf Res. 2017, 142, 32–49. [Google Scholar] [CrossRef]
- Wang, H.; Fu, D.; Liu, D.; Xiao, X.; He, X.; Liu, B. Analysis and Prediction of Significant Wave Height in the Beibu Gulf, South China Sea. J. Geophys. Res. Ocean. 2021, 126, e2020JC017144. [Google Scholar] [CrossRef]
- Zavala-Garay, J.; Rogowski, P.; Wilkin, J.; Terrill, E.; Shearman, R.K.; Tran, L.H. An Integral View of the Gulf of Tonkin Seasonal Dynamics. J. Geophys. Res. Ocean. 2022, 127, e2021JC018125. [Google Scholar] [CrossRef]
- Condon, A.J.; Sheng, Y.P. Optimal storm generation for evaluation of the storm surge inundation threat. Ocean Eng. 2012, 43, 13–22. [Google Scholar] [CrossRef]
- Lu, X.; Zhang, J. Numerical study on spatially varying bottom friction coefficient of a 2D tidal model with adjoint method. Cont. Shelf Res. 2006, 26, 1905–1923. [Google Scholar] [CrossRef]
- Zhang, J.; Lu, X. Parameter estimation for a three-dimensional numerical barotropic tidal model with adjoint method. Int. J. Numer. Methods Fluids 2008, 57, 47–92. [Google Scholar] [CrossRef]
- Zhang, J.; Lu, X.; Wang, P.; Wang, Y.P. Study on linear and nonlinear bottom friction parameterizations for regional tidal models using data assimilation. Cont. Shelf Res. 2011, 31, 555–573. [Google Scholar] [CrossRef]
- Guo, Z.; Pan, H.; Fan, W.; Lv, X. Application of Surface Spline Interpolation in Inversion of Bottom Friction Coefficients. J. Atmos. Ocean. Technol. 2017, 34, 2021–2028. [Google Scholar] [CrossRef]
- Liu, M.; Lv, X. Study on the Drag Coefficient in the Simulation of Storm Surges with Adjoint Method. Oceanol. Limnol. Sin. 2011, 42, 9–19, (In Chinese with English Abstract). [Google Scholar]
Disclaimer/Publisher’s Note: The statements, opinions and data contained in all publications are solely those of the individual author(s) and contributor(s) and not of MDPI and/or the editor(s). MDPI and/or the editor(s) disclaim responsibility for any injury to people or property resulting from any ideas, methods, instructions or products referred to in the content. |
© 2025 by the authors. Licensee MDPI, Basel, Switzerland. This article is an open access article distributed under the terms and conditions of the Creative Commons Attribution (CC BY) license (https://creativecommons.org/licenses/by/4.0/).