You are currently viewing a new version of our website. To view the old version click .
Journal of Marine Science and Engineering
  • Article
  • Open Access

23 September 2025

Numerical Investigation of Flow Field Characteristics Around a Monopile Foundation with Collar Protection

,
,
,
,
,
and
1
Jiangsu Xinneng Haili Offshore Wind Power Generation Co., Ltd., Rudong, Nantong 226400, China
2
Key Laboratory of Ministry of Education for Coastal Disaster and Protection, Hohai University, Nanjing 210024, China
3
Nanjing Hydraulic Research Institute, Nanjing 210029, China
*
Author to whom correspondence should be addressed.
This article belongs to the Special Issue Advancements in Marine Hydrodynamics and Structural Optimization

Abstract

Collar structures are widely used to protect monopile foundations from scour, but their geometric obstruction hinders direct observation of the surrounding flow in physical experiments. To overcome this limitation, this study employs large-eddy simulation (LES) to investigate the flow characteristics around a monopile with collar protection. The LES model was validated against well-documented experimental data of pile-induced flow, confirming its reliability. Simulations under flat-bed and equilibrium scour conditions were conducted to evaluate the effects of the collar on time-averaged velocity, vortex dynamics, and turbulence intensity. The results show that the collar substantially weakens the upstream accelerated flow, suppresses horseshoe vortex formation, and reduces both the strength and extent of sidewall currents. Under flatbed conditions, the side-flow intensity decreases by 24.3% and the accelerated flow area is reduced by 93.3%. A counter-rotating vortex beneath the collar dissipates kinetic energy and simplifies the near-bed vortex system, thereby mitigating scour. However, the protective effect diminishes with increasing inflow velocity, with turbulence intensity rising by 159% for a 14% velocity increase. Overall, this study provides deeper insights into the protective mechanisms of collar structures, advancing the understanding of their effectiveness and limitations in monopile scour protection.

1. Introduction

Energy is fundamental to human survival and drives socio-economic development. With the depletion of conventional energy sources and increasing environmental awareness, renewable energies such as wind, ocean, and hydrogen power have gained prominence. Among them, wind power has the greatest commercial potential. According to the Global Wind Report 2025 by the Global Wind Energy Council (GWEC) [], global wind installations reached a record 117 GW in 2024, and the European Renewable Energy Council (EWEA) projects offshore wind capacity will reach 150 GW by 2030. As one of the countries with the richest wind resources, China possesses 253 GW of onshore wind potential and offshore wind potential nearly three times greater, up to 750 GW []. The rapid development of offshore wind power not only plays a strategic role in optimizing the energy structure but also poses new challenges to the safety and reliability of foundation engineering. Compared with onshore turbines, offshore wind turbines have much larger unit capacities and structures. Their foundations are simultaneously subjected to combined actions of wind, waves, currents, and even ice loads [], while seabed soils are often sandy or silty with high variability under harsh construction conditions []. Moreover, offshore construction is complex and costly, requiring heavy equipment for transportation and installation, with foundation construction costs accounting for about one-quarter of the total project investment. Therefore, selecting appropriate foundation types and implementing protective measures are critical for structural safety and cost efficiency.
Protective measures for offshore wind turbine foundations can be generally classified into active and passive approaches []. Passive protection focuses on modifying the erodibility of the bed or soil properties, primarily by placing erosion-resistant materials to improve resistance. Common methods include riprap [], sand mattress [], and solidified soil [,]. Parker [] emphasized that the size and thickness of riprap play a critical role in its scour protection performance, showing that effective protection can be achieved with reduced extent (about 1.5 pier widths) and thickness (about 2D50), even without a geotextile filter in gravel-bed streams; Ma et al. [] used chemical stabilizers such as cement to solidify silt for scour protection, while Ahenkorah et al. [] applied the bio-cementation method to strengthen soil around monopiles; both studies demonstrated effective mitigation of local scour. Although relatively easy to implement, these methods mainly rely on the material performance itself and struggle to fundamentally reduce flow-induced scour, often requiring frequent maintenance during operation, leading to high long-term costs.
In contrast, active protection targets scour mechanisms by controlling the flow around the foundation, altering local hydrodynamics to reduce erosion. Such methods include collars [], sacrificial piles [], slotted piles [], submerged sills [], and sand-retaining sills [], all of which modify the flow field and significantly mitigate local scour. Although these measures require a higher initial investment, they substantially reduce long-term maintenance costs and are thus considered promising strategies for future scour protection. Collars, as a typical active measure, have been shown to effectively reduce flow disturbance and suppress scour. Chen et al. [] reported that collars markedly weaken the strength of the downflow and horseshoe vortices in front of piles. Pandey et al. [] observed in flume tests that collars delay the formation of scour pits and that installation height is critical, with collars placed near or flush with the bed providing optimal protection by suppressing accelerated flow beneath them. Alabi et al. [] found that, for the same scour duration, scour depth with collars is consistently smaller than without, both during development and at equilibrium. Kumar et al. [] developed an empirical formula to estimate collar efficiency based on experimental data.
However, in existing research, the obstruction of the collar in physical model tests has made it difficult to capture detailed flow distributions beneath the structure. As a result, direct observational evidence for the protective mechanism remains limited. Moreover, numerical simulations have mostly focused on the final equilibrium scour depth or the temporal evolution of scour pits, while the underlying mechanisms of collar-induced scour mitigation remain unclear. Against this background, this study applies numerical simulation to conduct an in-depth investigation of the protective mechanisms of collars. Typical scenarios with the collar located above or flush with the bed are considered under different inflow velocities, and the scour characteristics with and without collar protection are compared. Particular attention is paid to the flow field distribution and its evolution before and after scour pit formation. The objective is to elucidate the hydrodynamic processes of collar protection and provide scientific and engineering references for the design of collar protection for monopile foundations in offshore wind farms.

2. Methods

2.1. Simulation Scenarios

According to previous studies [], placing the collar close to or flush with the bed surface achieves the highest protective efficiency. Pandey et al. [] further confirmed through laboratory experiments that installing the collar at the bed surface maximizes its protective function. Therefore, in the design stage, the installation height of the collar should be minimized to suppress the development of accelerated flow beneath it. Building on these findings, the present study focuses on scenarios where the collar is installed at the bed surface and investigates two representative stages of scour evolution. The flat-bed stage is examined to capture the initial influence of the collar on the near-pile flow field before bed deformation occurs, while the equilibrium scour stage is analyzed to reveal the flow–structure interaction after the scour pit has fully developed. Together, these two conditions allow a more comprehensive understanding of collar-induced protection mechanisms.
As shown in Table 1, for the flat-bed stage, two cases were considered: an unprotected case (FB-NP) and a protected case (FB-C1). These cases were designed to compare differences in horseshoe vortex intensity, downflow, and near-bed scour potential during the early stage of scour. Although collars perform best when installed flush with the bed surface (hc/D = 0), this configuration makes it difficult to observe the flow beneath the collar. Therefore, in the flat-bed scenario, the collar was set slightly above the bed at hc/D = 0.13, which maintained effective protection while allowing a clearer examination of sub-collar flow features.
Table 1. Numerical simulation scenarios of flow fields.
For the equilibrium scour stage, three cases were considered: an unprotected case (ES-NP) and two protected cases with the collar installed flush with the bed surface (ES-C1-V7 and ES-C2-V8). In ES-C1-V7, the inflow velocity was kept the same as in the unprotected case, whereas in ES-C2-V8, the inflow velocity was increased by 0.1Uc to investigate the effect of higher flow velocity on the protective performance of the collar and the associated flow field variations.
To further analyze the flow field under equilibrium scour conditions, an accurate scour pit geometry was obtained directly from physical flume experiments. The typical scour profiles were reconstructed using photogrammetry combined with three-dimensional (3D) modeling techniques. After each test, approximately 50 photographs were taken around the monopile scour pit. These images were processed with specialized software to generate sparse and dense point clouds, followed by coordinate correction, scale adjustment, alignment of the bed level and pile center, regional cropping, and export of the dense point cloud, thereby yielding high-resolution 3D terrain data derived from the laboratory flume tests. Figure 1 illustrates the procedure for obtaining the dense point cloud model. Validation was conducted by comparing the reconstructed pit depth, width, and the distance from the upstream pile surface to the pit front edge. Specifically, these dimensions were obtained by selecting representative points in the 3D point cloud, extracting their coordinates, and calculating the distances between the selected points. The calculated values were then compared with the corresponding terrain measurements from the physical model tests to ensure the accuracy of the reconstruction. All errors were within 2%, confirming the accuracy and reliability of the reconstructed experimental terrain data.
Figure 1. Terrain data processing steps. (a) Photographs from flume tests; (b) dense point cloud model; (c) surface extraction from reconstructed point cloud.

2.2. CFD Simulation Method and Theory

In the numerical simulation, the flow is modeled as a three-dimensional incompressible viscous fluid. The governing equations consist of the continuity equation and the Navier–Stokes equations, which are used to resolve the turbulent flow field around the monopile foundation. The equations are expressed as follows:
u i x i = 0
u i t + u j u i x j = 1 ρ P x i + x j ( 2 ν S i j u i u j ¯ )
where ui is the fluid velocity; ρ is the fluid density, taken as 998.2 kg/m3; μ is the dynamic viscosity of the fluid, set to 1.005 × 10⁻³ Pa·s in this study; P is the pressure; ν is the kinematic viscosity coefficient (ν = μ/ρ); Sij is the mean strain rate tensor; ui′ denotes the velocity fluctuation; and u i u j ¯ represents the Reynolds stress tensor.
In this study, the Large-Eddy Simulation (LES) method [] was employed. Compared with the Reynolds-Averaged Navier–Stokes (RANS) approach, LES offers greater applicability for simulating turbulent flows, as it can capture large-scale structures and unsteady backscatter that RANS cannot resolve, thereby yielding more accurate three-dimensional results. The LES model achieves this by applying a spatial filtering operation to turbulent variables, which removes small-scale eddies within the grid while directly resolving the large-scale vortices that dominate the overall flow behavior. The filtered continuity and Navier–Stokes equations in the LES framework are expressed as follows:
ρ t + ( ρ u i ¯ ) x i = 0
t ( ρ u i ¯ ) + x i ( ρ u i u j ¯ ) = x i ( μ u i ¯ x j ¯ ) p ¯ x i τ i j x j
τ i j = ρ u i u j ¯ ρ u i ¯ u j ¯
where u i ¯ is the velocity component in the i-th direction, and τij denotes the subgrid-scale (SGS) Reynolds stress, which represents the effects of the unresolved small-scale eddies. Accurately capturing these subgrid motions requires modeling τij so that the filtered equations can be properly closed. The choice of the SGS model is therefore critical to the accuracy of LES results. In this study, the Smagorinsky subgrid model [] is employed, in which the governing equation for the SGS stress τij and the expression for the eddy viscosity are given as follows:
τ i j 1 3 τ k k δ i j = 2 C s Δ 2 S ¯ S i j
μ s = ρ C s Δ L E S 2 S ¯
where ΔLES is the LES filter width, S is the strain rate tensor, and Cs is the Smagorinsky constant, typically taken in the range of 0.1–0.2.

2.3. Numerical Setup

2.3.1. Computational Domain

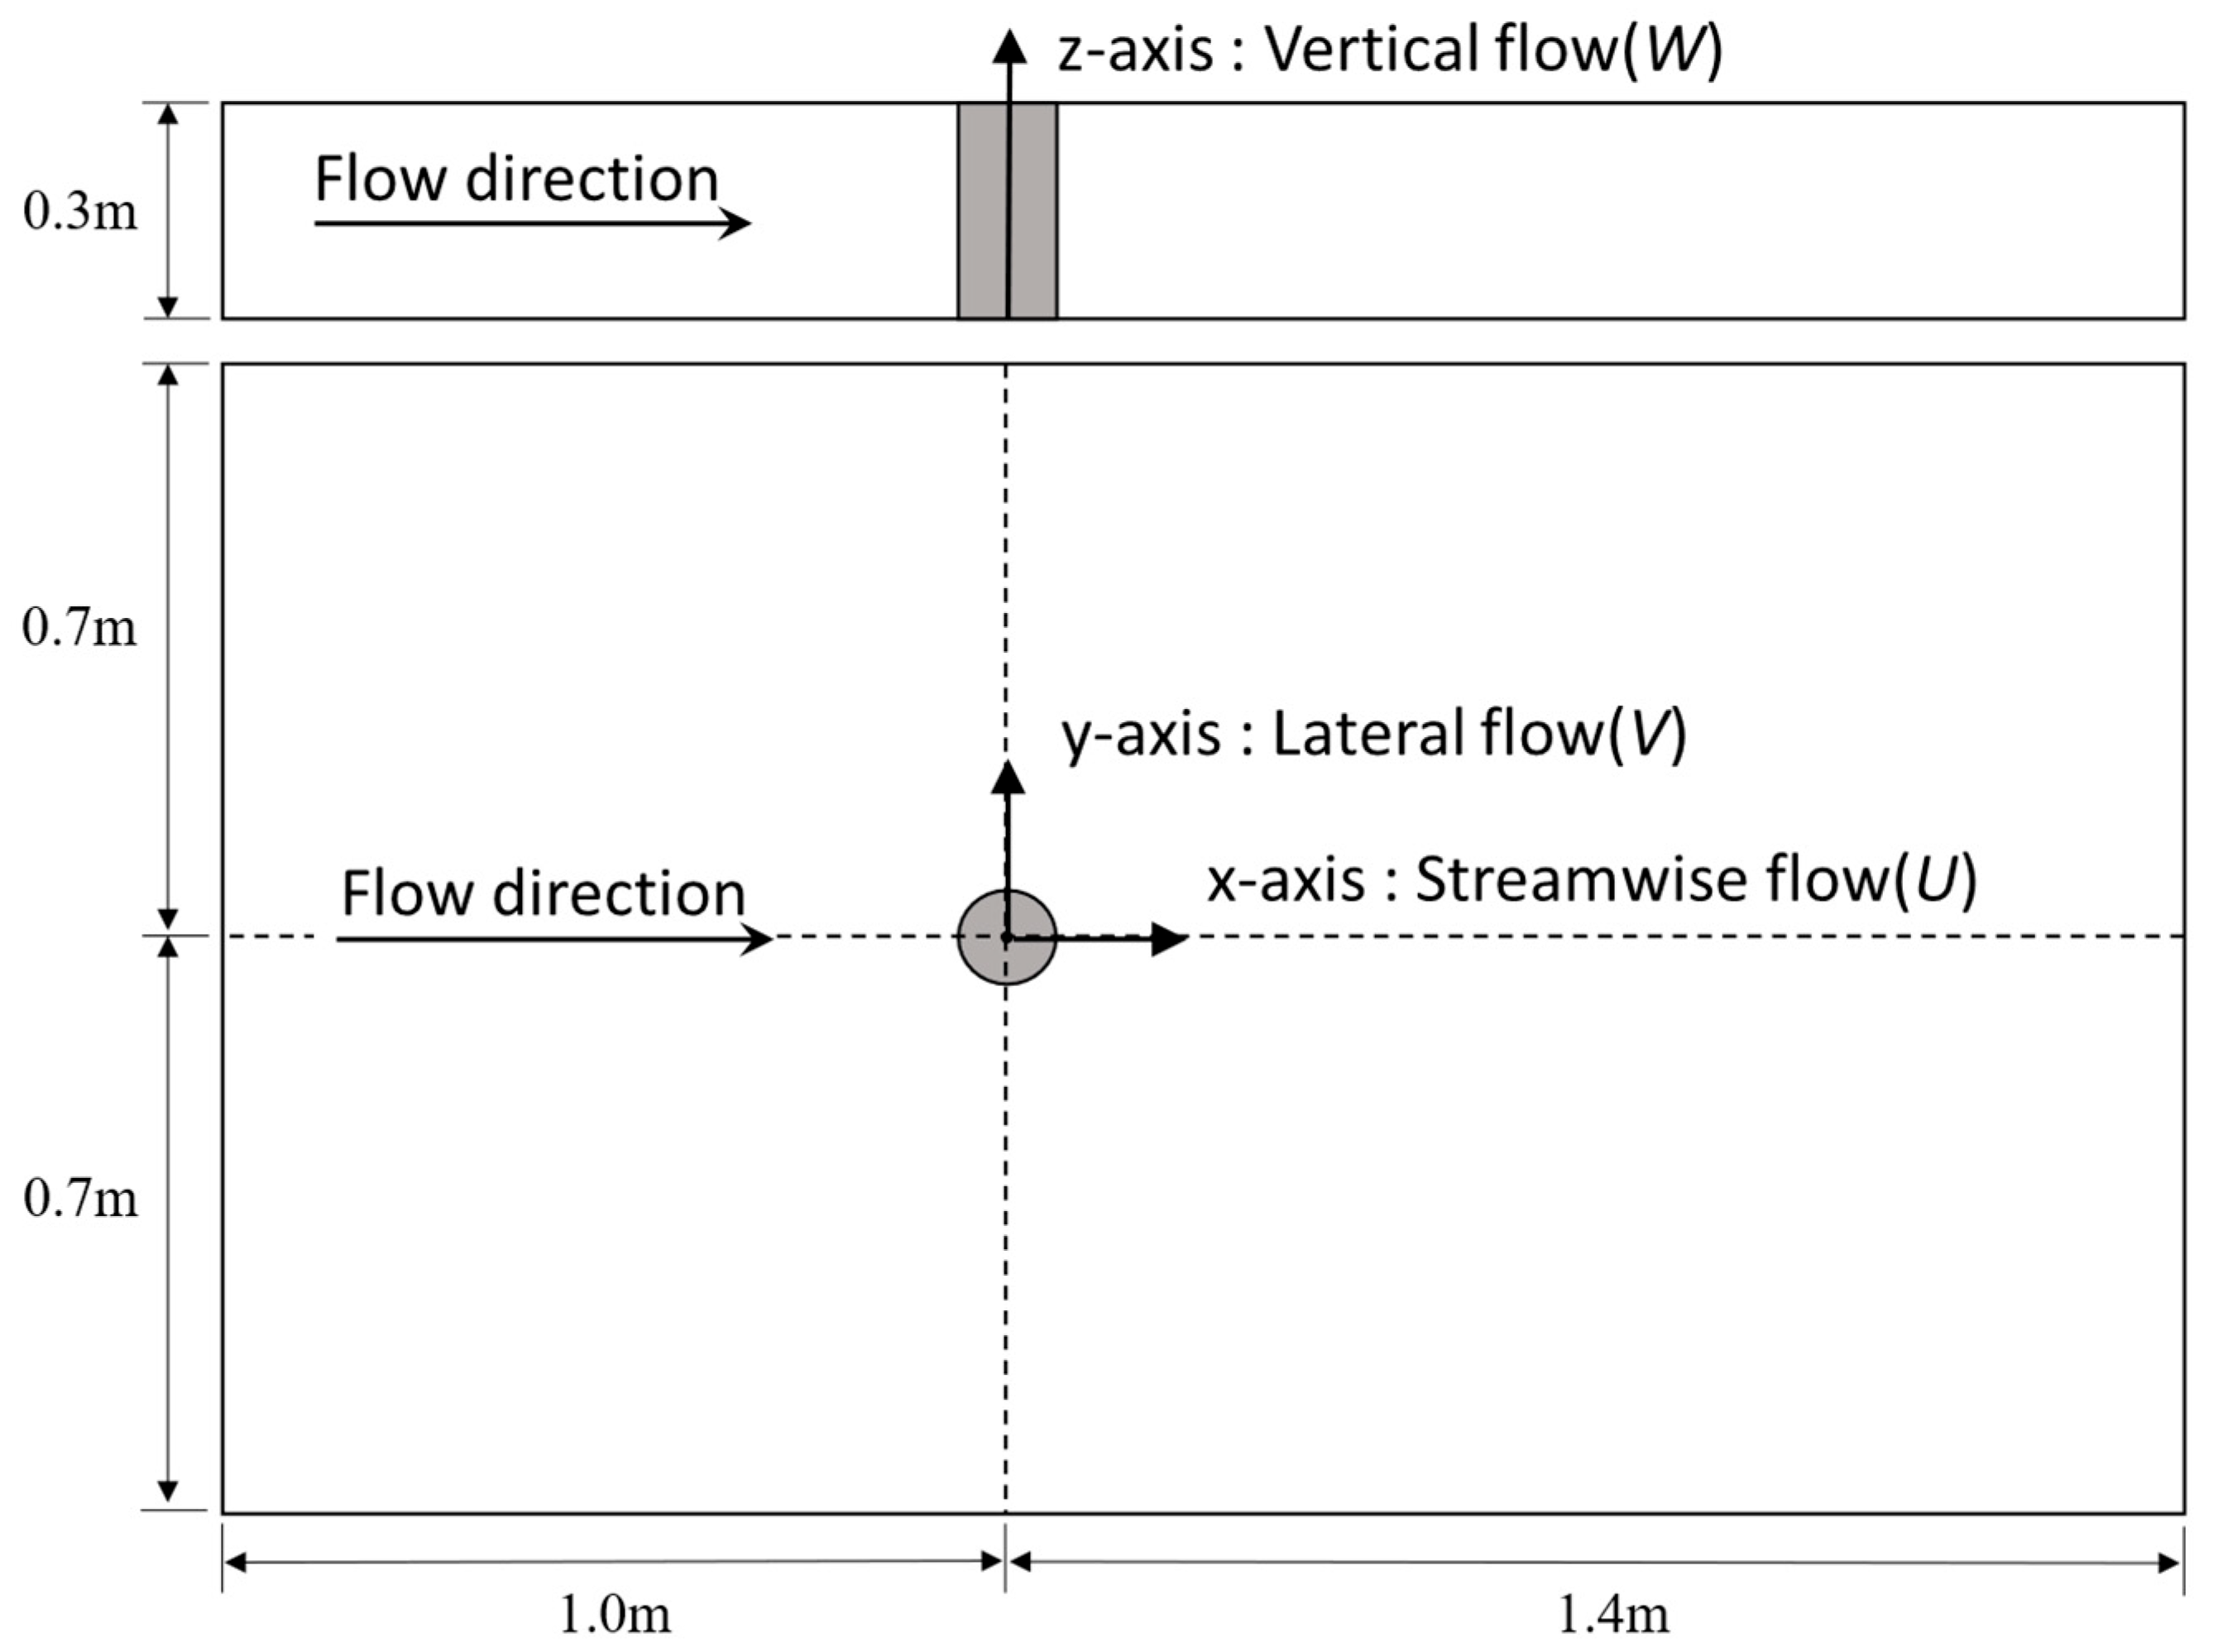
Compared with the Reynolds-Averaged Navier–Stokes (RANS) method, Large-Eddy Simulation (LES) requires a finer grid resolution, particularly near the wall boundaries, where the mesh size must be very small. To reduce the computational complexity associated with LES while maintaining sufficient resolution for the near-wall flow, the free surface was treated using the rigid-lid approximation (RLA), neglecting surface fluctuations and simulating only the submerged flow region []. Despite this simplification, LES still entails a high computational cost and time. Therefore, to further reduce the computational burden while ensuring the full development of vortex structures around the monopile foundation, a relatively compact computational domain was adopted. As shown in Figure 2, the distance from the cylinder center to the inlet boundary was set to more than 8D, to the outlet boundary more than 12D, and to the lateral boundaries more than 6D. According to previous studies [], such a domain size is sufficient to capture the flow structures around the monopile and allows the turbulent vortices to develop fully.
Figure 2. Schematic diagram of the numerical simulation area.
For consistency in the quantitative description and comparative analysis of the simulation results, the coordinate system is defined as follows: the x-axis represents the streamwise direction with velocity component U, the y-axis represents the transverse direction with velocity component V, and the z-axis represents the vertical direction with velocity component W.

2.3.2. Numerical Model and Boundary Conditions

In this study, LES was conducted using the open-source CFD computational software iSWEM (version 0.89), which has been validated in previous works. The computational domain was discretized using tetrahedral meshes with progressive refinement, as shown in Figure 3. The mesh was refined around the monopile and the bed surface, while gradually coarsening toward the upstream, downstream, and lateral boundaries. Regarding boundary conditions, the inlet was defined as a velocity inlet, the outlet as a free outflow, the lateral and top boundaries as symmetry planes, and the bed surface, monopile, and collar as no-slip walls.
Figure 3. Schematic of Grid Generation. (a) Model Geometry; (b) Computational Mesh.
A grid independence study was conducted using coarse, medium, and fine meshes. The results showed negligible differences (<5%) between the medium and fine meshes; this criterion is commonly adopted in CFD studies to demonstrate grid independence. Therefore, the medium mesh was adopted for subsequent simulations. In addition, the grid resolution near the wall satisfies the requirement of y+ < 5, ensuring that the near-wall viscous sublayer can be adequately resolved. Specifically, the first-layer grid spacing corresponds to z+ = 3.2 near the bed and x+ = y+ = 4.5 around the monopile, indicating that the LES model can accurately capture the fine-scale vortex structures in the near-wall region. Time-step and boundary condition sensitivity tests further confirmed that the results are stable and robust with respect to these numerical parameters.

2.3.3. Vorticity Calculation

When a monopile is placed in a river or coastal flow, it obstructs the current and generates vortices during the flow-around process. As the scour pit develops, the surrounding bed morphology changes, altering the vortex distribution at different stages of scour. In this study, the distribution and evolution of time-averaged vortices around the monopile are examined using streamlines and vorticity fields.
Vorticity is a key parameter for describing the flow around foundations, especially in relation to horseshoe vortices. The dimensionless vorticity is defined as ωD/U0, where ω is the vorticity. Mathematically, vorticity represents the local rotation (curl) of the velocity field, and its components ωx, ωy, and ωz correspond to rotation in the three coordinate planes.
ω x = w / y v / z
ω y = u / z w / x
ω z = v / x u / y

2.3.4. Turbulence Intensity Calculation and Sampling Duration

Unlike vorticity, which describes the rotational structures around the monopile, turbulence intensity focuses on the fluctuating components of the flow and is therefore a key indicator of flow unsteadiness and energy distribution. By quantifying velocity fluctuations in the streamwise, transverse, and vertical directions, turbulence intensity provides a direct measure of flow instability and its potential to enhance sediment transport. In this study, turbulence intensity parameters (Urms, Vrms, Wrms) and the overall turbulence intensity (TI) are employed to analyze their spatial distribution, variation, and the effect of the collar on turbulence suppression. Here, Urms, Vrms, and Wrms represent the dimensionless turbulence intensities in the streamwise, transverse, and vertical directions, respectively, and their calculation formulas are as follows.
U r m s = 1 N i N u i U 2 0.5 / U 0
V r m s = 1 N i N v i V 2 0.5 / U 0
W r m s = 1 N i N w i W 2 0.5 / U 0
Here, ui, vi and wi denote the instantaneous velocity components in the streamwise, transverse, and vertical directions, respectively, while U, V and W represent the corresponding time-averaged velocities at a given point. N is the total number of instantaneous velocity samples.
The turbulence intensity (TI) is used to quantify the energy contained in turbulent fluctuations relative to the mean flow. Its dimensionless form is calculated as
TI = U r m s 2 + W r m s 2 / U 0
In addition, the relative contributions of the horizontal and vertical components to the overall turbulence intensity are defined as
E U = U r m s 2 / U r m s 2 + W r m s 2 × 100 %
E W = W r m s 2 / U r m s 2 + W r m s 2 × 100 %
In this study, turbulence intensity was analyzed at eight vertical positions with sampling times from 1 s to 60 s, and the results stabilized beyond 20 s; thus, a 20 s sampling duration was adopted for subsequent simulations.

2.4. Model Validation

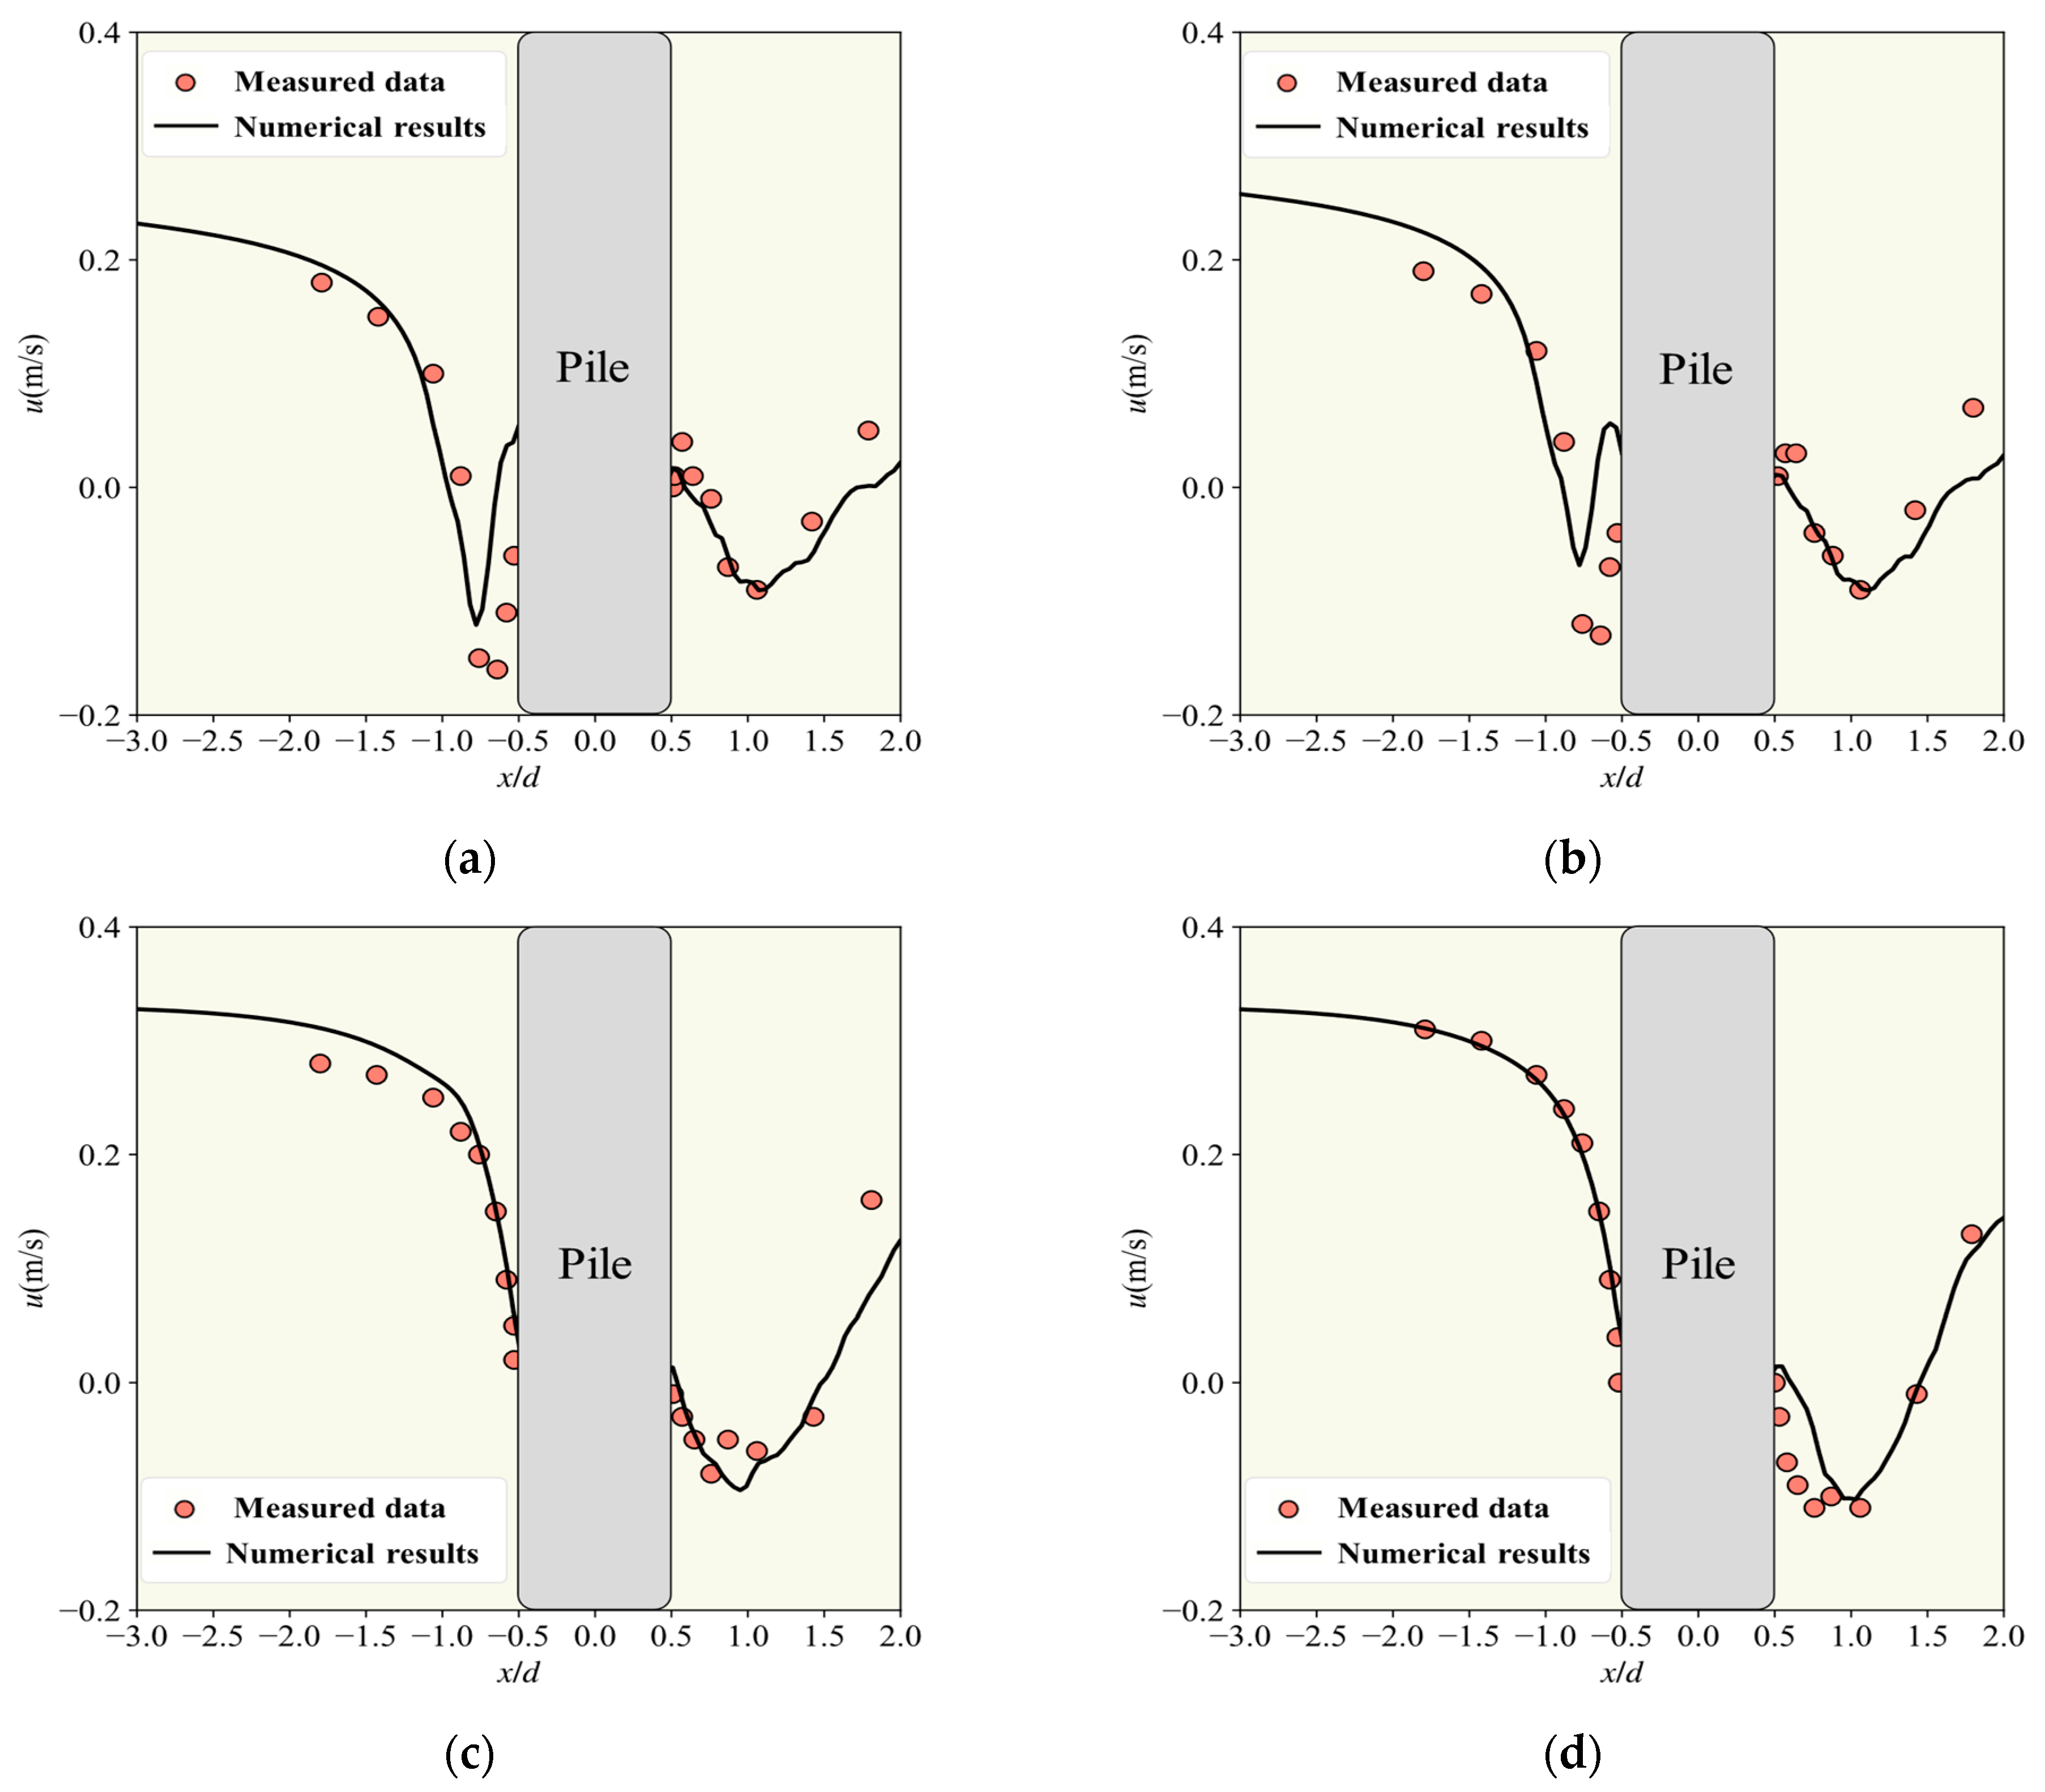
Since the bed morphology and flow field around the monopile change rapidly during the initial stage of local scour, it is difficult to capture the instantaneous velocity distribution near the pile using ADV measurements in physical experiments. Moreover, adding a collar only alters the pile’s surrounding flow configuration without significantly affecting the simulation fundamentals. Therefore, validating the model under flat-bed conditions without a collar against classical experimental data is sufficient. Roulund et al. [] measured the flow field upstream and downstream of a cylinder under flat-bed conditions using a Doppler velocimeter, with a current velocity of 0.326 m/s and a Reynolds number of 1.8 × 10⁵, which are close to the parameters used in this study. Validation against their data is thus essential for assessing the reliability of the present LES simulations.
An LES model was established using the same parameters as in Roulund et al.’s experiment, and the computed results were compared with the measurements (Figure 4). These figures show a comparison of velocity distributions at different heights above the bed between the simulation results and classical experimental data. The main findings are as follows:
Figure 4. Comparison of the flow direction velocities between the experimental data from Roulund et al. [] and the numerical modeling results of this study: (a) z/h0 = 0.01, (b) z/h0 = 0.02, (c) z/h0 = 0.2, (d) z/h0 = 0.4.
  • Upstream flow: The flow remained relatively stable, and the LES results agreed well with the measurements. At z/h0 ≤ 0.02 (Figure 4a,b), the model slightly overpredicted velocity, with errors of 15.2% and 18.6%. At z/h0 ≥ 0.2 (Figure 4c,d), agreement improved, with errors reduced to 4.6% and 7.3%.
  • Downstream flow: The flow was highly turbulent, and although local deviations existed, the LES captured the overall trend with errors generally below 20%.
In summary, the LES model accurately reproduces the flow around the monopile and shows good agreement with classical experimental results, demonstrating its reliability for subsequent simulations.

3. Results and Discussion

3.1. Flow Field Distribution Around the Monopile

3.1.1. Velocity Distribution Under Flat-Bed Conditions

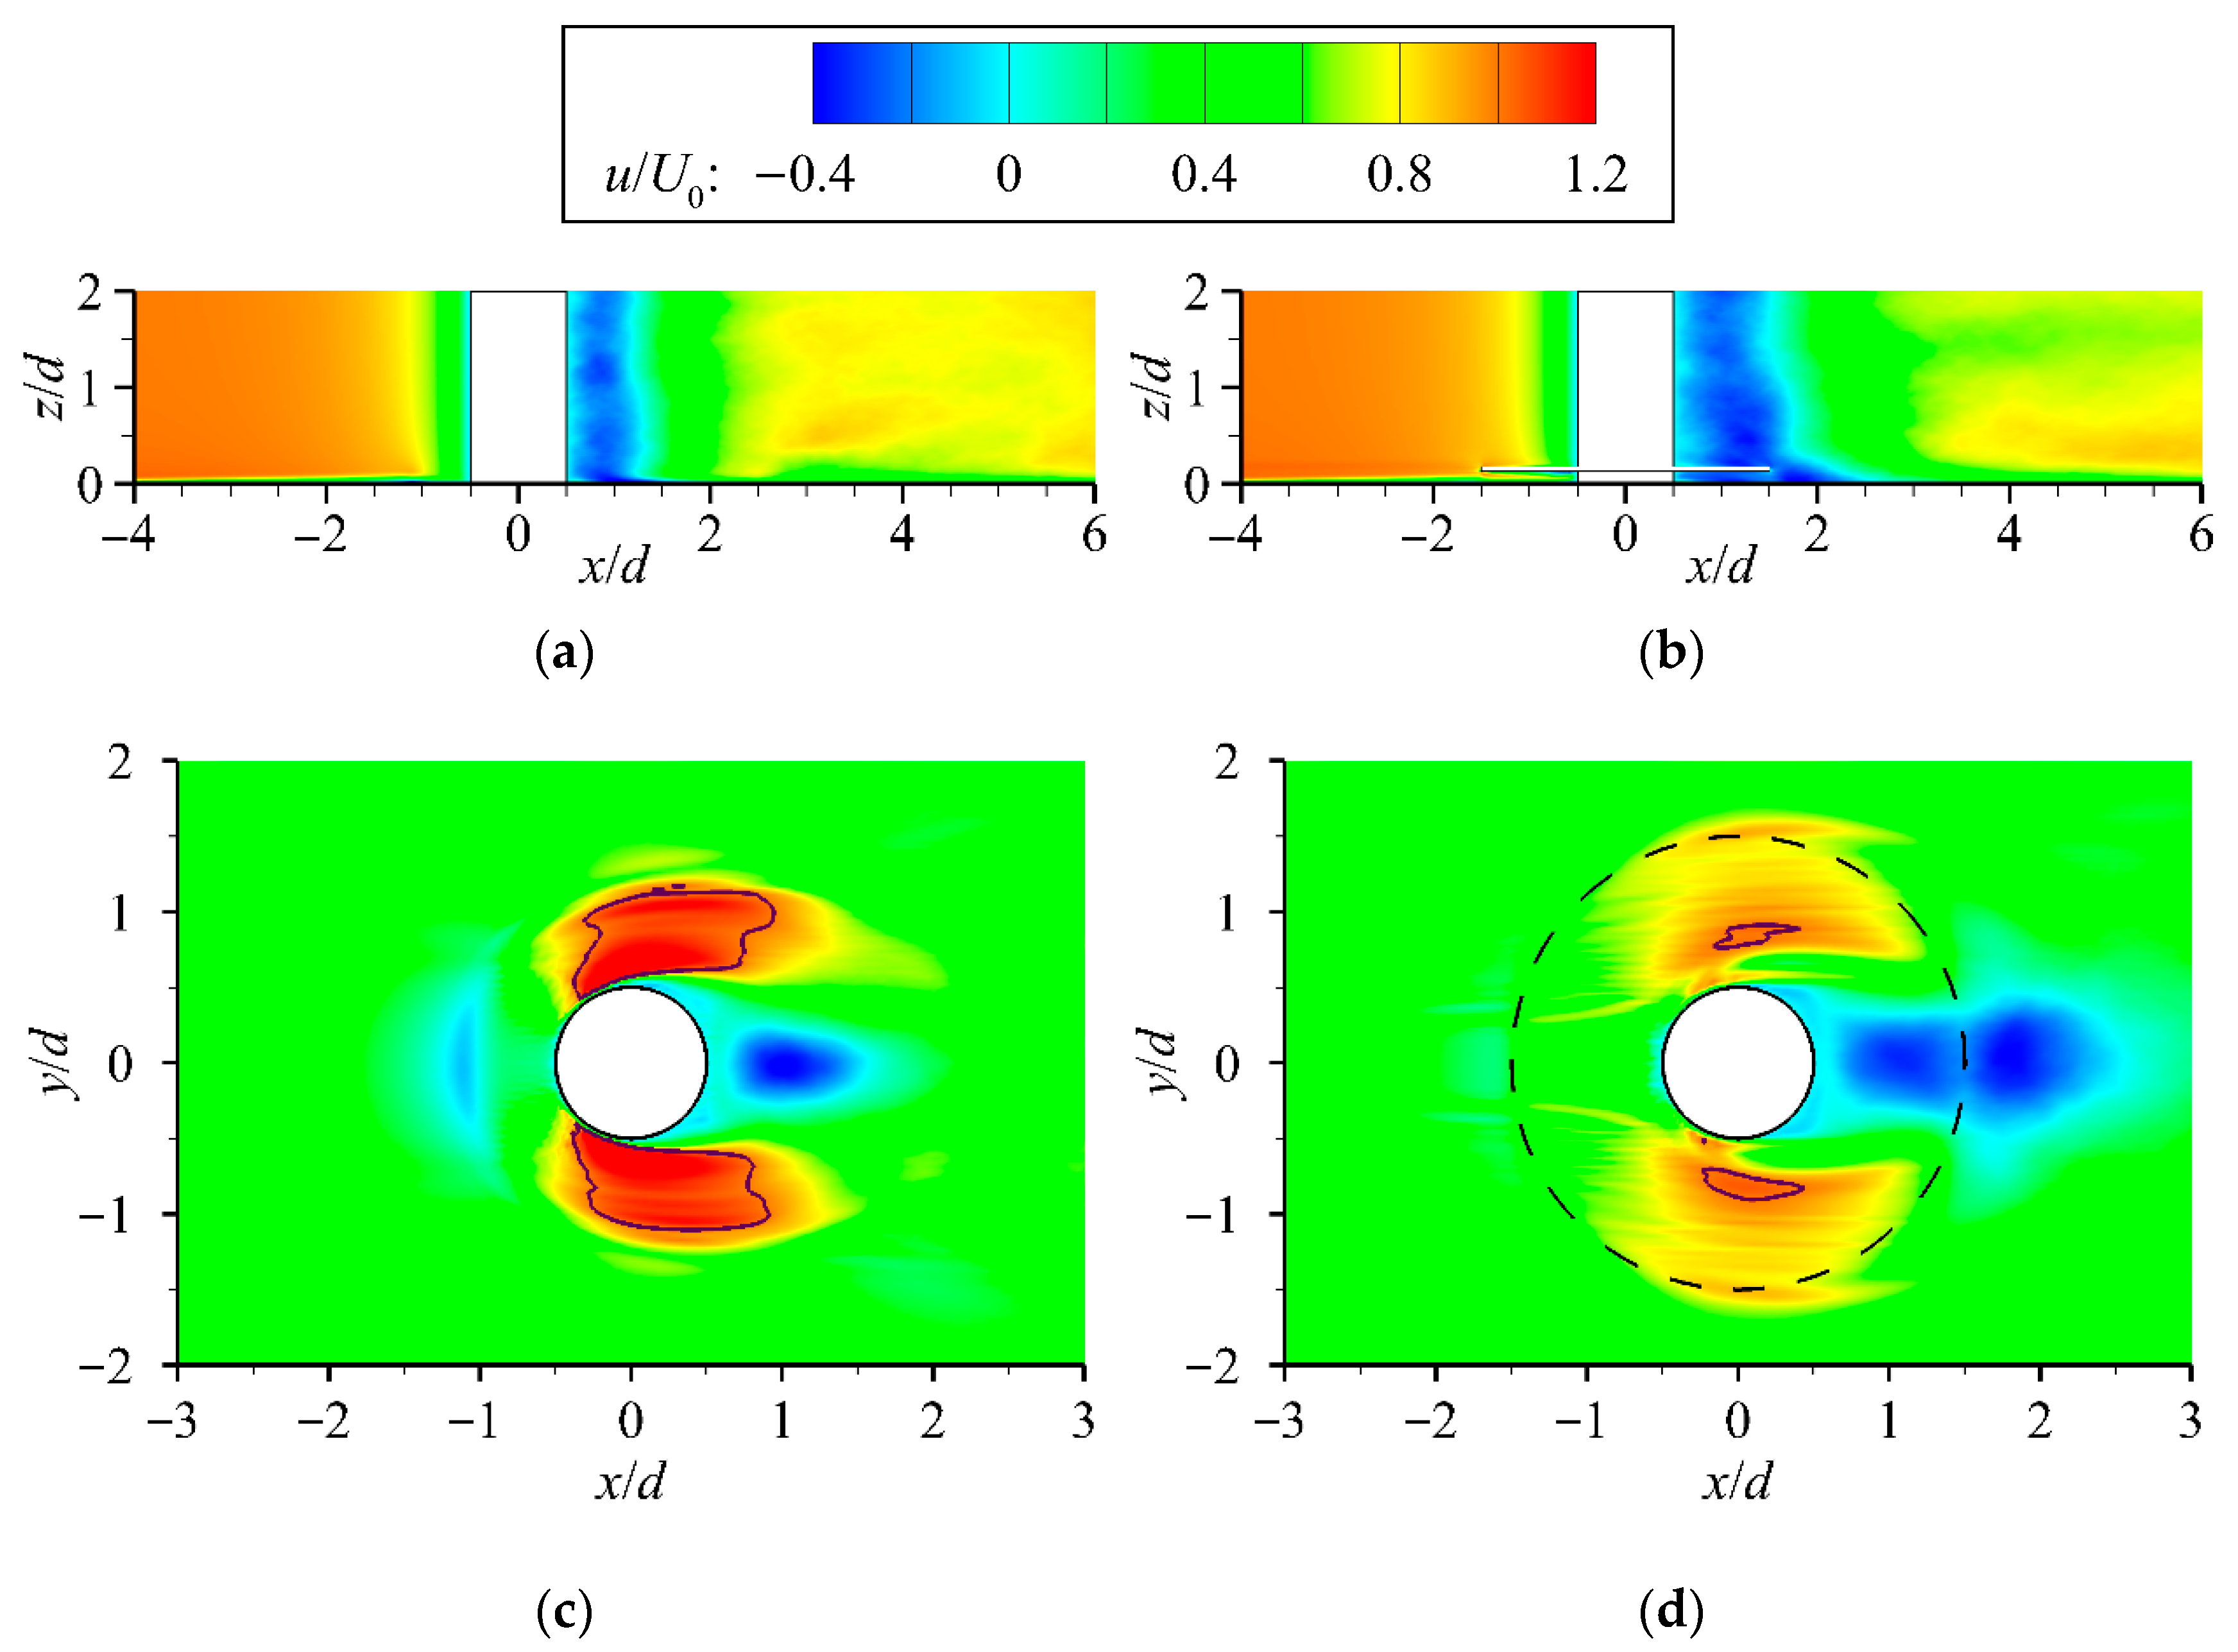
To clarify the flow characteristics prior to scour pit formation, numerical simulations were first conducted under flat-bed conditions. Figure 5 shows the distribution of streamwise mean velocity U around the monopile with and without a collar. In this study, the ratio of water depth to monopile diameter was 2.6, satisfying the requirement for fully developed wake vortices []. As illustrated in Figure 5a, without a collar, the approaching flow was blocked at the upstream edge of the monopile, causing a sharp reduction in the horizontal velocity component, and a negative velocity region developed about 0.75D downstream of the pile base, a typical feature of wake vortices. By contrast, Figure 5b shows that with a collar installed, the negative velocity region downstream expanded to approximately 1.5D. This enlargement can be attributed to the collar altering the incoming flow path and wake structure, thereby weakening the direct impact of horseshoe vortices and downflow in front of the pile, while enlarging the recirculation zone and extending the reverse flow region [,].
Figure 5. Distribution of streamwise velocity U under flat-bed conditions. y/d = 0 section: (a) FB-NP and (b) FB-C1; z/d = 0.04 section: (c) FB-NP and (d) FB-C1.
To further analyze the characteristics of the sidewall accelerated flow under collar protection, the streamwise mean velocity U was extracted at the near-bed plane (z/d = 0.04) for different scenarios. Based on velocity contours, regions with local velocities greater than U0 were identified. As shown in Figure 5c,d, in the unprotected case, large acceleration zones developed on both sides of the monopile, accompanied by evident jet-like concentration, with high flow intensity that could readily initiate and transport sediment. With the collar installed, the results indicate that both the maximum side velocity and the area of the accelerated zone were significantly reduced: the ratio of maximum side velocity to U0 decreased from 1.40 to 1.06 (a reduction of 24.3%), while the accelerated flow area decreased by 93.3%. These findings demonstrate that the collar effectively reduces near-bed streamwise velocity around the pile, thereby suppressing the initiation and development of scour pits.
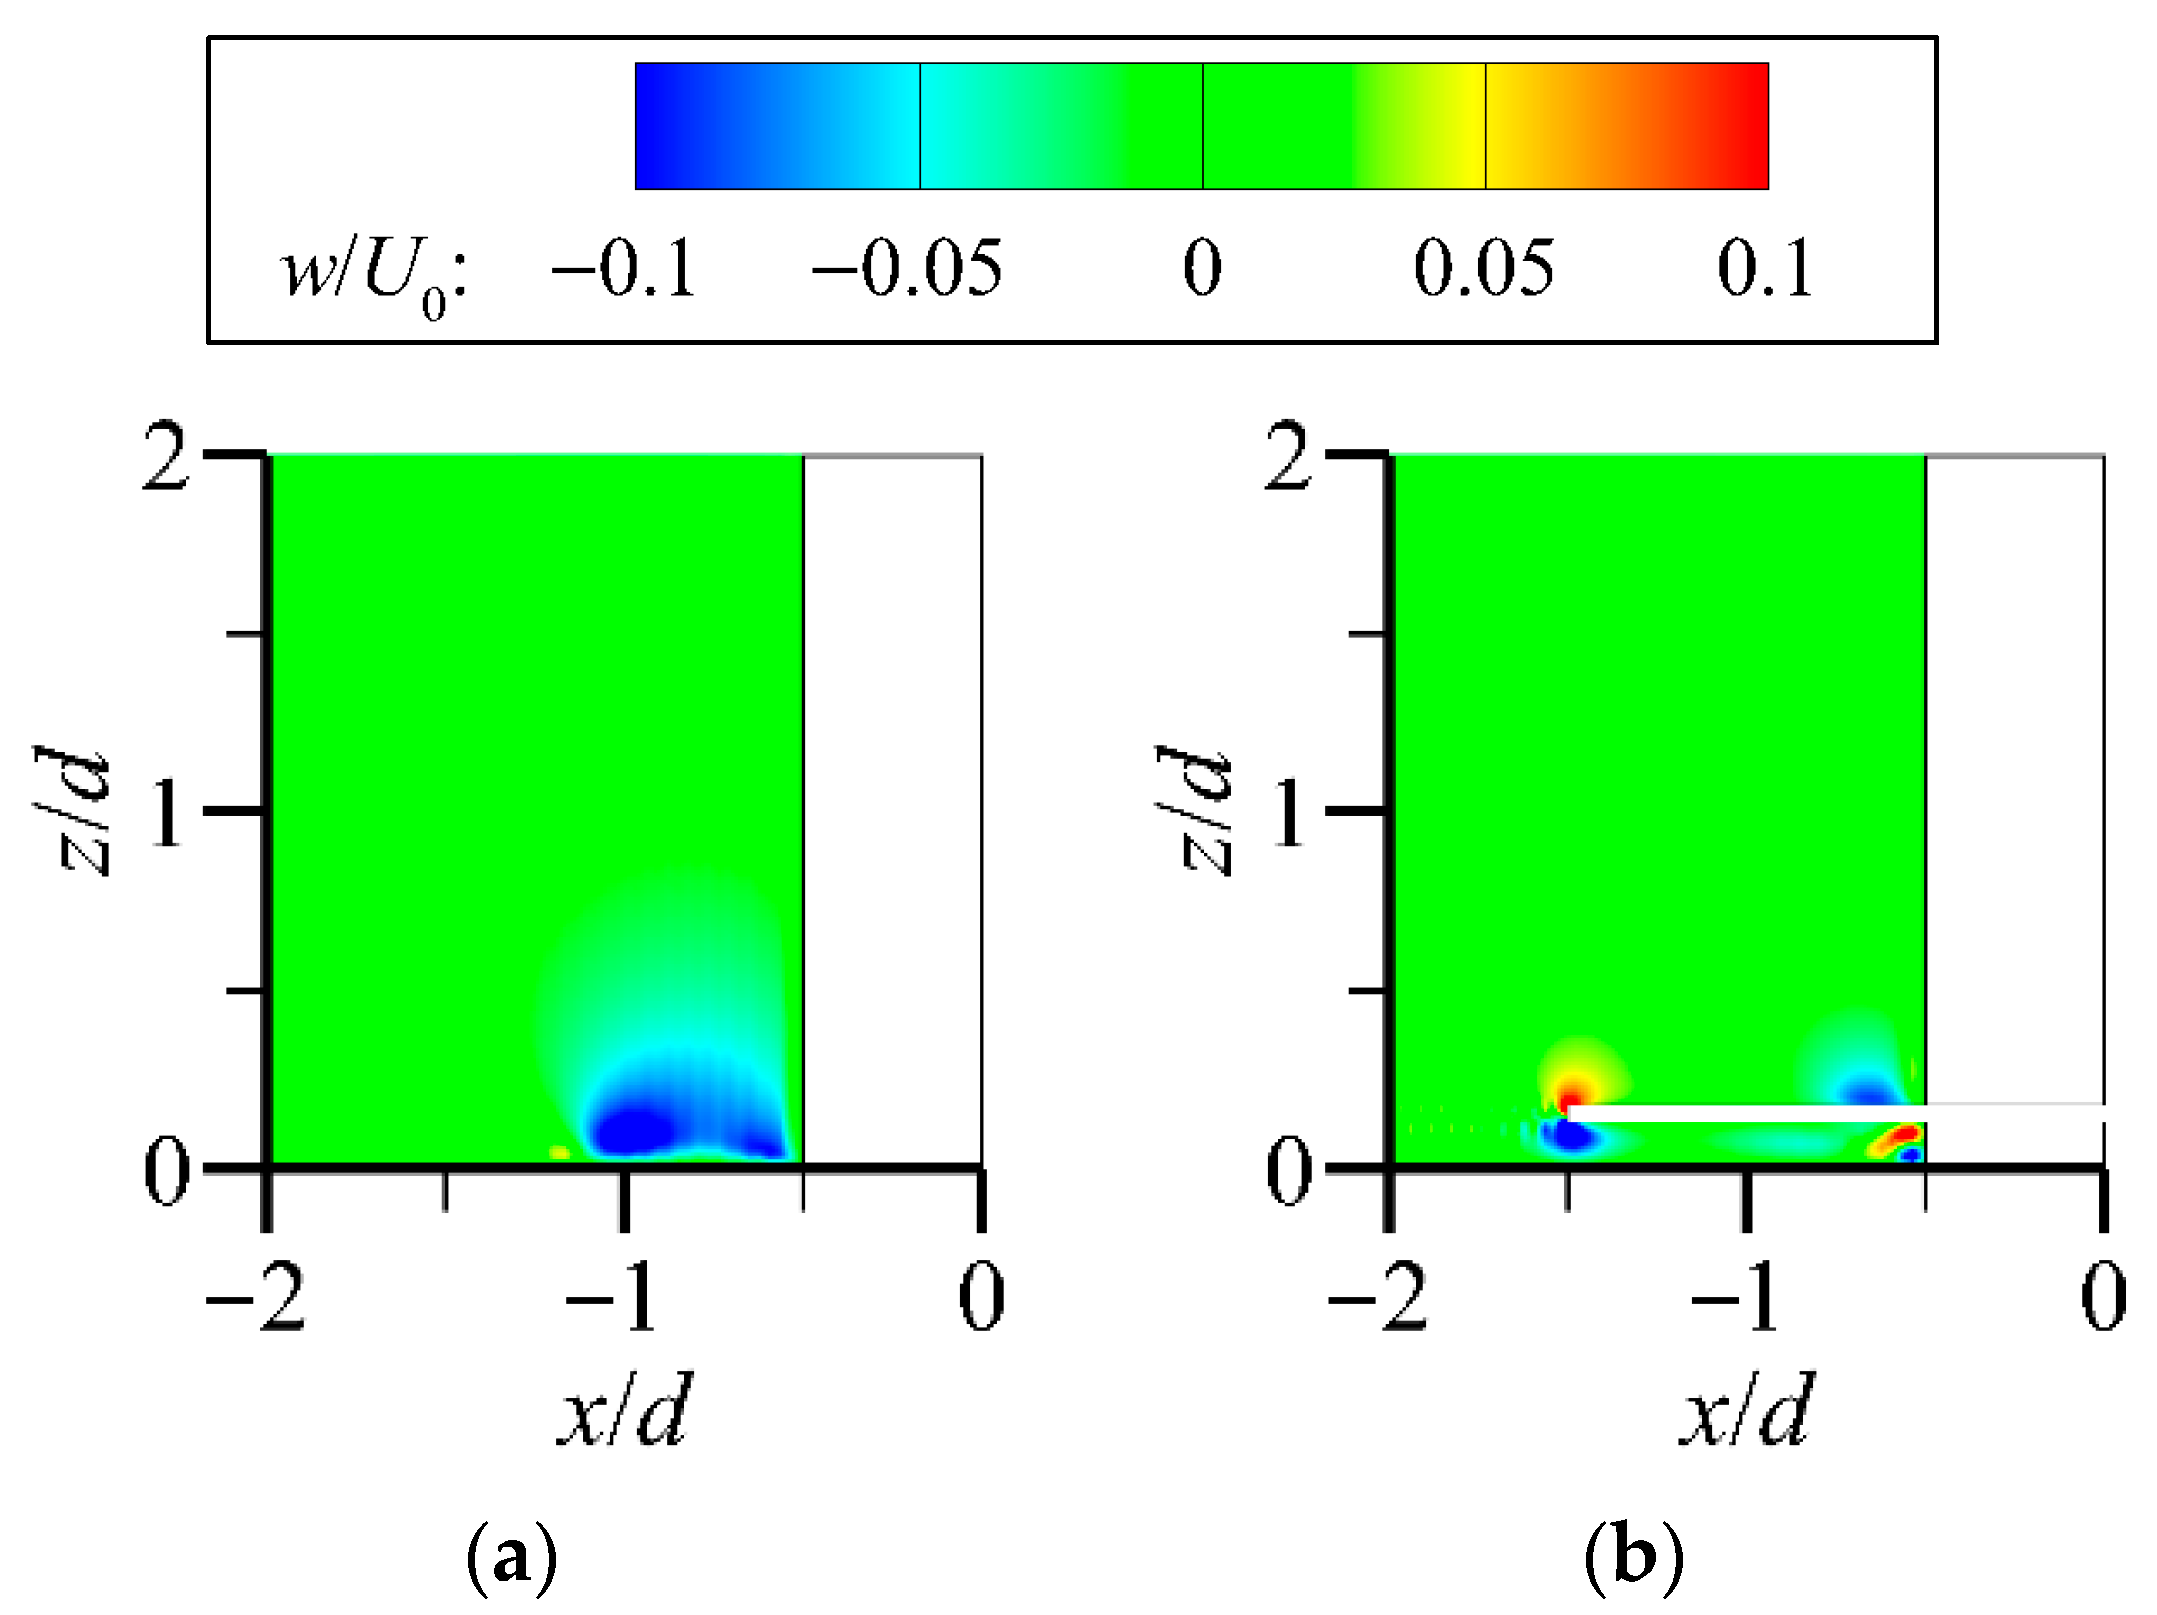
Figure 6 further examines the distribution of vertical mean velocity (w/U0) along the pile’s longitudinal center plane (y/d = 0) under flat-bed conditions. Without the collar (Figure 6a), a pronounced downflow forms at the upstream edge of the monopile, with a maximum negative velocity of 0.89 U0, concentrated within 0.5D upstream of the pile. This strong downflow exerts a substantial impact on the bed surface and is one of the primary drivers of initial scour pit formation. When a collar is installed above the bed surface (Figure 6b), the flow structure is markedly altered and the development of the downflow is suppressed. Instead, symmetric small-scale upward and downward flows appear along the collar’s upper and lower surfaces. Notably, the maximum downflow near the bed is reduced to just 0.16 U0, representing an 82% decrease compared to the unprotected case, with its distribution shifted outward and concentrated near the collar edge.
Figure 6. Distribution of vertical velocity under flat-bed conditions (y/d = 0 section). (a) FB-NP and (b) FB-C1.

3.1.2. Velocity Distribution Under Scour Equilibrium Conditions

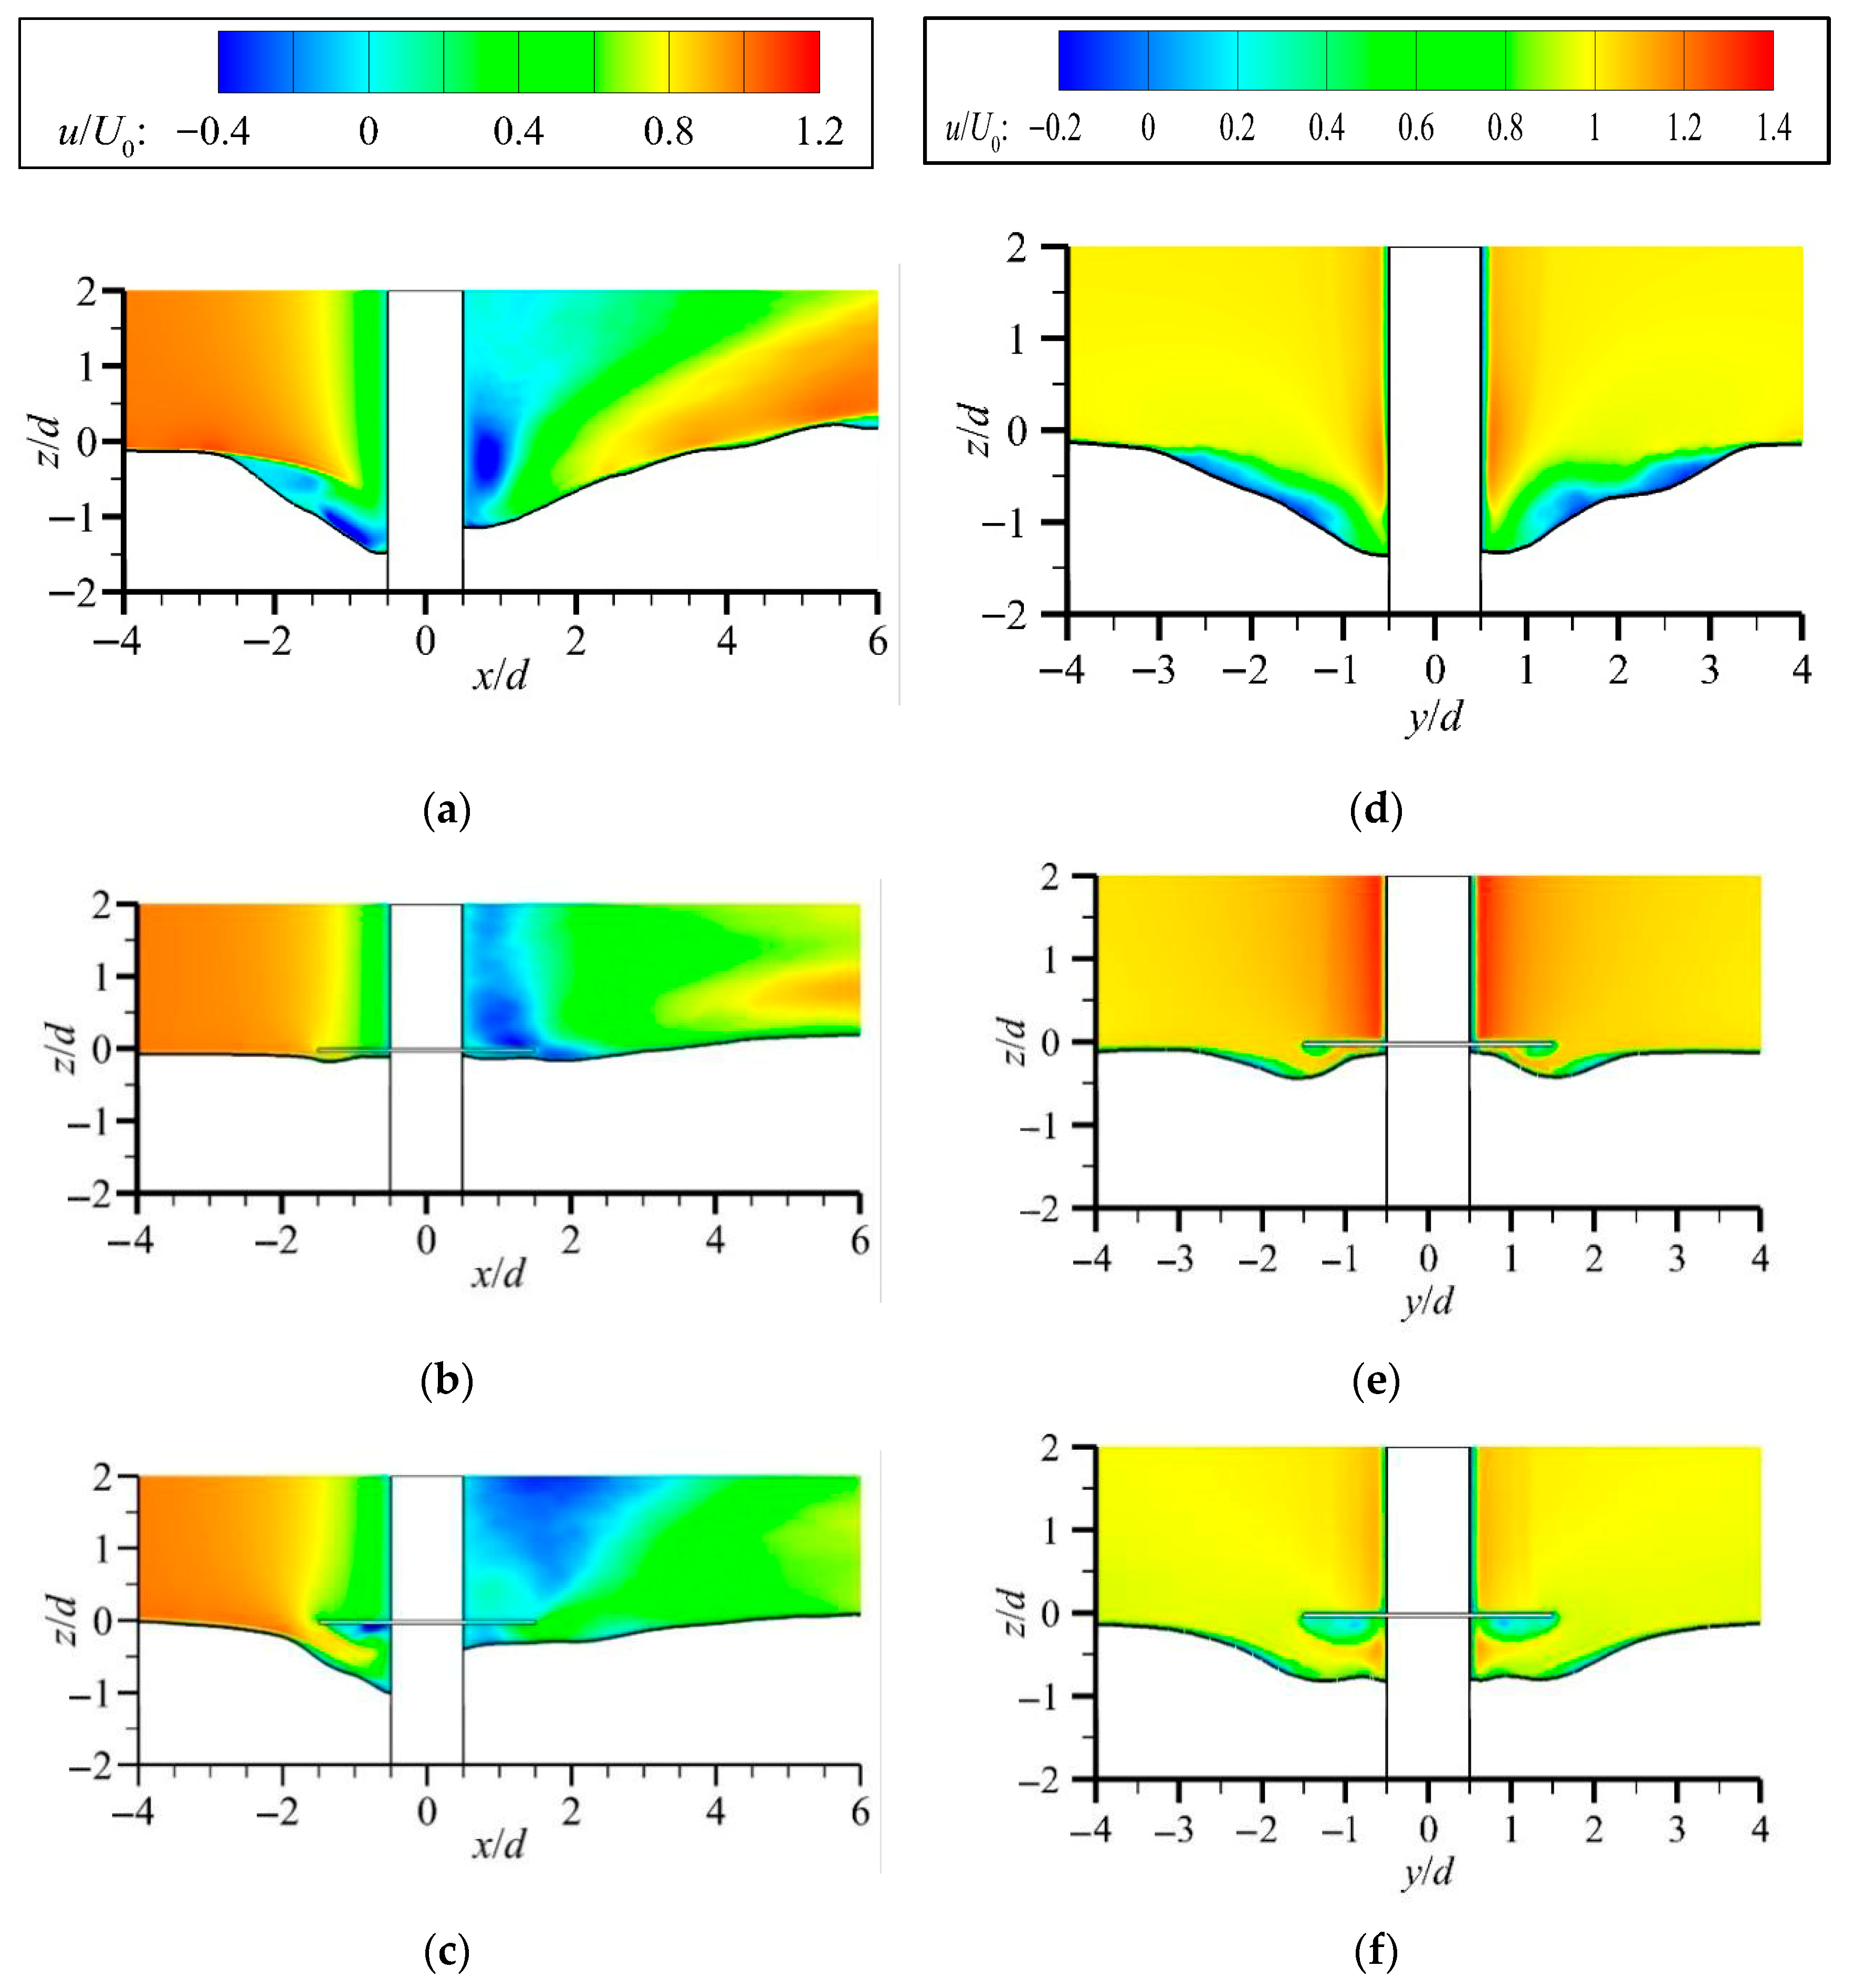
Figure 7 presents the streamwise velocity distributions (u/U0) along the monopile’s longitudinal plane (y/d = 0) and transverse plane (x/d = 0) under different inflow conditions after scour reached equilibrium, comparing the unprotected case (ES-NP) with collar-protected cases (ES-C1-V7, and ES-C2-V8). Results show that when the inflow velocity was 0.7Uc, the scour pit developed significantly in the unprotected case, with maximum depths of about 1.5D at the front and sides and 1D at the rear. In contrast, with collar protection, scour depth was markedly reduced: only small pits of about 0.1D formed at the front and rear within the collar range, while side scour reached a maximum of 0.5D. When inflow velocity increased to 0.8Uc, scour depth under collar protection grew but still remained much lower than in the unprotected condition, with depths of about 1D at the front, 0.8D at the sides, and 0.4D at the rear. These findings, consistent with previous studies [], indicate that collars can significantly mitigate scour development even under relatively high inflow velocities. However, earlier works primarily focused on the final scour morphology while overlooking the scouring process itself. Therefore, unlike previous studies, the present work attempts to elucidate the underlying mechanisms of this phenomenon from the perspective of flow field distribution characteristics under different conditions.
Figure 7. Distribution of streamwise velocity U at scour equilibrium. y/d = 0 section: (a) ES-NP, (b) ES-C1-V7, (c) ES-C2-V8; x/d = 0 section: (d) ES-NP, (e) ES-C1-V7, (f) ES-C2-V8.
As shown in Figure 7, the equilibrium flow patterns exhibited distinct characteristics in the front, side, and rear regions of the monopile. In the front region, clear differences emerged between scenarios. Without protection (Figure 7a), the incoming flow was blocked by the monopile and locally accelerated at the pit edge, descending diagonally into the scour pit. However, velocity quickly decayed near the pile or bed, forming a localized recirculation zone in the lower part of the pit. With a collar installed flush with the bed surface (Figure 7b), the accelerated flow and downflow were effectively suppressed, leaving only a small, shallow pit with weak velocities and no obvious recirculation, indicating excellent protection. At higher inflow (Figure 7c), however, the front scour pit deepened and expanded, and a tongue-shaped jet with a peak velocity of about 0.88U0 developed between the collar and bed. This jet penetrated beneath the collar, continuously eroding the upstream bed and creating a small recirculation near the collar’s lower surface. These results suggest that, under stronger inflow, the accelerated jet between the collar and bed is the primary cause of reduced protective efficiency.
In the wake region of the monopile, different flow features were observed under various scenarios. Without protection (Figure 7a), an upward accelerating flow develops near the bed on the downstream side of the pile. This flow, interacting with the wake vortices and the approaching current, generates a tail acceleration zone extending from about 2D to 6D downstream, where the velocity gradually increases to 1.09U0. As a result, the scour depth behind the pile is significantly greater in the unprotected case compared to the collar-protected condition. When a collar is installed (Figure 7b), the accelerated flow zone behind the pile becomes much smaller, and its distance from the pile increases, thereby greatly reducing its erosive impact on the bed surface. Although the recirculation zone expands under this condition, the region within 0–2D downstream remains dominated by low-velocity flow, which limits bed erosion, in agreement with the conclusions reported by Gupta et al. []. However, when the inflow velocity is further increased (Figure 7c), the accelerated flow zone behind the pile does not expand but instead diminishes, while the recirculation region above the collar becomes more pronounced. This phenomenon is likely due to the strong energy dissipation caused by the wake vortices, which suppresses further velocity growth downstream and alleviates the deepening of the scour pit.
Analysis of the lateral flow field shows that under unprotected conditions (Figure 7d), an acceleration zone with velocity up to 1.2U0 develops along the pile side, about 0.5D above the pit bottom, while the pit bottom flow remains weak and near-bed recirculation dominates. Previous studies have shown that the peak velocities occur at the pier sides []. Our results further reveal that installing a collar alters this pattern: with a collar installed (Figure 7e), the direct contact between accelerated flow and bed sediment is suppressed; the maximum velocity above the collar rises to 1.33U0, but beneath the collar it drops to 1.09U0, limiting scour. When inflow increases (Figure 7f), acceleration between the collar and bed intensifies and promotes sediment transport, yet as the scour pit enlarges, the flow cross-section beneath the collar increases, reducing velocity to about 1.13U0. A low-velocity zone then forms under the collar, keeping the overall flow relatively balanced. Thus, even at higher inflow, the collar still offers measurable scour protection compared with the unprotected case.
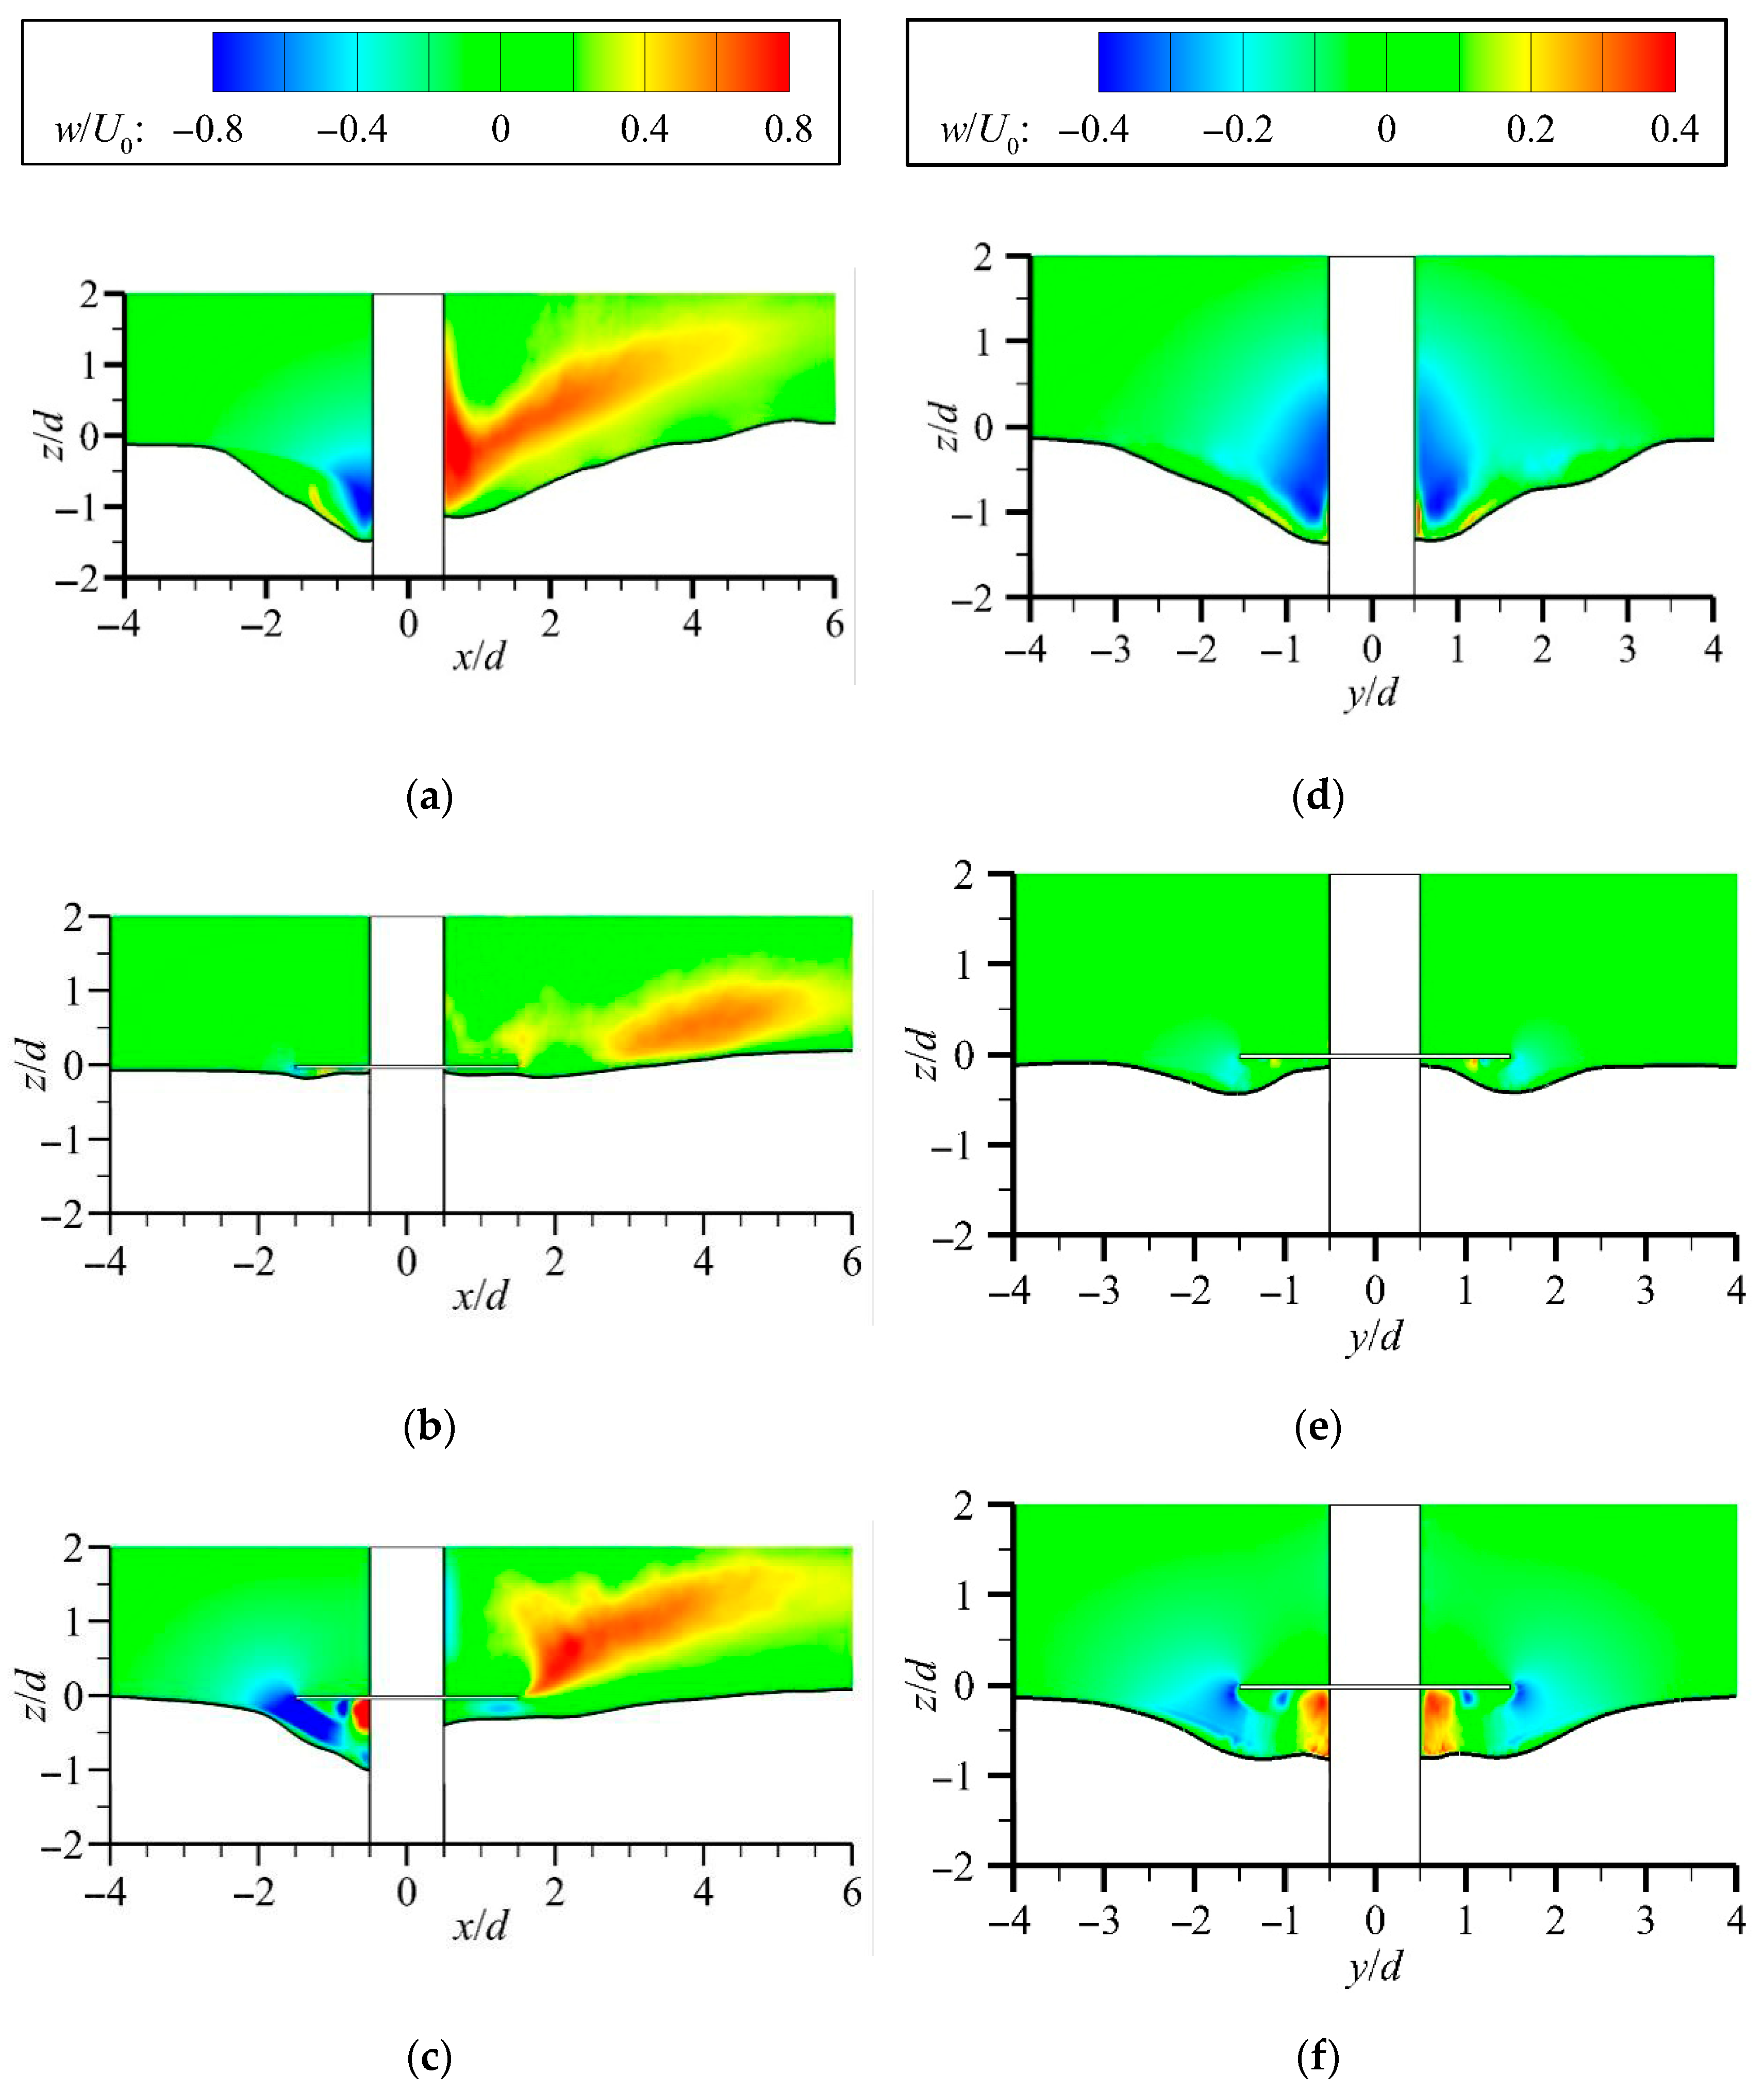
Since the scour process around the monopile is primarily characterized by vertical bed elevation changes, the vertical flow plays a key role in shaping scour morphology. Existing numerical studies have often focused on horizontal velocity variations while neglecting the influence of vertical velocity on scour development [,]. Figure 8 presents the distribution of vertical velocity (w/U0) in both the longitudinal (y/d = 0) and transverse (x/d = 0) sections of the monopile at equilibrium scour under different conditions. Distinct differences can be observed at the upstream, lateral, and downstream regions.
Figure 8. Distribution of streamwise velocity W at scour equilibrium. y/d = 0 section: (a) ES-NP, (b) ES-C1-V7, (c) ES-C2-V8; x/d = 0 section: (d) ES-NP, (e) ES-C1-V7, (f) ES-C2-V8.
For the upstream flow, the unprotected case shows that the vertical velocity within the scour pit is dominated by a strong downflow near the upstream edge of the pile and an upflow within the pit interior, consistent with the experimental results of Guan et al. []. As shown in Figure 8a, the downflow penetrates the pit, where gravitational potential energy is converted into kinetic energy, reaching a maximum velocity of 0.83U0 and producing a strong impact on the bed surface. After striking the pit bottom, part of the flow returns upstream, generating an upflow in the pit center with a maximum velocity of 0.45U0. Traditional riprap protection relies mainly on increasing bed roughness to dissipate flow energy and resist sediment entrainment, but its effect is largely confined to bed reinforcement, with limited alteration of local flow structures. Under strong vertical impingement, riprap may become unstable or displaced []. By contrast, with a collar installed (Figure 8b), the downflow immediately in front of the pile is almost eliminated, and only a weak flow following the pit slope appears beneath the collar. This demonstrates the advantage of collars over riprap, as they directly suppress strong downflows and reshape vortex structures at the pier–bed interface. When the inflow velocity rises to 0.8Uc (Figure 8c), the equilibrium scour depth increases notably, and a tongue-shaped downflow with a velocity up to 0.5U0 forms between the collar and the bed. This downflow interacts with horizontal acceleration flow, generating strong vortices that erode the bed beneath the collar and weaken its protection. In addition, flow impinging on the pit bottom is forced upward, creating a strong upflow near the collar–pile junction with a peak velocity of 0.87U0.
For the pile rear region, all three cases are dominated by upflow, but with clear differences. Without protection (Figure 8a), the upflow is extensive and strong, with a peak velocity of 0.85 U0 right behind the pile, posing a significant threat to the bed. With a collar installed (Figure 8b), the upflow is notably weakened and shifted farther away from the pile. Even when the inflow increases (Figure 8c), the maximum upflow remains only 0.5U0 and is mainly confined above the collar, reducing its impact on the bed. This demonstrates that the collar effectively suppresses rear upflow and mitigates scour.
For the lateral flow field, the vertical velocity distribution also differs significantly between the protected and unprotected cases. Without protection (Figure 8d), the distribution resembles that in front of the pile, consisting of both downflow and upflow. However, the side downflow splits at the pit bottom into two upflows: one rising closely along the pile surface, and the other spreading outward along the pit slope. The upflow adjacent to the pile is the strongest, with a maximum velocity of 0.56U0, exceeding the peak downflow velocity of −0.39U0, thereby strongly influencing scour development. With collar protection (Figure 8e,f), the side downflow is greatly reduced and confined to the outer edge of the collar. Under inflow conditions of 0.7Uc and 0.8Uc, the maximum downflow velocities drop to −0.20U0 and −0.30U0, respectively. In addition, the upflow distribution changes markedly, moving inward along the pit slope until it reaches the underside of the collar.

3.2. Distribution of Time-Averaged Vortices

3.2.1. Vortex Distribution Under Flat-Bed Conditions

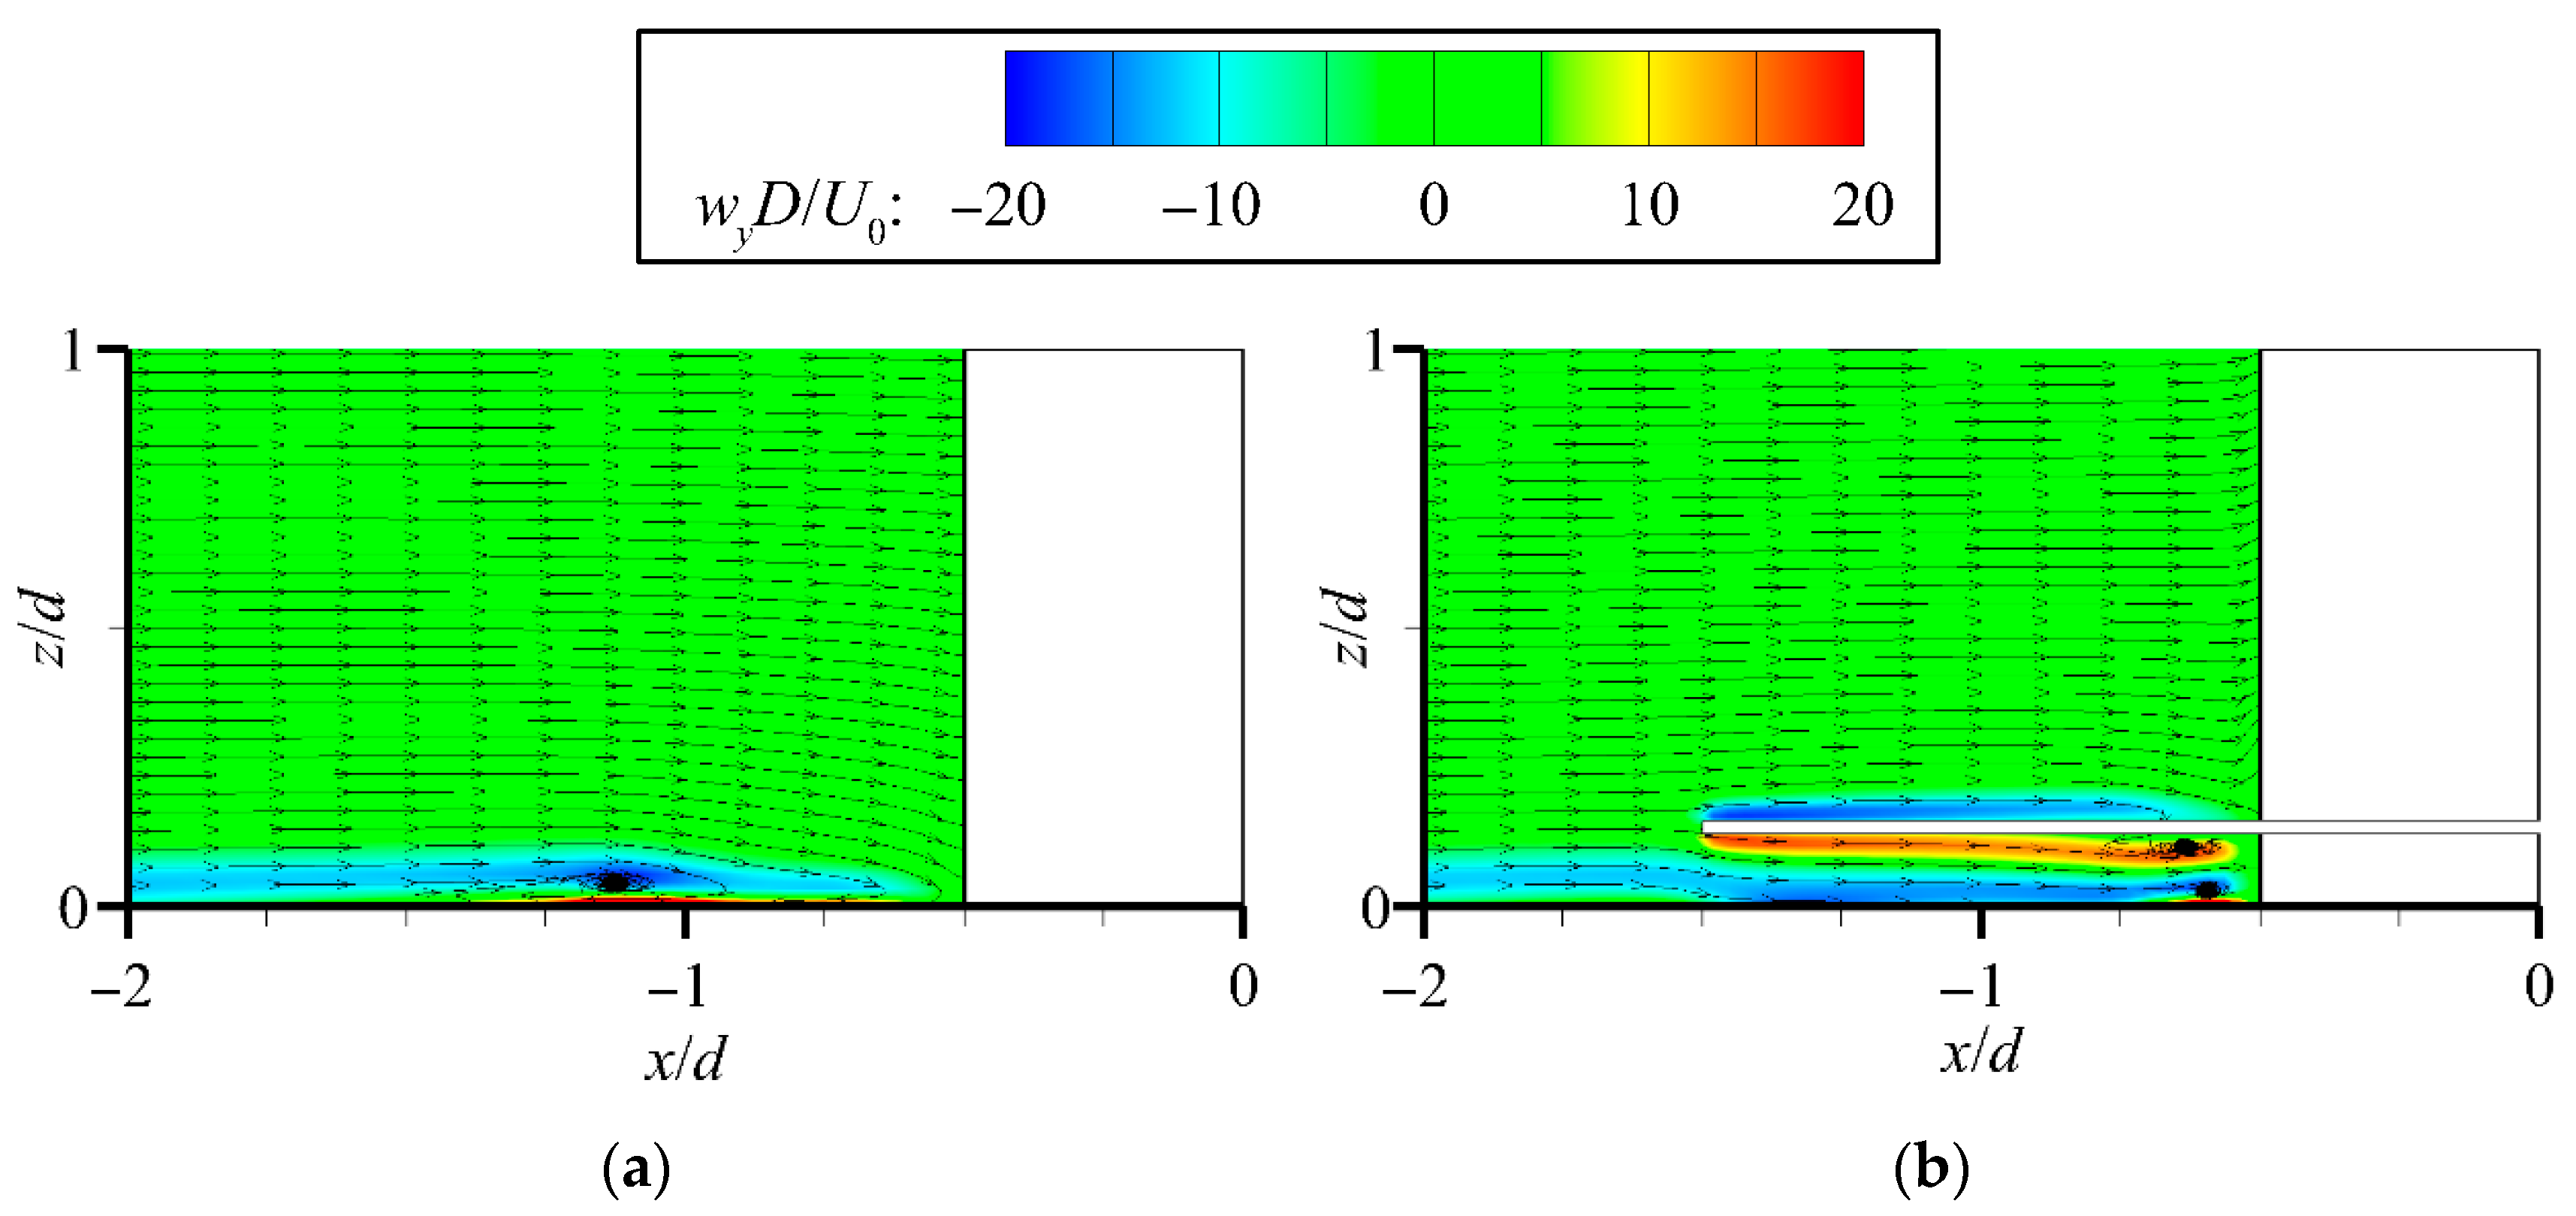
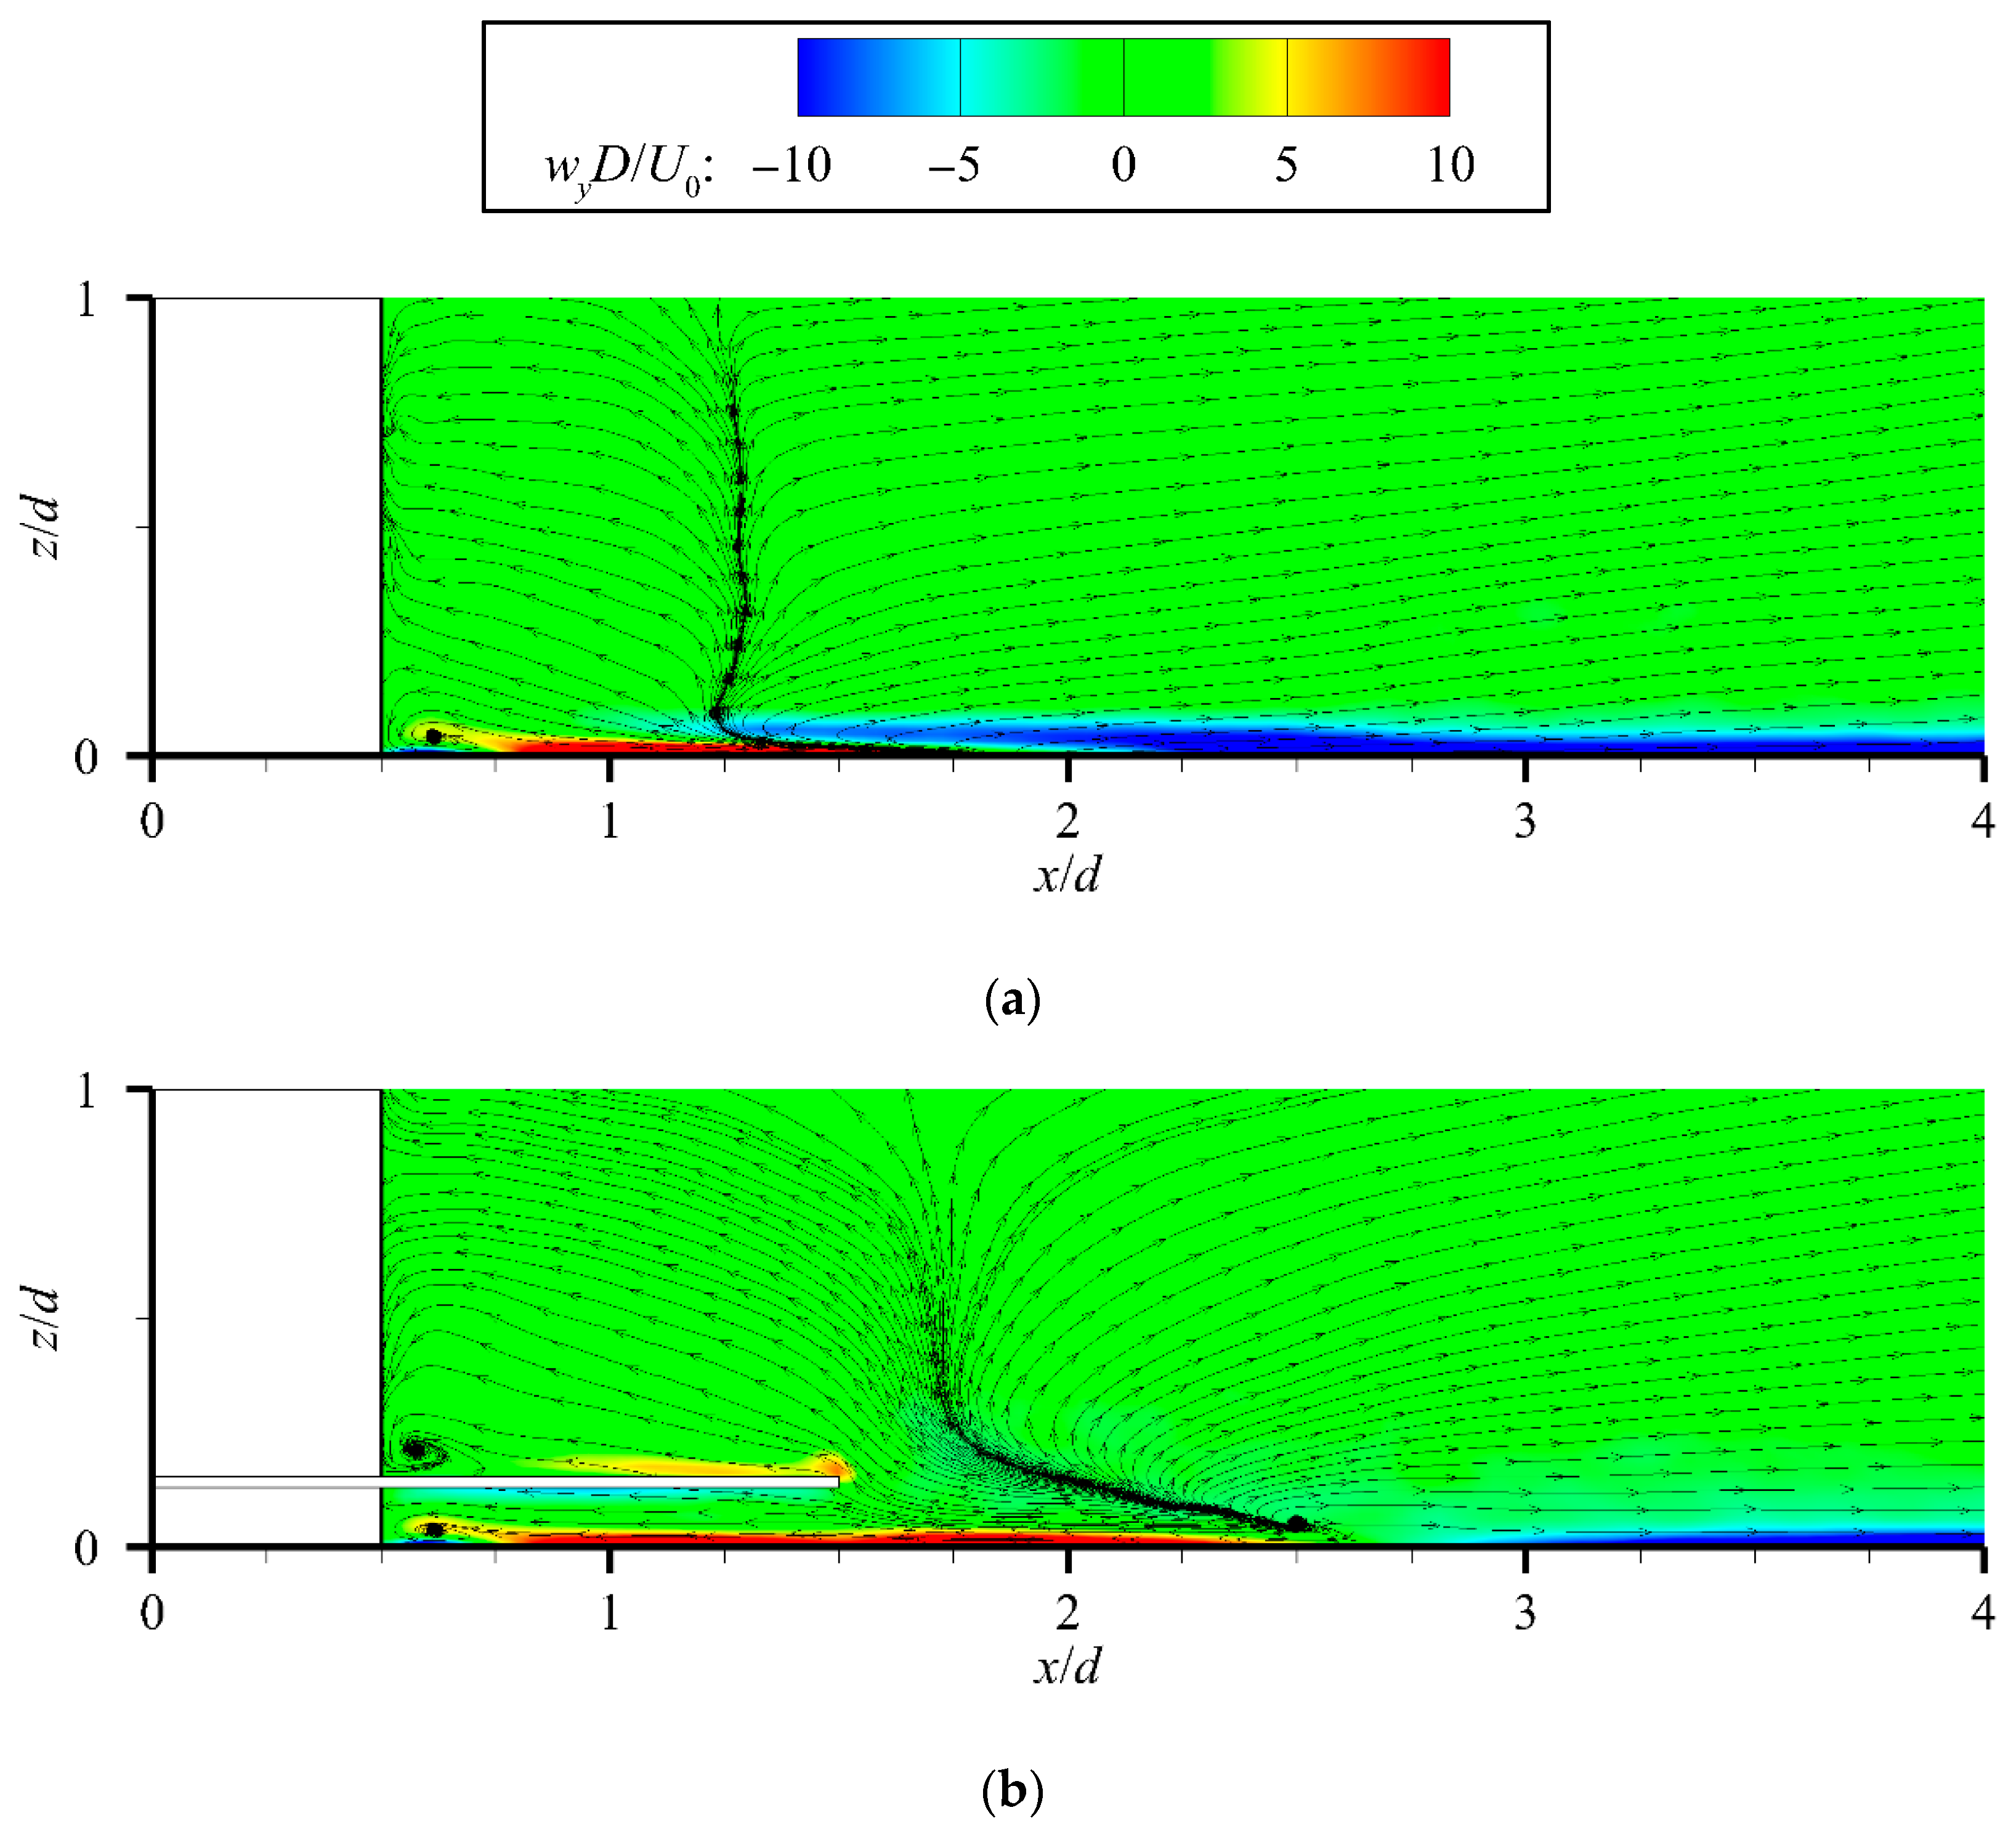
Figure 9 and Figure 10 illustrate the distribution of mean streamlines and vorticity (ωy) in the longitudinal center plane of the monopile (y/d = 0) under flat-bed conditions. In these figures, red denotes counterclockwise vortices, while blue denotes clockwise vortices.
Figure 9. Mean streamlines and vorticity at the pile front under flat-bed conditions (y/d = 0). (a) FB-NP and (b) FB-C1.
Figure 10. Mean streamlines and vorticity at the pile rear under flat-bed conditions (y/d = 0). (a) FB-NP and (b) FB-C1.
On the upstream side of the monopile (Figure 9a,b), a downflow is present regardless of whether a collar is installed, giving rise to small horseshoe vortices along the bed surface. With the collar in place, previous studies have demonstrated that it promotes gradual flow separation, thereby reducing vortex intensity and mitigating scour []. In the present study, however, we found that the reduction in vortex intensity is primarily attributable to the formation of a pair of counter-rotating vortices above and below the structure, with the counterclockwise vortex beneath the collar exhibiting a strength comparable to that of the bed surface vortex.
On the downstream side (Figure 10a,b), the unprotected case produces a reverse recirculation zone extending about 0.75D behind the pile, where clear counterclockwise vortices appear close to the bed (0.5 ≤ x/d ≤ 1.25). Beyond x/d > 1.25, this recirculation gradually weakens and disappears, the flow direction realigns with the main stream, and near-bed vorticity shifts clockwise with straighter streamlines. By contrast, when a collar is installed, the recirculation zone nearly doubles in size, extending to about 1.5D, and the counterclockwise vortices near the bed are sustained further downstream, up to around 2.5D behind the pile.

3.2.2. Vortex Distribution Under Scour Equilibrium Conditions

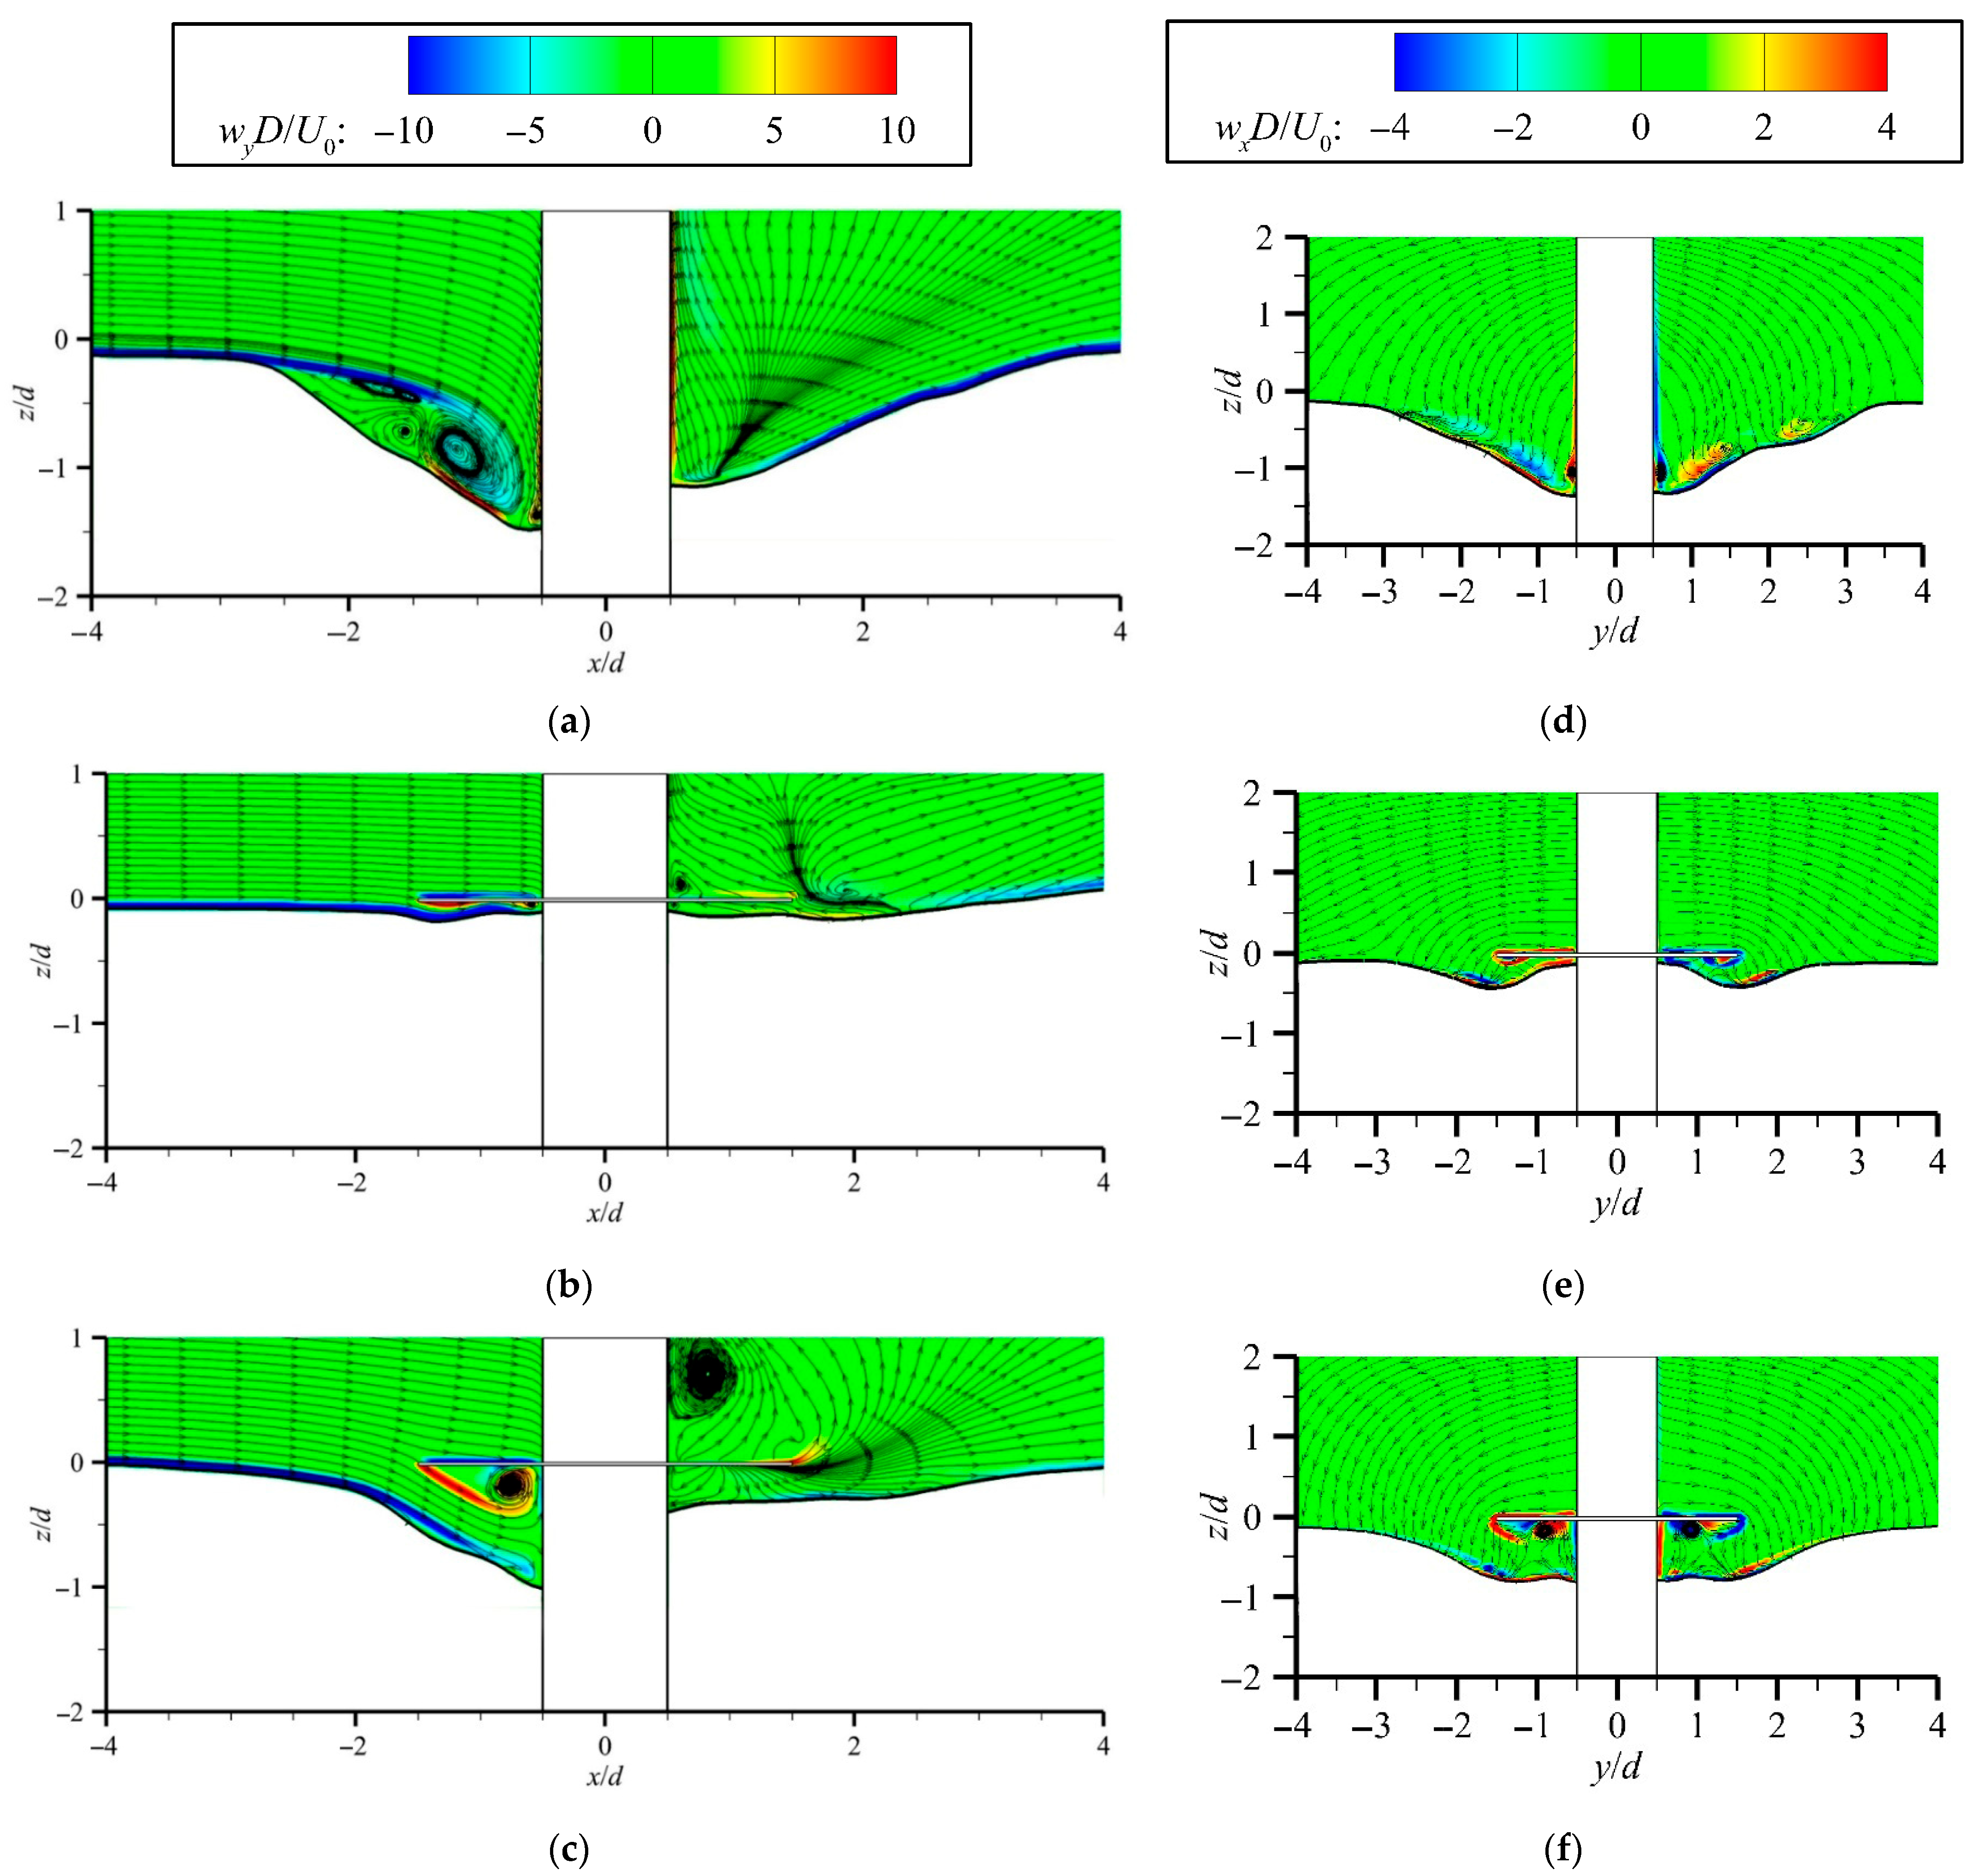
Figure 11 presents the mean streamlines and vorticity within the scour pit at equilibrium, showing their distribution in both the longitudinal center plane of the monopile (y/d = 0) and the transverse section of the pit (x/d = 0).
Figure 11. Mean streamlines and vorticity at scour equilibrium. Vorticity ωy at y/d = 0 section: (a) ES-NP, (b) ES-C1-V7, (c) ES-C2-V8; vorticity ωx at x/d = 0 section: (d) ES-NP, (e) ES-C1-V7, (f) ES-C2-V8.
Without protection, a typical scour pit forms around the monopile (Figure 11a). In the longitudinal section, three vortices are observed: a small junction vortex at the pit bottom (0.1 D, weak, counter-clockwise), a strong main vortex in the mid-to-lower steep slope (0.6–0.7 D, clockwise, with a weak upstream counter-rotation), and a weak, flattened vortex in the upper gentle-slope area (clockwise). These vortices define the flow structure of the equilibrium scour pit. Compared with PIV experiments [], the small vortex here appears more flattened, likely due to the finer vertical mesh near the bed. In the transverse section (Figure 11d), vortices occur mainly on both sides of the pit bottom, some near the pile and others along the pit edge, rotating in opposite directions. Overall, the vortex distribution agrees well with previous studies.
Previous studies have shown that installing a collar significantly reduces the formation of horseshoe and wake vortices and separates the vortex field into upper and lower regions []. However, the underlying mechanisms behind these phenomena have not been thoroughly analyzed. When a collar is installed (Figure 11b), only two scour grooves develop on either side of the foundation, while upstream scour becomes negligible, with only minor local scour observed along the lower edge of the collar. Because the collar effectively blocks most of the downflow, almost no vortices are generated near the upstream bed surface, and the vortex distribution closely resembles that under flat-bed conditions, indicating that the collar provides strong protection at this flow velocity. In the transverse section (Figure 11e), the approaching flow is diverted laterally around the pile, while the downflow, also impeded by the collar, impinges on the bed at the outer edge of the collar. This interaction produces two symmetric counter-rotating vortices, one beneath the collar edge and the other along the outer edge of the scour pit.
When the inflow velocity further increases to 0.80Uc, the scour depth in both the upstream and downstream regions becomes significantly greater compared to lower-flow conditions (Figure 11c). At this stage, the angle between the collar and the downflow streamlines widens, allowing part of the flow to intrude into the pit through the gap between the collar and the bed. At the lower edge of the collar, this intruding flow interacts with the pile to generate a large, high-intensity counterclockwise vortex. This vortex dissipates a substantial portion of the flow’s kinetic energy, thereby reducing the volume of downflow reaching the pit bottom, and can thus be regarded as a typical energy-dissipating vortex. As a result, only a weaker clockwise vortex remains near the bed, and the flow structure around the bed becomes much simpler than in the unprotected case, effectively mitigating scour. This simplification of the vortex field represents a distinct advantage of collars compared with other protective measures. As shown in Figure 11f, although the scour depth in the transverse section increases under higher velocities, the overall vortex distribution remains similar to that observed at lower velocities. The main difference is that the energy-dissipating vortex beneath the collar becomes larger in scale and shifts closer to the inner edge of the collar.
In summary, when the collar is installed flush with the bed surface, a counter-rotating energy-dissipating vortex develops beneath it, effectively dissipating local kinetic energy, reducing the flow intensity around the pile, and mitigating scour. However, under high approach flow velocities or when the collar width is insufficient, the accelerated flow along the pile sides becomes the critical factor leading to protection failure. In such cases, the influence zone of the accelerated flow extends beyond the effective protection range of the collar, inducing scour grooves at its edges. These grooves then allow approach flow to penetrate further, where interaction with downflow generates horseshoe vortices, subjecting the collar edges to continuous erosion. As the grooves deepen and gradually expand upstream, they eventually merge, forming a scour pit that encircles the upstream and lateral sides of the pile.

3.3. Turbulence Intensity Around the Monopile

3.3.1. Distribution of Turbulence Intensity Under Flat-Bed Conditions

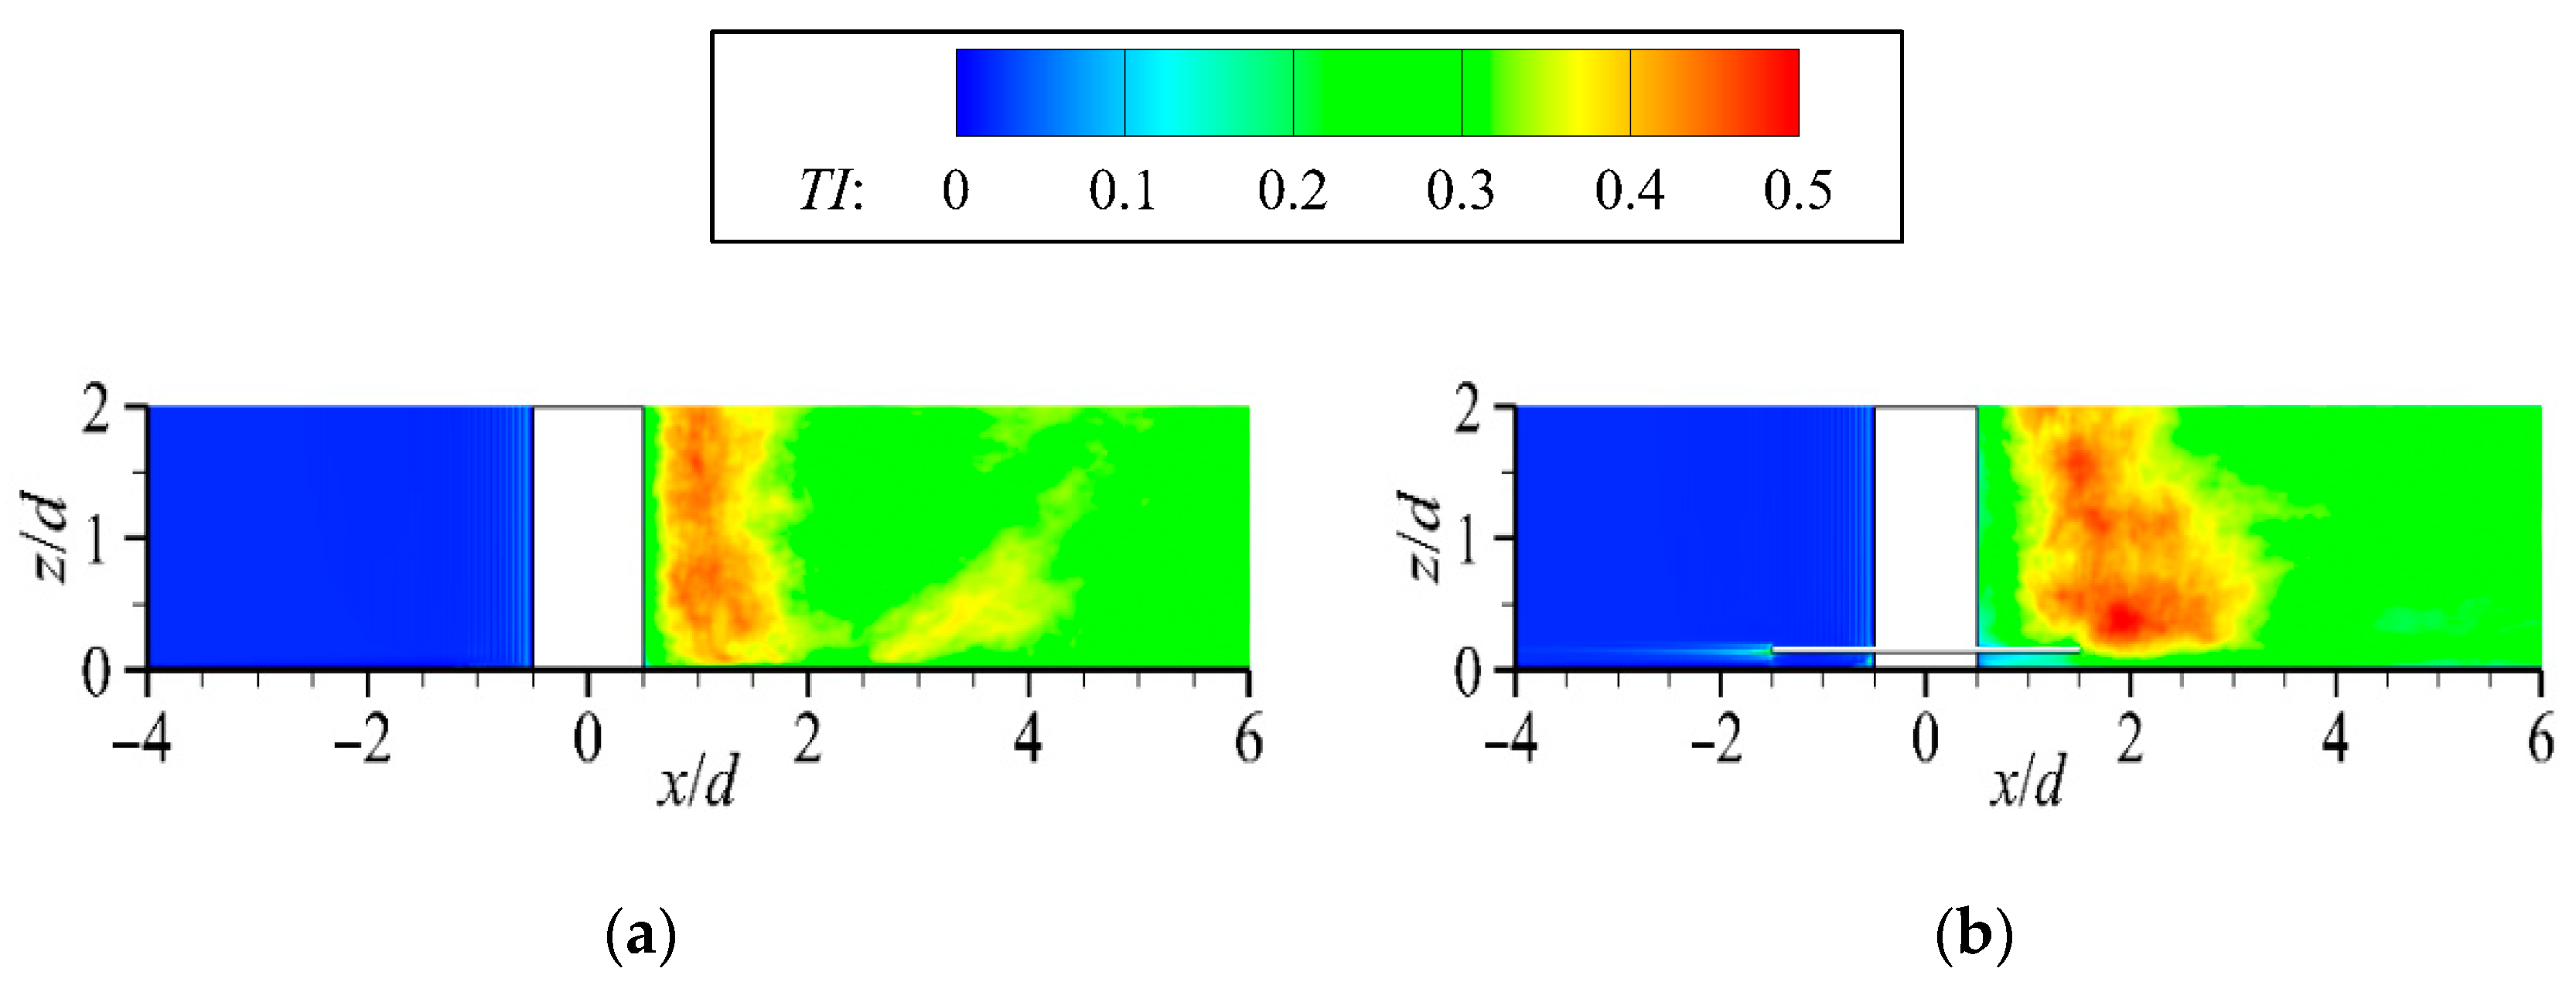
Figure 12 shows the turbulence intensity (TI) distribution along the monopile longitudinal section (y/d = 0) for the unprotected case (FB-NP) and the collar-protected case (FB-C1).
Figure 12. Turbulence intensity distributions under flat-bed conditions (section at y/d = 0). (a) FB-NP and (b) FB-C1.
As shown in Figure 12, under unprotected conditions, the turbulence intensity in front of the pile is nearly zero, indicating that no significant flow disturbance develops at the upstream bed surface under flat-bed conditions, consistent with the mean streamline distribution. In contrast, turbulence is concentrated in the wake region behind the pile. Based on the intensity distribution, this region can be divided into two zones: a strong wake region within 0.5 ≤ x/d ≤ 1.5, where TI increases markedly to 0.3–0.5 and reaches its maximum, and a weak wake region for x/d > 1.5, where turbulence rapidly decays and stabilizes at about 0.2.
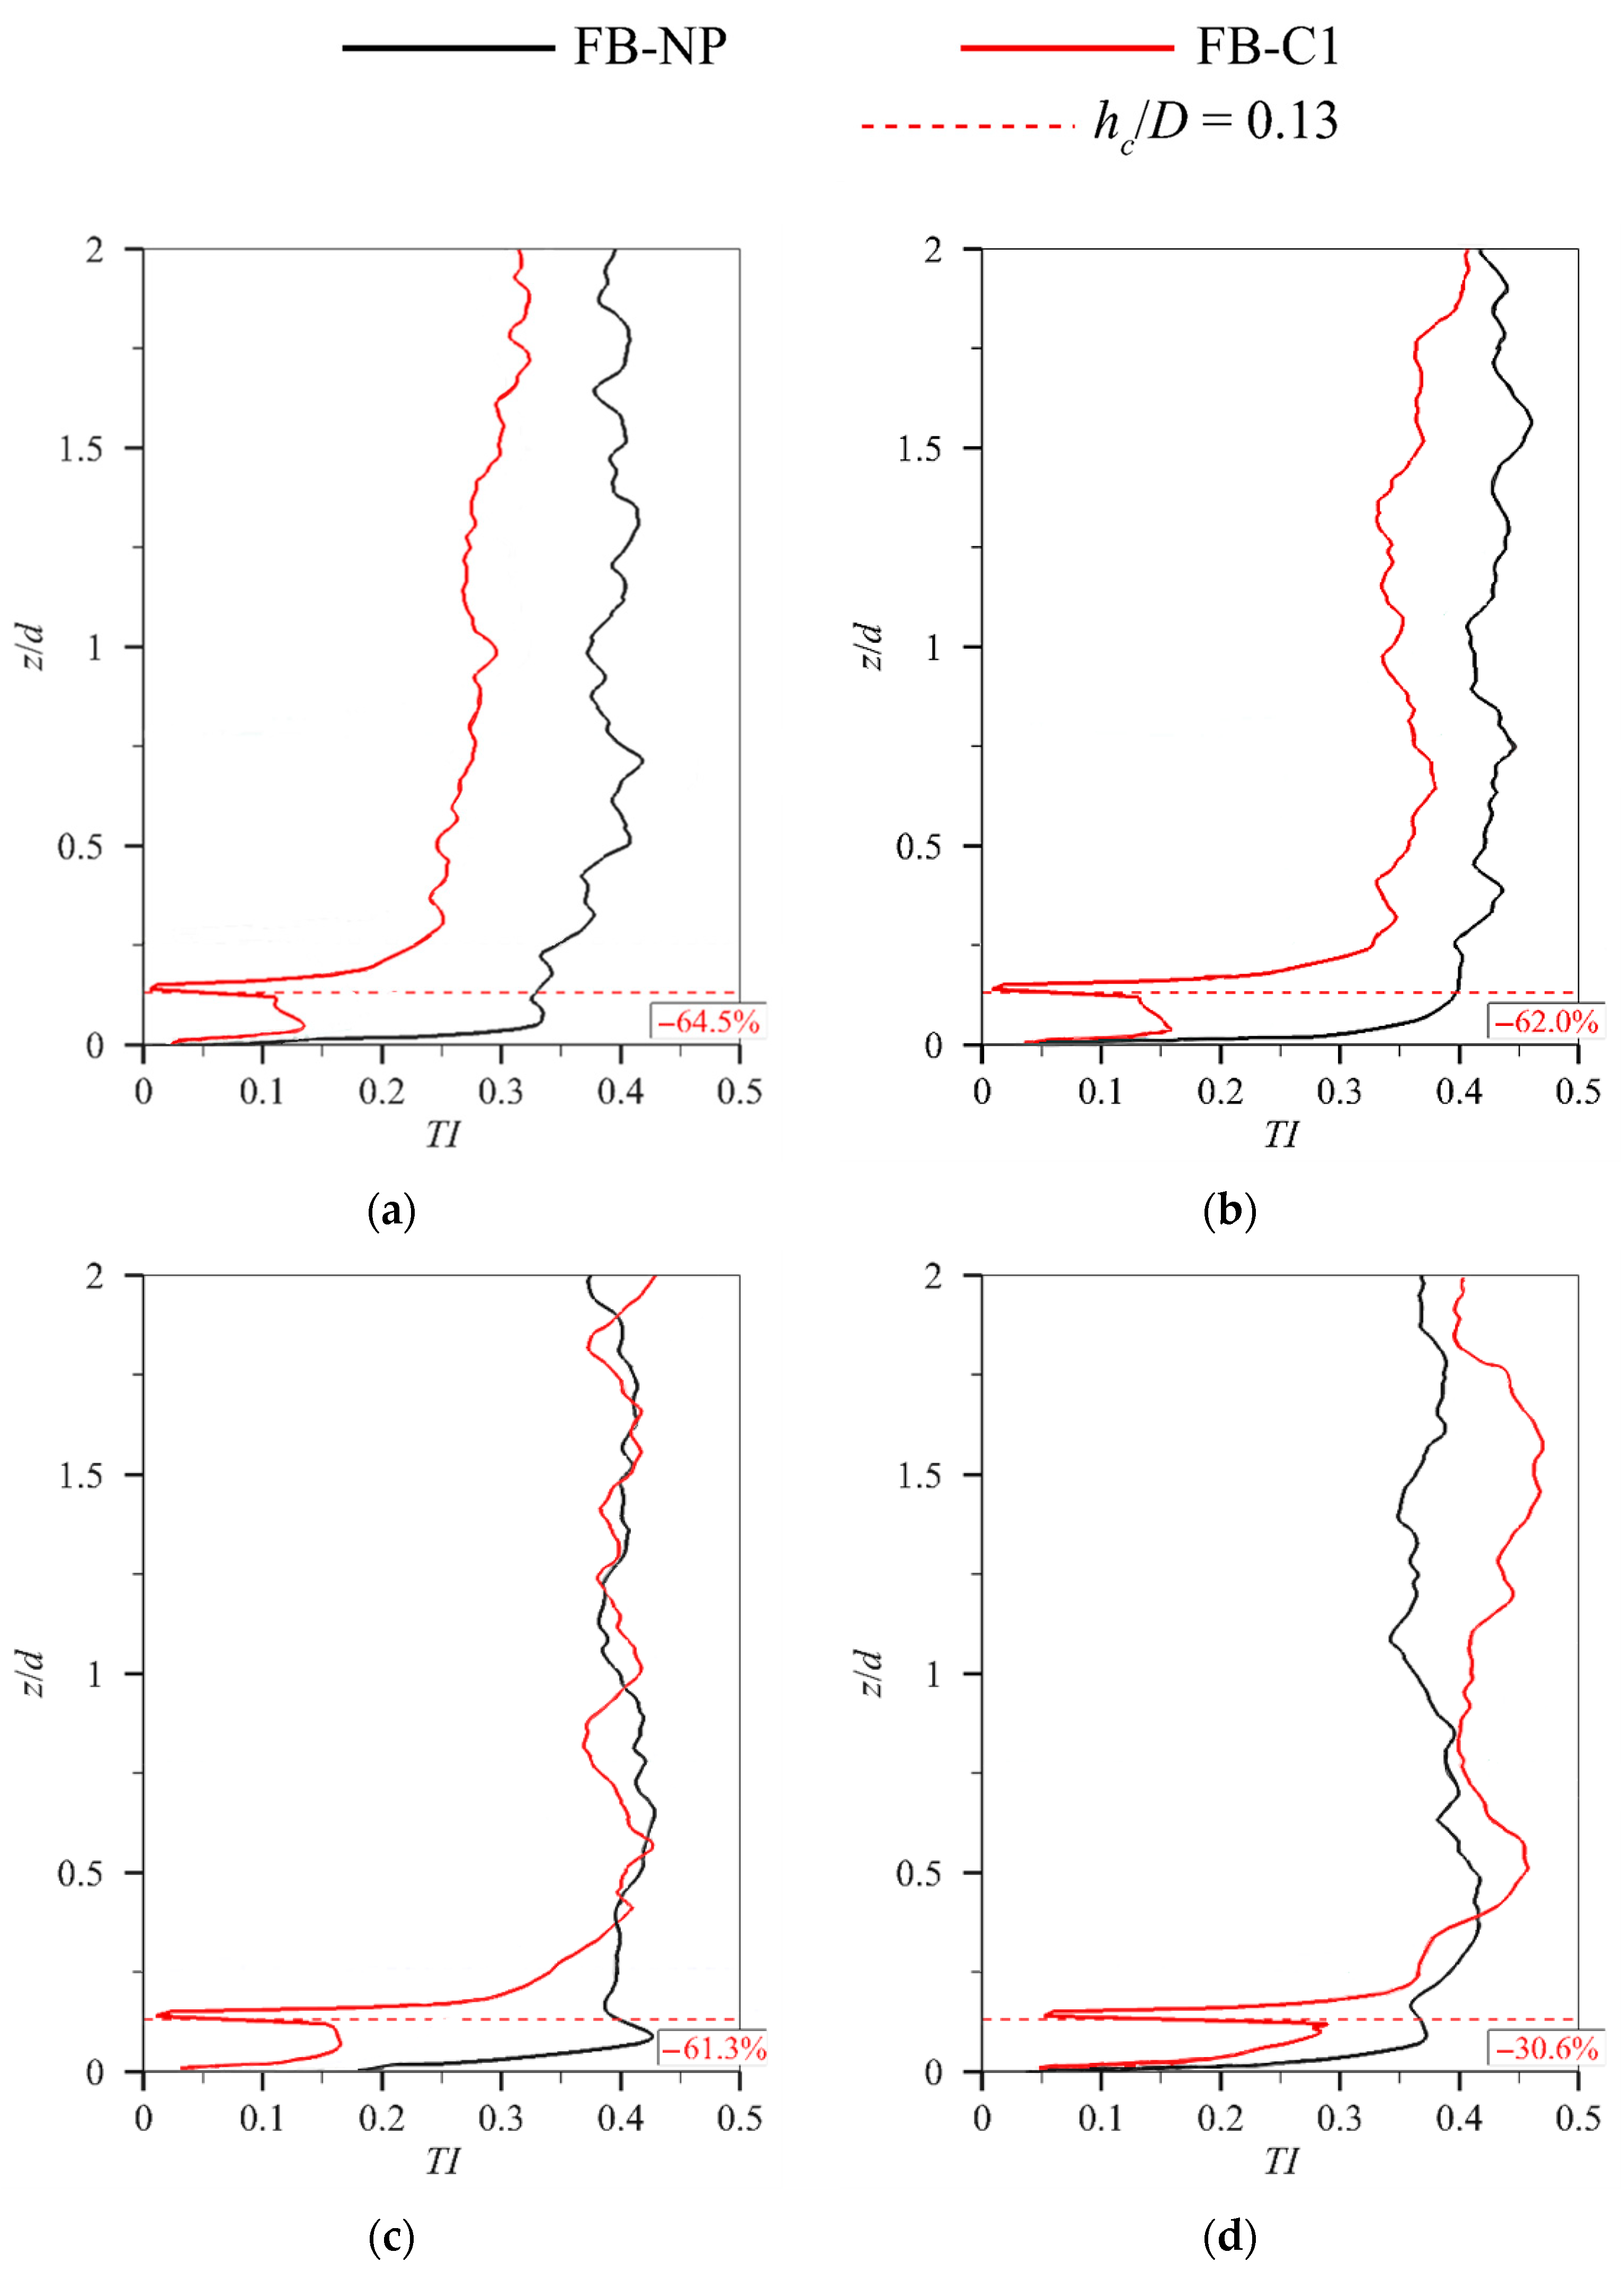
To evaluate the suppression effect of the collar, turbulence intensity distributions were compared at four vertical sections downstream of the pile (x/d = 0.75, 1.0, 1.25, and 1.5), as also shown in Figure 13, where the black curves represent the unprotected condition and the red curves represent the case with the collar flush with the bed; each curve shows the TI distribution at various cross-sections and elevations. The horizontal dashed line marks the collar installation height. By averaging turbulence intensity below the collar and comparing it with the unprotected regions, the reduction rate was quantified. Results show that at 0.75D downstream, the collar reduced turbulence intensity beneath it by 64.5%. This effect diminished with distance yet still provided a 14% reduction at 1.5D. These findings confirm that the collar substantially weakens turbulence intensity around the pile, with its influence persisting over a certain downstream extent.
Figure 13. Comparison of turbulence intensity (TI) at different longitudinal positions: (a) x/d = 0.75, (b) x/d = 1, (c) x/d = 1.25, (d) x/d = 1.5.

3.3.2. Distribution of Turbulence Intensity Under Scour Equilibrium Conditions

Figure 14 shows the turbulence intensity distributions in the longitudinal section (y/d = 0) and transverse section (x/d = 0) of the monopile under different conditions at equilibrium scour.
Figure 14. Turbulence intensity distribution at equilibrium scour. TI at y/d = 0 section: (a) ES-NP, (b) ES-C1-V7, (c) ES-C2-V8; TI at x/d = 0 section: (d) ES-NP, (e) ES-C1-V7, (f) ES-C2-V8.
Under unprotected conditions (Figure 14a,d), the turbulence inside the scour hole shows three distinct patterns. In the upstream zone, a clear vortex develops in front of the pile, with turbulence intensity generally between 0.2 and 0.3. In the wake region, turbulence can be divided into two zones: a weak near-bed zone where TI is below 0.3, and a strong zone 1.0D–2.0D above the bed. At x/d = 1.0, the depth-averaged TI over the lower 0.5D drops from 0.39 under flat-bed conditions to 0.23 at equilibrium scour, a 41% reduction that reflects the weakening of near-bed vortices as scour stabilizes. Above the bed, however, turbulence remains strong, reaching up to 0.5 due to the combined effect of upward flow and wake vortices. In the lateral zone (Figure 14d), accelerated side flow and horseshoe vortices keep TI above 0.2, with the most intense turbulence (0.3–0.4) located 0.5D–1.5D from the pile edge.
With collar protection (Figure 14b,e), the scour hole is relatively small, and the turbulence distribution at equilibrium is similar to that under flat-bed conditions. Upstream turbulence is largely suppressed, with intensity near zero across most of the region. In the lateral grooves, turbulence intensity is much lower than in the unprotected case, with a maximum of only 0.17. In contrast, turbulence in the wake remains high, generally exceeding 0.4, and is mainly concentrated within 0.5D–2.5D downstream of the pile.
When the inflow velocity further increases (Figure 14c,f), the protective effect of the collar is significantly weakened, and large-scale scour holes develop both in front of and beside the pile. Compared with the lower-inflow case, turbulence intensity in these regions is notably higher: the maximum upstream turbulence increases to 0.25, while the lateral turbulence rises from 0.17 to 0.44, representing a 159% increase. In contrast, turbulence intensity in the wake decreases markedly, with values around the collar generally below 0.2.

4. Conclusions

This study employed large-eddy simulation (LES) to investigate the flow characteristics around a monopile foundation with collar protection. By comparing flow velocity, vortex structures, and turbulence distributions under flat-bed and equilibrium scour conditions, the following conclusions are drawn:
  • The flat-bed results indicate that, compared with the unprotected case, the collar strongly suppresses flow beneath it, delaying scour initiation, inhibiting horseshoe vortices, and reducing turbulence. In this study, we further found that the suppression is stronger in the vertical direction than in the streamwise direction.
  • When a scour pit forms, we conclude from our analysis that the collar functions through two mechanisms: flow suppression, which reduces flow intensity, and bed shielding, which isolates the bed from disturbance. Both effects weaken with increasing inflow velocity. Our results show that the collar markedly reduces pile-front acceleration and prevents downflow, while its partitioning effect also moderates pile-side flow, maintaining relatively stable velocities beneath the collar.
  • Vortex analysis shows that, without protection, the scour pit contains a complex vortex system. This study finds that under collar protection, an energy-dissipating vortex forms beneath the collar, rotating opposite to the main vortex. It dissipates local kinetic energy, weakens the main vortex, and simplifies near-bed vortex structures, representing a primary mechanism for scour mitigation. As inflow velocity increases, both scour depth and the energy-dissipating vortex expand. These observations address features that are difficult to capture in physical model experiments.
  • Finally, our results indicate that under collar protection, turbulence at the pile front and sides is substantially reduced, while the wake is relatively unaffected. As inflow velocity increases, the pile sides become the most turbulence-prone region; a 14% increase in inflow velocity leads to a 159% rise in turbulence intensity, highlighting that scour along the pile sides should be a primary focus when employing collar protection.
This study used large-eddy simulation to compute flow field characteristics. The method is computationally intensive and time-consuming, so alternative numerical approaches may be considered in the future. Moreover, only the effect of collar installation was analyzed; the influence of collar height on the flow field around the pile will be investigated in future work.

Author Contributions

Conceptualization, L.W.; methodology, D.G.; software, H.M.; validation, H.S. and L.Y.; resources, L.W.; data curation, X.Z.; writing—original draft preparation, L.W.; writing—review and editing, D.C. and D.G.; visualization, X.Z.; supervision, D.C. and D.G.; funding acquisition, H.S. and L.Y. All authors have read and agreed to the published version of the manuscript.

Funding

This research was funded by the project “Research on Scour Protection Technology for Monopile Foundations in Complex Marine Conditions at Jiangsu Guoxin Rudong Offshore Wind Farm” (Grant No. JSXN-H-2024-012).

Data Availability Statement

Access to the data will be considered by the authors upon request.

Conflicts of Interest

Authors Lei Wu, Haifei Sun, and Lingfei Yu are employed by Jiangsu Xinneng Haili Offshore Wind Power Generation Co., Ltd. The rest of the authors declare no conflicts of interest.

References

  1. Ben, B.; Emerson, C.; Ladwa, R.; Mullin, S.; Jayasurya, F.; Hutchinson, M.; Qiao, L.; Williams, R.; Han, W.; Liang, W.; et al. Global Wind Report 2025; Global Wind Energy Council: Brussels, Belgium, 2025. [Google Scholar]
  2. Zhang, B.M.; Shen, D.C.; Wei, J.M. Current status and development plan of wind energy utilization in China. Agric. Mach. 2001, 15–17. [Google Scholar]
  3. Yao, Z.; Melville, B.; Shamseldin, A.Y.; Wang, R.; Guan, D. New insights into local scour characteristics around vibrating monopiles under combined wave-current conditions. Ocean Eng. 2025, 315, 119812. [Google Scholar] [CrossRef]
  4. Guan, D.W.; Xie, Y.X.; Chiew, Y.M.; Ding, F.; Ferradosa, T.F.; Hong, J. Estimation of local scour around monopile foundations for offshore structures using machine learning models. Ocean Eng. 2024, 296, 116951. [Google Scholar] [CrossRef]
  5. Tang, Z.; Melville, B.; Singhal, N.; Shamseldin, A.; Zheng, J.H.; Guan, D.W.; Cheng, L. Countermeasures for local scour at offshore wind turbine monopile foundations: A review. Water Sci. Eng. 2022, 15, 15–28. [Google Scholar] [CrossRef]
  6. Tu, X.Y.; Wu, T.S.; Chen, R.L.; Wu, M.W. Application of riprap method in pier scour protection engineering. Guangdong Water Resour. Hydropower 2010, 2, 1–4. [Google Scholar]
  7. Bi, M.J.; Liu, J.C.; Su, R.; Wang, H.; Liu, S. Experimental study on scour characteristics and protective measures of monopile foundations on sandy coasts. South. Energy Constr. 2020, 7, 103–111. [Google Scholar]
  8. Cong, M.; Chen, L.Z.; Chen, B. Analysis of strength development in soft clay stabilized with cement-based stabilizer. Constr. Build. Mater. 2014, 71, 354–362. [Google Scholar] [CrossRef]
  9. Meng, H.; Guan, D.; Cheng, L.; Zhang, X.; Xu, Z.; Wei, C. Effect of seawater curing on the mechanical properties of solidified high-water content marine dredged clay. Constr. Build. Mater. 2025, 463, 140111. [Google Scholar] [CrossRef]
  10. Parker, G.; Toro-Escobar, C.; Voigt, R.L. Countermeasures to Protect Bridge Piers from Scour; St. Anthony Falls Laboratory: Minneapolis, MN, USA, 1998. [Google Scholar]
  11. Ma, C.; Sheng, C.; Lian, J.; Liu, F. Solidification sludge as a scour countermeasure in ocean engineering. Ocean Eng. 2022, 244, 110423. [Google Scholar] [CrossRef]
  12. Ahenkorah, I.; Rahman, M.M.; Karim, M.R.; Beecham, S. Enzyme induced calcium carbonate precipitation and its engineering application: A systematic review and meta-analysis. Constr. Build. Mater. 2021, 308, 125000. [Google Scholar] [CrossRef]
  13. Li, H.; Barkdoll, B.; Kuhnle, R. Bridge abutment collar as a scour countermeasure. In Proceedings of the World Water and Environmental Resources Congress, Anchorage, AK, USA, 15–19 May 2005. [Google Scholar]
  14. Melville, B.W.; Hadfield, A.C. Use of sacrificial piles as pier scour countermeasures. J. Hydraul. Eng. 1999, 125, 1221–1224. [Google Scholar] [CrossRef]
  15. Obied, N.A.; Khassaf, S.I. Experimental study for protection of piers against local scour using slots. Int. J. Eng. 2019, 32, 217–222. [Google Scholar] [CrossRef]
  16. Chow, K.H.; Ooi, S.K. Scour Protection Around a Bridge Pier. Ph.D. Thesis, Nanyang Technological University, Singapore, 1997. [Google Scholar]
  17. Hamidifar, H.; Nasrabadi, M.; Omid, M.H. Using a bed sill as a scour countermeasure downstream of an apron. Ain Shams Eng. J. 2018, 9, 1663–1669. [Google Scholar] [CrossRef]
  18. Chen, S.C.; Tfwala, S.; Wu, T.Y.; Chan, H.C.; Chou, H.T. A hooked-collar for bridge piers protection: Flow fields and scour. Water 2018, 10, 1251. [Google Scholar] [CrossRef]
  19. Pandey, M.; Azamathulla, H.M.; Chaudhuri, S.; Pu, J.H.; Pourshahbaz, H. Reduction of time-dependent scour around piers using collars. Ocean Eng. 2020, 213, 107632. [Google Scholar] [CrossRef]
  20. Alabi, P. Time Development of Local Scour at a Bridge Pier Fitted with a Collar. Master’s Thesis, University of Saskatchewan, Saskatoon, SK, Canada, 2006. [Google Scholar]
  21. Kumar, V.; Raju, K.G.R.; Vittal, N. Reduction of local scour around bridge piers using slots and collars. J. Hydraul. Eng. 1999, 125, 1302–1305. [Google Scholar] [CrossRef]
  22. Zhang, Z.S.; Cui, G.X.; Xu, C.X. Theory and Application of Large Eddy Simulation of Turbulence; Tsinghua University Press: Beijing, China, 2008. [Google Scholar]
  23. Smagorinsky, J. General circulation experiments with the primitive equations: I. Basic Exp. Mon. Weather Rev. 1963, 91, 99–164. [Google Scholar] [CrossRef]
  24. Iqbal, S.; Haider, R.; Pasha, G.A.; Zhao, L.; Abbas, F.M.; Anjum, N.; Murtaza, N.; Abbas, Z. Numerical investigation of flow around partially and fully vegetated submerged spur dike. Water 2025, 17, 435. [Google Scholar] [CrossRef]
  25. Sarker, M.A. Flow measurement around scoured bridge piers using Acoustic-Doppler Velocimeter (ADV). Flow Meas. Instrum. 1998, 9, 217–227. [Google Scholar]
  26. Roulund, A.; Sumer, B.M.; Fredsøe, J.; Michelsen, J. Numerical and experimental investigation of flow and scour around a circular pile. J. Fluid Mech. 2005, 534, 351–401. [Google Scholar] [CrossRef]
  27. Sturm, T.W.; Ettema, R.; Melville, B.W. Evaluation of Bridge-Scour Research: Abutment and Contraction Scour Processes and Prediction; The National Academies Press: Washington, DC, USA, 2011. [Google Scholar]
  28. Fredsøe, J.; Sumer, B.M. The Mechanics of Scour in the Marine Environment; World Scientific Publishing Company: Singapore, 2002. [Google Scholar]
  29. Kothyari, U.C.; Garde, R.J.; Ranga Raju, K.G. Temporal variation of scour around circular bridge piers. J. Hydraul. Eng. 1992, 118, 1091–1106. [Google Scholar] [CrossRef]
  30. Ghaderi, A.; Saeed, A. CFD simulation of local scouring around airfoil-shaped bridge piers with and without collar. Sādhanā 2019, 44, 216. [Google Scholar] [CrossRef]
  31. Gupta, L.K.; Pandey, M.; Anand Raj, P. Numerical simulation of local scour around the pier with and without airfoil collar (AFC) using FLOW-3D. Environ. Fluid Mech. 2024, 24, 631–649. [Google Scholar] [CrossRef]
  32. Guan, D.; Chiew, Y.-M.; Wei, M.; Hsieh, S.C. Characterization of horseshoe vortex in a developing scour hole at a cylindrical bridge pier. Int. J. Sediment Res. 2019, 34, 118–124. [Google Scholar] [CrossRef]
  33. Harasti, A.; Gilja, G.; Potočki, K.; Lacko, M. Scour at bridge piers protected by the riprap sloping structure: A review. Water 2021, 13, 3606. [Google Scholar] [CrossRef]
Disclaimer/Publisher’s Note: The statements, opinions and data contained in all publications are solely those of the individual author(s) and contributor(s) and not of MDPI and/or the editor(s). MDPI and/or the editor(s) disclaim responsibility for any injury to people or property resulting from any ideas, methods, instructions or products referred to in the content.

Article Metrics

Citations

Article Access Statistics

Multiple requests from the same IP address are counted as one view.