Abstract
In response to the challenges of metal corrosion detection and anti-corrosion coating performance evaluation in the marine environment of Zhoushan, this study proposes an improved object detection model, YOLO v5-EfficientViT-NWD-CCA, to enhance the recognition accuracy and detection efficiency of corrosion images on marine structures. Based on YOLO v5, the model incorporates the EfficientViT backbone network, NWD (Normalized Wasserstein Distance) loss function, and CCA (Criss-Cross Attention) attention mechanism, outperforming comparative models across multiple key metrics. Experimental results show that the proposed model increases precision from 0.73 to 0.76 (approximately 4% improvement) and raises the True Positive rate from 0.66 to 0.70 (approximately 6% improvement) according to the confusion matrix, demonstrating more stable overall detection performance. Building on this, the study combines the model’s detection results to conduct a quantitative analysis of the corrosion area of eight types of anti-corrosion coatings in two typical marine environments—tidal zones and fully immersed zones—across different exposure periods (24, 60, and 96 months). The results indicate that the tidal zone presents a harsher corrosion environment, with corrosion severity significantly increasing over time. Fusion-bonded epoxy coatings, powder epoxy coatings, and fluorocarbon coatings exhibit good corrosion resistance, whereas chlorinated rubber coatings and conventional epoxy coatings perform poorly. This study not only achieves intelligent identification and precise quantification of corrosion areas but also provides a scientific basis for the selection and evaluation of anti-corrosion coatings in different marine environments.
1. Introduction
At present, infrastructure development in China’s coastal regions is steadily advancing, bringing significant benefits in terms of the economy, transportation, and resource exploitation. However, the unique water quality characteristics of coastal environments—high salinity, high humidity, abundant oxygen, temperature fluctuations, and microbial attachment, serious challenges to the durability and stability of infrastructure [1]. Corrosion has emerged as a critical threat to the maintenance and safety of coastal structures, severely impacting their service life, maintenance costs, and operational safety [1,2]. In light of these issues, technologies for corrosion identification, detection, and protection of marine and coastal engineering infrastructure have become a major focus of research in this field [3].
To address these corrosion issues, researchers have employed various methods such as electrochemical testing [4], ultrasonic testing [5], radiographic inspection [6], and sensor-based monitoring networks [7] for real-time monitoring and prediction to enable timely prevention of damage. Although traditional detection techniques have achieved certain results, they remain constrained by limitations in detection accuracy, equipment complexity, and real-time performance [8]. With the advancement of artificial intelligence, corrosion detection methods based on image recognition technology have emerged to compensate for the shortcomings of traditional techniques, offering advantages such as non-contact inspection and automated analysis [9]. Conventional image recognition methods, including edge detection [10], image threshold segmentation [11], morphological analysis [12], and texture and color feature analysis [13], are capable of identifying corrosion areas and performing quantitative evaluation. However, when dealing with complex backgrounds and multi-scale targets, factors such as image quality and environmental conditions continue to pose challenges to the accuracy and robustness of these methods [14].
With the rapid advancement of deep learning technologies, the YOLO (You Only Look Once) series of object detection models has emerged. These models adopt an end-to-end training approach, performing object detection directly on raw images. This effectively eliminates the need for the complex pre-processing and post-processing steps inherent in traditional detection workflows, greatly simplifying system architecture design and implementation processes while significantly improving detection efficiency [15]. Through years of evolution, the YOLO series has progressed from YOLOv1 to YOLOv12 [16]. Among them, YOLOv5 remains highly favored and widely recognized in both industry and academia due to its unique advantages. After extensive testing and iterative optimization, YOLOv5 has developed into a mature and stable codebase and architectural system, offering outstanding flexibility for deployment and ease of debugging [17]. Its lightweight design greatly reduces the number of parameters and significantly lowers computational complexity. Compared with some of its successors, YOLOv5 demonstrates superior training and inference speeds, making it particularly suitable for real-time detection tasks in resource-constrained environments [18]. Furthermore, YOLOv5 is known for its clear structure and high degree of modularity, providing researchers with the convenience to flexibly adjust and customize it for various application scenarios [19]. Although YOLOv5 has certain limitations, a series of improvements targeting its Backbone [20,21,22,23,24,25,26], Neck [27,28,29,30], Head [31,32,33,34], and loss functions [35,36,37,38,39,40,41,42,43] have significantly enhanced its performance across key metrics such as detection accuracy, speed, and adaptability. These advancements enable YOLOv5 to be effectively deployed in complex application scenarios such as real-time video analysis and autonomous driving. For instance, to enhance the extraction of small object features without increasing model complexity, researchers have introduced lightweight convolutional modules like GhostNet [21], ShuffleNet [22], and MobileNet [23] into YOLOv5’s Backbone. This makes the Backbone more efficient, thereby improving real-time performance while ensuring fine-grained features are captured during small object detection. Similarly, to improve detection performance under low-light conditions, researchers have enhanced YOLOv5’s Neck component by integrating image enhancement techniques and adaptive threshold segmentation [30]. Combined with multi-scale feature fusion and attention mechanisms, these improvements further optimize the detection of small targets in drone aerial imagery [31]. In terms of enhancing YOLOv5’s Head component, some researchers have incorporated spatial attention modules such as CBAM to detect corrosion on metal surfaces [33]. This module aggregates channel and spatial attention information through the addition of global average pooling and global max pooling layers. Regarding loss function improvements, various strategies have been proposed, including adaptive loss functions [36,37], weighted loss functions [38,39,40], and multi-task learning loss functions [41,42,43], all aimed at further enhancing the model’s performance in small object detection and generalization.
Although numerous studies and applications have sought to improve YOLOv5, limitations persist in terms of accuracy, speed, complexity, and generalization capability. While existing enhanced models have reduced computational load through optimizations such as the SPP (Spatial Pyramid Pooling) module and lightweight Neck designs, they still face issues of parameter redundancy. This is particularly challenging when dealing with the complex and diverse characteristics of marine infrastructure corrosion, which includes forms such as pitting and uniform corrosion. These varied corrosion patterns pose significant challenges for rapid and accurate feature detection. In light of this, conducting in-depth research on the traditional YOLOv5 model using specific corrosion datasets and exploring the effectiveness of various improvements for metal corrosion detection is of particular importance.
The YOLO series of models has proven highly effective in addressing challenges commonly found in corrosion imagery, such as irregular target shapes and significant variations in scale. These models demonstrate broad application potential and have achieved notable progress in the field of metal corrosion assessment. In terms of corrosion area identification and quantitative evaluation, YOLO-based models have been widely adopted to build intelligent analysis systems. For example, a YOLOv10-based sequential architecture integrates MobileViTv3 blocks and a classification network to achieve dual functions of corrosion detection and grading, resulting in a 1% improvement in F1 score and an 8.8% increase in classification accuracy [44]. In terms of technical optimization, researchers have further enhanced model performance through the incorporation of attention mechanisms and multimodal data fusion techniques. For instance, the dual attention network DAMCN (Dual Attention Metallic Corrosion Network) enhances feature extraction for corrosion under complex environments by embedding the CBAM (Convolutional Block Attention) module [45]. The CAMCD (Channel Attention based Metallic Corrosion Detection) method, based on channel attention, utilizes SE (Squeeze-and-Excitation) blocks to weight features, enabling more precise recognition of varying corrosion levels [46]. Additionally, the MCD-Net model, which combines convolutional and Transformer architectures, achieved an F1 score of 84.53% on public datasets, demonstrating strong robustness against shadows and noise [47]. In recent years, the application scope of YOLO technology has expanded from single-task detection to multi-scenario comprehensive evaluation. For example, Chliveros et al. [48] integrated deep convolutional neural networks with Eigen-tree decomposition structures to achieve pixel-level segmentation of marine vessel anti-corrosion coatings. Bertolini et al. [49] combined electrochemical testing with material characterization to provide scientific support for corrosion rehabilitation of historical building reinforcements. In the field of bridge health monitoring, Zhang et al. [50] developed an automated rebar extraction method based on ground-penetrating radar data, significantly improving the efficiency of corrosion area localization. Moreover, a corrosion grading model based on Stress-Magnetic Flux Leakage (SMFL) technology further revealed the coupling relationship between load and corrosion [51]. Additionally, the Faster RSTRENG algorithm proposed by Yan et al. [52] improved the efficiency of pipeline corrosion defect assessment, offering a practical and efficient tool for engineering applications.
Although YOLO-based models have demonstrated strong performance in corrosion detection, challenges such as the lack of standardized data annotation and limited adaptability to complex environments still hinder the accuracy and generalization of corrosion severity quantification. As a result, YOLO-based approaches for quantitative evaluation of corrosion levels often suffer from insufficient precision and robustness. To address these issues, further optimization of model architecture and the development of corrosion severity quantification methods based on detection results are required. Therefore, this study aims to enhance the accuracy and practicality of corrosion severity assessment by improving the feature extraction capabilities and environmental adaptability of the YOLO algorithm, while integrating a more refined corrosion grading annotation strategy.
In selecting the baseline detection model for this study, several representative approaches were considered. Faster R-CNN, as a typical two-stage detector, can achieve high precision via a region proposal network (RPN), and previous studies—such as window state detection combined with traditional augmentation—have shown its stable performance. However, the additional proposal generation and classification steps during inference lead to slower processing and higher latency, making it less suitable for corrosion detection tasks that require real-time or near-real-time performance [53]. YOLOv10, incorporating Transformer architecture, offers stronger feature representation and has demonstrated excellent performance in tasks such as automated non-PPE detection on construction sites [54]. Nevertheless, its complex structure, large parameter count, and high computational demand require more robust hardware and larger datasets. For the relatively small and homogeneous corrosion dataset used in this study, YOLOv10’s advantages cannot be fully leveraged, while training and inference costs would increase [55]. In contrast, YOLOv5 achieves a favorable balance between accuracy and speed, featuring a lightweight design, fast inference, and low hardware dependency, which allows high detection accuracy with significantly improved efficiency. Its well-established community support, including diverse data augmentation strategies, hyperparameter configuration, and transfer learning capabilities, further facilitates rapid experimentation and iteration [56]. Thus, YOLOv5 was selected as a representative baseline in this work due to its academic and industrial relevance. Its selection aligns with the scale and characteristics of the dataset and offers a sound reference point for subsequent model improvements and comparative studies.
2. Materials and Methods
This study utilizes test data from scrapped specimens at the Zhoushan Seawater Station and employs data processing techniques to construct a corrosion-labeled image dataset for various metal anti-corrosion coatings. Building upon the traditional YOLOv5 model, an improved image recognition method (YOLOv5-EfficientViT-NWD-CCA) is proposed, with its performance validated through ablation and comparative experiments. The primary focus of this work is on corrosion detection, and the reported evaluation metrics are mainly used to assess the performance of the proposed detection method. Based on the model’s detection results, segmentation techniques are further incorporated in Section 2.3 to quantify the corroded area, thereby enabling an assessment of corrosion severity across different coating types. This step represents a supplementary contribution to the study, highlighting the feasibility of extending vision-based detection results toward corrosion quantification. As the emphasis of the study lies in detection, the segmentation step relies on existing methods and is not evaluated in detail in terms of segmentation performance. This provides valuable data support for selecting anti-corrosion coatings in marine and coastal environments. Figure 1 illustrates the overall research framework of this study.
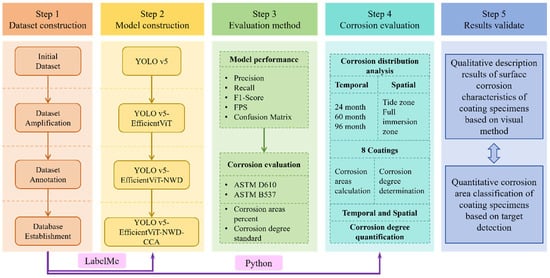
Figure 1.
Basic framework of the study.
2.1. Data
2.1.1. Dataset Collection
The dataset used in this study originates from the Zhoushan seawater station’s real marine exposure test images, compiled by the China National Materials Corrosion and Protection Data Center. The Zhoushan station is located in Luotou, Dinghai District, Zhoushan City, Zhejiang Province, characterized by specific marine conditions such as low salinity, turbidity, high sediment content, and minimal marine organism attachment. The experimental environment for the test data is seawater (East China Sea), with the specimens made of standard Q235 carbon steel substrate (100 mm × 50 mm × 3 mm). The coating types include Powder Epoxy Coating, Epoxy Coating, Chlorinated Rubber, Fluorocarbon Coating, Wuxi Anti-fouling Coating, and Fusion-Bonded Epoxy Coating, covering a total of 6 main categories (10 subcategories) of coatings, as shown in Table 1. The exposure durations are 96, 60, and 24 months, and the specific corrosion environments are the tidal zone and the full immersion zone. It should be noted that coatings No. 9 (Chlorinated Rubber-3) and No. 10 (Wuxi Anti-fouling Coating) in Table 1 only have image data for 24-month tidal zone and 60-month full immersion zone, respectively, with a limited quantity. Therefore, these two coatings were excluded from this study. Only the image data of the first eight coating types were used as the initial dataset for this study, resulting in a total of 125 valid images. Figure 2 shows examples of coated specimens.

Table 1.
Basic information for different coatings.
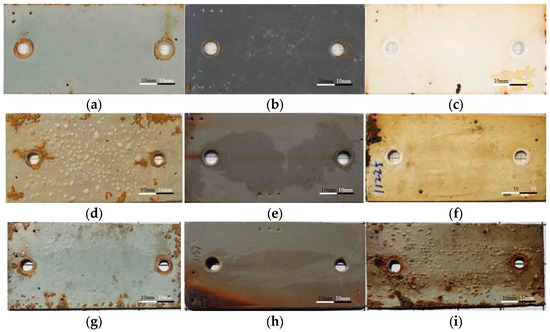
Figure 2.
Sample images in dataset. (a) Epoxy coating-2 (24 months); (b) Powder epoxy (24 months); (c) Fluorocarbon-2 (24 months); (d) Epoxy coating-2 (60 months); (e) Powder epoxy (60 months); (f) Fluorocarbon coating-2 (60 months); (g) Epoxy coating-1 (96 months); (h) Fusion-bonded epoxy (96 months); (i) Chlorinated rubber-1 (96 months).
2.1.2. Dataset Augmentation and Image Annotation
Due to the absence of detailed acquisition parameters such as camera-to-sample distance, lens specifications, and cropping steps in the dataset, all specimen images were standardized to a fixed pixel size (height = 400 pixels, width = 800 pixels) based on the dimensions of the standard specimens. This unification facilitated subsequent extraction of corroded regions at the pixel level using segmentation masks and enabled the calculation of relative corrosion area with respect to the total specimen area. Prior to data augmentation, the original dataset was carefully screened to remove unsuitable samples due to limitations in the initial images, resulting in 125 original images with approximately 15 images per coating category to ensure class balance. In addition,, this study employed 11 data augmentation techniques, including rotation (angle = 90/180/270), scaling (scale = 1.5), horizontal flipping (flipCode = 1), vertical flipping (flipCode = 0), pixel translation (x = 15, y = 15), brightness adjustment (percentage = 0.9/1.1), Gaussian noise (kernel = (7, 7), sigma = 1.5), and salt-and-pepper noise (percentage = 0.05), to expand the initial dataset, generating a total of 1500 images. However, some of the augmented images exhibited abnormalities, such as corrosion areas located at image edges or corrosion features disappearing. These abnormal images were further screened and removed. As a result, 1266 valid images were retained, consisting of 125 original images and 1141 augmented images. Based on this curated dataset, the images were partitioned into training, validation, and test sets with proportions of 70%, 20%, and 10%, respectively, providing a clear basis for model training and performance evaluation. To avoid augmentation leakage, all augmented images generated from the same original image are ensured to remain within the same dataset split. The data augmentation process is illustrated in Figure 3.
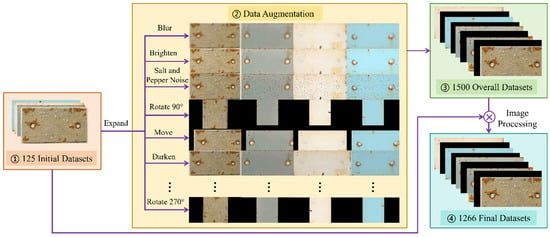
Figure 3.
Data augmentation diagram.
Image annotation is the process of accurately identifying corrosion features within images and assigning corresponding labels, with the goal of constructing a high-quality dataset for machine learning model training. In this study, Labelme (v5.6.1) was used to manually annotate 125 original images, forming the initial sample set. Based on this, the trained model weights were utilized along with a custom Python (v3.8) script to automatically annotate the 1141 augmented images. To mitigate potential errors or biases from auto-labeling, all automatically generated annotations were independently reviewed by three researchers, followed by cross-comparison for consistency. The review indicated that the overall accuracy of auto-labeling exceeded 90%. For those annotations identified as incorrect or inaccurate during manual verification, manual refinements were applied to ensure accuracy and consistency. Ultimately, an annotated dataset comprising 1266 images was established as the foundation for model training. Figure 4 presents typical examples from the annotated dataset.
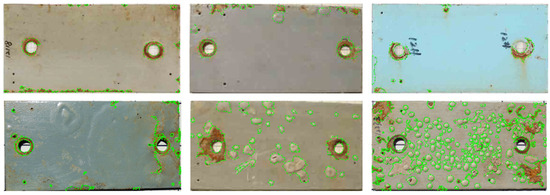
Figure 4.
Examples of annotated image data.
2.2. Improved YOLOv5
In the field of object detection, although the traditional YOLOv5 model is renowned for its efficiency and lightweight design, its reliance on the IoU metric poses certain limitations. Specifically, IoU fails to provide distance information when the predicted and ground truth boxes do not overlap, and it inadequately accounts for aspect ratio and center alignment. To address these shortcomings, subsequent studies introduced the CIoU metric, which incorporates center point distance and aspect ratio consistency. However, CIoU may still underperform when dealing with targets of extreme aspect ratios or in multi-scale detection tasks, particularly in small object detection scenarios. To overcome YOLOv5’s limitations in small object detection, researchers introduced the NWD loss function, which improves matching quality from the perspective of distributional distance. NWD treats the predicted and ground truth boxes as probability distributions and measures their differences using Wasserstein Distance. This approach more comprehensively considers scale and shape characteristics, demonstrating clear advantages in small object detection. Nevertheless, the NWD-YOLOv5 model faces challenges such as high computational complexity and prolonged training times, in addition to requiring a more sophisticated model structure. To optimize the model architecture, this study focuses on enhancements to the Backbone and Head modules. Based on NWD-YOLOv5, EfficientViT is introduced, forming the EfficientViT-NWD-YOLOv5 model. EfficientViT integrates multi-scale linear attention mechanisms with deep convolutional layers, effectively capturing both local and global information in high-resolution images. This enhances feature extraction efficiency and quality, improving the model’s sensitivity to small targets and complex environments. For more detailed computational principles behind YOLOv5, YOLOv5-EfficientViT, and YOLOv5-EfficientViT-NWD, readers are referred to the research team’s previous publications [57].
Although the multi-scale linear attention mechanism introduced in the EfficientViT-NWD-YOLOv5 model performs well in extracting image details and multi-scale corrosion features, its modeling capacity remains primarily focused on local regions. Consequently, its ability to capture long-range dependencies between corrosion targets and the background is relatively limited. To further enhance the model’s global perception capability, this study incorporates CCA mechanism into the EfficientViT-NWD-YOLOv5 architecture, resulting in the improved YOLOv5-EfficientViT-NWD-CCA model. The CCA module utilizes sparse yet structured attention pathways to effectively supplement the model’s capacity for global context modeling, thereby supporting more accurate identification and localization of corrosion regions. The underlying principles and implementation details of this approach will be elaborated upon in the following sections. Figure 5 illustrates the basic framework of the YOLOv5-EfficientViT-NWD-CCA model.
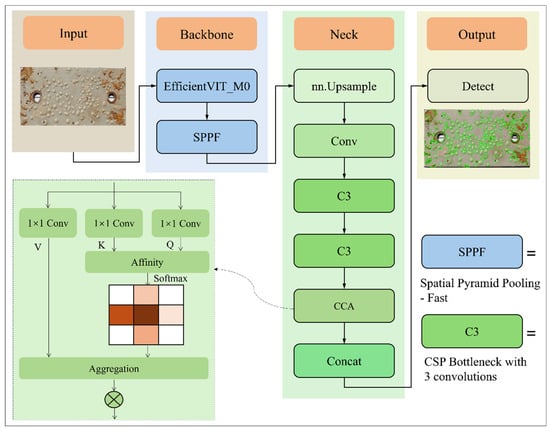
Figure 5.
Architecture of YOLO v5-efficientViT-NWD-CCA.
CCA module is designed to achieve efficient context modeling through sparse connections. Unlike traditional Non-local Attention, the CCA module establishes attention connections only along the “criss-cross paths” of each pixel—specifically, within the same row and column. This approach significantly reduces computational and memory overhead while still effectively capturing long-range dependencies [58].
Given an input feature map , where , and denote the number of channels, height, and width, respectively, the main steps of the CCA module are as follows:
(1) Query and Key feature extraction. To capture contextual dependencies, two parallel 1 × 1 convolutions are applied to input feature map to produce the query and key feature maps:
where is the reduced channel dimension used to decrease computational overhead.
(2) Attention correlation computation. For each spatial position , its corresponding query vector is extracted from . A set of contextual key vectors shown in Equation (2) is constructed from K, where each lies along the same row or column as but excludes the position itself. The total number of such contextual positions is :
The attention correlation score between and the i-th contextual position is computed as Equation (3):
To obtain the normalized attention weights, a Softmax operation is applied over the set :
Here, denotes the attention weight, measuring how much attention position pays to context location .
(3) Value feature aggregation and output computation. Another 1 × 1 convolution is applied to the input H to obtain the value feature map . Corresponding to each , a set of contextual value vectors shown in Equation (5) is collected along the same row and column (excluding μ):
The output feature vector at location μ, denoted , is computed via weighted summation followed by a residual connection:
where is the original input feature at location μ. The output preserves spatial dimensions and channel count while embedding criss-cross contextual information.
2.3. Corrosion Area Quantification Method
To achieve quantitative evaluation of corrosion on metal specimens, corrosion targets are first identified using the proposed YOLOv5-EfficientViT-NWD-CCA detection model. Based on the detection results, segmentation masks are then applied to extract the pixels corresponding to the corrosion regions, enabling the calculation of the corrosion area relative to the standard specimen. In these masks, pixel values of 1 indicate corrosion areas, while pixel values of 0 represent non-corroded areas. By counting the total number of pixels with a value of 1 in the mask, the proportion of the corrosion area relative to the entire image can be calculated. This proportion can then be used to estimate the actual corrosion area of the specimen. The steps for corrosion area quantification are outlined as follows.
First, according to Equation (7), calculate the total number of pixels for a single specimen (unit: pixels), where and represent the height and width of the image, respectively.
Next, calculate the pixel proportion of the corrosion area within the entire image, denoted as , as shown in Equation (8), where represents the total number of pixels in the corrosion area.
Finally, by combining the corrosion pixel ratio with the actual area of the specimen , the actual corrosion area can be estimated according to Equation (9).
This method enables the calculation of corrosion areas by combining object detection algorithms with image mask processing. In this study, the primary focus is on corrosion object detection, and the subsequent extraction of corrosion pixels using masks serves as a supplementary step to quantify corrosion area based on the detection results. It was noting that the corrosion masks were manually delineated using the Labelme (v5.6.1) based on the detected corrosion boxes. This allows the automated quantification of corrosion area relative to the standard specimen, providing an efficient and reliable technical means for the quantitative analysis of metal corrosion severity. The specific corrosion area calculation process is illustrated in Figure 6.
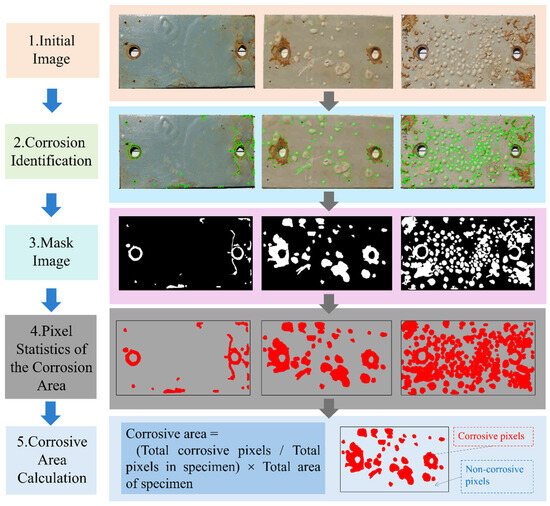
Figure 6.
Flowchart of corrosion area quantification.
2.4. Evaluation Metrics
2.4.1. Evaluation Metrics for Object Detection
In this study, Precision, Recall, F1-Score, FPS (Frames Per Second), and Confusion Matrix are employed as professional evaluation metrics to quantitatively assess the performance of the improved YOLOv5-EfficientViT-NWD-CCA model and its three baseline models in corrosion feature detection tasks. Precision is defined as the proportion of correctly predicted positive samples among all samples predicted as positive by the model. It measures the model’s capability to accurately identify positive instances. A Precision value of 0 indicates that all predicted positive samples are false positives, whereas a Precision of 1 signifies perfect accuracy in predicting positive samples. Higher Precision reflects the model’s ability to minimize false positives, indicating that a larger proportion of samples identified as positive genuinely belong to the positive class. Recall evaluates the model’s performance from a different perspective: it measures the proportion of actual positive samples that are correctly identified and classified by the model. Recall reflects the model’s effectiveness in capturing positive instances. F1-Score serves as the harmonic mean of Precision and Recall, integrating both into a single comprehensive evaluation metric. It provides a quantitative measure of the model’s balanced performance in terms of both Precision and Recall.
In the field of image processing, FPS serves as a key performance metric for evaluating a system’s ability to process continuous input frames, playing a crucial role in assessing the operational efficiency of object detection models. Specifically, FPS accurately reflects the processing speed of corrosion image analysis systems or algorithms when handling sequential image data. Requirements for FPS vary across different application scenarios, directly determining whether an algorithm can meet real-time performance demands. The calculation of FPS involves three core stages: pre-processing time, inference time, and non-maximum suppression (NMS) time. The pre-processing stage refers to the time required for the system to convert raw input data through operations such as format transformation, ensuring compatibility with the model’s input requirements. Shorter pre-processing time enables the system to enter the inference stage more quickly, thereby improving overall FPS performance. The inference stage measures the time taken by the model to perform forward propagation and generate predictions. This phase is critical to the system’s real-time performance; generally, the shorter the inference time, the higher the FPS value, and the stronger the system’s real-time responsiveness. The NMS stage, as a post-processing step, focuses on eliminating redundant and overlapping detection boxes to ensure that each target object corresponds to a single optimal detection box. The time consumed in this stage also impacts the final FPS performance.
In addition, this study incorporates the Confusion Matrix into the model performance evaluation framework. By comparing the model’s predicted results with the ground truth, the confusion matrix categorizes evaluation outcomes into four groups: True Positives (TP), False Positives (FP), True Negatives (TN), and False Negatives (FN). This matrix-based evaluation tool not only provides a comprehensive overview of the model’s prediction accuracy and the distribution of various types of prediction errors but also offers detailed data support and critical insights for analyzing prediction biases and identifying areas for model improvement. Such analysis enables researchers to develop more informed and scientifically grounded optimization strategies, ultimately enhancing the overall performance of the model in corrosion feature detection tasks.
2.4.2. Evaluation Metrics for Corrosion Area Assessment
In the quantitative evaluation of metal corrosion damage, the corrosion area ratio serves as a critical indicator of surface degradation severity. In accordance with the ASTM D610 [59] and ASTM B537 [60] standards, this study categorizes the extent of corrosion on metal surfaces into 11 levels, ranging from no visible corrosion (area < 0.01%) to complete surface corrosion (100%). Each level is assigned a corresponding score from 10 (minimal corrosion) to 0 (severe corrosion), as detailed in Table 2. This scoring system effectively captures the progression of corrosion and provides a standardized basis for assessing material degradation under specific environmental conditions. As the corroded area increases, the assigned score decreases, reflecting a higher degree of damage and a greater potential impact on the structural integrity of the material.

Table 2.
Corrosion performance rating standard.
3. Results
This study focuses primarily on both model performance and the anti-corrosion effectiveness of coatings. A comprehensive evaluation of the detection models is conducted to identify the model with the best performance. The detailed experimental parameters are as follows: the input resolution was set to 640 × 640; both the training and inference batch sizes were set to 8; the number of training epochs was 250; the optimizer used was SGD; the initial learning rate (lr0) and final learning rate (lrf) were both set to 0.01; the confidence threshold (conf-thres) was 0.25; and the IoU threshold (iou-thres) was 0.45. All experiments were conducted in a GPU environment (NVIDIA GeForce GTX 1650, local configuration), and the random seed was fixed at 0 to ensure reproducibility of the results.
3.1. Model Performance Evaluation
This study compares the performance of four models in corrosion feature detection tasks: YOLOv5, YOLOv5-EfficientViT, YOLOv5-EfficientViT-NWD, and YOLOv5-EfficientViT-NWD-CCA. Based on precision testing, all models were observed to converge to stable accuracy levels after 250 training epochs. Therefore, the evaluation is conducted using results obtained at the 250th epoch, focusing on key performance metrics including Precision, Recall, F1-Score, FPS (Pre-processing, Inference, and NMS), and the Confusion Matrix, as summarized in Table 3.

Table 3.
Performance evaluation results of the four models (at 250 epochs).
The results indicate that each model exhibits varying levels of performance across different metrics. Among them, YOLOv5-EfficientViT-NWD-CCA shows noticeable improvement in terms of precision and prediction accuracy, particularly in identifying corrosion features. As shown in Figure 7, a radar chart is used to visualize the performance across various evaluation indicators. For the purpose of consistent comparison, the FPS values were normalized prior to plotting. Overall, YOLOv5-EfficientViT-NWD-CCA achieves the most balanced performance across all metrics. It performs particularly well in the Confusion Matrix and Precision, suggesting that it is capable of maintaining high detection accuracy while effectively minimizing false positives.
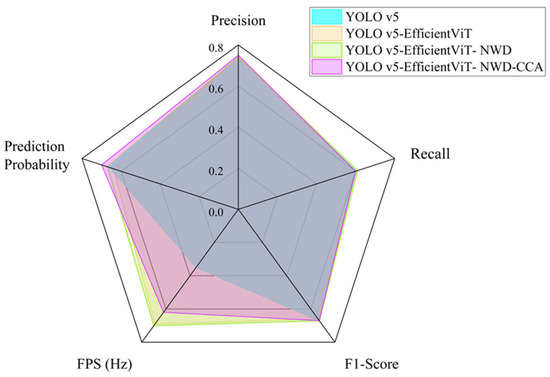
Figure 7.
Performance comparison.
This study further analyzes the time consumption and corresponding FPS of different models across the three key stages: pre-processing, inference, and NMS (as shown in Figure 8). For YOLOv5, the inference time reaches 23.4 ms, with an FPS of only 35 Hz, indicating lower efficiency. After optimization with EfficientViT, YOLOv5-EfficientViT reduces inference time to 9.1 ms and boosts FPS to 69 Hz, demonstrating that the EfficientViT structure significantly improves inference efficiency. With further optimization, YOLOv5-EfficientViT-NWD achieves an inference time of 8.2 ms and an FPS of 70 Hz, showing the substantial contribution of the NWD mechanism. For YOLOv5-EfficientViT-NWD-CCA, inference time increases to 10.3 ms and FPS drops to 62 Hz. Although the introduction of the CCA mechanism enhances accuracy, it also increases computational complexity, leading to slightly longer inference time and reduced FPS.
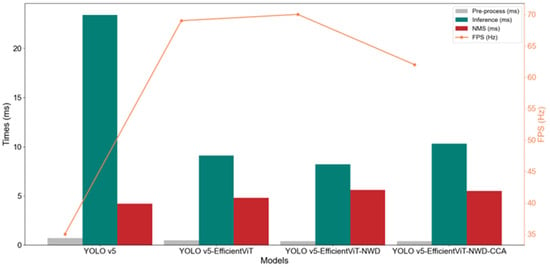
Figure 8.
Comparative analysis of inference speed for the four models.
Figure 9 provides a clear visualization of the confusion matrix analysis results for the four models. It can be observed that all four models achieve a True Negative rate (TNR) of 1.00 for background detection, indicating that background pixels are consistently classified correctly. However, due to the dominance of background pixels, this high TNR does not reflect the models’ ability to detect corrosion features. Therefore, in our analysis of the confusion matrices, we primarily focus on the True Positive rate (TPR) and False Positive rate (FPR) to evaluate the models’ performance in corrosion detection.
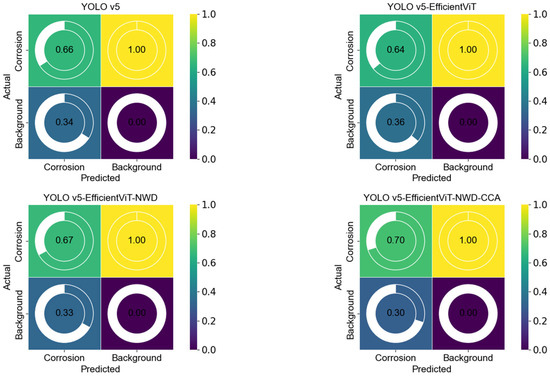
Figure 9.
Confusion matrix results of the four models.
It can be observed that YOLOv5 achieves a TPR of 0.66 for corrosion detection and an FPR of 0.34 for corrosion, indicating a relatively high false detection rate. YOLOv5-EfficientViT improves inference speed, but its TPR for corrosion detection slightly decreases to 0.64, and FPR increases to 0.36, indicating a modest reduction in detection accuracy. After optimization with the NWD mechanism, YOLOv5-EfficientViT-NWD improves the TPR to 0.67 and reduces FPR to 0.33, lowering false positives and enhancing overall detection performance. The YOLOv5-EfficientViT-NWD-CCA model further raises TPR to 0.70 and reduces FPR to 0.30, achieving the best performance among all models. It is evident that the integration of NWD and CCA mechanisms contributes to improved detection of corrosion features and reduced false positives, while background TNR remains high but is not relied upon for evaluating the model’s corrosion detection capability.
3.2. Comparative Analysis of Corrosion Severity for Coated Specimens in Different Corrosive Environments
3.2.1. Comparison of 96-Month Exposure Test Results
Corrosion area serves as a reliable indicator of the corrosion severity of specimens, thereby reflecting the anti-corrosion performance of coatings. To analyze the performance of various coatings under different exposure durations and corrosive environments, this study utilized the aforementioned improved corrosion feature detection model to identify and quantify the corrosion area of each coated specimen. It is worth noting that among the collected data, five types of coatings underwent exposure tests lasting up to 96 months: Epoxy Coating-1, Chlorinated Rubber-1, Chlorinated Rubber-2, Fluorocarbon Coating-1, and Fusion-Bonded Epoxy Coating. Figure 10 presents the distribution of corrosion areas on unit specimens for these five coatings after 96 months of exposure in tidal zone (TZ) and full immersion zone (FIZ) environments. The Y-axis represents the relative frequency density of corrosion areas, where the total area under each curve is normalized to 1. This means that the curve height at a given interval reflects the relative probability of corrosion areas occurring within that range, rather than the absolute number or percentage of corrosion spots. This helps maintain comparability and reproducibility across datasets of different scales. Furthermore, since Figure 10, Figure 11, Figure 12, Figure 13, Figure 14, Figure 15, Figure 16, Figure 17 and Figure 18 share identical definitions for both the X- and Y-axes, Figure 11, Figure 12, Figure 13, Figure 14, Figure 15, Figure 16, Figure 17 and Figure 18 follow the same interpretation.
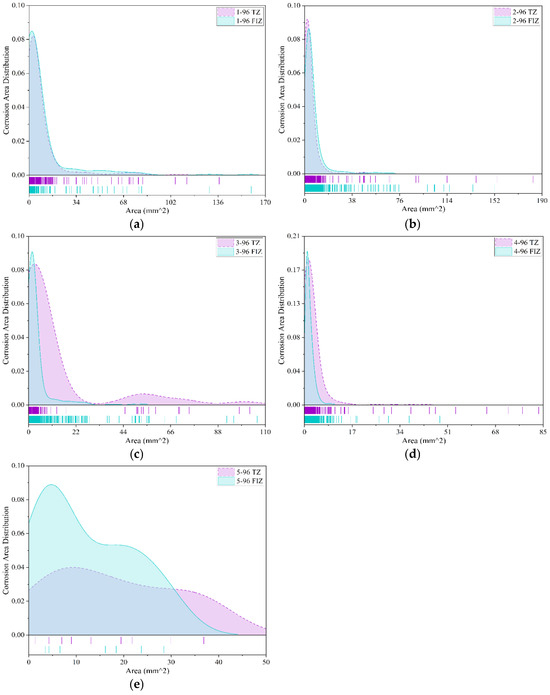
Figure 10.
Comparison of corrosion severity for coated specimens in tidal zone and full immersion zone (96 months). (a) Epoxy coating-1; (b) Chlorinated rubber-1; (c) Chlorinated rubber-2; (d) Fluorocarbon coating-1; (e) Fusion-bonded epoxy coating.
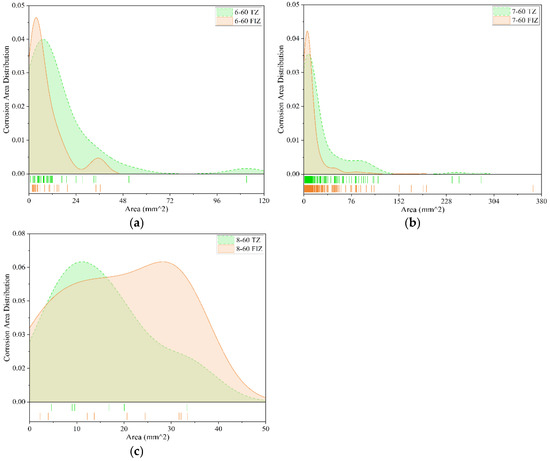
Figure 11.
Comparison of anti-corrosion performance of different coatings (60 months). (a) Fluorocarbon coating-2; (b) Epoxy coating-2; (c) Powder epoxy coating.
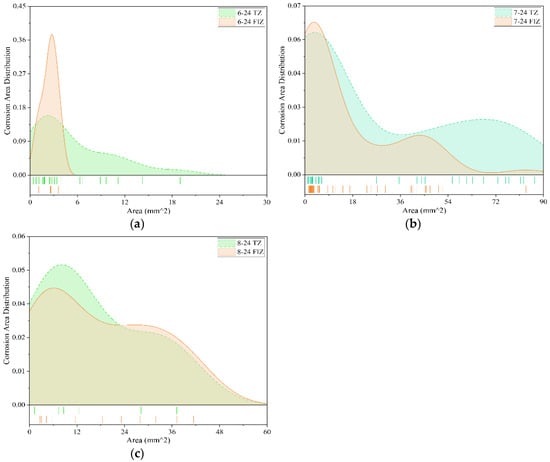
Figure 12.
Comparison of anti-corrosion performance of different coatings (24 months). (a) Fluorocarbon coating-2; (b) Epoxy coating-2; (c) Powder epoxy coating.
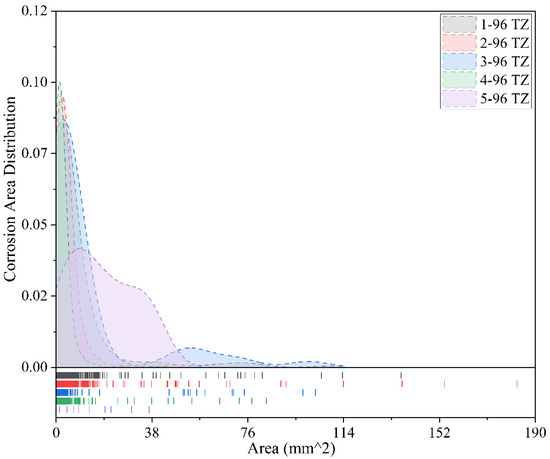
Figure 13.
Comparison of corrosion conditions for different coatings after 96 months of exposure (tidal zone).
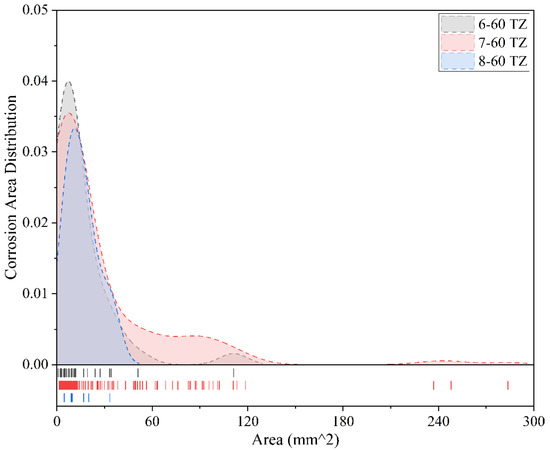
Figure 14.
Comparison of corrosion conditions for different coatings after 60 months of exposure (tidal zone).

Figure 15.
Comparison of corrosion conditions for different coatings after 24 months of exposure (tidal zone).
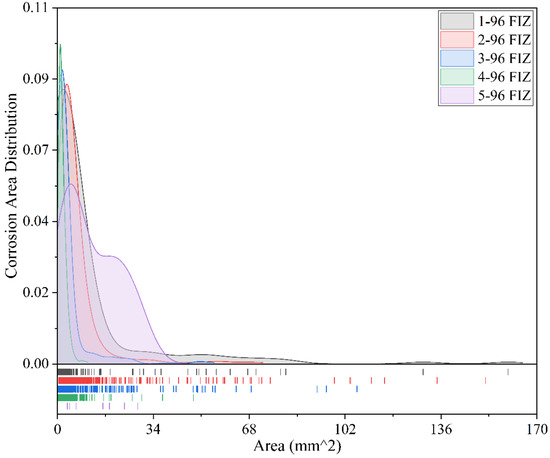
Figure 16.
Comparison of corrosion conditions for different coatings after 96 months of exposure (full immersion zone).
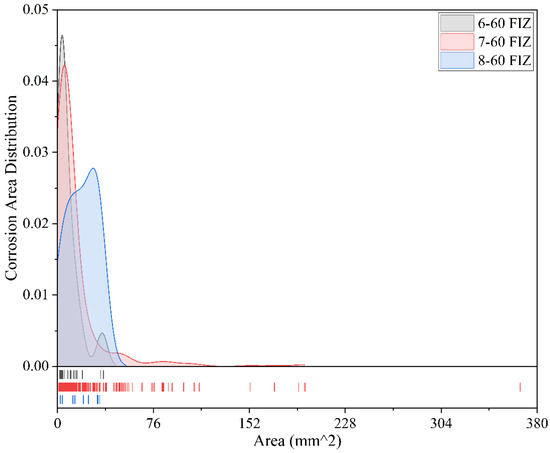
Figure 17.
Comparison of corrosion conditions for different coatings after 60 months of exposure (full immersion zone).
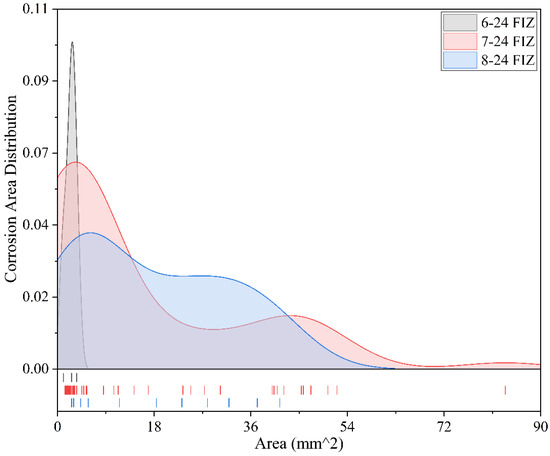
Figure 18.
Comparison of corrosion conditions for different coatings after 24 months of exposure (full immersion zone).
As shown in Figure 10a, after 96 months of exposure, the corrosion area distribution of Epoxy Coating-1 specimens in both the tidal zone and full immersion zone is generally similar. The data reveal a characteristic distribution where small-area corrosion regions account for the majority, while large-area corrosion regions are relatively rare. In both environments, the corrosion area predominantly falls within the range of 0 mm2 to 17 mm2, with the most frequent corrosion area being very small, approximately 5 mm2. For areas exceeding 17 mm2, the occurrence of corrosion regions is extremely limited, and the distribution is highly scattered. Overall, after 96 months of exposure testing, the corrosion severity of Epoxy Coating-1 in the tidal zone and full immersion zone shows little difference. This indicates that the anti-corrosion performance of Epoxy Coating-1 on metal specimens is relatively consistent between the two environments over long-term exposure.
As shown in Figure 10b, similar to Epoxy Coating-1, the corrosion area distribution of Chlorinated Rubber-1 specimens after 96 months of exposure is generally comparable between the tidal zone and full immersion zone. Both environments exhibit the characteristic pattern where small-area corrosion regions account for the majority, while large-area corrosion regions are relatively rare. The corrosion areas on unit specimens in both environments are primarily concentrated within the range of 0 mm2 to 16 mm2, with the most frequent corrosion area around 5 mm2. For corrosion areas exceeding 16 mm2, occurrences are very limited, and the distribution is highly scattered. However, in the tidal zone, the maximum corrosion area reaches 180 mm2, whereas in the full immersion zone, the maximum corrosion area is 150 mm2. This indicates that after 96 months of exposure, the overall corrosion severity of Chlorinated Rubber-1 specimens in both environments is relatively similar, though the corrosion in the tidal zone is slightly more severe.
As shown in Figure 10c, after 96 months of exposure, the corrosion area distribution of Chlorinated Rubber-2 coated specimens in both the tidal zone and full immersion zone exhibits similar trends. In both environments, small-area corrosion regions dominate, while large-area corrosion regions are relatively rare. In the tidal zone, the corrosion areas are primarily concentrated within the range of 0 mm2 to 22 mm2, with the most frequent corrosion area around 5 mm2. Corrosion areas exceeding 22 mm2 account for a small and highly scattered proportion, with the maximum corrosion area reaching 100 mm2. In the full immersion zone, corrosion areas are mainly distributed between 0 mm2 and 7 mm2. Corrosion areas larger than 7 mm2 are extremely limited and scattered, with the maximum corrosion area also around 100 mm2. These findings suggest that after 96 months of exposure, the overall corrosion severity of Chlorinated Rubber-2 specimens is relatively similar in both environments. However, in the tidal zone, corrosion areas are smaller and more concentrated, typically appearing as small-scale pitting corrosion. In the full immersion zone, while small-area pitting corrosion also dominates, there are instances of larger patch-like corrosion areas.
As shown in Figure 10d, after 96 months of exposure, the corrosion area distribution of Fluorocarbon Coating-1 specimens in both the tidal zone and full immersion zone exhibits similar patterns. In the tidal zone, corrosion areas are mainly concentrated within the range of 0 mm2 to 9 mm2, with the most frequent corrosion area around 4 mm2. Corrosion areas exceeding 9 mm2 are very few and highly scattered, with the maximum corrosion area reaching 80 mm2. In the full immersion zone, corrosion areas are primarily distributed between 0 mm2 and 6 mm2, with the most frequent corrosion area around 2 mm2. Corrosion areas larger than 6 mm2 account for an extremely small proportion and are widely scattered, with the maximum corrosion area reaching approximately 48 mm2. These results indicate that Fluorocarbon Coating-1 specimens exhibit low levels of corrosion under both exposure conditions, though corrosion in the tidal zone is relatively more severe.
As shown in Figure 10e, after 96 months of exposure, the Fusion-Bonded Epoxy Coating specimens exhibit a limited number of corrosion spots, which are relatively scattered. Additionally, there is a noticeable difference in the distribution of corrosion area between the tidal zone and the full immersion zone. In the full immersion zone, corrosion areas are primarily distributed within the range of 0 mm2 to 40 mm2, with the most frequent corrosion area approximately 5 mm2. In the tidal zone, corrosion areas are mainly distributed between 0 mm2 and 50 mm2, with the most frequent corrosion area around 10 mm2. These results indicate that after 96 months of exposure, the corrosion severity of Fusion-Bonded Epoxy Coating specimens is relatively similar in both environments. However, in the tidal zone, the corrosion area distribution is broader with lower occurrence frequencies across different sizes, whereas in the full immersion zone, the corrosion area distribution is narrower with higher occurrence frequencies for specific area sizes.
3.2.2. Comparison of 60-Month Exposure Test Results
Among the collected data, three types of coatings underwent exposure tests lasting 60 months: Fluorocarbon Coating-2, Epoxy Coating-2, and Powder Epoxy Coating. Therefore, the comparative study on anti-corrosion performance over 60 months focuses primarily on these three coatings. Figure 11 presents the comparison of corrosion areas for these coatings after 60 months of exposure in both the tidal zone and full immersion zone.
As shown in Figure 11a, after 60 months of exposure, the corrosion area distribution of Fluorocarbon Coating-2 specimens in the tidal zone is primarily concentrated within the range of 0 mm2 to 50 mm2, with the peak corrosion frequency approaching 0.04. The distribution indicates that small-area corrosion regions account for a relatively small proportion. Corrosion areas larger than 50 mm2 occur less frequently, with the maximum corrosion area reaching approximately 110 mm2. In the full immersion zone, corrosion areas are mainly concentrated between 0 mm2 and 24 mm2, with the highest corrosion frequency around 0.047. Similarly, small-area corrosion regions account for a relatively small proportion, and the maximum corrosion area is approximately 36 mm2. Therefore, after 60 months of exposure, the corrosion severity of Fluorocarbon Coating-2 specimens is slightly lower in the full immersion zone compared to the tidal zone. This suggests that the anti-corrosion performance of this coating in the tidal zone is somewhat weaker than in the full immersion zone.
As shown in Figure 11b, after 60 months of exposure, the corrosion area distribution of Epoxy Coating-2 specimens exhibits similar trends between the tidal zone and the full immersion zone. In the tidal zone, corrosion areas on the specimens are primarily concentrated within the range of 0 mm2 to 110 mm2, with the peak corrosion frequency close to 0.035. Corrosion areas larger than 150 mm2 are almost non-existent, and the maximum corrosion area reaches nearly 300 mm2. In the full immersion zone, corrosion areas are mainly concentrated between 0 mm2 and 70 mm2, with the peak corrosion frequency around 0.042. Corrosion areas larger than 80 mm2 are extremely rare, and the maximum corrosion area reaches approximately 350 mm2. Overall, after 60 months of exposure, the corrosion severity of Epoxy Coating-2 specimens is relatively similar between the tidal zone and the full immersion zone, though corrosion appears to be slightly more severe in the tidal zone.
As shown in Figure 11c, after 60 months of exposure, the Powder Epoxy Coating specimens exhibit relatively few corrosion areas in both the tidal zone and full immersion zone, with corrosion areas generally distributed within the range of 0 mm2 to 50 mm2. The peak corrosion frequencies are similar in both environments, approximately 0.06. However, the corrosion area distribution in the tidal zone is more concentrated, with the peak occurring around 10 mm2, whereas in the full immersion zone, the peak appears around 30 mm2. Overall, the corrosion severity of this coating is relatively low in both the tidal zone and full immersion zone after 60 months of exposure.
3.2.3. Comparison of 24-Month Exposure Test Results
Among the collected data, three types of coatings underwent exposure tests lasting 24 months: Fluorocarbon Coating-2, Epoxy Coating-2, and Powder Epoxy Coating. Figure 12 presents a comparative analysis of the corrosion area distribution for these coatings after 24 months of exposure in both the tidal zone and full immersion zone corrosion environments.
Figure 12a shows the distribution of corrosion areas on Fluorocarbon Coating-2 specimens after 24 months of exposure in both the tidal zone and full immersion zone. In the tidal zone, the corrosion area distribution is broader, with the maximum corrosion area reaching 19 mm2. The most frequent corrosion area is approximately 3 mm2, with a peak frequency of about 0.15. In the full immersion zone, the corrosion area distribution is more concentrated, primarily within the range of 0 mm2 to 5 mm2. The maximum corrosion area reaches 4 mm2, and the most frequent corrosion area is also around 3 mm2, with a peak frequency of 0.38. Overall, after 24 months of exposure, the corrosion severity of Fluorocarbon Coating-2 specimens is more pronounced in the tidal zone compared to the full immersion zone.
Figure 12b illustrates the corrosion area distribution of Epoxy Coating-2 specimens after 24 months of exposure in both the tidal zone and full immersion zone. Overall, the specimens exhibit similar corrosion patterns in both environments, with the peak corrosion frequency around 0.065. In the tidal zone, corrosion areas are primarily distributed between 0 mm2 and 90 mm2, with the maximum corrosion area reaching 90 mm2. In the full immersion zone, corrosion areas are mainly distributed between 0 mm2 and 63 mm2, with the maximum corrosion area approximately 82 mm2. In summary, after 24 months of exposure, the corrosion severity of Epoxy Coating-2 specimens is comparable in both the tidal zone and full immersion zone, though the corrosion is slightly more severe in the tidal zone.
Figure 12c presents the corrosion area distribution of Powder Epoxy Coating specimens after 24 months of exposure in both the tidal zone and full immersion zone. It is evident that Powder Epoxy Coating specimens exhibit relatively few corrosion regions in both environments, with corrosion areas generally distributed within the range of 0 mm2 to 40 mm2. The most frequent corrosion area in both zones is approximately 6 mm2. In the tidal zone, the peak frequency of corrosion area distribution reaches about 0.05, with the maximum corrosion area approximately 37 mm2. In the full immersion zone, the peak frequency is around 0.045, and the maximum corrosion area is approximately 42 mm2. These results indicate that after 24 months of exposure, the corrosion severity of Powder Epoxy Coating specimens is similar and relatively low in both the tidal zone and full immersion zone.
3.3. Comparative Analysis of Corrosion Severity Among Different Coatings in the Same Corrosive Environment
This study further conducted a comparative analysis of the corrosion performance of various coating specimens under the same corrosive environments and exposure durations, as shown in Table 4. For the 96-month exposure experiments, the coating specimens included Epoxy Coating-1, Chlorinated Rubber-1, Chlorinated Rubber-2, Fluorocarbon Coating-1, and Fusion-Bonded Epoxy Coating. For the 60-month exposure experiments, the specimens included Fluorocarbon Coating-2, Epoxy Coating-2, and Powder Epoxy Coating. Similarly, for the 24-month exposure experiments, the coating specimens consisted of Fluorocarbon Coating-2, Epoxy Coating-2, and Powder Epoxy Coating.

Table 4.
Descriptions of surface corrosion characteristics for each coating specimen.
3.3.1. Analysis of Corrosion Severity for Different Coatings in Tidal Zone
Figure 13 illustrates the corrosion conditions of five coatings in the tidal zone after 96 months of exposure. It can be observed that the Fusion-Bonded Epoxy Coating exhibits the most scattered distribution of corrosion areas, lacking a clear concentration trend. Its most frequent corrosion area is approximately 10 mm2, with a peak frequency of only 0.03, and the maximum corrosion area is about 38 mm2. These results indicate that this coating can effectively control corrosion progression even after long-term exposure, demonstrating strong corrosion resistance and uniformity. In contrast, the other four coatings show more concentrated corrosion area distributions, with their local maximum corrosion areas significantly larger than those of the Fusion-Bonded Epoxy Coating. Specifically, Chlorinated Rubber-1 and Fluorocarbon Coating-1 exhibit corrosion areas primarily concentrated within 0–10 mm2, with the most frequent corrosion area around 2 mm2 and a peak frequency close to 0.10, indicating that corrosion predominantly appears as small-area pitting. However, it is noteworthy that maximum corrosion areas of up to 180 mm2 and 80 mm2, respectively, were also observed. Although rare, these large corrosion areas suggest a risk of localized failure. For Epoxy Coating-1 and Chlorinated Rubber-2, corrosion areas are mostly concentrated within 0–19 mm2, with the most frequent corrosion area around 4 mm2 and a peak frequency of approximately 0.085. Their maximum corrosion areas reach 135 mm2 and 100 mm2, respectively, indicating that even under relatively mild overall corrosion, localized areas still require attention in terms of protective performance. Overall, Fusion-Bonded Epoxy Coating demonstrates the best long-term anti-corrosion performance in the tidal zone, with small, scattered corrosion areas and no evidence of severe localized corrosion. In contrast, although the other coatings primarily exhibit small-area corrosion, the presence of larger localized corrosion areas reveals potential weaknesses in protection, particularly in terms of pitting control, which still requires further improvement.
Figure 14 illustrates the corrosion conditions of three coatings in the tidal zone after 60 months of exposure. It is evident that all three coatings exhibit a clear concentration trend in corrosion area distribution, indicating that corrosion predominantly occurs within a certain range of small-area corrosion. Among them, Powder Epoxy Coating shows the most concentrated corrosion distribution, with corrosion areas mainly concentrated within 0–30 mm2. The most frequent corrosion area is approximately 15 mm2 with a frequency of 0.033, and the maximum corrosion area reaches only 32 mm2. This indicates that the coating provides good corrosion resistance in the tidal zone, with relatively uniform distribution and no significant large-area localized corrosion. In contrast, Epoxy Coating-2 shows a wider corrosion area distribution, primarily within 0–120 mm2. The most frequent corrosion area is around 10 mm2 with a peak frequency close to 0.035. However, the maximum corrosion area reaches 185 mm2, suggesting that although the overall corrosion tends to be concentrated, localized larger corrosion areas do occur, indicating potential weaknesses in protective performance in certain areas. The corrosion distribution characteristics of Fluorocarbon Coating-2 specimens fall between the other two. Corrosion areas are concentrated within 0–110 mm2, with the most common corrosion area also around 10 mm2. Its frequency is slightly higher at 0.04, and the maximum corrosion area is 110 mm2. This suggests that its corrosion control capability is acceptable but still somewhat inferior to Powder Epoxy Coating. Among the three coatings, Powder Epoxy Coating demonstrates the best anti-corrosion performance after 60 months of tidal zone exposure, with small and concentrated corrosion areas and no evident large-scale corrosion. Fluorocarbon Coating-2 follows, while Epoxy Coating-2, despite showing a relatively concentrated distribution, exhibits clear localized large-area corrosion, indicating room for improvement in protection consistency and long-term stability.
Figure 15 shows the corrosion conditions of three coatings in the full immersion zone after 24 months of exposure. Among the three coatings, Fluorocarbon Coating-2 specimens exhibits the most concentrated distribution of corrosion areas, primarily within the range of 0–20 mm2. The peak frequency occurs at approximately 4 mm2, with a frequency of 0.08, and the maximum corrosion area reaches only 20 mm2. This indicates that the coating offers good protective performance in the full immersion zone, with corrosion areas being small, concentrated, and showing no significant signs of localized spread. The Powder Epoxy Coating specimens demonstrate a more dispersed corrosion area distribution, ranging from 0 to 38 mm2. Although its peak frequency also occurs around 4 mm2, with a frequency of 0.08, there remains a notable presence of corrosion within the medium-sized range (20–38 mm2). This suggests that while the overall corrosion resistance is generally good, there is some tendency for localized corrosion expansion. In contrast, Epoxy Coating-2 specimens exhibit the most scattered corrosion area distribution, with a wide variation in corrosion sizes and a relatively flat frequency curve, lacking any clear concentration trend. This indicates weaker protection performance in the full immersion zone, with a greater likelihood of localized corrosion and inconsistent corrosion resistance. Among the three coatings, Fluorocarbon Coating-2 specimens demonstrate the best anti-corrosion performance, with small and concentrated corrosion areas. Powder Epoxy Coating ranks second, maintaining good overall performance while exhibiting some localized corrosion. Epoxy Coating-2 specimens perform the worst, with widely distributed corrosion areas and a higher risk of localized damage, indicating a need for improvement in its long-term protective capabilities.
3.3.2. Analysis of Corrosion Severity for Different Coatings in Full Immersion Zone
Figure 16 presents the corrosion area distribution of five coating specimens in the full immersion zone after 96 months of exposure. It can be observed that the corrosion areas of the Fusion-Bonded Epoxy Coating are the most scattered, mainly concentrated within the range of 0–34 mm2. The most frequent corrosion area is approximately 8 mm2, with a frequency of 0.055, and the maximum corrosion area is about 30 mm2. Overall, the number of corrosion areas is relatively small, and no significant clusters appear, indicating that this coating demonstrates good corrosion resistance and light overall corrosion in the full immersion zone. The corrosion areas of the Epoxy Coating-1 specimens are mainly concentrated within the range of 0–18 mm2, with the highest frequency appearing at approximately 4 mm2 and a frequency of 0.088. Although there is an outlier with a maximum corrosion area as high as 160 mm2, this is only an isolated case. In general, corrosion performance is acceptable, but there is still a risk of severe localized corrosion. The corrosion area distribution of Chlorinated Rubber-1 is similar to that of Epoxy Coating-1, mainly concentrated within the range of 0–16 mm2. The peak frequency appears at around 8 mm2, with a frequency close to 0.09. The maximum corrosion area is about 150 mm2, again limited to a very small number of points. Overall, the anti-corrosion performance is stable, but attention should be given to the potential for intensified localized corrosion. Chlorinated Rubber-2 specimens exhibit more concentrated corrosion area distribution, mostly within the range of 0–8 mm2. The highest frequency occurs at approximately 2 mm2, with a peak frequency close to 0.095, and the maximum corrosion area reaches 105 mm2. The overall corrosion areas are relatively small, the protective performance is good, and large localized corrosion areas are rare. The corrosion areas of Fluorocarbon Coating-1 specimens are the most concentrated, mainly within the range of 0–5 mm2. The highest frequency appears at approximately 1.5 mm2, with a frequency close to 0.1, and the maximum corrosion area is only 35 mm2. No significant large-area corrosion is observed, indicating excellent corrosion resistance.
Figure 17 shows the corrosion area distribution of three coated metal specimens in the full immersion zone after 60 months of exposure. Overall, the corrosion area distributions of the three coatings exhibit a certain degree of concentration, but there are clear differences in both corrosion severity and distribution characteristics. The Fluorocarbon Coating-2 specimens show the most concentrated distribution of corrosion areas, primarily within the range of 0–13 mm2. The peak frequency appears at a corrosion area of approximately 9 mm2, with a frequency of 0.046. The maximum corrosion area is 38 mm2, and the overall corrosion severity is low without any significant localized corrosion, demonstrating good anti-corrosion performance. The Epoxy Coating-2 specimens exhibit a relatively wider distribution of corrosion areas, mainly within the range of 0–38 mm2. The peak frequency appears at a corrosion area of approximately 12 mm2, with a frequency of 0.042. Although the maximum corrosion area reaches as high as 365 mm2, this represents only a few extreme points of corrosion; the majority of the corrosion areas are relatively concentrated. This suggests that the coating’s overall protective performance is acceptable, though there may be some localized defects. The Powder Epoxy Coating specimens also show a relatively concentrated distribution of corrosion areas, mainly within 0–40 mm2. However, its peak frequency occurs at a larger corrosion area of 35 mm2, with a frequency of 0.026. Although the maximum corrosion area does not exceed 35 mm2, the peak occurring at a relatively larger area indicates more uniform corrosion overall, but slightly more severe localized corrosion. In summary, Fluorocarbon Coating-2 specimens demonstrate the best anti-corrosion performance after 60 months of exposure in the full immersion zone, with small and concentrated corrosion areas. Epoxy Coating-2 performs well overall but shows occasional large-area corrosion. Powder Epoxy Coating specimens do not show extreme corrosion but exhibit larger peak corrosion areas, suggesting relatively higher localized corrosion severity and slightly weaker corrosion resistance.
Figure 18 presents the corrosion area distribution of three coatings in the full immersion zone after 24 months of exposure. Overall, the corrosion area distributions of the three specimens show clear differences. The Fluorocarbon Coating-2 specimens exhibit corrosion areas concentrated within 0–4 mm2, with the peak frequency occurring at approximately 3 mm2 and a frequency of 0.10. The maximum corrosion area is only 4 mm2, indicating that corrosion is confined to very small areas, highly concentrated, and of mild severity. The Epoxy Coating-2 specimens show a significantly broader corrosion area distribution, primarily within the range of 0–54 mm2. The peak frequency appears at approximately 4.5 mm2 (with a frequency of 0.065), and the maximum corrosion area reaches 85 mm2. This suggests a more dispersed corrosion pattern with the presence of larger corrosion defects, indicating unstable protective performance. The Powder Epoxy Coating specimens exhibit corrosion areas mainly concentrated within 0–40 mm2, with the peak frequency occurring around 6 mm2 and a corresponding frequency of 0.04. The maximum corrosion area is 40 mm2. The corrosion distribution is relatively uniform, with no extreme corrosion points, indicating generally reliable performance. In summary, the corrosion trends of the three coatings after 24 months of exposure in the full immersion zone are consistent with those observed at the 60-month interval: Fluorocarbon Coating-2 demonstrates the best anti-corrosion performance; Powder Epoxy Coating performs well overall with controllable corrosion distribution; Epoxy Coating-2 exhibits broader corrosion areas and larger maximum corrosion values, indicating relatively poorer performance.
3.4. Quantitative Analysis of Corrosion Severity Grades
To further quantify the corrosion severity of the coating specimens in both tidal zone and full immersion zone environments, this study conducted a corrosion grade analysis of the eight types of coatings at different exposure durations based on ASTM D610 [59] and ASTM B537 [60]. Corrosion grades were determined according to the size of the corrosion areas, with lower corrosion grade values indicating more severe corrosion.
Additionally, the number of specimens corresponding to each corrosion grade was calculated, and the results were validated by cross-referencing the qualitative observations of the surface corrosion conditions of each coated specimen. Table 4 provides a basic description of the surface corrosion conditions for each coating specimen.
3.4.1. Analysis of Corrosion Severity Grades for All Specimens
Figure 19 illustrates the distribution of corrosion grades for all coating specimens in the Full Immersion Zone and Tidal Zone under different exposure durations (24, 60, and 96 months). In the figure, circles of different colors represent different exposure durations and environments, while the size of each circle reflects the number of specimens at each corrosion grade. Blue and light blue circles represent the distribution of corrosion grades for all specimens in the tidal zone and full immersion zone, respectively, after 24 months of exposure. Red and light red circles represent the distribution of corrosion grades for all specimens in the tidal zone and full immersion zone, respectively, after 60 months of exposure. Green and light green circles represent the distribution of corrosion grades for all specimens in the tidal zone and full immersion zone, respectively, after 96 months of exposure. The size of each circle corresponds to the number of specimens falling within each corrosion grade category.
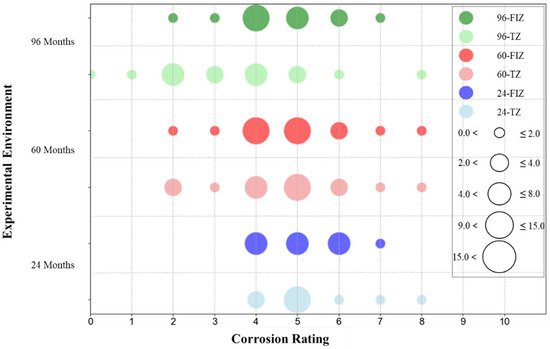
Figure 19.
Corrosion grade distribution of all coating specimens in tidal zone and full immersion zone (24/60/96 months).
It can be observed that with the extension of exposure time, the corrosion grades of coatings in both the full immersion zone and tidal zone show an overall upward trend, and the distribution of corrosion grades in both zones remains relatively similar. At 24 months, the corrosion grades in both zones are mainly concentrated between grades 4 and 7. Specifically, specimens in the tidal zone are more frequently classified between grades 4 and 6, while specimens in the full immersion zone are mostly at grade 5. This indicates that under short-term exposure, the coatings exhibit a certain degree of corrosion resistance but still show noticeable corrosion, with corrosion in the tidal zone being somewhat more severe. When the exposure time extends to 60 months, the corrosion grade distribution in both zones broadens, showing a similar trend of expansion. The corrosion grades in both zones now range from grades 2 to 8. In the tidal zone, the corrosion grades are primarily concentrated in grades 4 and 5, while in the full immersion zone, most specimens are at grade 5. Notably, the number of specimens at grade 2 in the full immersion zone is significantly higher than in the tidal zone, indicating the emergence of larger corrosion areas and higher corrosion severity in the full immersion zone. At 96 months, the corrosion grade range in the full immersion zone further expands to grades 0 to 8, with noticeable increases in both the extent and frequency of corrosion areas, suggesting that some coatings have undergone severe degradation. In the tidal zone, corrosion grades remain concentrated between grades 2 and 8, but the number of specimens at grade 4 has increased significantly compared to the 60-month mark. Overall, as exposure time increases, the overall corrosion resistance of the coatings gradually declines in both the tidal zone and full immersion zone, following similar trends. The tidal zone shows a greater concentration of specimens in the grades 4 and 5 range, whereas the full immersion zone more frequently exhibits larger corrosion areas. Additionally, the qualitative descriptions of surface corrosion characteristics in Table 4 also confirm that the severity of corrosion increases progressively over time in both environments.
3.4.2. Analysis of Corrosion Grades for Different Coated Specimens at 96 Months
The collected data includes five types of coatings with an exposure duration of 96 months: Epoxy Coating-1, Chlorinated Rubber-1, Chlorinated Rubber-2, Fluorocarbon Coating-1, and Fusion-Bonded Epoxy Coating. The corrosion grades of these five coatings in the tidal zone and full immersion zone were quantified, and the results are shown in Figure 20. Figure 20 indicates that after 96 months of exposure, there are significant differences in corrosion grades between the tidal zone and full immersion zone for these five coatings. Except for the Fusion-Bonded Epoxy Coating, the corrosion grades of the other four coatings are mainly concentrated between grades 2 and 5, while the Fusion-Bonded Epoxy Coating shows corrosion grades primarily between grades 5 and 8, demonstrating strong corrosion resistance. Further analysis shows that Fusion-Bonded Epoxy Coating, Fluorocarbon Coating-1, and Epoxy Coating-1 generally exhibit higher corrosion grades in the tidal zone compared to the full immersion zone. In contrast, the corrosion grades of Chlorinated Rubber-1 and Chlorinated Rubber-2 are mainly distributed between grades 2 and 4, indicating weaker corrosion resistance. Unlike the other coatings, these two coatings show significantly higher corrosion grades in the full immersion zone than in the tidal zone, with some specimens in the full immersion zone exhibiting extremely severe corrosion at grades 0 and 1. A comparison between these two coatings shows that the corrosion grades of Chlorinated Rubber-1 specimens in both the full immersion zone and tidal zone are higher than those of Chlorinated Rubber-2 specimens in the corresponding zones, indicating that Chlorinated Rubber-1 specimen has poorer corrosion resistance than Chlorinated Rubber-2 specimen. Overall, Fusion-Bonded Epoxy Coating shows the best corrosion resistance, followed by Fluorocarbon Coating-1, Epoxy Coating-1, Chlorinated Rubber-2, and Chlorinated Rubber-1. However, considering only the tidal zone, the corrosion resistance from high to low is Fusion-Bonded Epoxy Coating, Chlorinated Rubber-2, Fluorocarbon Coating-1, Epoxy Coating-1, and Chlorinated Rubber-1. In the full immersion zone, the corrosion resistance from high to low is Fusion-Bonded Epoxy Coating, Epoxy Coating-1, Fluorocarbon Coating-1, Chlorinated Rubber-1, and Chlorinated Rubber-2.
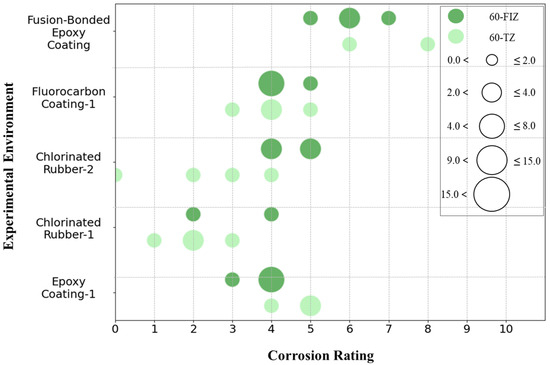
Figure 20.
Corrosion grade distribution of different coating specimens in tidal zone and full immersion zone after 96 months of exposure.
The image observation results in Table 4 further validate these findings. Chlorinated Rubber-1 and Chlorinated Rubber-2 showed extensive blistering and rust spots on their surfaces, with corrosion grades of 0 and 1, respectively, indicating severe corrosion. Epoxy Coating-1 and Fluorocarbon Coating-1 exhibited only minor surface corrosion, with corrosion grades concentrated between 3 and 5, reflecting relatively low overall corrosion severity. Notably, no significant rust was observed on the surface of the Fusion-Bonded Epoxy Coating, with corrosion grades ranging from 5 to 8, demonstrating good corrosion resistance.
3.4.3. Analysis of Corrosion Grades for Different Coated Specimens at 60 Months
The collected data includes three types of coatings with a 60-month exposure duration: Epoxy Coating-2, Fluorocarbon Coating-2, and Powder Epoxy Coating. The corrosion grades of these three coatings in the tidal zone and full immersion zone were quantified, and the results are shown in Figure 21. Figure 21 shows that after 60 months of exposure, there are significant differences in corrosion grades between the tidal zone and full immersion zone for these three coatings. The corrosion grades of the Powder Epoxy Coating specimens are mainly distributed between grades 5 and 8, with the full immersion zone concentrated at grades 6 and 7, and the tidal zone mainly at grades 5 and 8, indicating that the coating has similar anti-corrosion performance in both environments and maintains overall good corrosion resistance. The corrosion grades of the Epoxy Coating-2 specimens in both zones are concentrated between grades 2 and 5, with the tidal zone mainly at grade 4 and the full immersion zone at grades 2 and 5, indicating a more noticeable difference in corrosion resistance between the two environments, with more severe corrosion observed in the full immersion zone. The corrosion grades of the Fluorocarbon Coating-2 specimens are mainly distributed between grades 4 and 7, with the full immersion zone mainly at grade 6 and the tidal zone at grade 5, indicating more serious corrosion in the tidal zone. Overall, after 60 months of exposure, the Powder Epoxy Coating demonstrates the best corrosion resistance, followed by Fluorocarbon Coating-2, and finally Epoxy Coating-2.
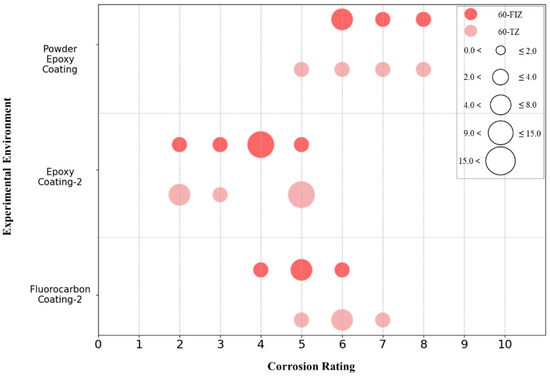
Figure 21.
Corrosion grade distribution of different coating specimens in tidal zone and full immersion zone after 60 months of exposure.
The image results of each specimen in Table 4 show that the surface of the Powder Epoxy Coating specimens exhibits only slight signs of corrosion with no obvious rust, and the corrosion grades range between 5 and 8, indicating good anti-corrosion performance. The surface of the Epoxy Coating-2 specimens shows noticeable blistering and rust spots, with corrosion grades concentrated between 2 and 5, indicating more severe corrosion. The surface of the Fluorocarbon Coating-2 specimens appears glossy and free of rust, but 1 to 3 mm blisters are present, with corrosion grades distributed between 4 and 7, reflecting a relatively mild level of corrosion. These qualitative observations verify the reliability of the previously stated assessment of the coatings’ corrosion resistance performance.
3.4.4. Analysis of Corrosion Grades for Different Coated Specimens at 24 Months
The data collected includes three types of coatings with a 24-month exposure duration: Epoxy Coating-2, Fluorocarbon Coating-2, and Powder Epoxy Coating. The corrosion grades of these three coatings in the tidal zone and full immersion zone were quantified, and the results are shown in Figure 22. It can be seen that after 24 months of exposure, the corrosion grades of the three coatings show little difference, especially between Fluorocarbon Coating-2 and Powder Epoxy Coating, which exhibit very similar corrosion grades, reflecting comparable anti-corrosion performance. The corrosion grades of the Powder Epoxy Coating specimens are concentrated between grades 5 and 7, with the tidal zone mainly at grade 6 and the full immersion zone at grade 5, indicating good corrosion resistance in both environments, with better performance in the tidal zone. The corrosion grades of Fluorocarbon Coating-2 specimens are concentrated between grades 6 and 7, with a higher proportion of grade 6 in the tidal zone compared to the full immersion zone, suggesting more severe corrosion in the tidal zone, though overall still at a moderate level. In contrast, the corrosion grades of Epoxy Coating-2 specimens are mainly distributed between grades 4 and 5, reflecting relatively poorer corrosion resistance. Overall, Fluorocarbon Coating-2 demonstrates the best corrosion resistance, especially in the full immersion zone, followed by Powder Epoxy Coating, with Epoxy Coating-2 performing the worst.
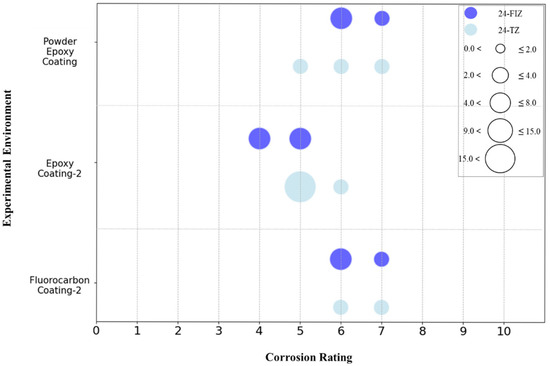
Figure 22.
Corrosion grade distribution of different coating specimens in tidal zone and full immersion zone after 24 months of exposure.
According to the image analysis results in Table 4, the surface of the Powder Epoxy Coating showed no obvious signs of corrosion, with corrosion grades concentrated between 5 and 7, and the overall severity of corrosion was low. The corrosion grade of Epoxy Coating-2 was mainly concentrated at grade 5, with only slight surface corrosion observed, indicating low severity. The surface of Fluorocarbon Coating-2 appeared glossy and free of rust, though 1 to 4 mm blisters were present, with corrosion grades ranging from 6 to 7, reflecting a mild level of corrosion. These observations further validate the quantified corrosion grade results mentioned above.
4. Discussion
4.1. Discussion on Performance of the Proposed Model
This study conducted a comparative analysis of the detection performance between the proposed YOLOv5-EfficientViT-NWD-CCA model and its baseline models. The results show that YOLOv5-EfficientViT-NWD-CCA outperforms the baseline in terms of Precision (0.76) and prediction confidence (0.70), which is attributed to the introduction of the CCA mechanism. CCA enhances the recognition accuracy of small-scale corrosion features by capturing richer contextual information; however, it also reduces the inference speed to 62 Hz due to the additional feature interaction operations introduced by CCA. To address the trade-off between accuracy and speed, future work could explore lightweight attention mechanisms, apply model compression and quantization techniques, and leverage distributed inference or parallel computing strategies. In terms of Recall and F1-Score, the proposed model shows little difference from the baseline and is capable of effectively identifying most positive samples. The limitations in the detection performance of the improved model are partly related to the quantity and quality of the training image data. Future research can improve the model’s prediction accuracy by expanding the training dataset and enhancing data quality. Additionally, strategies such as transfer learning and loss function optimization could be considered to further enhance the model’s effectiveness and applicability in practical scenarios.
4.2. Discussion on Corrosion Severity of Coated Specimens Under Different Corrosive Environments
After long-term exposure in the tidal zone, all types of protective coatings face the combined effects of complex environmental factors, including alternating wet and dry cycles, and the periodic penetration of oxygen and corrosive media. These conditions place higher demands on the coatings’ density, adhesion, and barrier properties. Based on the 96-month exposure results, although all five coatings primarily exhibited small-area corrosion, their protective capabilities varied significantly. Fluorocarbon Coating-1 demonstrated the best performance, with small and concentrated corrosion areas, reflecting its high density and excellent chemical stability, which effectively resists the structural damage caused by cyclic stress and redox environments typical of tidal zones. Epoxy Coating-1 and Chlorinated Rubber-2 both showed stable corrosion control, with minimal differences in corrosion distribution between the tidal and full immersion zones, indicating their adaptability to different environments and suitability for providing balanced protection in various service conditions. Chlorinated Rubber-1 exhibited localized corrosion expansion in the tidal zone; although its overall trend was similar to that in the full immersion zone, the concentration of corrosion in specific areas suggests that its aging resistance and structural integrity still need improvement. Fusion-Bonded Epoxy Coating showed fewer corrosion spots overall, but these were more scattered and varied in size, indicating a potential risk of localized failure under long-term tidal exposure, which highlights the need for further optimization in formulation or application quality.
The 60-month exposure test further revealed the challenges posed by the tidal zone to coating protection performance. Fluorocarbon Coating-2 exhibited a slightly larger corrosion area range in the tidal zone compared to the full immersion zone, indicating that while its barrier properties are strong, they are still somewhat affected by frequent wet–dry cycles. Epoxy Coating-2 showed larger corrosion areas in both zones, with a broader distribution in the tidal zone, reflecting deficiencies in its long-term permeability resistance and adhesion between the coating and substrate, making it less capable of withstanding complex alternating load environments. In contrast, Powder Epoxy Coating exhibited small, concentrated corrosion areas with high frequency peaks in both zones, demonstrating excellent barrier structure and density, which significantly enhanced its resistance to corrosion factors in the tidal zone and indicated strong engineering applicability.
At the 24-month exposure stage, the three coatings also exhibited differentiated trends. Fluorocarbon Coating-2 showed more significant corrosion effects in the tidal zone, which is likely related to the degradation of its oxidation resistance under oxygen-enriched conditions. Epoxy Coating-2 exhibited larger corrosion areas in both the tidal and full immersion zones, revealing that its coating structure faces challenges in permeability and adhesion performance even at an early stage. In contrast, Powder Epoxy Coating demonstrated relatively ideal corrosion resistance in both zones, indicating that its dense structure, achieved through its manufacturing process, can effectively prevent the intrusion of corrosive media, making it one of the more promising protective systems currently available for tidal zone environments.
In summary, the complex service environment of the tidal zone imposes higher performance requirements on protective coatings. The coating’s density, barrier properties, and aging resistance are key factors determining its long-term protective effectiveness. Fluorocarbon-based and powder epoxy-based coatings demonstrated superior overall performance under multiple exposure cycles, with Powder Epoxy Coating showing clear advantages in both corrosion resistance and environmental adaptability, making it a recommended choice for long-term protection in tidal zones. In contrast, traditional epoxy and chlorinated rubber coatings need further improvement in their ability to withstand environmental variability in order to extend their service life.
4.3. Discussion on Corrosion Severity of Coated Specimens Under the Same Corrosive Environment
Due to frequent wet–dry cycles, ample oxygen supply, and salt accumulation, the tidal zone presents strong corrosive conditions. Exposure results of different protective coatings in this environment indicate that their protective performance is primarily influenced by coating density, barrier stability, and aging resistance. Fluorocarbon coatings (Fluorocarbon Coating-1 and -2) exhibited smaller and more concentrated corrosion areas in the tidal zone, demonstrating that their dense structures and high chemical stability provide effective protection in this environment. Powder Epoxy Coating consistently showed small and concentrated corrosion areas across all test stages, indicating strong impermeability and interface stability, effectively slowing the intrusion and spread of corrosive media, making it suitable for long-term service in the tidal zone. Epoxy Coating-2 and Chlorinated Rubber-1 exhibited larger corrosion areas in the tidal zone, with greater severity compared to the full immersion zone, reflecting their insufficient durability under alternating wet–dry and oxygen-rich conditions. The corrosion may be related to aging, declining barrier performance, and weakened adhesion over prolonged service. Although Fusion-Bonded Epoxy Coating showed fewer corrosion points, they were more scattered with significant variation in area size, suggesting that while its overall barrier performance is acceptable, there are inconsistencies in localized protection. Therefore, in tidal zone environments, Powder Epoxy Coating and Fluorocarbon coatings demonstrate better corrosion protection and are suitable for long-term use in harsh marine environments, whereas Epoxy Coating-2, Chlorinated Rubber-1, and Fusion-Bonded Epoxy Coating require further improvement in material structure or interface performance for such applications.
The full immersion zone remains continuously submerged, where oxygen diffusion is limited and the dissolved oxygen concentration is relatively stable. Corrosion in this environment is primarily driven by electrochemical reactions, resulting in a slower corrosion rate. However, once the coating is damaged, corrosion products are difficult to diffuse, making it easy for localized concentration cells to form and accelerate pitting corrosion. Therefore, the coating’s density, interfacial adhesion, and water stability are key factors influencing its protective performance. The 96-month exposure results show that Fluorocarbon Coating-1 specimens exhibited small, concentrated corrosion areas with no significant abnormal corrosion points, indicating that its dense molecular structure effectively blocks moisture and ion penetration, offering excellent water resistance and sealing properties, well-suited to the low-oxygen, stable environment of the full immersion zone. Chlorinated Rubber-2 specimens also demonstrated good corrosion control, with a narrow distribution of corrosion areas, reflecting good film-forming properties that provide relatively uniform barrier protection. Fusion-Bonded Epoxy Coating specimens, though showing slightly more scattered corrosion distribution, maintained relatively small overall corrosion areas, suggesting that its thermoset cross-linked structure retains stability even in high-humidity environments. In contrast, Epoxy Coating-1 specimens and Chlorinated Rubber-1 specimens exhibited small average corrosion areas but had isolated larger corrosion spots, likely due to insufficient local adhesion or micro-cracks allowing moisture ingress, leading to localized barrier failure and uneven protection risks. Data from the 60-month and 24-month exposures further confirm this trend. Fluorocarbon Coating-2 specimens consistently showed small, concentrated corrosion areas at both intervals, indicating a dense structure and chemical inertness of the coating system, which contribute to its strong adaptability and long-term stability in full immersion environments. Powder Epoxy Coating specimens showed a relatively uniform distribution of corrosion areas with moderate maximum corrosion sizes, indicating that the continuous dense film formed after curing helps inhibit corrosion spread, though its localized protection is slightly inferior to fluorocarbon systems. Epoxy Coating-2 specimens displayed a wide distribution of corrosion areas with larger maximum sizes, with noticeable corrosion defects appearing as early as the 24-month mark, suggesting insufficient initial barrier properties possibly related to higher water absorption and lower cross-linking density, which compromises its protection in high-humidity, low-oxygen environments. Therefore, Fluorocarbon Coatings, with their dense structure and excellent chemical resistance, demonstrate reliable protective stability in full immersion conditions. Chlorinated rubber and powder epoxy systems provide strong corrosion resistance when structural integrity is maintained, while conventional epoxy coatings show relatively weaker adaptability to full immersion environments and are prone to localized corrosion spread. It is recommended to enhance surface treatment or adopt multi-layer structures in practical applications to improve their long-term service performance.
4.4. Discussion on Corrosion Grades Analysis for Different Coated Specimens
This study conducted a quantitative analysis of corrosion grades for various coatings under different exposure durations in both the tidal zone and full immersion zone. The coatings with a 96-month exposure duration include Epoxy Coating-1, Chlorinated Rubber-1, Chlorinated Rubber-2, Fluorocarbon Coating-1, and Fusion-Bonded Epoxy Coating. The results indicate significant differences in corrosion grades between the two environments for these coatings. Among them, the Fusion-Bonded Epoxy Coating specimens showed corrosion grades ranging from 5 to 8, demonstrating the strongest corrosion resistance, which may be attributed to its optimized material formulation, dense molecular structure, and highly cross-linked network structure formed through high-temperature curing. In contrast, Chlorinated Rubber Coating-1 and -2 exhibited weaker corrosion resistance, with corrosion grades mainly concentrated between 2 and 4, due to inherent material limitations and insufficient curing processes. Notably, the corrosion grades of these two chlorinated rubber coatings were abnormally higher in the full immersion zone than in the tidal zone, which may be related to their faster swelling and degradation rates in water.
For the coatings with a 60-month exposure duration, including Epoxy Coating-2, Fluorocarbon Coating-2, and Powder Epoxy Coating, the Powder Epoxy Coating exhibited similar corrosion resistance in both environments and maintained overall good anti-corrosion performance, with corrosion grades concentrated between 5 and 8. Epoxy Coating-2 showed significant differences in corrosion resistance between the two zones, with more severe corrosion in the full immersion zone, where corrosion grades were concentrated between 2 and 5. Fluorocarbon Coating-2 exhibited more severe corrosion in the tidal zone, with corrosion grades primarily between 4 and 7. Under the 24-month exposure duration, the differences in corrosion grades among Epoxy Coating-2, Fluorocarbon Coating-2, and Powder Epoxy Coating were relatively minor. The corrosion grades of Powder Epoxy Coating were concentrated between 5 and 7, those of Fluorocarbon Coating-2 between 6 and 7, and those of Epoxy Coating-2 mainly between 4 and 5.
From the perspective of the corrosion environment, the tidal zone’s periodic wet–dry cycles, UV radiation, and salt deposition from seawater splashes accelerate coating aging and corrosion. In contrast, coatings in the full immersion zone are subjected to prolonged seawater immersion, facing chemical corrosion and osmotic pressure effects. Different coatings exhibit varying levels of adaptability to these environmental factors, leading to performance differences between the two environments. For example, Fusion-Bonded Epoxy Coating demonstrates strong adaptability to environmental changes with stable microstructure, whereas the chlorinated rubber coatings may experience a decline in protective performance in the full immersion zone due to factors such as water penetration.
Time is a critical factor in evaluating the corrosion resistance of coatings. In short-term tests, the degree of corrosion among different coatings is relatively low with minimal differences; however, as the exposure duration increases, corrosion severity gradually rises, and the performance differences between coatings become more pronounced. This indicates that long-term corrosion testing provides a more accurate reflection of the actual performance changes and corrosion resistance differences in coatings. Under prolonged exposure, coating aging becomes increasingly evident, accompanied by the degradation of physical and chemical properties. For example, the performance of Epoxy Coating-2 declines significantly over time, while Powder Epoxy Coating and Fluorocarbon Coating-2 exhibit superior resistance to aging.
5. Conclusions
In this study, an improved model based on YOLOv5, named YOLOv5-EfficientViT-NWD-CCA, was developed for corrosion detection and performance evaluation of metal protective coatings. By introducing the EfficientViT feature extraction module, the Normalized Wasserstein Distance (NWD) target matching strategy, and the Contextual Criss-Cross Attention (CCA) mechanism, the model demonstrated significant improvements in the identification of small-scale corrosion features. Experimental results show that the improved model outperforms the original YOLOv5 and its evolved versions in key metrics such as Precision and prediction confidence. Although there was a slight reduction in inference speed, the overall detection performance is more suitable for high-precision corrosion identification tasks. To further enhance the model’s practicality, future research can explore optimization strategies such as lightweight attention structures, model compression, transfer learning, and distributed inference, while maintaining detection accuracy.
In the evaluation of corrosion resistance of protective coatings, this study systematically analyzed the corrosion severity of seven typical coatings under different corrosive environments (tidal zone and full immersion zone) and exposure periods (24, 60, and 96 months). The results indicate that the tidal zone poses greater challenges to the corrosion resistance of coatings. Overall, Fusion-Bonded Epoxy Coating, Powder Epoxy Coating, and Fluorocarbon Coatings exhibited higher protective stability and environmental adaptability throughout multi-cycle exposure tests, characterized by small and concentrated corrosion areas, excellent density, and strong aging resistance, making them suitable for long-term protection projects in complex tidal environments. In contrast, Epoxy Coatings and some Chlorinated Rubber Coatings showed issues such as localized corrosion propagation and deterioration of barrier performance under alternating wet–dry or submerged conditions, highlighting the need for further optimization in material structure and adhesion properties. The quantitative analysis of corrosion grades further validated the differences in corrosion resistance among the coatings and demonstrated that performance differences became more pronounced with extended exposure time, emphasizing the necessity of long-term exposure testing to accurately assess the practical performance of coatings. Additionally, the study points out that due to the differing corrosion mechanisms between the tidal zone and the full immersion zone, coating protection performance is influenced by a combination of factors, including density, film-forming stability, adhesion, and aging behavior. The proposed YOLOv5-EfficientViT-NWD-CCA model demonstrated improved detection accuracy over other YOLOv5 variants, confirming its applicability in complex marine corrosion feature recognition tasks. By integrating image-based corrosion features with coating performance evaluation, this study also offered targeted recommendations for material optimization, providing theoretical and technical references for engineering applications.
Despite these contributions, several limitations remain. First, the detection accuracy of the model is still influenced by the limited quantity and diversity of training data. In particular, the dataset originates from a single station (Zhoushan) under specific environmental conditions, such as low salinity and high turbidity, and lacks external validation or cross-domain testing. As a result, the generalizability and robustness of the model beyond this domain are not fully supported. Enhancing the dataset with high-quality, multi-angle images, as well as incorporating cross-domain or multi-site/multi-environment data, is expected to further improve model accuracy and robustness. Second, the experimental setup, while simulating typical marine corrosive environments, did not fully account for real-world variables such as microbial activity, pollutant deposition, and flow-induced effects. Consequently, discrepancies between laboratory results and field performance may occur. Third, the current analysis lacks variability metrics (e.g., confidence intervals, error bars, and effective sample size), which limits the assessment of statistical significance and data dispersion. Future studies should integrate such metrics to provide a more rigorous evaluation of model performance and experimental variability. To address these issues, future work should incorporate multi-environment, long-term field exposure tests, advanced microstructural characterization, and multi-physics numerical simulations. Such efforts can deepen the understanding of coating failure mechanisms in tidal and immersion zones, enhance the model’s predictive capability, and support the refinement of protective coating design and application strategies. Furthermore, improving both the quantity and quality of training data, alongside rigorous statistical evaluation, will be key to strengthening the integration of image-based corrosion detection with anti-corrosion performance assessment in practical engineering scenarios.
Author Contributions
Conceptualization, Q.Y. and X.G.; Methodology, Q.Y., X.G. and Y.H.; Software, Y.H. and X.H.; Validation, Q.Y. and Y.H.; Formal analysis, Q.Y. and Y.H.; Investigation, Q.Y. and Y.H.; Data curation, Y.H. and X.H.; Visualization, Y.H. and X.H.; Supervision, Q.Y. and X.G.; Writing—original draft preparation, Y.H.; Writing—review and editing, X.G. and Q.Y. All authors have read and agreed to the published version of the manuscript.
Funding
This research received no external funding.
Data Availability Statement
The original contributions presented in this study are included in this article. Further inquiries can be directed to the corresponding author.
Acknowledgments
All authors would like to express their sincere thanks to the editor and reviewers for their constructive comments.
Conflicts of Interest
The authors declare no conflicts of interest.
References
- Abbas, M.; Shafiee, M. An overview of maintenance management strategies for corroded steel structures in extreme marine environments. Mar. Struct. 2020, 71, 102718. [Google Scholar] [CrossRef]
- Jeffrey, R.; Melchers, R.E. Effect of vertical length on corrosion of steel in the tidal zone. Corrosion 2009, 65, 695–702. [Google Scholar] [CrossRef]
- Chandler, K.A. Marine and Offshore Corrosion: Marine Engineering Series; Elsevier: Amsterdam, The Netherlands, 2014. [Google Scholar]
- Agarwala, V.S.; Reed, P.L.; Ahmad, S. Corrosion detection and monitoring—A review. In Proceedings of the NACE CORROSION 2000 Conference, Orlando, FL, USA, 26–31 March 2000. NACE-00271. [Google Scholar]
- Watanabe, T.; Trang, H.T.H.; Harada, K.; Hashimoto, C. Evaluation of corrosion-induced crack and rebar corrosion by ultrasonic testing. Constr. Build. Mater. 2014, 67, 197–201. [Google Scholar] [CrossRef]
- Edalati, K.; Rastkhah, N.; Kermani, A.; Seiedi, M.; Movafeghi, A. In-service corrosion evaluation in pipelines using gamma radiography–a numerical approach. Insight-Non-Destruct. Test. Cond. Monit. 2004, 46, 396–398. [Google Scholar] [CrossRef]
- Wright, R.F.; Lu, P.; Devkota, J.; Lu, F.; Ziomek-Moroz, M.; Ohodnicki, P.R., Jr. Corrosion sensors for structural health monitoring of oil and natural gas infrastructure: A review. Sensors 2019, 19, 3964. [Google Scholar] [CrossRef] [PubMed]
- Xia, D.H.; Deng, C.M.; Macdonald, D.; Jamali, S.; Mills, D.; Luo, J.L.; Hu, W. Electrochemical measurements used for assessment of corrosion and protection of metallic materials in the field: A critical review. J. Mater. Sci. Technol. 2022, 112, 151–183. [Google Scholar] [CrossRef]
- Dabous, S.A.; Feroz, S. Condition monitoring of bridges with non-contact testing technologies. Autom. Constr. 2020, 116, 103224. [Google Scholar] [CrossRef]
- Liao, K.W.; Lee, Y.T. Detection of rust defects on steel bridge coatings via digital image recognition. Autom. Constr. 2016, 71, 294–306. [Google Scholar] [CrossRef]
- Hoang, N.D. Image processing-based pitting corrosion detection using metaheuristic optimized multilevel image thresholding and machine-learning approaches. Math. Probl. Eng. 2020, 2020, 6765274. [Google Scholar] [CrossRef]
- Wang, X.; Zhang, W.; Lin, Z.; Li, H.; Zhang, Y.; Quan, W.; Yu, Z. Current status of image recognition technology in the field of corrosion protection applications. Coatings 2024, 14, 1051. [Google Scholar] [CrossRef]
- Pidaparti, R.M.; Hinderliter, B.; Maskey, D. Evaluation of corrosion growth on SS304 based on textural and color features from image analysis. Int. Sch. Res. Not. 2013, 2013, 376823. [Google Scholar] [CrossRef]
- Li, Z.; Zhu, H.; Huang, M. A deep learning-based fine crack segmentation network on full-scale steel bridge images with complicated backgrounds. IEEE Access 2021, 9, 114989–114997. [Google Scholar] [CrossRef]
- Jiang, P.; Ergu, D.; Liu, F.; Cai, Y.; Ma, B. A review of YOLO algorithm developments. Procedia Comput. Sci. 2022, 199, 1066–1073. [Google Scholar] [CrossRef]
- Terven, J.; Córdova-Esparza, D.M.; Romero-González, J.A. A comprehensive review of YOLO architectures in computer vision: From YOLOv1 to YOLOv8 and YOLO-NAS. Mach. Learn. Knowl. Extract. 2023, 5, 1680–1716. [Google Scholar] [CrossRef]
- Jocher, G.; Nishimura, K.; Mineeva, T.; Vilariño, R. YOLOv5; GitHub Repository. 2020. Available online: https://github.com/ultralytics/yolov5 (accessed on 15 May 2024).
- Liu, W.; Anguelov, D.; Erhan, D.; Szegedy, C.; Reed, S.; Fu, C.Y.; Berg, A.C. SSD: Single shot multibox detector. In Proceedings of the European Conference on Computer Vision (ECCV), Amsterdam, The Netherlands, 11–14 October 2016; pp. 21–37. [Google Scholar]
- Wang, S.; Hao, X. YOLO-SK: A lightweight multiscale object detection algorithm. Heliyon 2024, 10, 2. [Google Scholar] [CrossRef]
- Yang, X.; del Rey Castillo, E.; Zou, Y.; Wotherspoon, L. UAV-deployed deep learning network for real-time multi-class damage detection using model quantization techniques. Autom. Constr. 2024, 159, 105254. [Google Scholar] [CrossRef]
- Zhang, Y.; Cai, W.; Fan, S.; Song, R.; Jin, J. Object detection based on YOLOv5 and GhostNet for orchard pests. Information 2022, 13, 548. [Google Scholar] [CrossRef]
- Lawal, O.M. YOLOv5-LiNet: A lightweight network for fruits instance segmentation. PLoS ONE 2023, 18, e0282297. [Google Scholar] [CrossRef]
- Liu, L.; Wang, L.; Ma, Z. Improved lightweight YOLOv5 based on ShuffleNet and its application on traffic signs detection. PLoS ONE 2024, 19, e0310269. [Google Scholar] [CrossRef]
- Wang, J.; Chen, Y.; Dong, Z.; Gao, M. Improved YOLOv5 network for real-time multi-scale traffic sign detection. Neural Comput. Appl. 2023, 35, 7853–7865. [Google Scholar] [CrossRef]
- Chen, J.; Pan, S.; Chan, Y.; Ni, Y.; Ye, D. A new method based on YOLOv5 and multiscale data augmentation for visual inspection in substation. Sci. Rep. 2024, 14, 9362. [Google Scholar] [CrossRef]
- Liu, J.; Sun, H.; Liu, H.; Yue, Q.; Xu, Z.; Jia, Y.; Wang, S. Recognition and quantification of apparent damage to concrete structure based on computer vision. Measurement 2024, 226, 115635. [Google Scholar]
- Liu, J.; Zhan, J.; Zhang, J.; Chen, J.; Song, Y.; Tang, L.; Guo, Y. Robust scale fusion and edge-aware feature attention network for remote sensing UAV road detection under harsh weather. Results Eng. 2025, 19, 106172. [Google Scholar] [CrossRef]
- Zhou, J.; Su, T.; Li, K.; Dai, J. Small Target-YOLO v5: Enhancing the algorithm for small object detection in drone aerial imagery based on YOLO v5. Sensors 2024, 24, 134. [Google Scholar] [CrossRef] [PubMed]
- Shan, C.; Liu, H.; Yu, Y. Research on improved algorithm for helmet detection based on YOLO v5. Sci. Rep. 2023, 13, 18056. [Google Scholar] [CrossRef]
- Liu, J.; Cai, Q.; Zou, F.; Zhu, Y.; Liao, L.; Guo, F. BiGA-YOLO: A lightweight object detection network based on YOLO v5 for autonomous driving. Electronics 2023, 12, 2745. [Google Scholar]
- Li, A.; Sun, S.; Zhang, Z.; Feng, M.; Wu, C.; Li, W. A multi-scale traffic object detection algorithm for road scenes based on improved YOLOv5. Electronics 2023, 12, 878. [Google Scholar] [CrossRef]
- Wang, S.; Fan, X.; Zhao, Z.; Qiao, Z.; Wang, N.; Qiu, Y.; Jia, X. Research on steel surface defect detection system based on YOLOv5s-SE-CA model and BEMD image enhancement. Nondestruct. Test. Eval. 2024, 39, 1–20. [Google Scholar] [CrossRef]
- Fu, M.; Jia, Z.; Wu, L.; Cui, Z. Detection and recognition of metal surface corrosion based on CBG-YOLOv5s. PLoS ONE 2024, 19, e0300440. [Google Scholar]
- Huang, B.; Liu, J.; Liu, X.; Liu, K.; Liao, X.; Li, K.; Wang, J. Improved YOLOv5 network for steel surface defect detection. Metals 2023, 13, 1439. [Google Scholar] [CrossRef]
- Sumi, L.; Dey, S. Improved bounding box regression loss for weapon detection systems using deep learning. Int. J. Inf. Technol. 2024, 16, 1–17. [Google Scholar] [CrossRef]
- Jing, Z.; Li, P.; Wu, B.; Yuan, S.; Chen, Y. An adaptive focal loss function based on transfer learning for few-shot radar signal intra-pulse modulation classification. Remote Sens. 2022, 14, 1950. [Google Scholar] [CrossRef]
- Cui, Y.; Jia, M.; Lin, T.Y.; Song, Y.; Belongie, S. Class-balanced loss based on effective number of samples. In Proceedings of the IEEE/CVF Conference on Computer Vision and Pattern Recognition (CVPR), Long Beach, CA, USA, 16–20 June 2019; pp. 9268–9277. [Google Scholar]
- Nisa, U. Image augmentation approaches for small and tiny object detection in aerial images: A review. Multimed. Tools Appl. 2025, 84, 21521–21568. [Google Scholar] [CrossRef]
- Zhu, C.; Wang, Z. Entropy-based matrix learning machine for imbalanced data sets. Pattern Recognit. Lett. 2017, 88, 72–80. [Google Scholar] [CrossRef]
- Xie, Z.; Shu, C.; Fu, Y.; Zhou, J.; Chen, D. Balanced loss function for accurate surface defect segmentation. Appl. Sci. 2023, 13, 826. [Google Scholar] [CrossRef]
- Zhang, Y.F.; Ren, W.; Zhang, Z.; Jia, Z.; Wang, L.; Tan, T. Focal and efficient IOU loss for accurate bounding box regression. Neurocomputing 2022, 506, 146–157. [Google Scholar] [CrossRef]
- Tong, Z.; Chen, Y.; Xu, Z.; Yu, R. Wise-IoU: Bounding box regression loss with dynamic focusing mechanism. arXiv 2023, arXiv:2301.10051. [Google Scholar]
- Gevorgyan, Z. SIoU loss: More powerful learning for bounding box regression. arXiv 2022, arXiv:2205.12740. [Google Scholar] [CrossRef]
- Cheng, H.; Kang, F. Corrosion detection and grading method for hydraulic metal structures based on an improved YOLOv10 sequential architecture. In Proceedings of the 2024 3rd International Conference on Automation, Robotics and Computer Engineering (ICARCE), Shanghai, China, 13–15 January 2024; IEEE: Piscataway, NJ, USA, 2024. [Google Scholar]
- Liu, X.; Luo, Y.; Lu, Y.; Jin, Y.; Vu, Q.V.; Kong, Z. A dual attention network for automatic metallic corrosion detection in natural environment. J. Build. Eng. 2023, 75, 107014. [Google Scholar] [CrossRef]
- Zhang, S.J.; Deng, X.; Lu, Y.; Hong, S.; Kong, Z.; Peng, Y.; Luo, Y. A channel attention based deep neural network for automatic metallic corrosion detection. J. Build. Eng. 2021, 42, 103046. [Google Scholar] [CrossRef]
- Guo, J.; Wang, L.; Hua, L. Efficient metal corrosion area detection model combining convolution and transformer. Appl. Sci. 2024, 14, 9900. [Google Scholar] [CrossRef]
- Chliveros, G.; Tzanetatos, I.; Kontomaris, S.V. A deep learning image corrosion classification method for marine vessels using an eigen tree hierarchy module. Coatings 2024, 14, 768. [Google Scholar] [CrossRef]
- Bertolini, L.; Carsana, M.; Gastaldi, M.; Lollini, F.; Redaelli, E. Corrosion assessment and restoration strategies of reinforced concrete buildings of the cultural heritage. Mater. Corros. 2011, 62, 146–154. [Google Scholar] [CrossRef]
- Zhang, Y.C.; Du, Y.L.; Yi, T.H.; Zhang, S.H. Automatic rebar picking for corrosion assessment of RC bridge decks with ground-penetrating radar data. J. Perform. Constr. Facil. 2024, 38, 04023069. [Google Scholar] [CrossRef]
- Zhang, H.; Qi, J.; Zheng, Y.; Zhou, J.; Qiu, J. Characterization and grading assessment of rebar corrosion in loaded RC beams via SMFL technology. Constr. Build. Mater. 2024, 411, 134484. [Google Scholar] [CrossRef]
- Yan, J.; Lu, D.; Khou, I.; Zhang, S. Faster RSTRENG: A more efficient effective area method algorithm for corrosion assessment. J. Press. Vessel Technol. 2023, 145, 031502. [Google Scholar] [CrossRef]
- Wang, J.; Zhang, T.; Cheng, Y.; Al-Nabhan, N. Deep learning for object detection: A survey. Comput. Syst. Sci. Eng. 2021, 38, 165–182. [Google Scholar] [CrossRef]
- Wang, S. Automated non-PPE detection on construction sites using YOLOv10 and transformer architectures for surveillance and body worn cameras with benchmark datasets. Sci. Rep. 2025, 15, 27043. [Google Scholar] [CrossRef]
- Mittal, P. A comprehensive survey of deep learning-based lightweight object detection models for edge devices. Artif. Intell. Rev. 2024, 57, 242. [Google Scholar] [CrossRef]
- Ali, M.L.; Zhang, Z. The YOLO framework: A comprehensive review of evolution, applications, and benchmarks in object detection. Computers 2024, 13, 336. [Google Scholar] [CrossRef]
- Yu, Q.; Han, Y.; Gao, X.; Lin, W.; Han, Y. Comparative analysis of improved YOLO v5 models for corrosion detection in coastal environments. J. Mar. Sci. Eng. 2024, 12, 1754. [Google Scholar] [CrossRef]
- Huang, Z.; Wang, X.; Huang, L.; Huang, C.; Wei, Y.; Liu, W. CCNET: Criss-cross attention for semantic segmentation. arXiv 2020, arXiv:1811.11721. [Google Scholar] [CrossRef]
- ASTM D610-08; Standard Practice for Evaluating Degree of Rusting on Painted Steel Surfaces. ASTM International: West Conshohocken, PA, USA, 2008.
- ASTM B537-70; Standard Practice for Rating of Electroplated Panels Subjected to Atmospheric Exposure. ASTM International: West Conshohocken, PA, USA, 2013.
Disclaimer/Publisher’s Note: The statements, opinions and data contained in all publications are solely those of the individual author(s) and contributor(s) and not of MDPI and/or the editor(s). MDPI and/or the editor(s) disclaim responsibility for any injury to people or property resulting from any ideas, methods, instructions or products referred to in the content. |
© 2025 by the authors. Licensee MDPI, Basel, Switzerland. This article is an open access article distributed under the terms and conditions of the Creative Commons Attribution (CC BY) license (https://creativecommons.org/licenses/by/4.0/).


