1. Introduction
Accurate wind data are essential for understanding wind patterns that influence climate studies, air quality assessments, renewable energy development, hazard mitigation, wave dynamics, and coastal engineering [
1,
2,
3,
4,
5,
6,
7,
8]. Such data support economic growth, environmental sustainability, and scientific advancements by enabling efficient wind farm operations, improved coastal infrastructure, and enhanced maritime safety. They are also critical for climate modeling, emissions management, and designing wind-resistant infrastructure like skyscrapers and coastal defenses. Despite their significance, a global shortage of reliable wind data, particularly in coastal and offshore regions, poses substantial challenges [
9,
10].
To address this gap, global reanalysis models, such as the European Centre for Medium-Range Weather Forecasts (ECMWF) ERA5, offer a potential solution by providing comprehensive wind simulations validated against observations from ships, satellites, radar, and buoys [
11,
12,
13]. ERA5, the latest climate reanalysis product, delivers hourly atmospheric, land-surface, and sea-state parameters dating back to 1950, making it a valuable tool for studying past climates and forecasting future trends [
14]. Its application spans climate research, environmental modeling, and renewable energy assessment, with studies demonstrating its effectiveness in capturing wind variability in diverse regions. However, evaluations of ERA5’s accuracy remain scarce, particularly in coastal and offshore areas with complex environmental dynamics [
15].
Compared to other models like the NCEP/NCAR Reanalysis, a joint project between the National Center for Atmospheric Research (NCAR) and the National Oceanic and Atmospheric Administration (NOAA) [
16], ERA5 generally demonstrates superior performance [
14]. The NCEP/NCAR model is validated versus measurements obtained from ships, satellites, radar, and buoys [
3,
17], and it provides a comprehensive set of atmospheric and land surface parameters from 1948 to the present. The ERA5 and the NCEP/NCAR provide a gridded surface wind dataset and other atmospheric variables that complement wind observations [
18]. Foli et al. [
19] found that ERA5 outperformed NCEP/NCAR in capturing regional wind variability in West Africa, achieving higher accuracy and smaller biases. Similarly, Vozila et al. [
20] showed that ERA5 consistently achieves higher temporal correlation coefficients than regional climate models (RCMs) and limited-area models. However, its resolution limits its ability to represent fine-scale variability. ERA5 has also shown limitations in extreme conditions, such as underestimating wind speeds near storm centers, leading to errors in storm surge simulations [
20,
21,
22,
23,
24,
25]. Campos et al. [
26] found that ERA5 underestimates wind speeds by roughly 10–15% during tropical or extratropical cyclone events compared to non-cyclonic conditions. Xiong et al. [
21] proposed integrating ERA5 with a typhoon model to address these issues, enhancing wind intensity near storm cores while retaining ERA5’s strengths.
Ren et al. [
25] used ERA5 to analyze wind fields’ spatial and temporal characteristics along the Guangdong coast in China and found that the ERA5 underestimation of measurements increases as the storm intensity increases; the same finding was reported by [
27]. In the South China Sea, Zhai et al. [
22] found ERA5 to be reliable for general analyses but noted significant underestimations of wind speeds (up to 38%) under extreme conditions, especially in shallow waters. Similarly, Suo et al. [
28] highlighted seasonal influences on ERA5 accuracy along the Bohai Bay coastline, recommending localized wind profiles and radar data for improvements. Jourdier [
29] and Gualtieri [
30] demonstrated that ERA5 performs well in homogeneous environments, achieving high correlation coefficients (0.93–0.96), but struggles in complex terrains, where resolution limitations lead to biases.
Despite extensive validation efforts in Europe, West Africa, and East Asia, studies on ERA5’s accuracy in the Arabian Gulf region, particularly Kuwait, are notably lacking. The Arabian Gulf holds global significance due to its vital role in oil supply, trade, and the development of coastal and offshore mega-projects aligned with regional visions such as Kuwait Vision 2035 [
31,
32,
33,
34,
35]. These projects, including ports, touristic beaches, and offshore renewable energy farms, depend on accurate wind and hydrodynamic data. However, the sparse availability of measured data in the region, coupled with unique environmental challenges such as shallow coastal waters and an arid climate, necessitates a thorough evaluation of ERA5’s reliability.
This study addresses this critical gap by evaluating the accuracy of ERA5 wind data in Kuwait’s coastal and offshore regions. Using advanced statistical tools, it investigates ERA5’s ability to capture wind dynamics in an area characterized by limited observational data and environmental complexity. The findings provide actionable insights into the model’s strengths and limitations, contributing to developing localized wind models and observational programs. These results are essential for supporting renewable energy projects, enhancing coastal engineering practices, improving maritime safety, and facilitating the development of wave models in Kuwait, which currently lacks long-term wind and wave measurements [
31,
36,
37,
38]
This study addresses a critical gap in applying global wind models in the Arabian Gulf, specifically focusing on Kuwait’s shallow coastal region. By employing advanced statistical techniques, it provides a detailed scientific evaluation of ERA5 wind data in an area characterized by sparse observational climate data and unique environmental challenges. Such evaluation is essential for implementing these data into various designs and applications and for observational model data improvements. The findings emphasize the need to develop localized and reliable wind models and implement comprehensive observational programs. This research contributes to the region’s sustainable development by strengthening maritime safety, enhancing infrastructure resilience, and supporting renewable energy projects, coastal engineering practices, and environmental management efforts.
In addition to addressing local challenges, this research offers broader implications for improving ERA5’s applicability in other shallow-water, arid coastal regions worldwide. The findings emphasize the need for enhanced integration of observational data and reanalysis models to advance sustainable development efforts. The following sections outline the data, methodology, results, and conclusions, presenting recommendations for future research and practical applications.
2. Measured and ERA5 Data
2.1. Measured Data
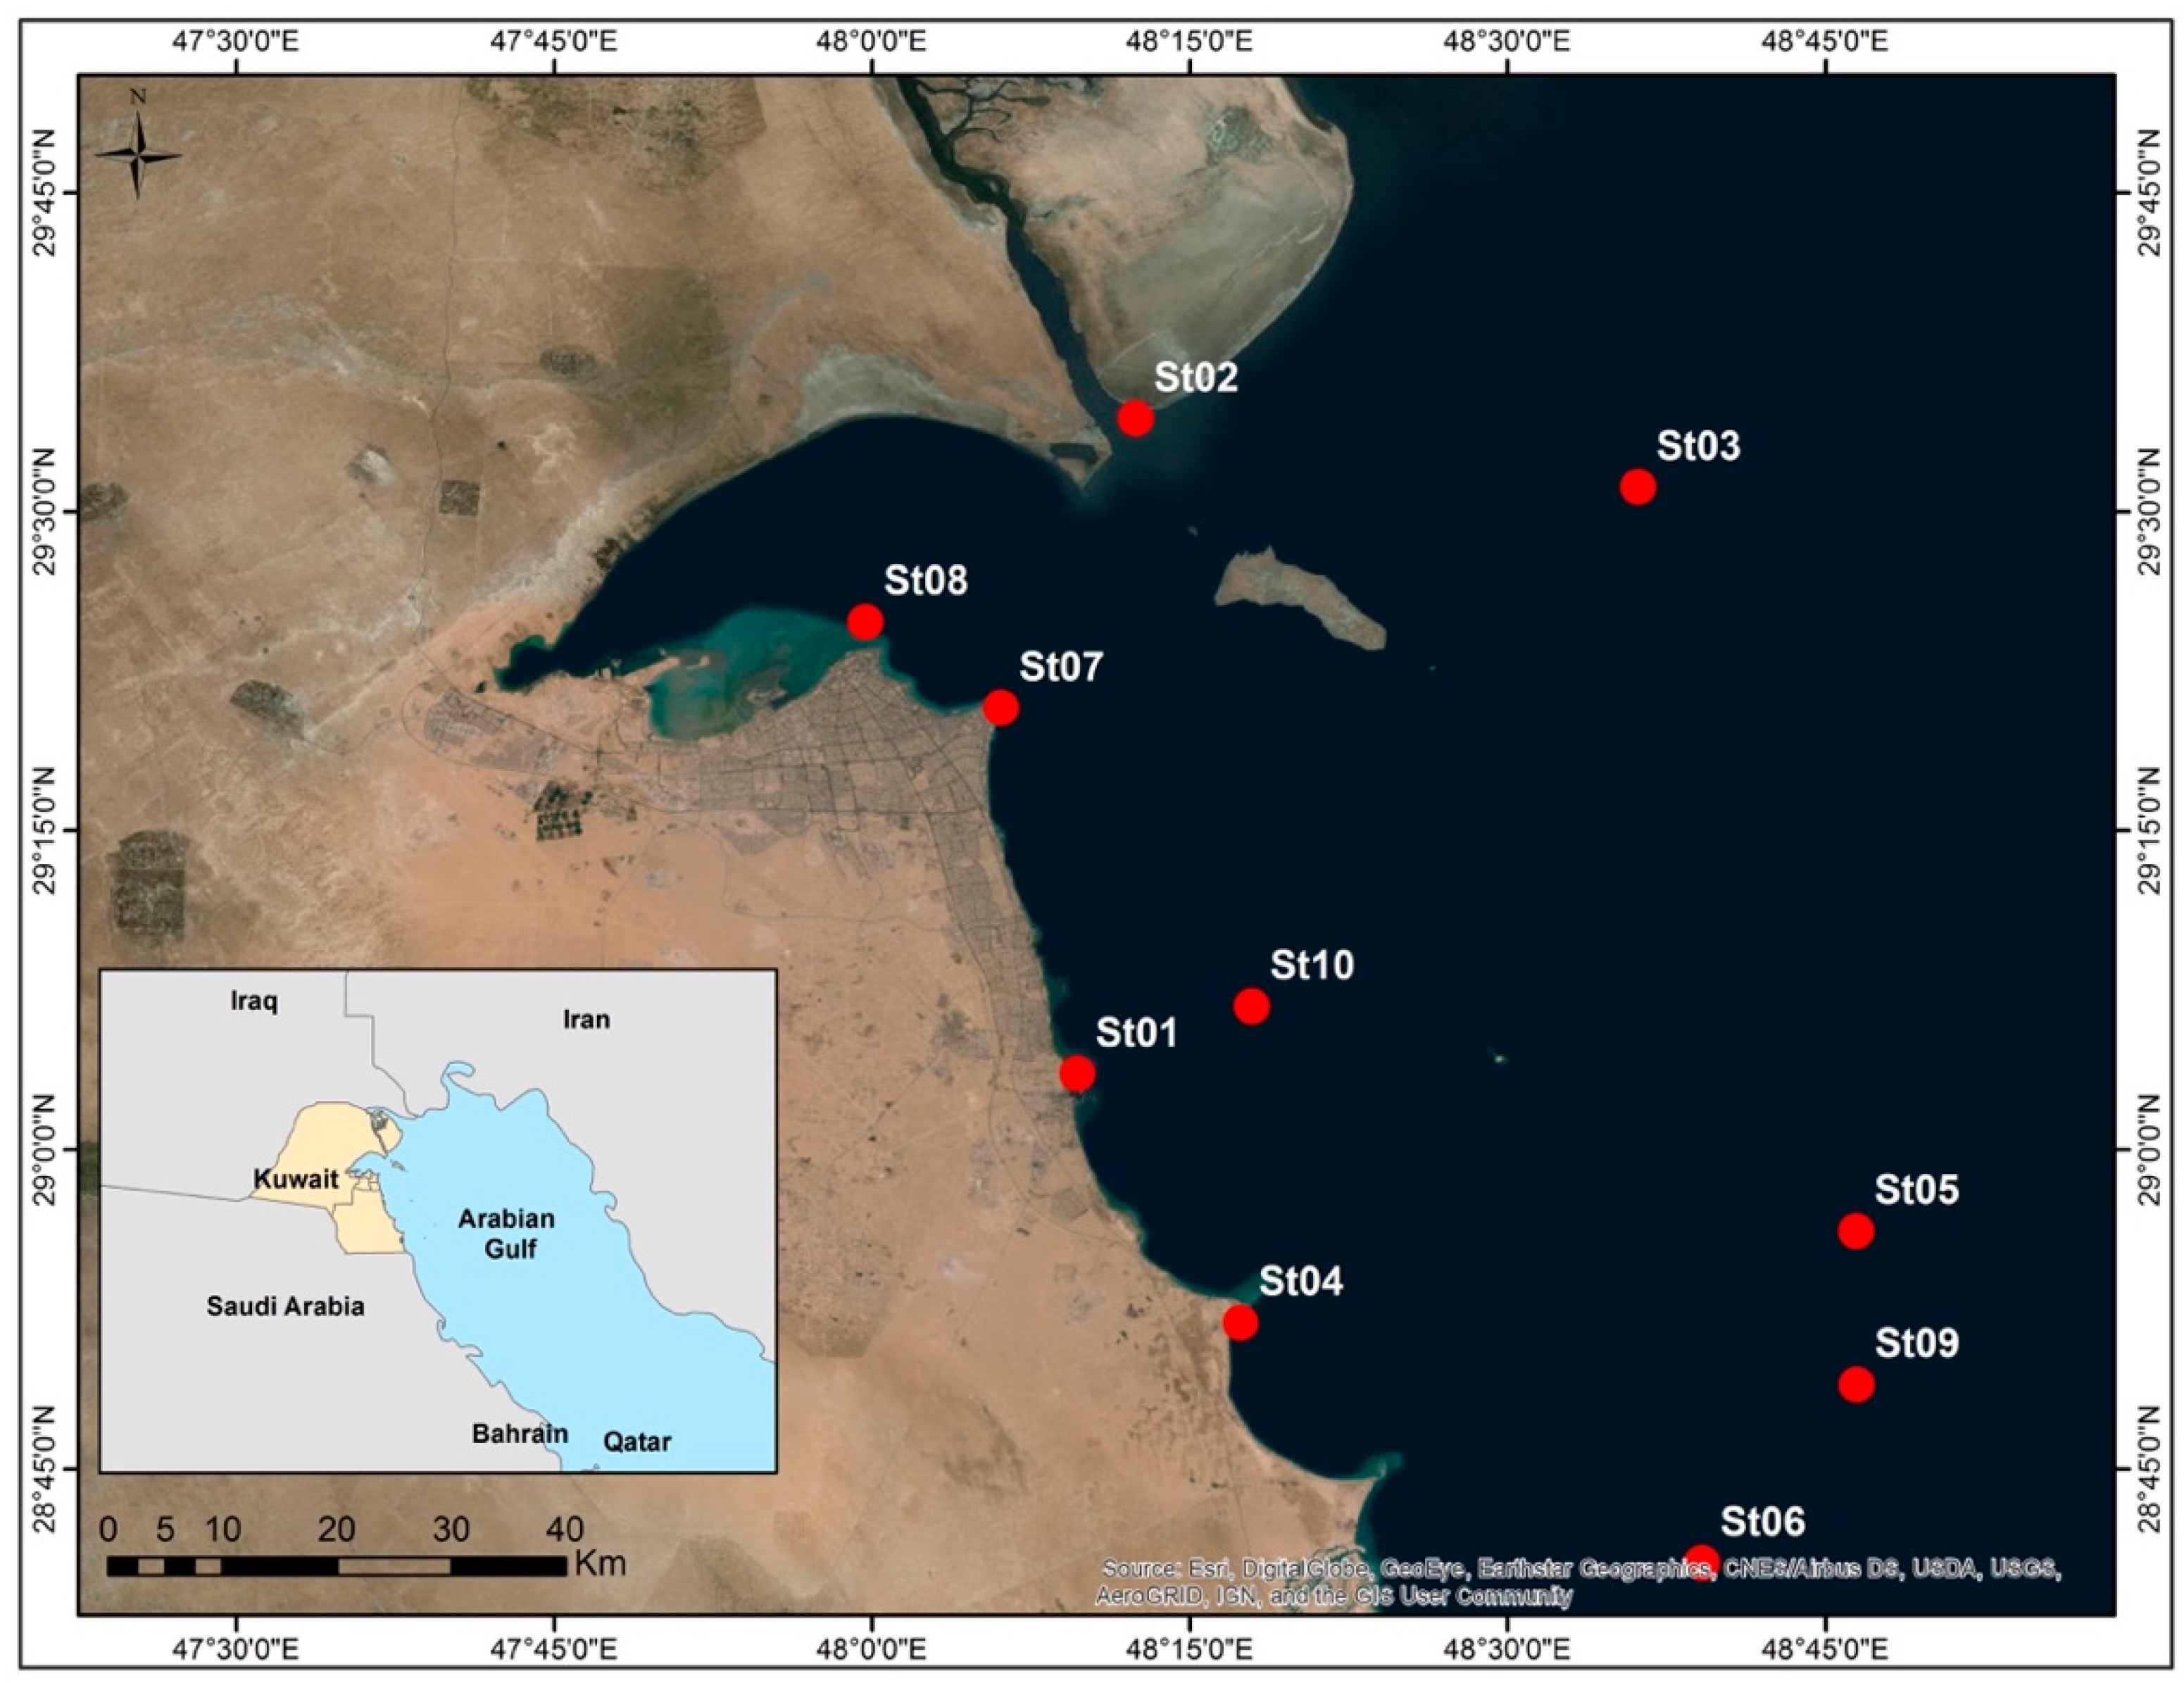
The Kuwait Meteorological Department (KMD) monitors and forecasts weather conditions, including marine environments, in Kuwait. The department operates ten coastal and offshore meteorological stations within Kuwait’s sea territories (
Figure 1). The dataset comprises wind speed and direction measurements from these stations measured 10 m above sea level. Detailed information about the data, including station names, codes, locations, measurement dates, and percentages of missing data, is provided in
Table 1.
The coastal stations (St01, St02, St04, St07, and St08) have measurements from 1 January 2010 to 30 December 2017, with missing data percentages ranging from 0.22% to 1.02%. The offshore stations (St03, St05, St06, St09, and St10) have measurements from 1 January 2010 to 31 December 2017, with missing data percentages ranging from 0.35% to 11.33%. Overall, most stations exhibit relatively complete datasets with minor percentages of missing records, averaging 1.72% across all stations, except for St10, which has a substantial gap.
KMD applies rigorous quality control processes to ensure the accuracy and reliability of collected data. These processes include systematic review and validation to identify missing data and remove unrealistic measurements. Therefore, this dataset is suitable for validating numerical wind models and conducting in-depth analyses of wind dynamics, and it offers valuable insights into wind patterns, trends, and extremes.
2.2. ERA5 Data
The ERA5 reanalysis dataset offers a spatial resolution of approximately 31 km (0.25 degrees) and provides 137 vertical levels, with data extending from the surface to 0.01 hPa, roughly 80 km above the Earth’s surface. This dataset uses a state-of-the-art assimilation system integrating vast satellite and ground-based weather station data. The 4D-Var method is used in this assimilation process, which considers the evolution of weather variables in space and time, resulting in highly accurate and consistent global atmospheric reconstructions. The ERA5 wind data have been validated against independent observations, demonstrating their high accuracy and reliability. Researchers and practitioners widely use ERA5 to study wind patterns, extreme weather events, and long-term climate change impacts. Its comprehensive coverage and satisfactory resolution allow for detailed analyses of atmospheric dynamics on regional and global scales, making it a critical resource for the scientific community.
From 2010 to 2017, the horizontal wind components at 10 m above the sea level, specifically the eastward (u) and northward (v) vectors, were utilized to compute the magnitude of the wind speed and its direction at each hour for locations corresponding to measured data points.
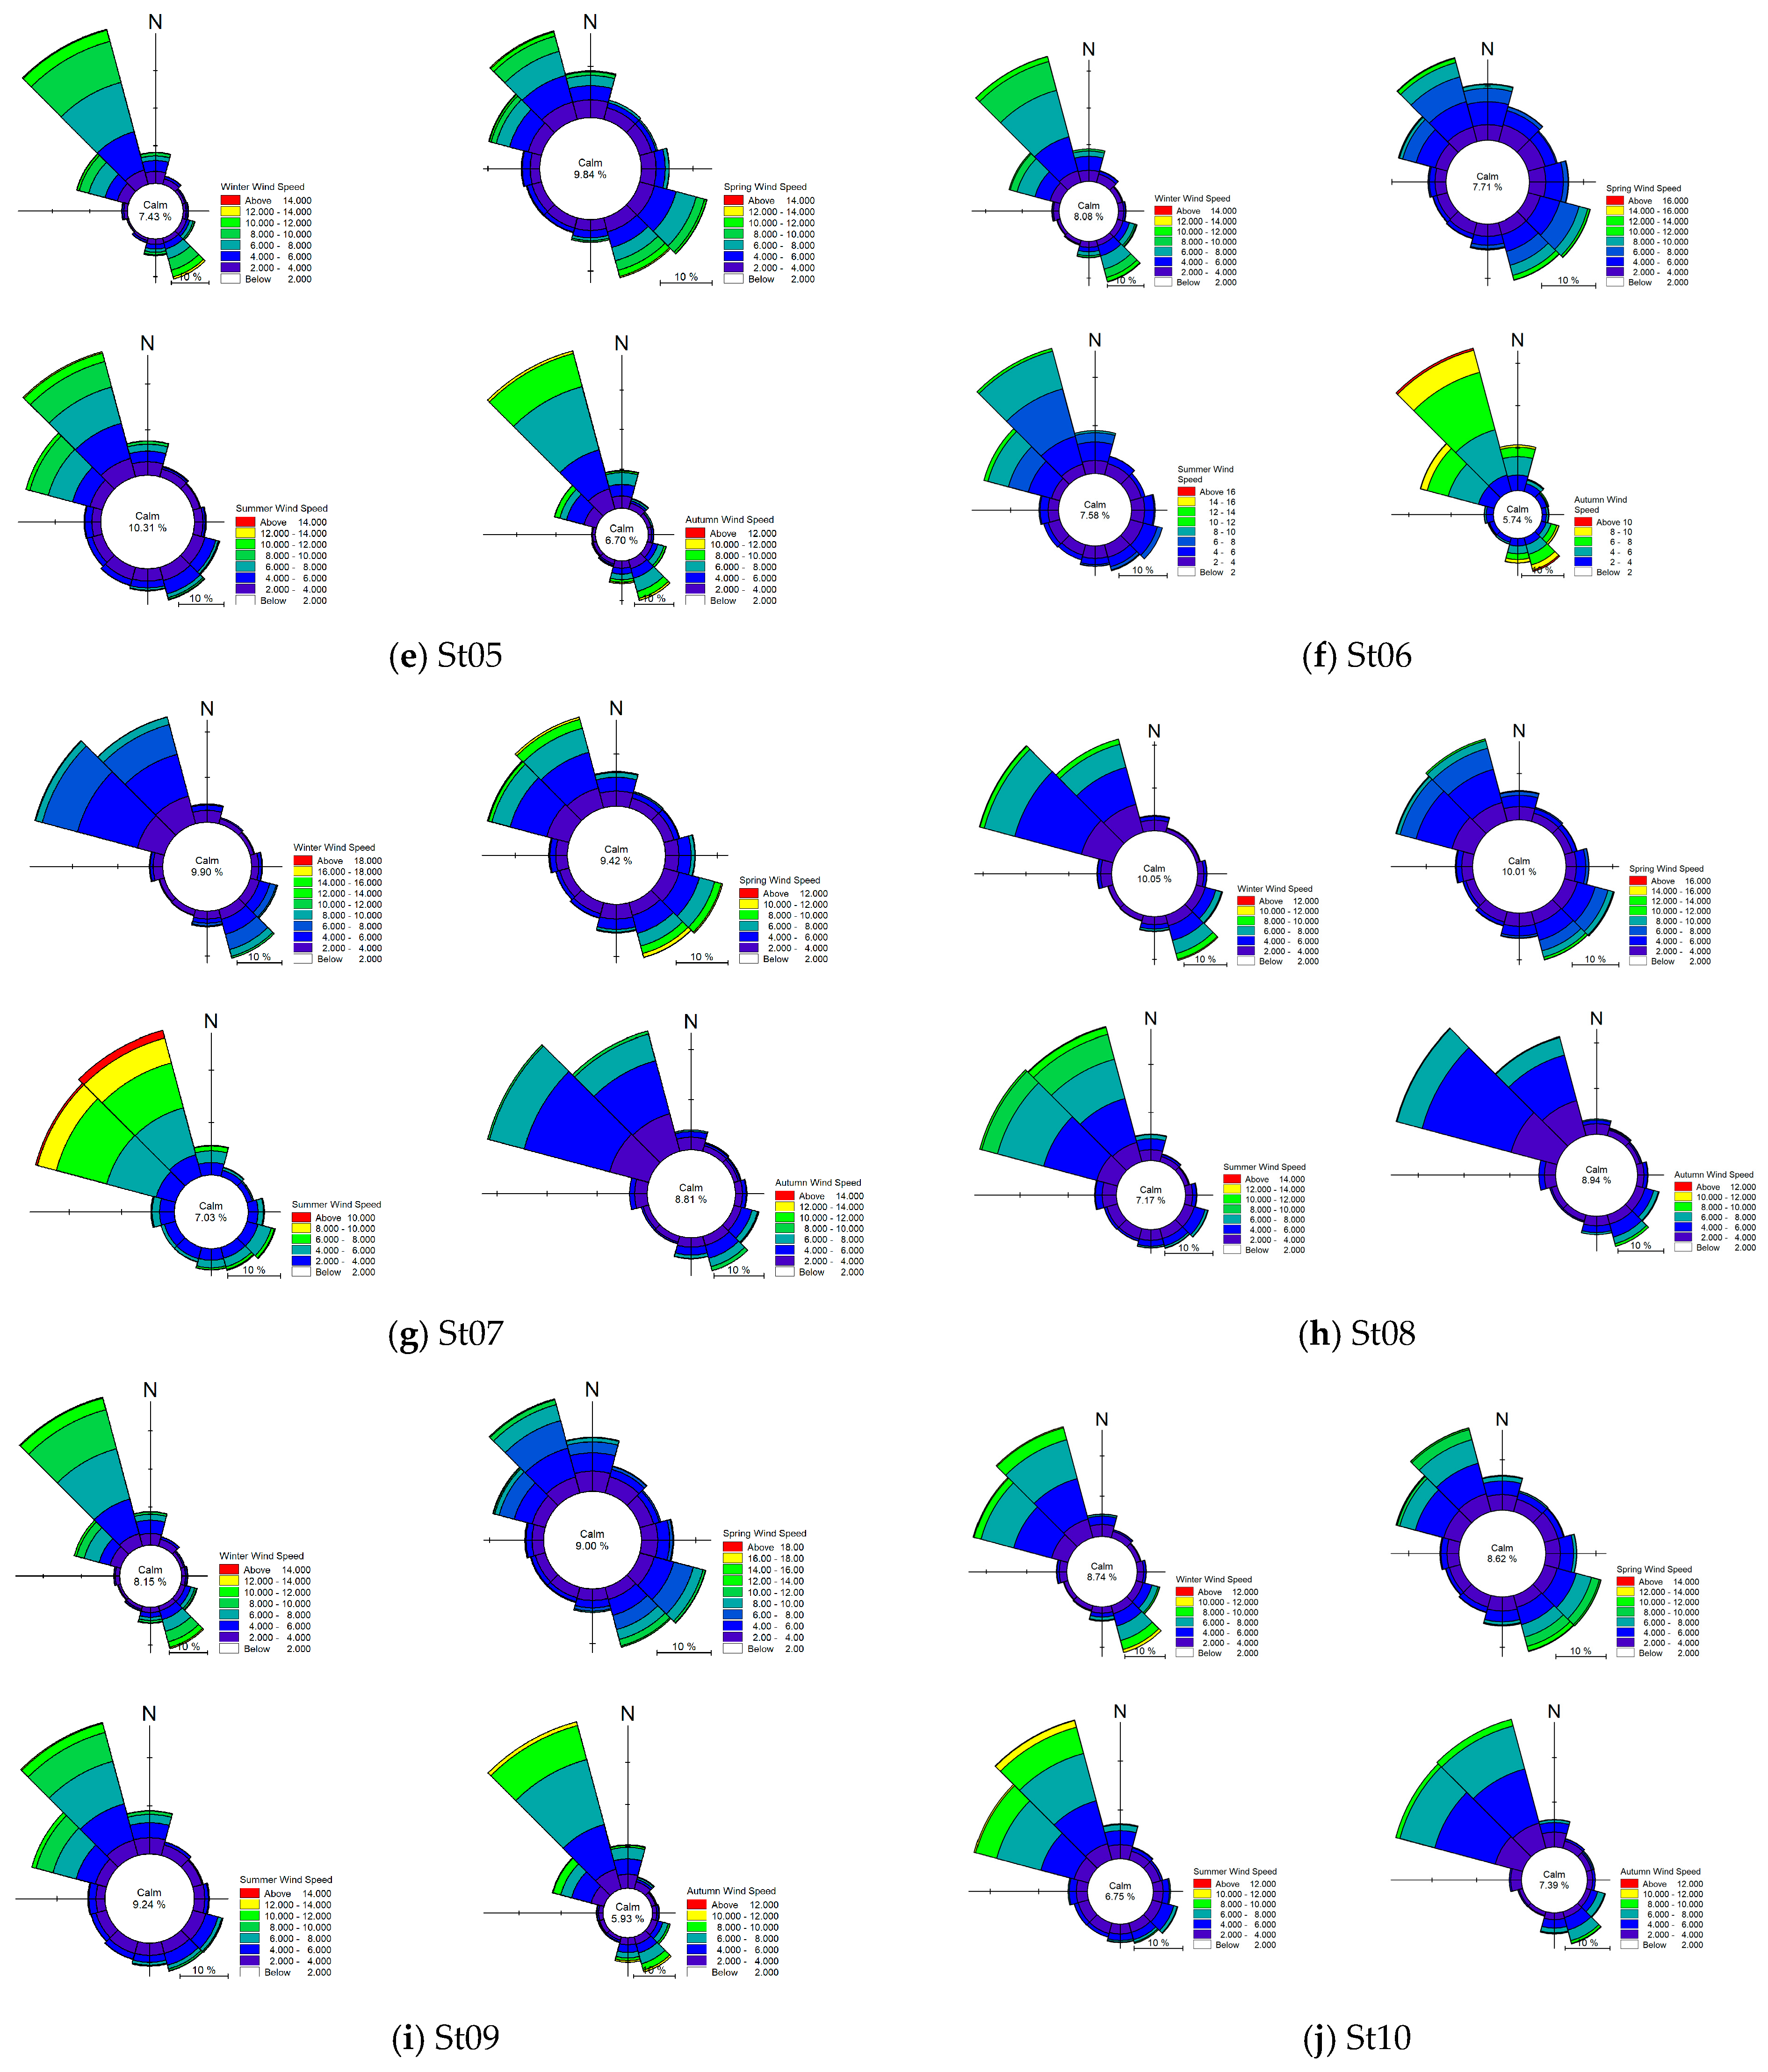
2.3. Kuwait’s Coastal and Offshore Wind Climate
The geographic location and seasonal meteorological patterns shape Kuwait’s coastal and offshore wind climate. According to the Kuwait Central Statistical Bureau annual reports [
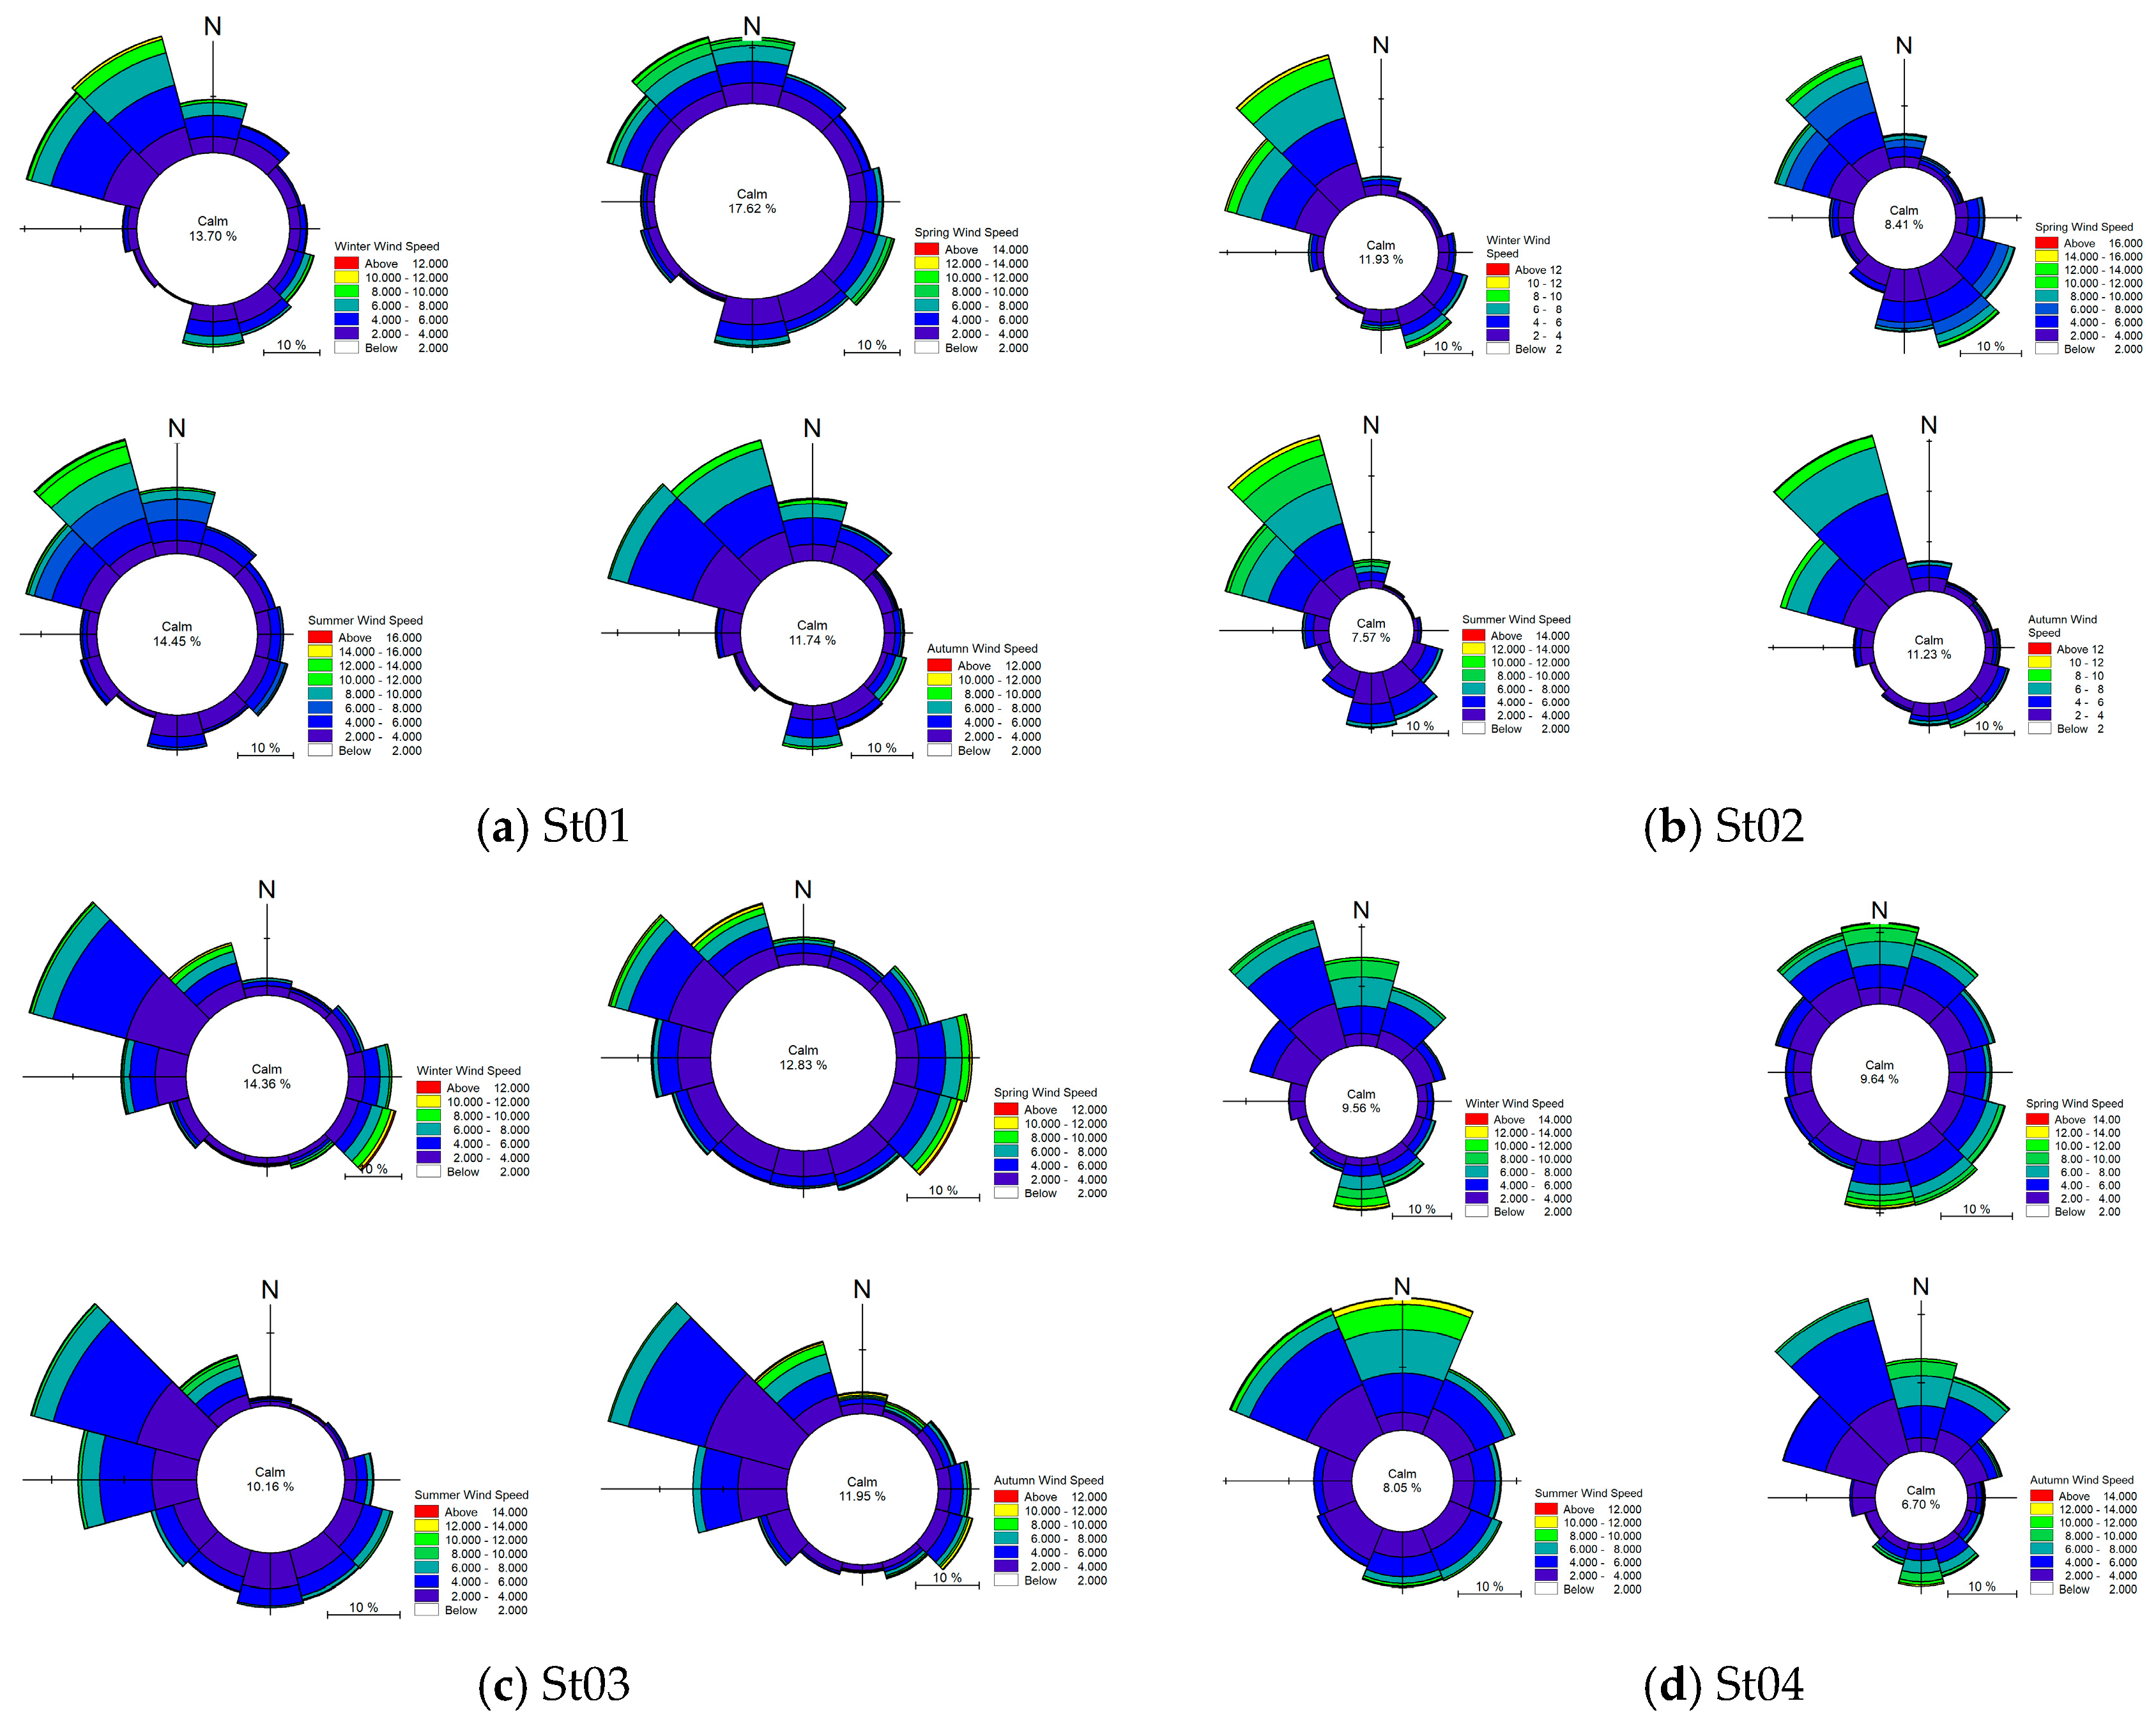
39], during winter (6 December–15 February), the northwesterly winds are persistent, although the occurrence of occasional southeasterly winds. In spring (16 February–20 May), the wind patterns become more varied and dynamic. Mild spring (16 February–20 May) is characterized by easterly and southeasterly winds and shifts to northwesterly during the warm spring (9 April–20 May). During summer (21 May–4 November), the wind blows from the northwest until July. As the humid summer sets in (20 July–30 August), southeasterly winds dominate, particularly during late July and August. The transition to autumn (1 September–4 November) sees a decline in the intensity of the winds, and by autumn (5 November–5 December), wind patterns calm significantly. The measured wind data from the ten stations (
Figure 2) confirm the Kuwait Central Statistical Bureau report and show that the region experiences prevailing northwesterly winds known as Shamal, influenced by pressure gradients between the Arabian Peninsula and surrounding water bodies.
The measured wind data and
Figure 2 indicate that coastal stations have mean wind speeds ranging from 4.3 to 5.1 m/s, with maximum wind speeds between 13.4 and 20.5 m/s. The prevailing wind directions at these stations generally come from the northwest sector, specifically between 303° and 350°, with only minor variations.
In contrast, offshore stations show higher mean wind speeds, ranging from 4.2 to 6.3 m/s, with maximum wind speeds consistently between 14.8 and 17.6 m/s. The prevailing wind directions for offshore stations are also predominantly from the northwest, specifically between 299° and 325°, with minimal variability. Offshore stations experience higher and more consistent average wind speeds due to the reduced surface roughness over open water. In contrast, coastal stations exhibit slightly lower mean speeds but can experience occasional high gusts.
All stations are dominated by northwest winds, reflecting the regional wind patterns. Coastal stations display greater variability in wind speed, likely due to the effects of terrain, structures, and land–sea interactions. On the other hand, offshore stations demonstrate more uniform wind magnitudes with fewer fluctuations.
Overall, the data indicate that offshore stations experience higher and more stable wind speeds, while coastal stations are characterized by localized peaks and greater variability influenced by topographical factors.
3. Methodology
The study starts by statistically analyzing the measured and ERA5 data to obtain significant insights into the central tendency, variability, and distribution of wind speeds. The analysis incorporates mean (
m), median (
md), and mode (
me) to capture the average, middle, and most frequently occurring wind speeds. Also, the normalized standard deviation (
σn) is analyzed to measure the dispersion of the ERA5 wind speeds relative to the measured wind speeds, providing an evaluation for the variability of the model’s predictions relative to the observed variability, where values close to 1 suggest a good match in variability between predictions and observations.
σn is calculated as follows [
40]:
where
σp is the standard deviation of the predicted values,
σo is the standard deviation of the observed values,
P is the predicted values,
O is the observed values,
n is the number of observations, and the overbar indicates mean values through time. To further characterize the distribution, skewness (
sk) and kurtosis (
ku) are evaluated to measure the symmetry and peakedness of the data, while range (
Ra), interquartile range (
IQR), and percentiles (25th, 75th, and 90th) provide a comprehensive picture of data spread and variability.
Subsequently, the correlation between observed wind speeds and the ERA5 predictions is evaluated using Pearson (
), Spearman (
), and Kendall (
) correlation coefficients. These metrics evaluate different types of relationships: Pearson assesses linear relationships, providing insights into the strength and direction of proportional relationships between observed and predicted values; Spearman evaluates the rank-order relationships and is suitable for monotonic but not necessarily linear relationships; and Kendall evaluates rank-order relationships, focusing on concordance and discordance between pairs. These measures are crucial for understanding the variability and complexity of wind speed dynamics, which may not always follow linear patterns. By employing these diverse statistical tools, the analysis captures various correlation dimensions, comprehensively evaluating the model’s performance across different scenarios. The formulas for the three correlation coefficients are as follows [
41,
42,
43]:
where
di is the difference between the ranks of corresponding variables,
C is the number of concordant pairs, and
D is the number of discordant pairs.
Additionally, the performance of ERA5 data is assessed using multiple goodness of fit (gof) measures: error metrics and agreement indices. The error metrics include the
σn, normalized mean error (
NME), normalized centered root-mean-square error (
NCRMSE), and standard deviation of residuals (
σr). These metrics provide a nuanced evaluation of systematic discrepancies, variability, and residuals [
44,
45,
46,
47]:
NME measures the normalized bias between observed and predicted values, highlighting the systematic discrepancies and evaluating the mean bias in the model’s predictions, with negative values indicating an overall tendency to underestimate wind speeds. NCRMSE is a comprehensive metric that helps in model comparison. Unlike traditional root-mean-square error (RMSE), it centers the data around their respective means before computing the error and normalizing it against the observed values. Doing so offers deeper insights into the nature of modeling errors. σr evaluates the fluctuation in predictive accuracy by quantifying the variability of residuals between the predicted and observed values.
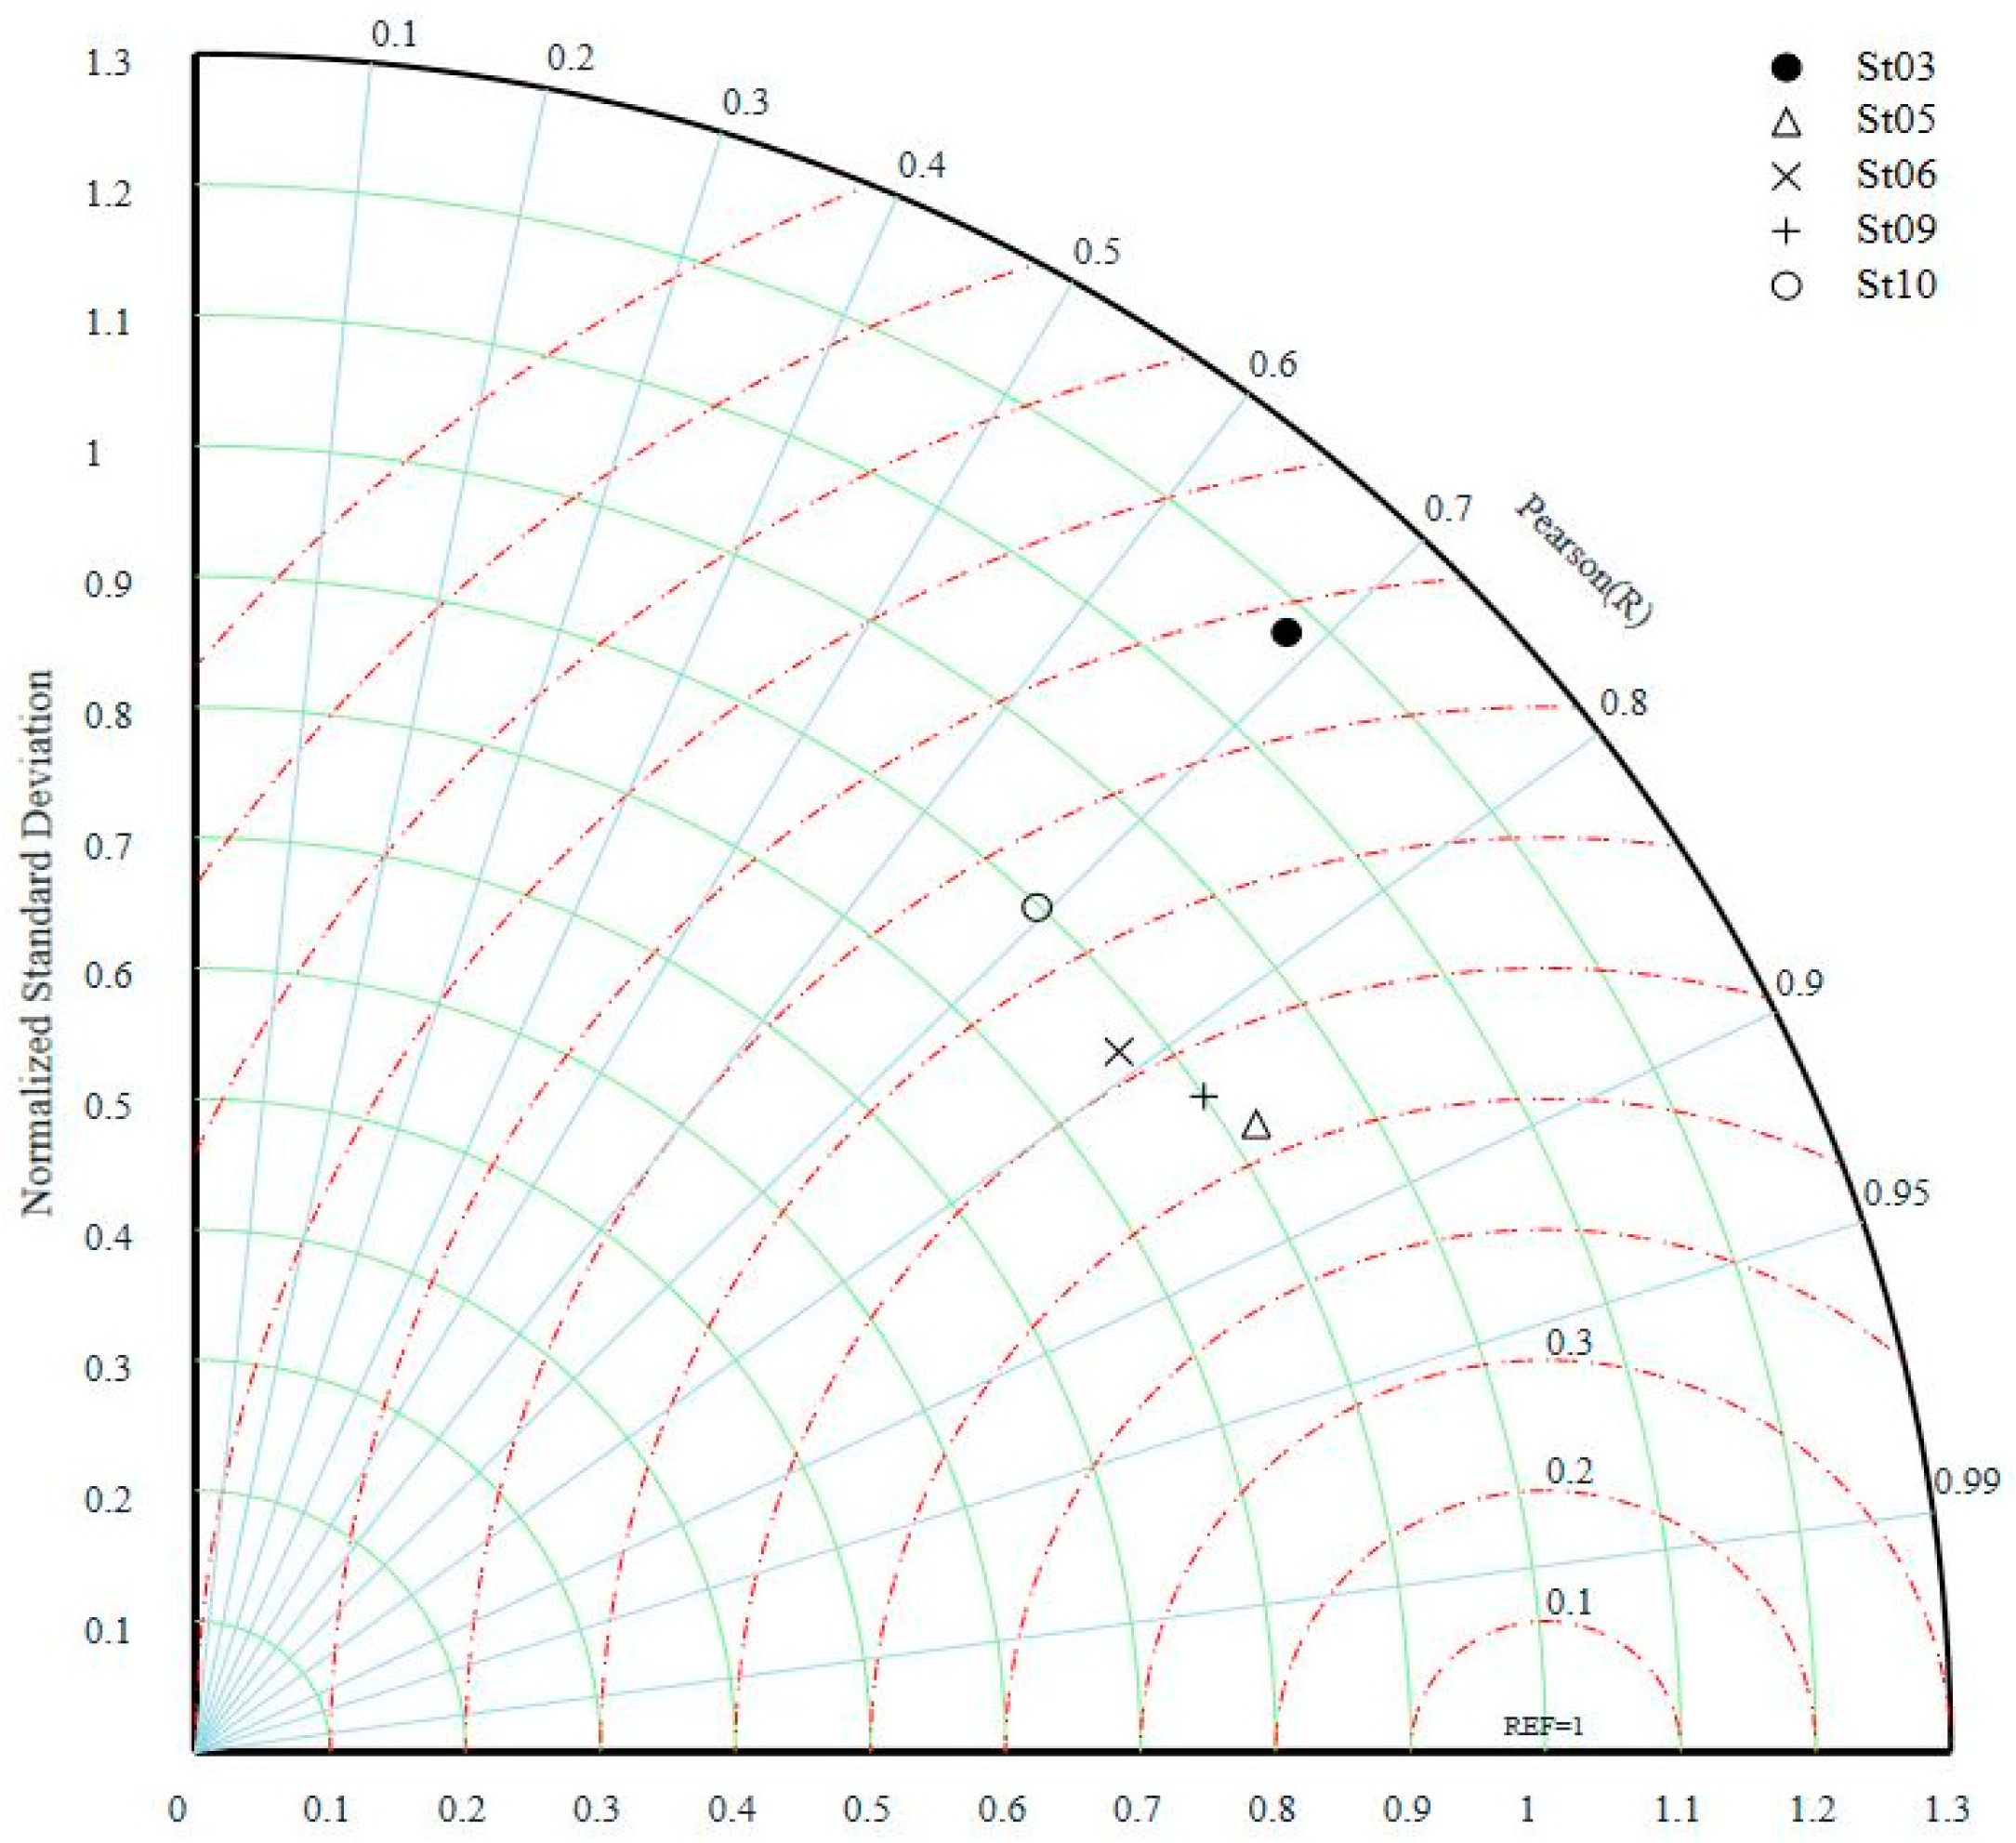
The Pearson’s correlation coefficient and the error metrics are visualized graphically using the normalized Taylor diagram (NTD) [
46], which summarizes how well patterns match each other in terms of their correlation, centered root-mean-square error (
RMSE), and
σn. The NTD provides a concise way to assess the performance of models or compare different datasets in terms of their statistical properties. This diagram is widely used in meteorology, oceanography, and climatology to provide a comprehensive overview of model performance and accuracy when comparing different simulations or observational datasets [
18,
48,
49,
50]. The diagram shows the correlation coefficient on the angular axis, the normalized standard deviation of modeled and observed data on the radial distance, and the centered root-mean-square difference between the two on the distance from a reference point. In a normalized Taylor diagram, the reference point is usually positioned at coordinates (1.0, 0.0), indicating an exact match in standard deviation and correlation.
Agreement indices [
47,
51,
52,
53], including the Nash–Sutcliffe coefficient (
E), index of agreement (
IA), coefficient of determination (
R2), and fraction of model predictions within a factor of two of observations (
FAC2), evaluate model fidelity. These indices assess the proportion of explained variance, overall fit, and prediction accuracy. The coefficient of determination (
R2) measures the proportion of variation in the observed data that the model can explain, ranging from 0 to 1, with 1 indicating a perfect fit. The Nash–Sutcliffe coefficient (
E) ranges from −∞ to 1, where higher values indicate better model performance. An
E value of 0 implies that the model’s predictions are no better than a naive prediction based on the mean of the observed values. The index of agreement (
IA), ranging from 0 to 1, evaluates model fit by considering the sum of squared residuals and penalizing larger deviations more heavily. It accounts for the maximum possible error for each residual, with higher
IA values indicating better agreement. The fraction of model predictions within a factor of two (
FAC2) assesses accuracy by calculating the proportion of predictions that fall within a factor of two of the corresponding observed values. An
FAC2 value of 1 represents perfect accuracy, where predictions fall neither more than double nor less than half of the observed value. High
R2,
E,
IA, and
FAC2 values generally indicate a strong model performance, whereas low values suggest inadequate model performance. The agreement indices are given by [
47,
51,
52,
53]:
Several studies commonly use these statistical indicators to evaluate the accuracy of climate, wave, and environmental models [
3,
54,
55,
56,
57,
58].
Additionally, advanced metrics such as the Perkins Skill Score (
PSS) [
59] and the Brier Skill Score (
BSS) [
60,
61] are employed to assess distributional and probabilistic accuracy. The
PSS measures the overlap of probability density functions (PDFs) between ERA5 and observed data and is calculated by summing the minimum values of the two PDFs across all bins [
59]:
where
Pm and
Po are the frequencies of values for model predictions and observations, respectively. The
PSS ranges from 0 to 1, where 1 indicates perfect overlap between the modeled and observed distributions, and 0 indicates no overlap.
The Brier Skill Score (
BSS) evaluates probabilistic accuracy relative to a reference forecast based on the Brier Score (
BS):
where
N is the total number of forecasts,
pi is the predicted probability of the
i-th event, and
oi is the observed outcome (1 if the event occurred, 0 if it did not).
BSm is the Brier Score of the model being evaluated, and
BSref is the Brier Score of the reference forecast. The
BSS ranges from −∞ to 1. A
BSS value of 1 indicates a perfect forecast, 0 suggests that the model performs no better than the reference forecast, and negative values imply that the model performs worse than the reference. The
BSS is an effective metric for evaluating the skill of probabilistic models and their ability to improve upon baseline predictions.
In addition to wind speed, wind direction patterns are analyzed, and the differences between ERA5 and measured data are visualized using the NTD, complemented by wind rose diagrams. Also, seasonal wind direction trends are examined to evaluate ERA5’s ability to reproduce climatological direction variability in Kuwait.
4. Results and Discussion
4.1. Initial Assessment
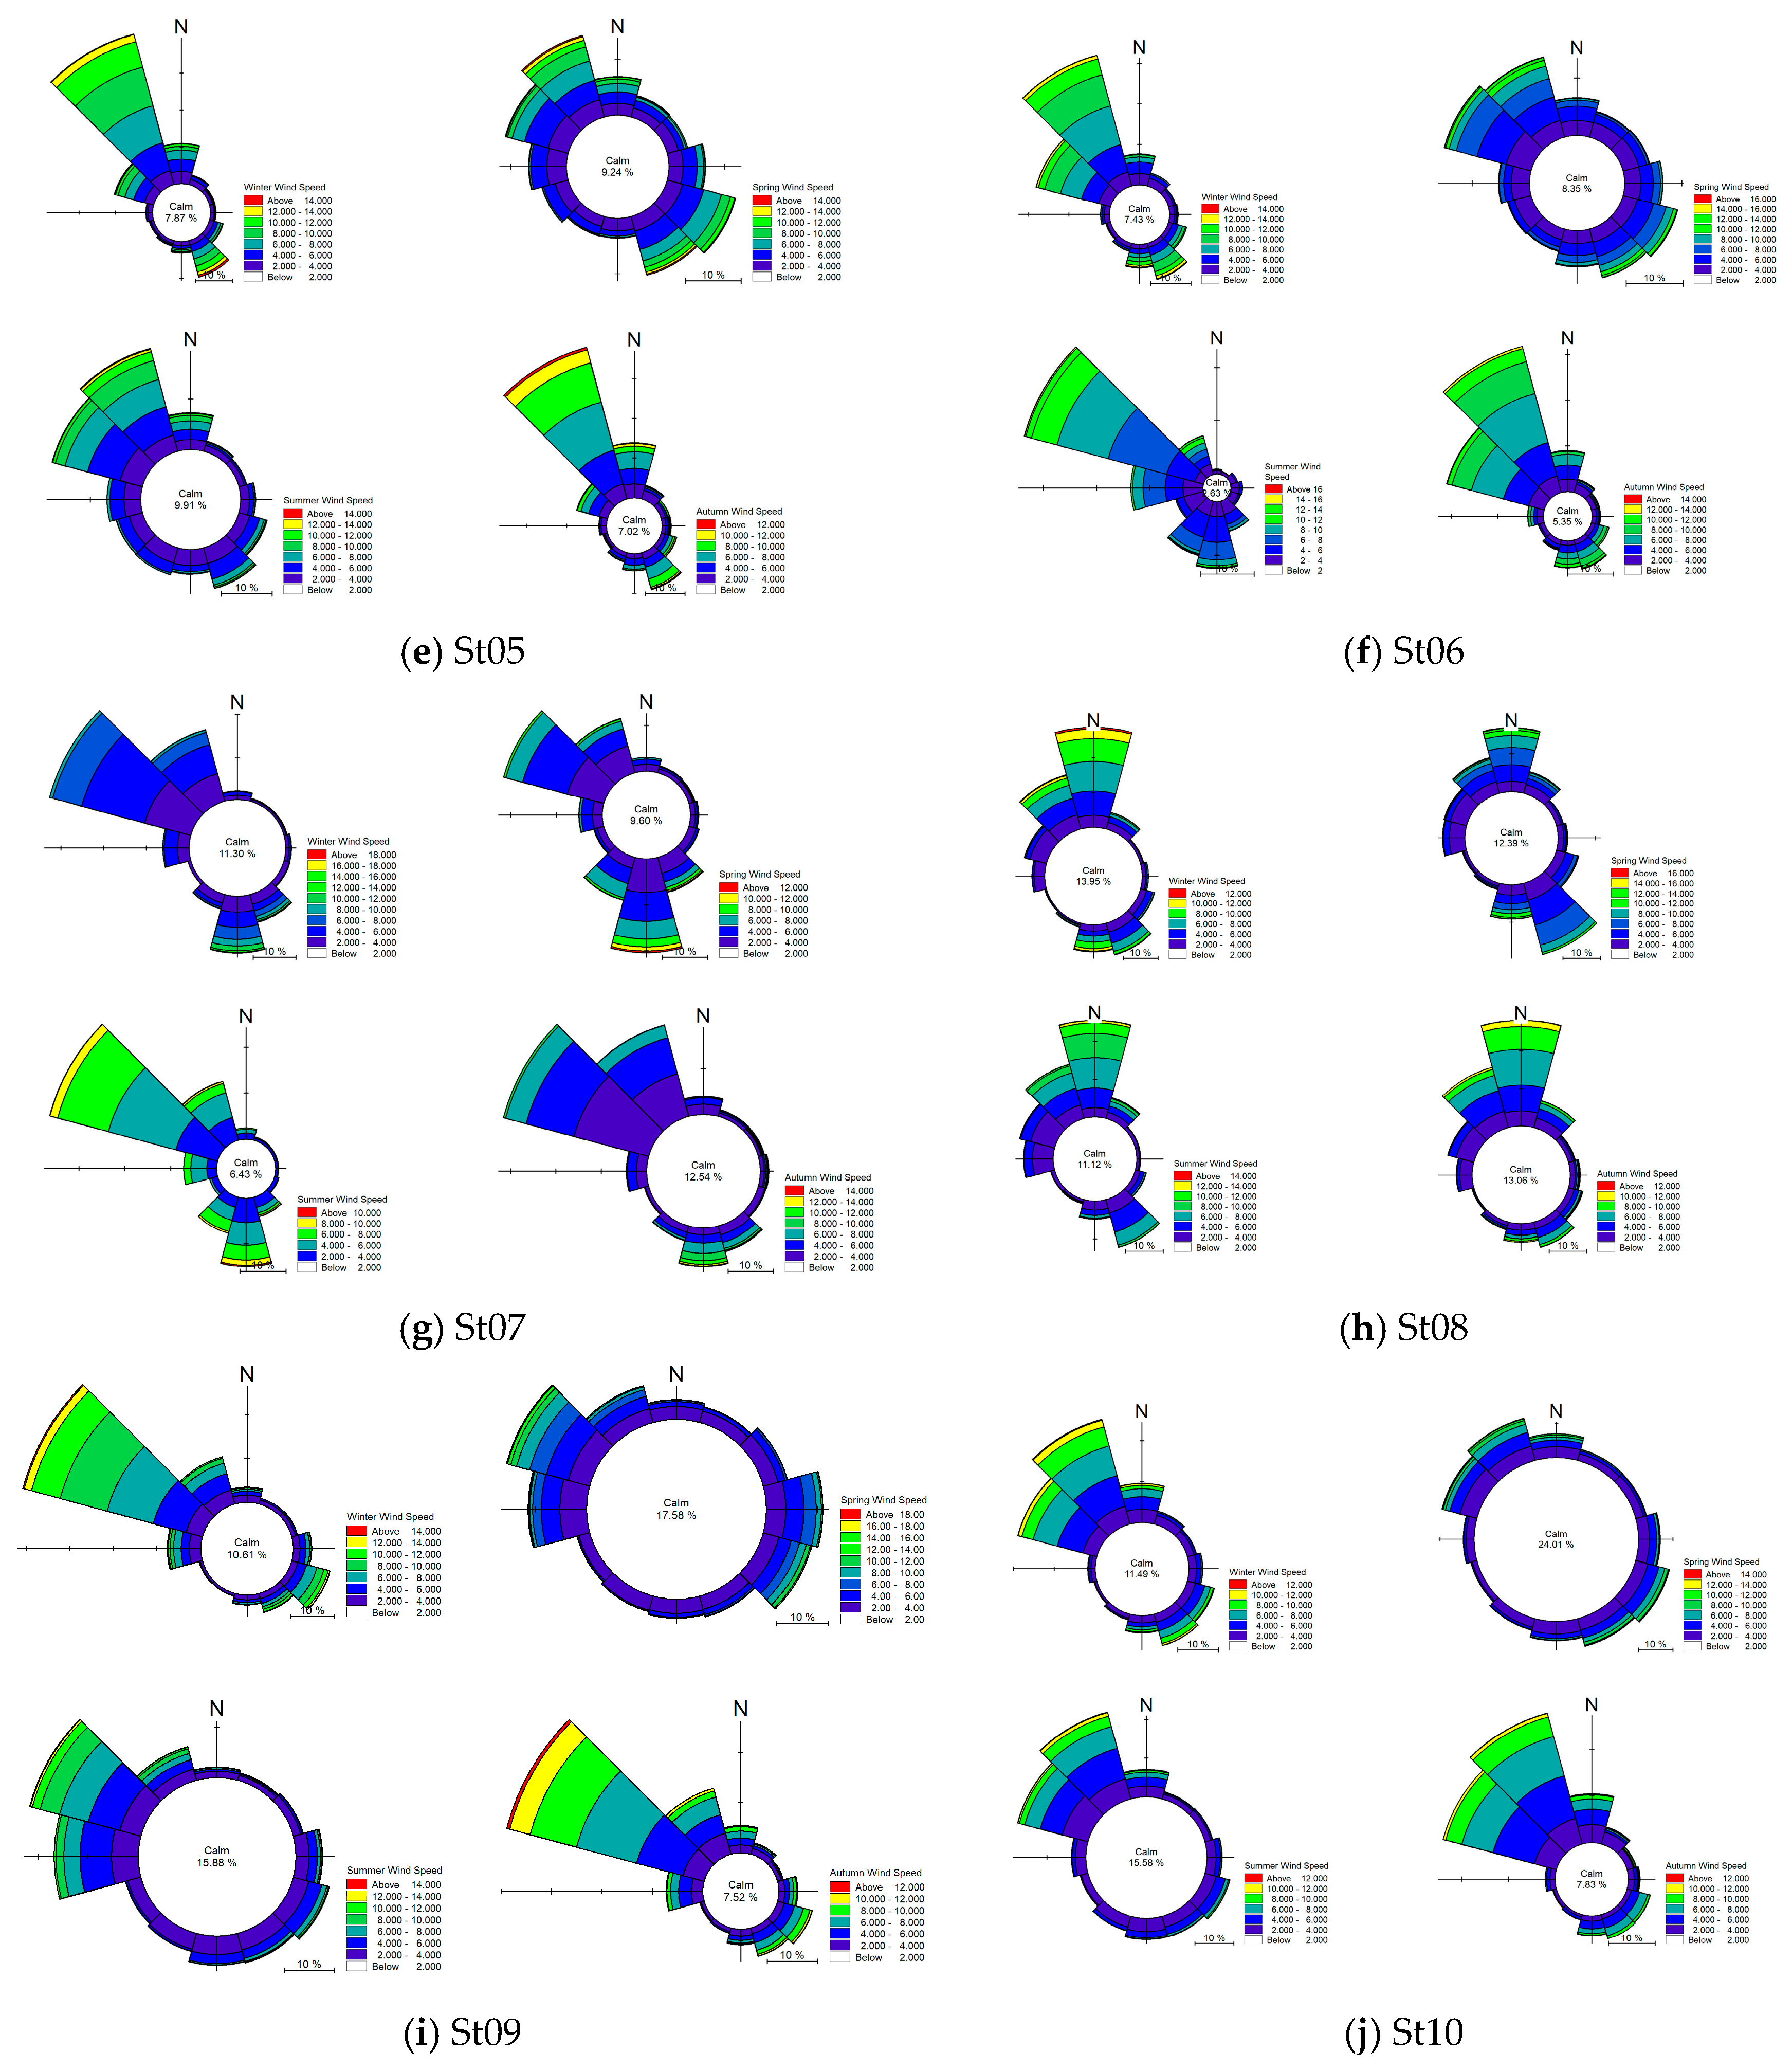
The analysis began by creating a scatter plot (
Figure 3), which compares the measured wind speeds at the ten stations and the predicted wind speeds from the ERA5 model. The graph indicates a strong correlation between the measured values and the ERA5 predictions, especially for wind speeds below 10 m/s. However, it also reveals that the ERA5 model underestimates higher wind speeds. The level of underestimation varies across the stations, suggesting that the model’s accuracy differs for each station. Notably, some studies [
14,
18,
62] highlight the challenges reanalysis datasets face in accurately representing high wind speeds. This limitation arises because reanalysis data represent averages over larger grid cells, encompassing several kilometers, rather than specific observational locations. As a result, the wind speed variability within these grid cells may be smoothed, potentially underestimating extreme values. However, the reanalysis datasets effectively capture broader patterns of near-surface wind variability [
15,
18,
19,
21,
22,
26,
28,
29,
30,
63,
64,
65,
66,
67]. However, the ERA5 model’s performance requires more detailed statistical analysis and a nuanced, station-specific interpretation of the model’s performance.
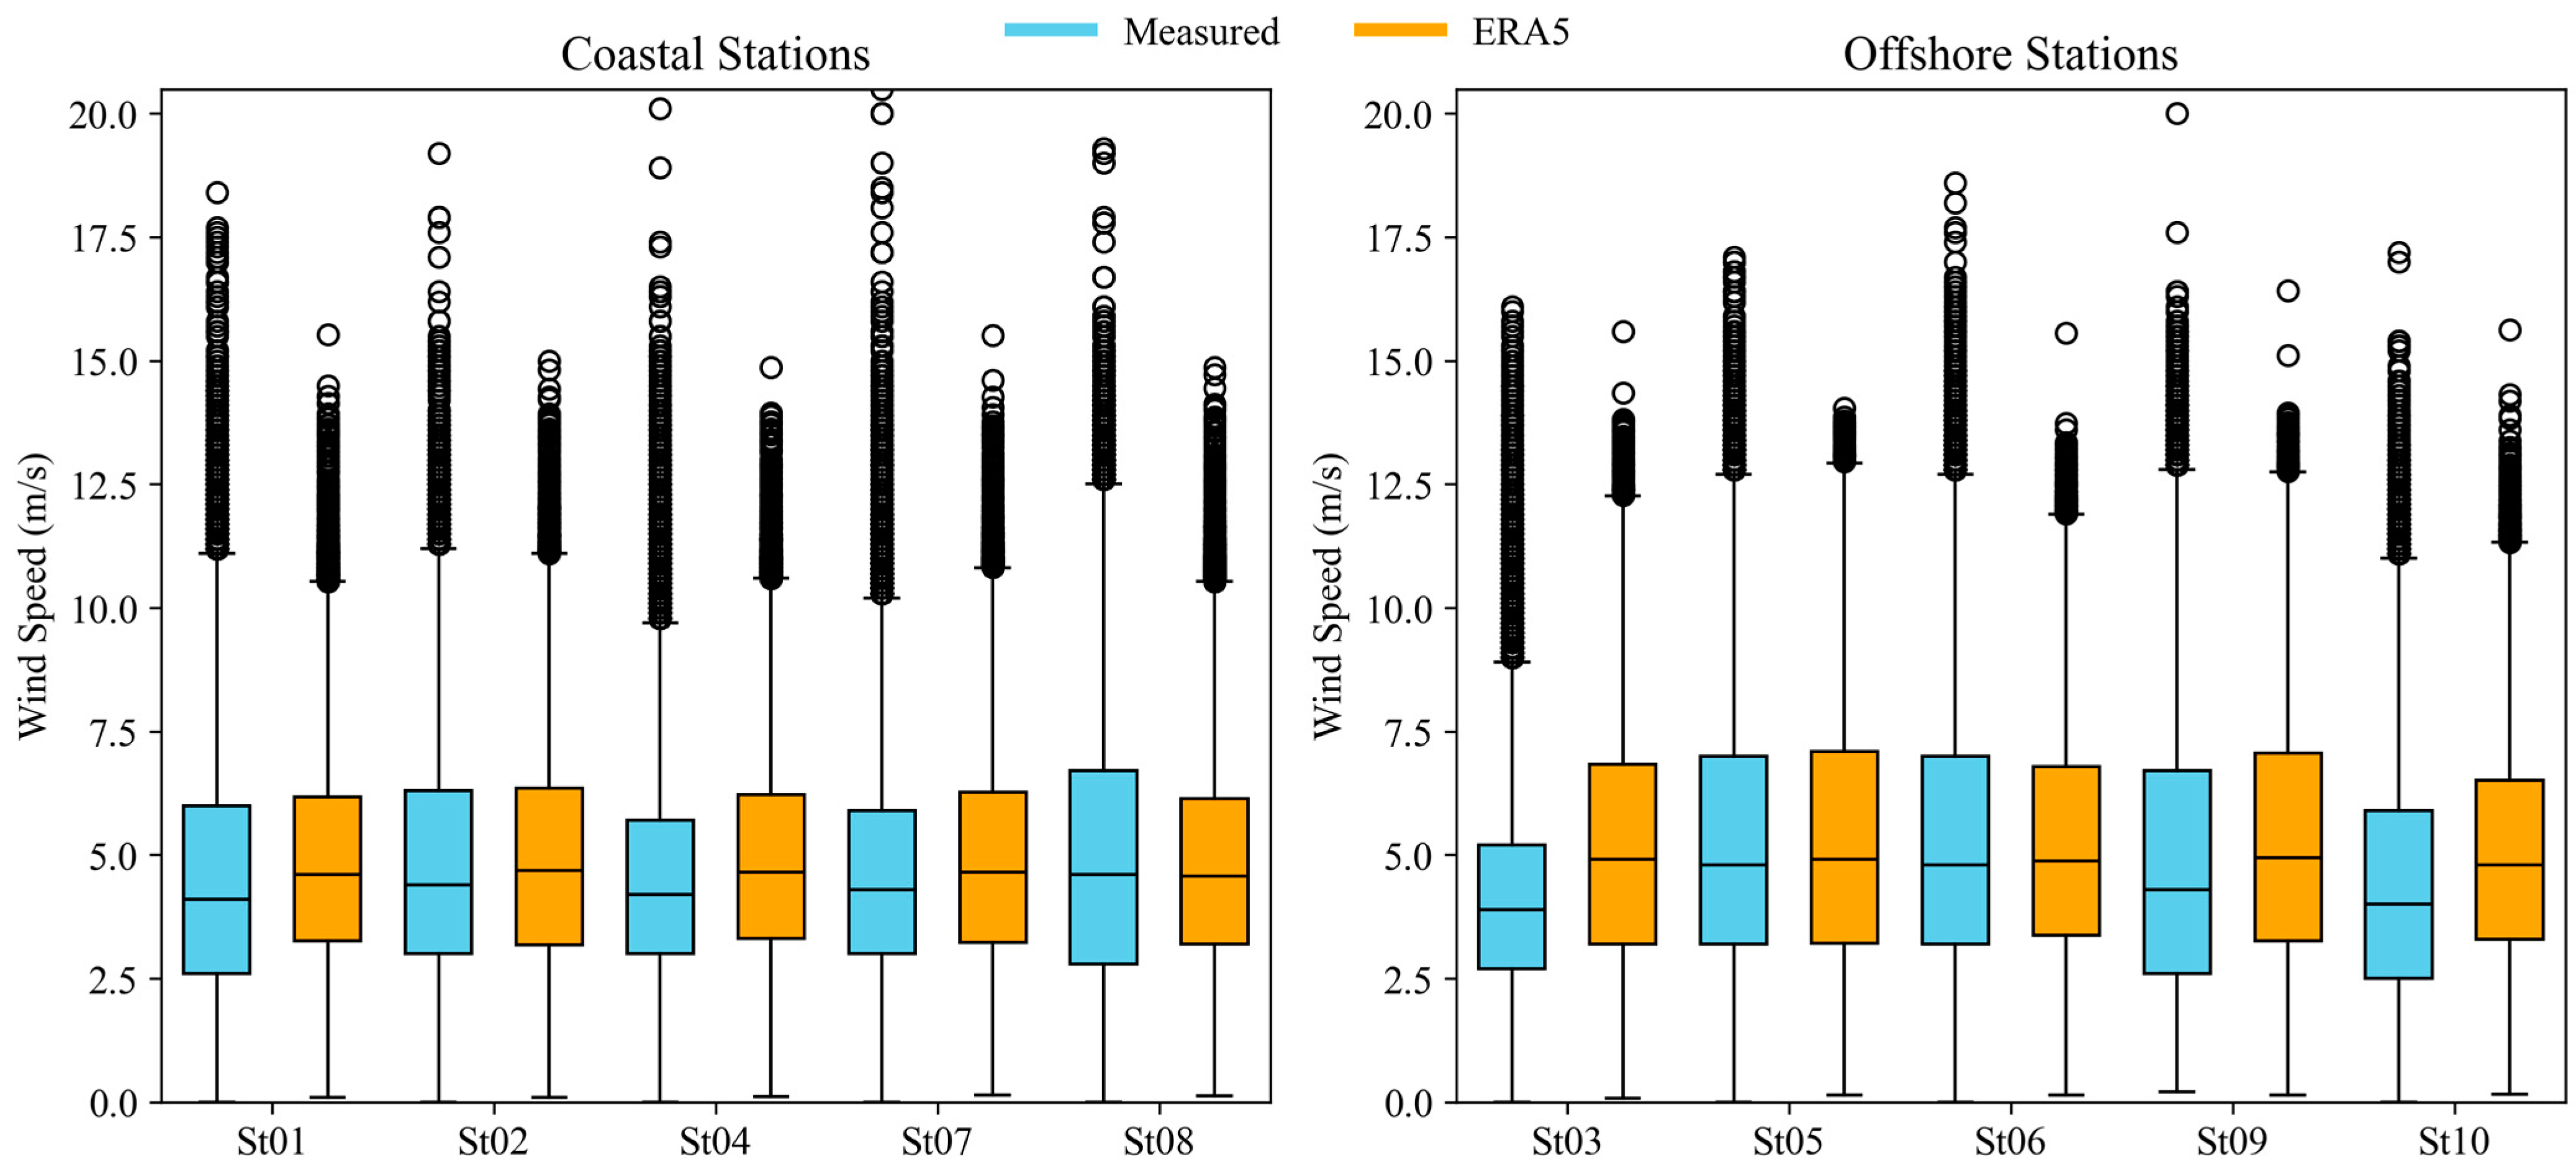
The initial statistics and
Figure 4 suggest that the ERA5 model slightly overestimates the mean and median wind speeds, with average differences of +0.25 m/s and +0.42 m/s, respectively. However, ERA5 underestimates wind speed variability, as shown by its lower standard deviation (−0.20 m/s) compared to measured data. The ERA5 wind speed distribution is less skewed (−0.39) and flatter (−0.82 kurtosis), indicating that the model may not accurately capture the asymmetry and likelihood of extreme wind speeds. Regarding data spread and extreme weather events, it has been observed that ERA5 data have a slightly narrower range, of approximately 3.45 m/s, than the measured data.
Figure 4 highlights these distinct patterns in measured and ERA5 datasets across coastal and offshore stations. The figure shows systematic differences in central tendency, variability, and extreme wind speed events. The higher median values in ERA5 data and the wider interquartile ranges (IQRs) in the measured data indicate that ERA5 does not fully capture localized variations in observed wind patterns. Extreme wind speeds, represented by the maximum values and outliers, are more pronounced in the measured data (e.g., maximum wind speeds of 20.5 m/s at St07 compared to 15.5 m/s in ERA5). This suggests that ERA5 underestimates the intensity of peak wind events, likely due to its spatial resolution and parameterization schemes, which smooth the influence of complex interactions between atmospheric conditions and the heterogeneous features of land and water surfaces.
The findings align with previous investigations that have identified biases in ERA5 wind speed estimates, particularly the underestimation of intense wind speeds offshore due to the model’s drag formulation [
18,
28,
68]. Gandoin and Garza [
68] documented an underestimation of intense wind speeds offshore in ERA5, attributing this bias to the model’s drag formulation and recommending correction methods. Similarly, studies evaluating ERA5’s performance in coastal areas, such as the assessment conducted in Bohai Bay [
28], have noted significant deviations between ERA5 reanalysis data and in situ measurements, emphasizing the need for regional validation of reanalysis datasets. However, the current analysis shows that while ERA5 effectively represents wind speeds at coastal and offshore stations by capturing central tendencies, it underestimates variability and extreme events. This underestimation is critical for applications requiring precise wind assessments, such as extreme weather forecasting and wind energy resource evaluation, particularly in regions with complex terrain [
26,
28]. Nonetheless, for some applications, such as modeling the general wave climate in moderate wave regions, these differences are minor and do not significantly affect the model’s overall reliability [
38,
64,
67]. To ensure accurate use of ERA5 data in analyses requiring precise wind speed variability and extreme characterization, applying necessary corrections and conducting regional validations remain essential [
64,
67].
Offshore, measured data exhibit broader variability and higher extreme wind speeds than ERA5, highlighting ERA5’s inability to capture episodic high-wind events accurately. The differences between coastal and offshore stations are primarily attributed to variations in surface roughness, atmospheric stability, and thermal interactions [
68,
69]. Coastal areas typically have higher surface roughness due to varied terrain and vegetation, which increases friction and reduces wind speeds. In contrast, offshore, the smoother sea surface offers less resistance, allowing winds to maintain higher velocities. Overland, increased turbulence caused by surface heating enhances vertical mixing, affecting wind speeds, whereas more stable conditions often prevail offshore [
69]. Differential heating between land and sea surfaces also creates sea and land breezes, low-level jets, and localized wind circulations and atmospheric conditions, significantly influencing coastal wind patterns and contributing to the observed discrepancies between coastal and offshore measurements and ERA5 predictions [
28,
69,
70,
71,
72].
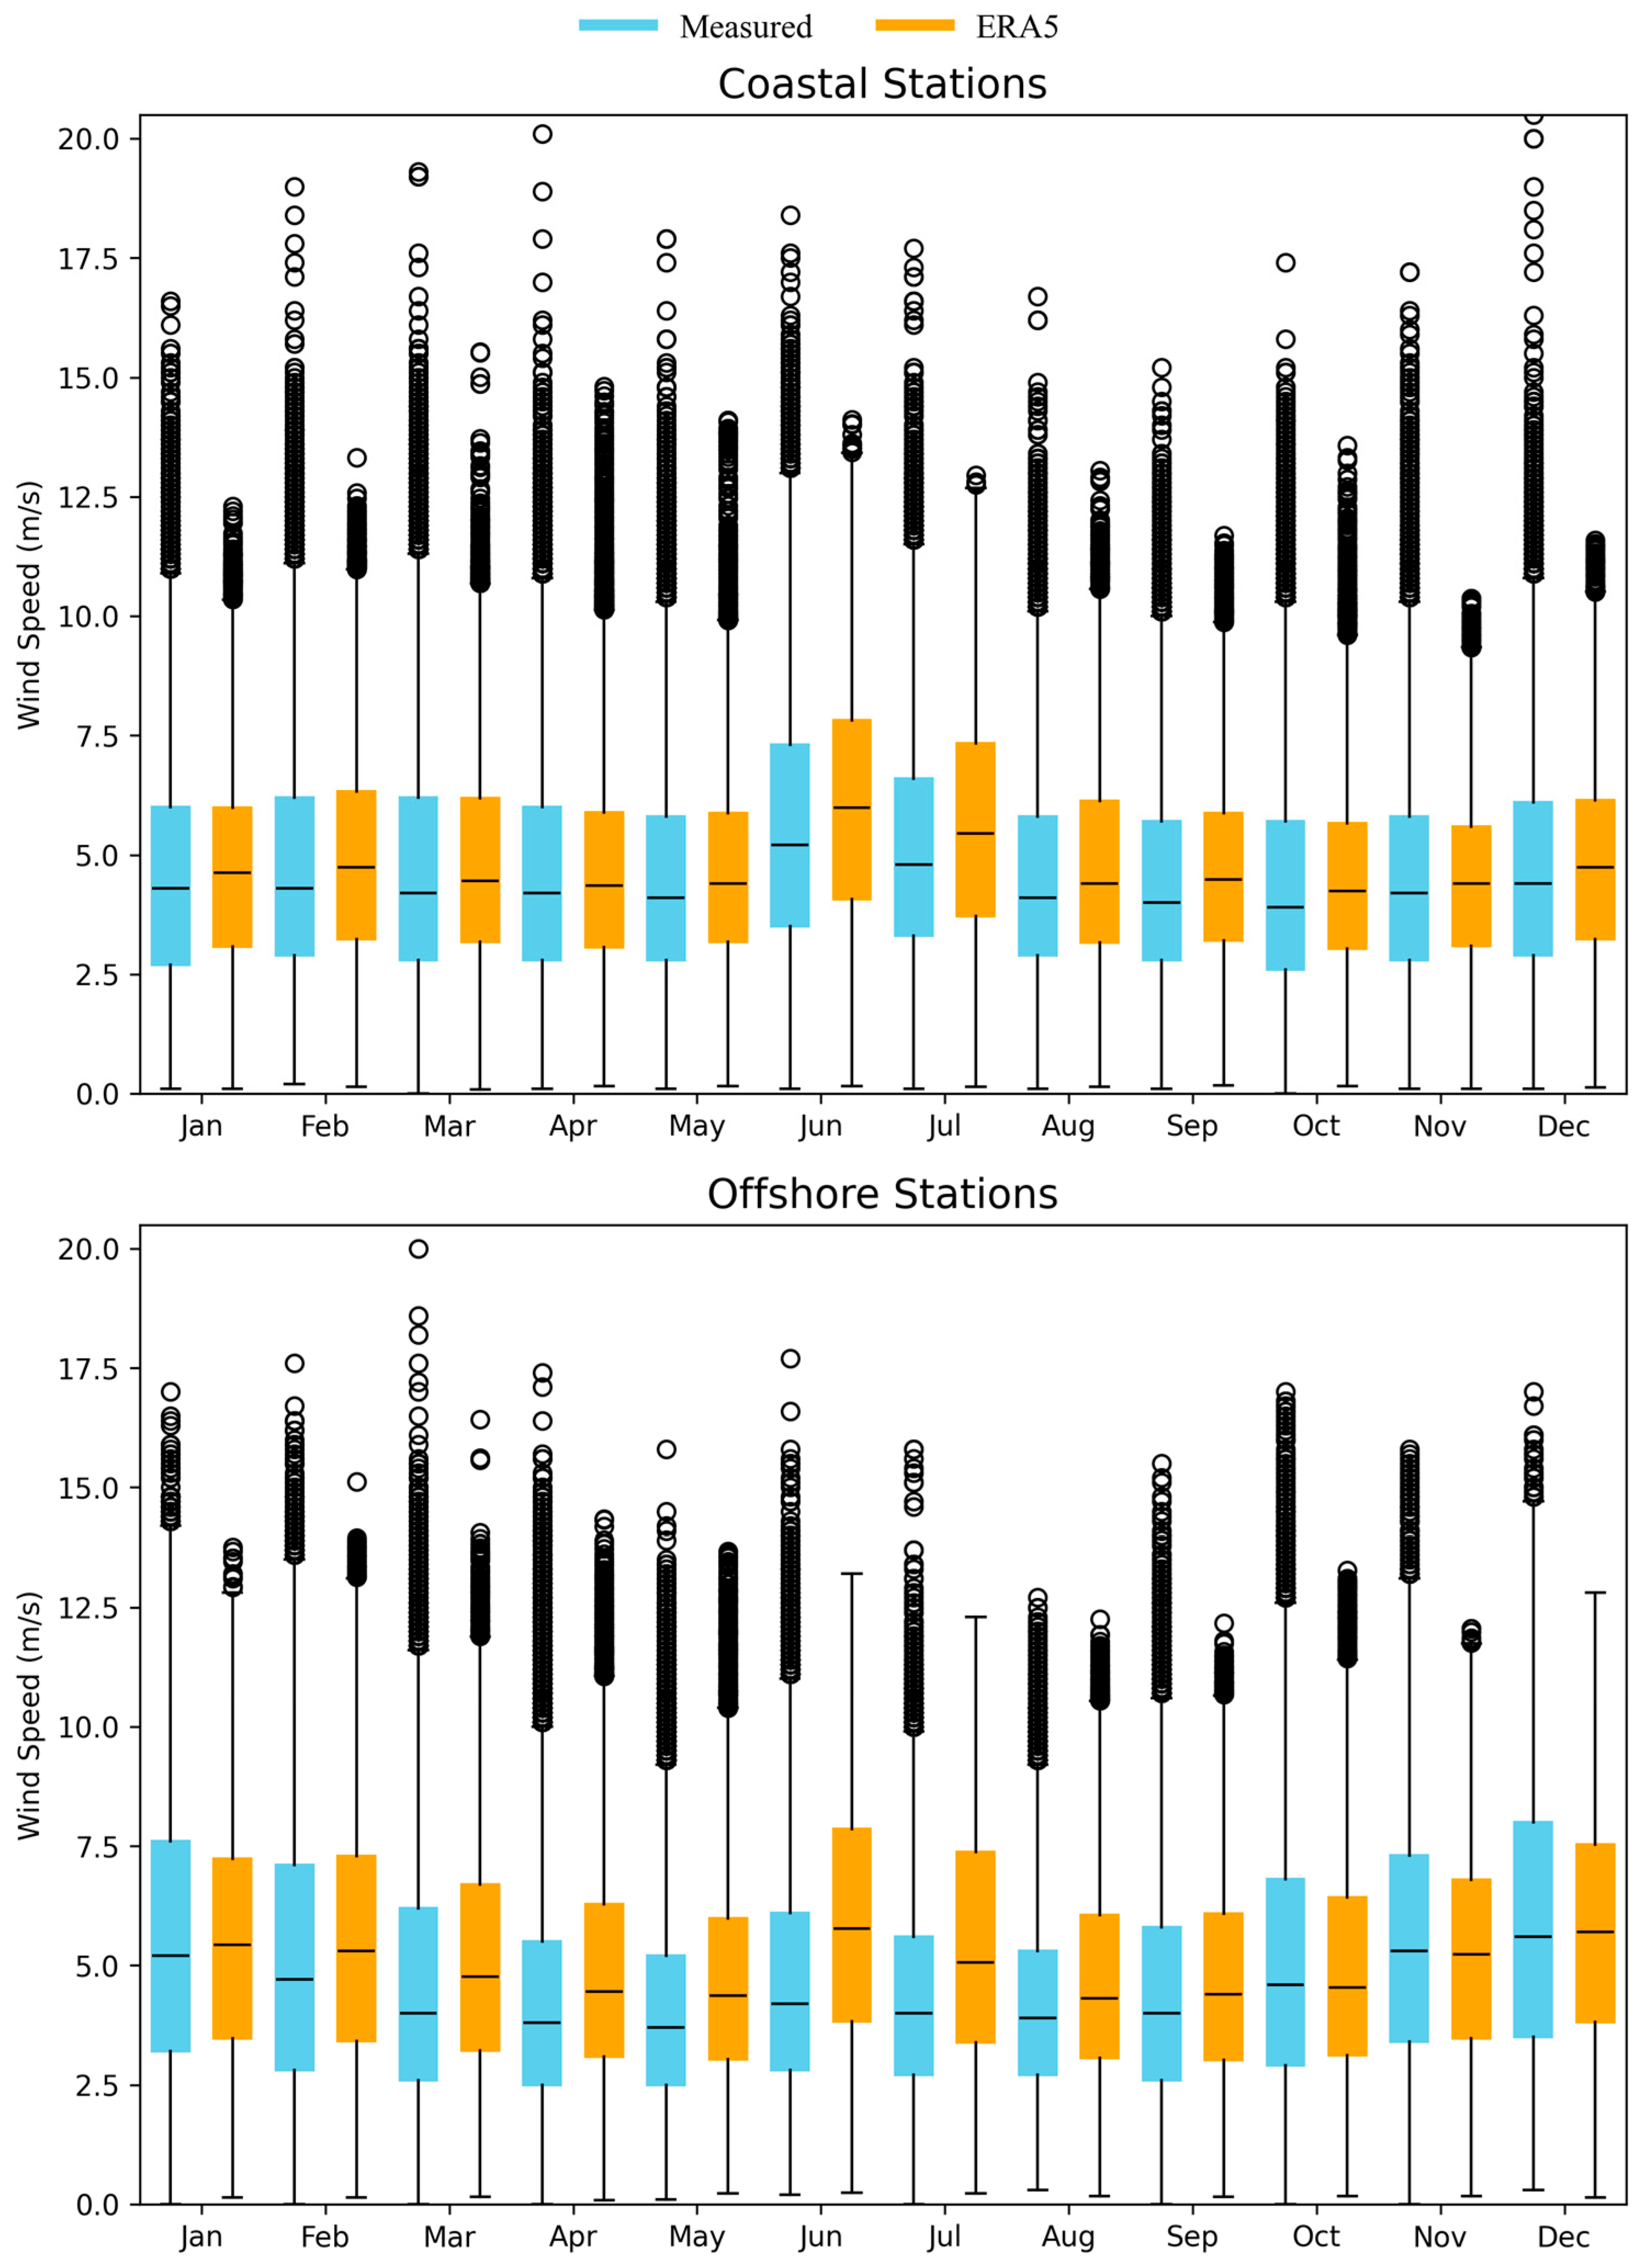
The annual cycle of wind speeds for coastal and offshore stations (
Figure 5) demonstrates a clear pattern of higher wind speeds in winter and lower wind speeds in summer. These results are consistent with earlier studies on wind speed annual cycles [
4,
73]. Coastal stations exhibit greater variability (for the same reasons mentioned earlier) than offshore stations across all seasons, particularly evident in the measured data’s interquartile ranges and whisker lengths. Median wind speeds at coastal and offshore stations peak during winter, with coastal stations showing slightly higher values than offshore stations. Measured data indicate an interquartile range of 2.5–7.0 m/s, with extreme values (whiskers) extending beyond 15 m/s. ERA5, while capturing the overall trend, underestimates both the upper extremes and the variability. This is consistent with findings by [
14], who noted that reanalysis datasets, including ERA5, tend to underestimate high seasonal wind speeds in regions with localized dynamics. Spring wind speeds decrease compared to winter but maintain moderate variability. Coastal stations exhibit higher median wind speeds and variability than offshore stations. ERA5 underrepresents the variability in the coastal stations’ measured data, a common limitation in reanalysis datasets when mesoscale phenomena, such as “Shamal” winds, are prominent during transitional seasons. Wind speeds are at their lowest in summer, with measured median values around 4 m/s for coastal stations and slightly lower offshore. ERA5 captures this seasonal minimum but overestimates wind speeds during June and July, where a slight measured peak occurs due to thermal wind circulations. Minola et al. [
18] reported similar overestimations of summer wind speeds in coastal regions, attributing them to the overrepresentation of thermal dynamics in reanalysis models. Wind speeds begin to increase as the region transitions to winter. Measured data indicate a wider variability at coastal stations compared to offshore, with occasional high wind events. ERA5 replicates the trend but underestimates extreme values, particularly in November. These findings are consistent with the observations of [
74], where reanalysis products smoothed out transitional season variability.
4.2. Correlation Between the Measured and ERA5 Wind Speeds and the Goodness of Fit Measures Across the Stations
The correlation coefficients between measured wind speeds and ERA5 reanalysis data (
Table 2) reveal notable differences between coastal and offshore stations. Offshore stations generally exhibit higher correlations, with
R values ranging from 0.69 to 0.85, indicating a strong linear relationship. In contrast, coastal stations show
R values between 0.59 and 0.77, suggesting a moderate linear relationship. This pattern is consistent across
ρ and
τ coefficients, which assess rank-based and monotonic relationships, respectively. The superior performance of ERA5 in offshore settings aligns with findings from previous studies. For instance, the authors of [
75] evaluated wind speed estimates from ERA5 and other reanalyses against measurements at various sites in Central Europe. They found that reanalyses exhibited the smallest errors at offshore locations, attributing this to the more homogeneous surface conditions over the ocean, which are easier to accurately model compared to the complex terrain and land–sea interactions at coastal sites. Conversely, the lower correlations observed at coastal stations may be due to complex wind patterns influenced by land–sea temperature contrasts, topography, and localized phenomena, such as sea breezes [
28,
69,
70,
71,
72]. These factors can introduce variability, which is challenging for reanalysis models to capture accurately. Hadjipetrou and Kyriakidis [
50] statistically compared high-resolution wind speed estimates against coastal meteorological observations in the Eastern Mediterranean. They reported that while reanalysis datasets provided valuable insights into regional wind variability, there were notable differences in model performance, particularly in capturing extreme values and localized wind patterns in coastal areas. Solbrekke et al. [
76] provided evidence of ERA5’s underestimation of intense wind speeds offshore, which could impact the correlation coefficients observed in this study. They discussed the reasons for this underestimation and proposed correction methods to improve the accuracy of ERA5 wind speed estimates. The higher number of correlation coefficients at offshore stations compared to coastal stations underscores the need for caution when utilizing reanalysis data in coastal zones, where localized factors may lead to reduced accuracy. Further research and potential model adjustments are necessary to enhance the reliability of reanalysis datasets in complex coastal environments.
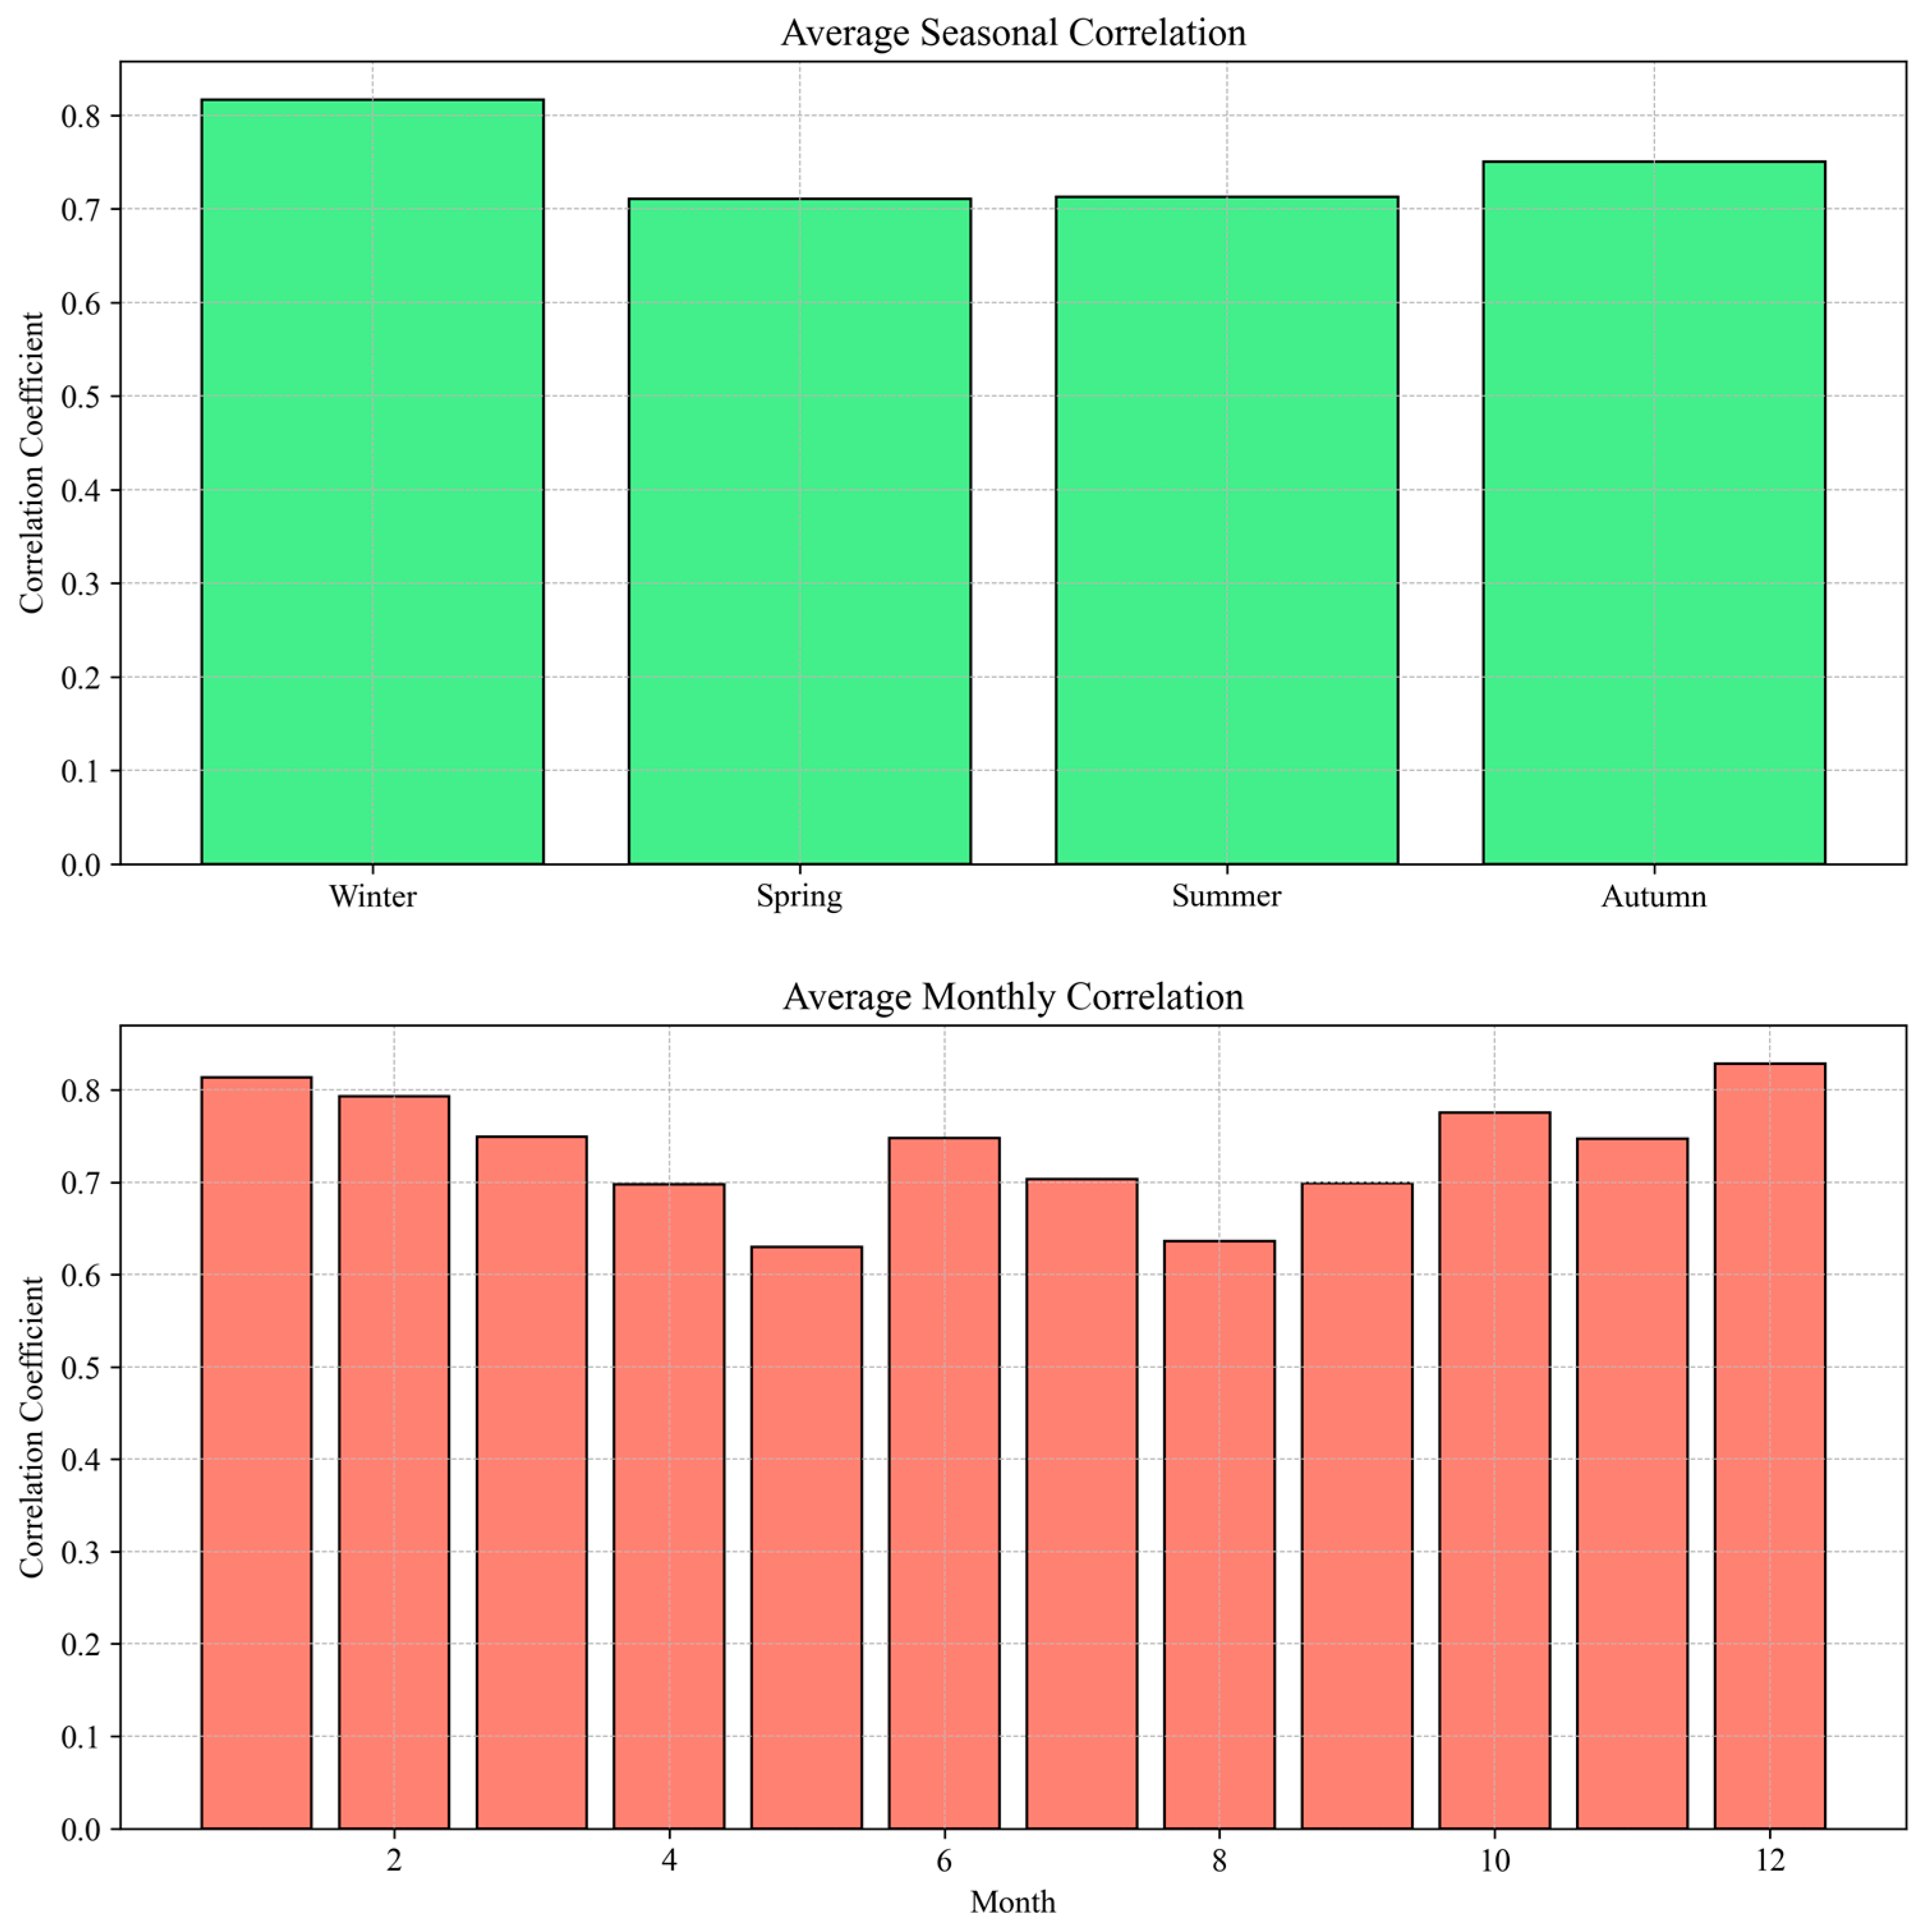
The seasonal Pearson’s correlation coefficient varies between 0.82 during the winter and 0.71 during spring and summer (
Figure 6). The figure indicates that the ERA5 reanalysis data align more closely with the wind speeds measured during the cooler periods. In contrast, spring and summer show relatively lower average correlations, suggesting a reduced level of agreement. These results can be attributed to the fact that winter is characterized by more stable atmospheric conditions and larger-scale synoptic wind systems well captured by reanalysis models (e.g., [
75]). Conversely, spring and summer often involve more localized phenomena, such as sea breezes, convective activity, and thermal gradients, which are more challenging to represent in reanalysis datasets [
50].
Monthly correlations (lower panel of
Figure 6) show significant variability. December, January, and February exhibit the highest correlation correlations, consistent with the findings for winter in the seasonal analysis. In contrast, correlations dip in May, July, August, and September, corresponding to the summer season when mesoscale and local effects, such as thermal circulations, become prominent.
The seasonal and monthly trends suggest that ERA5 reanalysis data are more reliable during periods dominated by large-scale meteorological systems (e.g., winter and late autumn) compared to those influenced by localized and mesoscale processes (e.g., late spring and summer). This finding aligns with prior studies that reported higher correlations between observational and reanalysis data in regions and times with more homogeneous and large-scale atmospheric dynamics [
50,
75]. The lower correlations observed during spring and summer emphasize the importance of considering localized wind variability in coastal and offshore wind studies. These results confirm the initial assessment findings and the previous studies showing that, in addition to local conditions, the model’s accuracy is influenced by a combination of atmospheric and physical factors, such as temperature, pressure gradients, sea–land breezes, surface roughness, measurement elevation, assimilation methods, data quality and density, boundary layer parameterization, and model resolution [
14,
18,
28,
77,
78,
79]. For example, stable atmospheric conditions, such as temperature inversions, suppress turbulent mixing, leading to underestimation of wind speeds, while convective instability can result in overestimation [
79].
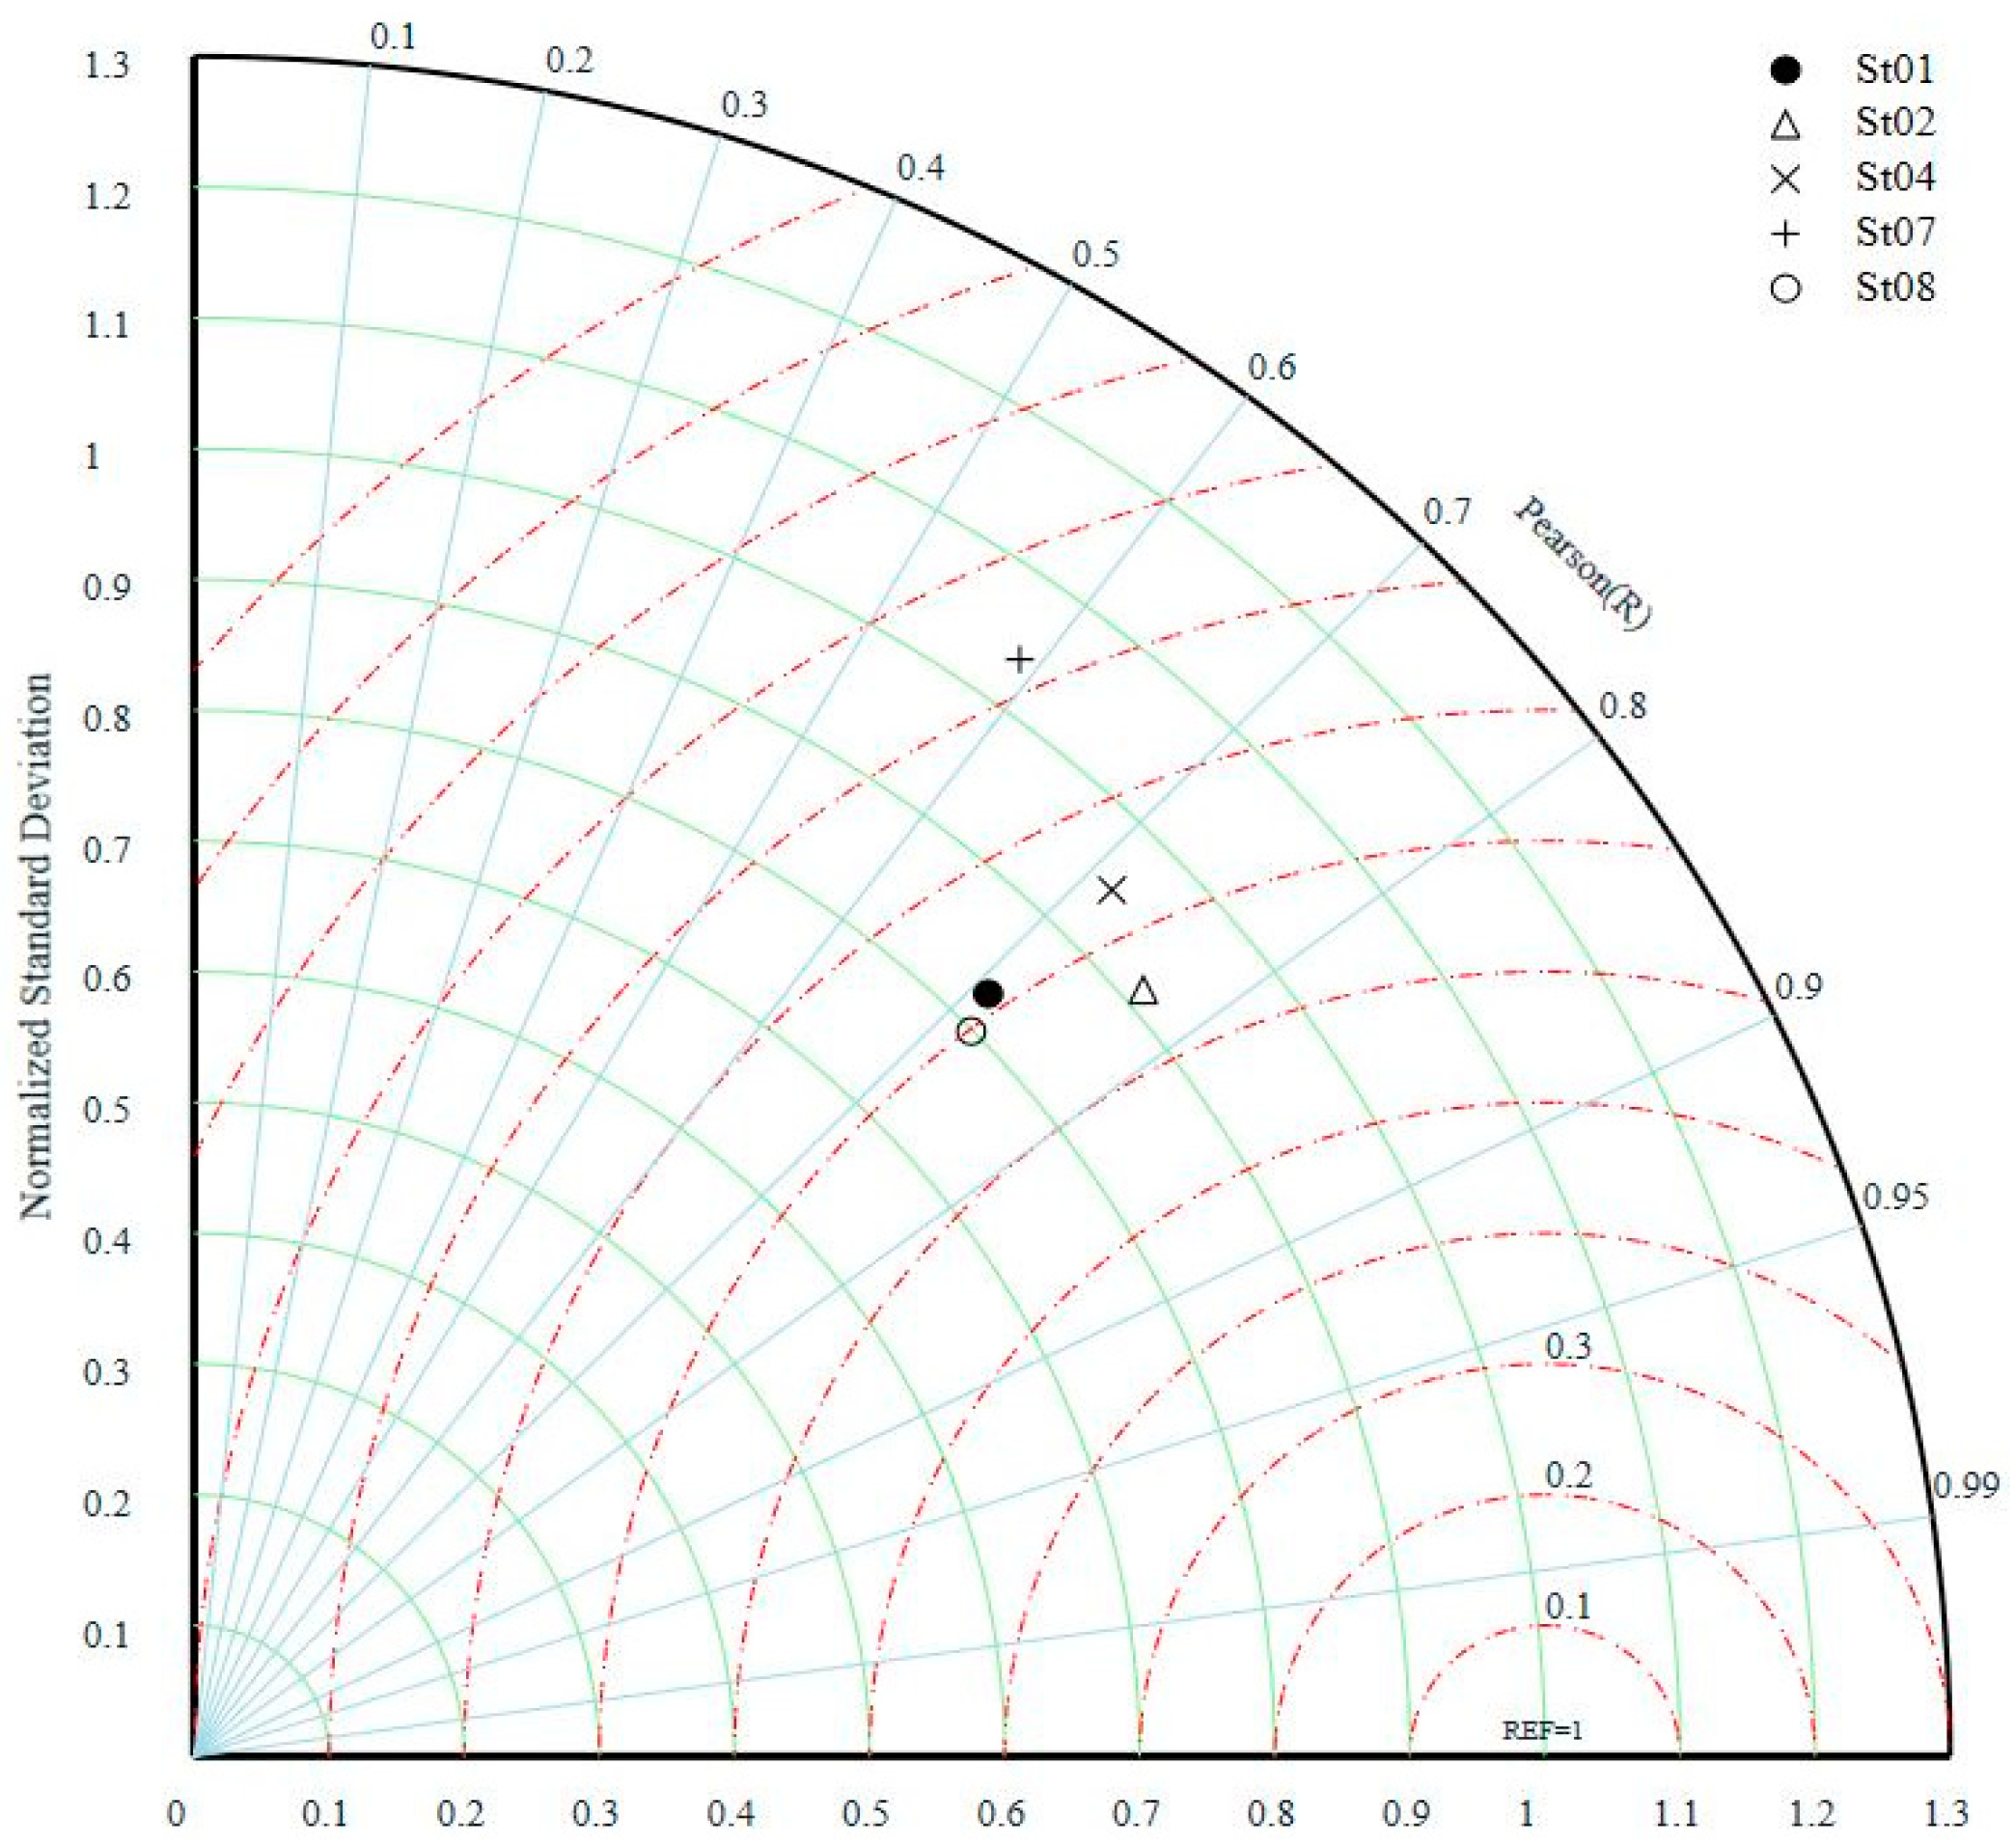
Table 3 summarizes the error metrics, while
Table 4 presents the agreement indices (
R2,
E,
IA, and
FAC2) across the ten stations.
Figure 7 (coastal stations) and
Figure 8 (offshore stations) combine and visually represent model performance through Taylor diagrams, integrating three statistical metrics: correlation, standard deviation, and RMSE. Ideally, better agreement between the ERA5 and measured data is indicated by
σn and
R values closer to 1, and normalized RMSE values closer to 0 [
18].
The results reveal moderate variability in prediction errors across the stations. The
σn values suggest that ERA5 generally captures wind speed variability well, with an average of 0.93 and a range from 0.80 to 1.18. The
NME values are near zero (average: −0.05), indicating a slight underestimation by ERA5, likely due to its inability to fully capture intense wind speeds, a limitation corroborated by other studies [
68]. Notably, offshore station St03 exhibits a more significant negative bias (−0.20), warranting further investigation, as this station has the second shortest observational record.
NCRMSE values range from 0.53 to 0.92, with offshore station St05 showing the best fit (lowest NCRMSE: 0.53) and coastal station St07 reflecting the largest discrepancies (highest NCRMSE: 0.92). These results confirm that the ERA5 model generally performs better offshore than near the coast. The average σr value of 1.73 (range: 1.47–1.92) highlights variability in model consistency and reinforces the challenge ERA5 faces in capturing coastal variability.
Overall, the results demonstrate that ERA5’s performance varies geographically and temporally, aligning with observations from other studies [
74,
80]. These variations can stem from differences in resolution, location, and scale of comparison. Consequently, local and regional evaluations of the ERA5 model’s performance are crucial before applying its data in engineering or scientific contexts.
The combined analysis of the
R2,
E,
IA, and
FAC2 metrics (
Table 4) provides a nuanced understanding of the ERA5 model’s performance in predicting wind speeds across various stations. The metrics reveal distinct patterns of model behavior: some stations exhibit consistently high values across all metrics, indicating robust model accuracy, while others display notable deficiencies, highlighting areas where the model’s predictive capabilities are limited. The average
R2 value of 0.55 reflects a moderate correlation between the ERA5 model predictions and observed wind speeds, suggesting that ERA5 captures general trends but may struggle with localized wind patterns. Similarly, the average
E value of 0.45 indicates satisfactory performance in some regions but leaves considerable room for model enhancement, particularly at stations such as St03 (
E = 0.04) and St07 (
E = 0.12). The
IA values, ranging from 0.76 to 0.92, reflect the model’s overall reliability, with an average value of 0.84 suggesting solid predictive performance. Stations such as St05 (
IA = 0.92) and St09 (
IA = 0.90) demonstrate excellent agreement between ERA5 predictions and observations. Finally, all stations have FAC2 values above 0.8, demonstrating consistent model performance across different locations. FAC2 values, ranging from 0.82 to 0.92, underscore the model’s robustness and reliability, even in regions where other metrics suggest room for improvement.
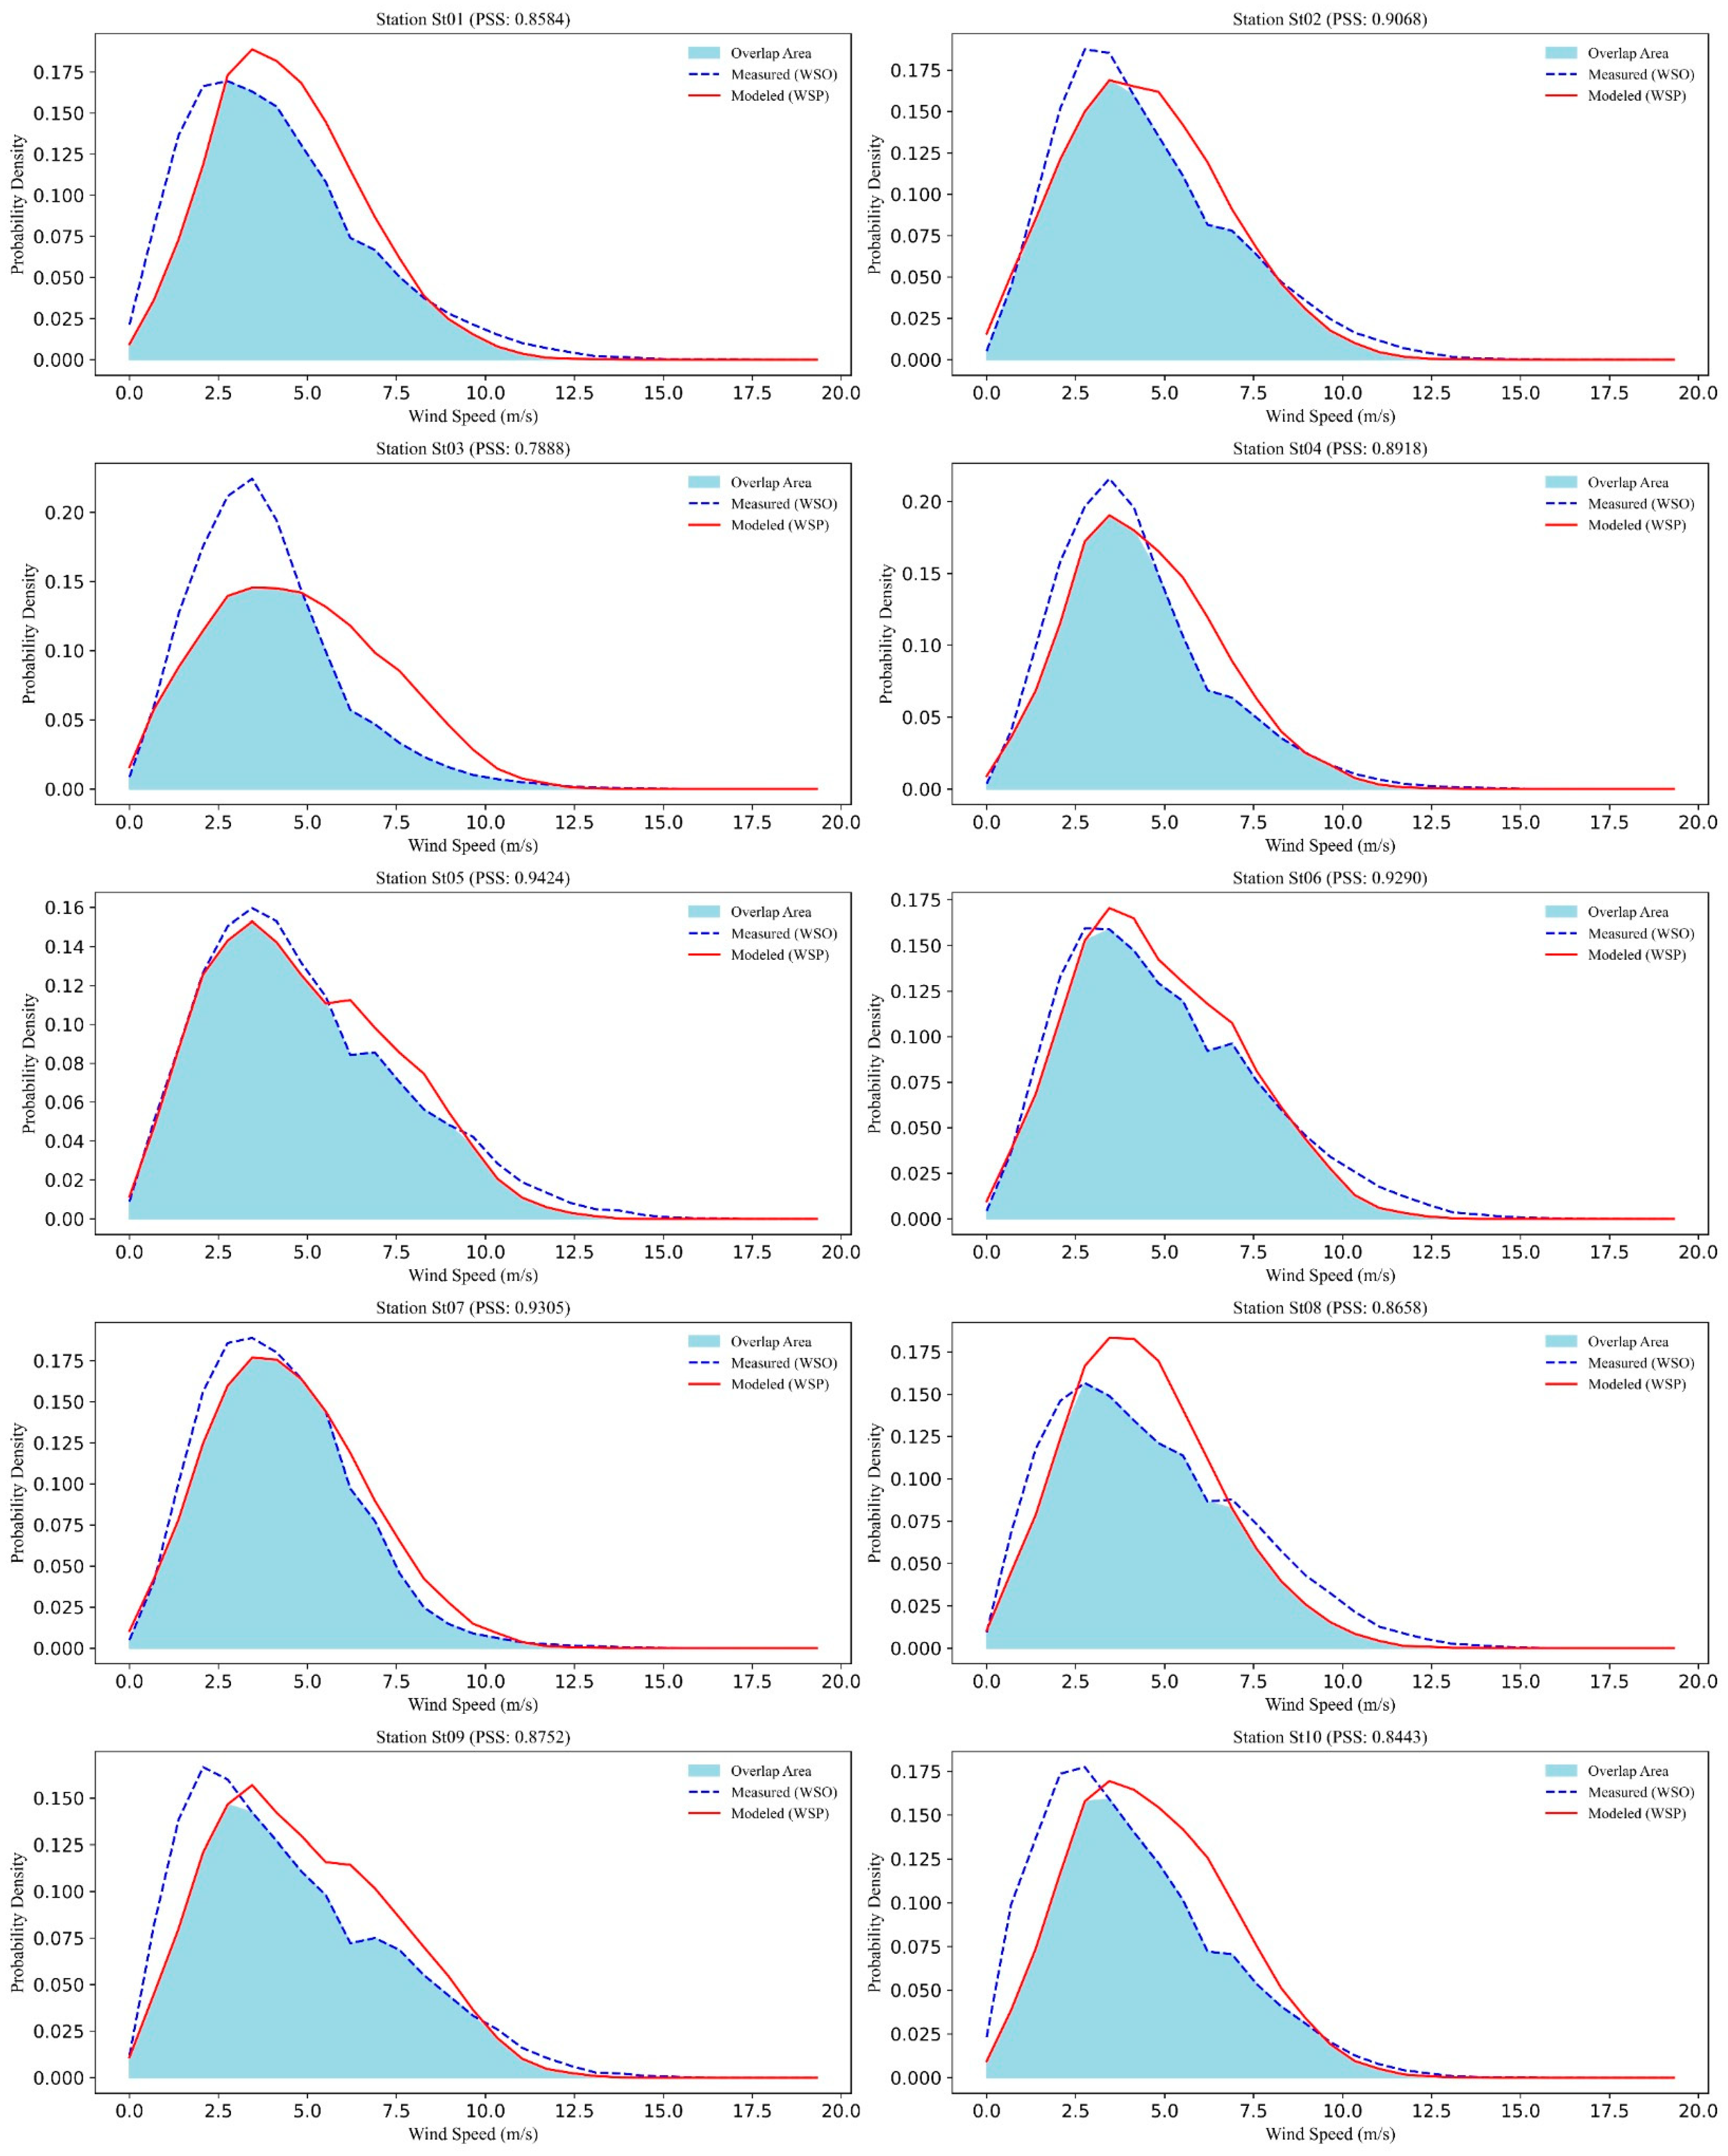
4.3. Evaluation of ERA5 Model Performance Using PSS and BSS
The Perkins Skill Score (PSS), combined with additional statistical metrics, was utilized to comprehensively evaluate the performance of the ERA5 model in replicating observed wind speed distributions. The frequency distribution and PSS results (
Figure 9) were corroborated by auxiliary metrics such as root-mean-square error (RMSE), mean absolute error (MAE), and bias (
Table 5), providing a multi-faceted assessment framework. The PSS values ranged from 0.79 at St03 to 0.94 at St05, indicating a generally high level of agreement between measured and modeled wind speed distributions.
Stations with higher PSS values, characterized by greater overlap areas, demonstrated lower RMSE and MAE, such as St05 (RMSE = 1.47, MAE = 1.12), reflecting reduced error margins and accurate replication of observed wind speed distributions. Notably, the magnitude of the scores was independent of whether the station was coastal or offshore, aligning with findings from Molina et al. [
18], who concluded that PSS performance exhibits no dependency on geographical features.
For stations such as St03 (RMSE = 2.05, bias = 0.92), the model’s overestimation of wind speeds contributed to a reduced PSS score, consistent with previous studies highlighting the sensitivity of PSS to systematic biases [
18,
59]. Despite these discrepancies, the strong overall performance of the ERA5 model supports the utility of PSS as a robust metric for assessing wind speed distributions, particularly when supplemented by RMSE and bias metrics [
18,
59,
81,
82]. However, as noted in earlier studies and evident in this analysis, the model demonstrates challenges in accurately predicting extreme wind events, specifically for percentiles greater than the 90th, likely due to resolution limitations or smoothing effects.
The Brier Skill Score (BSS) analysis reveals distinct station patterns (
Figure 10). Positive BSS values at St01, St02, St05, St06, St08, and St09 demonstrate the model’s ability to outperform the reference method, likely due to its capacity to capture dominant wind patterns. Offshore stations, like St05, show higher scores, reflecting the model’s effectiveness in representing broad-scale, uniform wind conditions. Similarly, coastal stations with moderate positive scores indicate some skill but highlight limitations in resolving finer-scale variability, particularly at St01, St02, and St06. These results align with findings in [
83], where insufficient spatial resolution and ensemble calibration hindered probabilistic model performance.
Negative BSS values, such as those at St03, St04, St07, and St10, highlight the ERA5 model underperformance. St03’s highly negative score suggests challenges in capturing offshore wind dynamics, possibly due to unresolved wind–wave interactions or spatial variability in atmospheric conditions. St07 has the most negative score among coastal stations, likely influenced by turbulence, land–sea interactions, or inadequate calibration. Near-zero scores at St04 and moderate negatives at St10 suggest marginal improvement over the reference method but point to overconfidence in predictions, a limitation common in probabilistic frameworks lacking robust uncertainty quantification.
These findings emphasize the need for targeted model refinements. Positive BSS stations could benefit from enhanced spatial resolution and calibration to improve their skill further. For negative BSS stations, addressing specific environmental challenges, such as wind–wave interactions and turbulence, is critical. Probabilistic methods like GenCast [
83], incorporating uncertainty and spatiotemporal dependencies, ensemble calibration, and spatial pooling, could significantly improve prediction reliability across all stations.
4.4. Wind Direction
Figure 2 and
Figure 11 highlight the wind direction trends observed in the measured and ERA5 datasets, respectively. Both datasets demonstrate consistent seasonal dominance of northwest winds across coastal and offshore stations. However, the measured data exhibit greater variability, particularly during transitional seasons like spring and autumn. This increased variability reflects local wind dynamics often smoothed out in ERA5. Offshore stations show notable discrepancies, with mean wind directions in ERA5 offset by approximately 10–20° compared to measured data. While these offsets are acceptable given the complexity of wind direction analysis [
28], they underscore the limitations of reanalysis models in capturing localized dynamics.
ERA5 performs well in winter and summer, seasons with stable and predictable wind patterns, achieving correlation coefficients exceeding 0.85 at most stations. For instance, winter at St05 shows a strong alignment, with a bias of just 5° and an RMSE of 7.5°. In contrast, autumn at ST10 reveals ERA5’s limitations, with biases exceeding 20°. The measured data for this season report a standard deviation of 106°, compared to 97° in ERA5, highlighting the latter’s tendency to underrepresent dynamic shifts.
Spring is another transitional season where discrepancies are pronounced, particularly at St03 and St10. Biases of up to 20° were observed, potentially impacting wind energy assessments and climatological studies. ERA5’s smoother variability may overlook critical shifts in wind dynamics, which are vital for understanding coastal and offshore meteorological processes.
The results highlight the capacity of ERA5 data to capture the dynamic nature of coastal and offshore wind regimes, which are influenced by complex interactions between atmospheric conditions and open water surfaces and the land–sea interaction. Also, while ERA5 provides a valuable resource for long-term wind speed characterization, caution is warranted when using its data for applications sensitive to peak wind speeds or fine-scale variability. Underestimating extreme events by ERA5 could have significant implications in designing coastal and offshore structures, and renewable energy projects where accurate extreme value predictions are essential. Also, understanding the factors affecting the ERA5 accuracy is crucial for improving wind resource assessments and optimizing the placement and design of wind energy infrastructure in both coastal and offshore environments. The evaluation shows that the ERA5 model in the region tends to underrepresent extreme wind events, consistently falling short of actual extreme measurements, and it overestimates mean and median wind speeds. This systematic bias towards moderate wind conditions raises concerns about the model’s applicability in critical scenarios, such as wind hazard assessments, where accurate representation of extremes is paramount, wind energy projects, coastal engineering, and risk assessments for storm impacts. These findings underscore a broader challenge in adequately capturing the diverse conditions experienced in wind dynamics.
5. Conclusions and Recommendations
This study assessed the performance of ERA5 reanalysis wind data against observational measurements from ten coastal and offshore stations in Kuwait from 2010 to 2017. The findings reveal that while ERA5 effectively captures general wind speed patterns, particularly at offshore stations, it exhibits notable limitations in representing wind variability and extreme wind events, especially at coastal locations.
Offshore stations demonstrated stronger agreement with observations, with Pearson correlation coefficients reaching up to 0.85 and Perkins Skill Score (PSS) values up to 0.94. These results underscore ERA5’s proficiency in modeling uniform wind conditions over open water. Conversely, coastal stations showed significant discrepancies, with correlation coefficients as low as 0.35 and persistent biases due to complex land–sea interactions and localized meteorological phenomena. Additionally, ERA5 underrepresented extreme wind speeds, particularly for higher percentiles, as its spatial resolution led to a smoothing effect on variability.
Taylor diagrams and statistical measures, including normalized standard deviation (σn), index of agreement (IA), and normalized centered root-mean-square error (NCRMSE), highlighted the model’s relative strengths and weaknesses across station types. Offshore stations consistently achieved better IA and lower NCRMSE values compared to coastal stations. Additionally, E metrics highlighted significant variability in the model’s effectiveness across different stations. E values ranged from 0.12 at St07 to 0.72 at St05, and, at the same time, 82% to 92% of the predictions fell within a factor of two of the observed wind speeds, indicating general reliability and revealing improvement areas. Extreme wind event prediction was a recurring challenge, limiting ERA5’s application in high-precision contexts such as wind energy development, storm impact assessments, and coastal infrastructure design.
5.1. Recommendations
Localized calibration: Recalibrate ERA5 using high-resolution observational datasets to account for regional characteristics, particularly in coastal areas where land–sea interactions and mesoscale dynamics play a significant role.
Hybrid modeling approaches: Combine ERA5 data with machine learning and hybrid models to enhance its ability to predict extreme events and represent localized wind variability more effectively.
Enhanced observational networks: Develop and maintain high-resolution, long-term meteorological monitoring networks in Kuwait and similar regions. These networks can reduce data scarcity, support model validation, and improve extreme event representation.
Extreme event focus: Improve the model’s capability to represent extreme wind events by refining its spatial resolution and adopting probabilistic frameworks that address spatiotemporal dependencies and quantify uncertainties.
Advanced model refinement: Explore methodologies such as ensemble calibration, wind–wave interaction models, and improved parameterization schemes to mitigate biases and enhance the model’s performance in transitional and extreme conditions.
5.2. Future Directions
Continuous validation and updating of ERA5 using localized datasets are crucial for improving its accuracy and reliability. Future research should prioritize enhancing the model’s capacity to predict extreme wind speeds, with implications for renewable energy development, coastal engineering, and climate adaptation strategies. Addressing these challenges will ensure that ERA5 evolves into a more robust and versatile tool for analyzing wind dynamics in coastal and offshore environments, supporting sustainable development goals, and contributing to broader regional and global initiatives.


