Joint Optimization of Berths and Quay Cranes Considering Carbon Emissions: A Case Study of a Container Terminal in China

Abstract
1. Introduction
1.1. Literature Review
1.2. The Contributions of This Paper
2. Problem Description and Model Formulations
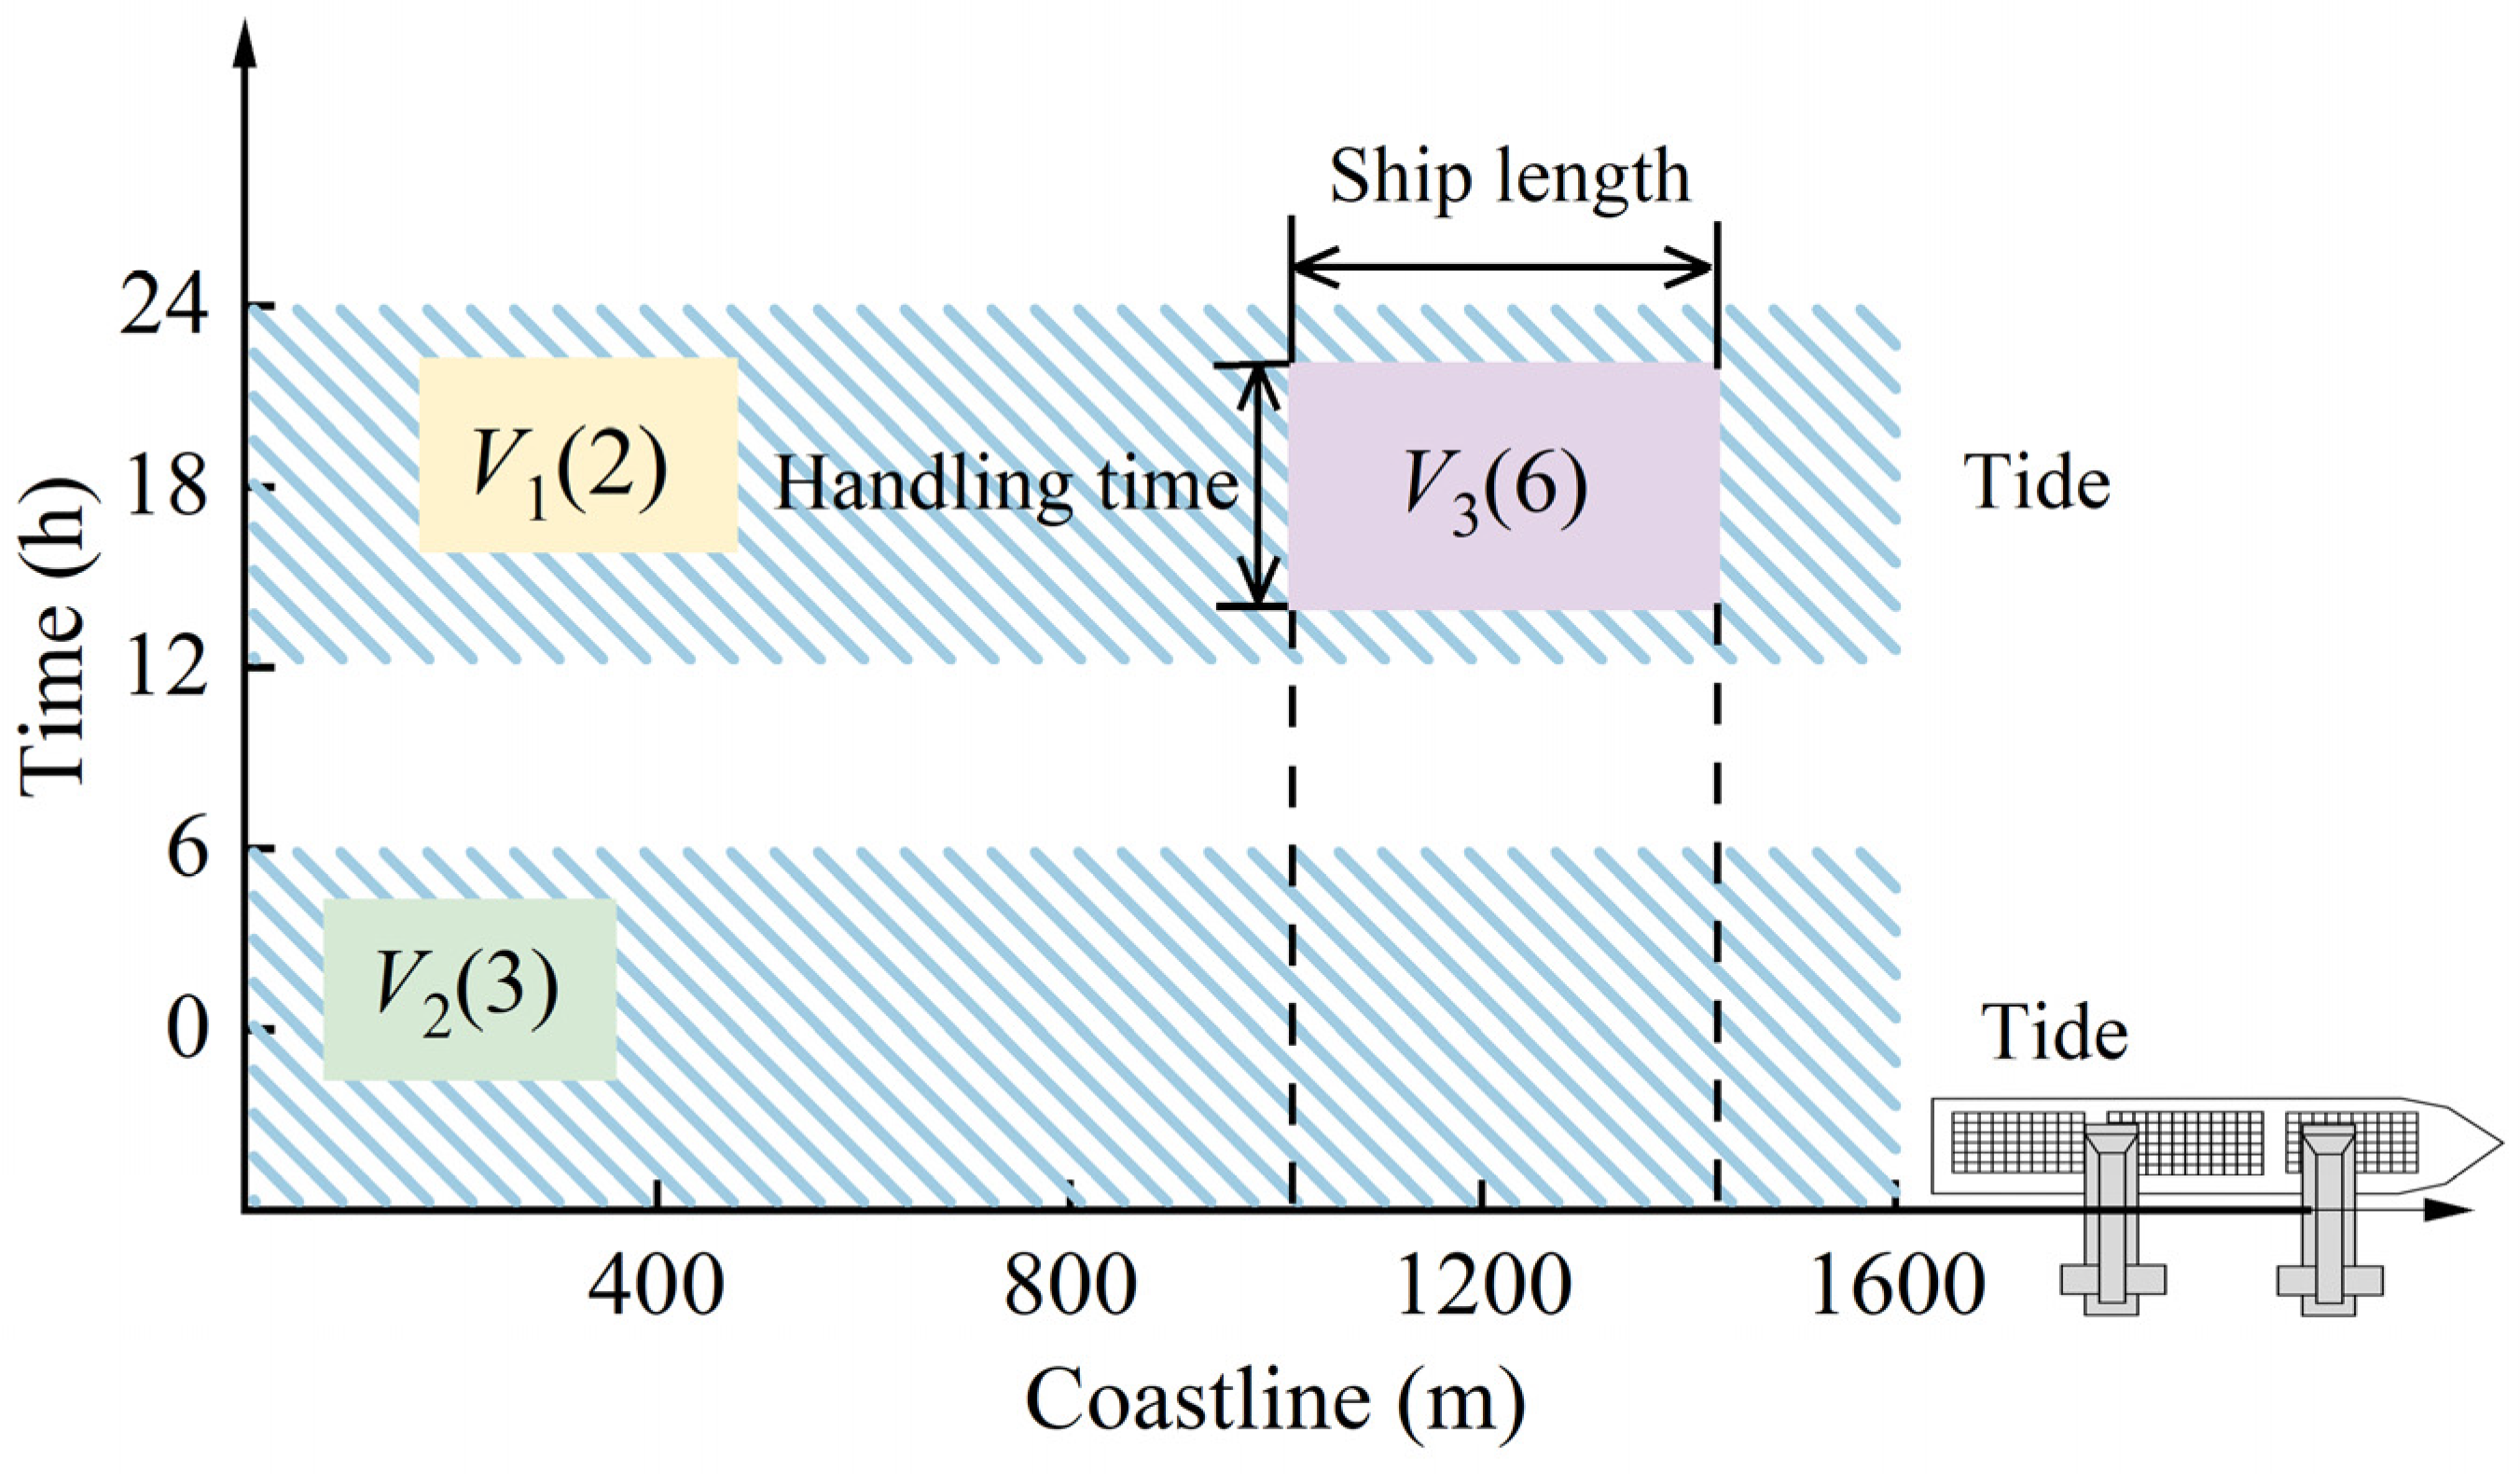
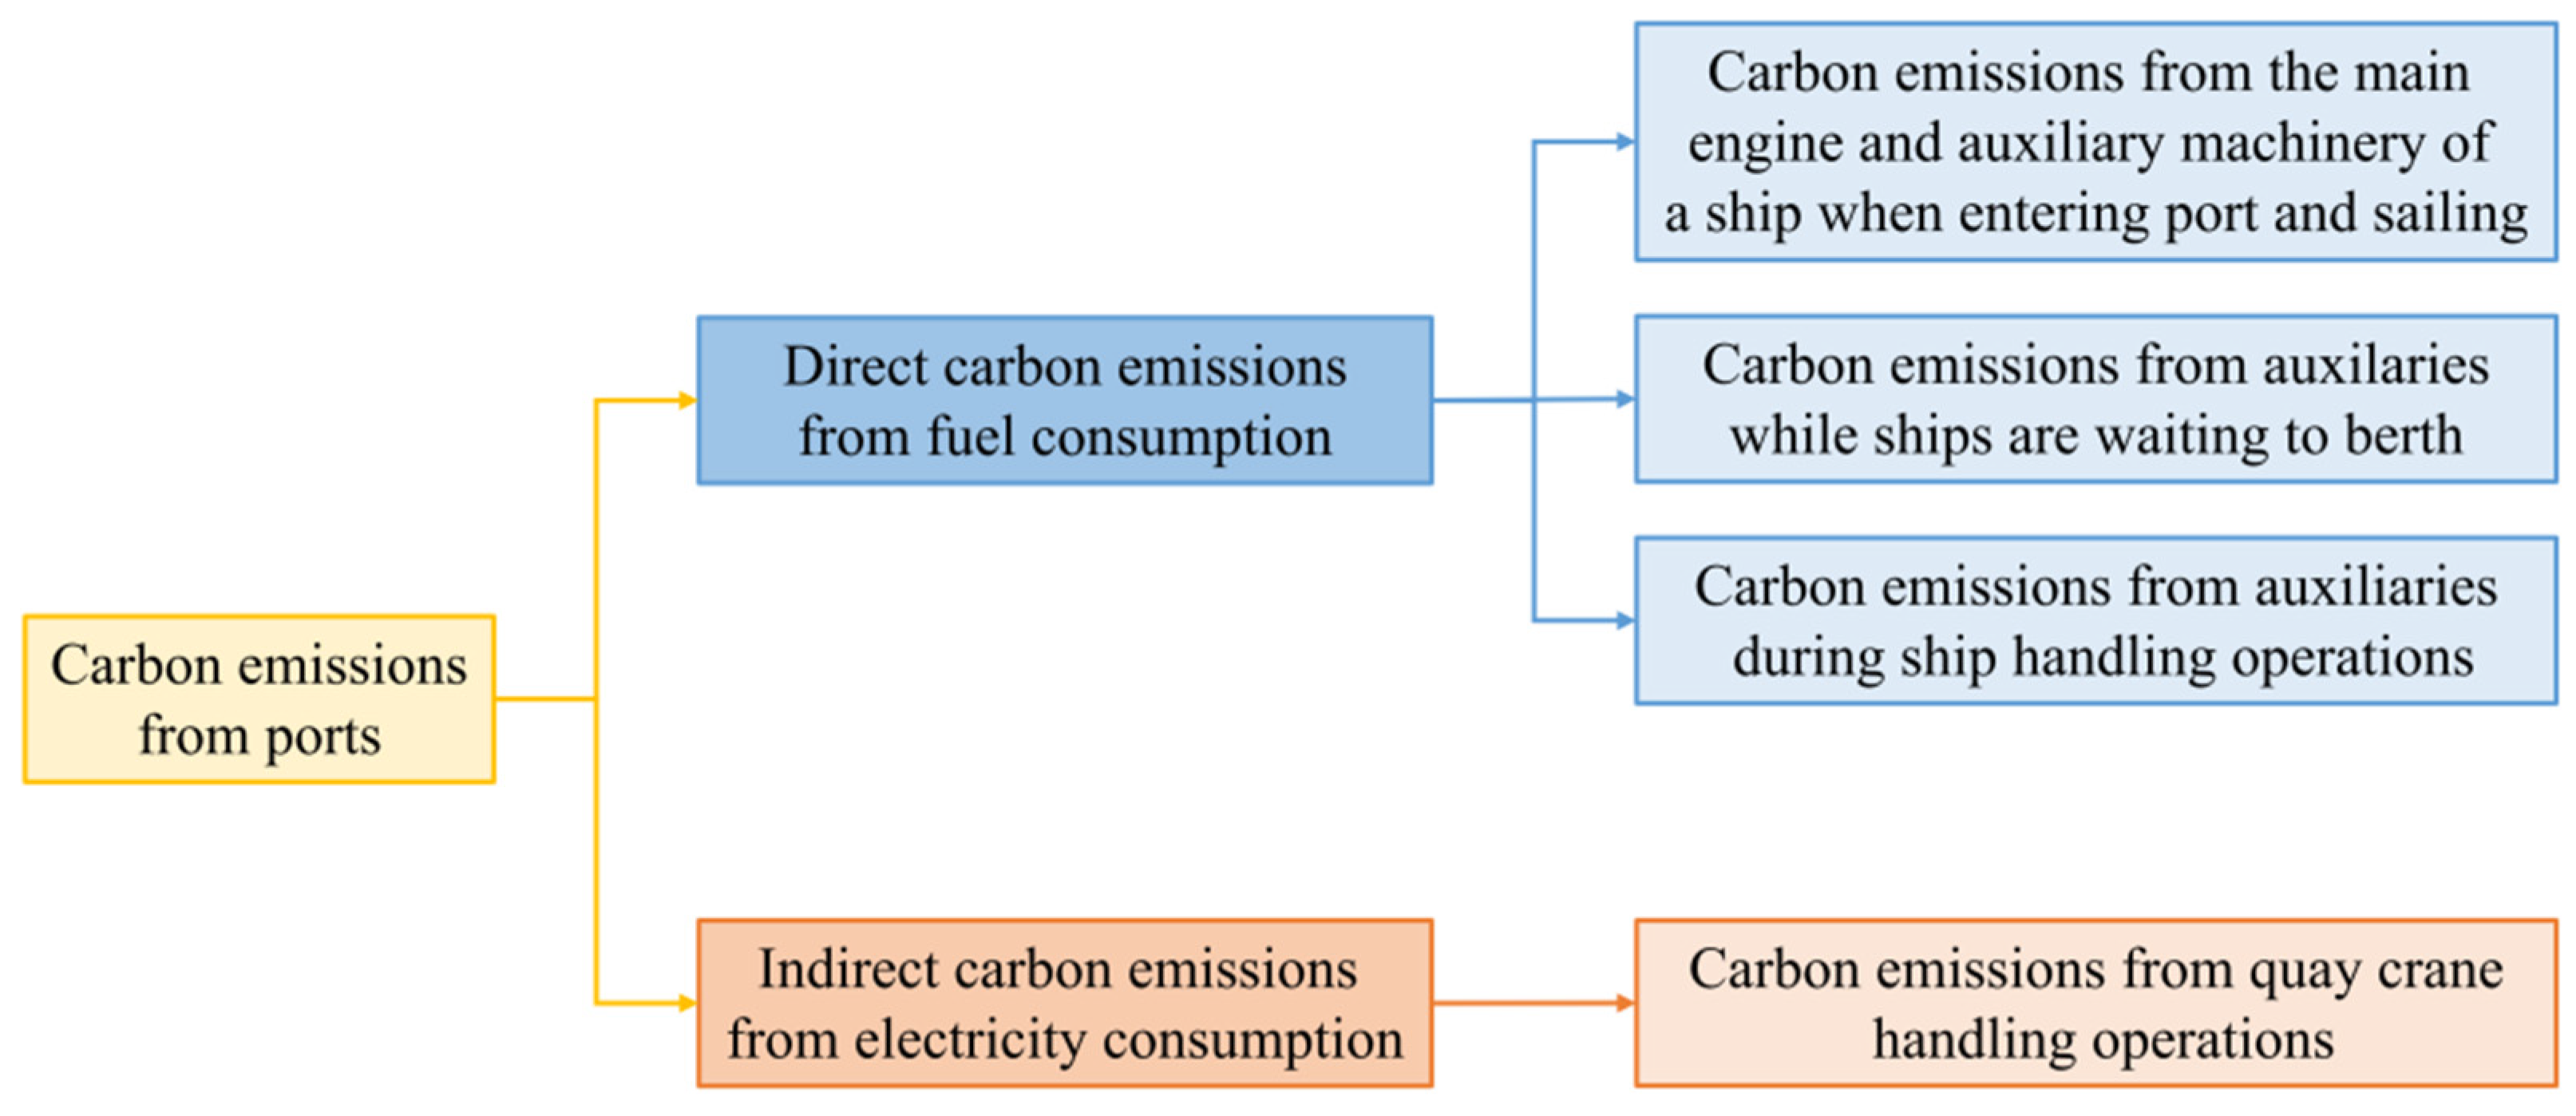
2.1. Problem Description
2.2. Model Formulations
- (1)
- All quay cranes operate on the same track and have uniform loading and unloading efficiencies;
- (2)
- The length of each ship includes the actual length plus the necessary gap required between docked ships;
- (3)
- Once a ship has docked, it cannot move until its loading and unloading operations are fully completed;
- (4)
- The energy consumption per unit time is consistent across all quay cranes and ships;
- (5)
- All ships arriving at the port must undergo loading and unloading operations within the constraints of their allocated resources;
- (6)
- Each ship has predefined minimum and maximum limits for the number of quay cranes it can be allocated, with the actual allocation falling within this range;
- (7)
- The effects of ship departure speed and quay crane movement on carbon emissions are not explicitly considered in the model.
2.3. ILP Model
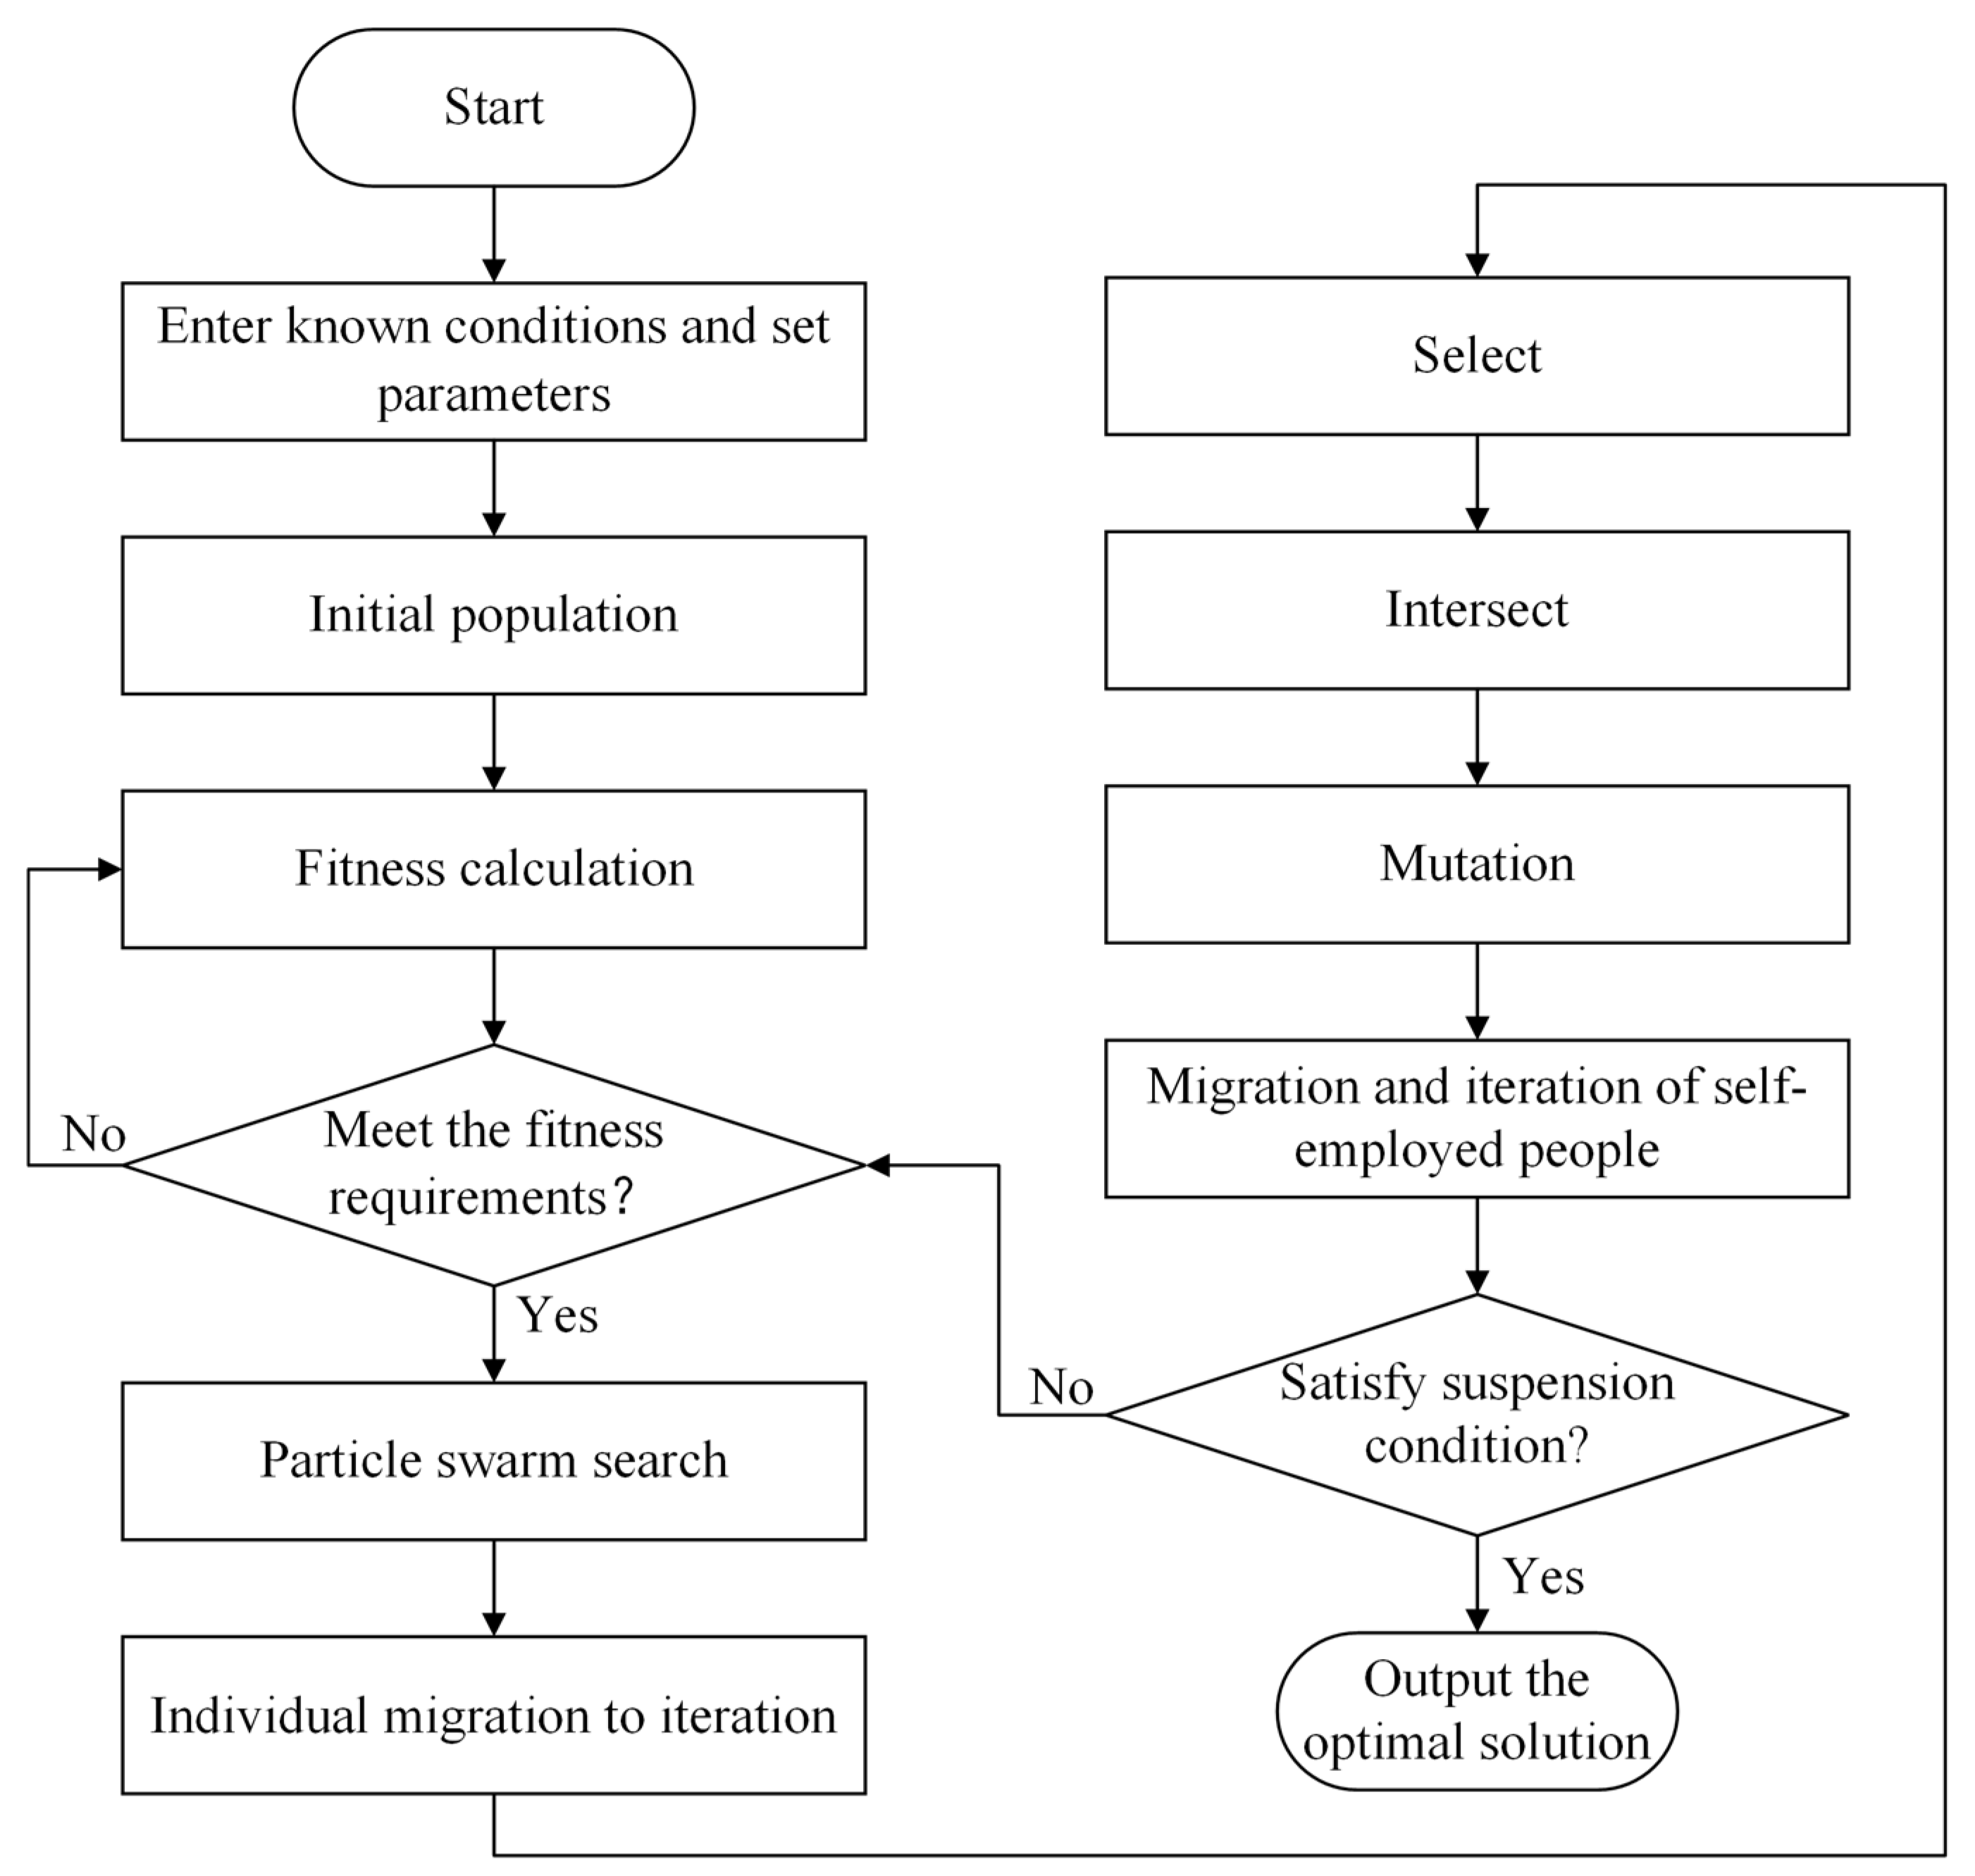
3. Heuristic Approach
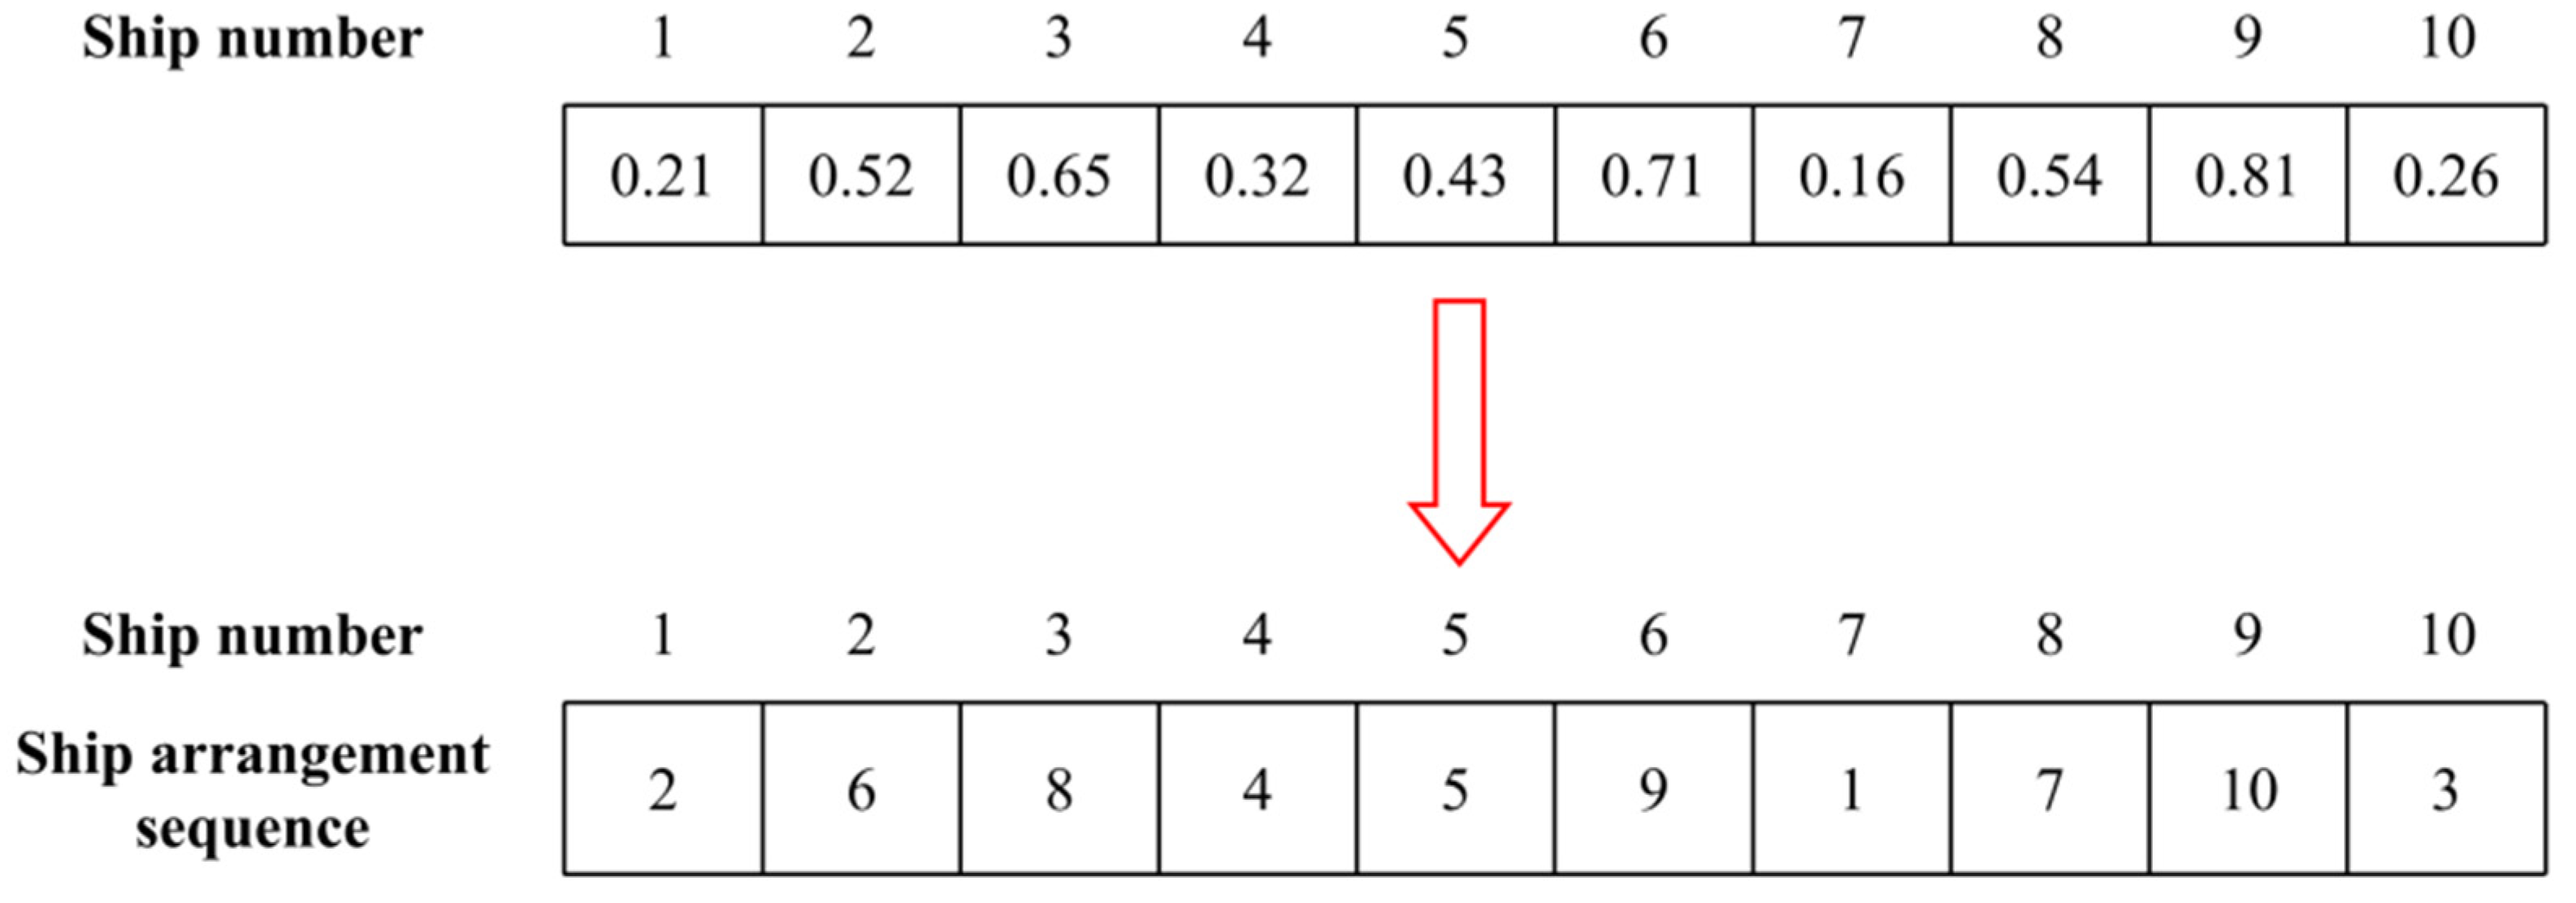
3.1. Encoding and Decoding
3.2. Population Initialization
3.3. Fitness Function
3.4. Particle Update
3.5. Crossover and Mutation
3.5.1. Crossover
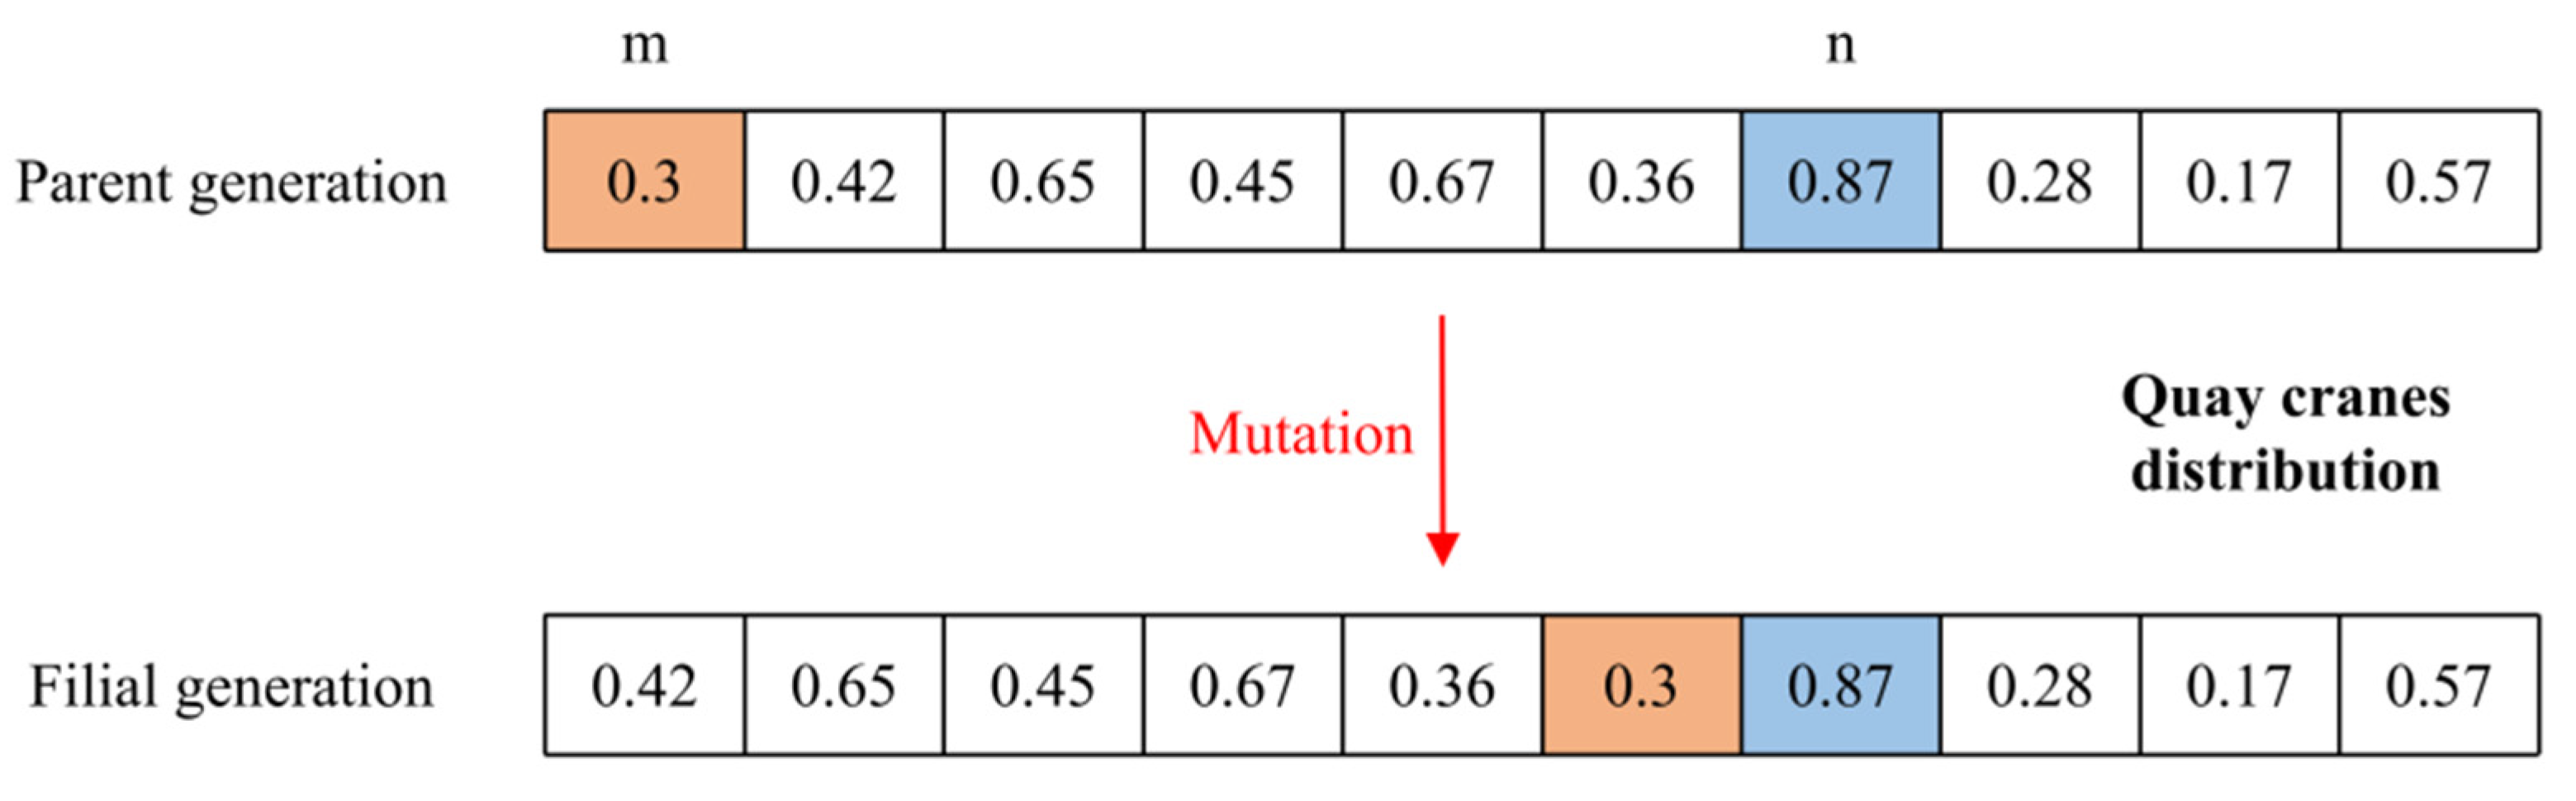
3.5.2. Mutation
4. Case Study
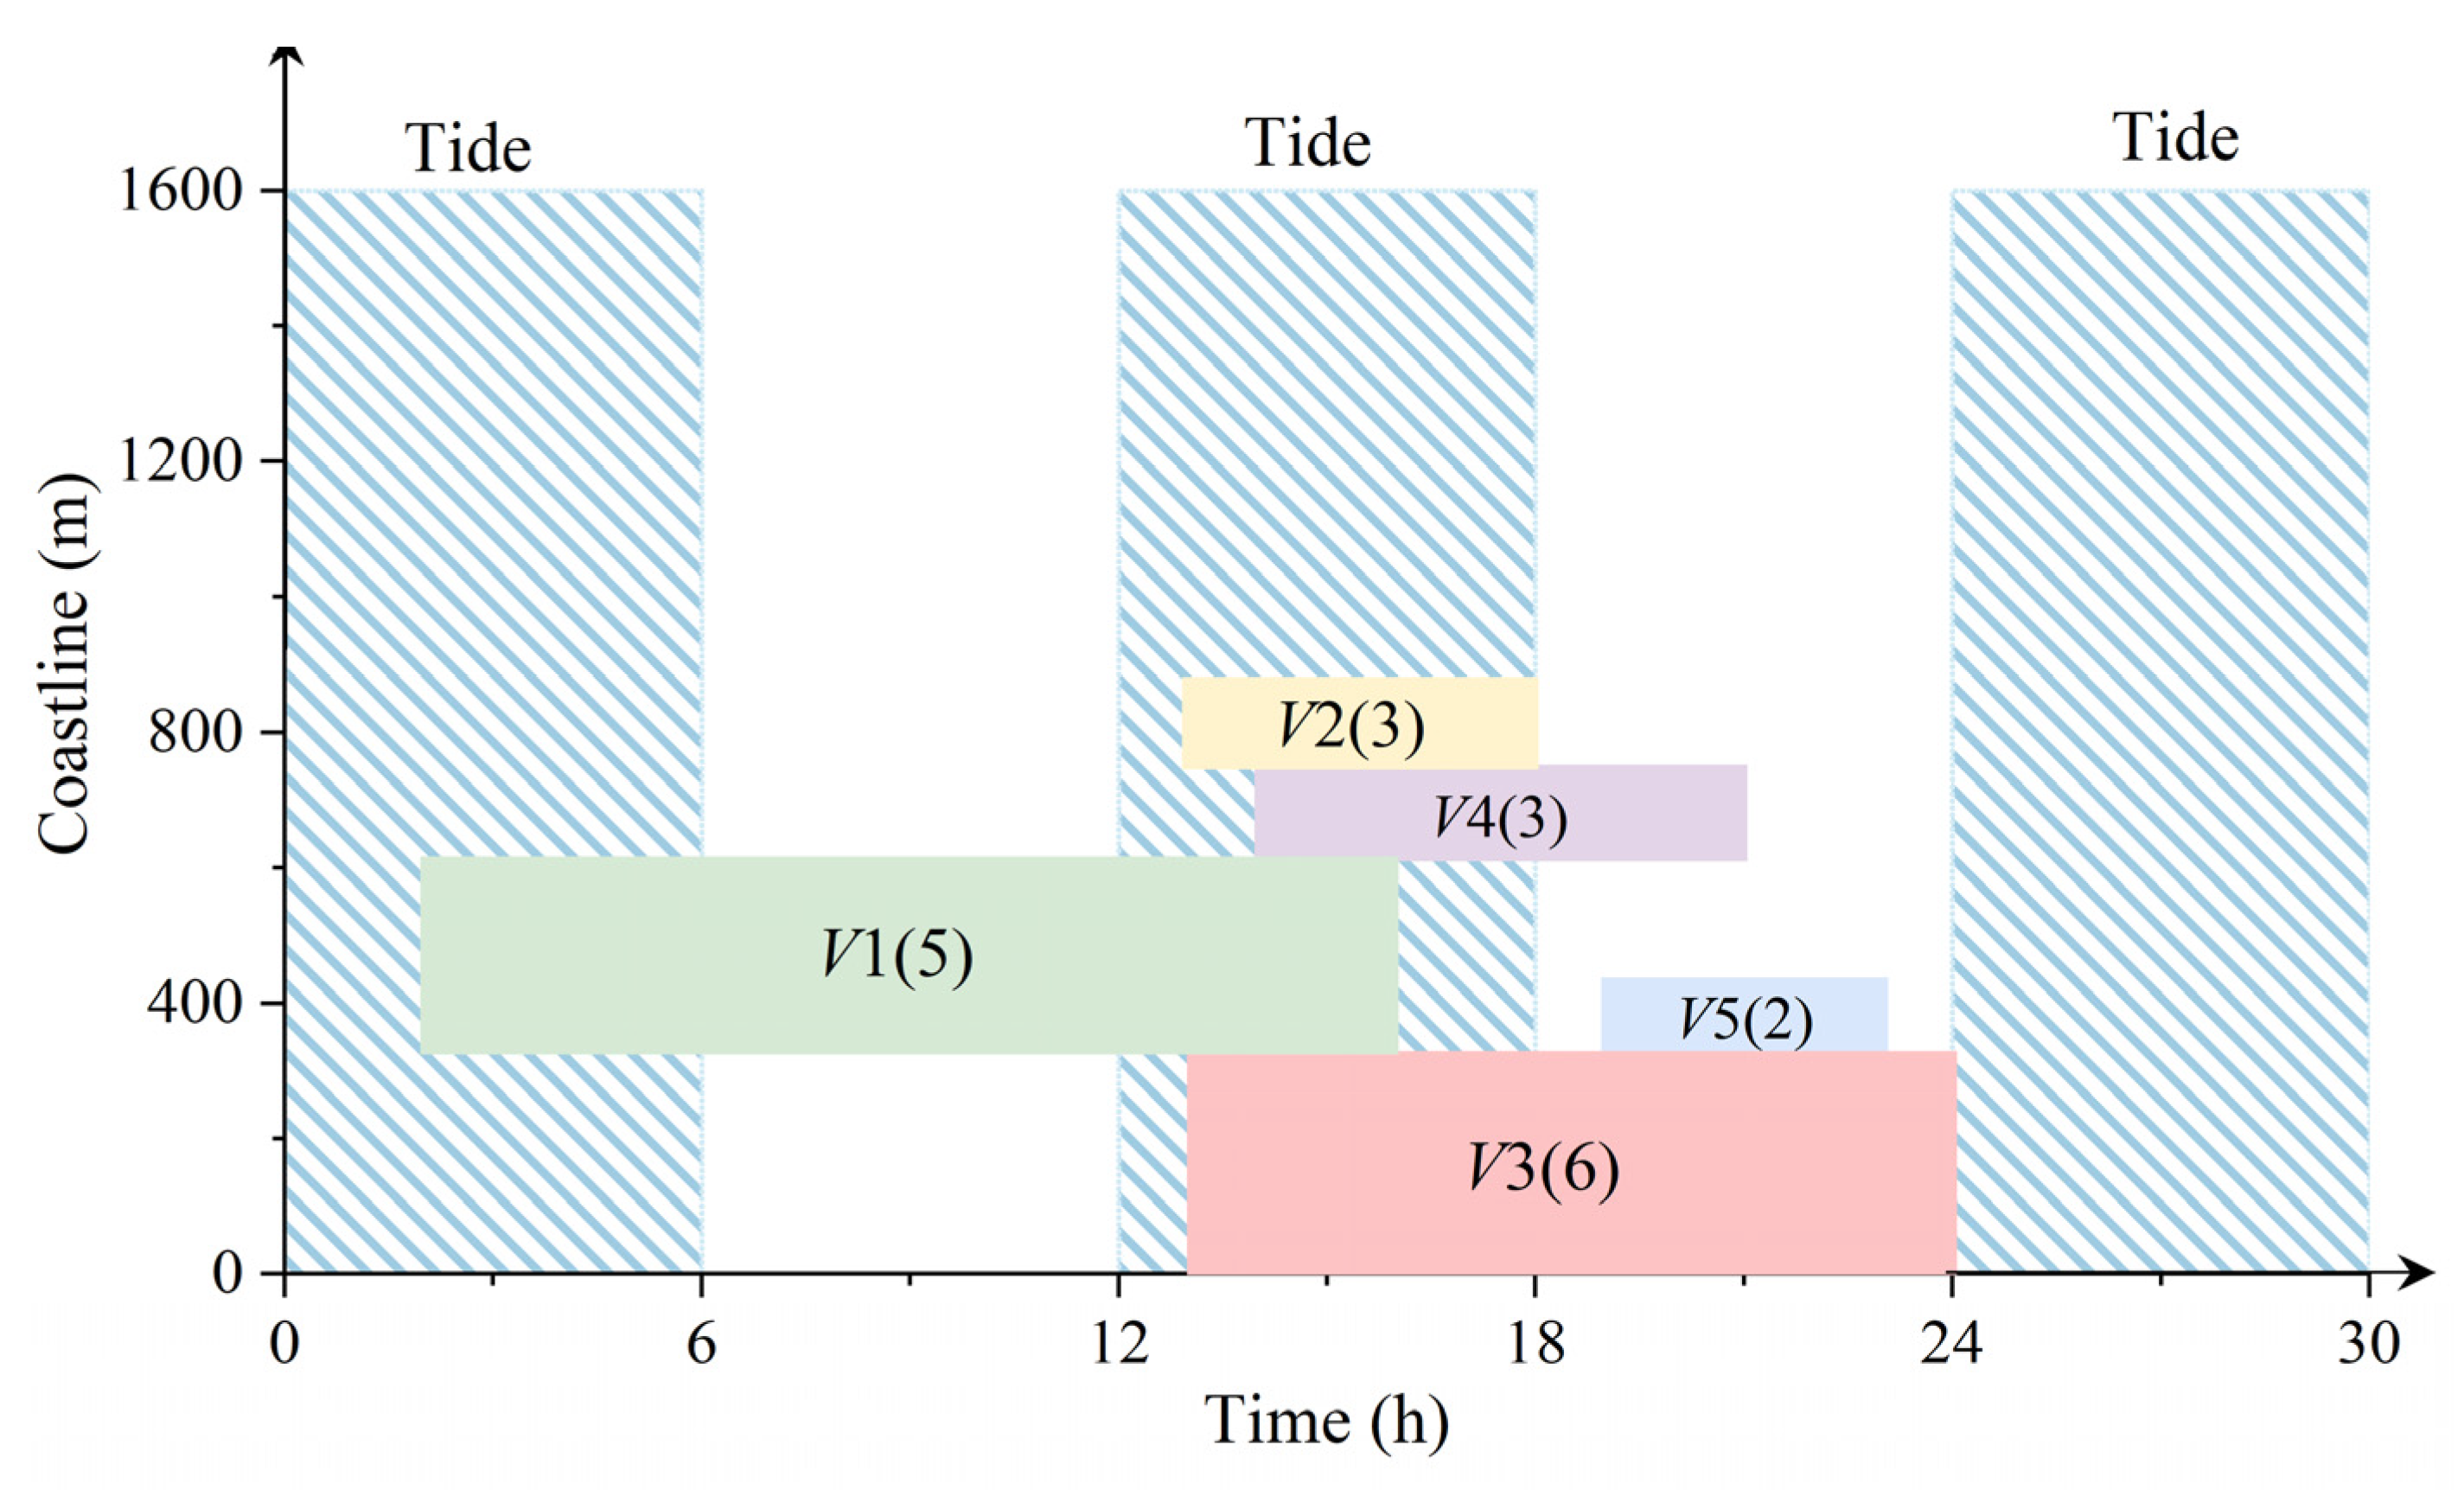
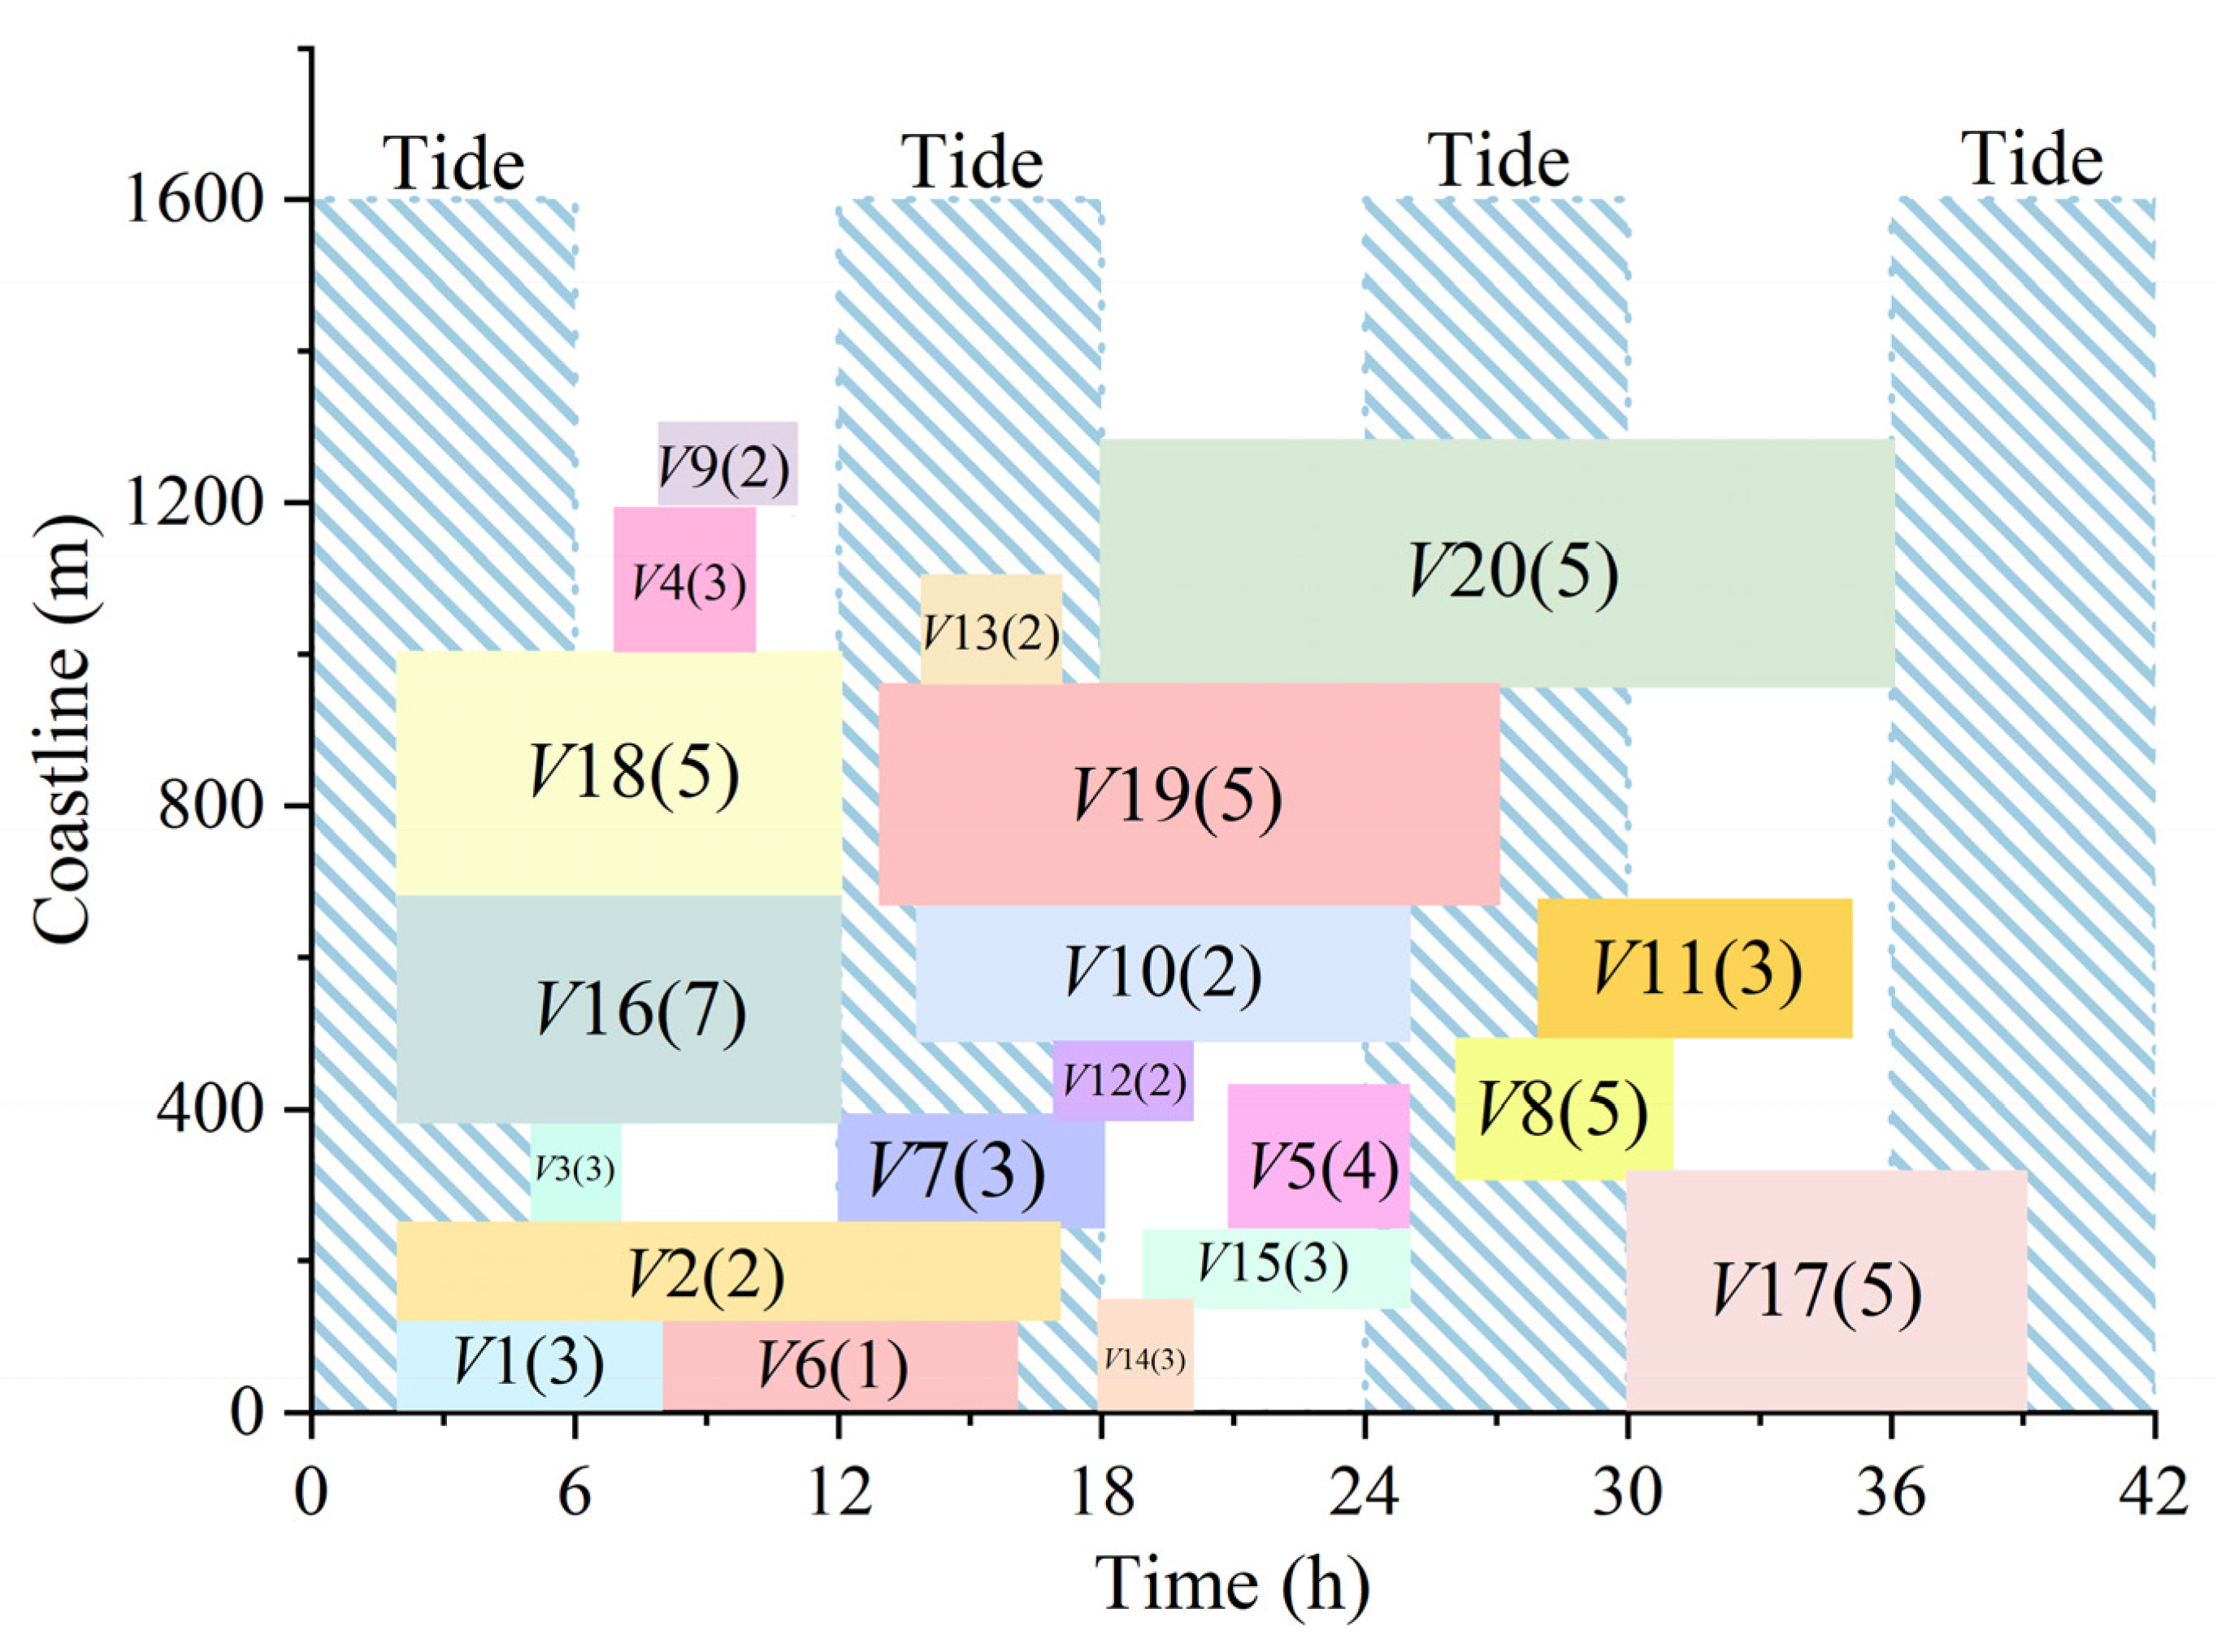
4.1. Cases and Solutions
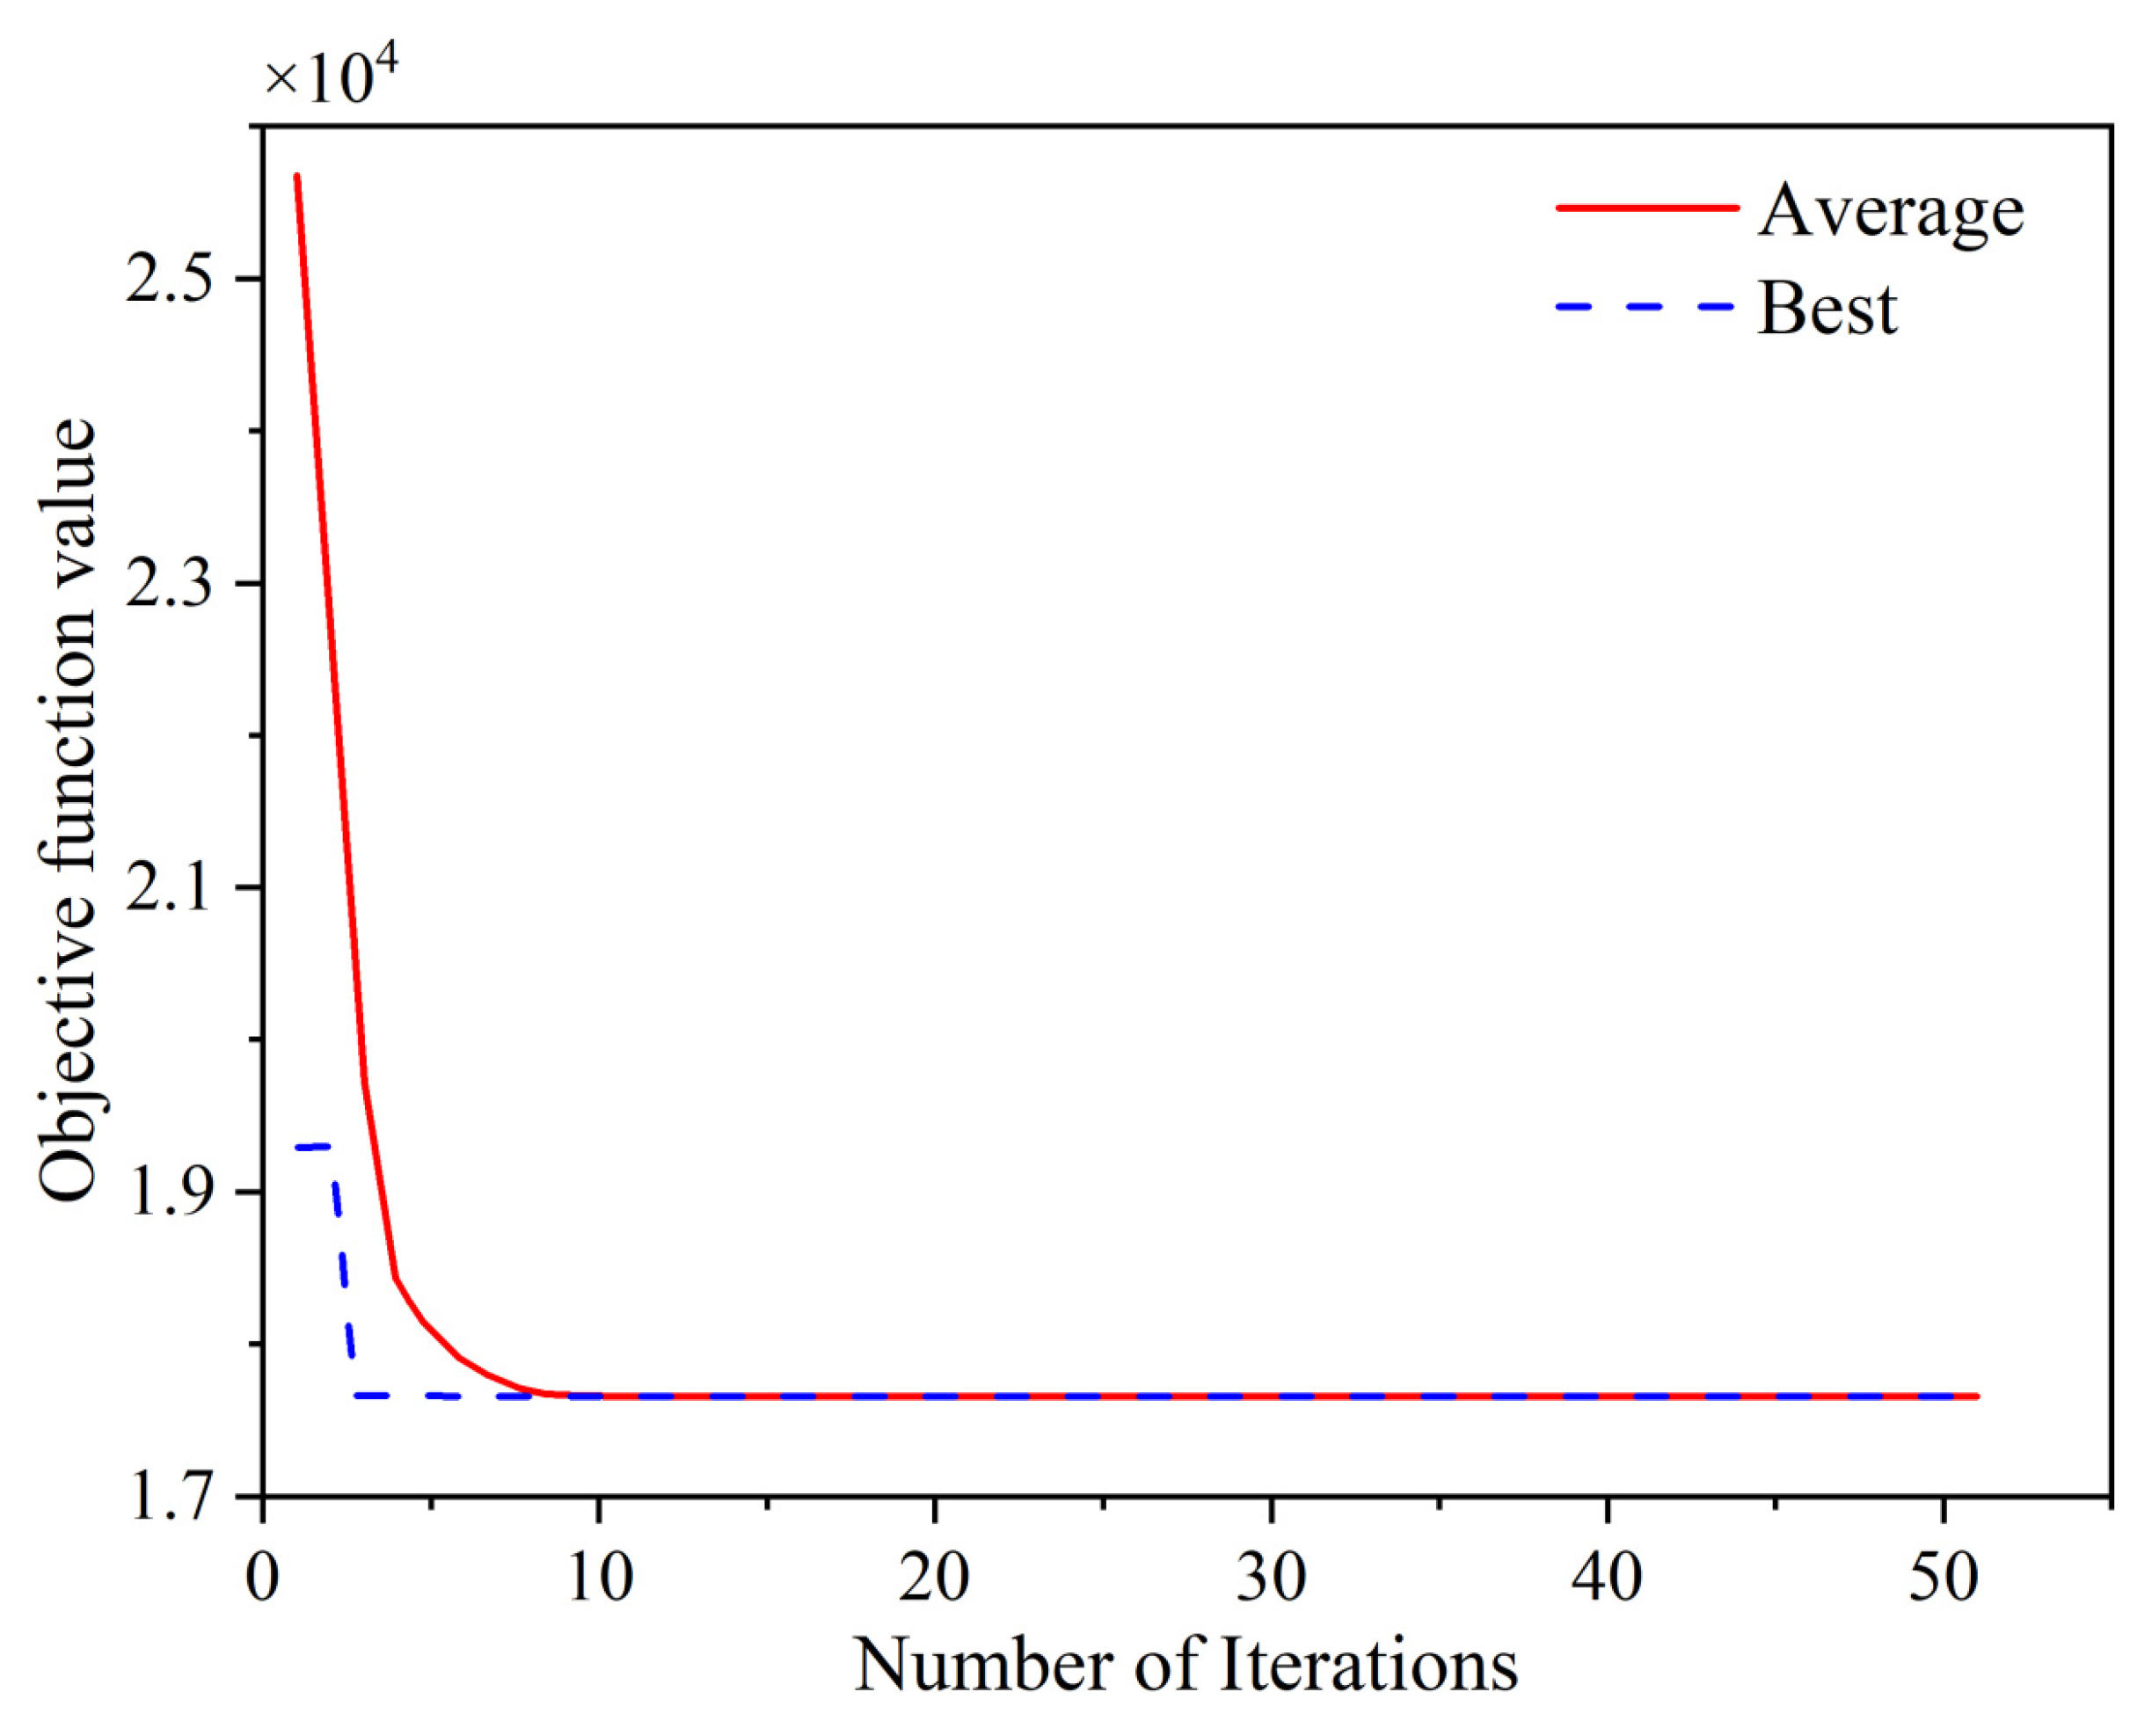
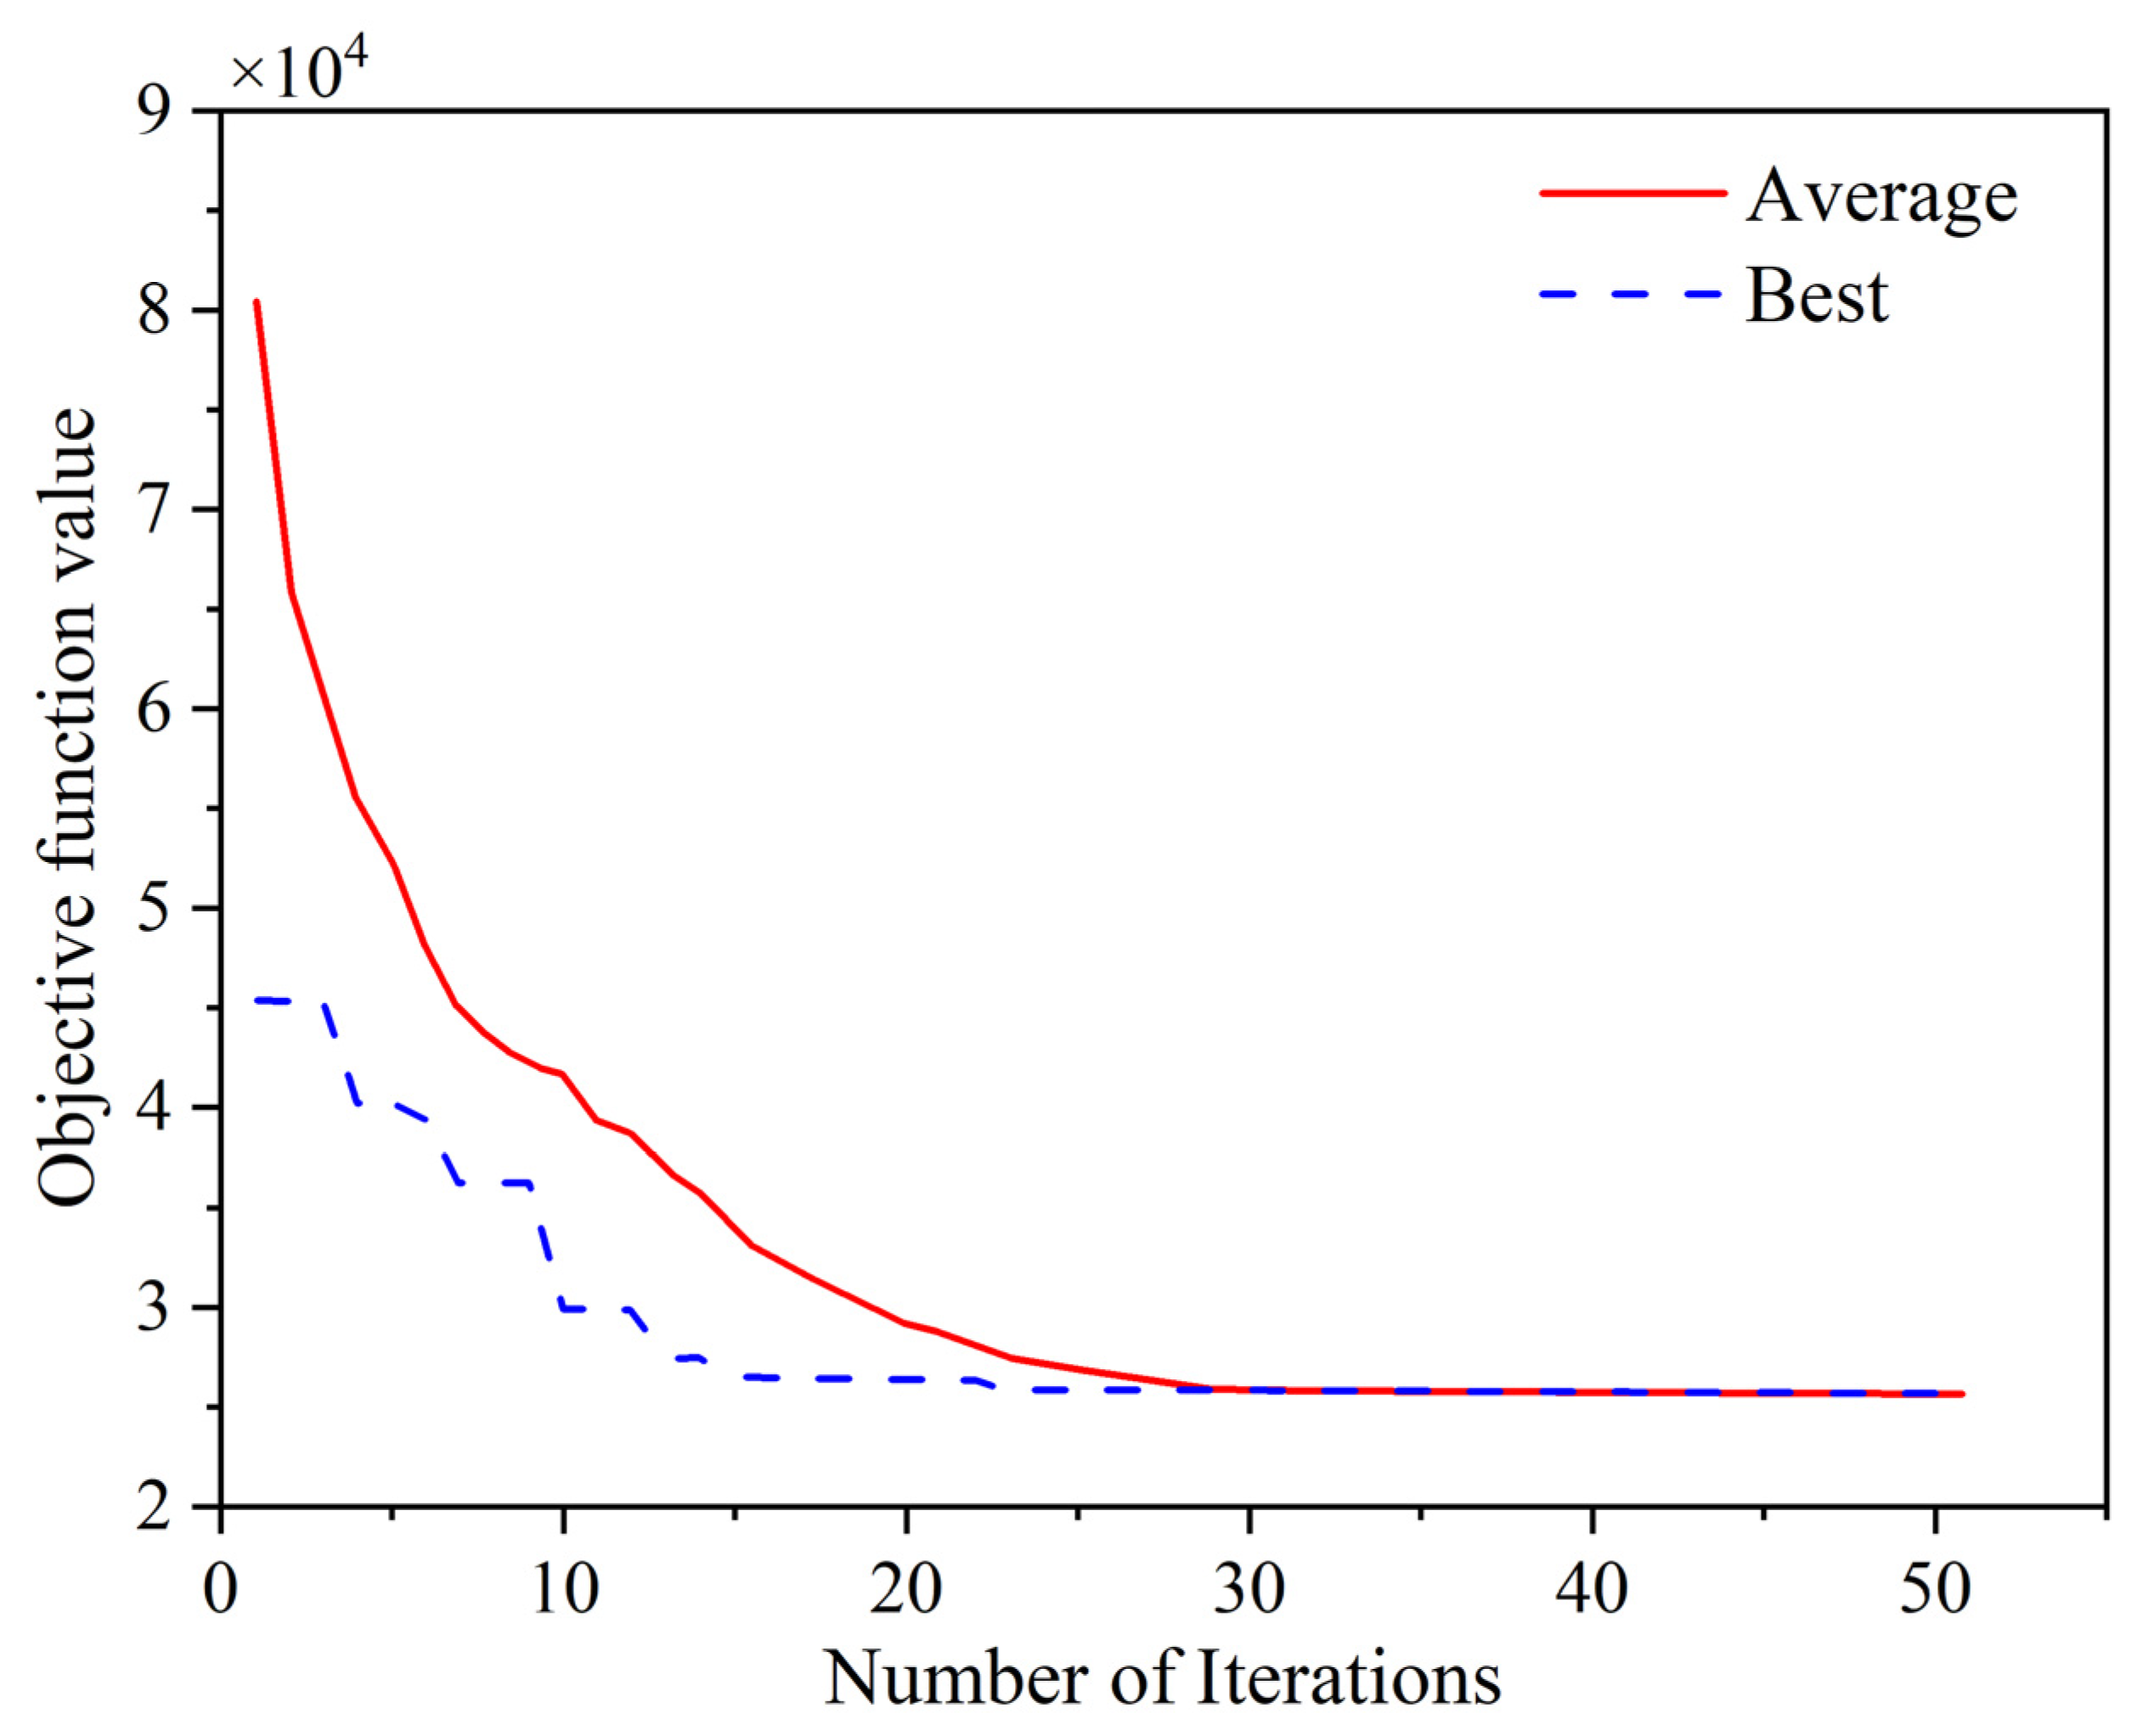
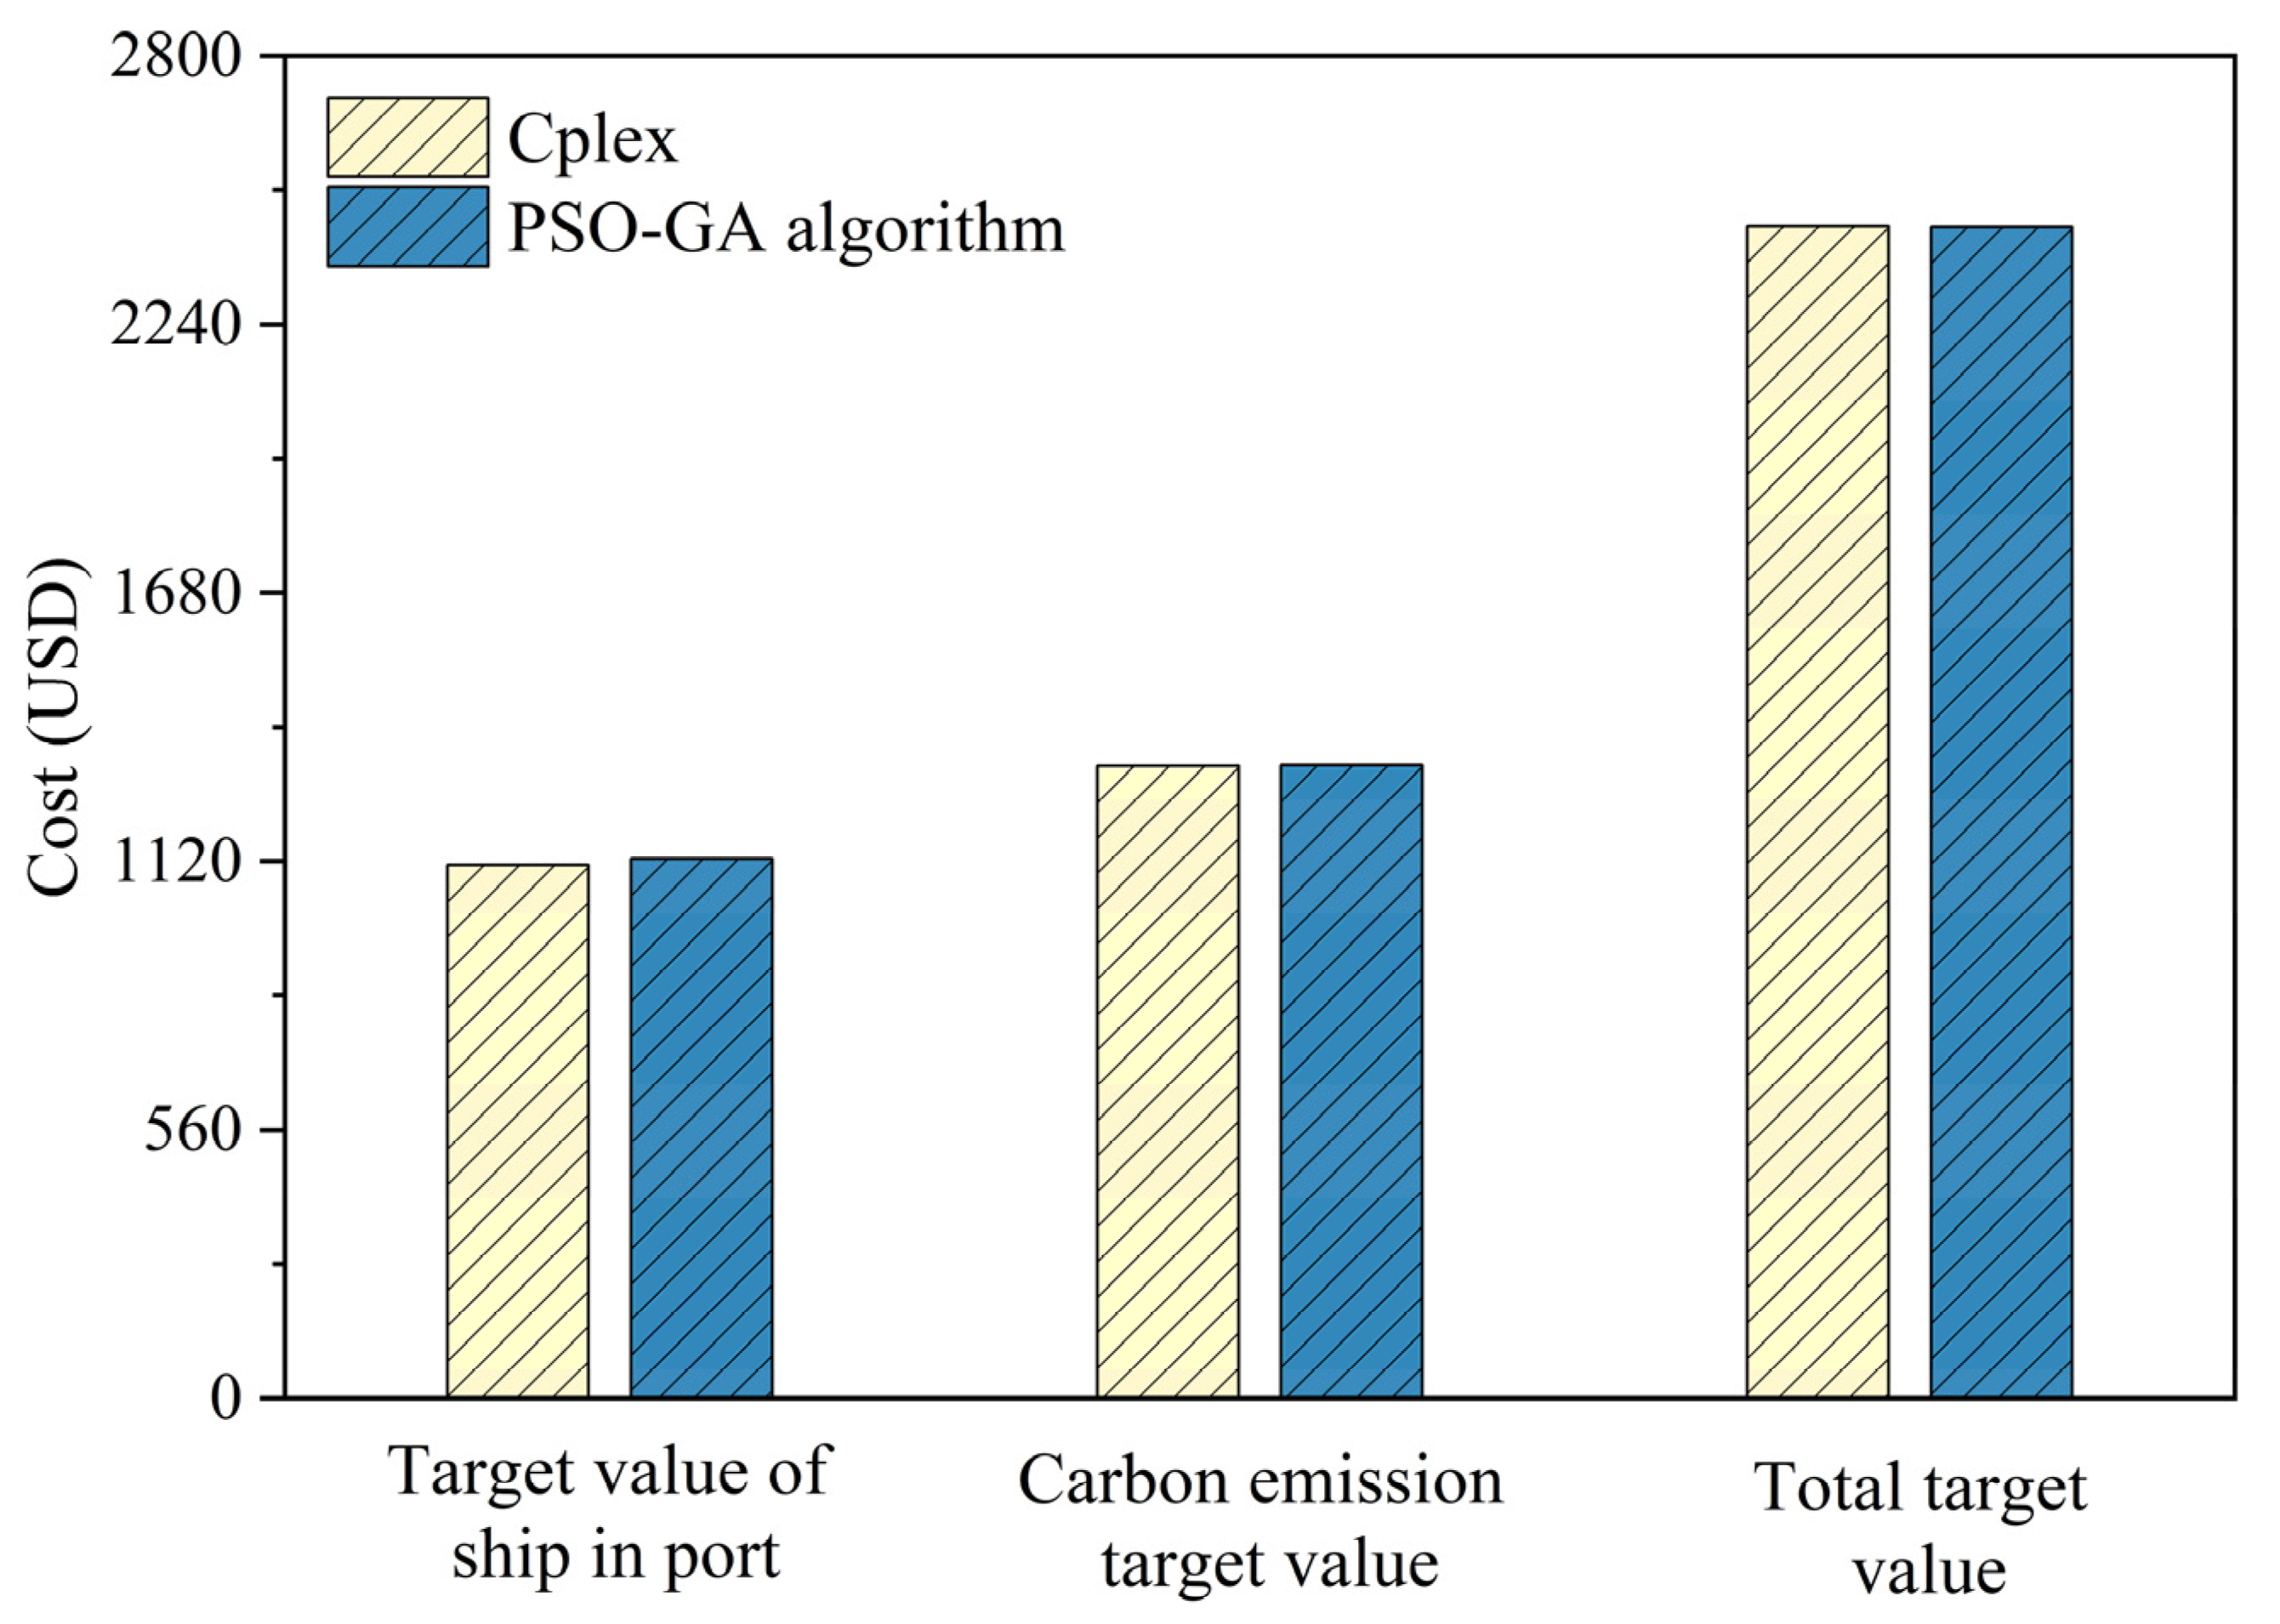
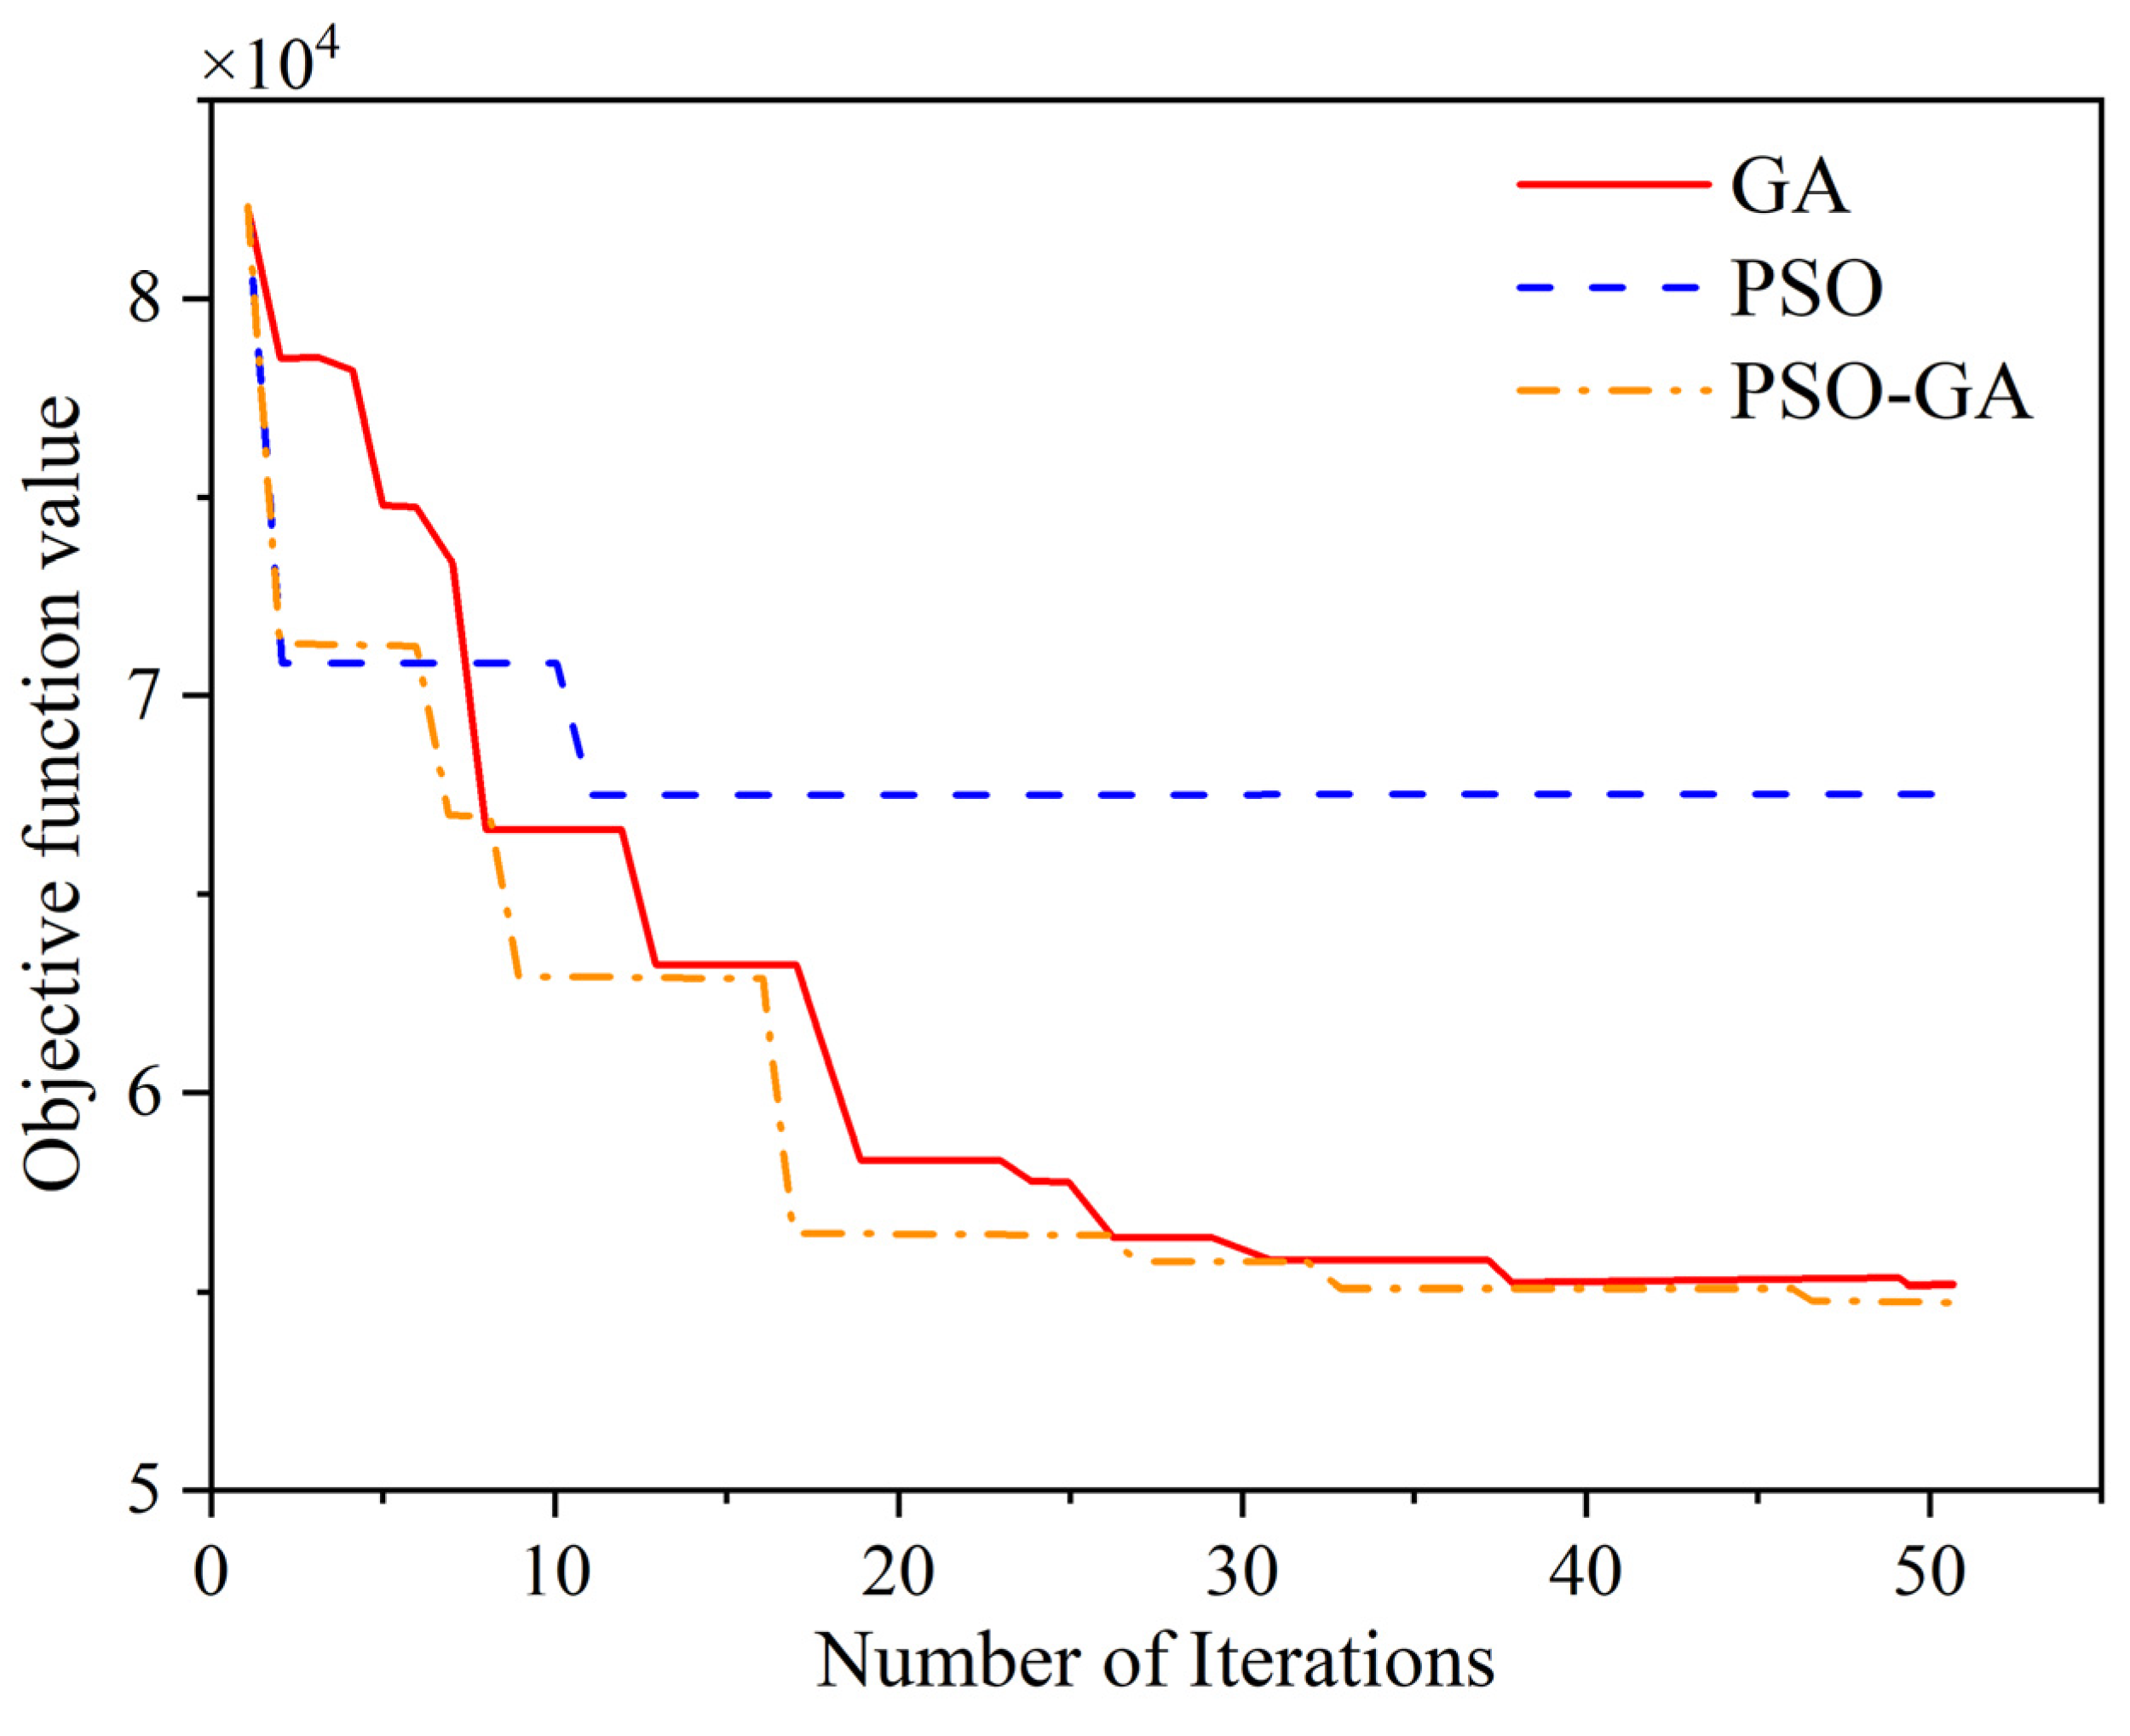
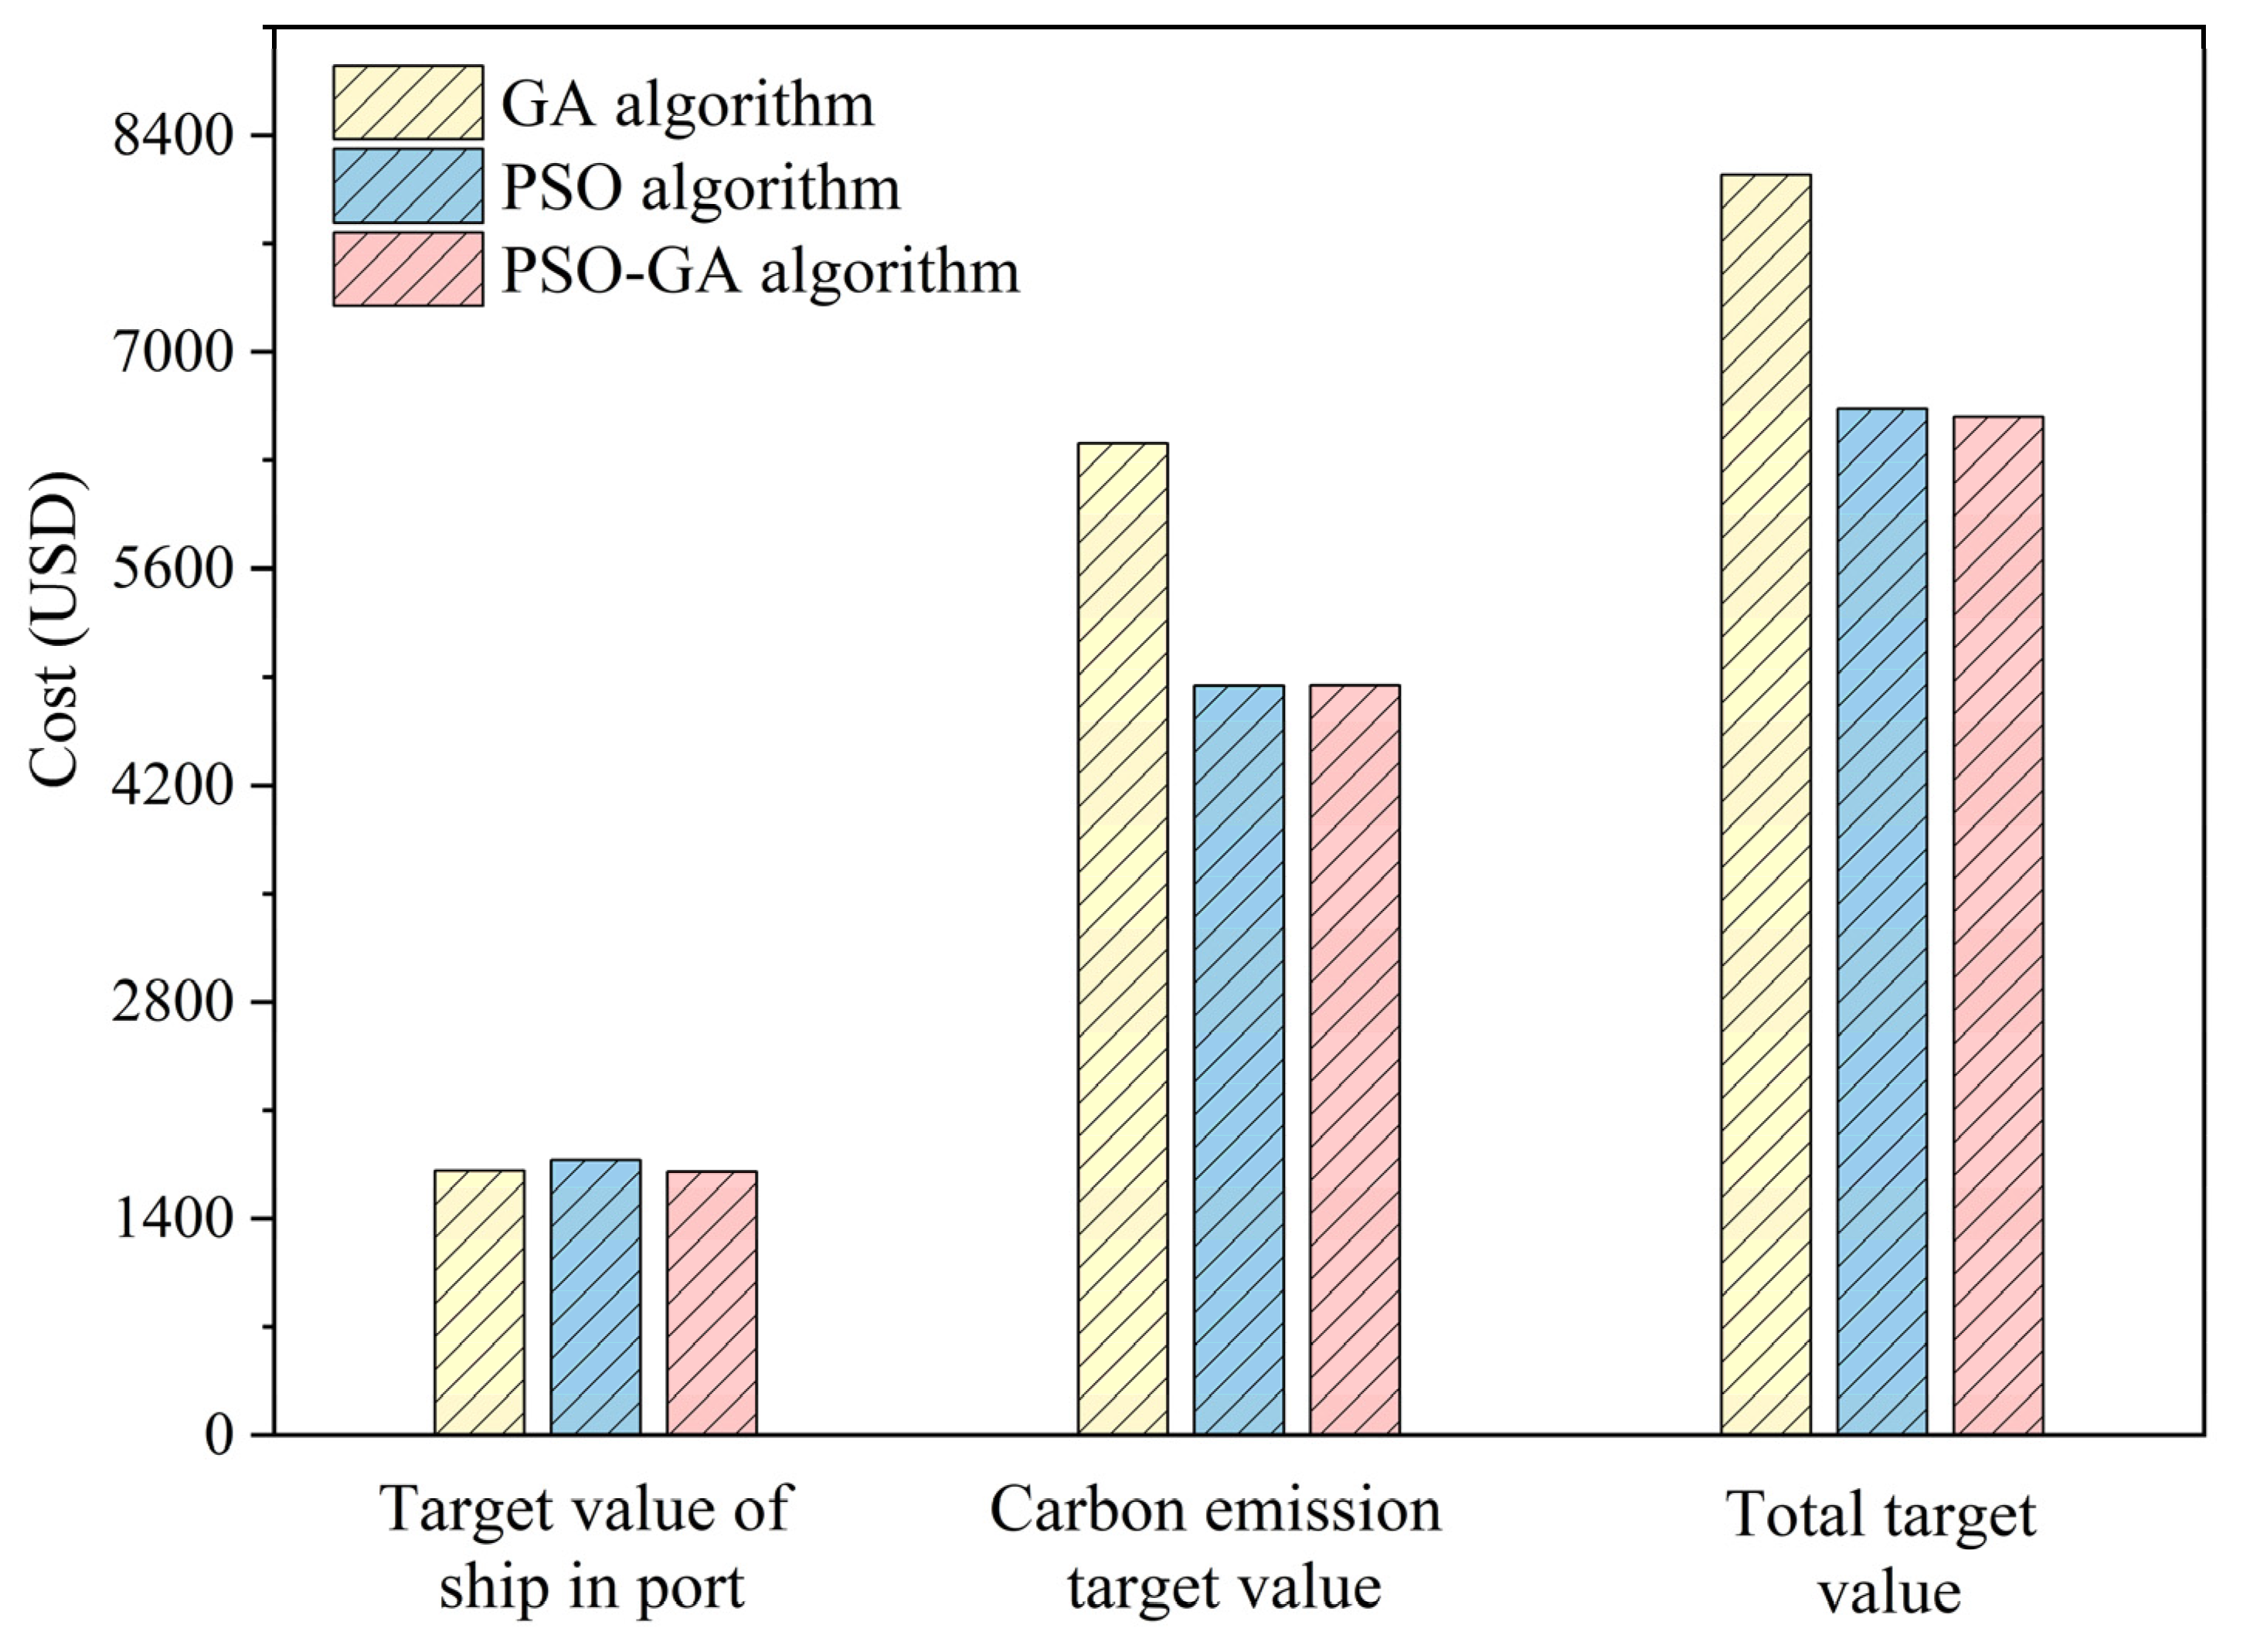
4.2. Algorithm Performance Analysis
4.3. Sensitivity Analysis of Quay Crane Handling Efficiency
4.4. Comprehensive Impact Analysis of Efficiency Improvement on Operational Costs and Carbon Emissions
5. Conclusions
Author Contributions
Funding
Institutional Review Board Statement
Informed Consent Statement
Data Availability Statement
Conflicts of Interest
Appendix A

| Currency | Exchange Rate to 1 USD |
|---|---|
| USD (US Dollar) | 1 |
| CNY (Chinese Yuan) | 7.3 |
| EUR (Euro) | 0.92 |
| GBP (British Pound) | 0.78 |
| JPY (Japanese Yen) | 138.5 |
| AUD (Australian Dollar) | 1.44 |
References
- Wang, T.; Du, Y.; Fang, D.; Li, Z.-C. Berth allocation and quay crane assignment for the trade-off between service efficiency and operating cost considering carbon emission taxation. Transp. Sci. 2020, 54, 1307–1331. [Google Scholar] [CrossRef]
- Duan, J.; Liu, Y.; Zhang, Q.; Qin, J. Combined configuration of container terminal berth and quay crane considering carbon cost. Math. Probl. Eng. 2021, 2021, 6043846. [Google Scholar] [CrossRef]
- Wang, W.Y.; Peng, Y.; Tang, G.L.; Song, X.Q. Influence of carbon emission constraint on container quay crane allocation. Adv. Mater. Res. 2013, 807, 936–940. [Google Scholar] [CrossRef]
- Yang, R.; Sun, J. Research on Berth-Quay Crane Joint Scheduling Considering Carbon Emission. J. Ind. Intell. Inf. 2021, 9, 1–6. [Google Scholar] [CrossRef]
- Lin, S.; Zhen, L.; Wang, W.; Tan, Z. Green berth and yard space allocation under carbon tax policy in tidal ports. Marit. Policy Manag. 2023, 50, 1080–1101. [Google Scholar] [CrossRef]
- Prayogo, D.N. Carbon emission modelling in container terminal operations planning using a system dynamics approach. In Proceedings of the IOP Conference Series: Materials Science and Engineering, Wuhan, China, 5–12 October 2019; p. 012014. [Google Scholar]
- Venturini, G.; Iris, Ç.; Kontovas, C.A.; Larsen, A. The multi-port berth allocation problem with speed optimization and emission considerations. Transp. Res. Part D Transp. Environ. 2017, 54, 142–159. [Google Scholar] [CrossRef]
- Wang, T.; Li, M.; Hu, H. Berth allocation and quay crane-yard truck assignment considering carbon emissions in port area. Int. J. Shipp. Transp. Logist. 2019, 11, 216–242. [Google Scholar] [CrossRef]
- Yu, F.; Teng, F.; Shan, Q.; Li, T.; Xiao, Y. Continuous berth allocation considering carbon emission and uncertainty. In Proceedings of the 2022 4th International Conference on Data-driven Optimization of Complex Systems (DOCS), Chengdu, China, 28–30 October 2022; pp. 1–6. [Google Scholar]
- Jiang, X.; Zhong, M.; Shi, J.; Li, W.; Sui, Y.; Dou, Y. Overall scheduling model for vessels scheduling and berth allocation for ports with restricted channels that considers carbon emissions. J. Mar. Sci. Eng. 2022, 10, 1757. [Google Scholar] [CrossRef]
- Sharifi, S.; Hosseini, S.F.; Kananizadeh, M.; Gholami, H. A new multi-objective model for berth allocation and quay crane assignment problem with speed optimization and air emission considerations: A case study of Rajaee Port in Iran. Int. J. Marit. Technol. 2023, 17, 25–48. [Google Scholar] [CrossRef]
- Yu, F.; Shan, Q.; Xiao, Y.; Teng, F. Robust Low-Carbon Discrete Berth Allocation under Uncertainty. Int. Trans. Electr. Energy Syst. 2022, 2022, 5310004. [Google Scholar] [CrossRef]
- Fan, H.; Yu, J.; Liu, X. Tramp ship routing and scheduling with speed optimization considering carbon emissions. Sustainability 2019, 11, 6367. [Google Scholar] [CrossRef]
- Park, Y.-M.; Kim, K.H. A scheduling method for berth and quay cranes. OR Spectr. 2003, 25, 1–23. [Google Scholar] [CrossRef]
- Imai, A.; Chen, H.C.; Nishimura, E.; Papadimitriou, S. The simultaneous berth and quay crane allocation problem. Transp. Res. Part E Logist. Transp. Rev. 2008, 44, 900–920. [Google Scholar] [CrossRef]
- Xu, J.; Shi, G. A study of integrated continuous berth allocation and quay crane scheduling. In Proceedings of the 2022 2nd Conference on High Performance Computing and Communication Engineering (HPCCE 2022), Harbin, China, 16–18 December 2023; pp. 141–146. [Google Scholar]
- Nazri, S.N.A.; Mokhtar, K.; Abu Bakar, A.; McLellan, B.C.; Mhd Ruslan, S.M. Optimization berth allocation in container terminals: A Pyomo and Google Colab approach. Ocean Coast. Manag. 2024, 258, 107359. [Google Scholar] [CrossRef]
- Dai, Y.; Li, Z.; Wang, B. Optimizing berth allocation in maritime transportation with quay crane setup times using reinforcement learning. J. Mar. Sci. Eng. 2023, 11, 1025. [Google Scholar] [CrossRef]
- Tang, X.; Liu, C.; Li, X.; Ji, Y. Distributionally Robust Programming of Berth-Allocation-with-Crane-Allocation Problem with Uncertain Quay-Crane-Handling Efficiency. Sustainability 2023, 15, 13448. [Google Scholar] [CrossRef]
- Fatemi-Anaraki, S.; Tavakkoli-Moghaddam, R.; Abdolhamidi, D.; Vahedi-Nouri, B. Simultaneous waterway scheduling, berth allocation, and quay crane assignment: A novel matheuristic approach. Int. J. Prod. Res. 2021, 59, 7576–7593. [Google Scholar] [CrossRef]
- Chargui, K.; Zouadi, T.; Sreedharan, V.R. Berth and quay crane allocation and scheduling problem with renewable energy uncertainty: A robust exact decomposition. Comput. Oper. Res. 2023, 156, 106251. [Google Scholar] [CrossRef]
- Li, Y.; Chu, F.; Zheng, F.; Liu, M. A bi-objective optimization for integrated berth allocation and quay crane assignment with preventive maintenance activities. IEEE Trans. Intell. Transp. Syst. 2020, 23, 2938–2955. [Google Scholar] [CrossRef]
- Yin, W.; Xu, B.; Yang, Y. Integrated Allocation and Scheduling Problem for Berth and Quay Crane in U-shaped Container Port under Spatio-temporal Asynchronous Propagation. In Proceedings of the 2022 International Symposium on Sensing and Instrumentation in 5G and IoT Era (ISSI), Shanghai, China, 17–18 November 2022; pp. 47–52. [Google Scholar]
- Chargui, K.; Zouadi, T.; Sreedharan, V.R.; El Fallahi, A.; Reghioui, M. A novel robust exact decomposition algorithm for berth and quay crane allocation and scheduling problem considering uncertainty and energy efficiency. Omega 2023, 118, 102868. [Google Scholar] [CrossRef]
- Wang, Z.; Cheng, J.; Hu, H. A Proactive-Reactive-Based Approach for Continuous Berth Allocation and Quay Crane Assignment Problems with Hybrid Uncertainty. J. Mar. Sci. Eng. 2024, 12, 182. [Google Scholar] [CrossRef]
- Cao, X.; Yang, Z.-Y.; Hong, W.-C.; Xu, R.-Z.; Wang, Y.-T. Optimizing berth-quay crane allocation considering economic factors using chaotic quantum SSA. Appl. Artif. Intell. 2022, 36, 2073719. [Google Scholar] [CrossRef]
- Ji, B.; Huang, H.; Samson, S.Y. An enhanced NSGA-II for solving berth allocation and quay crane assignment problem with stochastic arrival times. IEEE Trans. Intell. Transp. Syst. 2022, 24, 459–473. [Google Scholar] [CrossRef]


| Indices: | |
| set of ships, ; | |
| set of small ships; | |
| set of medium-sized ships; | |
| set of large ships; | |
| A tidal sequence, each sequence includes one high tide and one low tide; | |
| set of tidal sequences; | |
| duration of high tide; | |
| set of time periods, ; | |
| set of quay cranes, , is the total number of quay cranes; | |
| length of the container terminal berth shoreline | |
| length of the ship’s hull; | |
| ship’s estimated time of arrival (ETA); | |
| ship’s estimated time of departure (ETD); | |
| maximum number of quay cranes that can be allocated to the ship; | |
| minimum number of quay cranes that can be allocated to the ship; | |
| The volume of containers to be loaded/unloaded for the ship; | |
| loading/unloading efficiency of the quay crane; | |
| carbon emission factor of the ship during its stay in the port; | |
| auxiliary engine’s rated power for the ship; | |
| ship’s load factor; | |
| number of auxiliary engines on the ship; | |
| carbon emission factor of the quay crane; | |
| carbon tax; | |
| energy consumption per unit time of each quay crane; | |
| cost coefficient for ships waiting at anchor to dock; | |
| cost coefficient for ships with delayed departures; | |
| cost coefficient for ships deviating from their preferred berth; | |
| ship’s preferred berth (measured from the bow); | |
| a very large positive number. | |
| Decision variables: | |
| value of 1 when a ship docks in front of another ship; otherwise, it is 0. | |
| value of 1 when a ship docks after another ship has departed; otherwise, it is 0. | |
| actual docking position of the ship. | |
| actual docking time of the ship. | |
| actual departure time of the ship. | |
| number of the foremost quay cranes allocated to the ship. | |
| number of the rearmost quay cranes allocated to the ship. | |
| Indicates whether the allocated number of quay cranes can meet the loading and unloading requirements of the ship. If not, it takes a value of 1; otherwise, it is 0. | |
| value of 1 if the ship enters the channel and docks during the nth high tide period; otherwise, it is 0. | |
| value of 1 if the ship enters the channel and departs during the nth high tide period; otherwise, it is 0. | |
| Auxiliary variables: | |
| deviation between the ship’s actual docking position and its preferred berth position; | |
| delay in the ship’s departure time. | |
| Parameter | Meaning | Value |
|---|---|---|
| Carbon Emission Factor During Vessel Stay | kWh | |
| Quay Crane Carbon Emission Factor | 1.0935 kg/kWh | |
| Energy Consumption per Quay Crane per Unit Time | 93.1 kWh/h | |
| Number of Auxiliary Engines per Vessel | 4 | |
| Rated Power of Vessel Auxiliary Engines | 250 kW | |
| Vessel Load Rate | 0.5 | |
| Departure Delay Cost | 17.08 USD/h | |
| Anchorage Waiting Cost | 5.74 USD/h | |
| Carbon Tax | 0.035 USD/kg |
| Vessel ID | Vessel Length /m | Preferred Berth /m | Arrival Time /h | Expected Departure Time /h | Handling Volume (TEU) /TEU | Minimum Quay Cranes | Maximum Quay Cranes | Deviation Cost /(USD/m) |
|---|---|---|---|---|---|---|---|---|
| 1 | 285 | 100 | 1:00 | 10:30 | 2360 | 2 | 5 | 3.30 |
| 2 | 130 | 300 | 12:30 | 14:57 | 520 | 1 | 3 | 0.73 |
| 3 | 326 | 0 | 10:10 | 21:24 | 2100 | 2 | 6 | 2.94 |
| 4 | 136 | 200 | 13:10 | 16:59 | 735 | 1 | 3 | 1.03 |
| 5 | 81 | 300 | 18:30 | 20:21 | 280 | 1 | 2 | 0.39 |
| Vessel ID | Berth Position | Berthing Time | Departure Time | Quay Crane Allocation |
|---|---|---|---|---|
| 1 | 327 | 2:00 | 16:00 | 5 |
| 2 | 748 | 13:00 | 18:00 | 3 |
| 3 | 1 | 13:00 | 24:00 | 6 |
| 4 | 612 | 14:00 | 21:00 | 3 |
| 5 | 327 | 19:00 | 23:00 | 2 |
| Vessel ID | Vessel Length /m | Preferred Berth /m | Arrival Time /h | Expected Departure Time /h | Handling Volume (TEU) /TEU | Minimum Quay Cranes | Maximum Quay Cranes | Deviation Cost /USD/m) |
|---|---|---|---|---|---|---|---|---|
| 1 | 120 | 25 | 1:00 | 16:00 | 366 | 1 | 3 | 0.51 |
| 2 | 130 | 570 | 2:00 | 14:00 | 1050 | 1 | 5 | 1.47 |
| 3 | 140 | 30 | 4:00 | 16:00 | 203 | 2 | 3 | 0.28 |
| 4 | 180 | 25 | 3:00 | 10:00 | 525 | 2 | 4 | 0.74 |
| 5 | 120 | 330 | 5:00 | 17:00 | 280 | 1 | 3 | 0.39 |
| 6 | 140 | 320 | 10:00 | 21:00 | 735 | 1 | 3 | 1.03 |
| 7 | 100 | 610 | 7:00 | 13:00 | 210 | 1 | 2 | 0.29 |
| 8 | 180 | 340 | 13:0 | 23:00 | 735 | 2 | 4 | 1.03 |
| 9 | 100 | 630 | 17:00 | 23:00 | 150 | 1 | 2 | 0.21 |
| 10 | 140 | 60 | 18:00 | 22:00 | 180 | 1 | 3 | 0.25 |
| 11 | 96 | 211 | 12:00 | 15:33 | 630 | 3 | 4 | 0.88 |
| 12 | 310 | 60 | 1:00 | 20:00 | 2200 | 2 | 5 | 3.08 |
| 13 | 326 | 675 | 10:10 | 21:24 | 2000 | 2 | 6 | 2.80 |
| 14 | 290 | 910 | 2:00 | 20:00 | 2300 | 3 | 6 | 3.22 |
| 15 | 320 | 989 | 0:00 | 23:58 | 2500 | 3 | 7 | 3.50 |
| Vessel ID | Berth Position | Berthing Time | Departure Time | Quay Crane Allocation |
|---|---|---|---|---|
| 1 | 621 | 2 | 6 | 3 |
| 2 | 491 | 2 | 17 | 2 |
| 3 | 1 | 9 | 11 | 3 |
| 4 | 1 | 3 | 8 | 3 |
| 5 | 621 | 7 | 11 | 2 |
| 6 | 321 | 16 | 23 | 3 |
| 7 | 741 | 8 | 11 | 2 |
| 8 | 1 | 14 | 25 | 2 |
| 9 | 461 | 18 | 21 | 2 |
| 10 | 181 | 18 | 20 | 3 |
| 11 | 181 | 21 | 27 | 3 |
| 12 | 181 | 2 | 15 | 5 |
| 13 | 621 | 13 | 28 | 4 |
| 14 | 947 | 2 | 13 | 6 |
| 15 | 947 | 14 | 26 | 6 |
| Vessel ID | Vessel Length /m | Preferred Berth /m | Arrival Time /h | Expected Departure Time /h | Handling Volume (TEU) /TEU | Minimum Quay Cranes | Maximum Quay Cranes | Deviation Cost /USD/m) |
|---|---|---|---|---|---|---|---|---|
| 1 | 120 | 25 | 1:00 | 16:00 | 366 | 1 | 3 | 0.51 |
| 2 | 130 | 570 | 2:00 | 14:00 | 1050 | 1 | 5 | 1.47 |
| 3 | 140 | 30 | 4:00 | 16:00 | 203 | 2 | 3 | 0.28 |
| 4 | 180 | 320 | 5:00 | 9:00 | 294 | 1 | 3 | 0.41 |
| 5 | 180 | 25 | 3:00 | 10:00 | 525 | 2 | 4 | 0.74 |
| 6 | 120 | 330 | 5:00 | 17:00 | 280 | 1 | 3 | 0.39 |
| 7 | 140 | 320 | 10:00 | 21:00 | 735 | 1 | 3 | 1.03 |
| 8 | 180 | 340 | 10:00 | 22:00 | 840 | 2 | 5 | 1.18 |
| 9 | 100 | 610 | 7:00 | 13:00 | 210 | 1 | 2 | 0.29 |
| 10 | 180 | 340 | 13:00 | 23:00 | 735 | 2 | 4 | 1.03 |
| 11 | 180 | 570 | 12:00 | 23:00 | 635 | 1 | 3 | 0.89 |
| 12 | 100 | 630 | 17:00 | 23:00 | 150 | 1 | 2 | 0.21 |
| 13 | 140 | 1270 | 13:00 | 20:00 | 190 | 1 | 3 | 0.27 |
| 14 | 140 | 60 | 18:00 | 22:00 | 180 | 1 | 3 | 0.25 |
| 15 | 96 | 211 | 12:00 | 15:33 | 630 | 3 | 4 | 0.88 |
| 16 | 285 | 300 | 1:00 | 10:30 | 2360 | 5 | 7 | 3.30 |
| 17 | 310 | 60 | 1:00 | 20:00 | 2200 | 2 | 5 | 3.08 |
| 18 | 326 | 675 | 1:10 | 10:24 | 1710 | 5 | 8 | 2.39 |
| 19 | 290 | 910 | 2:00 | 20:00 | 2300 | 2 | 5 | 3.22 |
| 20 | 320 | 989 | 0:00 | 23:58 | 2500 | 3 | 5 | 3.50 |
| Vessel ID | Berth Position | Berthing Time | Departure Time | Quay Crane Allocation |
|---|---|---|---|---|
| 1 | 1 | 2 | 6 | 3 |
| 2 | 121 | 2 | 17 | 2 |
| 3 | 251 | 5 | 7 | 3 |
| 4 | 1002 | 7 | 10 | 3 |
| 5 | 237 | 21 | 25 | 4 |
| 6 | 1 | 8 | 16 | 1 |
| 7 | 251 | 11 | 18 | 3 |
| 8 | 311 | 26 | 31 | 5 |
| 9 | 1182 | 8 | 11 | 2 |
| 10 | 491 | 14 | 25 | 3 |
| 11 | 491 | 28 | 35 | 2 |
| 12 | 391 | 17 | 20 | 2 |
| 13 | 961 | 14 | 17 | 3 |
| 14 | 1 | 18 | 20 | 3 |
| 15 | 141 | 19 | 25 | 3 |
| 16 | 391 | 2 | 12 | 7 |
| 17 | 1 | 26 | 39 | 5 |
| 18 | 676 | 2 | 12 | 5 |
| 19 | 671 | 13 | 27 | 5 |
| 20 | 961 | 18 | 36 | 5 |
| Solution | Cost (USD) | Cost (USD) | Cost (USD) | Cost (USD) | Cost (USD) | Carbon Emission Cost (USD) | Vessel In-Port Cost (USD) | Total Cost (USD) |
|---|---|---|---|---|---|---|---|---|
| CPLEX | 559.83 | 586.14 | 29.66 | 287.23 | 1035.12 | 1145.97 | 1352.00 | 2497.97 |
| PSO-GA | 561.80 | 586.14 | 29.73 | 290.31 | 1035.55 | 1147.94 | 1355.59 | 2503.52 |
| Solution | Cost (USD) | Cost (USD) | Cost (USD) | Cost (USD) | Cost (USD) | Carbon Emission Cost (USD) | Vessel In-Port Cost (USD) | Total Cost (USD) |
|---|---|---|---|---|---|---|---|---|
| GA | 1468.17 | 527.35 | 705.07 | 1854.61 | 4890.12 | 1995.52 | 7449.79 | 9445.3 |
| PSO | 1563.79 | 509.49 | 750.99 | 1820.45 | 3065.4 | 2073.32 | 5636.82 | 7710.14 |
| PSO-GA | 1480.12 | 516.66 | 710.81 | 1581.33 | 3360.87 | 1996.78 | 5652.99 | 7649.77 |
Disclaimer/Publisher’s Note: The statements, opinions and data contained in all publications are solely those of the individual author(s) and contributor(s) and not of MDPI and/or the editor(s). MDPI and/or the editor(s) disclaim responsibility for any injury to people or property resulting from any ideas, methods, instructions or products referred to in the content. |
© 2025 by the authors. Licensee MDPI, Basel, Switzerland. This article is an open access article distributed under the terms and conditions of the Creative Commons Attribution (CC BY) license (https://creativecommons.org/licenses/by/4.0/).
Share and Cite
Lu, H.; Lu, X. Joint Optimization of Berths and Quay Cranes Considering Carbon Emissions: A Case Study of a Container Terminal in China. J. Mar. Sci. Eng. 2025, 13, 148. https://doi.org/10.3390/jmse13010148
Lu H, Lu X. Joint Optimization of Berths and Quay Cranes Considering Carbon Emissions: A Case Study of a Container Terminal in China. Journal of Marine Science and Engineering. 2025; 13(1):148. https://doi.org/10.3390/jmse13010148
Chicago/Turabian StyleLu, Houjun, and Xiao Lu. 2025. "Joint Optimization of Berths and Quay Cranes Considering Carbon Emissions: A Case Study of a Container Terminal in China" Journal of Marine Science and Engineering 13, no. 1: 148. https://doi.org/10.3390/jmse13010148
APA StyleLu, H., & Lu, X. (2025). Joint Optimization of Berths and Quay Cranes Considering Carbon Emissions: A Case Study of a Container Terminal in China. Journal of Marine Science and Engineering, 13(1), 148. https://doi.org/10.3390/jmse13010148