You are currently viewing a new version of our website. To view the old version click .
Journal of Marine Science and Engineering
  • Article
  • Open Access

19 June 2024

A Novel Method for Estimating the Undrained Shear Strength of Marine Soil Based on CPTU Tests

,
,
,
and
1
PowerChina Huadong Engineering Corporation Limited, Hangzhou 311122, China
2
College of Landscape Architecture, Zhejiang A & F University, Hangzhou 311300, China
3
College of Architecture and Energy Engineering, Wenzhou University of Technology, Wenzhou 325035, China
*
Authors to whom correspondence should be addressed.
This article belongs to the Special Issue Advances in Sedimentology and Coastal and Marine Geology—2nd Edition

Abstract

The undrained shear strength is an essential parameter in the foundation design of marine structures. Due to the complex marine environment and technical limitations, it is difficult and costly to obtain offshore samples. Piezocone penetration tests (CPTU) are relatively low-cost compared to drilling and sampling methods. Therefore, based on the soil behavior type index (Ic) derived from CPTU results, a model for estimating cone factors (Nkt, Nke) is proposed to improve the accuracy of estimation of undrained shear strength. The result shows that the soil behavior type index (Ic) and cone factors take on a negatively correlated exponential relation. Incorporating a cone factor that varies with the soil behavior type index (Ic) significantly enhances the accuracy of undrained shear strength predictions compared to the conventional method of using a constant cone factor. This approach reduces the root mean square error (RMSE) for Nkt (Nke) from 0.124 (0.126) MPa to 0.056 (0.06) MPa, and the mean absolute error (MAE) from 0.0154 (0.016) MPa to 0.0032 (0.0036) MPa. The method was validated at an additional location and the predictions were in high agreement with the results of the consolidated quick direct shear test. The developed method can serve as an effective tool used in the design of foundations of marine structures.

1. Introduction

The utilization of offshore wind energy resources is a crucial driver for economic development [1,2] and an essential pathway towards achieving net-zero carbon goals. In recent years, offshore wind power construction has been gradually expanded from offshore areas to deeper parts of the sea, which further causes more difficulties and costs in soil sampling of marine geotechnical surveys [3]. As a result, in situ testing techniques, such as standard penetration tests (SPT) [4], cone penetration tests (CPT) [5], and piezocone penetration tests (CPTU) [6], have been applied in marine soil investigations. Compared to the traditional SPT, CPTUs have significant advantages, such as providing continuous testing data and suitability for more complex environmental conditions; as a result, they are extensively utilized in marine geotechnical surveys. However, existing empirical formulae relating CPTU results to soil parameters are primarily based on terrestrial environments [7,8] and are unsuitable for marine conditions [9]. Therefore, it is of great importance to conduct in-depth research on the empirical formulae connecting CPTU results and marine soil parameters.
In the context of pile foundation design for marine structures, the undrained shear strength of cohesive soil emerges as a critical parameter [10]. Consequently, the accurate prediction of undrained shear strength assumes paramount importance as a central focus in exploring the correlation between CPTU data and soil parameters. The penetration mechanism of CPTU in cohesive soils can be classified into theoretical and empirical methods. The theoretical method commonly includes bearing capacity theory [11], cavity expansion theory [12], the strain path method [13], and moving point dislocation theory [14]. Due to idealized assumptions in these theoretical methods, significant deviations often occur. Hence, scholars began to explore suitable empirical methods to improve the reliability of the prediction with various empirical methods being developed, such as the “total” cone tip resistance method [15], the effective cone resistance method [12], and the excess pore water pressure method [16]. However, the cone factors are still not fixed and vary greatly. To obtain more accurate cone factors, researchers further considered soil characteristic factors to improve the estimating precision of the undrained shear strength from CPTU. When considering the plasticity index of the soil [17], the estimated undrained shear strength values obtained from CPTU are usually very close to laboratory experiment results. Nevertheless, the correlation between cone factors and the plasticity index is only valid for specific soil conditions in certain regions [18,19]. In addition, cone factors are also related to the over-consolidation ratio [20], natural moisture content [21], and fines content [22] of the soil. To obtain the plasticity index, the over-consolidation ratio of soils, etc., soil sampling is required, which unavoidably increases the engineering costs. In order to solve this problem, Bol et al. [23,24] classified soils by means of a soil behavior type index and then gave empirical coefficients for the cone coefficients corresponding to the different soil classes. Nevertheless, the quantitative relation between Ic and cone factors was not provided in Bol’s study. With the development of computer science, machine learning algorithms have been employed to estimate the undrained shear strength with high accuracy [25,26,27]. Moreover, these algorithms are gradually overcoming the limitation of not being able to provide deterministic functional relationships.
To facilitate practical engineering applications and reduce costs associated with marine geotechnical exploration, this study categorized soil into distinct intervals based on the soil behavior type index. Utilizing data obtained from indoor consolidated quick direct shear tests, it established a robust regression model to elucidate the explicit functional relationship between the soil behavior type index and the cone factor. The predictive performance of this model was rigorously assessed through comprehensive evaluation metrics, including the coefficient of determination (R2), root mean square error (RMSE), and mean absolute error (MAE). Furthermore, validation exercises were conducted in nearby marine project sites to confirm the applicability of the proposed methodology.

2. Methods for Calculating Undrained Shear Strength and Soil Behavior Type Index

The “total” cone tip resistance qt method and the effective cone resistance qe method are common methods for estimating undrained shear strength Su from CPTU results. In the following part, we also discuss the undrained shear strength from a consolidated quick direct shear test and the computation of the soil behavior type index Ic.

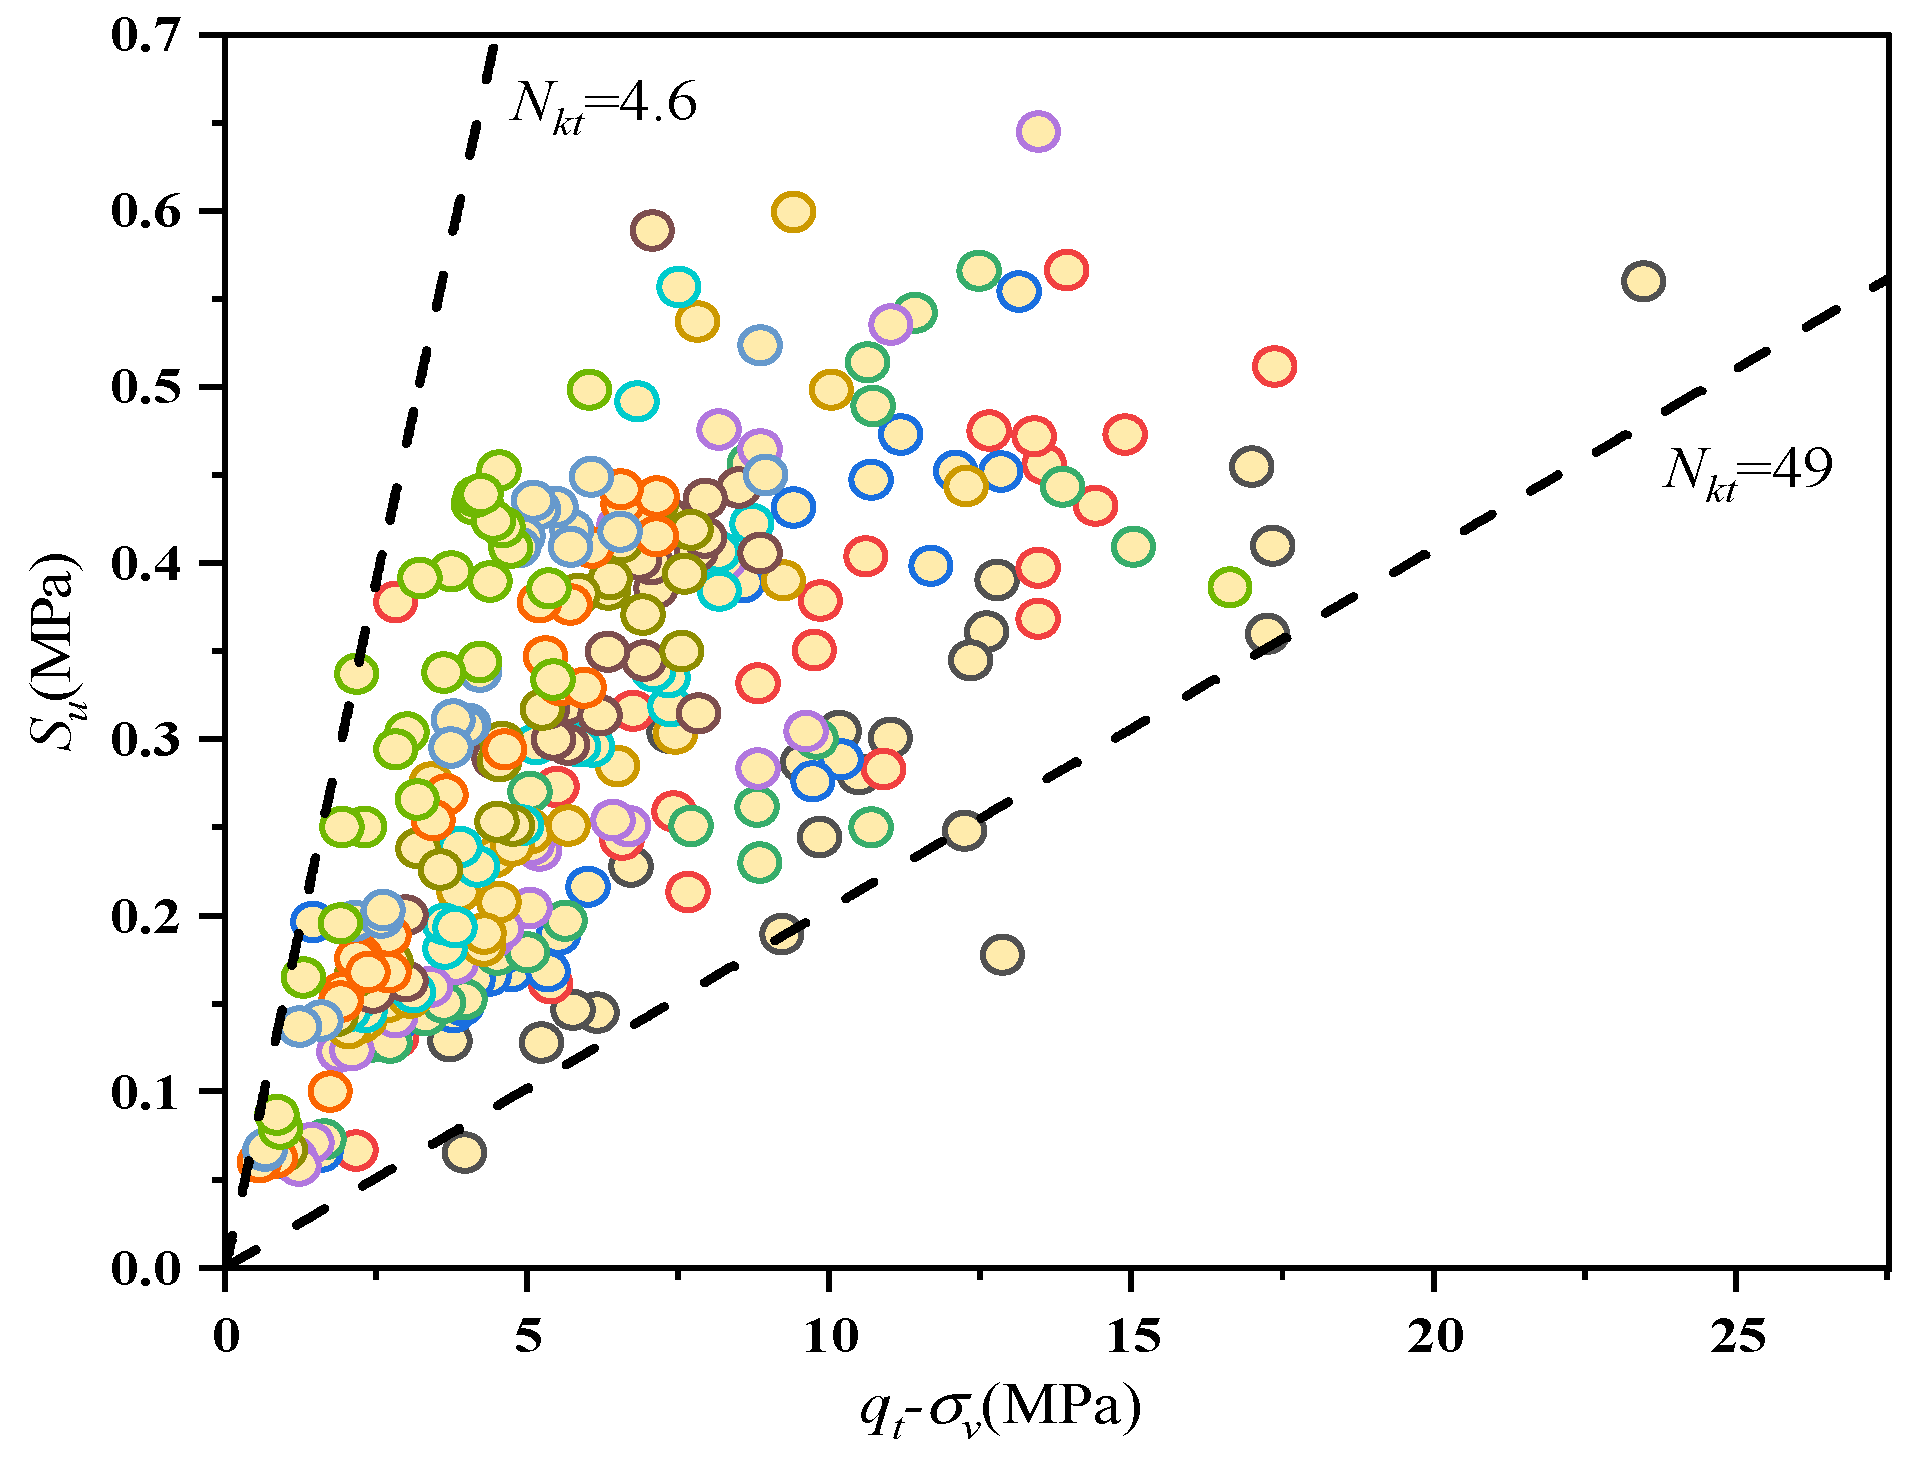
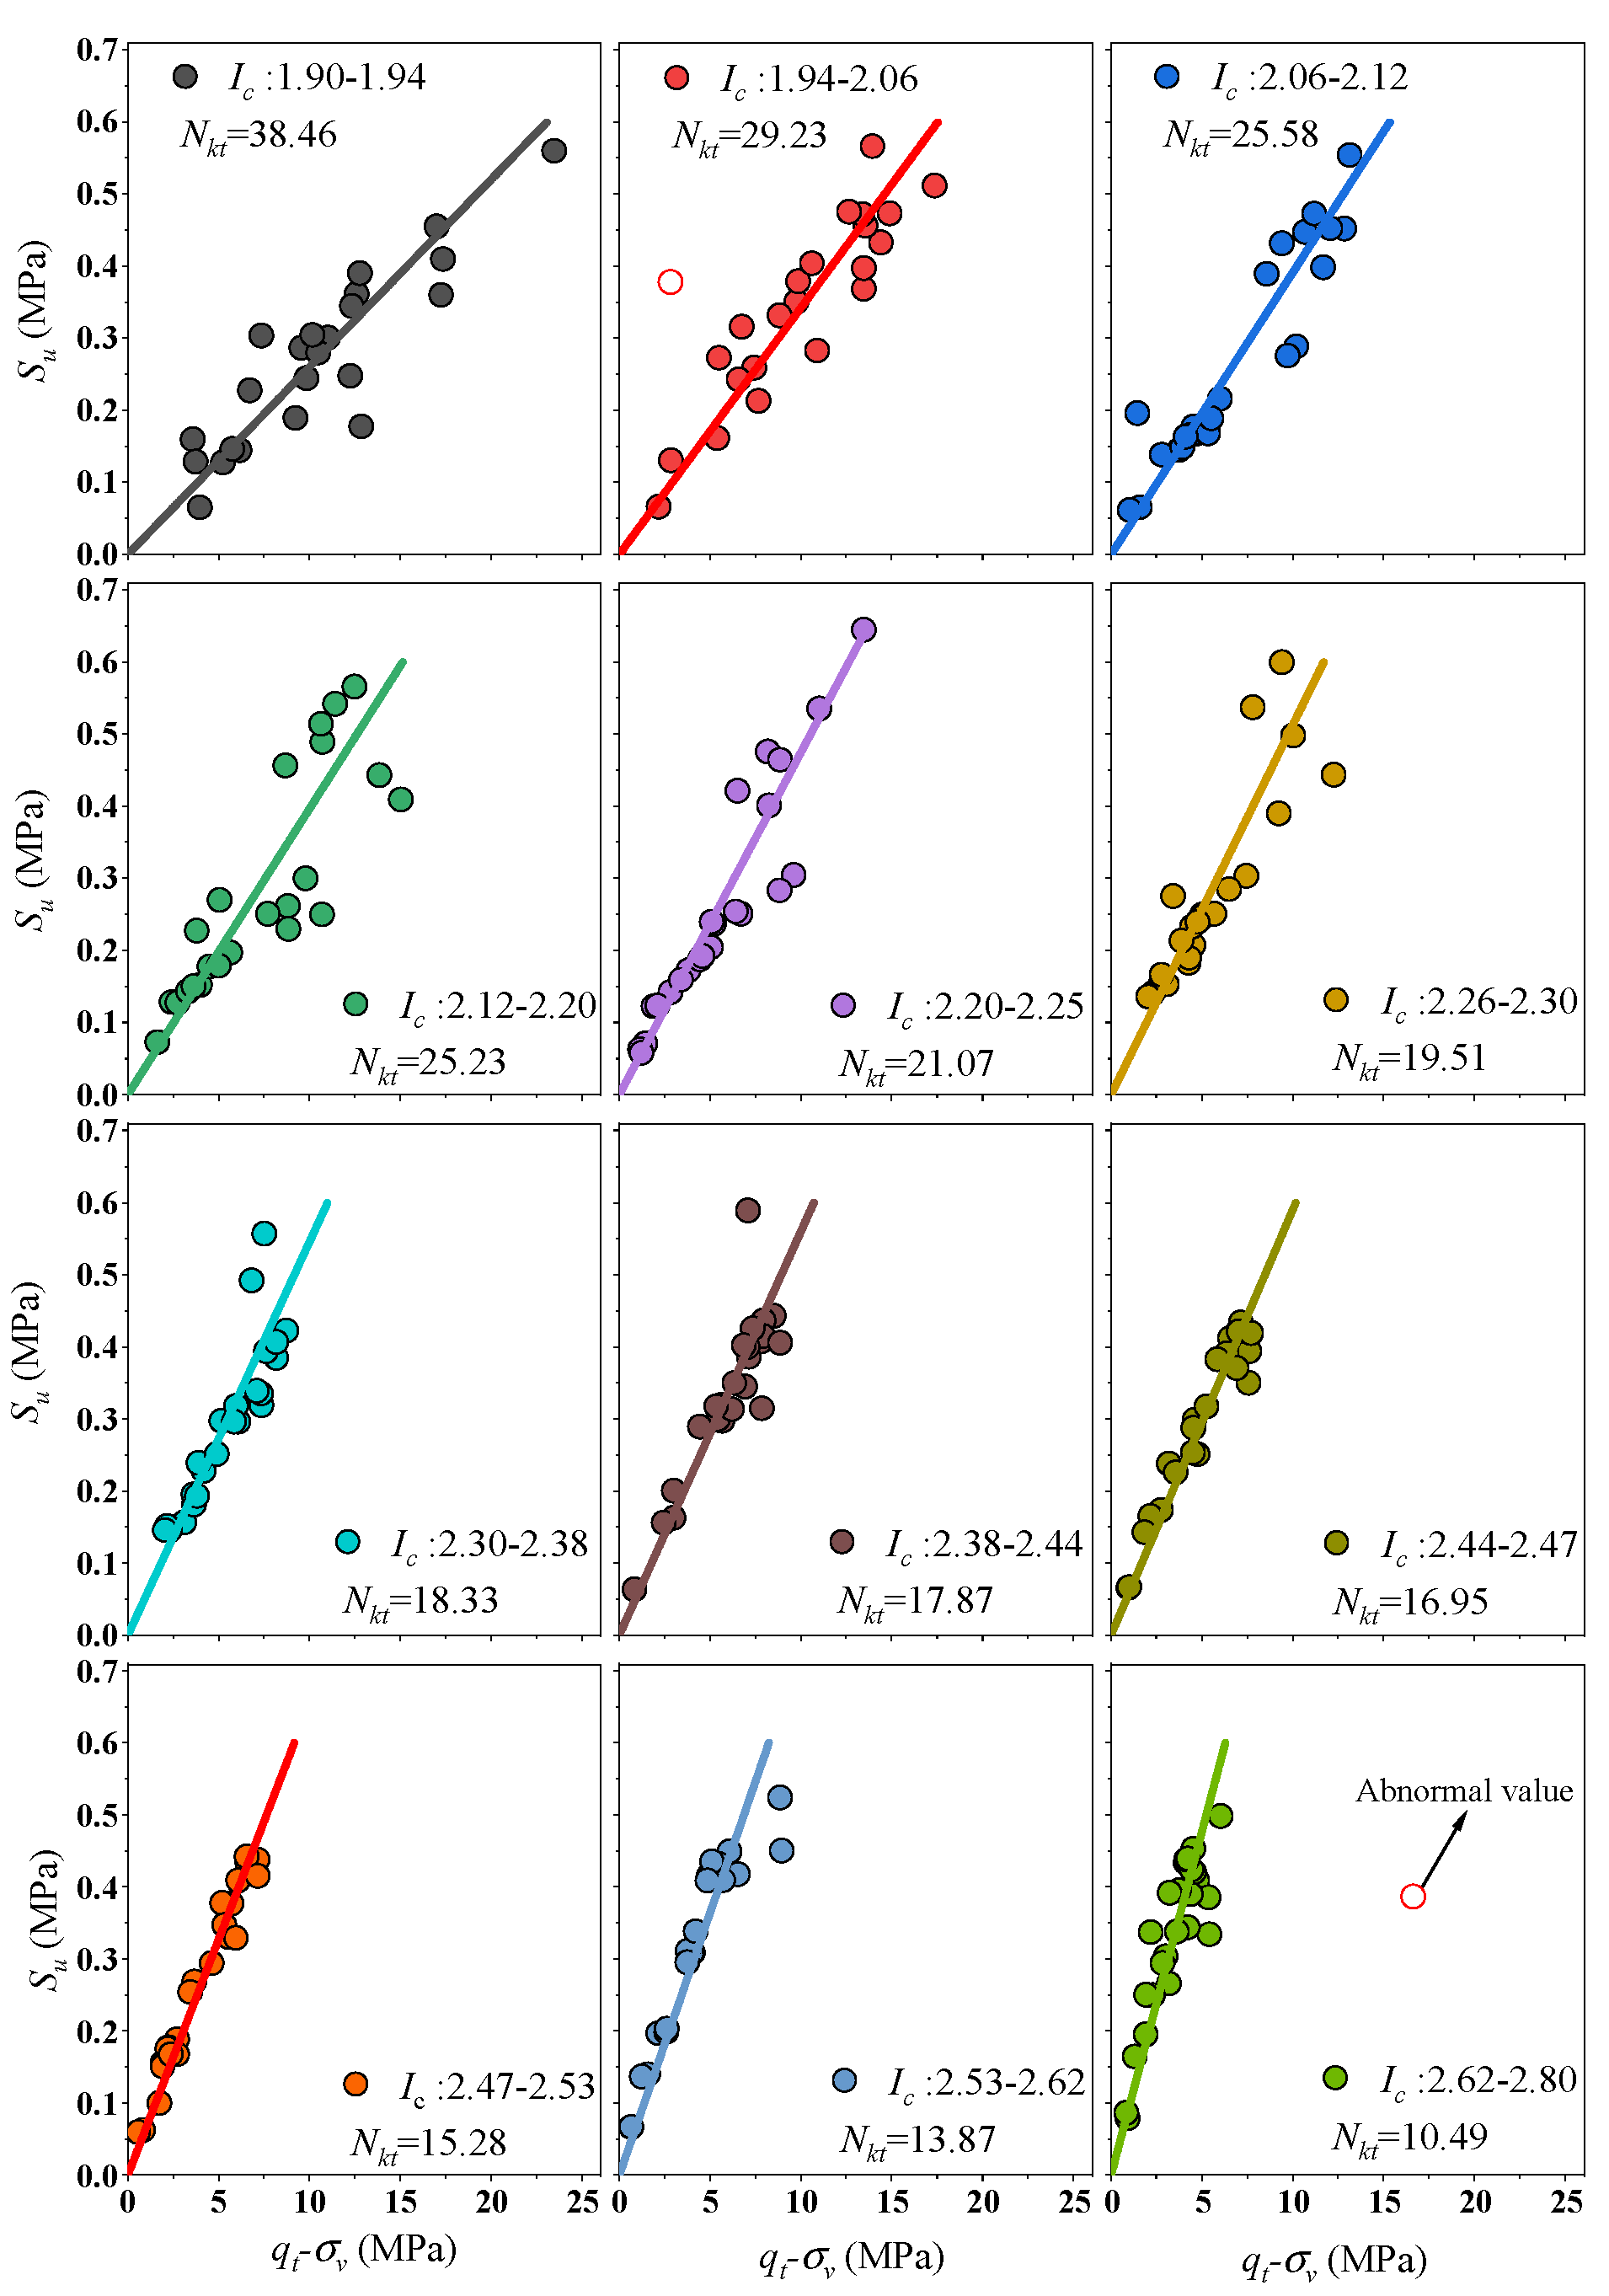
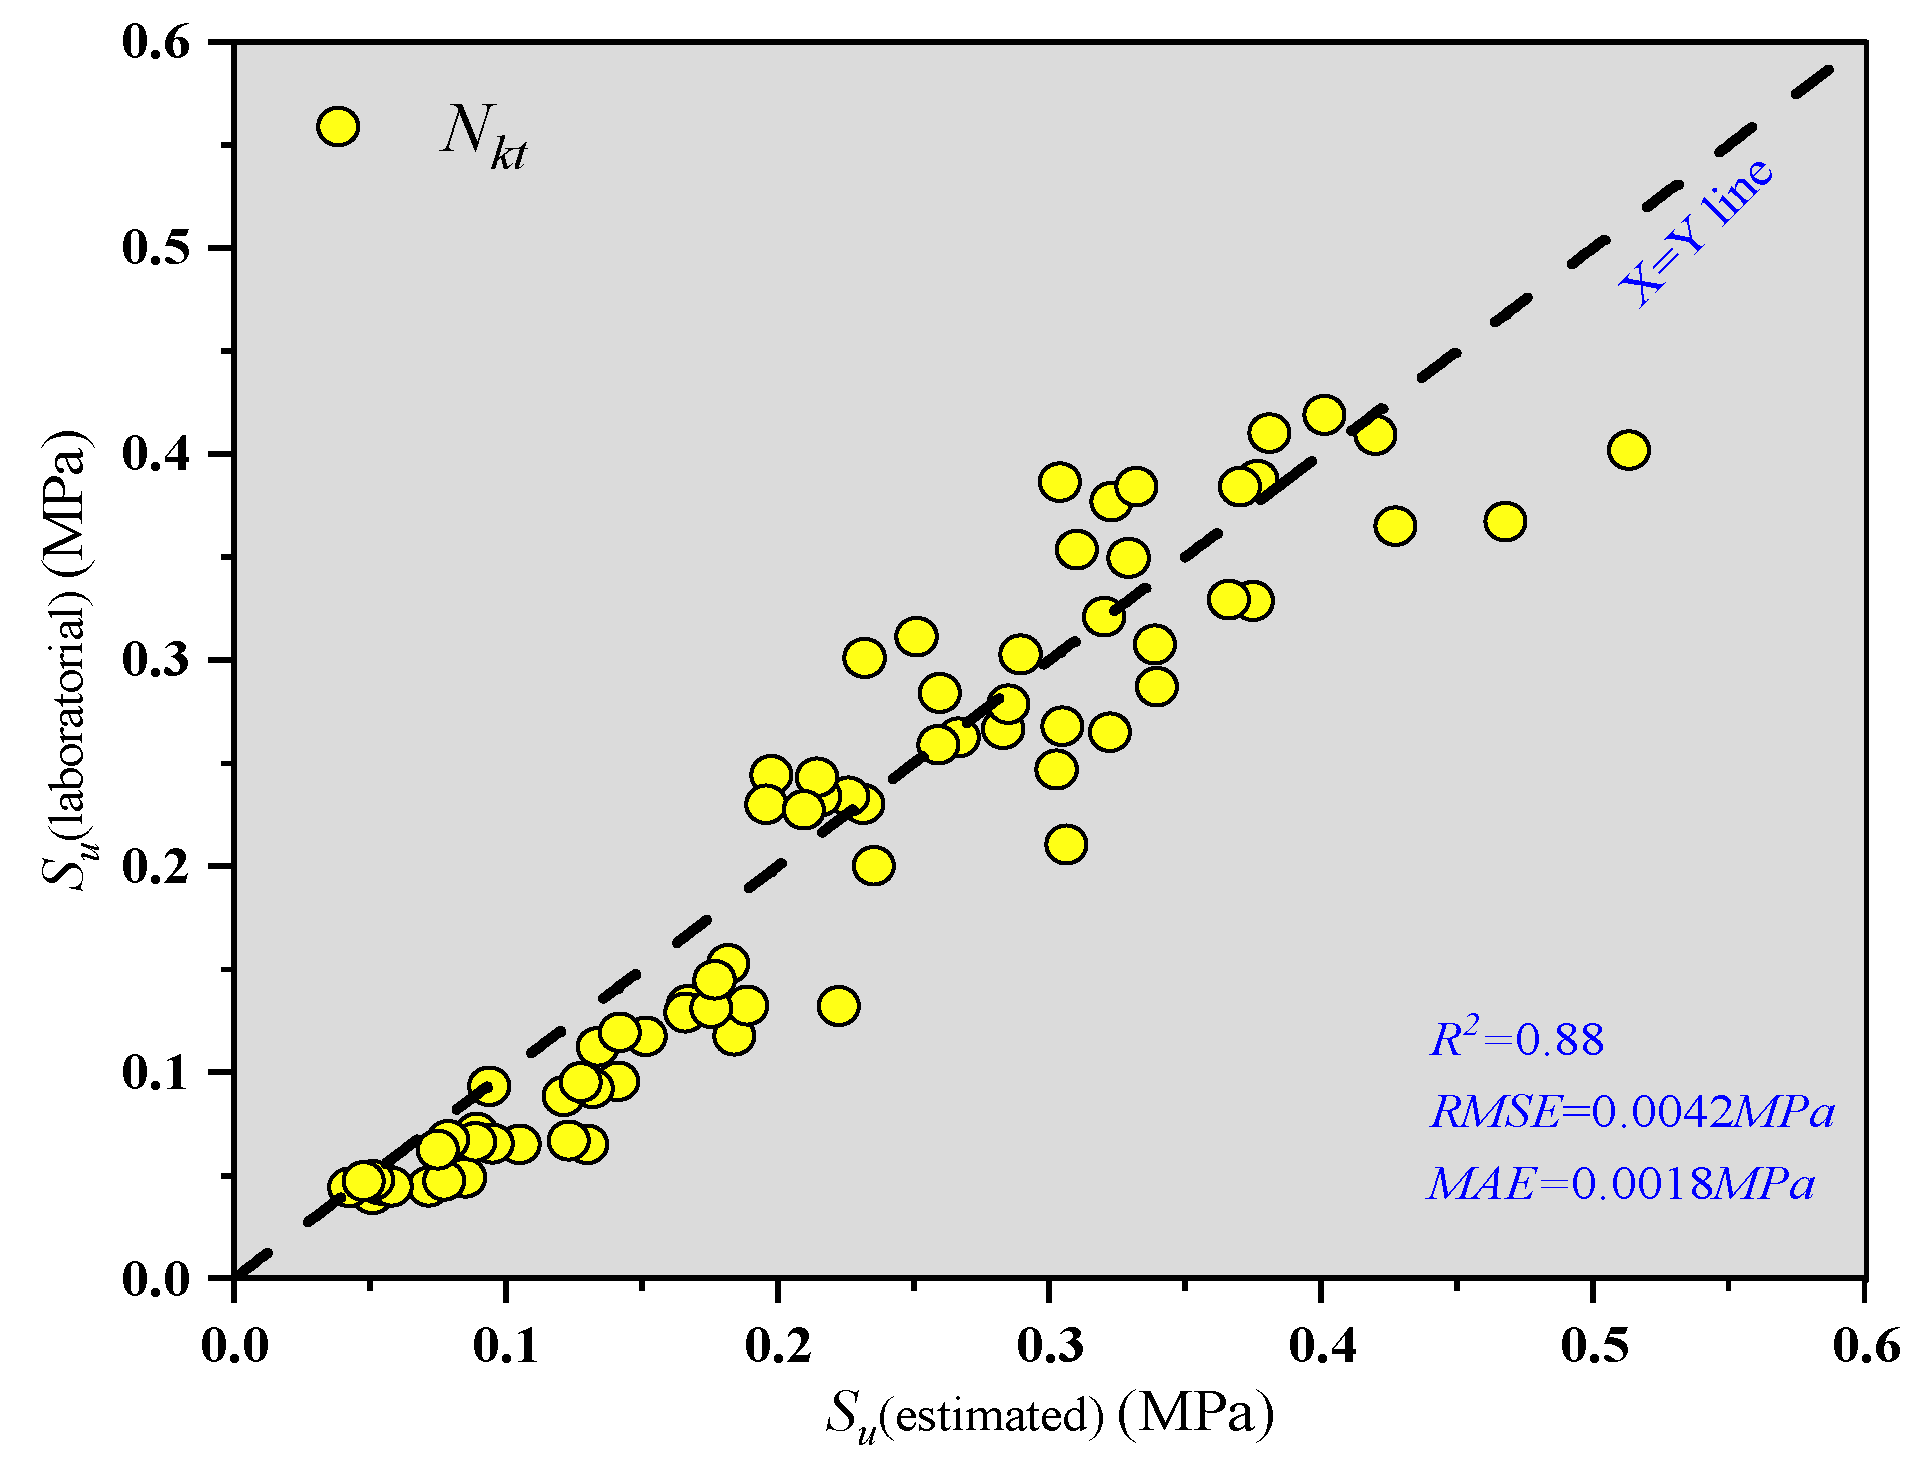
2.1. Estimation of Su by “Total” Cone Tip Resistance qt

Following Lunne et al. [15], the unified formula for calculating the undrained shear strength of clayey soils can be written as:
S u = q t σ v N k t
where Su is the undrained shear strength; qt is the total cone tip resistance; σv is the total vertical stress of the overlying soil; Nkt is the empirical cone factor.

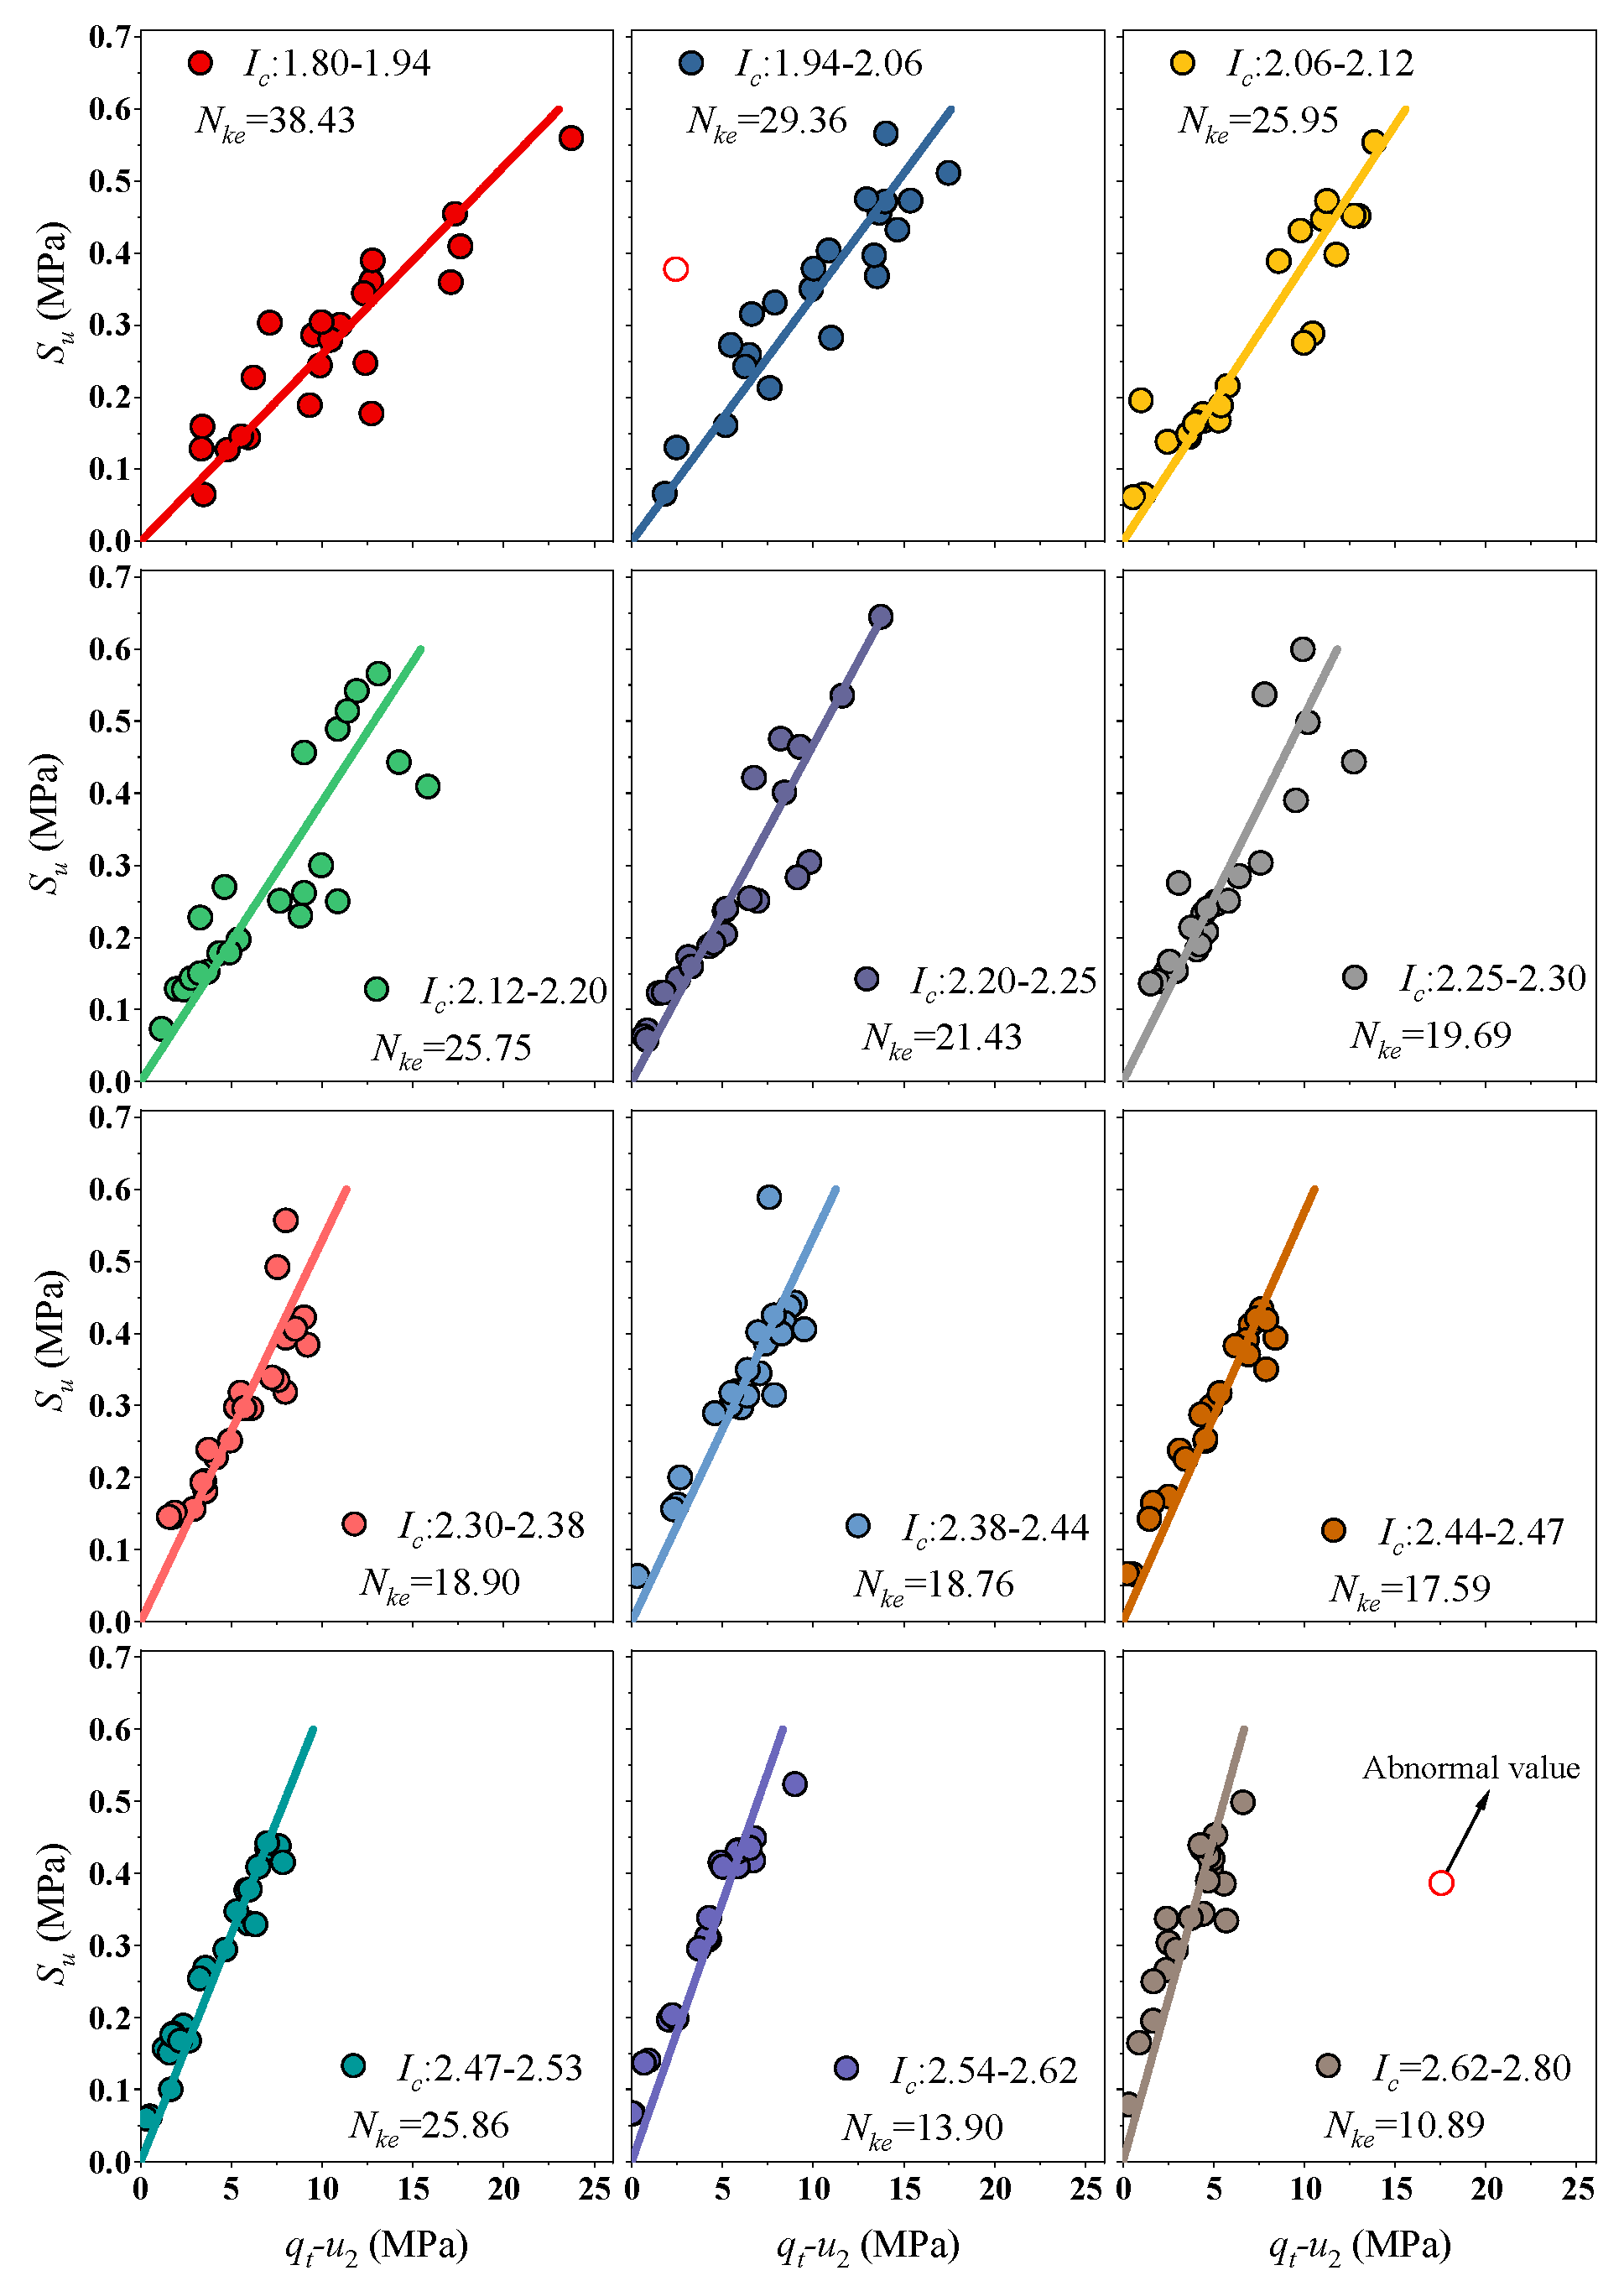
2.2. Estimation of Su by Effective Cone Tip Resistance qe

Considering the corrected total cone tip resistance qt and the difference in pore pressure u2, Senneset et al. [12] proposed an expression for the undrained shear strength Su of clayey soils as listed below:
S u = q e N k e = q t u 2 N k e
where Nke is the effective cone factor.

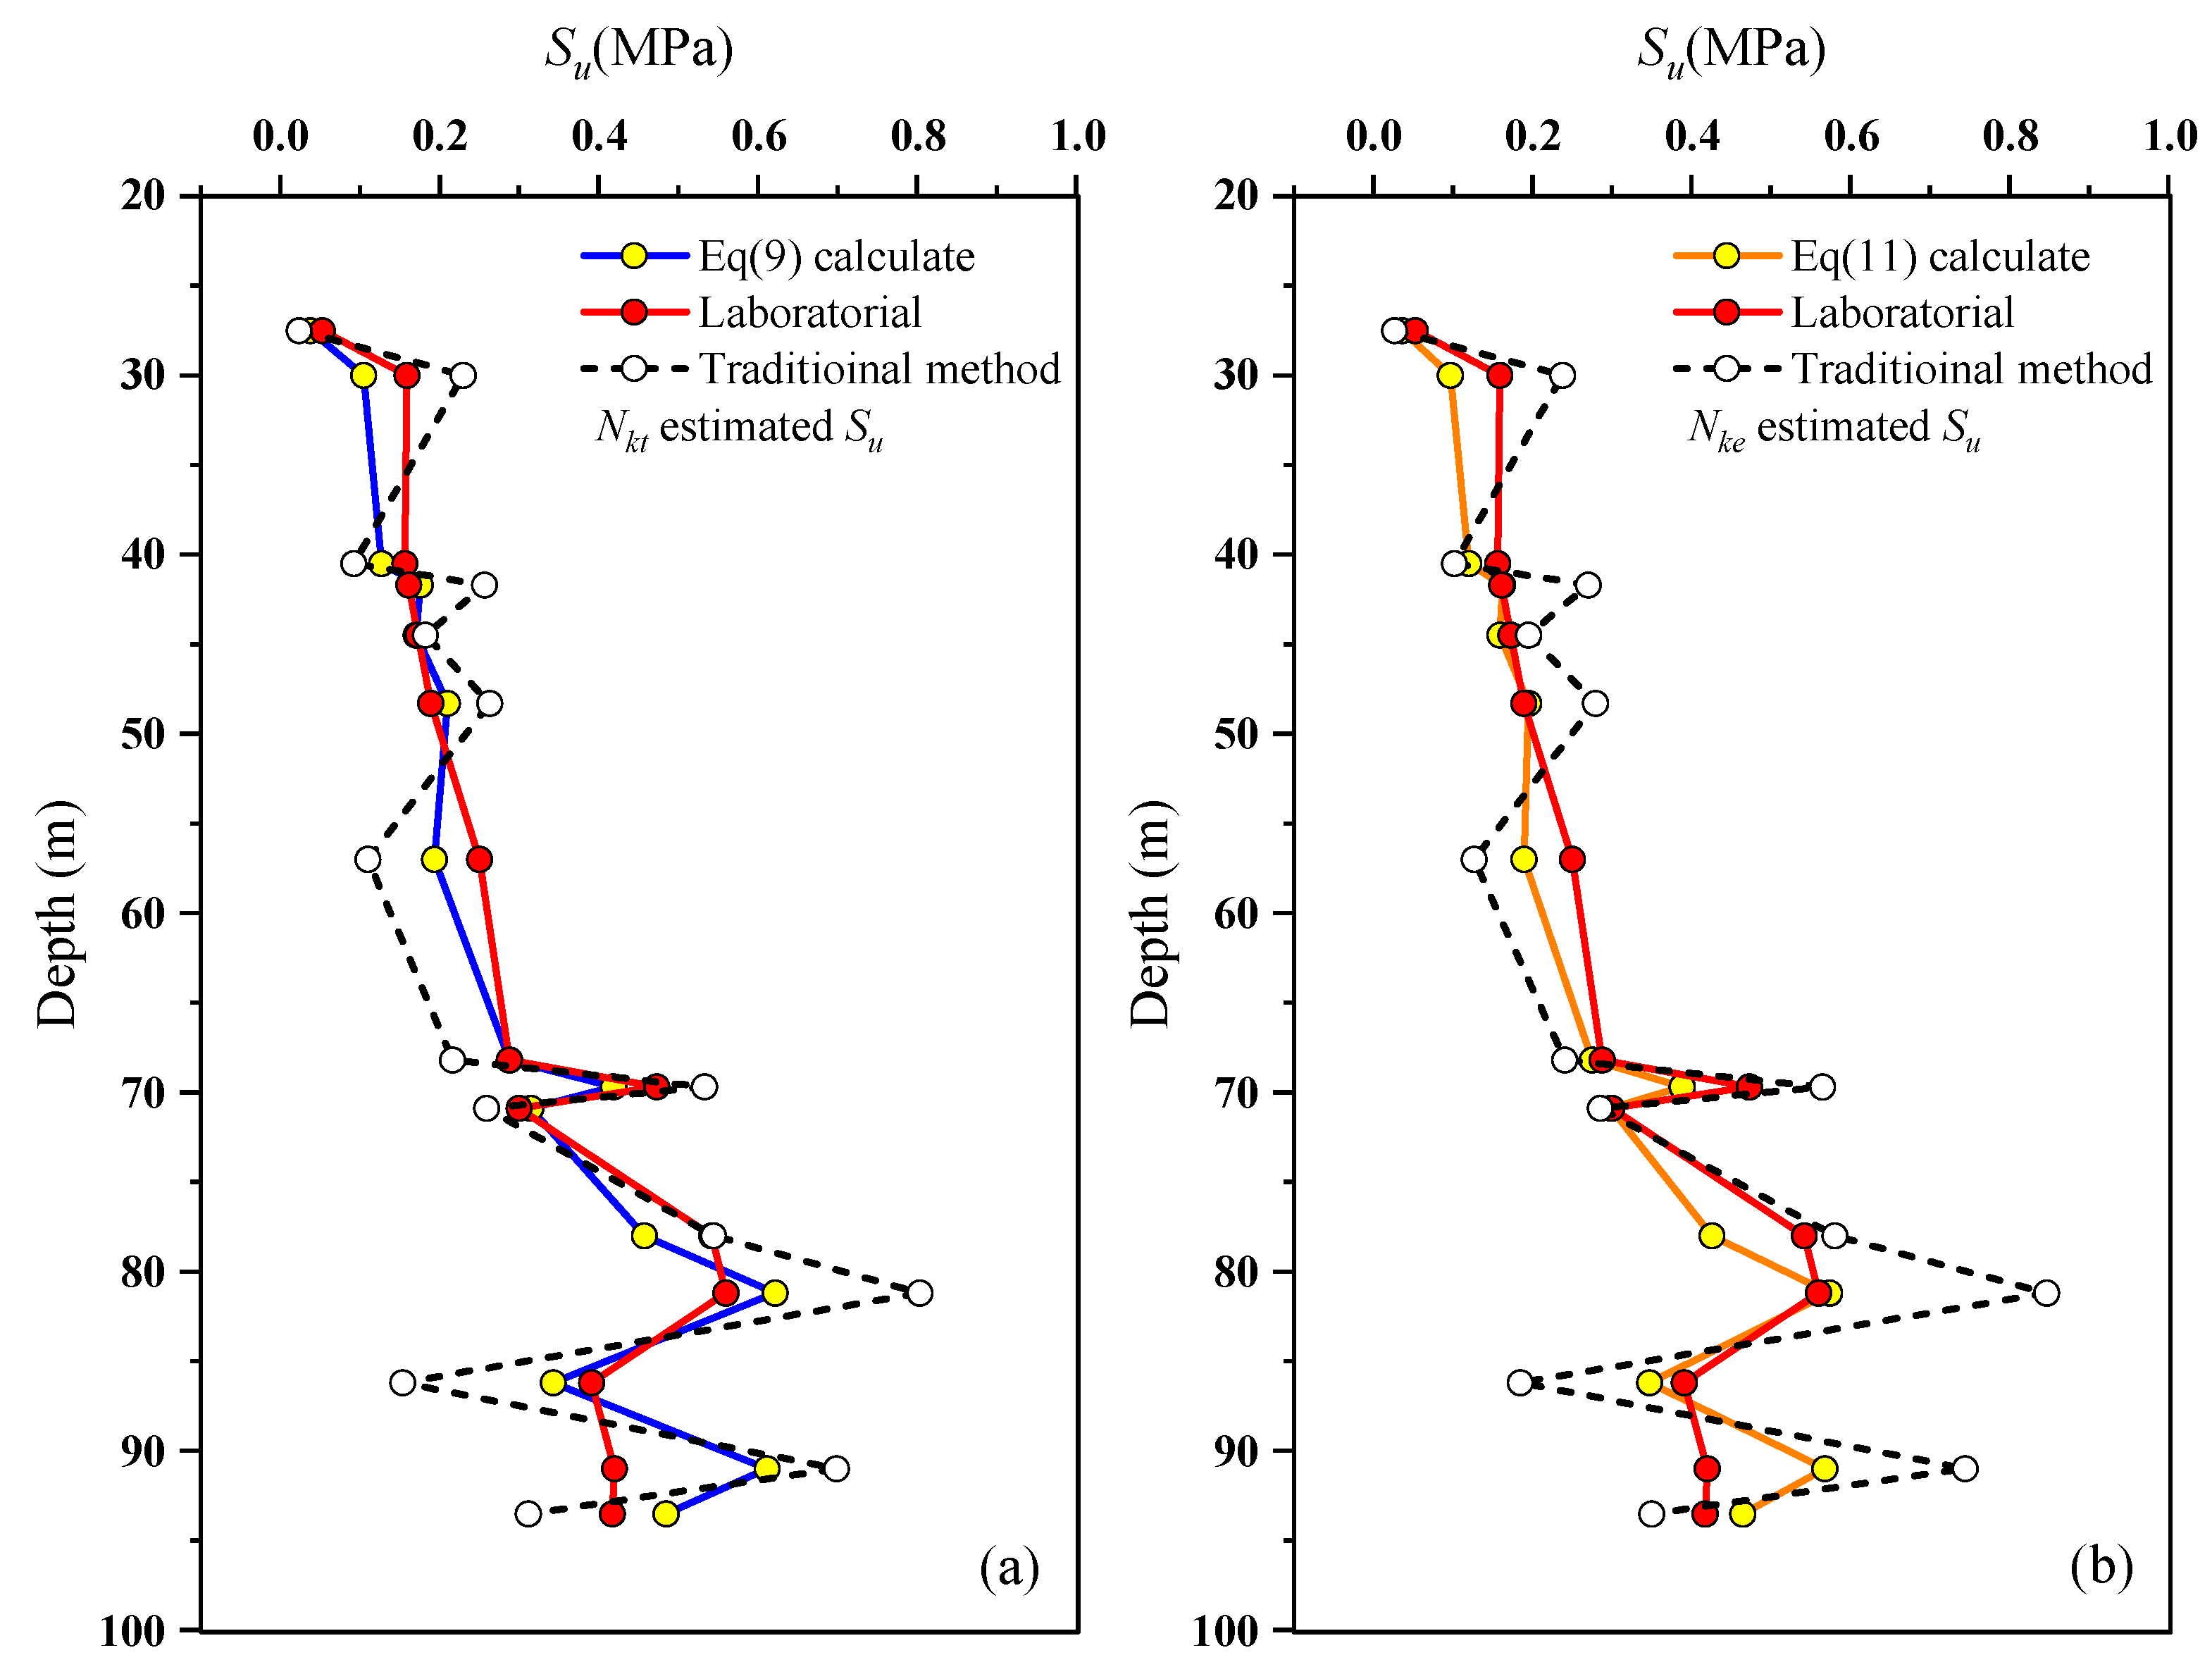
2.3. Calculation of Undrained Shear Strength Su

The consolidated quick direct shear test expeditiously assesses the shear strength of soil by subjecting a sample to shearing within a confined shear box under applied pressure. Despite potential limitations in accuracy, notably concerning sensitive marine soils, its widespread applicability stems from its simplicity, expediency, and cost-effectiveness. This method finds significant utility, particularly in marine geotechnical investigations, where its deployment often exceeds that of triaxial compression tests in terms of quantity. The undrained shear strength of soil at different depths can be estimated by the cohesive strength Cu, angle of internal friction φu, and unit weight of soil γ obtained from the consolidated quick direct shear test [28]. The average values of cohesive strength and angle of internal friction are generally used to calculate the indoor undrained shear strength. Due to the difficulties and high cost of offshore sampling [29], only a few holes are drilled for soil sampling. Hence, we adopt a combined method of indoor experiments and empirical formulae from CPTU to obtain the unit weight of the soil, which is a common practice in current practical engineering [30,31].
The consolidation stress σ3 and the undrained shear strength Su can be written as:
σ 3 = γ i h i 1 + 2 1 sin φ u 3
S u = c u + σ 3 tan φ u
where hi and γi are the thickness and weight of layer i, respectively. Note that the first layer is actually seawater.

2.4. Calculation of Soil Behavior Type Index Ic
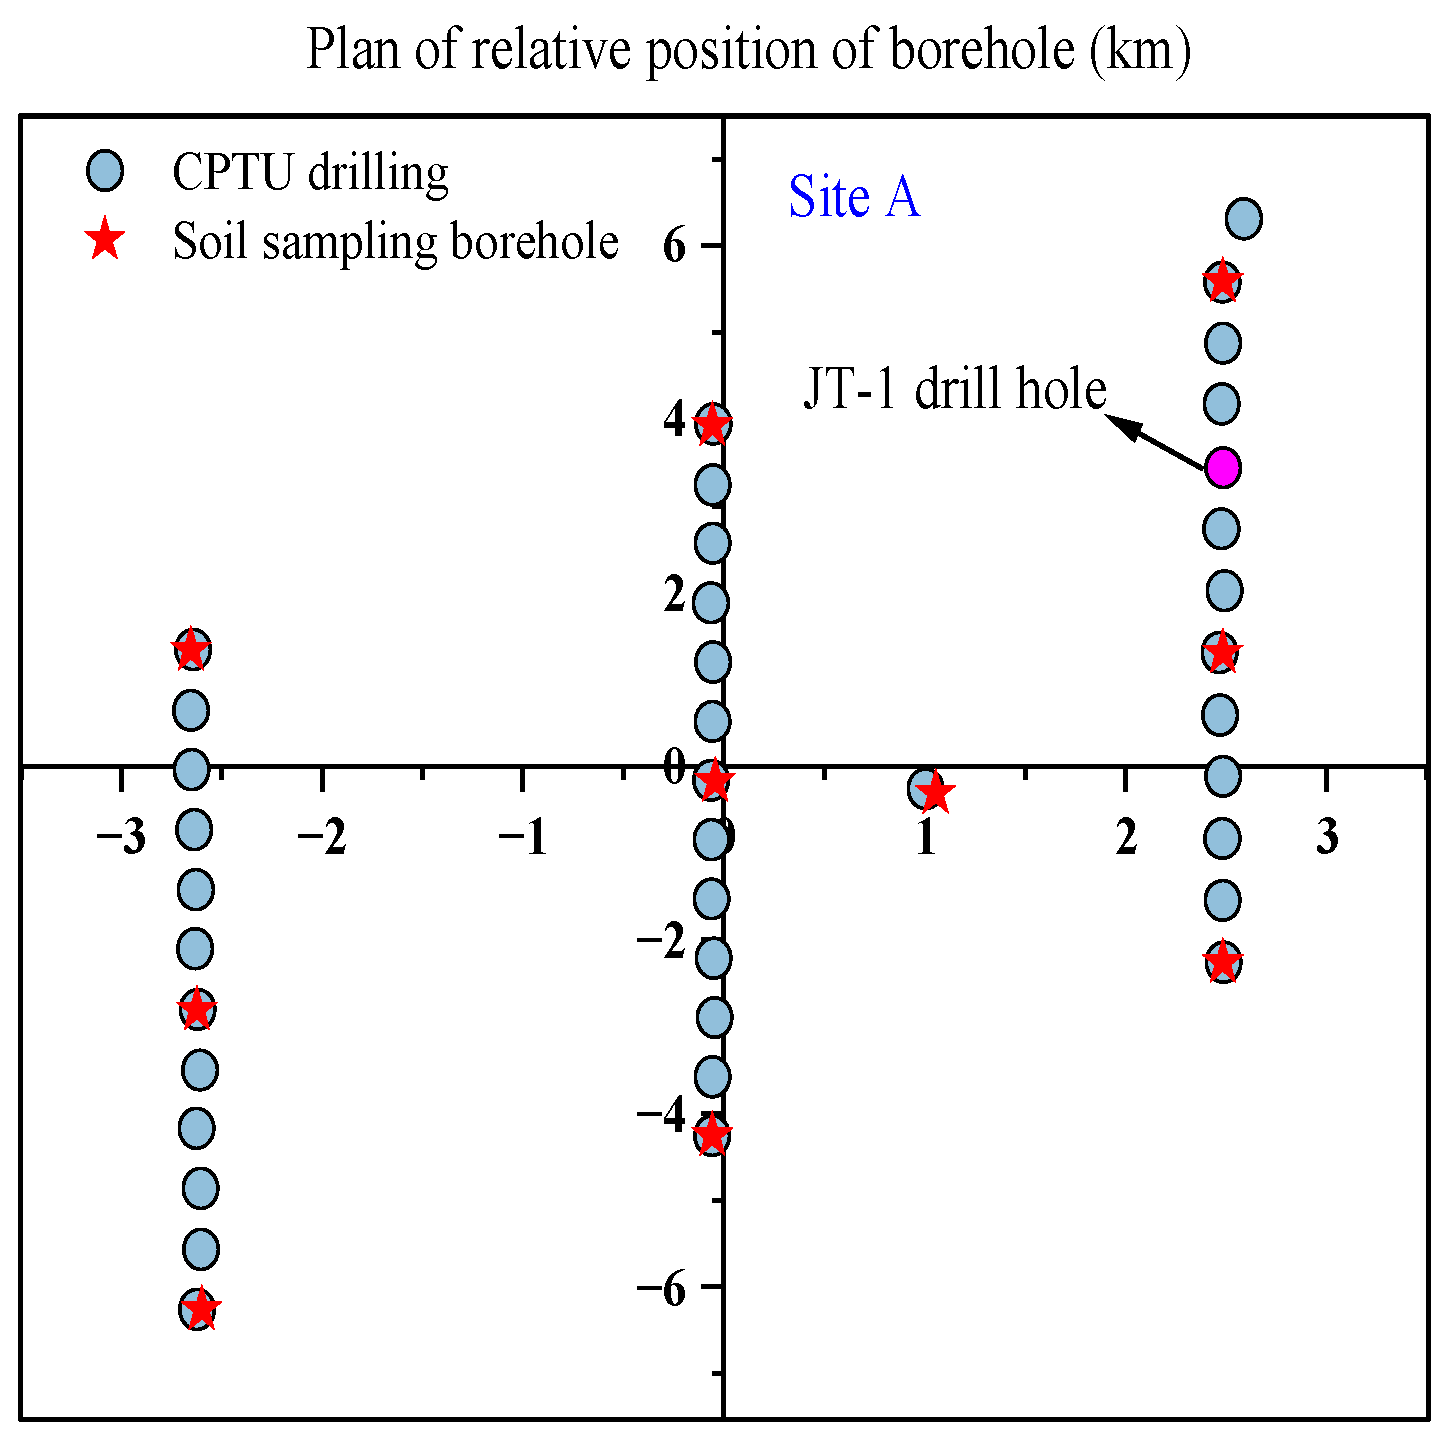
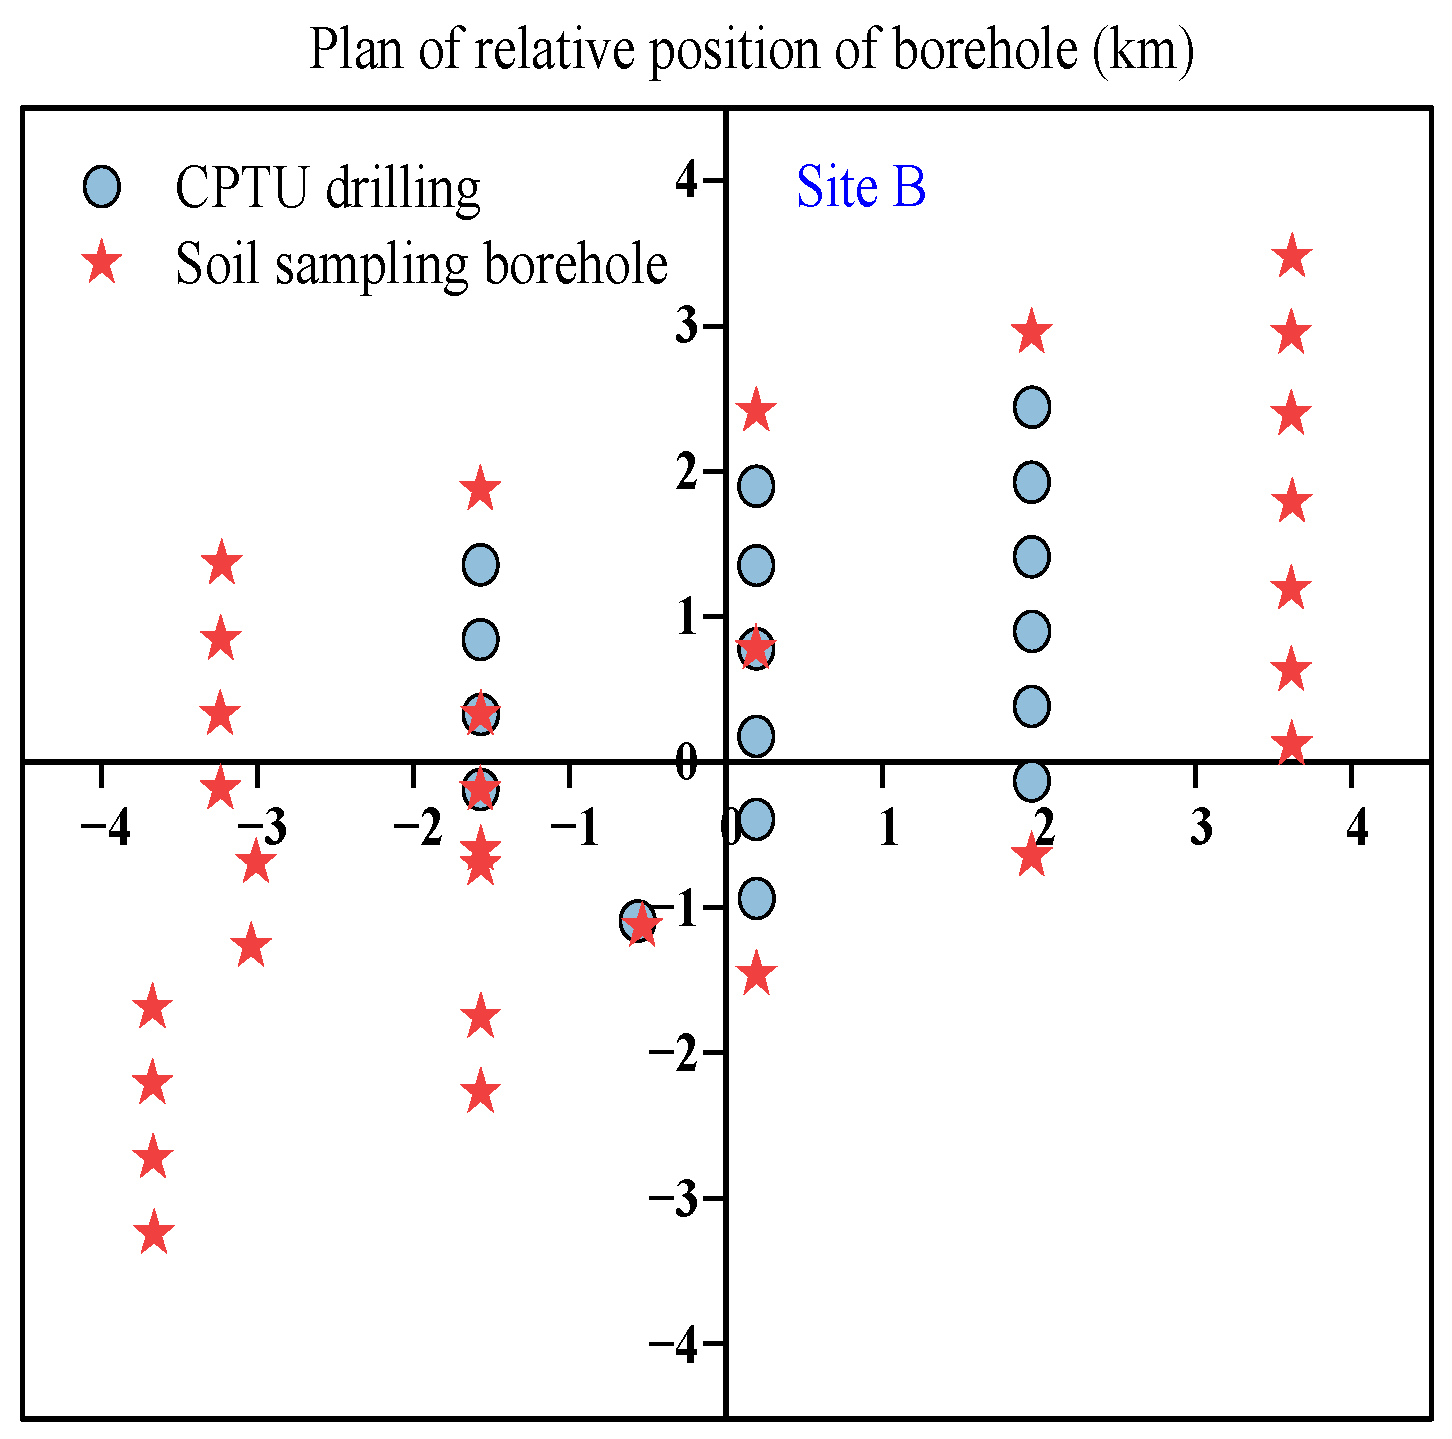
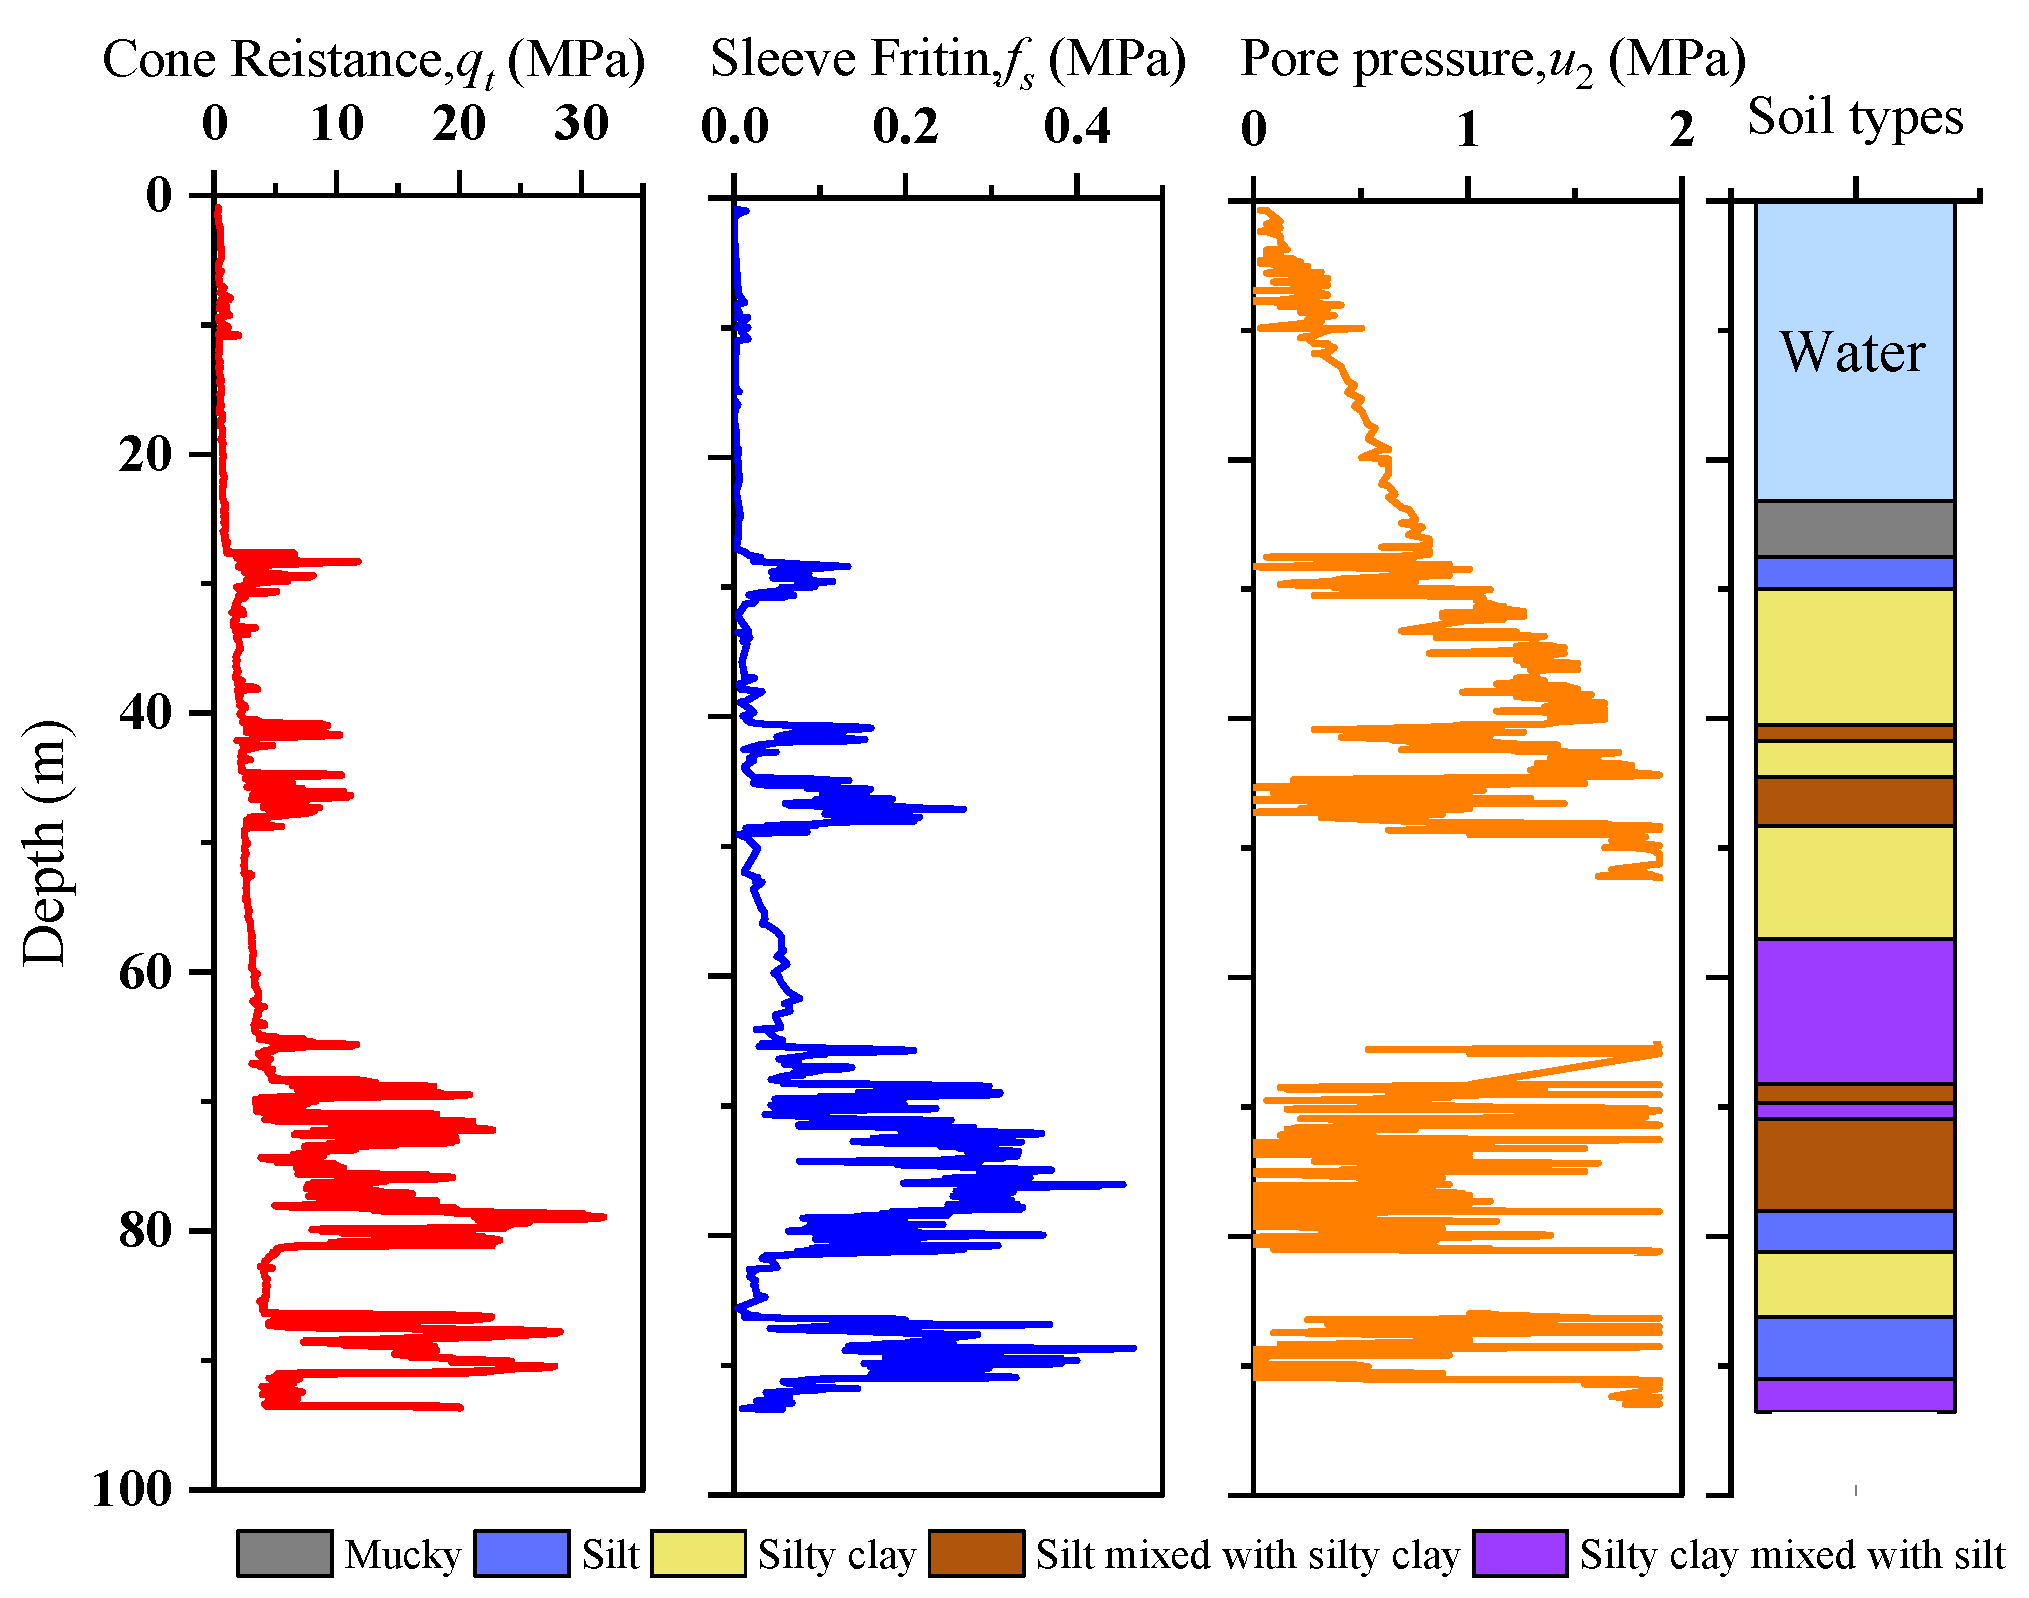
The normalized soil behavior type chart based on CPT proposed by Robertson (1990) [32] classifies soils. Jeffries and Davies [33] discovered the soil behavior type index, which defines the boundaries of soil types without the need for soil sampling. According to the generalized definition provided by Robertson [34], the soil behavior type index can be further described as follows:
I c = 3.47 log 10 Q 2 + 1.22 + log 10 F 2
Q = q t σ v p a ( p a σ v ) n
F = f s q t σ v
where Q is the normalized tip resistance; Pa is the atmospheric pressure; F is the normalized friction ratio; fs is the side friction resistance; σ v is the effective covering total stress; n is the stress index, and its value is set to 1. The revised classification of soil behavior types index [35] is listed in Table 1.
Table 1. The corrected Ic classification.

3. CPTU Results

As depicted in Figure 1, the experimental sites A and B are located in the eastern sea area of Cangnan and the southeastern sea area of Xiangshan in Zhejiang Province, China, respectively. Figure 2 and Figure 3 illustrate the distribution of drilling holes at sites A and B. Throughout the CPTU drilling process, parameters such as “total” cone tip resistance (qt), sleeve friction (fs), and pore water pressure at the cone shoulder (u2) were continuously measured with a data acquisition interval not exceeding 100 mm. At site A, there were 39 CPTU boreholes and 10 soil sampling holes, from which 202 soil samples were collected, and 68 sets of laboratory consolidated quick direct shear tests were conducted. Figure 4 displays the soil profile data of the CPTU borehole log section No. JT-1 along the depth direction at site A. The upper sediment at site A primarily consists of Quaternary (Q4) shallow marine deposits, including mud, muddy silty clay, silt, sandy silt, and silty clay. The lower sediment comprises Late Pleistocene (Q32) deposits from terrestrial and coastal environments, mainly composed of silt, silty clay, and sandy silt within the depth range of the exploration. At site B, there were 19 CPTU test holes and 28 soil sampling holes, from which 484 soil samples were collected, and 68 sets of laboratory consolidated quick direct shear tests were performed. The upper sediment at site B primarily consists of Quaternary (Q4) shallow marine deposits, including mud, muddy silty clay, sandy silt, silt, silty clay, and gravel. The lower sediment consists of Late Pleistocene (Q32) deposits from estuarine and coastal environments, characterized by sandy silt and silty clay within the depth range of the exploration. In summary, the geological conditions of experimental sites A and B are relatively similar. We first proposed an undrained shear strength formula based on CPTU results derived from the data of experimental site A and then verified it using the data from experimental site B. Table 2 presents the types and quantities of soil layers studied at experimental sites A and B.
Figure 1. Relative location of the experiment at sites A and B.
Figure 2. Distribution of boreholes at site A.
Figure 3. Distribution of boreholes at site B.
Figure 4. Soil profile data of the CPTU borehole log section No. JT-1 at site A.
Table 2. The information of soil layers.
Data extraction was first performed on the test results from 39 CPTU boreholes at experimental site A. After eliminating data from sand layers and surface mucky layers, 344 soil layer data were obtained. The histogram in Figure 5 displays the distribution of Ic data. Figure 6 shows the results of the selection of 280 soil layer data. To minimize random errors, this study focused on the range [1.8, 2.8], which has a dense distribution of Ic data. Figure 6 shows that the data points are relatively discrete and cannot form a functional relationship.
Figure 5. Histogram of Ic at site A.
Figure 6. Empirical cone factor Nkt vs. Su.
To investigate the functional relationship between the related variables (qtv, Su), 280 soil samples were divided into 12 groups based on the magnitude of Ic. Each group contained 23 soil samples, except for the last one, as shown in Figure 7. Two clear outliers were excluded based on observation. The results indicate a linear relationship between these variables, as demonstrated by the coefficient of determination R2 in Table 3. All results, except for Ic ranging from 2.12 to 2.22, indicate good fitting effectiveness, with values larger than 0.95. Additionally, using the method described above, the relationship between qt-u2 and Su can be determined (see Figure 8 and Table 3).
Figure 7. Nkt corresponding to different intervals of Ic at site A.
Table 3. Nkt and Nke of Ic in different intervals at site A.
Figure 8. Nke corresponding to different intervals of Ic at site A.
To further probe the functional relation between Ic and Nkt/Nke, the regression analysis was performed on the average values of Ic and the empirically obtained Nkt and Nke within each interval. It can be observed from Figure 9 that R2 is greater than 0.97 and a significant nonlinear relation exists between Ic and Nkt/Nke.
Figure 9. Relation between Nkt/Nke and Ic at site A.
As presented in Figure 9, a new computational formula for estimating cone factors (Nkt, Nke) can be provided as:
S u = q t σ v N k t
in which:
N k t = exp 6.41424 1.489 I c , 1.8 I c 2.8
S u = q t u 2 N k e
in which:
N k e = exp 6.31207 1.435 I c , 1.8 I c 2.8
According to Equation (9), the average value of Nkt in the soil behavior type index Ic range of 1.8 to 2.8 is 21.76, which is close to the statistical average value of 17.9 obtained by the consolidated quick direct shear test specified in the Technical Code for Static Penetration Test in Water Transportation Engineering of China [21]. According to Table 2, the study involved various types and numbers of soil layers. However, the lack of clay layers may result in an overestimation of the calculated value of Nkt in the formula. Furthermore, research conducted in the marine areas near Hangzhou Bay, Hangzhou City, Zhejiang Province, China, indicates that the consolidated quick direct shear tests conducted in this region yielded an overall average value of 20.25 for the cone tip factor (Nkt) in terms of undrained shear strength [36]. This further corroborates the reliability of the formula in the marine areas adjacent to Zhejiang Province, China.
Three statistical criteria (coefficient of determination R2, root mean square error RMSE, and mean absolute error MAE) are utilized to evaluate the proposed predictive model. The calculation formulas are as follows:
R 2 = 1 i = 1 n ( L i E i ) i = 1 n ( L i E ¯ ) 2
R M S E = i = 1 n ( L i E i ) 2 n
M A E = i = 1 n L i E i 2 n
where Li represents the undrained shear strength obtained from consolidated quick direct shear test; Ei represents the undrained shear strength predicted from CPTU results. The closer R2 is to 1, the better the model’s predictive performance. A smaller RMSE or MAE indicates better predictive performance of the model.
The cone factor values are not fixed and exhibit significant variation, making it challenging to obtain precise values for the undrained shear strength of soil. In practical engineering, traditional approaches often involve using maximum and minimum cone values of Nkt and Nke, or directly employing empirical values specific to the region, to calculate the undrained shear strength of soil. To compare the traditional method with the new method proposed in the study, minimum errors for cone factors (Nkt = 20.97 and Nke = 20.51) were determined using linear regression according to the “total” cone tip resistance method and effective cone resistance method, as shown in Figure 10a,b. In Figure 10c,d, cone factors Nkt and Nke were calculated using Equations (9) and (11). By comparing Figure 10a–d, it is found that when considering the correlation between soil behavior type index and cone factors, the three predicted indicators (R2, RMSE, MAE) show marked improvement. For instance, R2 corresponding to Nkt (Nke) increases from 0.09 (0.05) to 0.81 (0.78), respectively. RMSE corresponding to Nkt (Nke) decreases from 0.124 (0.126) MPa to 0.056 (0.06) MPa, respectively. MAE corresponding to Nkt (Nke) decreases from 0.0154 (0.016) MPa to 0.0032 (0.0036) MPa, respectively. The evaluated results show that considering the correlation between the soil behavior type index and cone factor can improve the prediction accuracy of undrained shear strength from CPTU.
Figure 10. Predictions using traditional Nkt and Nke methods in (a,b); predictions using the newly proposed Nkt and Nke methods in (c,d).
An analysis of the CPTU test result plots in Figure 4 is presented to compare the difference between the traditional method and the new method, which incorporates the soil behavior type index in predicting the distribution of undrained shear strength along the depth direction. In the conventional method, the values of cone factors were kept the same as in the previous section, i.e., Nkt = 20.97 and Nke = 20.51. Table 4 shows the soil cone factors obtained from the soil behavior type index. It is evident from Figure 11 that the undrained shear strength calculated using Equations (8) and (10) proposed in this study consistently has a smaller error than the conventional method. This indicates that the method incorporating the soil behavior type index has significant advantages in terms of prediction accuracy.
Table 4. Soil layer cone factor estimation.
Figure 11. Su forecasts along the depth direction ((a) with Nkt; (b) with Nke).
To further validate the reliability of the proposed method, site B was predicted and analyzed. Soil layer data were divided into four groups with 19 data in each group. According to Equation (8), the undrained shear strength of 76 soil layers at site B within the range of the soil behavior index [2.20, 2.8] (see Figure 12) was predicted.
Figure 12. Histogram of Ic at site B.
Table 5 presents the evaluation results of the predicted values. It is evident that the precision of undrained shear strength prediction improves with the increase in Ic. Specifically, as Ic increases, the R2 value rises while RMSE and MAE decrease accordingly. Figure 13 illustrates the predicted results for all soil layers, showing an R2 value of 0.88, an RMSE of 0.0042 MPa, and an MAE of 0.0018 MPa. These results indicate that this method can effectively predict the undrained shear strength for the experimental site B. It should be noted that the data used in this study are from coastal areas near Zhejiang Province, China. Therefore, it is recommended to use Equations (8) and (10) under similar circumstances.
Table 5. Predicted accuracy of Su corresponding to different intervals of Ic.
Figure 13. Analyzing the disparity between predicted and estimated values at site B.

4. Conclusions

This study aimed to improve the accuracy in predicting the undrained shear strength of fine-grained soil from CPTU. A new method for estimating the undrained shear strength of soil based on the soil behavior type index was proposed through in situ CPTU testing and an indoor consolidated quick direct shear test at one coastal area of Zhejiang Province in China. Then, a nearby site was selected to verify the accuracy and reliability of the developed method. The following conclusions were obtained:
  • The soil behavior type index Ic exhibits a negatively correlated exponential relation with the cone factors Nkt, Nke.
  • Considering the correlation between cone factors Nkt, Nke and the soil behavior type index Ic can enhance the prediction accuracy of undrained shear strength.
  • As Ic increases, the predicted accuracy of undrained shear strength from CPTU can be improved.
  • The functional relation between Ic and the Nkt can be applied to the adjacent regions of Zhejiang Province in China.

Author Contributions

Methodology, S.F.; software, S.F.; investigation, S.F.; data curation, S.F.; resources, S.F. and X.J.; formal analysis, Y.S.; writing—original draft, Y.S.; validation, Y.S. and X.J.; project administration, X.J.; conceptualization, Z.Z. and X.L.; supervision, Z.Z. and X.L.; Writing—review & editing, Z.Z. and X.L.; funding acquisition, X.L. All authors have read and agreed to the published version of the manuscript.

Funding

Xibin Li gratefully acknowledges the financial support provided by the Natural Science Foundation of Zhejiang Province under Grant No. LHZ21E090001.

Institutional Review Board Statement

Not applicable.

Data Availability Statement

Data supporting the findings of this study, including tables, figures, and references, can be obtained from the corresponding author upon reasonable request.

Conflicts of Interest

Sai Fu and Xianlin Jia were employed by PowerChina Huadong Engineering Corporation Limited. The authors declare no conflicts of interest.

References

  1. Bilgili, M.; Yasar, A.; Simsek, E. Offshore wind power development in Europe and its comparison with onshore counterpart. Renew. Sust. Energy Rev. 2011, 15, 905–915. [Google Scholar] [CrossRef]
  2. Chen, J. Development of offshore wind power in China. Renew. Sust. Energy Rev. 2011, 15, 5013–5020. [Google Scholar] [CrossRef]
  3. Qiao, H.; Liu, L.; He, H.; Liu, X.; Liu, X.; Peng, P. The practice and development of T-bar penetrometer tests in offshore engineering investigation: A comprehensive review. J. Mar. Sci. Eng. 2023, 11, 1160. [Google Scholar] [CrossRef]
  4. Mbarak, W.K.; Cinicioglu, E.N.; Cinicioglu, O. SPT based determination of undrained shear strength: Regression models and machine learning. Front. Struct. Civ. Eng. 2020, 14, 185–198. [Google Scholar] [CrossRef]
  5. Yang, Z.; Liu, X.; Guo, L.; Cui, Y.; Su, X.; Ling, X. Soil classification and site variability analysis based on CPT—A case study in the Yellow River subaquatic delta, China. J. Mar. Sci. Eng. 2021, 9, 431. [Google Scholar] [CrossRef]
  6. Kang, X.; Sun, H.-M.; Luo, H.; Dai, T.; Chen, R.-P. A portable bender element-double cone penetration testing equipment for measuring stiffness and shear strength of in-situ soft soil deposits. KSCE J. Civ. Eng. 2020, 24, 3546–3560. [Google Scholar] [CrossRef]
  7. Liu, X.; Shen, J.; Yang, M.; Cai, G.; Liu, S. Subsurface characterization of a construction site in Nanjing, China using ERT and CPTU methods. Eng. Geol. 2022, 299, 106563. [Google Scholar] [CrossRef]
  8. Cai, G.; Liu, S.; Puppala, A.J. Evaluation of geotechnical parameters of a lagoonal clay deposit in Jiangsu Lixia River area of China by seismic piezocone tests. KSCE J. Civ. Eng. 2016, 20, 1769–1782. [Google Scholar] [CrossRef]
  9. Duan, W.; Congress, S.S.C.; Cai, G.; Puppala, A.J.; Du, Y. Empirical Correlations of Soil Parameters based on Piezocone Penetration Tests (CPTU) for Hong Kong- Zhuhai-Macau Bridge (HZMB) Project. Transp. Geotech. 2021, 10, 100605. [Google Scholar] [CrossRef]
  10. Drusa, M.; Gago, F.; Vlček, J. Contribution to estimating bearing capacity of pile in clayey soils. Civ. Environ. Eng. 2016, 12, 128–136. [Google Scholar] [CrossRef]
  11. Salgado, R.; Lyamin, A.V.; Sloan, S.W.; Yu, H.S. Two and three dimensional bearing capacity of foundations in clay. Géotechnique 2004, 54, 297–306. [Google Scholar] [CrossRef]
  12. Senneset, K.; Sandven, R.; Janbu, N. Evaluation of soil parameters from piezocone tests. Transport. Res. Rec. 1989, 1235, 24–37. [Google Scholar]
  13. Teh, C.I.; Houlsby, G.T. An analytical study of the cone penetration test in clay. Géotechnique 1992, 42, 529–532. [Google Scholar] [CrossRef]
  14. Cleary, M.P. Fundamental solutions for a fluid-saturated porous solid. Int. J. Solids Struct. 1977, 12, 785–806. [Google Scholar] [CrossRef]
  15. Lunne, T.; Robertson, P.K.; Powell, J.J.M. Cone-Penetration Testing in Geotechnical Practice; Spon Press: London, UK, 2001. [Google Scholar]
  16. Paniagua, P.; D’Ignazio, M.; L’Heureux, J.-S.; Lunne, T.; Karlsrud, K. CPTU correlations for Norwegian clays: An update. AIMS Geosci. 2019, 5, 82–103. [Google Scholar] [CrossRef]
  17. Lunne, T.; Eide, O.; De, R.J. Correlations between cone resistance and vane shear strength in some Scandinavian soft to medium stiff clays. Can. Geotech. J. 1976, 13, 430–441. [Google Scholar] [CrossRef]
  18. Aas, G.; Lacasse, S.M.; Lunne, T.A.; Høeg, K. Use of In Situ Tests for Foundation Design on Clay. In Proceedings of the ASCE Specialty Conference In Situ’86, Use of In Situ tests in Geotechnical Engineering, Blacksburg, VA, USA, 23–25 June 1986. [Google Scholar]
  19. Shin, Y.J.; Kim, D. Assessment of undrained shear strength based on Cone Penetration Test (CPT) for clayey soils. KSCE J. Civ. Eng. 2011, 15, 1161–1166. [Google Scholar] [CrossRef]
  20. Mayne, P.W.; Peuchen, J. CPTU bearing factor Nkt for undrained strength evaluation in clays. In Proceedings of the Cone Penetration Testing 2018: Proceedings of the 4th International Symposium on Cone Penetration Testing (CPT’18), Delft, The Netherlands, 21–22 June 2018. [Google Scholar]
  21. JTS/T 242-2020; Technical Specification for Underwater Inspection Cone Penetration Engineering. China Communications Press Co., Ltd.: Beijing, China, 2020. (In Chinese)
  22. Naeini, S.A.; Moayed, R.Z. Evaluation of undrained shear strength of loose silty sand soil using CPT results. Int. J. Civ. Eng. 2007, 2, 104–117. [Google Scholar]
  23. Bol, E.; Önalp, A.; Özocak, A.; Sert, S. Estimation of the undrained shear strength of Adapazari fine grained soils by cone penetration test. Eng. Geol. 2019, 261, 105277. [Google Scholar] [CrossRef]
  24. Bol, E. The influence of pore pressure gradients in soil classification during piezocone penetration test. Eng. Geol. 2013, 157, 69–78. [Google Scholar] [CrossRef]
  25. Zhang, P.; Yin, Z.Y.; Jin, Y.F. Bayesian neural network-based uncertainty modelling: Application to soil compressibility and undrained shear strength prediction. Can. Geotech. J. 2022, 59, 546–557. [Google Scholar] [CrossRef]
  26. Zhang, W.; Wu, C.; Zhong, H.; Li, Y.; Wang, L. Prediction of undrained shear strength using extreme gradient boosting and random forest based on Bayesian optimization. Geosci. Front. 2021, 12, 469–477. [Google Scholar] [CrossRef]
  27. Baziar, M.H.; Saeedi Azizkandi, A.; Kashkooli, A. Prediction of pile settlement based on cone penetration test results: An ANN approach. KSCE J. Civ. Eng. 2015, 19, 98–106. [Google Scholar] [CrossRef]
  28. Ma, H.; Chen, Z.; Yu, S. Correlations of soil shear strength with specific penetration resistance of CPT in Shanghai area. Rock Soil Mech. 2014, 35, 536–542. (In Chinese) [Google Scholar]
  29. Li, Y.; Wang, Z.; Wang, H.; Xu, Z. Study on the undrained shear strength of Fujian Marine clay based on CPTU. China Water Transp. 2021, 21, 133–135. (In Chinese) [Google Scholar]
  30. Robertson, P.K. Estimating in-situ soil permeability from CPT & CPTu. In Proceedings of the 2nd International Symposium on Cone Penetration Testing (CPT ’10), Huntington Beach, CA, USA, 9–11 May 2010. [Google Scholar]
  31. Fan, H.; Xu, G. Application of ROSON 200 kN Seabed Cone Penetration Test System. Bull. Sci. Technol. 2019, 35, 163–167. (In Chinese) [Google Scholar]
  32. Robertson, P.K. Soil classification using the cone penetration test. Can. Geotech. J. 1990, 27, 151–158. [Google Scholar] [CrossRef]
  33. Jefferies, M.G.; Davies, M.P. Use of CPTu to estimate equivalent SPT. Geotech. Test. J. 1993, 16, 458–468. [Google Scholar] [CrossRef]
  34. Robertson, P.K. Interpretation of cone penetration tests a unified approach. Can. Geotech. J. 2009, 46, 1337–1355. [Google Scholar] [CrossRef]
  35. Du, G.; Gao, C.; Liu, S.; Guo, Q.; Luo, T. Evaluation method for the liquefaction potential using the standard penetration test value based on the CPTU soil behavior type index. Adv. Civ. Eng. 2019, 2019, 5612857. [Google Scholar] [CrossRef]
  36. Wang, K.; Shen, K.; Wang, M.; Wang, H.; Guo, Z. Strength interpretation parameter of piezoncone penetration test for soft clay in offshore area of Hangzhou Bay. Rock. Soil. Mech. 2023, 44 (Suppl. S1), 521–532. (In Chinese) [Google Scholar]
Disclaimer/Publisher’s Note: The statements, opinions and data contained in all publications are solely those of the individual author(s) and contributor(s) and not of MDPI and/or the editor(s). MDPI and/or the editor(s) disclaim responsibility for any injury to people or property resulting from any ideas, methods, instructions or products referred to in the content.

Article Metrics

Citations

Article Access Statistics

Multiple requests from the same IP address are counted as one view.