Article

Analyzing the Mediterranean Sea’s Dynamic Current System and Modeling of Renewable Current Energy Potential

by
Mehmet Ugur Gucel
1,* and
Abdulla Sakalli
2,*
1
Faculty of Marine Science and Technology, Iskenderun Technical University, Iskenderun 31200, Turkey
2
Department of Industrial Engineering, Faculty of Engineering and Natural Sciences, Iskenderun Technical University, Iskenderun 31200, Turkey
*
Authors to whom correspondence should be addressed.
J. Mar. Sci. Eng. 2024, 12(4), 671; https://doi.org/10.3390/jmse12040671
Submission received: 10 January 2024 / Revised: 5 April 2024 / Accepted: 16 April 2024 / Published: 18 April 2024

Abstract

:
In recent years, investments in renewable energy sources have been increasing in order to reduce fossil fuel consumption and mitigate the effects of global warming on the marine ecosystem. Recent studies have shown that marine current energy, which is one of the renewable energy sources, can provide very high energy gains. This study focuses on the Mediterranean region, which is one of the areas where the impacts of climate change are most clearly felt. The annual and seasonal analysis of the current velocity in the study area between 2016 and 2018 was carried out using remote sensing technology, and potential energy production was calculated using an underwater turbine system we selected. As a result of the study, it was determined that the maximum current velocities were 2.2 m/s in 2016 and 2017 and 2.7 m/s in 2018. In addition, it was observed that the current speed was approximately 2.7 m/s in the spring months and 2.0 m/s in the summer months. In the fall and winter months, it was 2.1 m/s and 2.2 m/s, respectively. Research has shown that the study area, especially in the eastern coastal areas, has the capacity to generate approximately 10 GWh of energy per year with the use of underwater turbine systems.

1. Introduction

Studies on renewable energy sources for a sustainable future have increased in recent years [1,2]. The widespread use of fossil fuels after the industrial revolution is one of the main causes of global warming and changes in submarine current systems [3]. The interaction between numerous variables, such as ocean circulation, salinity, seawater temperature, density differences, and depth, forms sea currents [4]. Understanding these complex interactions is crucial for predicting and mitigating the effects of global warming on our oceans. These alterations in marine current systems can have significant impacts on marine ecosystems, including changes in temperature, nutrient distribution, and species distribution [5]. Changing temperatures due to altered marine current systems can lead to shifts in the distribution of marine species, as some species may thrive in warmer waters while others may struggle to adapt [6]. Alterations in nutrient distribution, brought about by altered currents, can impact the productivity and abundance of marine organisms, ultimately having an impact on the entire food web [7]. Studying and monitoring marine current systems is essential for effectively managing and conserving our oceans in the wake of global warming [8]. Studying these systems can teach us a lot about the health and resilience of marine ecosystems as a whole, which can help us formulate strategies to protect them from the effects of climate change [9].
Studies suggest that renewable energy is crucial for future sustainability [10,11]. According to [12], energy sourced from the sea holds significant potential for future energy systems. Implementing renewable energy technologies can not only mitigate the effects of global warming, but also contribute to the preservation of marine ecosystems by reducing pollution and minimizing the disruption of natural habitats [13]. This transition to renewable energy can also create new job opportunities and stimulate economic growth in coastal communities [14]. Furthermore, the development of marine renewable energy can help diversify the energy mix, increasing resilience and reducing vulnerability to supply disruptions [15]. It is notable for its advantageous characteristics, including its ability to generate energy for 24 h and its water density, which is approximately 900 times greater than air density [16]. To harness ocean current energy effectively, it is essential to assess the suitability of the selected region [17]. This assessment involves evaluating factors such as the strength and consistency of the ocean currents, their proximity to power grids, and potential environmental impacts. Understanding the local marine ecosystem and its sensitivity to disturbances is also crucial in order to minimize any negative effects of harnessing ocean current energy [18].
Considering the economic viability and cost-effectiveness of installing and maintaining the necessary infrastructure is essential for the successful implementation of current energy projects in the ocean [19]. It is crucial to consider the economic feasibility and technological advancements required for the successful implementation of ocean current energy systems [20]. It was noted in a study that turbine installation is feasible in regions where the current speed exceeds 1.5 m/s; however, topography should also be considered [21]. Topography plays a crucial role in determining the suitability of a location for turbine installation [22]. Areas with steep underwater slopes or irregular seabed topography may not be ideal for harnessing ocean current energy [23]. These factors can affect the efficiency and stability of turbine operation as well as the overall cost-effectiveness of the system. Therefore, careful analysis of the underwater terrain is necessary to identify suitable sites for the effective implementation of ocean current energy systems [24]. Various studies have highlighted the significant renewable energy resources available in Southern European nations alongside the Mediterranean Sea (MS) [25,26].
By 2030, the plan is to establish energy generation systems in the Basque region of Spain with a capacity of around 60 MWh. These systems will obtain energy from the sea in selected areas, which will be a significant part of the estimated USD 140 million for projects in renewable energy research in Singapore [27]. According to [28], the potential annual average energy generated from tidal currents in the Irish region is 230 TWh. Similarly, 104 locations in Norway were examined, and it was found that approximately 17 TWh of energy could be obtained every year. Furthermore, ocean energy research conducted in the United Kingdom predicts the creation of around 68,000 jobs in the country by the year 2050 [29]. These results demonstrate the significant potential for tidal energy in the Irish and Norwegian regions. Furthermore, the energy produced contributes to meeting renewable energy targets and offers great prospects for job creation in the United Kingdom. Previous studies have mentioned the maximum and average current speeds and energy production potential for some locations in the MS region [30].
These studies have highlighted the significant potential for harnessing ocean energy in various regions. However, it is important to note that actual energy production may vary depending on factors such as technological advancements and environmental conditions. The growth of the ocean energy sector could also reduce dependence on fossil fuels, thus contributing to economic development. Research in progress and development initiatives aim to improve the efficiency and reliability of ocean energy technologies, which could further enhance the energy production potential in the future [31]. Therefore, further research and development are needed to fully exploit the potential of ocean energy in the MS region [25].
This study aims to analyze and map the annual and seasonal maximum current velocities in the MS region from 2016 to 2018. The purpose of the study is to identify the potential causes of fluctuations in maximum flow velocities that occur based on the year and season. Understanding these variations is crucial for accurate assessment of the energy production potential and optimization of the placement of marine energy devices in the MS region. Knowledge of the causes of potential fluctuations in maximum current speeds allows researchers to develop strategies for the efficient use of ocean energy. Simultaneously, by placing marine energy devices in the best way possible based on these differences, the MS region’s resources can be used to their fullest. By analyzing the data retrieved from three years, this study will give us useful information about the long-term patterns and trends of maximum current speeds, which, in turn, will help us devise marine energy projects that are both sustainable and effective.

2. Materials and Methods

2.1. Study Area

The average depth of the MS working area is 1500 m. The MS is connected to the Atlantic Ocean through the Straits of Gibraltar and to the Red Sea through the Suez Canal [32]. The MS region is rich in biodiversity and is characterized by a complex thermohaline system with high levels of wind–water interaction and circulation [33,34]. The WMS (West Mediterranean Sea) basin has a flat seafloor, while the EMS (East Mediterranean Sea) basin has a distinct seafloor formation [35]. The Sicily Channel connects the WMS and EMS basins [36]. The EMS has a higher salt concentration than the WMS. This concentration increases from west to east due to rapid evaporation [36]. The Atlantic water mass that enters via the Strait of Gibraltar moves northward and westward along the African coast, forming cyclonic and anticyclonic eddies [37]. After passing through the Strait of Sicily, one current branches towards the Tyrrhenian Sea, forming cyclonic currents along the coast, whereas another current flows through the Sicilian Channel and reaches the northern coasts of the Mediterranean Sea and the Levantine Basin. It forms surface, intermediate, and deep currents [38].

2.2. Remote-Sensed Data

During this study, the maximum flow velocities were analyzed in areas with a spatial resolution of 4 × 4 km, at depths of up to 150 m, between 2016 and 2018 using Copernicus Marine Environment Monitoring Services data [39]. Formulas (1)–(3) were used to determine the horizontal ( u I ) and vertical ( v I ) current data set and average [40]. The oceanic equations of motion of the Mediterranean current system were solved using an Ocean General Circulation Model based on NEMO (Nucleus for European Modelling of the Ocean version 3.6) [40]. The NEMO model is an interactive model that calculates air-surface fluxes of momentum, mass, and heat, and it is currently used in the Mediterranean Operational System. Climate Data Operator version 1.6.0 was used to visualize and analyze the NetCDF files. Additionally, an analysis was conducted on the maximum seasonal flow velocities during the study period (2016–2018), revealing differences between seasons. The seasons were labeled DJF, MAM, JJA, and SON, with each initial representing the first letter of the month falling in that season.
u I n = u I n 1 + 1 e 1 u δ i + 1 2 A D   X I n 1
v I n = v I n 1 + 1 e 2 v δ j + 1 2 A D   X I n 1
V ( m / s ) = u I 2 + v I 2

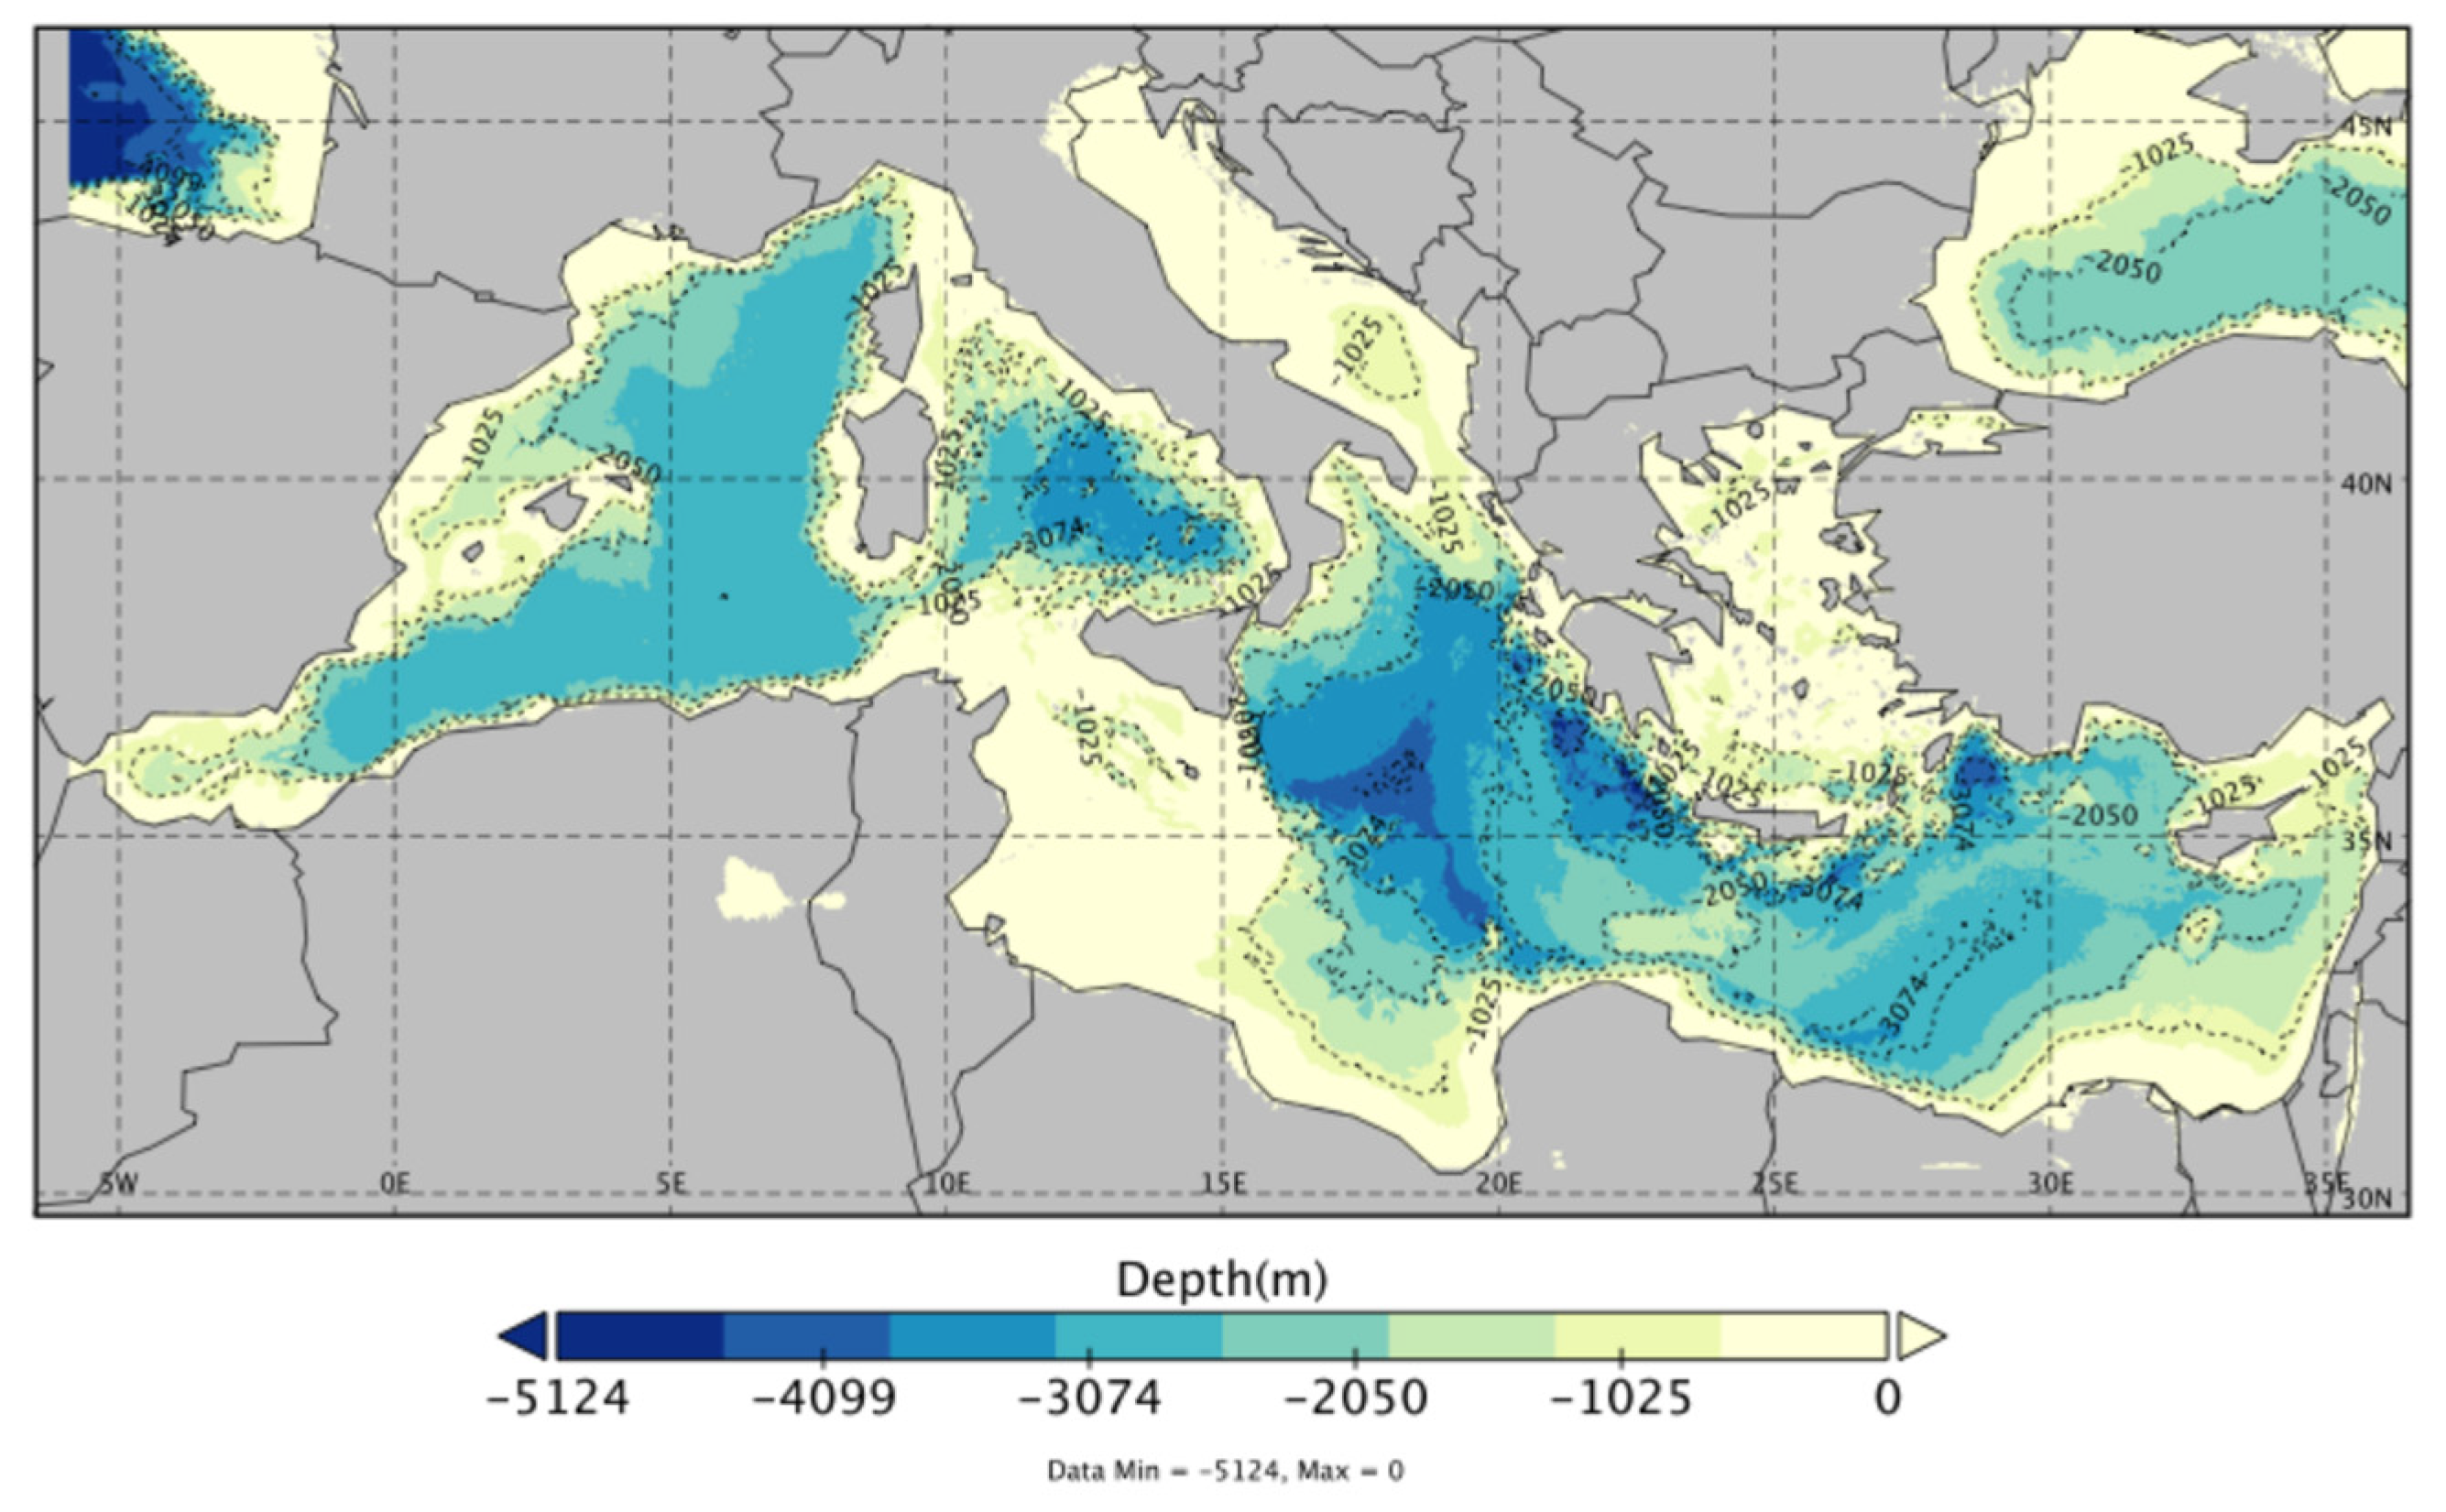
2.3. Bathymetry Data

The MS bathymetric map is presented in Figure 1, which reveals the depths of the coastlines and seas. The GEBCO (Bathymetric Compilation Group) [41] data set is used for bathymetric mapping of the Mediterranean region. The WMS coastlines, for example, have depths averaging around 1020 m, while the Tyrrhenian Sea reaches depths of up to 3074 m. Furthermore, certain points along the coasts and midsections of the Ionian Sea exceed 3000 m, while the EMS entry points vary between 2050 and 2500 m. The depths in the coastal and inner regions of the Levantine Sea range from 500 to 1025 m, and some points in the Aegean Sea reach depths of up to 4800 m.

2.4. Calculating Potential Energy with Underwater Turbine System

Previous research has indicated that hydrokinetic turbine systems installed underwater can provide significant amounts of environmentally friendly energy. The following Formula (4), derived by [17], theoretically expresses the energy gain (E) per unit time of a turbine (2). In this formula, p represents water density (1025 kg/m3), A represents the area swept by the rotor (m2), and V stands for marine current velocity (m/s). The selected turbine has a diameter of 9 m and minimum depth 30 m. The turbine efficiency is approximately 59.26% [42], while ensuring that it does not exceed the Betz limit. The study selected the AR1500 turbine type from Atlantis Resources as an example to determine the potential energy gain of an underwater turbine [43]. Previous studies have shown that the density of the sea benefits this turbine, which operates similarly to a wind turbine. The potential energy gain was calculated at locations with strong current speeds. The formula (5) calculated energy potential (Ep), which was used to calculate the potential energy gain for the points listed in Table 1. The resulting value was then multiplied by 365 (day), 24 (hour), and 3600 (second) to determine the hourly potential energy gain per year. Finally, the value was divided by 10 9 to represent the energy gain in gigawatt units.
E = 0.5pAV3
Ep = E 10 9

3. Results

In our study, we analyzed current data on the currents of the Mediterranean Sea obtained from Copernicus for the entire MS area, specifically for the years 2016, 2017, and 2018. First, we examined the data separately for each year. Figure 2 displays the temporal and spatial maximum current velocity (m/s) for the MS in 2016, which determined the highest current velocity during the study period to be 2.2 m/s. According to the analysis results of 2016, the highest current speed is observed at the WMS coasts and the Gibraltar Strait, where the speed of the current branch is generally between 1.2 m/s and 1.8 m/s, and there are areas in the Almeria-Oran region where the current reaches a speed of 1.8 m/s.
Second, this current branch, which continues to progress, reaches a speed of approximately 0.9 m/s to 1.5 m/s in the region up to the Sicily Channel. On the other hand, it is shown that the speed of the branch of current moving towards the interior of the EMS from the northern coasts of Africa varies between approximately 0.6 m/s and 1.3 m/s. Also, in the region between Benghazi and Tobruk off the coast of Libya and the island of Crete in Greece, there are points where the current speed exceeds 1.2 m/s. Likewise, it has also been determined that there are areas in the region between the eastern coasts of Cyprus and Turkey, particularly in the waters near Konacık and Samandağ, where the speed ranges from 0.9 m/s to 1.2 m/s. Additionally, points have been identified in the waters of the Aegean Sea between the islands of Rhodes and Chios, where the speed varies from 0.9 m/s to 1.2 m/s. Moreover, points with speeds ranging from 0.9 m/s to 1.1 m/s have been detected in the areas of Greece’s Peloponnese Peninsula and offshore regions on the Ionian Sea’s side. Regions ranging from 0.9 m/s to 1 m/s have been observed at points facing the coast of Durres along the entrance of the Adriatic Sea.
The temporal and spatial distribution map of the maximum flow velocity (m/s) for the year 2017 is displayed in Figure 3. The analysis shows that the maximum flow velocity reached up to 2.2 m/s. The current speeds of the current branch entering the WMS Almeria-Oran zone and its coastal areas were generally found to be between 0.9 m/s and 1.5 m/s, with an incoming velocity of approximately 1.8 m/s to 2.2 m/s from the Strait of Gibraltar. Moreover, the Balearic Sea experienced speeds ranging between 0.9 m/s and 1.2 m/s, while the entrance of the Sicily Channel measured between 1.2 m/s and 1.5 m/s. Additionally, the Tyrrhenian Sea usually sees speeds of 0.6 m/s, with certain points registering up to 1 m/s. The speed of the current moving towards the inner parts of the EMS from the Benghazi and Tobruk coasts is found to range between 0.9 m/s and 1.2 m/s. Moreover, it is generally around 0.6 m/s along the coasts of Cyprus and Turkey but can reach up to 1.2 m/s in certain areas of the Otranto Channel and the entrance to the Adriatic Sea. Additionally, in some locations off the coast of Rhodes Island and the Iskenderun Gulf, the speed is determined to be 1 m/s. It is clear that the entry of the western Mediterranean Sea from the Atlantic Ocean through the Strait of Gibraltar is more conducive to energy production, as shown by the velocity maps generated for 2016 and 2017.
The maximum spatial and temporal velocity for the MS in 2018 is depicted in Figure 4. Research during this period showed an increase in velocity up to roughly 2.7 m/s. The primary current flowing from the Strait of Gibraltar towards the WMS shores maintains a minimum speed of 0.9 m/s and may even exceed 1.8 m/s in certain locations. A study of current speeds ranging from 0.6 m/s to 1 m/s was conducted across the Ibiza Channel and the Balearic Sea and Tyrrhenian Sea regions. The analysis reveals that the average current speed varies between 0.6 m/s to 1.2 m/s along the WMS coastal regions to the EMS entrance, and from 0.9 m/s to 1.3 m/s in the Ionian Sea. The study identifies that the current speed ranges from roughly 0.6 m/s to 1.2 m/s along the EMS coasts of Libya and Egypt, while it moves quickly from the eastern Iskenderun Gulf regions at a speed of 0.6 m/s to 0.9 m/s towards the Ege Sea coasts. Points where the current flow can increase up to 1.2 m/s have been detected in the region between Midilli and Chios, Greece. Moreover, the entrance to the Adriatic Sea has been observed to possess a current speed ranging from 0.9 m/s to 1.5 m/s.
The map in Figure 5 shows the maximum current speed for the December–January–February season. During this season, the current speed can reach up to approximately 2.2 m/s at the entrance of the Strait of Gibraltar. It has been observed that the speed of the current along the WMS coasts is generally above 1.2 m/s and can reach up to 2 m/s. In some points of the EMS interior and Egypt offshore, the current can exceed 0.8 m/s. The current flowing along the Turkish coastline has been found to be approximately 0.4 to 0.8 m/s. In the Otranto Channel and the Ionian Sea coastline, the current has been determined to be between approximately 0.9 m/s and 1.3 m/s. The current in the Tyrrhenian Sea reaches up to 1.5 m/s, while in the Ibiza Channel entrance and the waters along the Balearic Islands, it has been observed to be between 1.2 m/s and 2 m/s.
During the months of March, April, and May, the maximum current velocity is mapped (as shown in Figure 6). The maximum current velocity reached approximately 2.7 m/s at the entrance to the Strait of Gibraltar. In this season, the current velocity was generally observed to be 1.2 m/s or higher along the Almeria-Oran coast, at the WMS entry point, and up to the Sicilian Channel. The current velocity was mostly 0.8 m/s but reached 1.5 m/s at some points off the coast of the Balearic Islands. The maximum current speed at the entrance of the EMS and off the Ionian Sea is 0.8 m/s. Furthermore, it has been observed that along the coasts of the Aegean Sea, the current speed generally ranges from 0.6 m/s to 1 m/s, with some points reaching up to 1.3 m/s. In the Levantine Sea, the current speed is generally found to be 0.8 m/s on average.
Figure 7 shows the maximum current velocity (m/s) observed during the working period of June–July–August (JJA) seasons from 2016 to 2018. This period registered a maximum current velocity of 2 m/s. It was found that the current branch flowing along the Gibraltar entrance and WMS coasts ranges between approximately 0.9 m/s and 2 m/s. It has been determined that the main current flowing from the Almeria-Oran region towards the Sicily Channel reaches speeds of over 0.9 m/s at certain points until the open waters of the Tyrrhenian Sea. It has also been observed that at the most distant points of the western coast of the Tyrrhenian Sea, the current reaches speeds of up to 1.5 m/s. Furthermore, along the lower parts of the Sicilian Channel and the Ionian coast, the velocity is between 0.6 m/s and 0.9 m/s. The current along the EMS coast extending to the Aegean Sea is estimated to be between 0.6 m/s and 0.9 m/s. Additionally, in certain regions east of the Gulf of Iskenderun and off the coast of Cyprus, near Konacık-Samandağ, the current speed has been measured to range from 1.2 m/s to 1.5 m/s.
The maximum current velocity (m/s) was mapped during the September–October–November (SON) season of the study period (2016–2018) in Figure 8. This season recorded the highest current velocity at approximately 2.1 m/s, and points were identified at the WMS shores where the current velocity was 0.6 m/s or higher. The main current branch from the Ibiza Channel towards the Balearic Sea was found to have a speed ranging from 0.6 m/s to 0.9 m/s. A current of up to 1.2 m/s has been found along the coasts of the Tyrrhenian Sea, at certain points in the Strait of Sicily. The current velocity in the vicinity of the Strait of Messina and the Ionian Sea usually varies between 0.6 and 1.2 m/s. Moreover, some areas at the entrance and coastline of the Adriatic Sea have been observed to witness current speeds of generally 0.6 to 1 m/s.
According to the analysis in Figure 9, the installation of a turbine system underwater can potentially generate gigawatts (GWh/year) of energy annually. In the WMS region, it was determined that there could be a gain of approximately 9 GWh/year or more at certain points along the coasts of Andorra and Genoa in the Balearic Sea. It was also found that there could be an increase of 6–10 GWh/year off the coasts of Algeria and Tunisia, and 4–5 GWh/year in the area between Malta and Sicily. Furthermore, an assessment of the regions of Derne and Tobruk, Libya, revealed a potential gain of more than 10 GWh/year. Furthermore, there is a potential for energy gain of over 6 GWh/year in the region between Cyprus and Turkey’s coastlines, particularly between the Samandağ, Arsuz, and Antalya areas. The coastal areas of the Greek islands of Rhodes and Crete have also been determined to have a potential gain of over 5 GWh/year.
Table 1 shows 14 points selected from the study area having high potential for energy production. In the selected regions, the lowest energy production amount was determined to be 7.82 GWh/year, while the highest was 9.98 GWh/year.

4. Discussion

Previous studies have determined the flow velocity at specific points in the MS region. In a recent study of the Messina Channel by [44], it was found that the maximum flow velocity in the region is typically between 1.8 m/s and 3 m/s. The study used the high-resolution hydrodynamic model SHYFEM. It is important to note that the chosen resolution of 1/48° (2 km) and the lack of long-term data sets in our study may lead to varying results. To identify appropriate sites for turbine installation in the Euripus channel region near Chalkis, Greece, locations with an average depth of 1.5 m and flow velocity of around 0.15 m/s were chosen. The conclusions drawn from the study indicate that though the area might not be ideal for large-scale energy production, it can be considered for small-scale applications [45]. The study’s data set was collected over a two-month span using a current measurement device. However, our study utilized satellite data sets collected hourly at depths of up to 150 m. Furthermore, our analysis incorporated approximately 386,080 data points. [46] performed a study to analyze the installation of underwater turbines and power production capabilities in Morocco, which is adjacent to the Atlantic coast and the Strait of Gibraltar. The study reveals that the current speed in the Tangier and Tetouan regions exceeded 2 m/s, while the average speed ranged from 0.9 m/s to 1.8 m/s. In addition, the energy production capacity per square meter reached a high of approximately 1.6 kWh. Our results may differ from previous studies due to the specific selection of the Atlantic coast study area and the use of a SWAN model output at 200 m resolution. [17] conducted a study on current speeds in the coastal region of Morocco, the Atlantic Ocean. Four points and depths were analyzed using the Copernicus Marine Environment Services Med-MFC model data set with a resolution of 1/24° * 1/24° for the year 2018. The study showed that the maximum current velocities were approximately 2.4 m/s and 1.5 m/s at depths of 10 and 50 m, respectively. In our study, we selected a depth range of 0–150 m and used the data set for the highest current velocity between 2016 and 2018. In another investigation [47], the current energy potential of the Larantuka Strait was analyzed through the Delft3D model. As a result of the analysis, certain locations with an annual energy production capacity of 20 GW or more were identified. The map in Figure 5 shows the maximum current speed for the December–January–February season. During this season, the current speed can reach up to approximately 2.2 m/s at the entrance of the Strait of Gibraltar. It has been observed that the current branch along the WMS coasts is generally above 1.2 m/s and can reach up to 2 m/s. In some points of the EMS interior and Egypt offshore, the current speed can exceed 0.8 m/s. The current flowing along the Turkish coastline has been found to be approximately 0.4 to 0.8 m/s. In the Otranto Channel and the Ionian Sea coastline, the current has been determined to be between approximately 0.9 m/s and 1.3 m/s. The current in the Tyrrhenian Sea reaches up to 1.5 m/s, while in the Ibiza Channel entrance and the waters off the Balearic Islands, it has been observed to be between 1.2 m/s and 2 m/s.

5. Conclusions

Annual and seasonal maximum current velocities were studied and mapped for the MS site during the study period (2016–2018). The maximum current velocities observed during the study were 2.2 m/s in 2016 and 2017, and 2.7 m/s in 2018. In addition, seasonal analyses revealed that during the DJF, MAM, JJA, and SON seasons of 2016–2018, the maximum current velocities were 2.2 m/s, 2.7 m/s, 2.0 m/s, and 2.1 m/s, respectively. Furthermore, by using underwater turbine systems in certain locations, it was found that there is a potential energy production of almost 10 GW/h. The study selected Atlantis Resources’ AR1500 turbine as an example to determine the potential energy gain from an underwater turbine with a rotor radius of 9 m and a minimum depth of approximately 30 m. Previous studies have shown that the turbine can harvest energy from the density of the sea, and operates similarly to a wind turbine. In this study, we calculated the potential energy gain at some locations with strong current speeds. The formula provides the energy gain per meter per second, which was used to calculate the potential energy gain for the points listed in Table 1. The resulting value was then multiplied by 365 (days), 24 (hours), and 3600 (seconds) to determine the hourly potential energy output per year. The result was then divided by 10 9 to represent the energy gain in gigawatt units. The results of this study can serve as a leader for future work in this field and assist in the installation of underwater turbines in the MS region in the future. On the other hand, it is necessary to consider the main current routes that marine organisms can follow to perform vital activities such as migration paths and feeding routes, by following the main current branches.

Author Contributions

Conceptualization, M.U.G. and A.S.; methodology, M.U.G. and A.S.; writing—original draft preparation, M.U.G. and A.S.; review and editing, M.U.G. and A.S. All authors have read and agreed to the published version of the manuscript.

Funding

This research received no external funding.

Institutional Review Board Statement

Not applicable.

Informed Consent Statement

Not applicable.

Data Availability Statement

Data are contained within the article.

Acknowledgments

Author Mehmet Ugur Gucel is a 100/2000 The Council of Higher Education in Aquaculture subdivision. The authors would like to express their sincere gratitude to Copernicus Marine Services for providing and access to the data that are used in this paper.

Conflicts of Interest

The authors declare no conflicts of interest.

Abbreviations

The following abbreviations are used in this manuscript
MSMediterranean Sea
WMSWest Mediterranean Sea
EMSEast Mediterranean Sea
DJFDecember, January, February
MAMMarch, April, May
JJAJune, July, August
SONSeptember, October, November
Eavailable current velocity power per unit area of flow (watt)
Epenergy potential gigawatt
pwater density (1025 kg/m3)
Athe rotor area swept (m2)
Vcurrent velocity (m/s)
TWhTerawatt per hour
MWhMegawatt per hour
m/smeter per second

References

  1. Bishoge, K.O.; Zhang, L.; Mushi, G.W. The Potential Renewable Energy for Sustainable Development in Tanzania: A Review. Clean Technol. 2018, 1, 70–88. [Google Scholar] [CrossRef]
  2. Albornoz, P.C.; Gómez, H.Á.; Ramirez, V.; Guilbert, D. Forecast Optimization of Wind Speed in the North Coast of the Yucatan Peninsula, Using the Single and Double Exponential Method. Clean Technol. 2023, 5, 744–765. [Google Scholar] [CrossRef]
  3. Gennip, S.; Popova, E.; Yool, A.; Pecl, G.; Hobday, A.; Sorte, C. Going with the flow: The role of ocean circulation in global marine ecosystems under a changing climate. Glob. Chang. Biol. 2017, 23, 2602–2617. [Google Scholar] [CrossRef] [PubMed]
  4. Melikoğlu, M. Current status and future of ocean energy sources: A global review. Ocean Eng. 2018, 148, 563–573. [Google Scholar] [CrossRef]
  5. Doney, S.C.; Ruckelshaus, M.; Duffy, J.E.; Barry, J.P.; Chan, F.; English, C.A.; Galindo, M.H.; Grebmeier, M.J.; Hollowed, B.A.; Knowlton, N.; et al. Climate change impacts on marine ecosystems. Annu. Rev. Mar. Sci. 2012, 4, 11–37. [Google Scholar] [CrossRef] [PubMed]
  6. Pinsky, M.L.; Worm, B.; Fogarty, M.J.; Sarmiento, J.L.; Levin, S.A. Marine taxa track local climate velocities. Science 2013, 341, 1239–1242. [Google Scholar] [CrossRef] [PubMed]
  7. Poloczanska, E.S.; Brown, C.J.; Sydeman, W.J.; Kiessling, W.; Schoeman, D.S.; Moore, P.J.; Richardson, A.J. Global imprint of climate change on marine life. Nat. Clim. Chang. 2013, 3, 919–925. [Google Scholar] [CrossRef]
  8. Hughes, T.P.; Barnes, M.L.; Bellwood, D.R.; Cinner, J.E.; Cumming, G.S.; Jackson, J.B.C.; Kleypas, J.; van de Leemput, I.A.; Lough, J.M.; Morrison, T.H.; et al. Coral reefs in the Anthropocene. Nature 2017, 546, 82–90. [Google Scholar] [CrossRef]
  9. Guldberg, H.O.; Poloczanska, S.E.; Skirving, W.; Dove, S. Coral reef ecosystems under climate change and ocean acidification. Front. Mar. Sci. 2017, 4, 158. [Google Scholar] [CrossRef]
  10. Ray, P. Renewable energy and sustainability. Clean Technol. Environ. Policy 2019, 21, 1517–1533. [Google Scholar] [CrossRef]
  11. Sweidan, O.D. The environmental and energy policies to enable sustainable consumption and production in the gulf cooperation council countries. Clean Technol. Environ. Policy 2021, 23, 2639–2654. [Google Scholar] [CrossRef]
  12. Davide, M.; Uihlein, A. Ocean energy development in Europe: Current status and future perspectives. Int. J. Mar. Energy 2015, 11, 84–104. [Google Scholar] [CrossRef]
  13. Opperman, J.J.; Carvallo, J.P.; Kelman, R.; Schmitt, R.J.P.; Almeida, R.; Chapin, E.; Flecker, A.; Goichot, M.; Grill, G.; Harou, J.J.; et al. Balancing renewable energy and river resources by moving from individual assessments of hydropower projects to energy system planning. Front. Environ. Sci. 2023, 10, 1036653. [Google Scholar] [CrossRef]
  14. McMaster, R.; Noble, B.; Poelzer, G.; Menghwani, V. Local capacity for energy transition in northern and indigenous communities: Analysis of gwich’in communities in northwest territories, Canada. Arctic 2023, 76, 143–159. [Google Scholar] [CrossRef]
  15. Milone, D.; Curto, D.; Franzitta, V.; Guercio, A.; Cirrincione, M.; Mohammadi, A. An economic approach to size of a renewable energy mix in small islands. Energies 2022, 15, 2005. [Google Scholar] [CrossRef]
  16. Rahman, N.; Badshah, S.; Rafai, A.; Badshah, M. Literature Review of Ocean Current Turbine. Int. J. Sci. Eng. Res. 2014, 5, 11. [Google Scholar] [CrossRef]
  17. Hazim, S.; Salih, A.; Janan, T.M.; Ouatouati, E.A.; Ghennioui, A. Marine current energy assessment and the hydrodynamic design of the hydrokinetic turbine for the Moroccan Mediterranean Coast. Energy Explor. Exploit. 2021, 39, 717–737. [Google Scholar] [CrossRef]
  18. Martinez, C.; Rockel, S.; Vieux, C. European Overseas Coastal and Marine Protected Areas: Overview of Coastal and Marine Conservation Efforts in the European Union’s Overseas Countries and Territories and Outermost Regions; IUCN: Gland, Switzerland, 2017; Volume xxvii, 182p. [Google Scholar] [CrossRef]
  19. Morrison, R.; Zhang, J.; Urban, E.; Hall, J.; Ittekkot, V.; Avril, B.; Zuo, F. Developing human capital for successful implementtion of international marine scientific research projects. Mar. Pollut. Bull. 2013, 77, 11–22. [Google Scholar] [CrossRef] [PubMed]
  20. Schmidt, J.O.; Bograd, S.J.; Arrizabalaga, H.; Azevedo, J.L.; Barbeaux, S.J.; Barth, J.A.; Boyer, T.; Brodie, S.; Cárdenas, J.J.; Cross, S.; et al. Future ocean observations to connect climate, fisheries and marine ecosystems. Front. Mar. Sci. 2019, 6, 550. [Google Scholar] [CrossRef]
  21. Pelc, R.; Fujita, R. Renewable energy from the ocean. Mar. Policy 2002, 26, 471–479. [Google Scholar] [CrossRef]
  22. Borja, A.; Pouso, S.; Galparsoro, I.; Manca, E.; Vasquez, M.; Lu, W.; Yang, L.; Uriarte, A. Applying the China’s marine resource-environment carrying capacity and spatial development suitability approach to the Bay of Biscay (North-East Atlantic). Front. Mar. Sci. 2022, 9, 972448. [Google Scholar] [CrossRef]
  23. Chen, Z.; He, J.; Cao, S.; Lu, Z.; Lan, M.; Zheng, H.; Luo, G.; Zhang, F. Diversity and distribution of heterotrophic flagellates in seawater of the Powell Basin, Antarctic Peninsula. Polar Res. 2021, 40, 5389. [Google Scholar] [CrossRef]
  24. Lee, D.; Kim, G.Y.; Tac, D.; Yi, Y.M.; Choi, J.H.; Kim, J.H.; Lee, H.J.; Yoon, S.S. Diagnosis of Scoping and Type of Review on the Marine Environmental Impact Assessment for Ocean Energy Development Project. J. Korean Soc. Mar. Environ. Energy 2015, 18, 179–188. [Google Scholar] [CrossRef]
  25. Pisacane, G.; Sannino, G.; Carillo, A.; Struglia, M.; Bastianoni, S. Marine energy exploitation in the Mediterranean region: Steps forward and challenges. Front. Energy Res. 2018, 6, 109. [Google Scholar] [CrossRef]
  26. Soukissian, T.H.; Denaxa, D.; Karathanasi, F.; Prospathopoulos, A.; Sarantakos, K.; Iona, A.; Georgantas, K.; Mavrakos, A.S. Marine Renewable Energy in the Mediterranean Sea: Status and Perspectives. Energies 2017, 10, 1512. [Google Scholar] [CrossRef]
  27. Melo, B.A.; Villate, L.J. Ocean Energy Systems Annual Report; The Executive Committee of Ocean Energy Systems: Lisbon, Portugal, 2016. Available online: https://tethys.pnnl.gov/sites/default/files/publications/OES-Annual-Report-2016.pdf (accessed on 13 December 2023).
  28. Rourke, F.; Boyle, F.; Reynolds, A. marine current energy devices: Current status and possible future applications in Ireland. Renew. Sustain. Energy Rev. 2010, 14, 1026–1036. [Google Scholar] [CrossRef]
  29. Gan, K.; Oki, T.; Gan, T.; Weis, T.; Yamazaki, D.; Schüttrumpf, H. Enhancing renewable energy systems, contributing to sustainable development goals of united nation and building resilience against climate change impacts. Energy Technol. 2023, 11, 11. [Google Scholar] [CrossRef]
  30. Hariss, S.; Saifaoui, D.; Hilmi, K.; Lilane, A.; Sossy, D.V. Exploitation of the Moroccan maritime potential in tidal energy. Mater. Today Proc. 2020, 30, 984–986. [Google Scholar] [CrossRef]
  31. Carillo, A.; Pisacane, G.; Struglia, M. Exploitation of an operative wave forecast system for energy resource assessment in the mediterranean sea. Front. Energy Res. 2022, 10, 944417. [Google Scholar] [CrossRef]
  32. Schroeder, K. Current Systems in the Mediterranean Sea. In Encyclopedia of Ocean Sciences, 3rd ed.; Cochran, K.J., Bokuniewicz, J.H., Yager, L.P., Eds.; Academic Press: Oxford, UK, 2019; Volume 3, pp. 219–227. [Google Scholar]
  33. Bonanno, A.; Zgozi, S.W.; Jarboui, O.; Mifsud, R.; Ceriola, L.; Basilone, G.; Arneri, E. Marine ecosystems and living resources in the Central Mediterranean Sea: An introduction. Hydrobiologia 2018, 821, 1–10. [Google Scholar] [CrossRef]
  34. Sakalli, A. Sea surface temperature change in the mediterranean sea under climate change: A linear model for simulation of the sea surface temperature up to 2100. Appl. Ecol. Environ. Res. 2017, 15, 707–716. [Google Scholar] [CrossRef]
  35. Anthony, J.E.; Marriner, N.; Morhange, C. Human influence and the changing geomorphology of Mediterranean deltas and coasts over the last 6000 years: From progradation to destruction phase? Earth-Sci. Rev. 2014, 139, 336–361. [Google Scholar] [CrossRef]
  36. Coll, M.; Piroddi, C.; Steenbeek, J.; Kaschner, K.; Ben Rais Lasram, F.; Aguzzi, J.; Ballesteros, E.; Bianchi, C.N.; Corbera, J.; Dailianis, T.; et al. The Biodiversity of theMediterranean Sea: Estimates, Patterns, and Threats. PLoS ONE 2010, 5, 8. [Google Scholar] [CrossRef] [PubMed]
  37. Buffet, G.G.; Krahmann, G.; Klaeschen, D.; Schroeder, K.; Sallares, V.; Papenberg, C.; Ranero, R.C.; Zitellini, N. Seismic Oceanography in the Tyrrhenian Sea: Thermohaline Staircases, Eddies, and Internal Waves. J. Geophys. Res. Ocean 2017, 122, 8503–8523. [Google Scholar] [CrossRef]
  38. Pascual, M.; Rives, B.; Schunter, C.; Macpherson, E. Impact of life history traits on gene flow: A multispecies systematic review across oceanographic barriers in the Mediterranean Sea. PLoS ONE 2017, 12, 5. [Google Scholar] [CrossRef] [PubMed]
  39. Escudier, R.; Clementi, E.; Omar, E.; Cipollone, A.; Pistoia, J.; Aydogdu, A.; Drudi, M.; Grandi, A.; Lyubartsev, V.; Lecci, R.; et al. Mediterranean Sea Physical Reanalysis (CMEMS MED-Currents) (Version 1) [Data Set]; Copernicus Monitoring Environment Marine Service (CMEMS): Ramonville-Saint-Agne, France, 2020. [Google Scholar] [CrossRef]
  40. Gurvan, M.; Bourdallé-Badie, R.; Chanut, J.; Clementi, E.; Coward, A.; Ethé, C.; Iovino, D.; Lea, D.; Lévy, C.; Lovato, T.; et al. NEMO Ocean Engine. Scientific Notes of IPSL Climate Modelling Center, v4.2, № 27; IPSL: Guyancourt, France, 2022. [Google Scholar] [CrossRef]
  41. GEBCO Bathymetric Compilation Group. The GEBCO_2021 Grid a Continuous Terrain Model of the Global Oceans and Land; NERC EDS British Oceanographic Data Centre NOC: Liverpool, UK, 2021. [Google Scholar] [CrossRef]
  42. Ranjbar, H.M.; Nasrazadani, A.S.; Kia, Z.H.; Gharali, K. Reaching the betz limit experimentally and numerically. Energy Equip. Syst. 2019, 7, 271–278. [Google Scholar] [CrossRef]
  43. Korte, A.; Windt, C.; Nils, G. Review assessment of the German tidal energy resource. J. Ocean Eng. Mar. Energy 2024, 10, 239–261. [Google Scholar] [CrossRef]
  44. Cucco, A.; Quattrocchi, G.; Olita, A.; Fazioli, L.; Ribotti, A.; Sinerchia, M.; Tedesco, C.; Sorgente, R. Hydrodynamic modelling of coastal seas: The role of tidal dynamics in the Messina Strait, Western Mediterranean Sea. Nat. Hazards Earth Syst. Sci. 2016, 16, 1553–1569. [Google Scholar] [CrossRef]
  45. Kontoyiannis, H.; Panagiotopoulos, M.; Soukissian, T. The Euripus tidal stream at Halkida/Greece: A practical, inexpensive approach in assessing the hydrokinetic renewable energy from field measurements in a tidal channel. J. Ocean Eng. Mar. Energy 2015, 1, 325–335. [Google Scholar] [CrossRef]
  46. Hazim, S.; Ouatouati, E.A.; Janan, T.M.; Ghennioui, A. Marine Currents Energy Resource Characterization for Morocco. Energy Procedia 2019, 157, 1037–1049. [Google Scholar] [CrossRef]
  47. Orhan, K.; Mayerle, R.; Pandoe, W. Assesment of energy production potential from tidal stream currents in Indonesia. Energy Procedia 2015, 76, 7–16. [Google Scholar] [CrossRef]
Figure 1. Mediterranean bathymetry map.
Jmse 12 00671 g001
Figure 2. Spatial distribution 4 × 4 km maximum current velocity (m/s) of the Mediterranean Sea in 2016.
Jmse 12 00671 g002
Figure 3. Spatial distribution 4 × 4 km maximum current velocity (m/s) of the Mediterranean Sea in 2017.
Jmse 12 00671 g003
Figure 4. Spatial distribution 4 × 4 km maximum current velocity (m/s) of the Mediterranean Sea in 2018.
Jmse 12 00671 g004
Figure 5. Spatial distribution 4 × 4 km maximum current velocity (m/s) of DJF between 2016 and 2018.
Jmse 12 00671 g005
Figure 6. Spatial distribution 4 × 4 km maximum current velocity (m/s) of MAM between 2016 and 2018.
Jmse 12 00671 g006
Figure 7. Spatial distribution 4 × 4 km maximum current velocity (m/s) of JJA between 2016 and 2018.
Jmse 12 00671 g007
Figure 8. Spatial distribution 4 × 4 km maximum current velocity (m/s) of SON between 2016 and 2018.
Jmse 12 00671 g008
Figure 9. Energy Potential Production (GWh/year).
Jmse 12 00671 g009
Table 1. High Potential Energy Production (GWh/year) areas in the Mediterranean Sea.
Current Velocity (m/s)Location (Latitude, Longitude)Potential Energy Production (GWh/Year)
0.46726227.04167, 34.93759.98
0.4642735.79167, 35.18759.79
0.460298.791667, 43.93759.54
0.457733.91667, 35.93759.38
0.4572155.208333, 43.020839.35
0.456889.291667, 37.520839.33
0.4537635.83333, 36.06259.14
0.4487433.54167, 35.895838.84
0.4468735.75, 35.979178.73
0.445532.1667, 36.06258.65
0.4401229.66667, 35.895838.34
0.4372835.66667, 35.477178.18
0.4371123.125, 32.854178.17
0.4307729.625, 33.770837.82
Disclaimer/Publisher’s Note: The statements, opinions and data contained in all publications are solely those of the individual author(s) and contributor(s) and not of MDPI and/or the editor(s). MDPI and/or the editor(s) disclaim responsibility for any injury to people or property resulting from any ideas, methods, instructions or products referred to in the content.

