Article

Centrifuge Shaking Table Test on the Seismic Dynamics of Revetment Breakwater and a Nearby Aircraft Runway Built on Reclaimed Coral Sand Foundation

1
State Key Laboratory of Geomechanics and Geotechnical Engineering, Institute of Rock and Soil Mechanics, Chinese Academy of Sciences, Wuhan 430071, China
2
School of Engineering Science, University of Chinese Academy of Sciences, Beijing 100049, China
3
School of Safety Sciences and Emergence Management, Wuhan University of Technology, Wuhan 430070, China
*
Author to whom correspondence should be addressed.
J. Mar. Sci. Eng. 2023, 11(1), 41; https://doi.org/10.3390/jmse11010041
Submission received: 25 November 2022 / Revised: 20 December 2022 / Accepted: 21 December 2022 / Published: 28 December 2022
(This article belongs to the Section Ocean Engineering)

Abstract

:
There are currently at least five aircraft runways built on the reclaimed coral sand foundations in the South China Sea (SCS). The seismic dynamics and stability of the revetment breakwaters and nearby aircraft runways built on reclaimed lands with coral sand in the SCS deserve attention. Taking the reclamation engineering in the SCS as the background, this study performed several centrifuge shaking table tests (N = 50 g) to explore the seismic dynamics and stability of a revetment breakwater and a nearby aircraft runway built on a reclaimed coral sand foundation. It is revealed that the revetment breakwater, aircraft runway, and their coral sand foundation have intensively responded to the excitation of seismic waves. The pore water pressure accumulates in the coral sand foundation; however, the accumulation amplitude is not significant. As a result, only soil softening, rather than liquefaction, has occurred in the coral sand foundation. The final residual subsidence of the revetment breakwater and aircraft runways are both about 0.5 mm, indicating that they are finally in a stable state. Through comparative study, it is found that the pore water pressure in the loose coral sand foundation is much easier to accumulate, and the corresponding acceleration amplification effect is also more significant. It means that a loose coral sand foundation is more detrimental to the seismic stability of the revetment breakwaters and airport runways.

1. Introduction

To perform marine observation, scientific research, marine rescue, safe navigation, and rational exploitation of marine resources, an aircraft runway with a length of 1150 m was first successfully constructed on Taiping Island in December 2007, which was a natural coral reef island in the South China Sea (SCS). In addition, China has built a series of lands on the top of some natural coral reefs in the SCS by the way of reclamation since 2013, and several aircraft runways have been built on them. As the area of these reclaimed lands was quite limited, these runways were usually built right at the edge zone of these reclaimed lands, and close to the protective revetment breakwater in the SCS.
For the revetment breakwater and other types of structures built on the islands of coral reefs, the environmental loads mainly include ocean waves and earthquakes. On the wave-induced dynamics and stability of revetment breakwaters in the SCS, some physical model tests (Ye et al. [1], He et al. [2,3], Zhang et al. [4]) and numerical analyses (Guo [5]) have been conducted in recent years. However, there is still very little research on the seismic dynamics and stability of the revetment breakwaters and other structures built on the coral reef in the SCS. United States Geological Survey (USGS) [6], Zhou and Adams [7] pointed out that the potential of strong earthquakes was great in the SCS. Furthermore, the results of Sun et al. [8] showed that a strong earthquake and great tsunami event occurred in the sea area around Xisha Island in the SCS around 1024 AD. Previous studies (Memos and Protonotarios [9], Iai and Kameoka [10], Hamada et al. [11], Sumer et al. [12]) have shown that once an earthquake occurs near engineering sites, marine structures may be damaged due to the foundation instability. Seismic loading brings a great threat to the safety and stability of the revetment breakwaters and their nearby runways built on these reclaimed coral sand foundations in the SCS. Therefore, it is of great engineering importance to study the seismic dynamics of the revetment breakwater and its runway in the SCS.
The coral reef is typically an isolated and high-rise terrain (1–3 km in height and 20–30 degrees of slope) in the marine environment. Many scholars have conducted deep studies on the seismic dynamics of isolated terrains, including numerical analysis (Li [13], Hao and Zhang [14], Bao et al. [15], Liu et al. [16]) and experimental studies (Yu et al. [17], Wang and Zhang [18], Hu et al. [19], Wu et al. [20]). Their results all confirmed that an isolated and high-rise terrain must have a significant amplification effect on seismic acceleration. The results of Li [13] showed that the peak acceleration at the top of a natural coral reef is 13 times that of the incident seismic wave at the bottom. Due to the significant amplification effect of the isolated and high-rise terrain of coral reefs on seismic waves, even an incident of weak seismic activity may be a great hazard to the safety of the revetment breakwaters, nearby runways, and their reclaimed coral sand foundation on the top of the coral reefs in the SCS.
A series of previous works have been conducted on the seismic stability of offshore breakwaters. Chaudhary and Hazarika [21] and Ozaki and Nagao [22] investigated the seismic stability of a caisson-type breakwater using physical model tests; Chen and Huang [23], Basu et al. [24], and Ye and Wang [25] studied the seismic dynamic response of a concrete breakwater adopting numerical modeling. Some scholars further carried out parametric studies to explore the effects of seismic frequency [26], the cross-section shape of breakwater [27,28], and the stiffness of seabed foundation [29,30] on the seismic dynamics of breakwaters. However, the previous works were mainly focused on the seismic dynamics of breakwaters built on quartz sand or silt soil foundation, and less research has been conducted on the seismic dynamics of the structures built on a coral sand foundation. Since the physical and mechanical properties of coral sand are different from those of terrestrial quartz sands, further research work is needed to explore the seismic dynamics and stability of the structures built on the coral sand foundation in the SCS.
In this study, the centrifuge shaking table test is utilized to investigate the seismic dynamics and stability of the revetment breakwater and a nearby aircraft runway built on a reclaimed coral sand foundation in SCS. The centrifugal acceleration is set as N = 50 g, and the similarity scale is set as 1:50 correspondingly. The excitation seismic wave is obtained by equally scaling the acceleration time history recorded at Wolong station in the 2008 Wenchuan great earthquake. The effects of the compactness of the coral sand foundation and the intensity of seismic waves are explored by performing some comparative tests. The experimental results presented in this study could provide valuable references for the seismic design of the breakwaters and structures in the SCS.

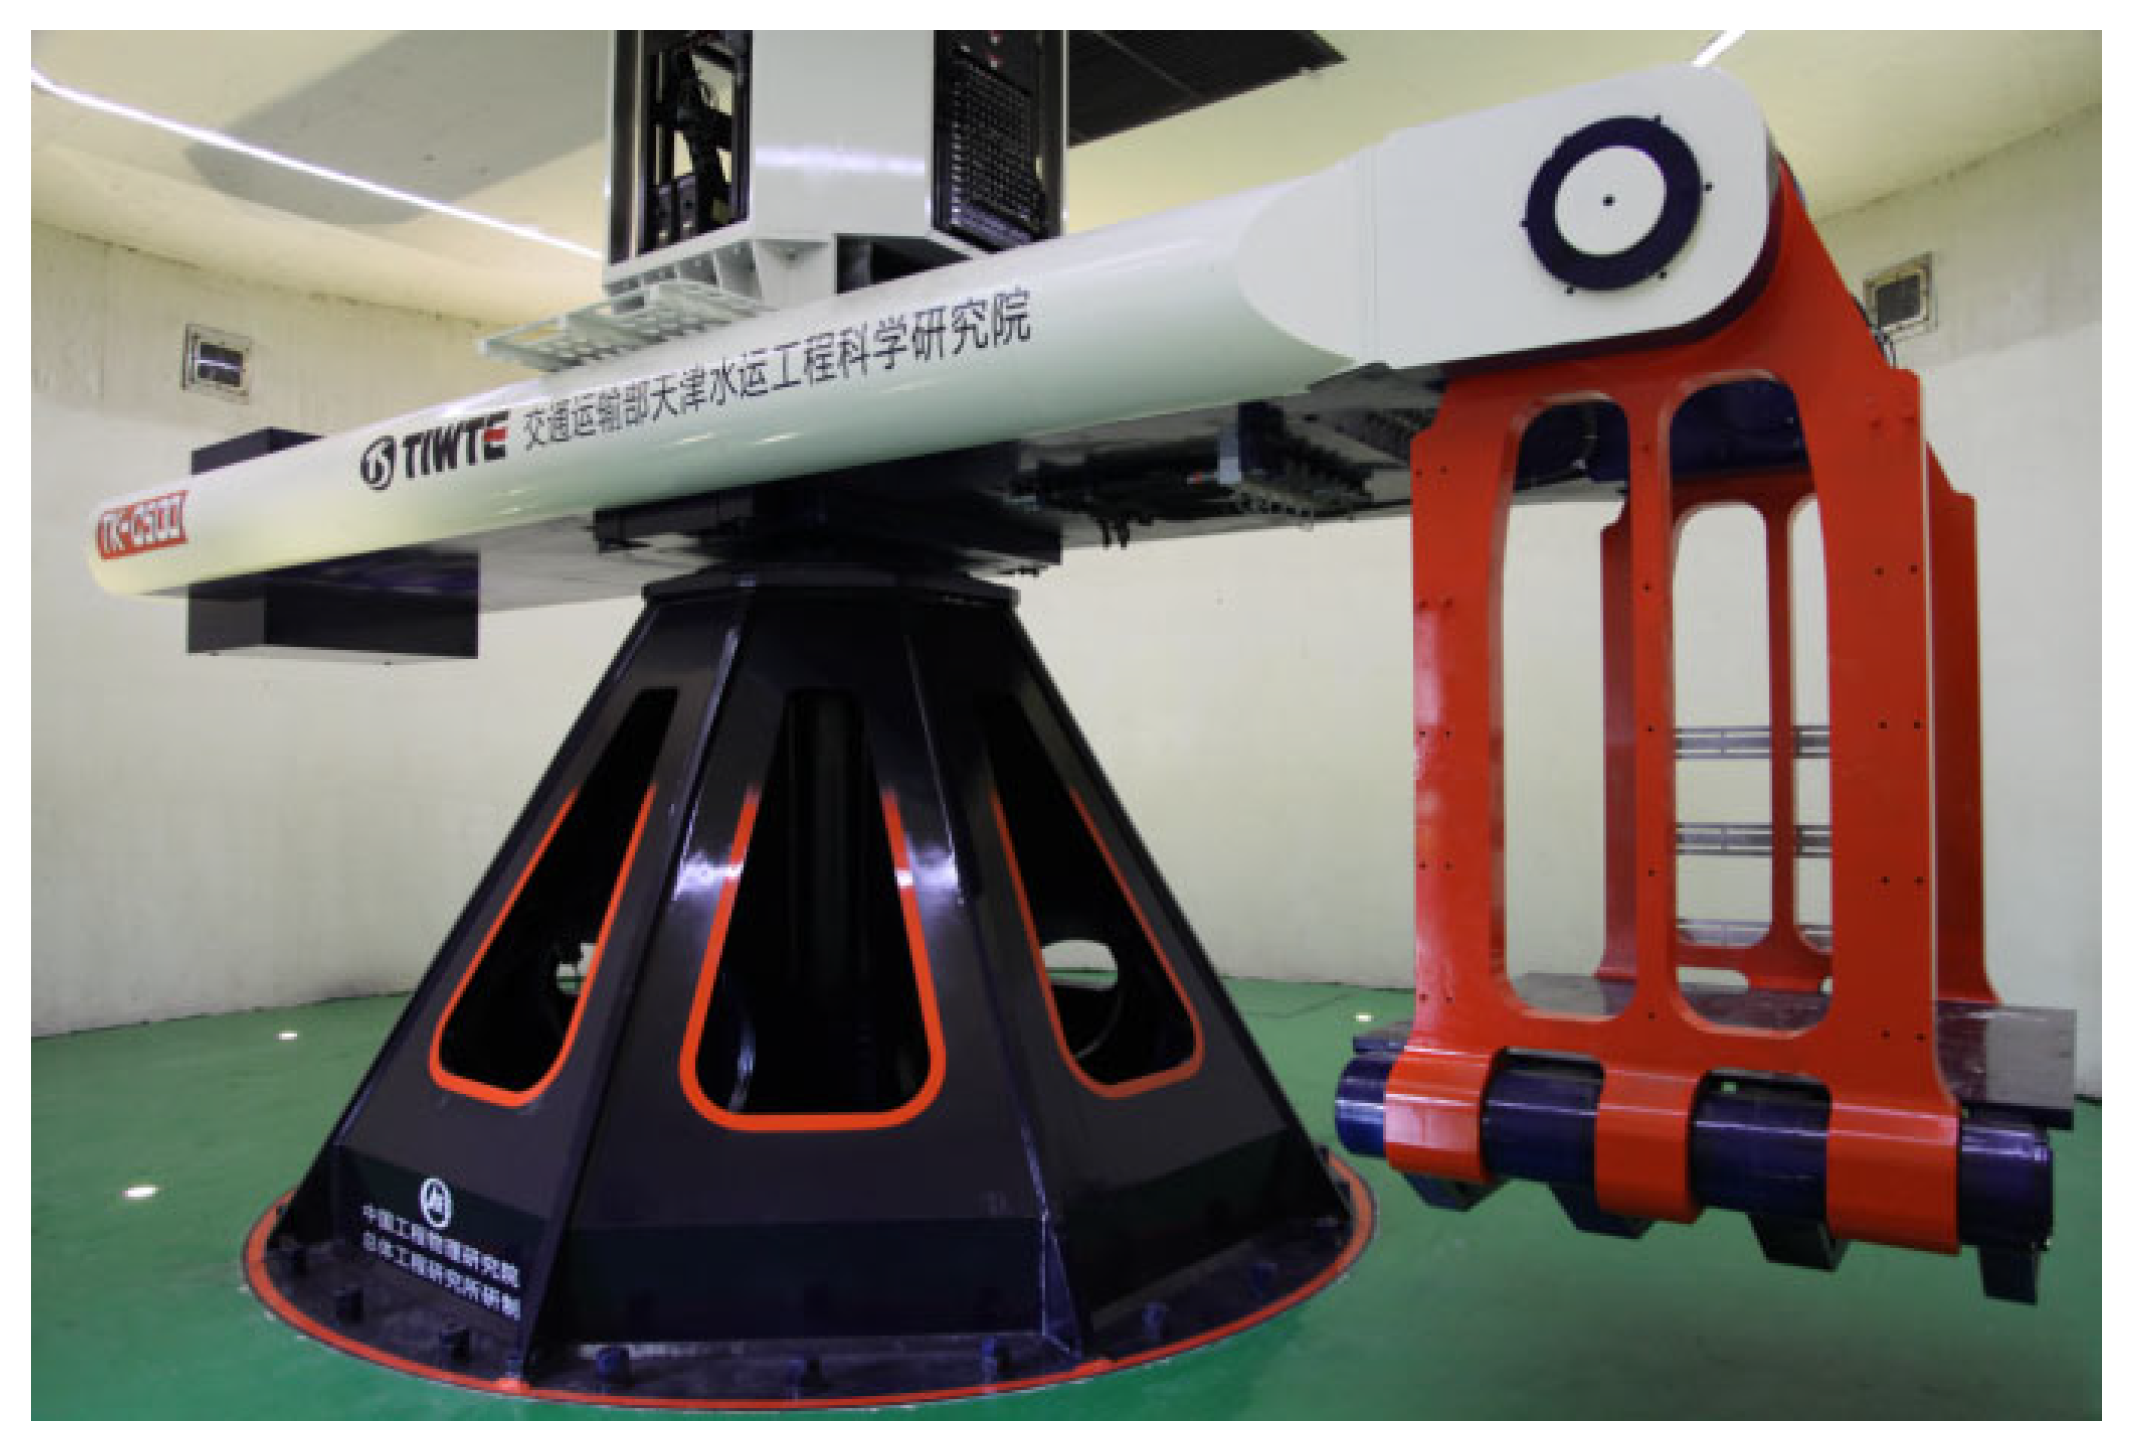
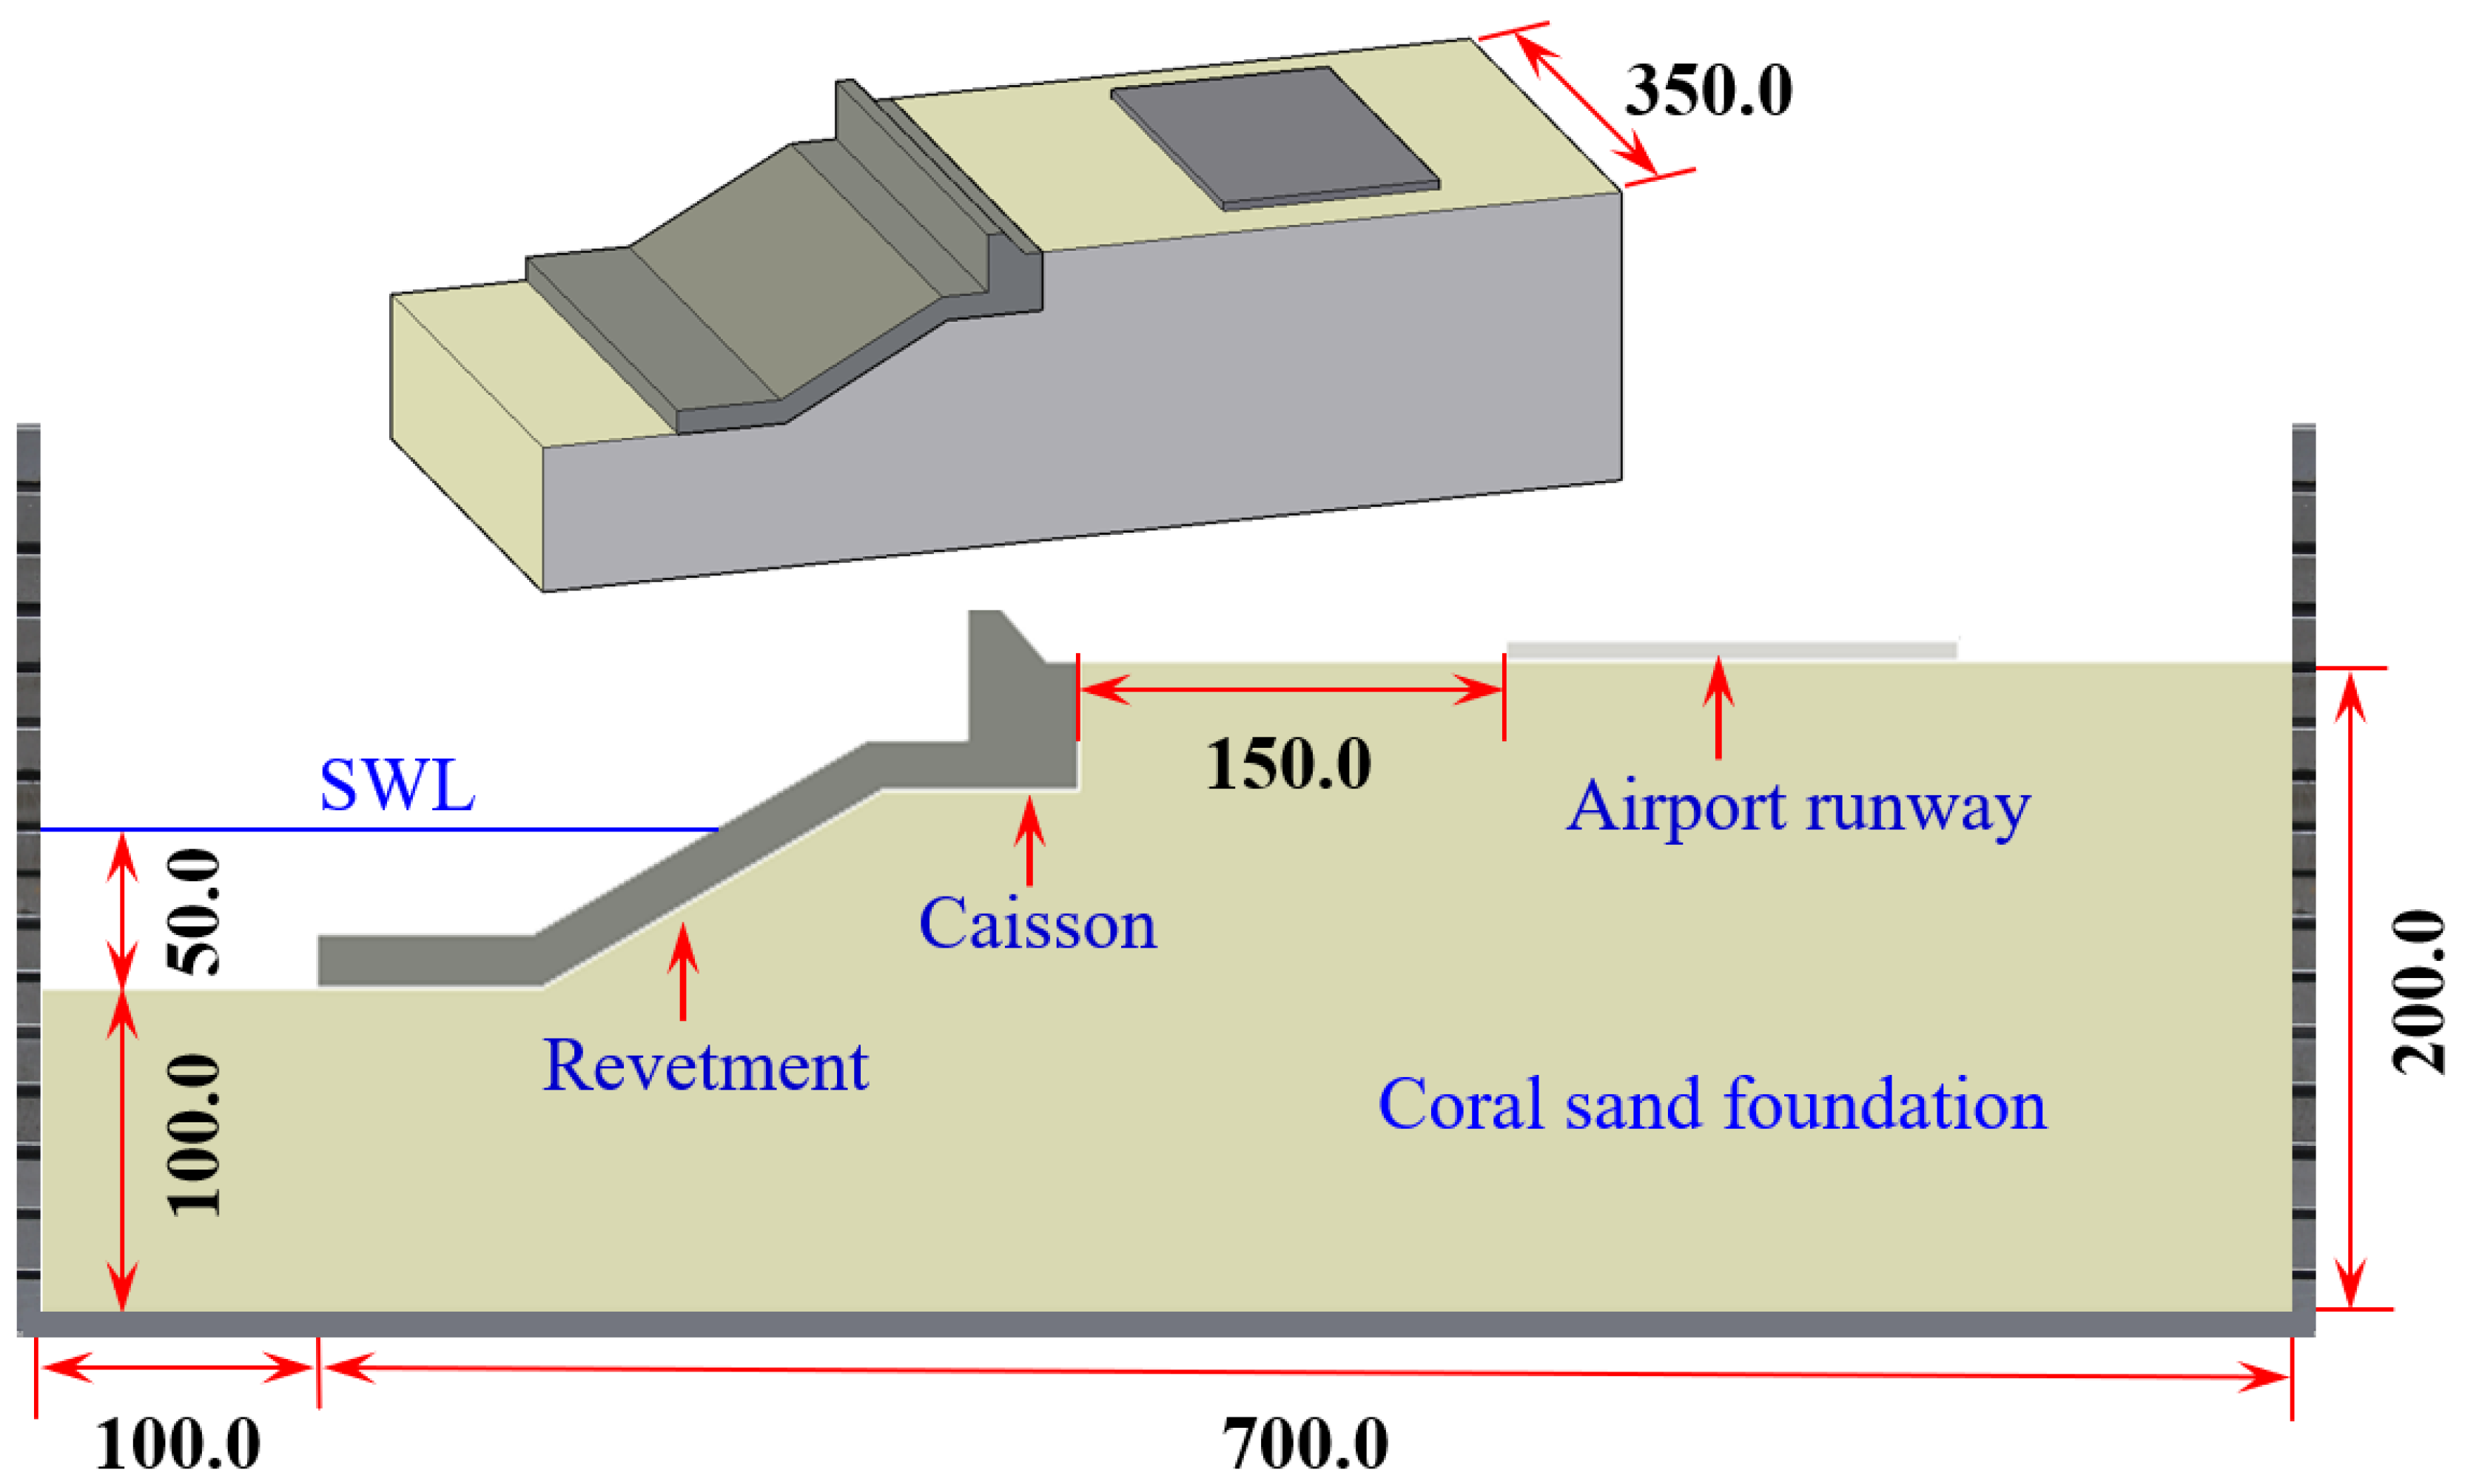
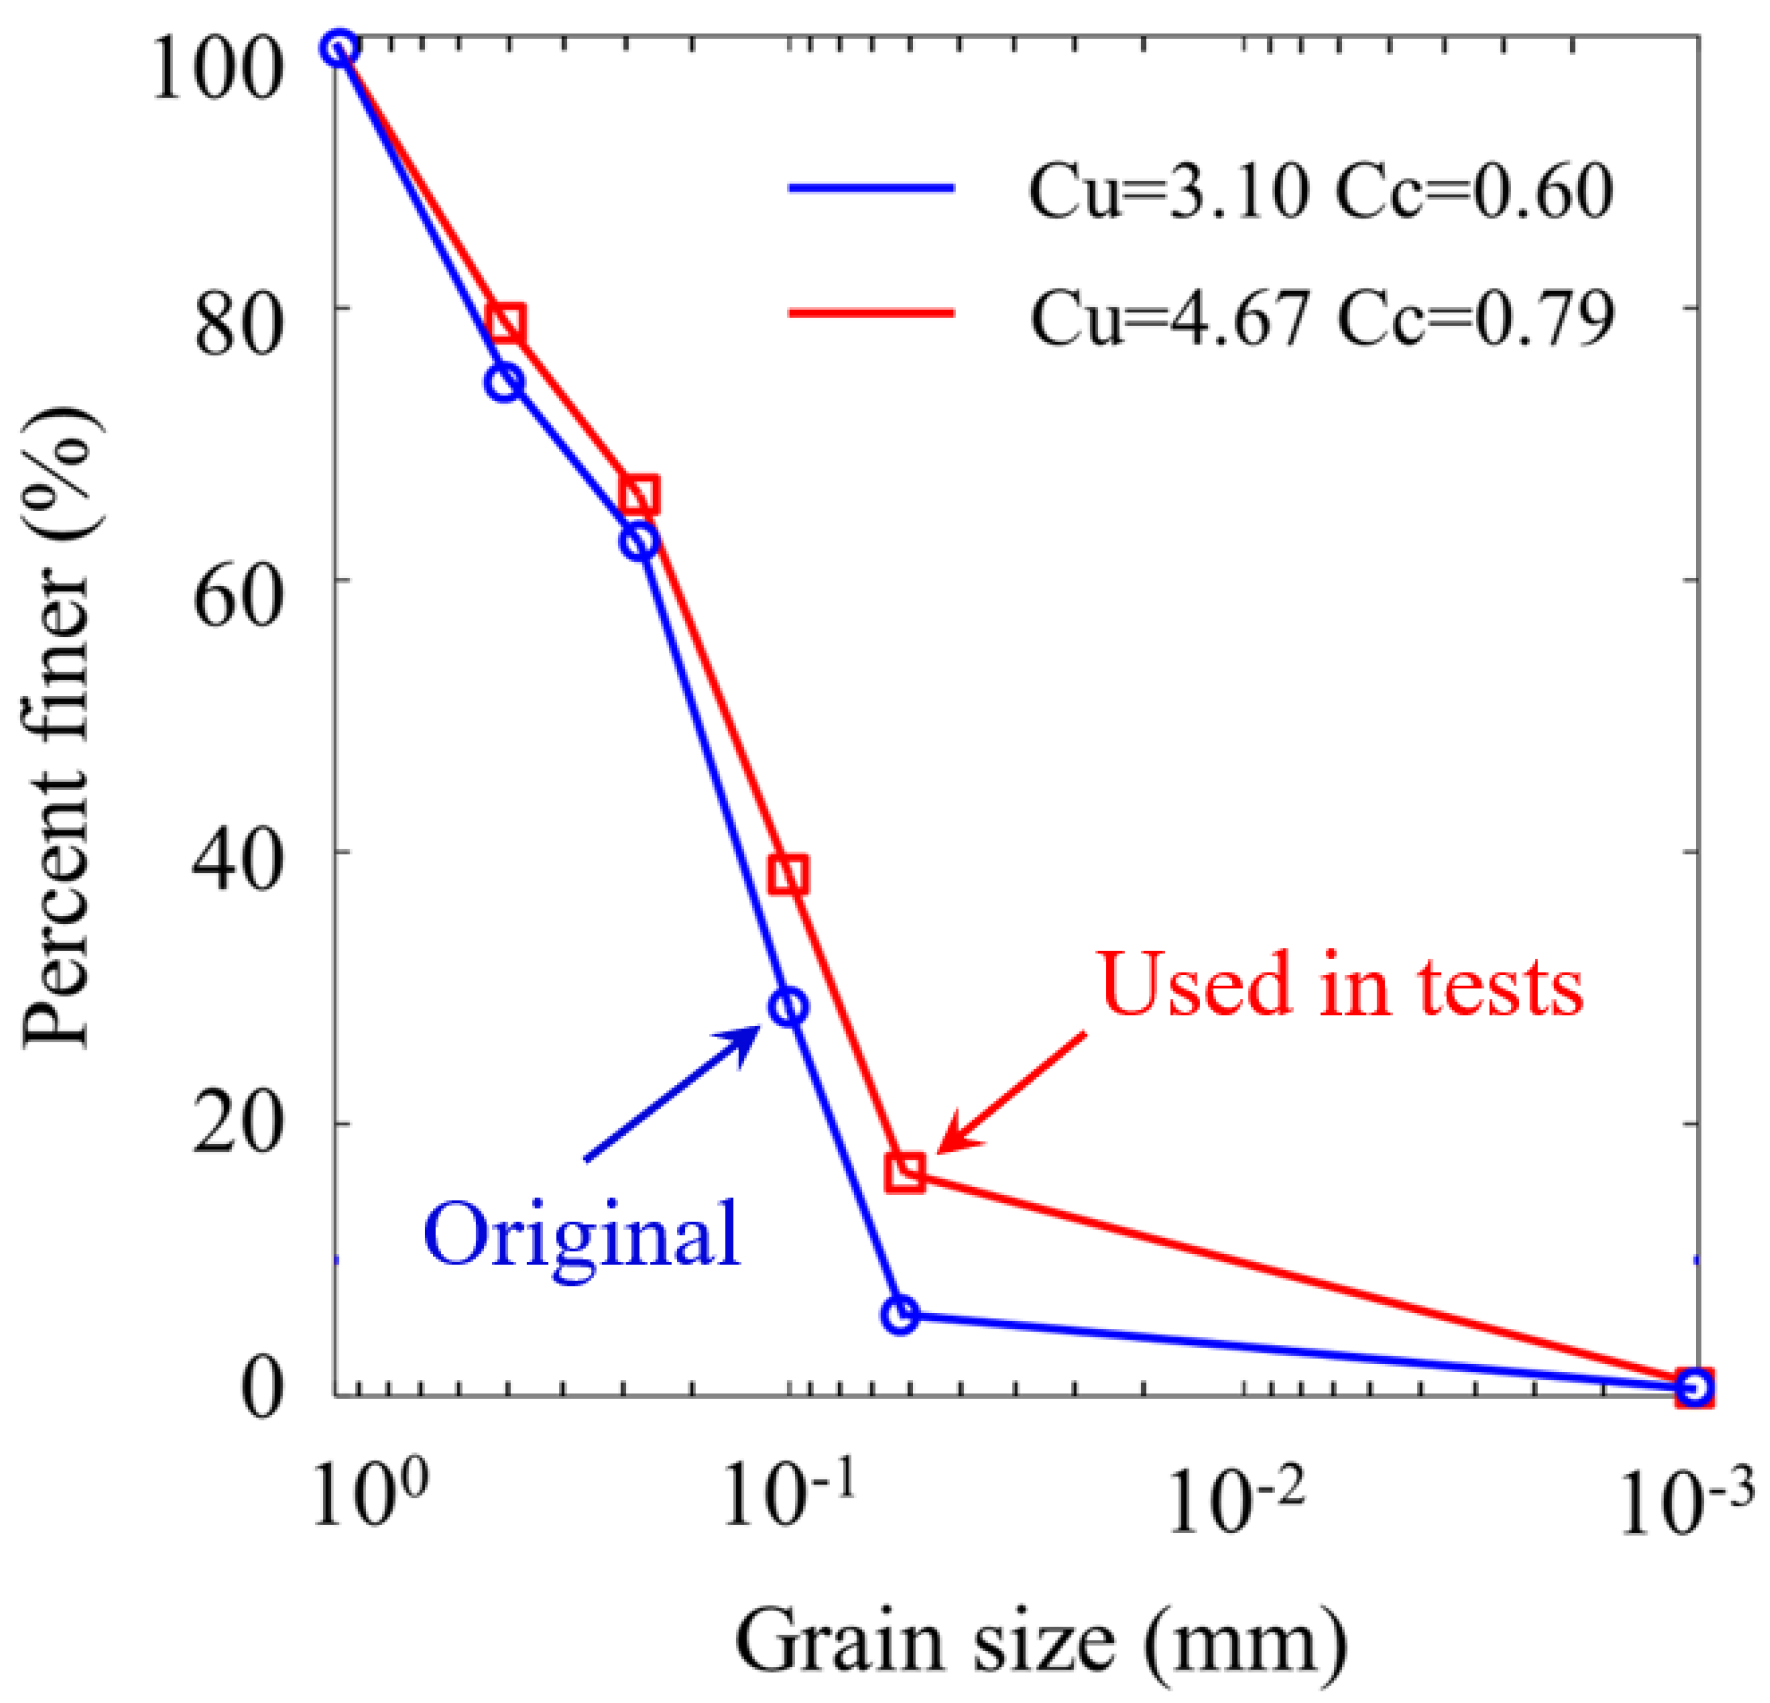
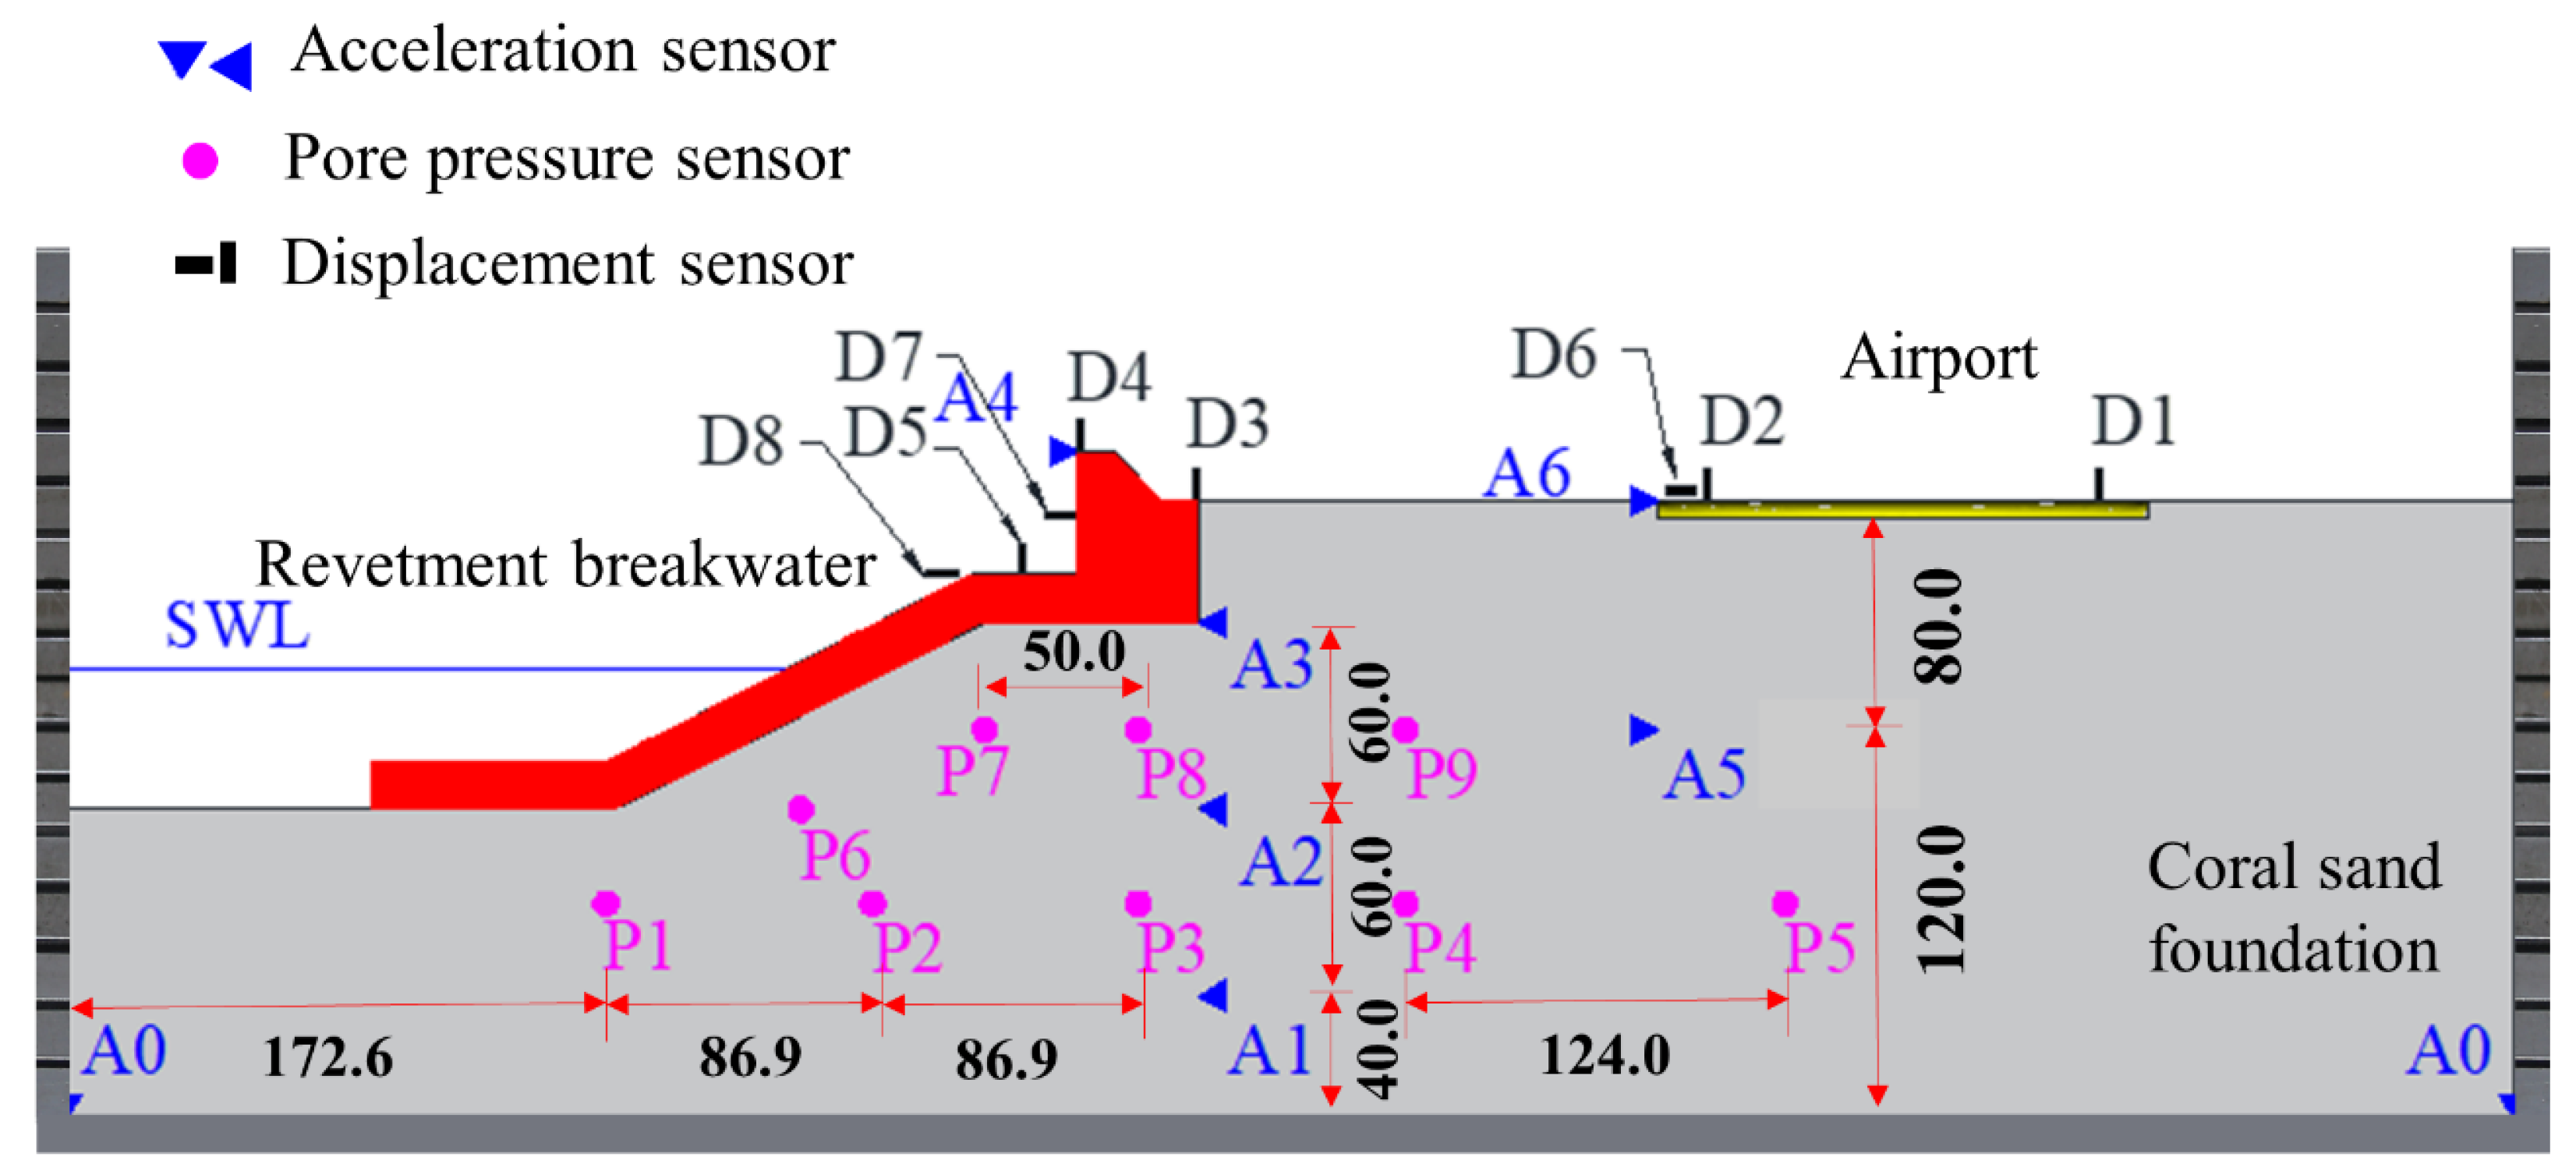
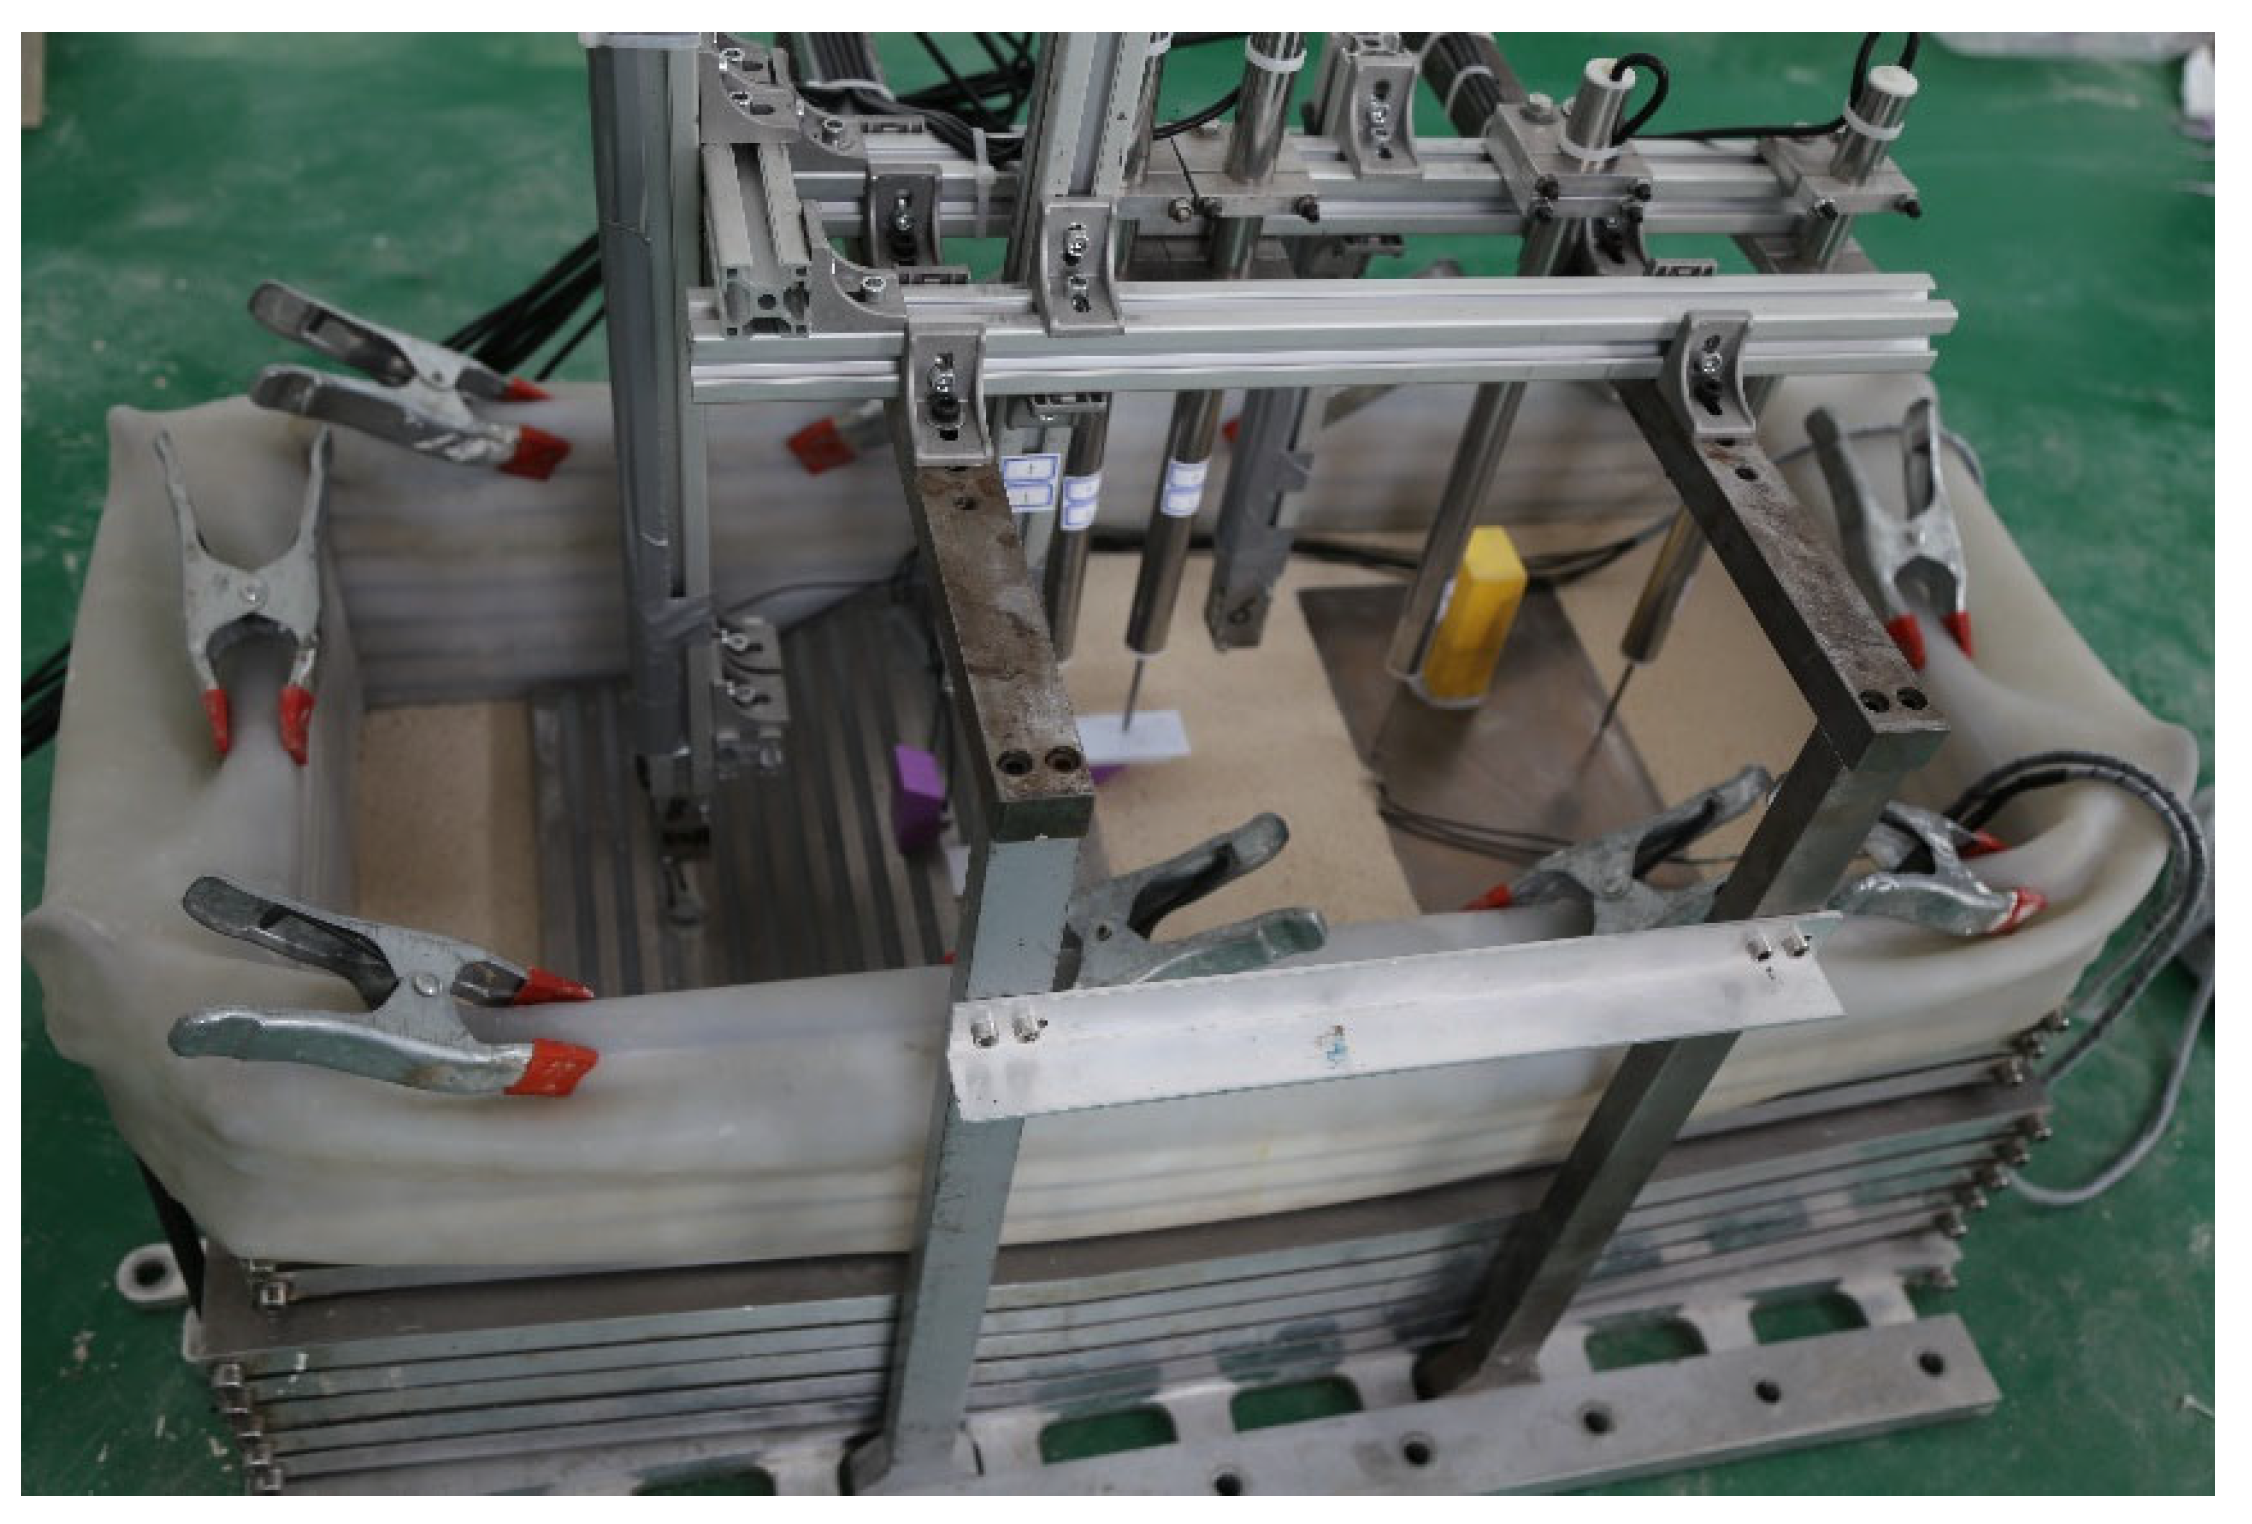
2. Physical Model and Excitation of Seismic Waves

The geotechnical centrifuge used in the test is shown in Figure 1 (Model is TK-C500). It has an effective capacity of 500 g·t, with a maximum centrifugal acceleration of 250 g and a maximum rotation radius of 5 m. The shaking table can simultaneously output the horizontal and vertical excitations with a peak exciting acceleration of 40 g horizontally and 20 g vertically, and the exciting frequency scope is 20 to 200 Hz. The model box used in the test is a stacked laminar shear box with an internal dimension of 350 mm × 800 mm × 400 mm, which can weaken the reflection of seismic waves on the lateral boundaries. The centrifugal acceleration in the test is set as 50 g. Accordingly, the similarity ratio of the physical model is 1:50.
The physical model consists of a revetment breakwater, an aircraft runway, and their coral sand foundation, in which the breakwater is composed of a near S-shaped revetment and a caisson. The schematic map of the physical model is illustrated in Figure 2. Considering the effect of water, the water depth is set to 50 mm in the test.
In practical engineering, the revetment breakwater and runway are both built with reinforced concrete, and the overall density is about ρ = 2500 kg/m3. In the physical model, aluminum alloy material ( ρ = 2800 kg/m3) is used to simulate the breakwater and runway. To make the overall density of the breakwater and runway meet the requirement of similarity with the prototype model, the breakwater and runway are partially hollowed out during the model preparation, ensuring that the overall density of the breakwater and runway is close to that of concrete. Additionally, the bottom of the breakwater and runway are roughened to simulate the friction between them and their foundation beneath the coral sand.
The coral sand foundation is prepared with the original coral sand sampled from the engineering sites in the South China Sea. To ensure the responding law of the seepage and pore pressure in the physical model is similar to that in the engineering prototype, the original coral sand needs to be screened and re-proportioned (note: the soil particles are not crushed), and the content of fine particles is increased in the proportioning process to form the sand utilized in the test. The grain gradation curves of the original coral sand and the re-proportioned sand are shown in Figure 3. Since the particle sizes in the physical model do not satisfy the similarity ratio 1:50 with that in the prototype model at engineering in-sites, the stiffness of the coral sand foundation in the physical model should be much greater than that in the prototype model. This is an inevitable scale effect in this study. Furthermore, a hydroxypropyl methylcellulose (HPMC) solution with a viscosity coefficient 50 times that of water at the test temperature before testing is prepared as the pore fluid used in the test.
The arrangement of sensors in the physical model is shown in Figure 4. Eight three-directional acceleration sensors are buried in the coral sand foundation, of which A0 is placed at the bottom of the model box for recording and calibrating the incident seismic waves. Nine pore pressure sensors are installed in the coral sand foundation, layer by layer. Eight displacement sensors (including LVDT and laser displacement meter) are installed to record the horizontal and vertical displacement responding of the breakwater and runway, respectively. In the test, to ensure the density and uniformity of the foundation, the coral sand foundation is prepared by the layered compaction method, and each layer is compacted to only 120% of the predetermined height. Through several tests, it is found that the designed layer thickness can be achieved by leaving 20% extra thickness for each layer of the coral sand after settling in the 50 g centrifugal gravity field. Sensors are installed at designed locations as that in Figure 4. After model preparation, the HPMC solution is poured into the stacked laminar box, and then the physical model is saturated in the 50 g centrifugal gravity field for half an hour. The completed physical model is shown in Figure 5.
Since the first seismic station in the SCS was built after 2015, there has been no strong earthquake recorded since its completion. In this test, the acceleration time history of the original seismic wave recorded at Wolong station, which is about 100 km away from the epicenter of the 2008 Wenchuan great earthquake, is selected as the excitation seismic wave after multiplying by a coefficient of 0.7. The peak acceleration of the excitation seismic wave is 6.702 m/s2 in the horizontal, and 3.7925 m/s2 in the vertical; it is, in fact, a strong seismic wave.
According to the convention of the centrifuge shaking table test, before the formal test begins, a temporary model with the same mass as the physical model is prepared and installed on the centrifuge shaking table, to commission and ensure that the output waveform of the shaking table can be as close to the target waveform as possible. The comparison of the input and output seismic waveforms of the centrifuge shaking table is shown in Figure 6, and the comparison of the frequency distribution is shown in Figure 7. It can be seen that the waveforms of the input and output seismic waves are basically consistent, while the peak acceleration of the output seismic waves is relatively small. The frequencies of the input and output seismic waves are both mainly distributed in the range of 0–10 Hz. After several times of commissioning, it is found that the output seismic wave of the shaking table can meet the test requirements. Finally, the waveform recorded by the acceleration sensor A0 installed at the bottom of the model box is used as the excitation seismic wave for the subsequent analysis of the test results.
In this study, three tests are conducted, and the test conditions are listed in Table 1. The physical model will be recreated for each test. Test 1 is used as the typical case to analyze the seismic dynamic responding and the stability of the revetment breakwater, aircraft runway, and their coral sand foundation built on the coral reefs in the SCS. Test 2 and Test 3 are two comparative cases to study the influences of the compactness of coral sand foundation, and the intensity of seismic wave. The waveform of the excitation seismic wave in Test 3 is exactly the same as that in Test 1. However, the acceleration value at any moment is obtained by equally scaling the acceleration time history in Test 1.

3. Analysis of Test Results

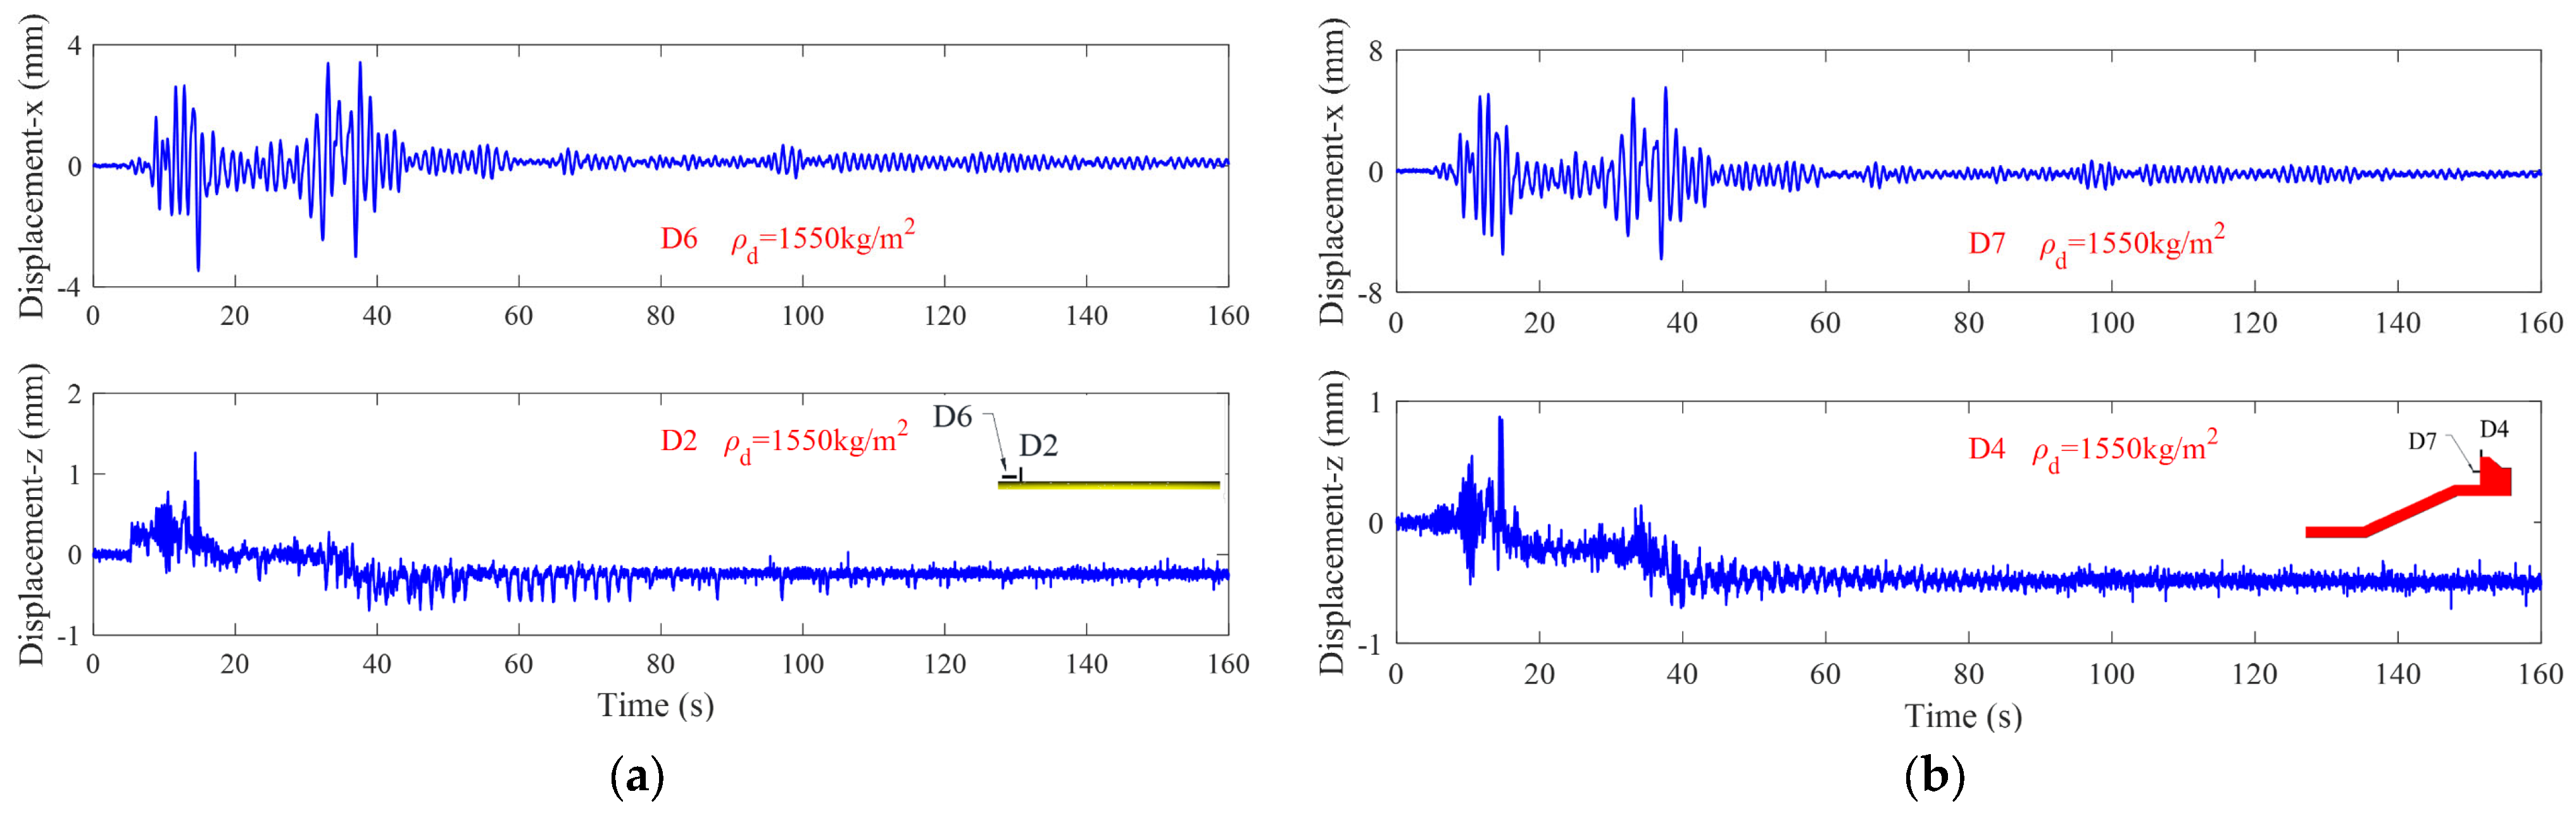
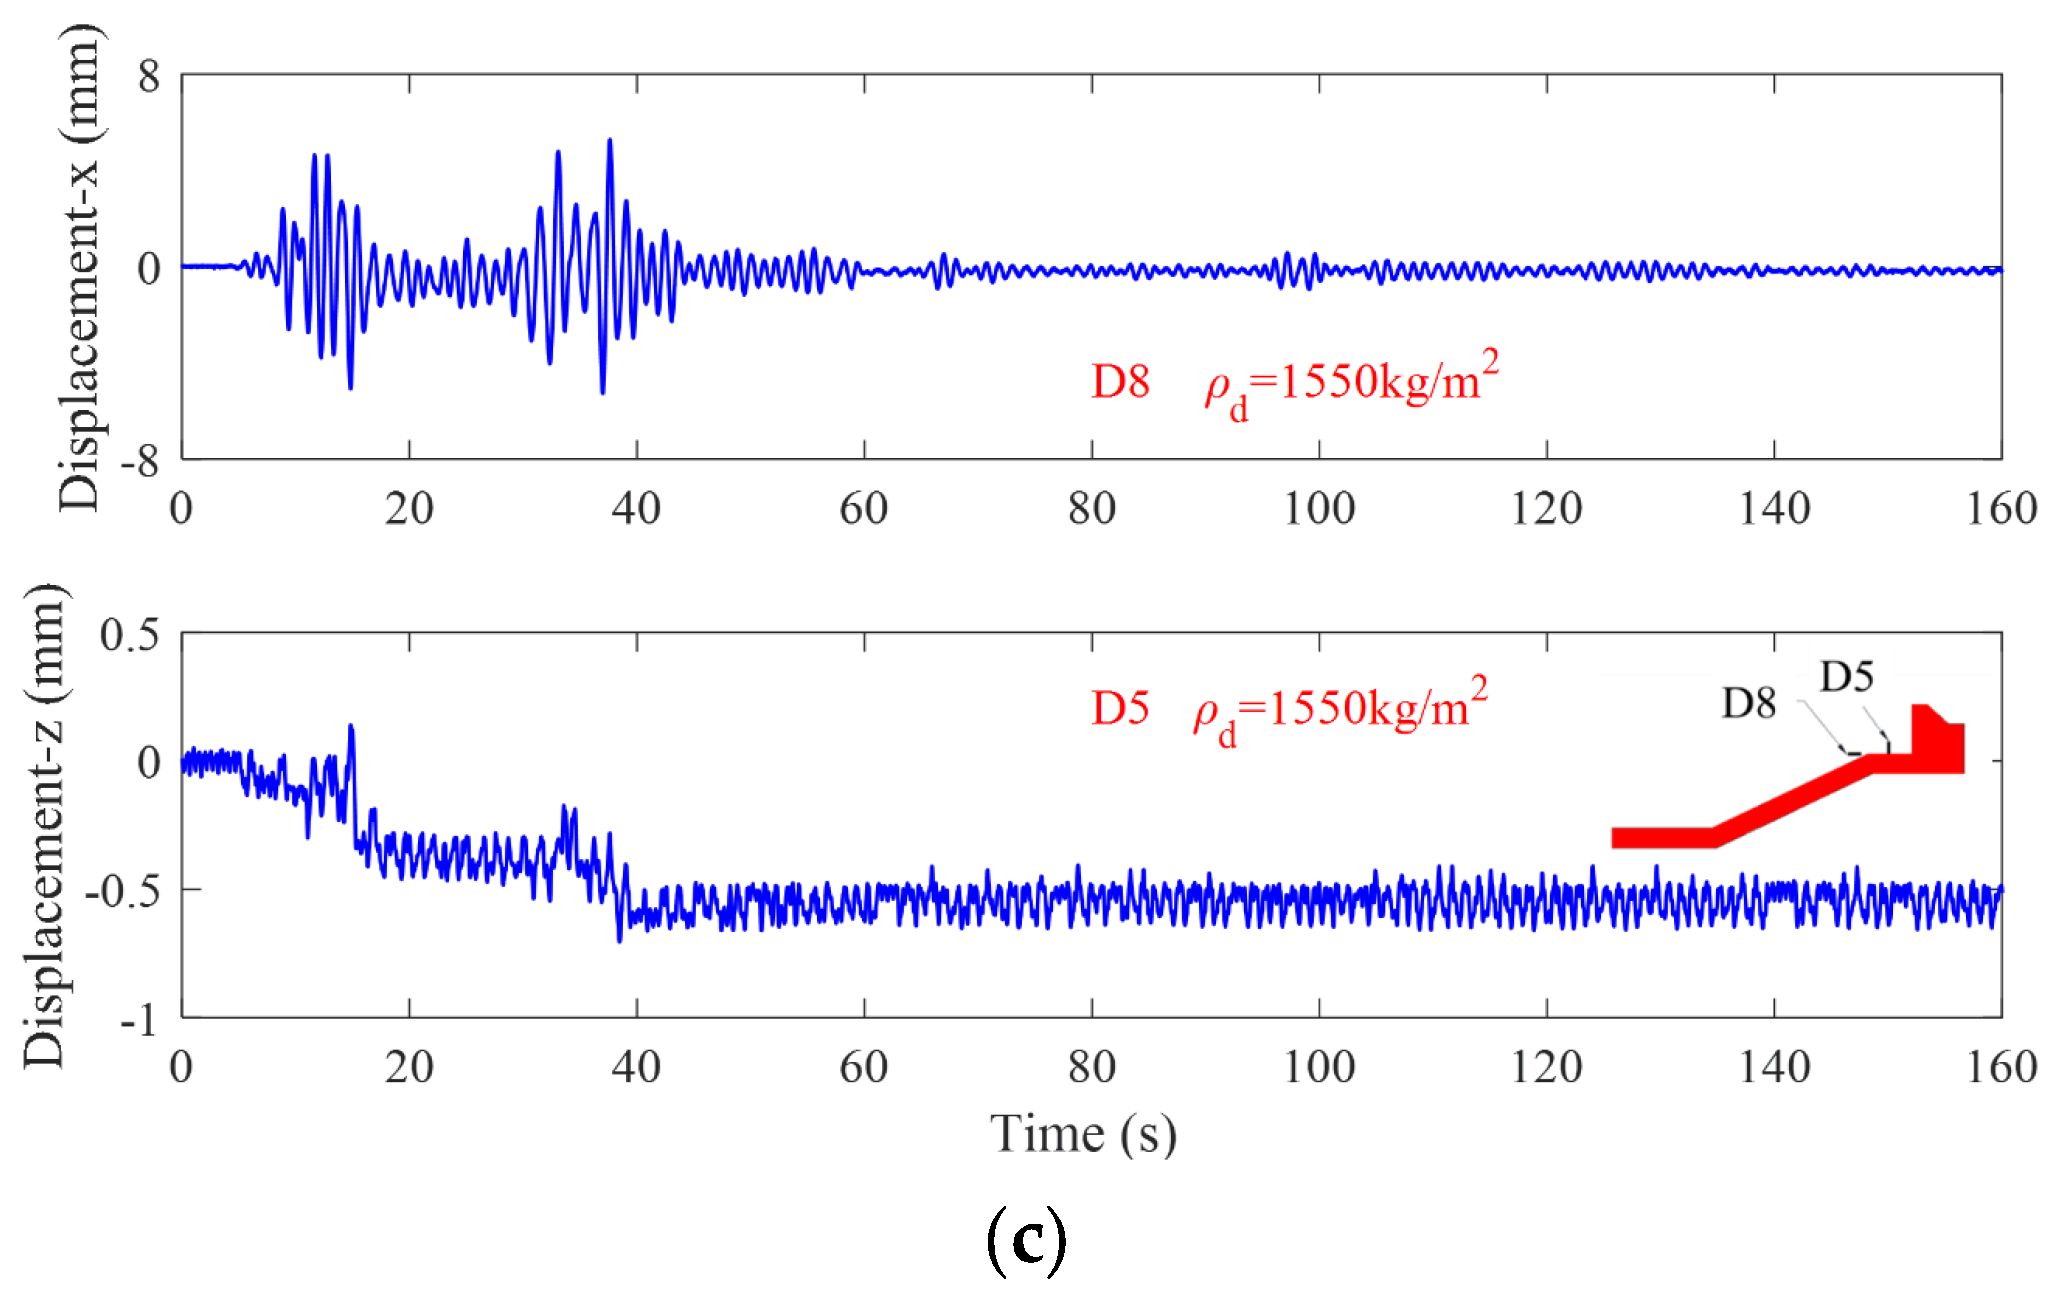
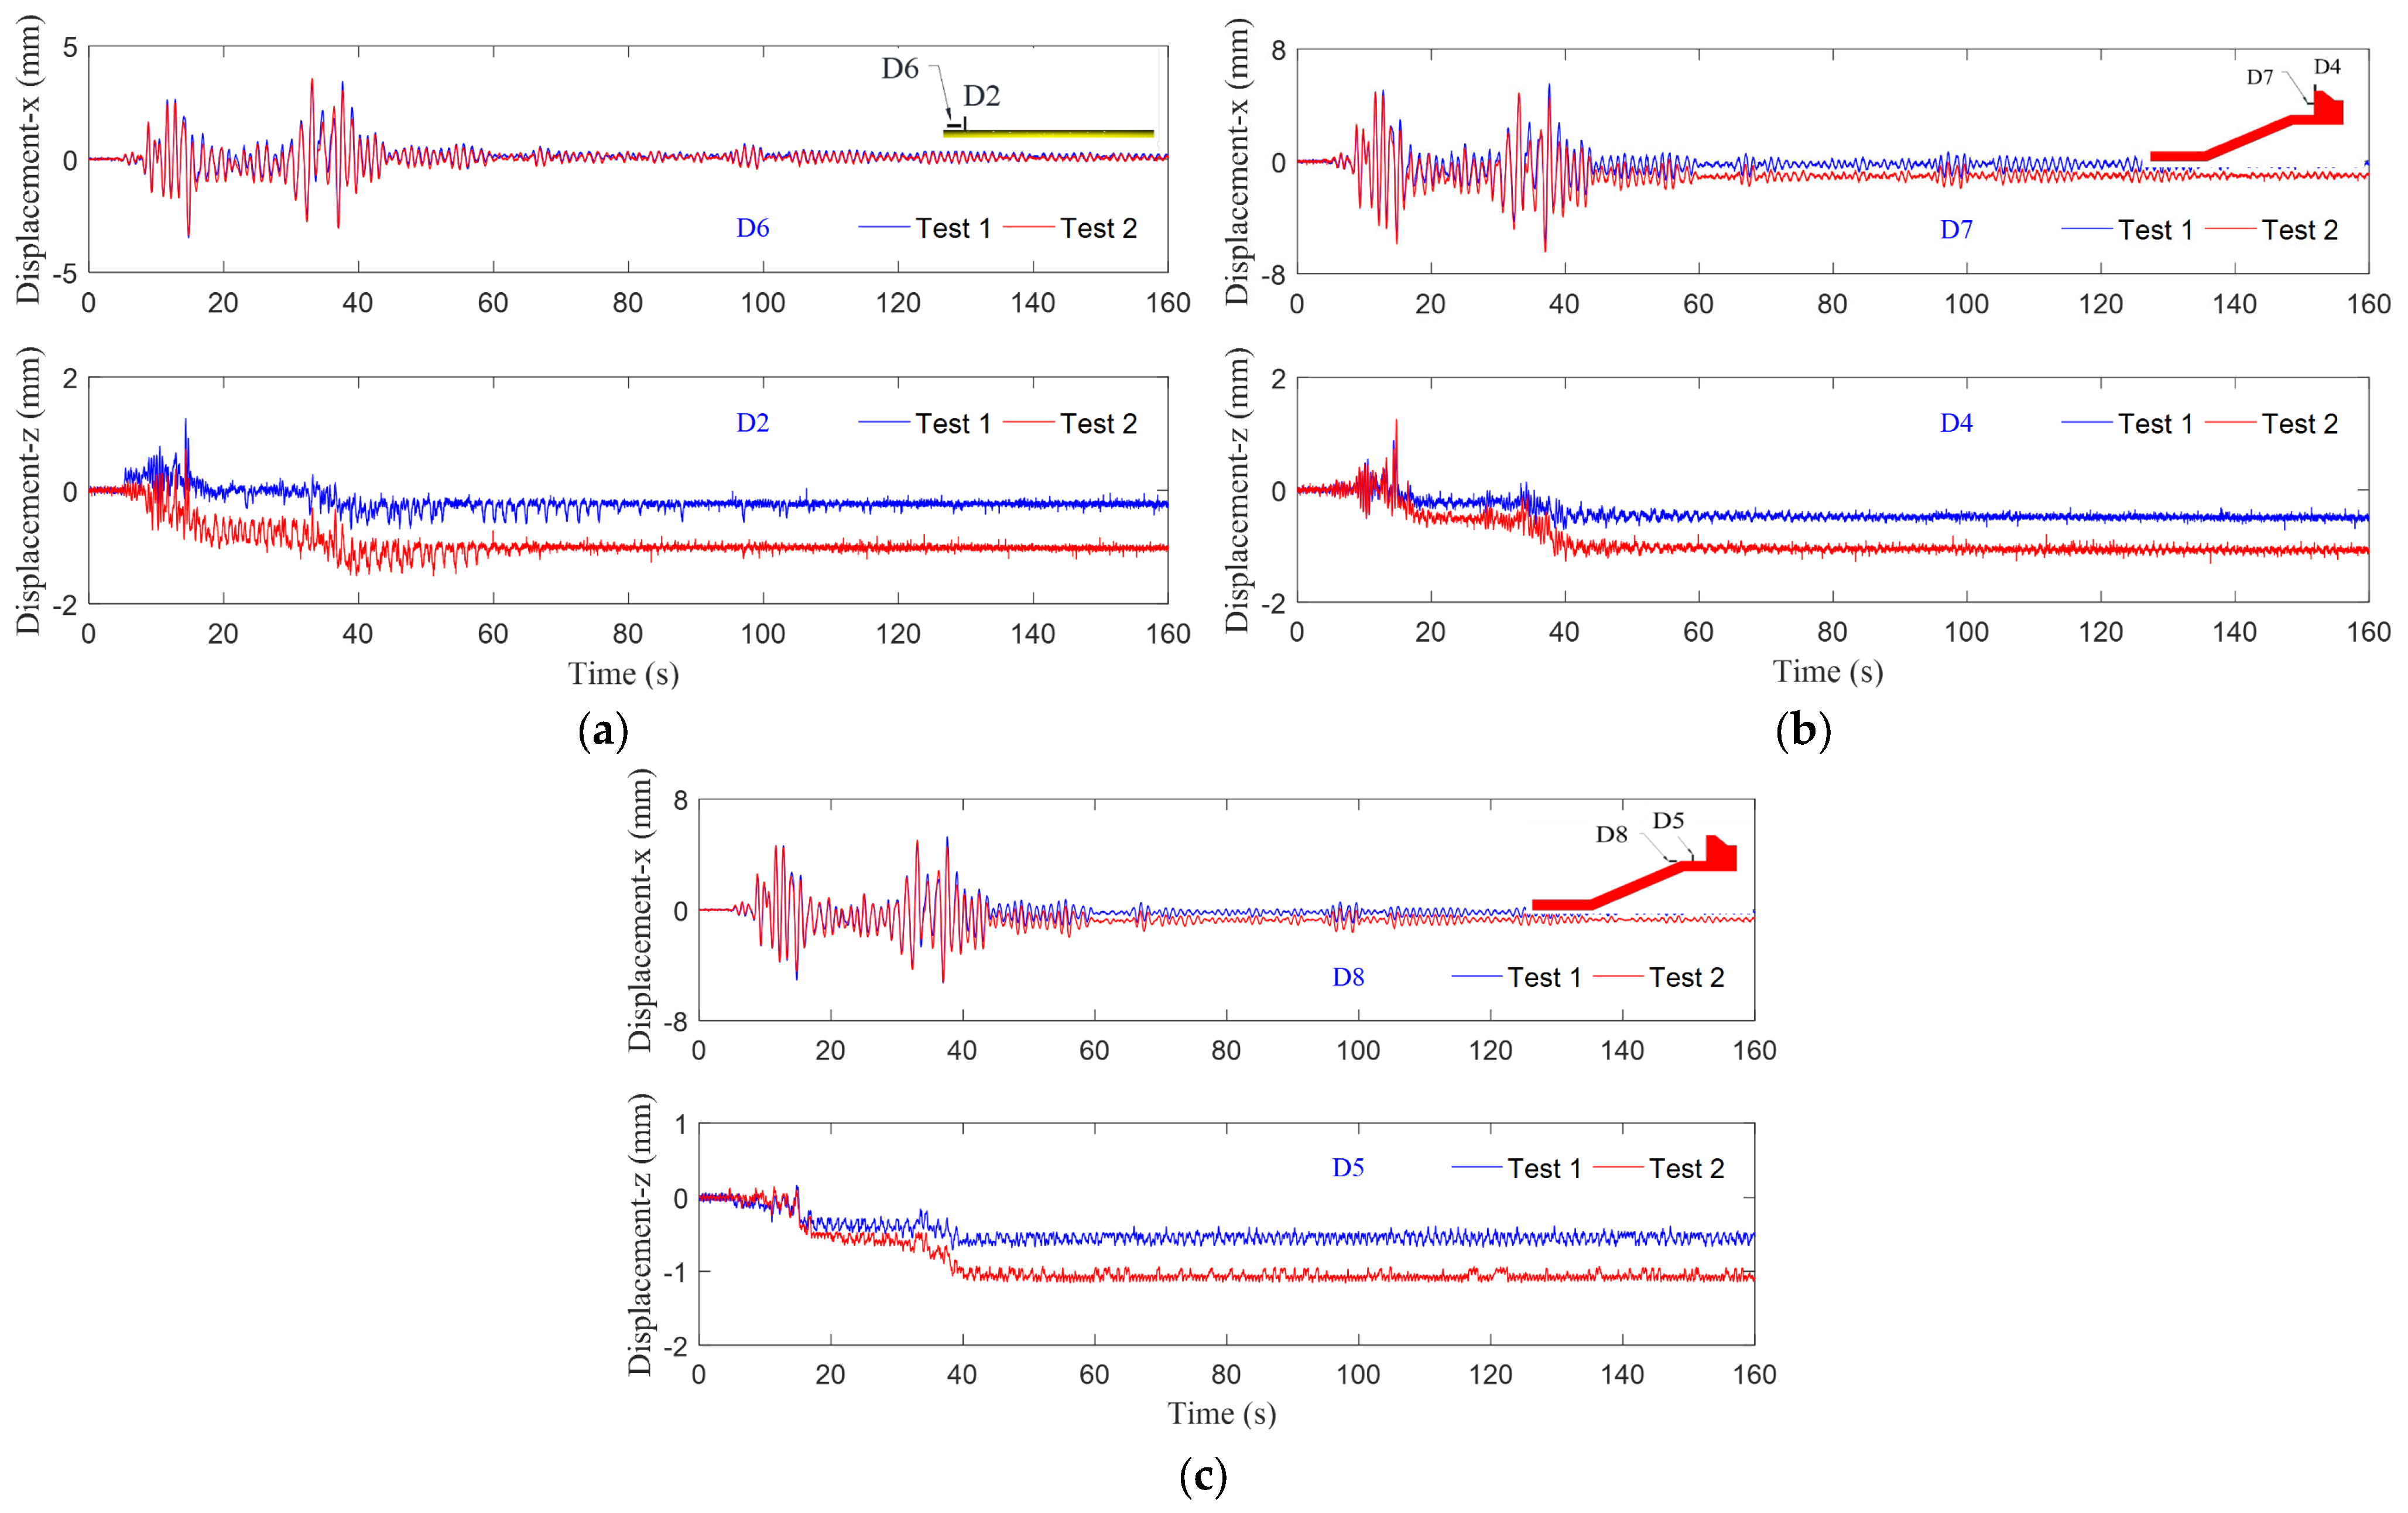
3.1. Dynamic Responding of Displacement

Figure 8 shows the time histories of the displacement of the runway, caisson, and revetment. This study stipulates that the horizontal displacement is positive if it is toward the seaside (right side), and the vertical displacement is positive if it is upward. It is shown that the horizontal displacement of the runway (recorded by D6) has a significant oscillation of about 3.5 mm, but there is no residual displacement. The vertical residual settlement (recorded by D2) of the runway is approximately −0.4 mm. Similarly, neither the caisson nor the revetment has residual displacement in horizontal, but they both have a greater amplitude (about 6 mm) of displacement oscillation. The vertical residual settlements of the caisson (recorded by D4), and the revetment (recorded by D5) are about −0.5 mm and −0.6 mm, respectively. As shown in Figure 8, when the incident seismic acceleration reaches its peak value (about at 16 s, 32 s, and 38 s, respectively), the oscillation amplitude of the runway and breakwater is correspondingly significant, and the development rate of the residual displacement is also fast. Overall, under the excitation of this strong seismic wave, the final residual displacement of the revetment breakwater and runway is small in magnitude. Both the revetment breakwater and runway built on the coral sand foundation are completely in a repairable state. It is indicated that the seismic performance of the breakwater and runway is good.

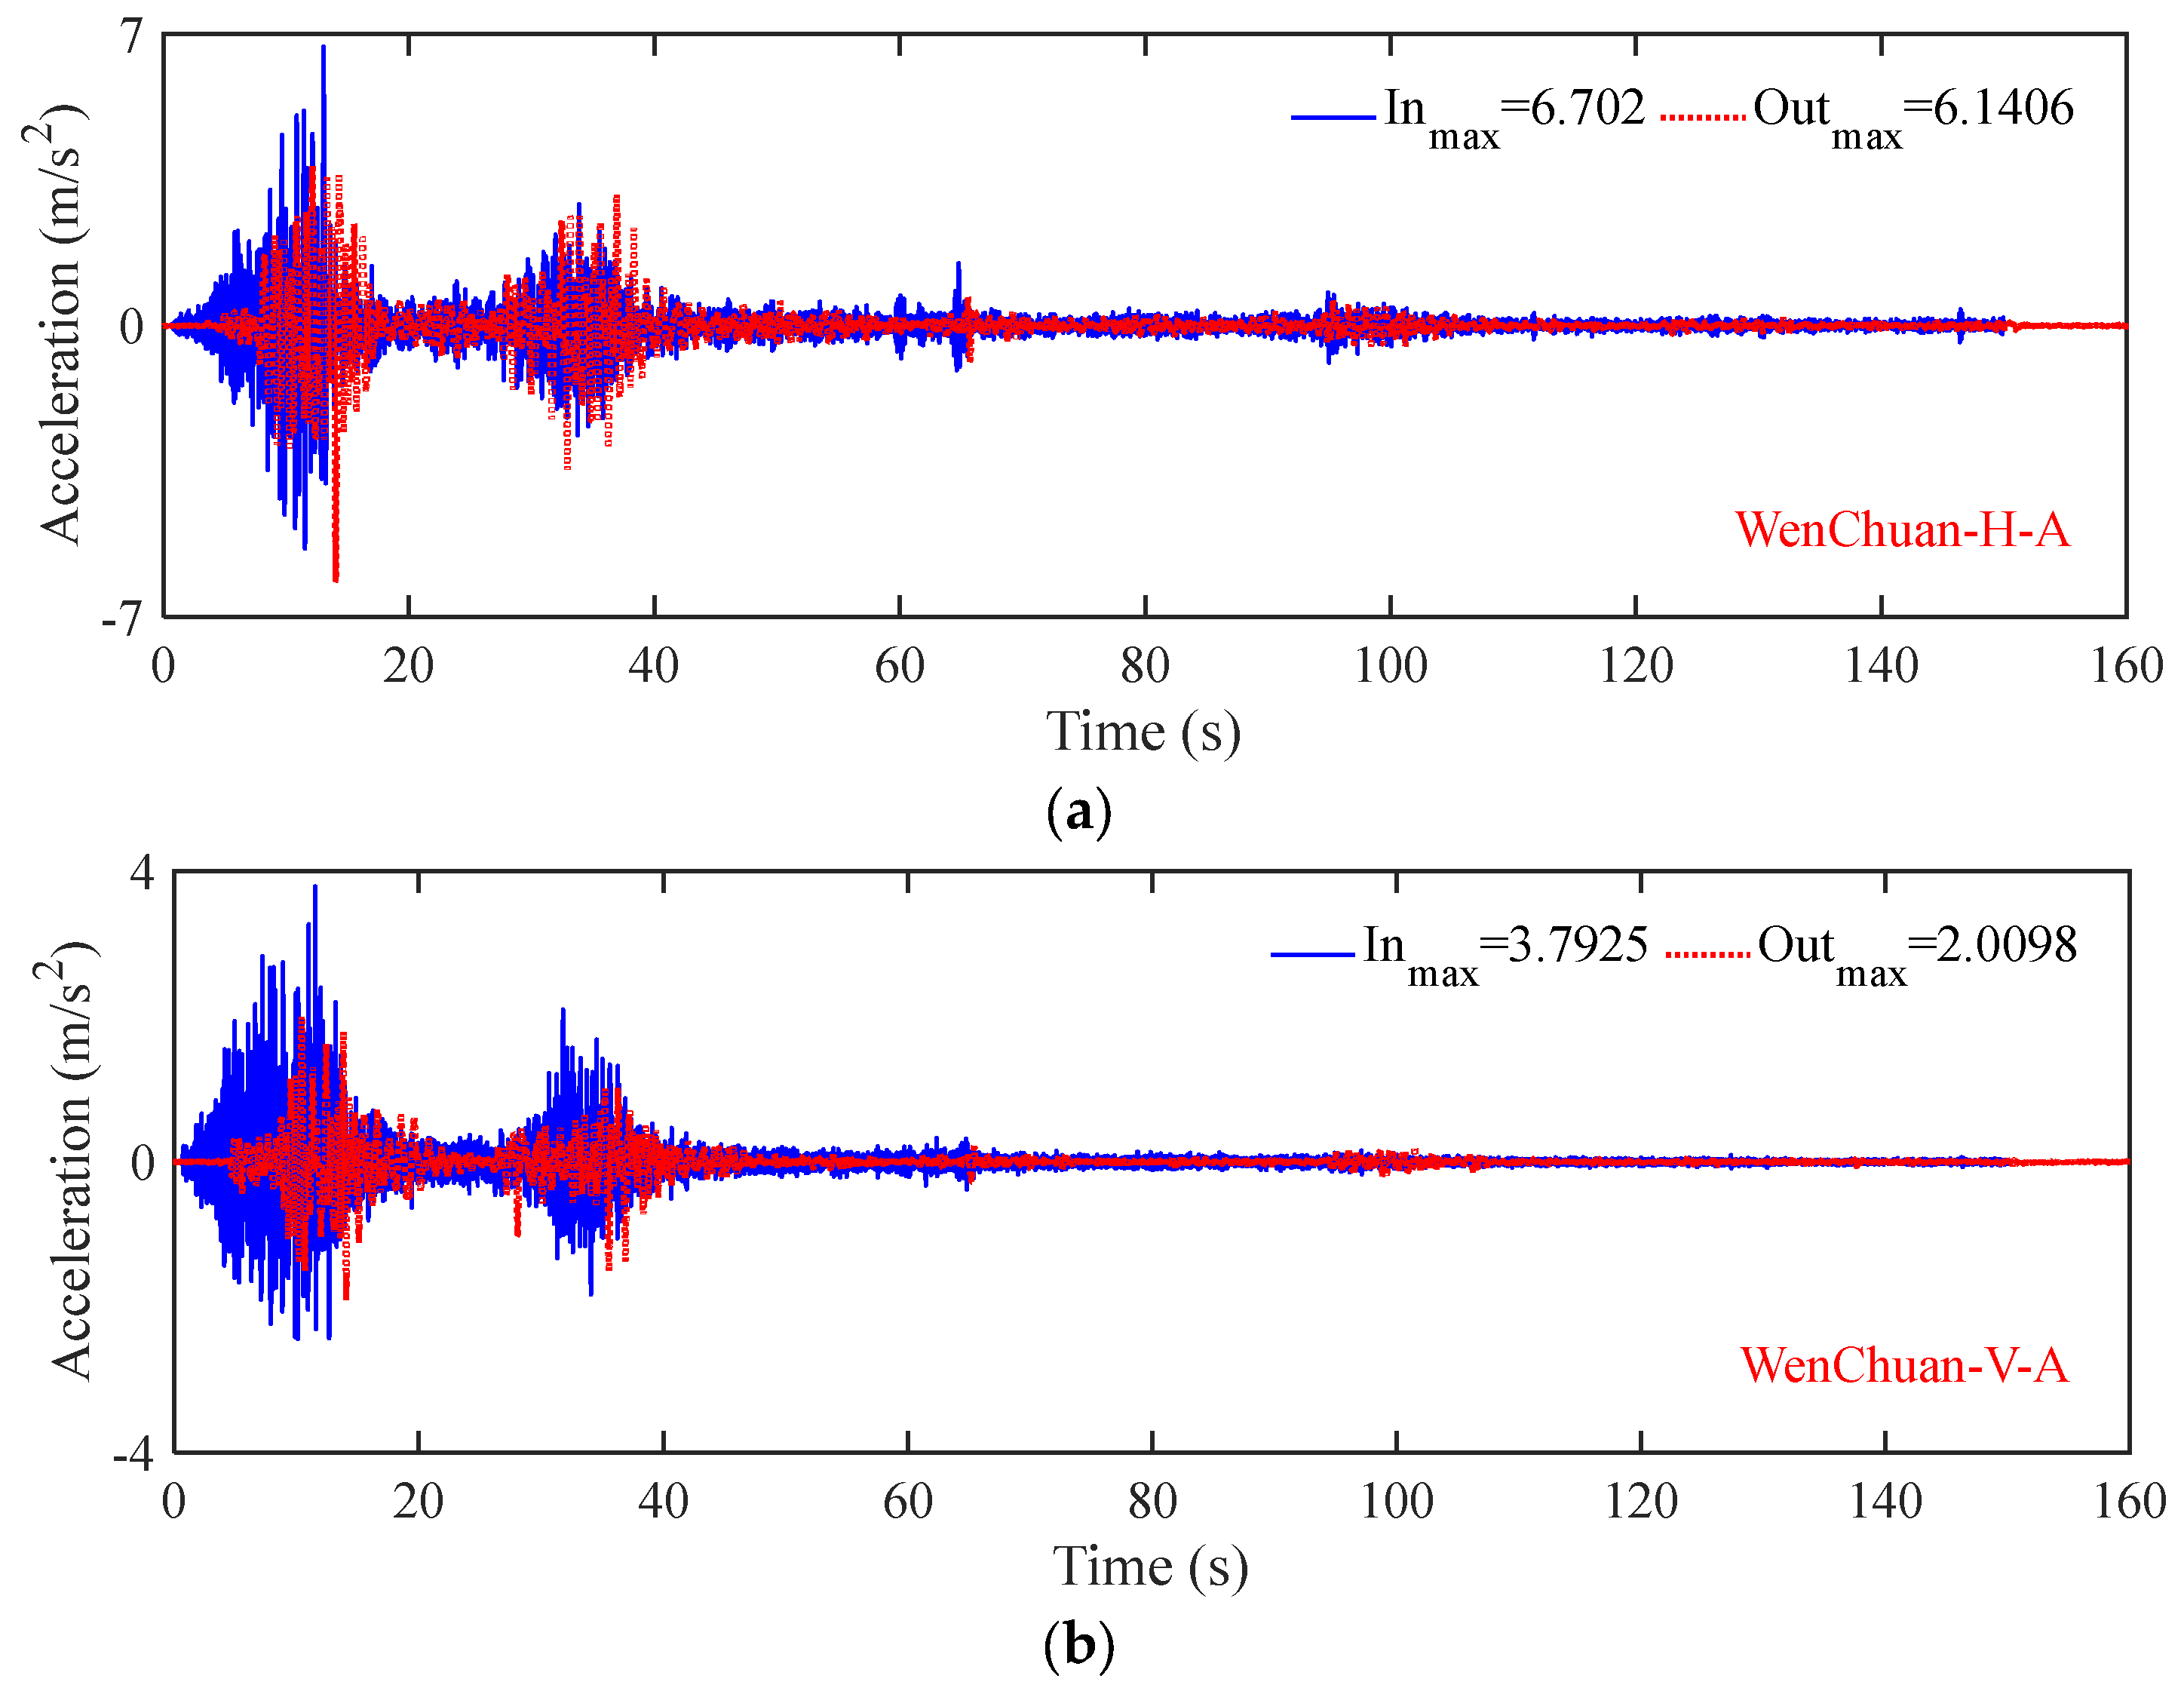
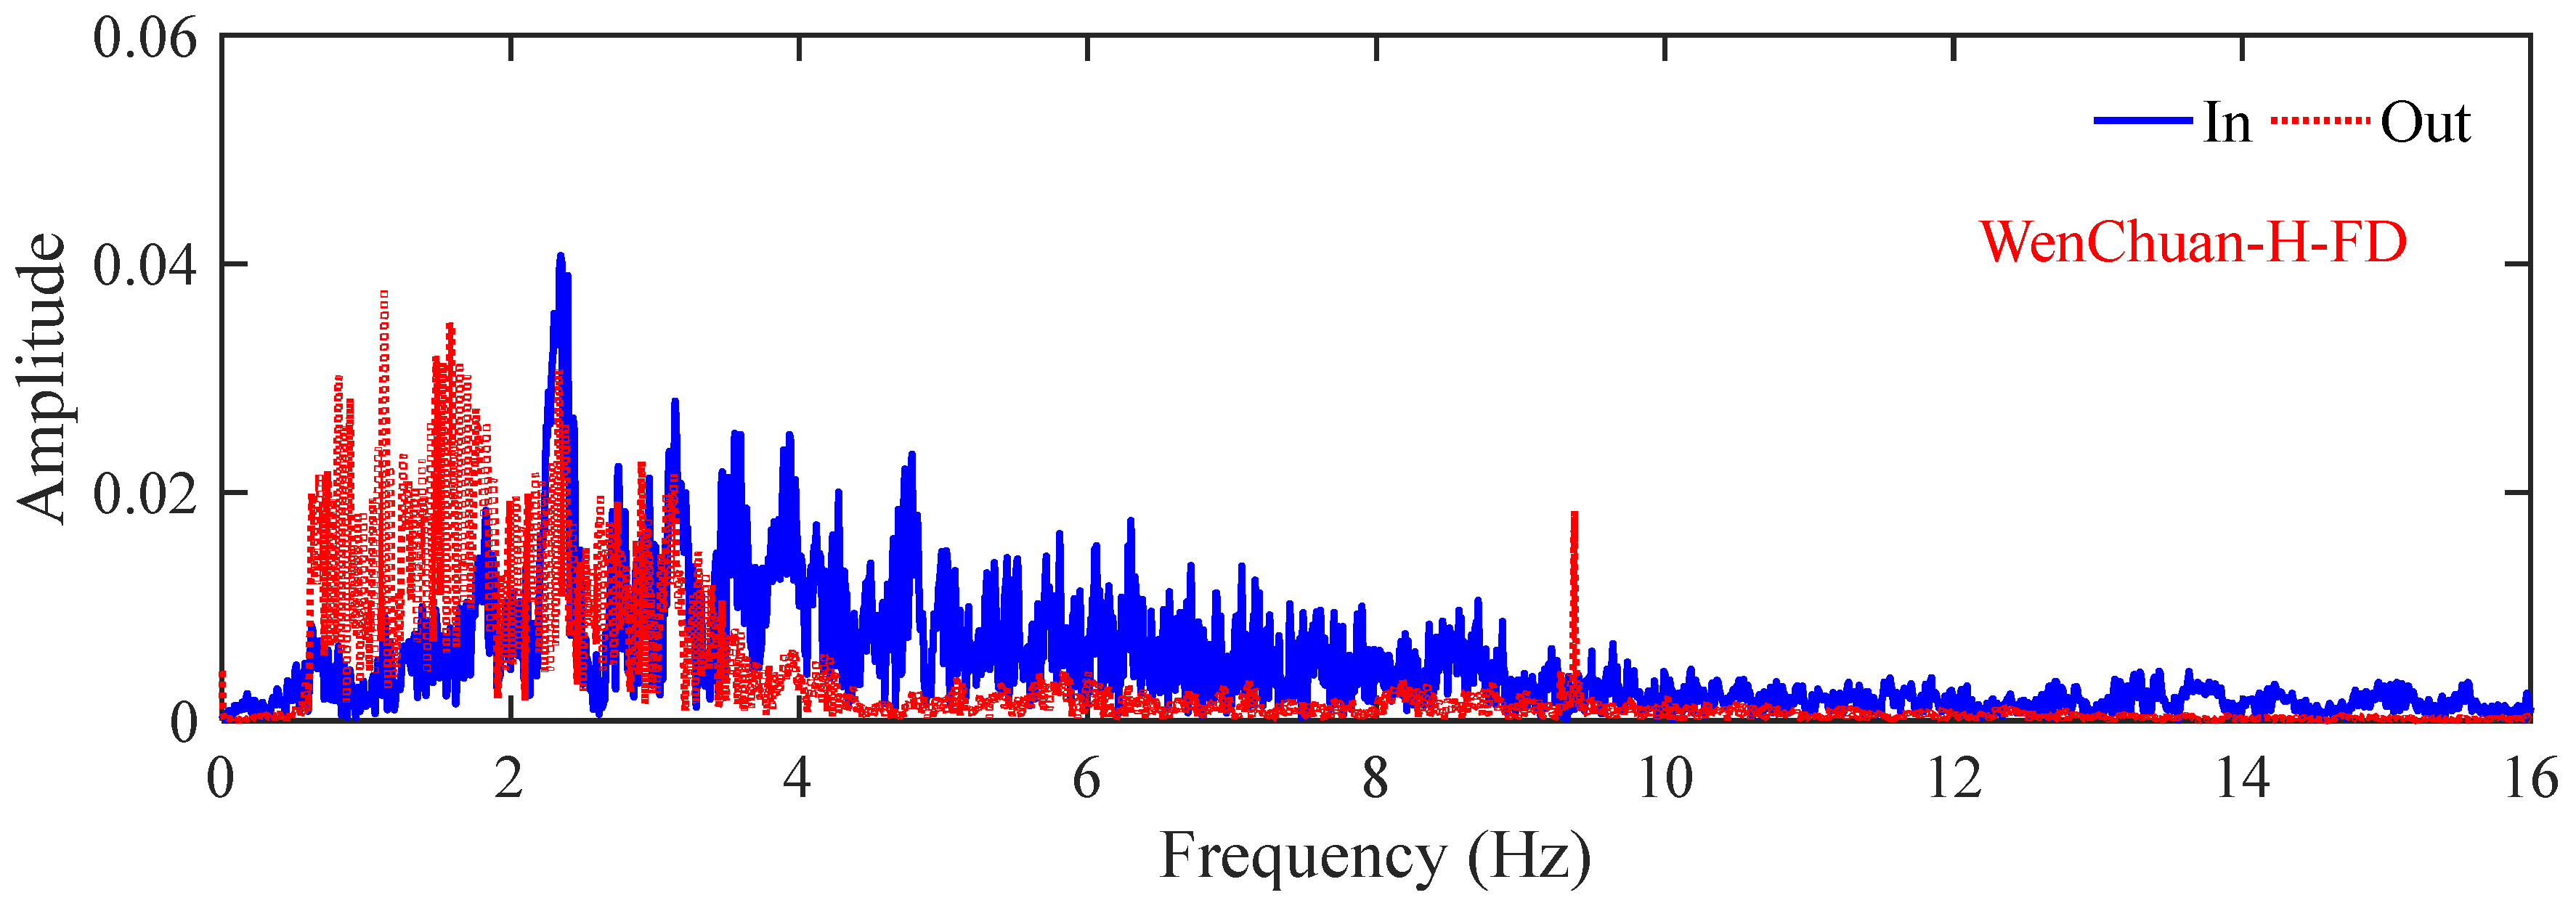
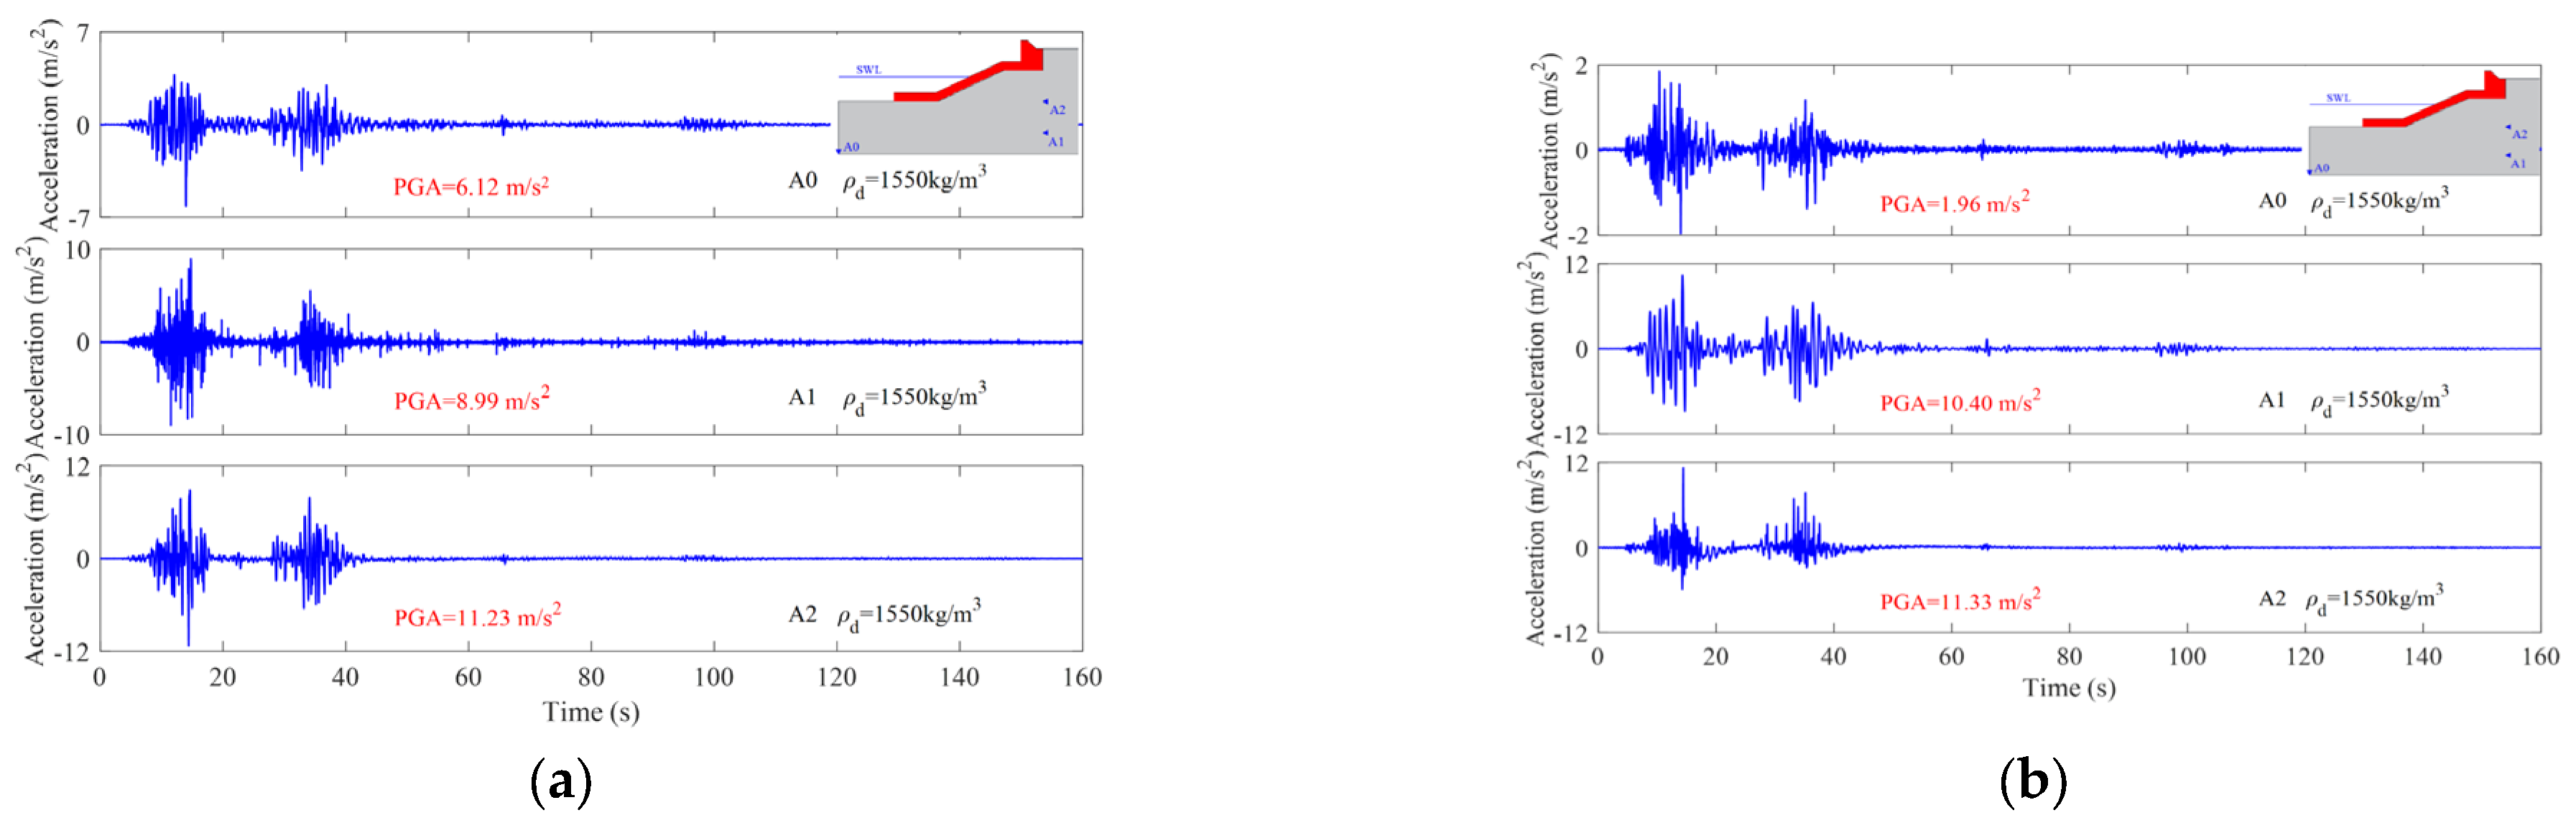
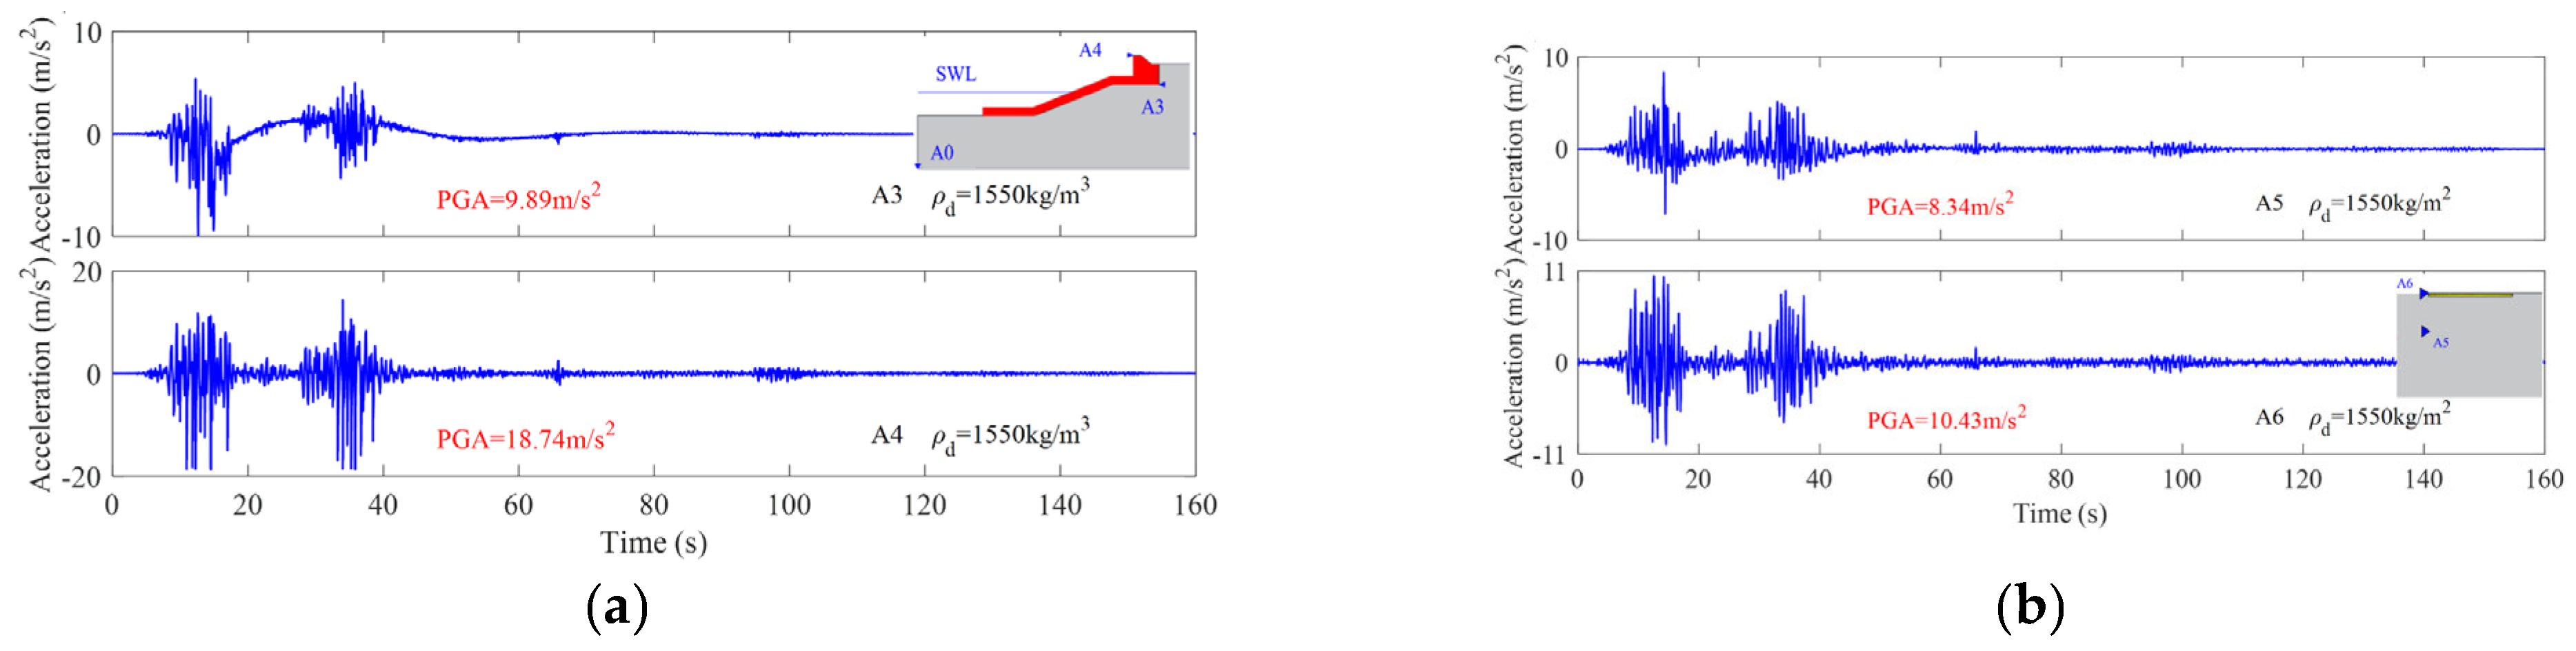
3.2. Dynamic Responding of Acceleration

The dynamic responding of horizontal and vertical acceleration at typical positions in the coral sand foundation is illustrated in Figure 9, where the acceleration sensor A0 is installed at the bottom of the model box, A1 and A2 are 40 mm, 100 mm away from the bottom of the model box, respectively. It is found that the responding intensity to the seismic wave within the coral sand foundation is positively correlated with the elevation it locates. The peak horizontal acceleration from A0 to A1, and A2 are 6.12 m/s2, 8.99 m/s2, and 11.23 m/s2, respectively, with an amplification factor of 1.84. In the vertical direction, the peak acceleration from A0 to A1, and A2 are 1.96 m/s2, 10.40 m/s2, and 11.33 m/s2, respectively, with an amplification factor of 5.78. It is implied that the amplification effect of the coral sand foundation on seismic acceleration is exceptionally obvious, and the amplification effect on the vertical acceleration is quite intense.
Figure 10 shows the horizontal acceleration dynamic responding of the revetment breakwater and runway. It is seen that the peak acceleration responding at A4 on top of the caisson reaches 18.74 m/s2, and the peak acceleration responding at A6 on the runway is 10.43 m/s2, showing a significant amplification effect compared with the peak acceleration of the input seismic wave of 6.12 m/s2.

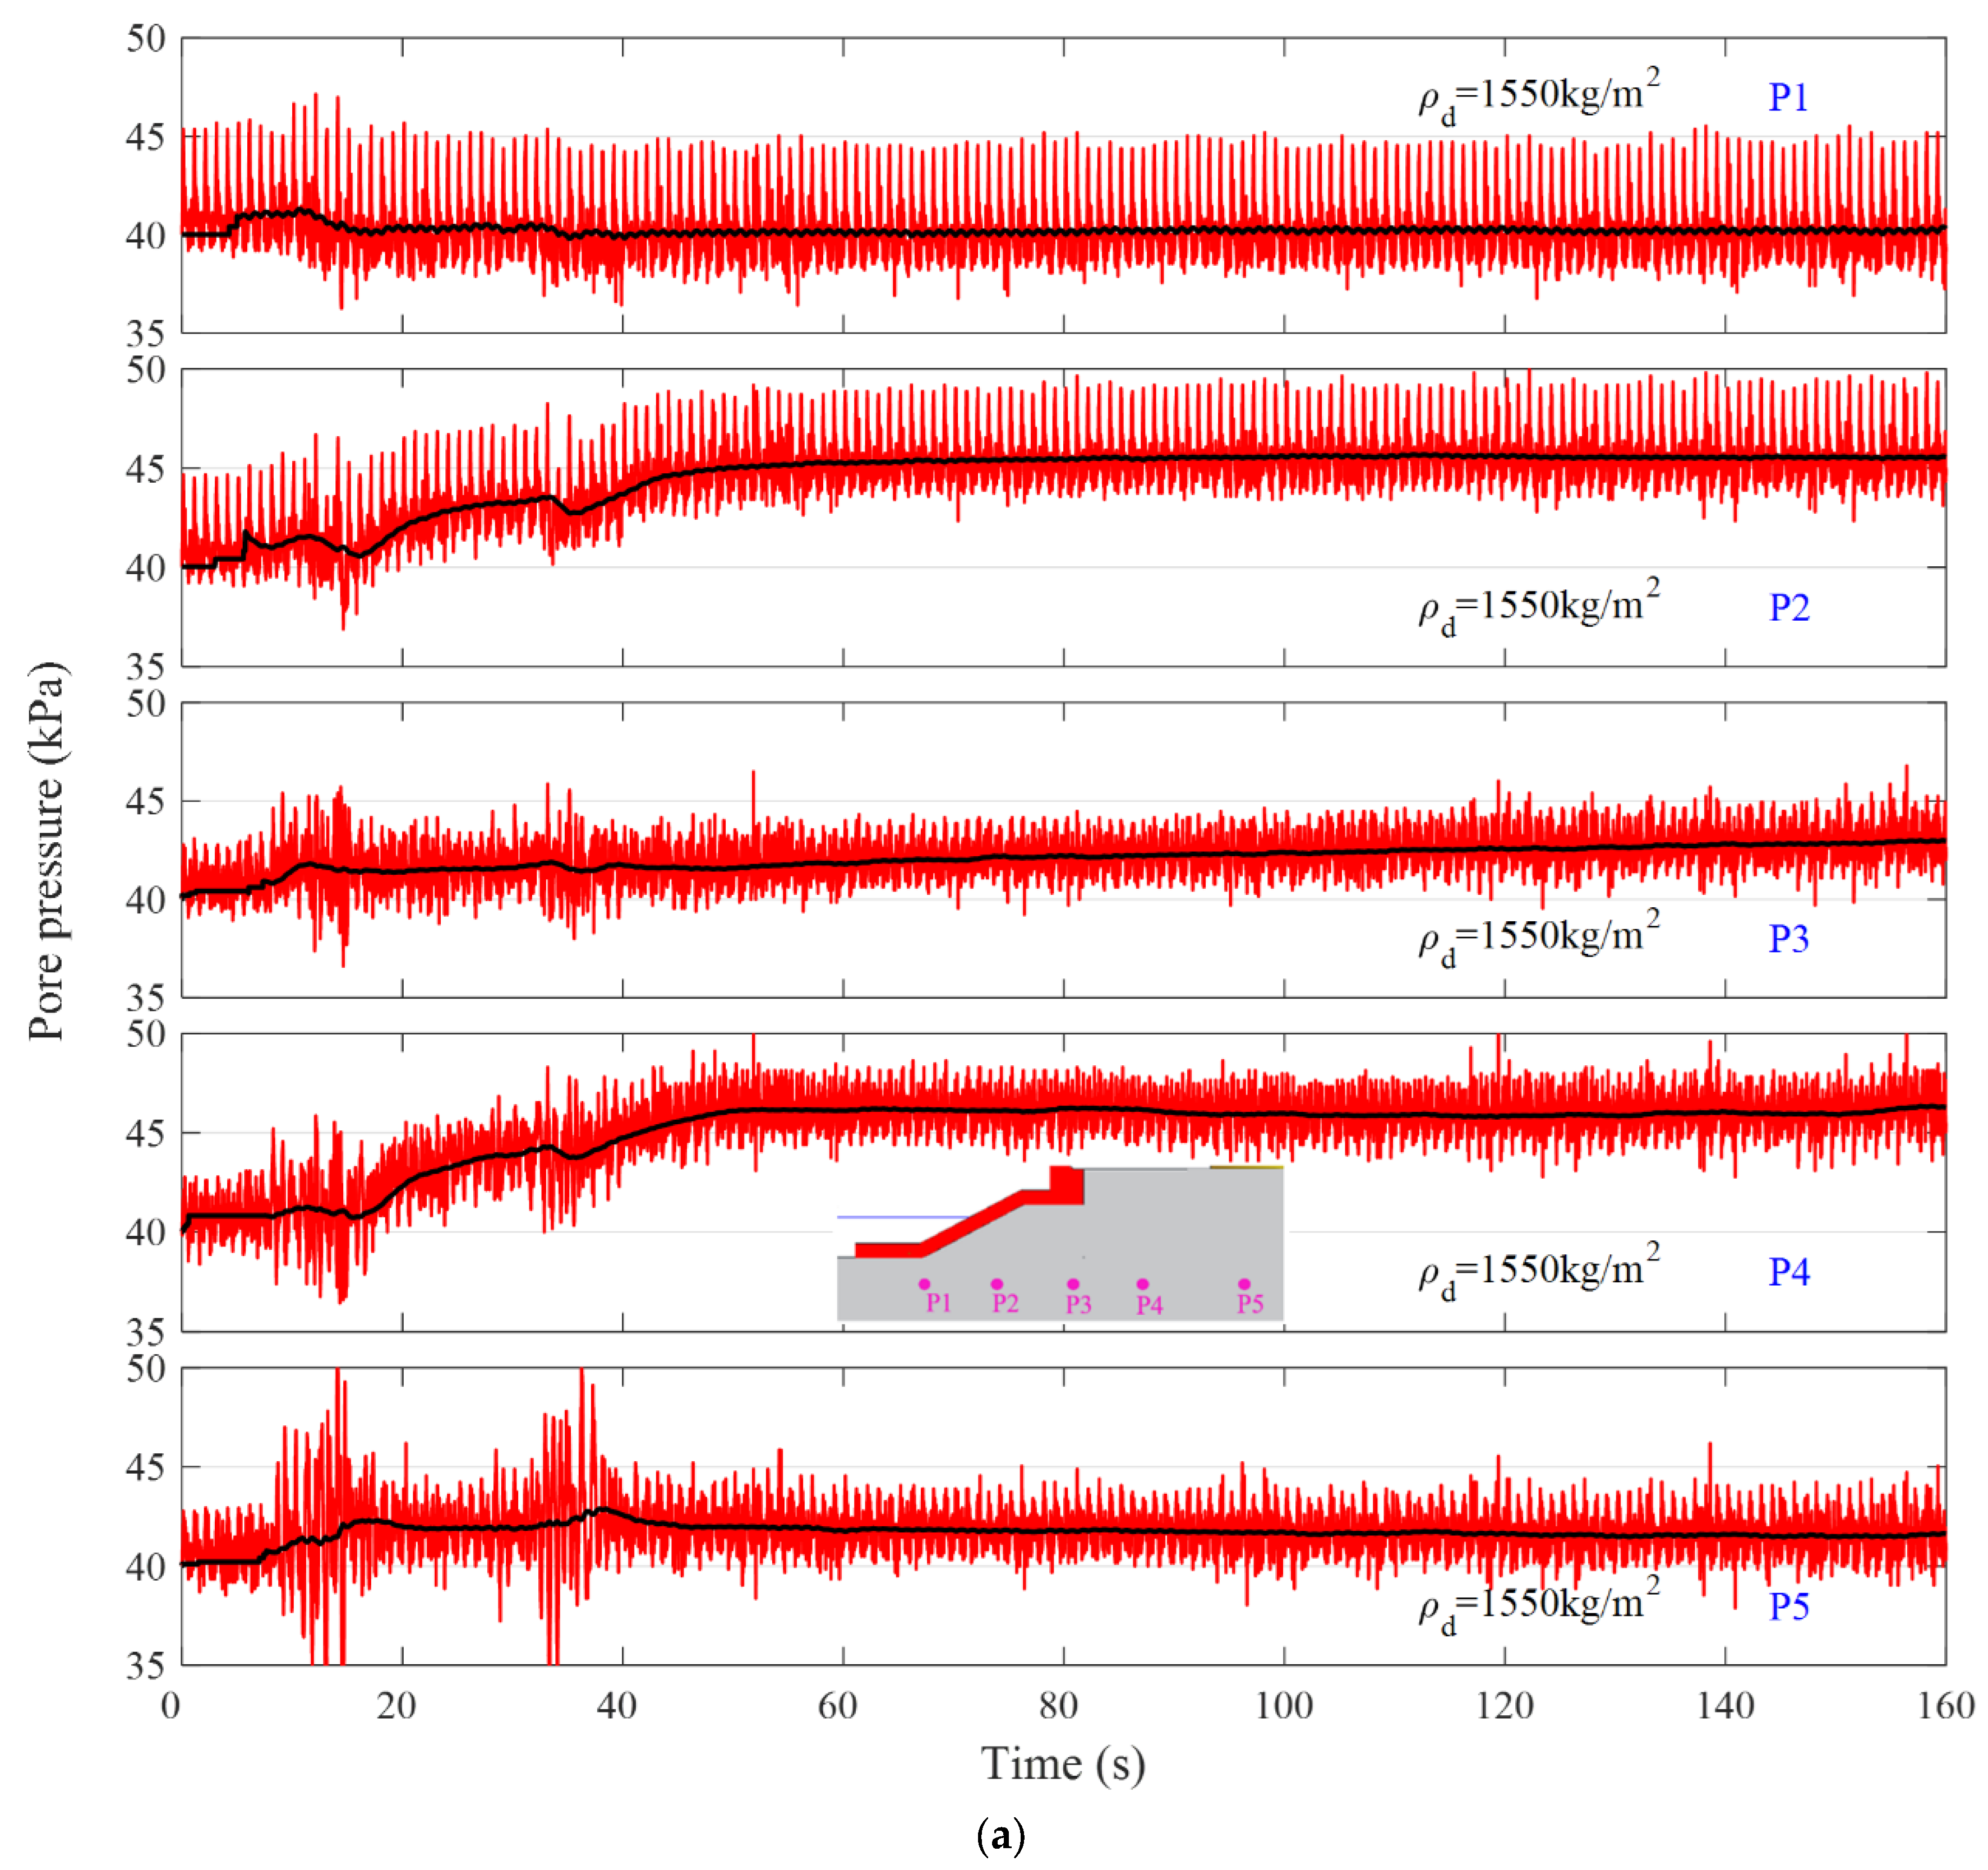
3.3. Dynamic Responding of Pore Pressure

Figure 11 shows the dynamic response of pore pressure at typical positions P1 to P8 within the coral sand foundation. Under the action of the strong earthquake, the pore pressure accumulates in the coral sand foundation, and the maximum residual pore pressure reaches 7 kPa. As shown in Figure 11a, the oscillation amplitude of pore pressure at P1 is great, but there is no accumulation of pore pressure. The reason for this is that the overlying coral sand of P1 is relatively thin, and the drainage path is short. As a result, the pore pressure at P1 dissipates very quickly and is difficult to accumulate. It is demonstrated by Figure 11b that there are two negative values of the pore pressure at P6 at 15 s and 35 s, which means the pore pressure here is less than its initial hydrostatic value. The possible reason for this is that the coral sand beneath the revetment breakwater is in a state of shear dilatation when the seismic acceleration is strong, and the volumetric dilatation leads to a significant drop in pore pressure. P8 is also located in the region where shear deformation occurs beneath the breakwater, and a similar phenomenon also occurs.
To further evaluate whether the liquefaction occurs or not within the coral sand foundation, the initial effective stress field of the physical model needs to be estimated. In this study, the numerical simulation software FssiCAS is utilized to estimate the initial effective stress within the physical model under the 50 g gravity environment. FssiCAS is a powerful FEM software in the fields of marine geotechnics and marine engineering geology, available at https://www.fssi.ac.cn/download.html (accessed on 25 October 2022). The established finite element model and mesh discretization (hexahedron element) are illustrated in Figure 12a, where the total number of finite element elements is about 200,000. The boundary conditions applied are as follows: (1) The bottom of the model is fixed for displacements in x, y, and z directions, and the four lateral faces are fixed in horizontal. (2) The hydrostatic pressure of 50 ρ g h (h is the distance from a point on the surface of the coral sand foundation to the static water level (SWL)) is applied to the surface of the coral sand foundation and revetment and ensuring that the effective stress on the surface of the coral sand foundation is zero. Since the simulation here is only to estimate the initial effective stress, the elastic constitutive model is adopted for the coral sand foundation, breakwater and runway. The vertical effective stress distribution is shown in Figure 12b.
The excess pore pressure ratio is defined as r u = P r / σ z 0 , where P r is excess pore pressure, and σ z 0 is initial vertical effective stress. The coral sand can be considered liquefied when r u ≥ 0.8 [31]. The excess pore pressure ratio r u at P1 to P8 is determined according to experimental and numerical results, as listed in Table 2. It is judged that no liquefaction or significant softening behavior occurs in the coral sand foundation, since the maximum r u is only 0.12. This is the fundamental reason why the revetment breakwater and runway built on the coral sand foundation have good seismic stability.

4. Analysis of Influencing Factors

4.1. Effect of the Relative Density of the Coral Sand Foundation

During the reclaiming process at engineering sites in the SCS, the relative density of the coral sand foundation at the shallow depth cannot be uniformly distributed. The effect of the relative densities of the coral sand on the seismic dynamics of the breakwater and aircraft runway is investigated by comparing the results of Test 1 and Test 2.

4.1.1. Dynamic Responding of Displacement

The comparisons of the displacement responding at typical positions in Test 1 and Test 2 are shown in Figure 13. It can be seen that the general trends of the displacement responding of the runway and breakwater are basically the same in the two tests. The maximum vertical settlement in Test 2 is greater than that in Test 1. The residual settlement of the runway in Test 2 is approximately 1 mm, which is almost 2.5 times that in Test 1. The residual settlement of the breakwater in Test 2 is about twice as much as that in Test 1. By comparison, it is found that the seismic-induced displacement of the revetment breakwater and nearby runway built on the less compacted coral sand foundation is greater, and the structural stability would become worse.

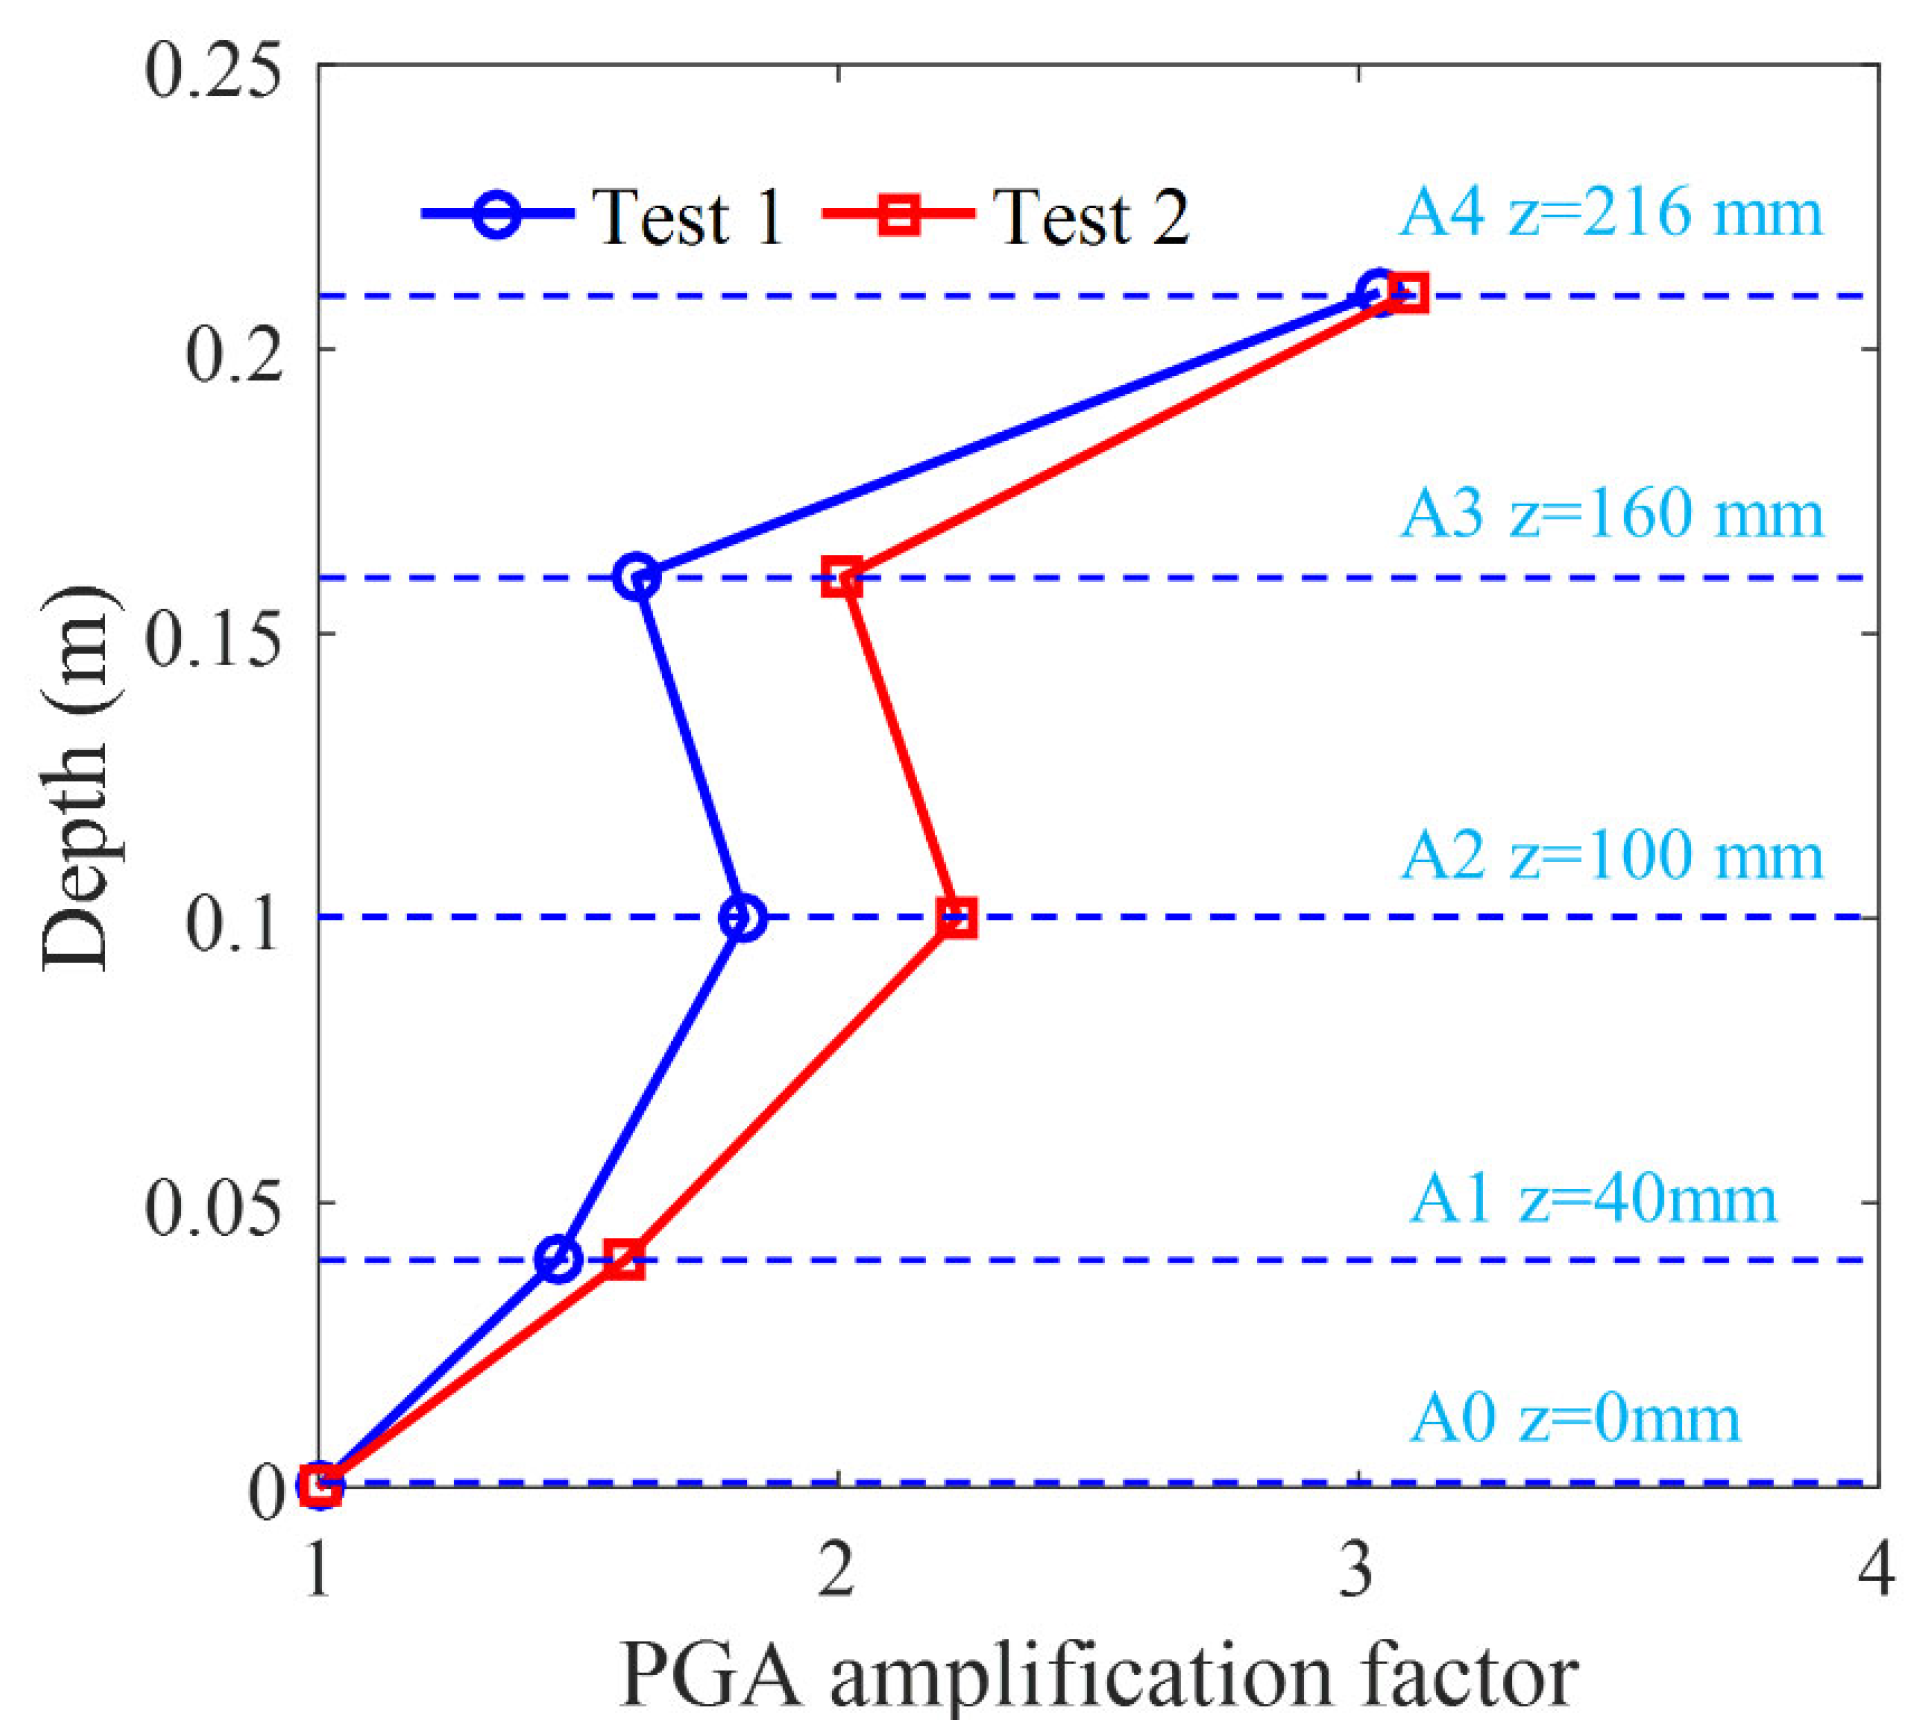
4.1.2. Dynamic Responding of Acceleration

The relationship between the amplification factor to the horizontal peak acceleration and the elevation at typical positions in Test 1 and Test 2 is shown in Figure 14. It can be seen that the amplification factor of horizontal acceleration is positively correlated with the elevation it locates, regardless of whether the coral sand foundation is in a dense or less dense state. However, the amplification factors in Test 2 are slightly greater than that in Test 1. In Test 2, the peak seismic acceleration recorded at A4 on the caisson is approximately 19 m/s2 with an amplification factor of 3.11. The test results show that the density of the coral sand foundation has an important impact on the seismic amplification effect, and the amplification effect on seismic waves is more significant in a less dense coral sand foundation.

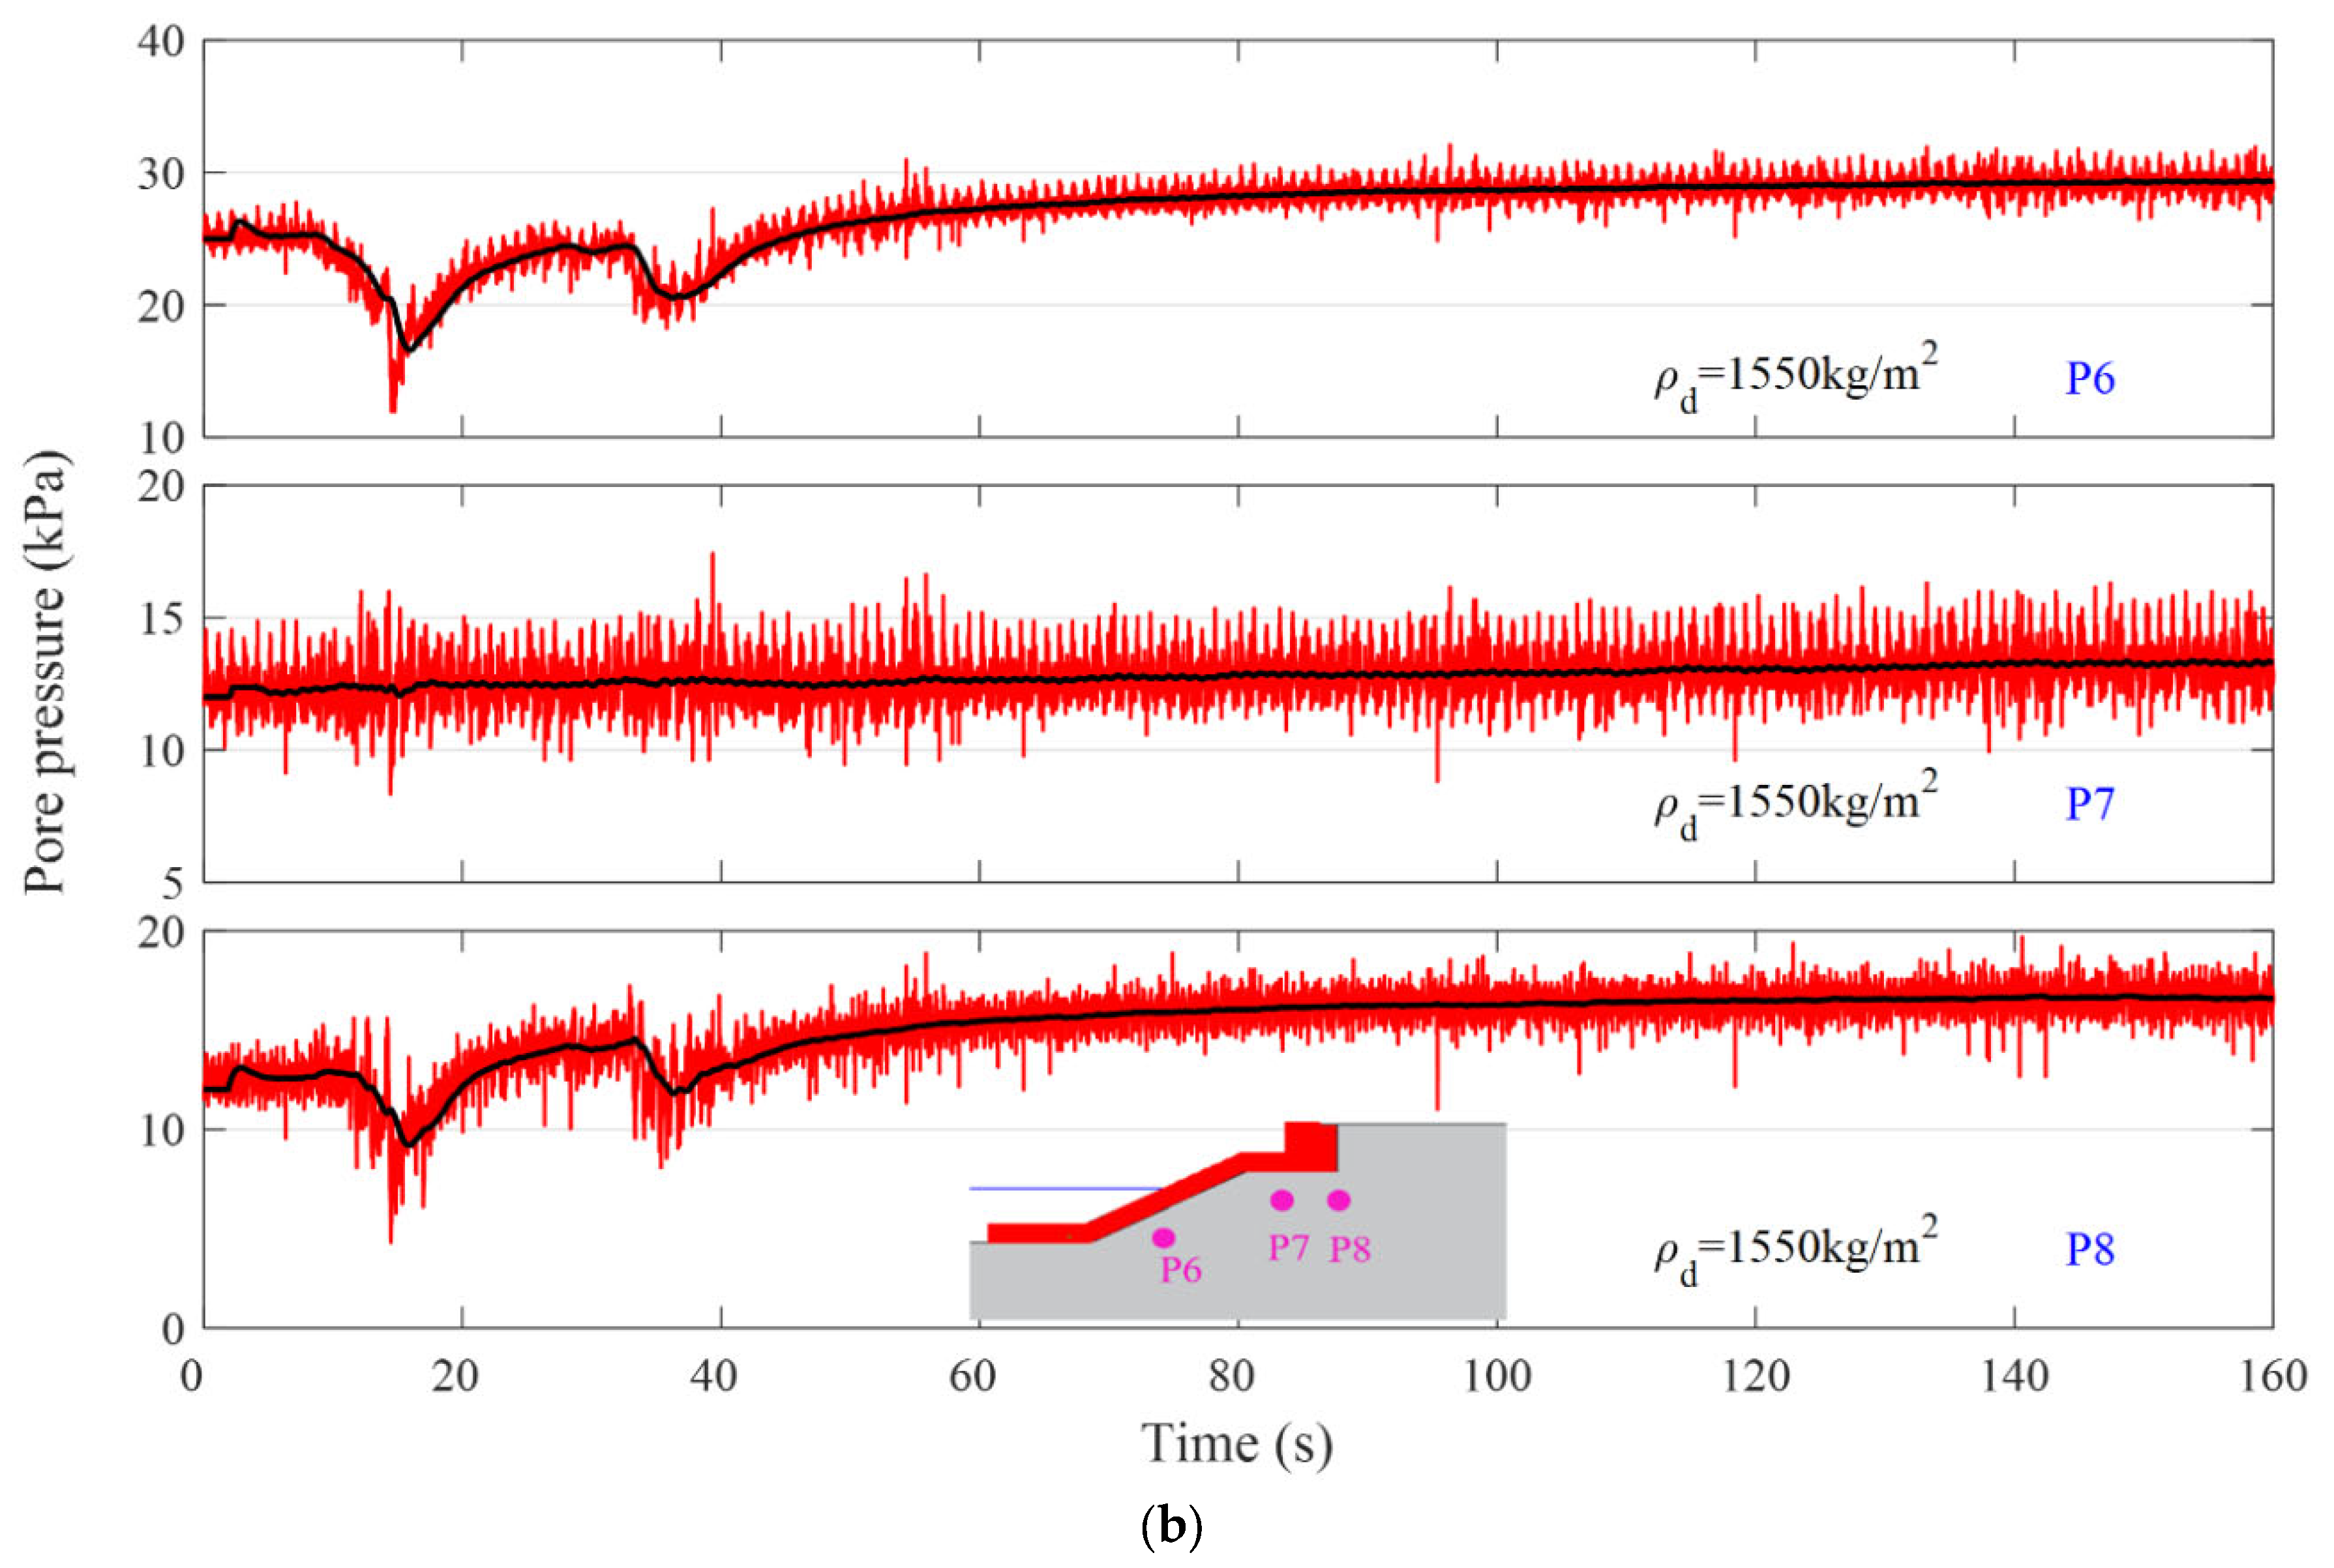
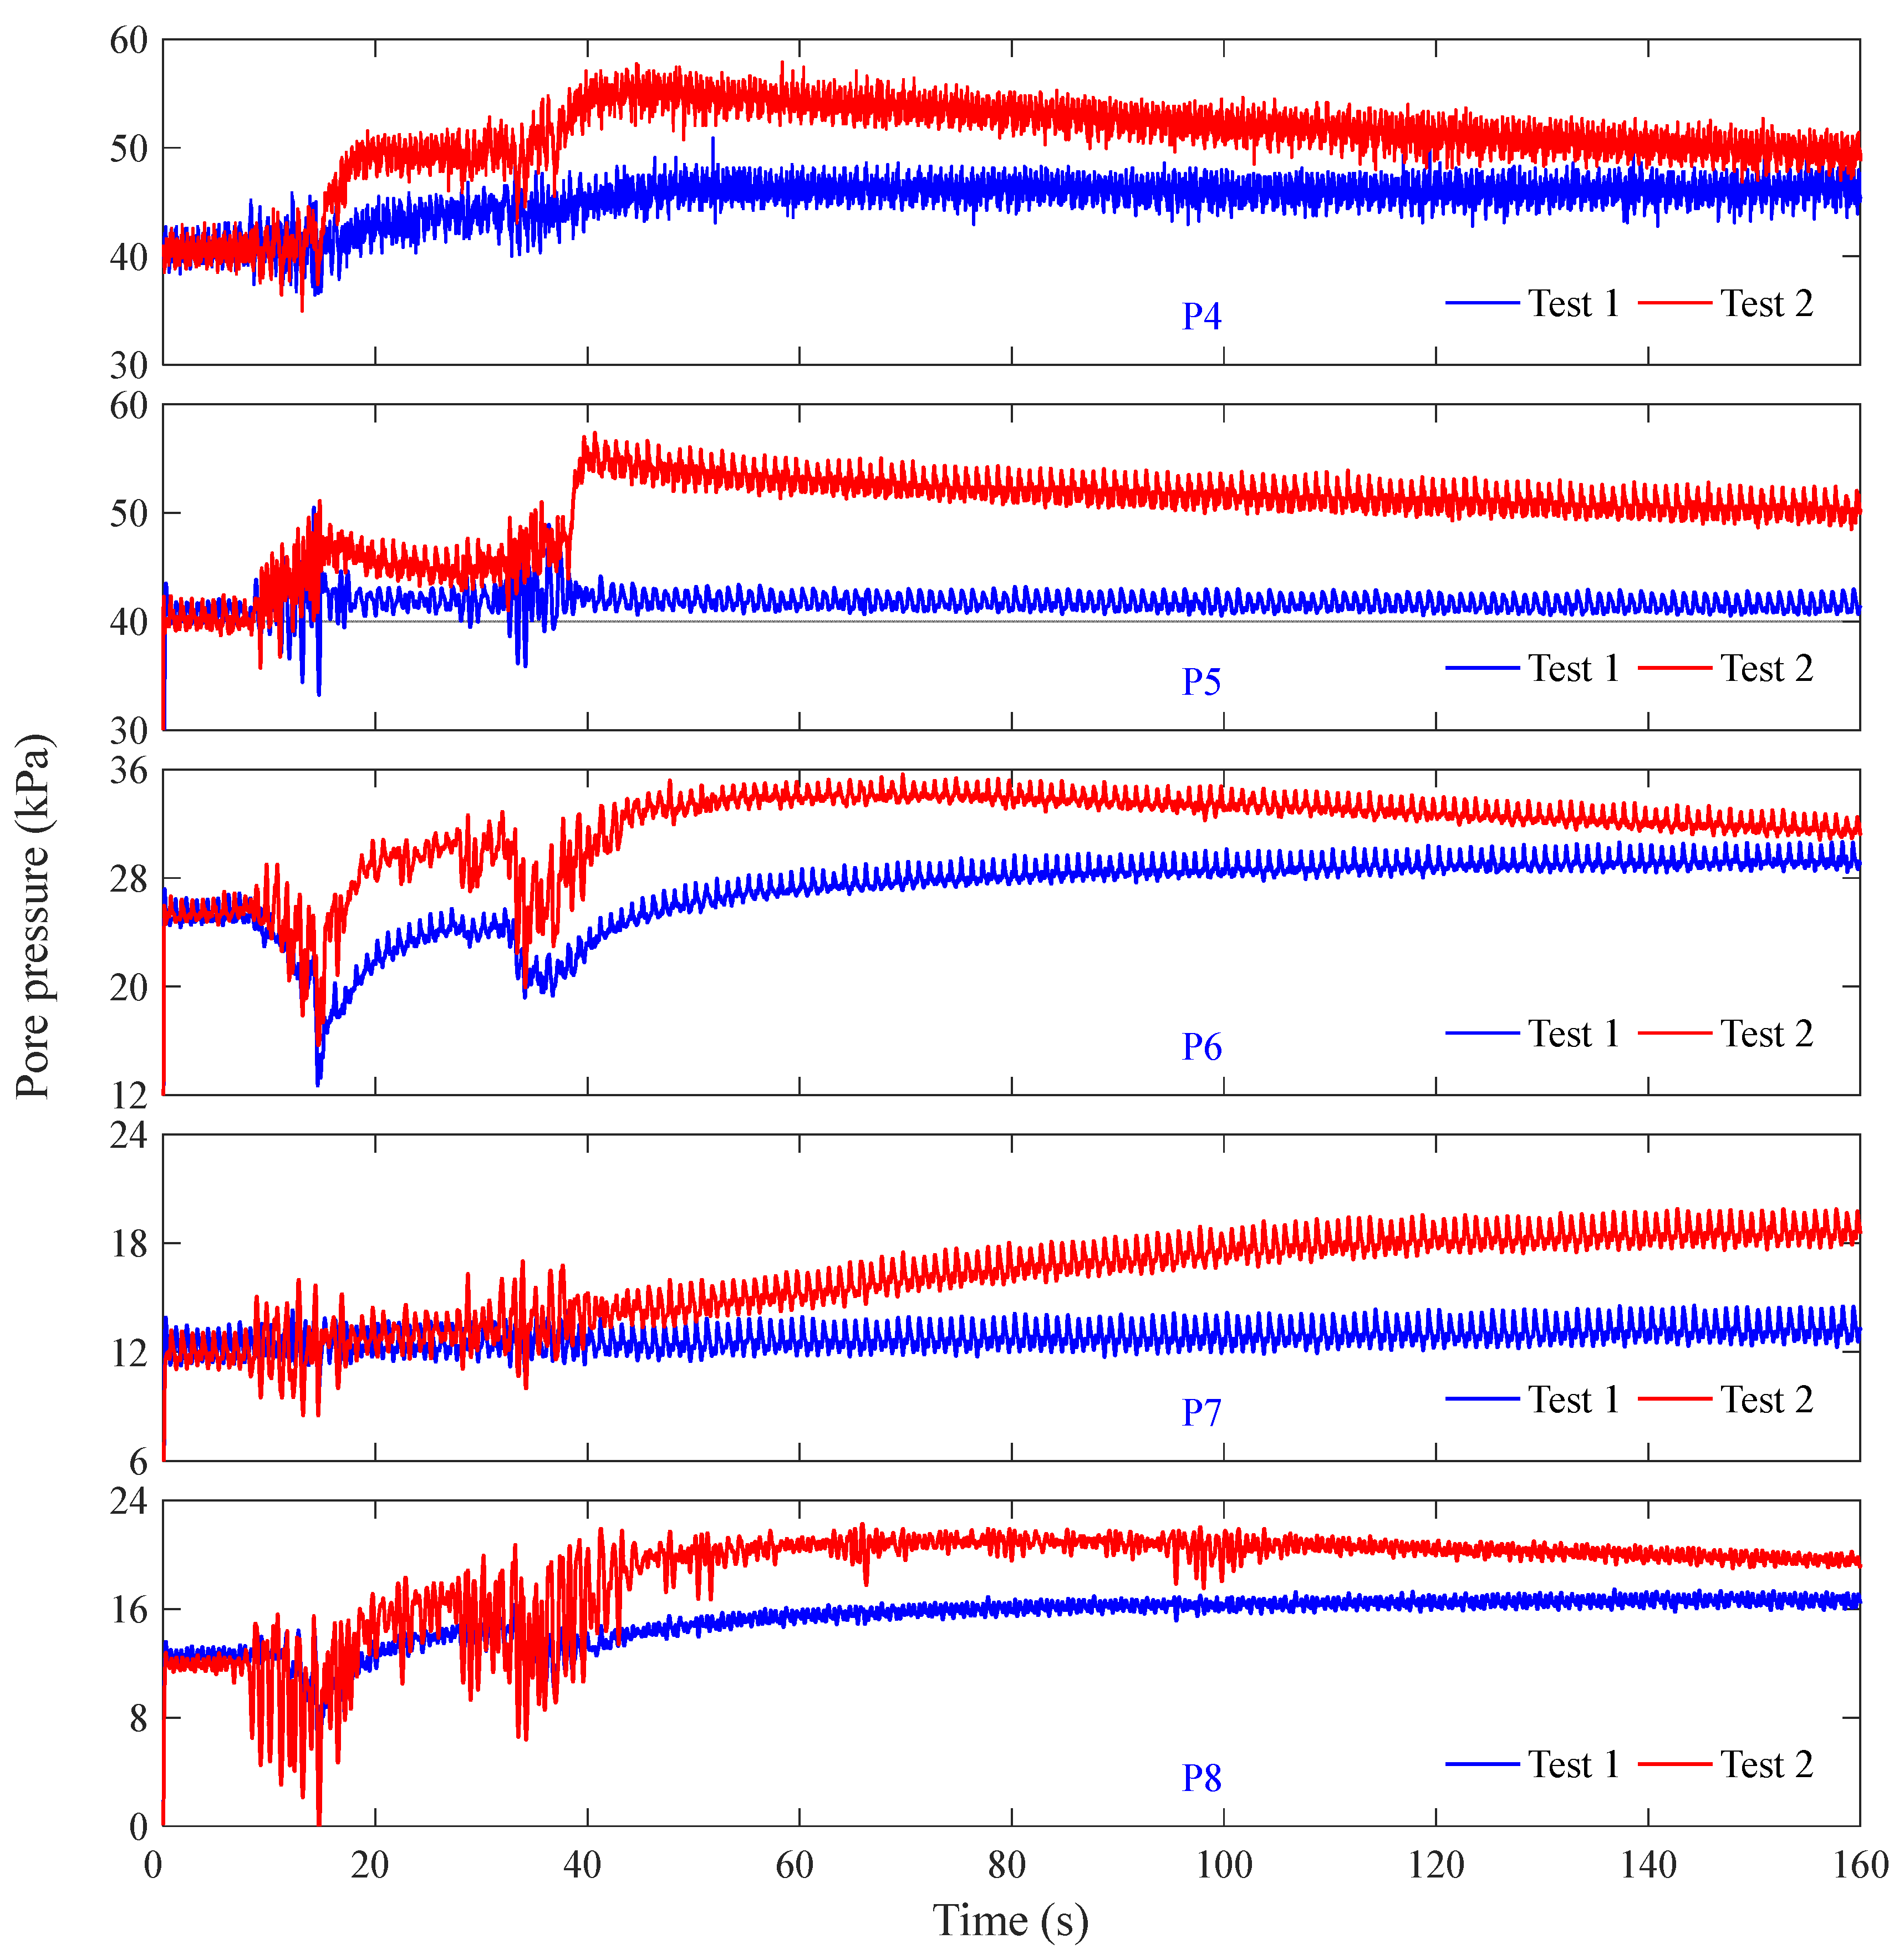
4.1.3. Dynamic Responding of Pore Pressure

The time histories of pore pressure at typical positions in Test 1 and Test 2 are shown in Figure 15. It can be seen that the accumulation rate of pore pressure is faster and the accumulated amplitude is greater in Test 2. The excess pore pressure at P4 in Test 2 can approximately reach 15.5 kPa, which is 2.2 times greater than that in Test 1. It is indicated that the accumulation of excess pore pressure, reduction of effective stress, and softening or even liquefaction is more likely to occur in less dense coral sand foundation. In addition, it can also be seen in Figure 15 that the pore pressure responding characteristics in Test 1 and Test 2 are basically the same, especially at P6, where both Test 1 and Test 2 capture the negative value of the accumulated excess pore pressure. The generality of the phenomenon, the good reproducibility of the test, and the good reliability of the test results are indicated.
To further evaluate the potential of liquefaction in the less dense coral sand foundation, the same numerical software FssiCAS is used to estimate the initial vertical effective stresses of the physical model in Test 2. The excess pore pressures and initial vertical effective stresses at P1 to P8 are listed in Table 3, which are estimated according to the experimental results in Test 2 and the numerical results of FssiCAS, respectively. It is known that the maximum excess pore pressure ratio in Test 2 is 0.22. Based on this result, it is judged that no liquefaction occurs in the coral sand foundation. However, the cyclic loading-induced softening behavior of the sandy soil has become more pronounced compared to that in Test 1. This is the direct cause of the greater residual displacement of the revetment breakwater and runway in Test 2.

4.2. Effect of the Intensity of Seismic Wave

The peak acceleration of the input seismic wave in Test 1 and Test 3 are 6.12 m/s2 and 3.23 m/s2, respectively. The effect of the intensity of seismic waves can be explored by comparing the results of Test 1 and Test 3.

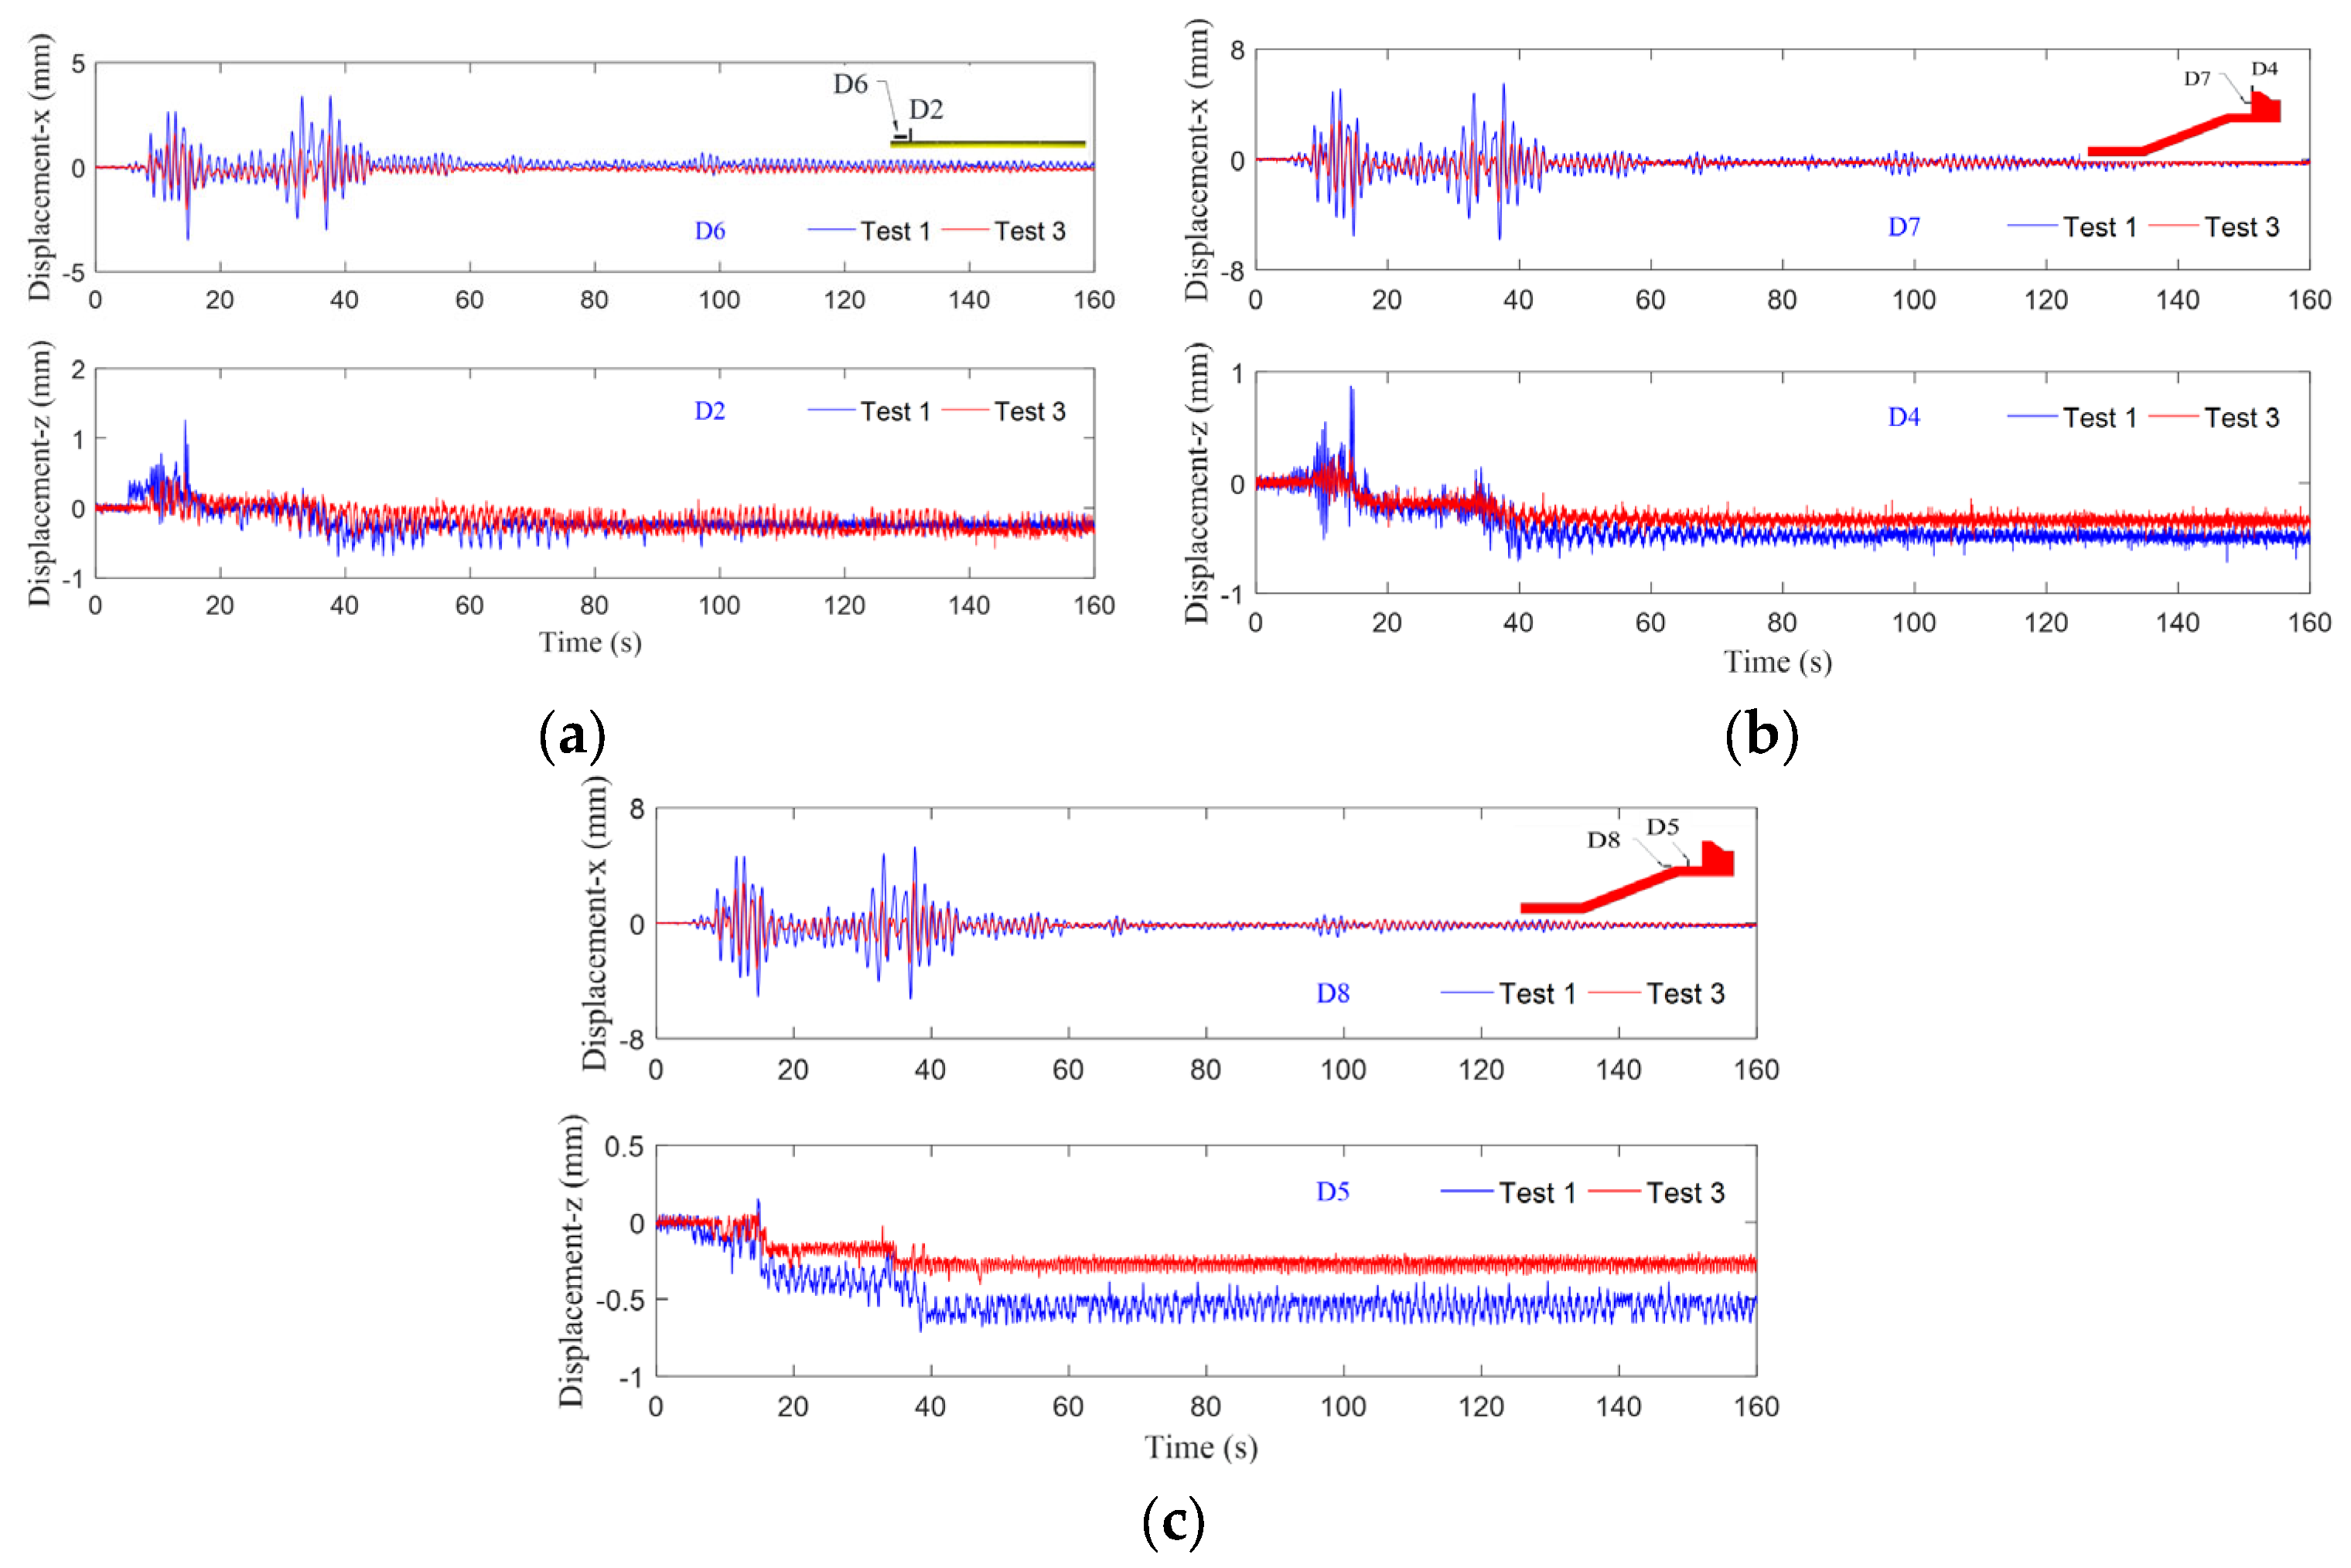
4.2.1. Dynamic Responding of Displacement

The comparisons of the displacement responding at typical positions in Test 1 and Test 2 are illustrated in Figure 16. It can be seen that the general trends of the displacement responses of the aircraft runway and breakwater in Test 1 and Test 3 are basically consistent. However, the amplitude of displacement oscillations for the runway and breakwater in Test 3 is smaller than that in Test 1. It can also be seen in Figure 16b,c that the residual settlement of the breakwater in Test 3 is approximately 50% of that in Test 1. This shows that seismic intensity directly affects the stability of the breakwater and runway. When performing seismic design, the selection of an appropriate fortified seismic intensity level is crucial to guarantee the stability of the structures.

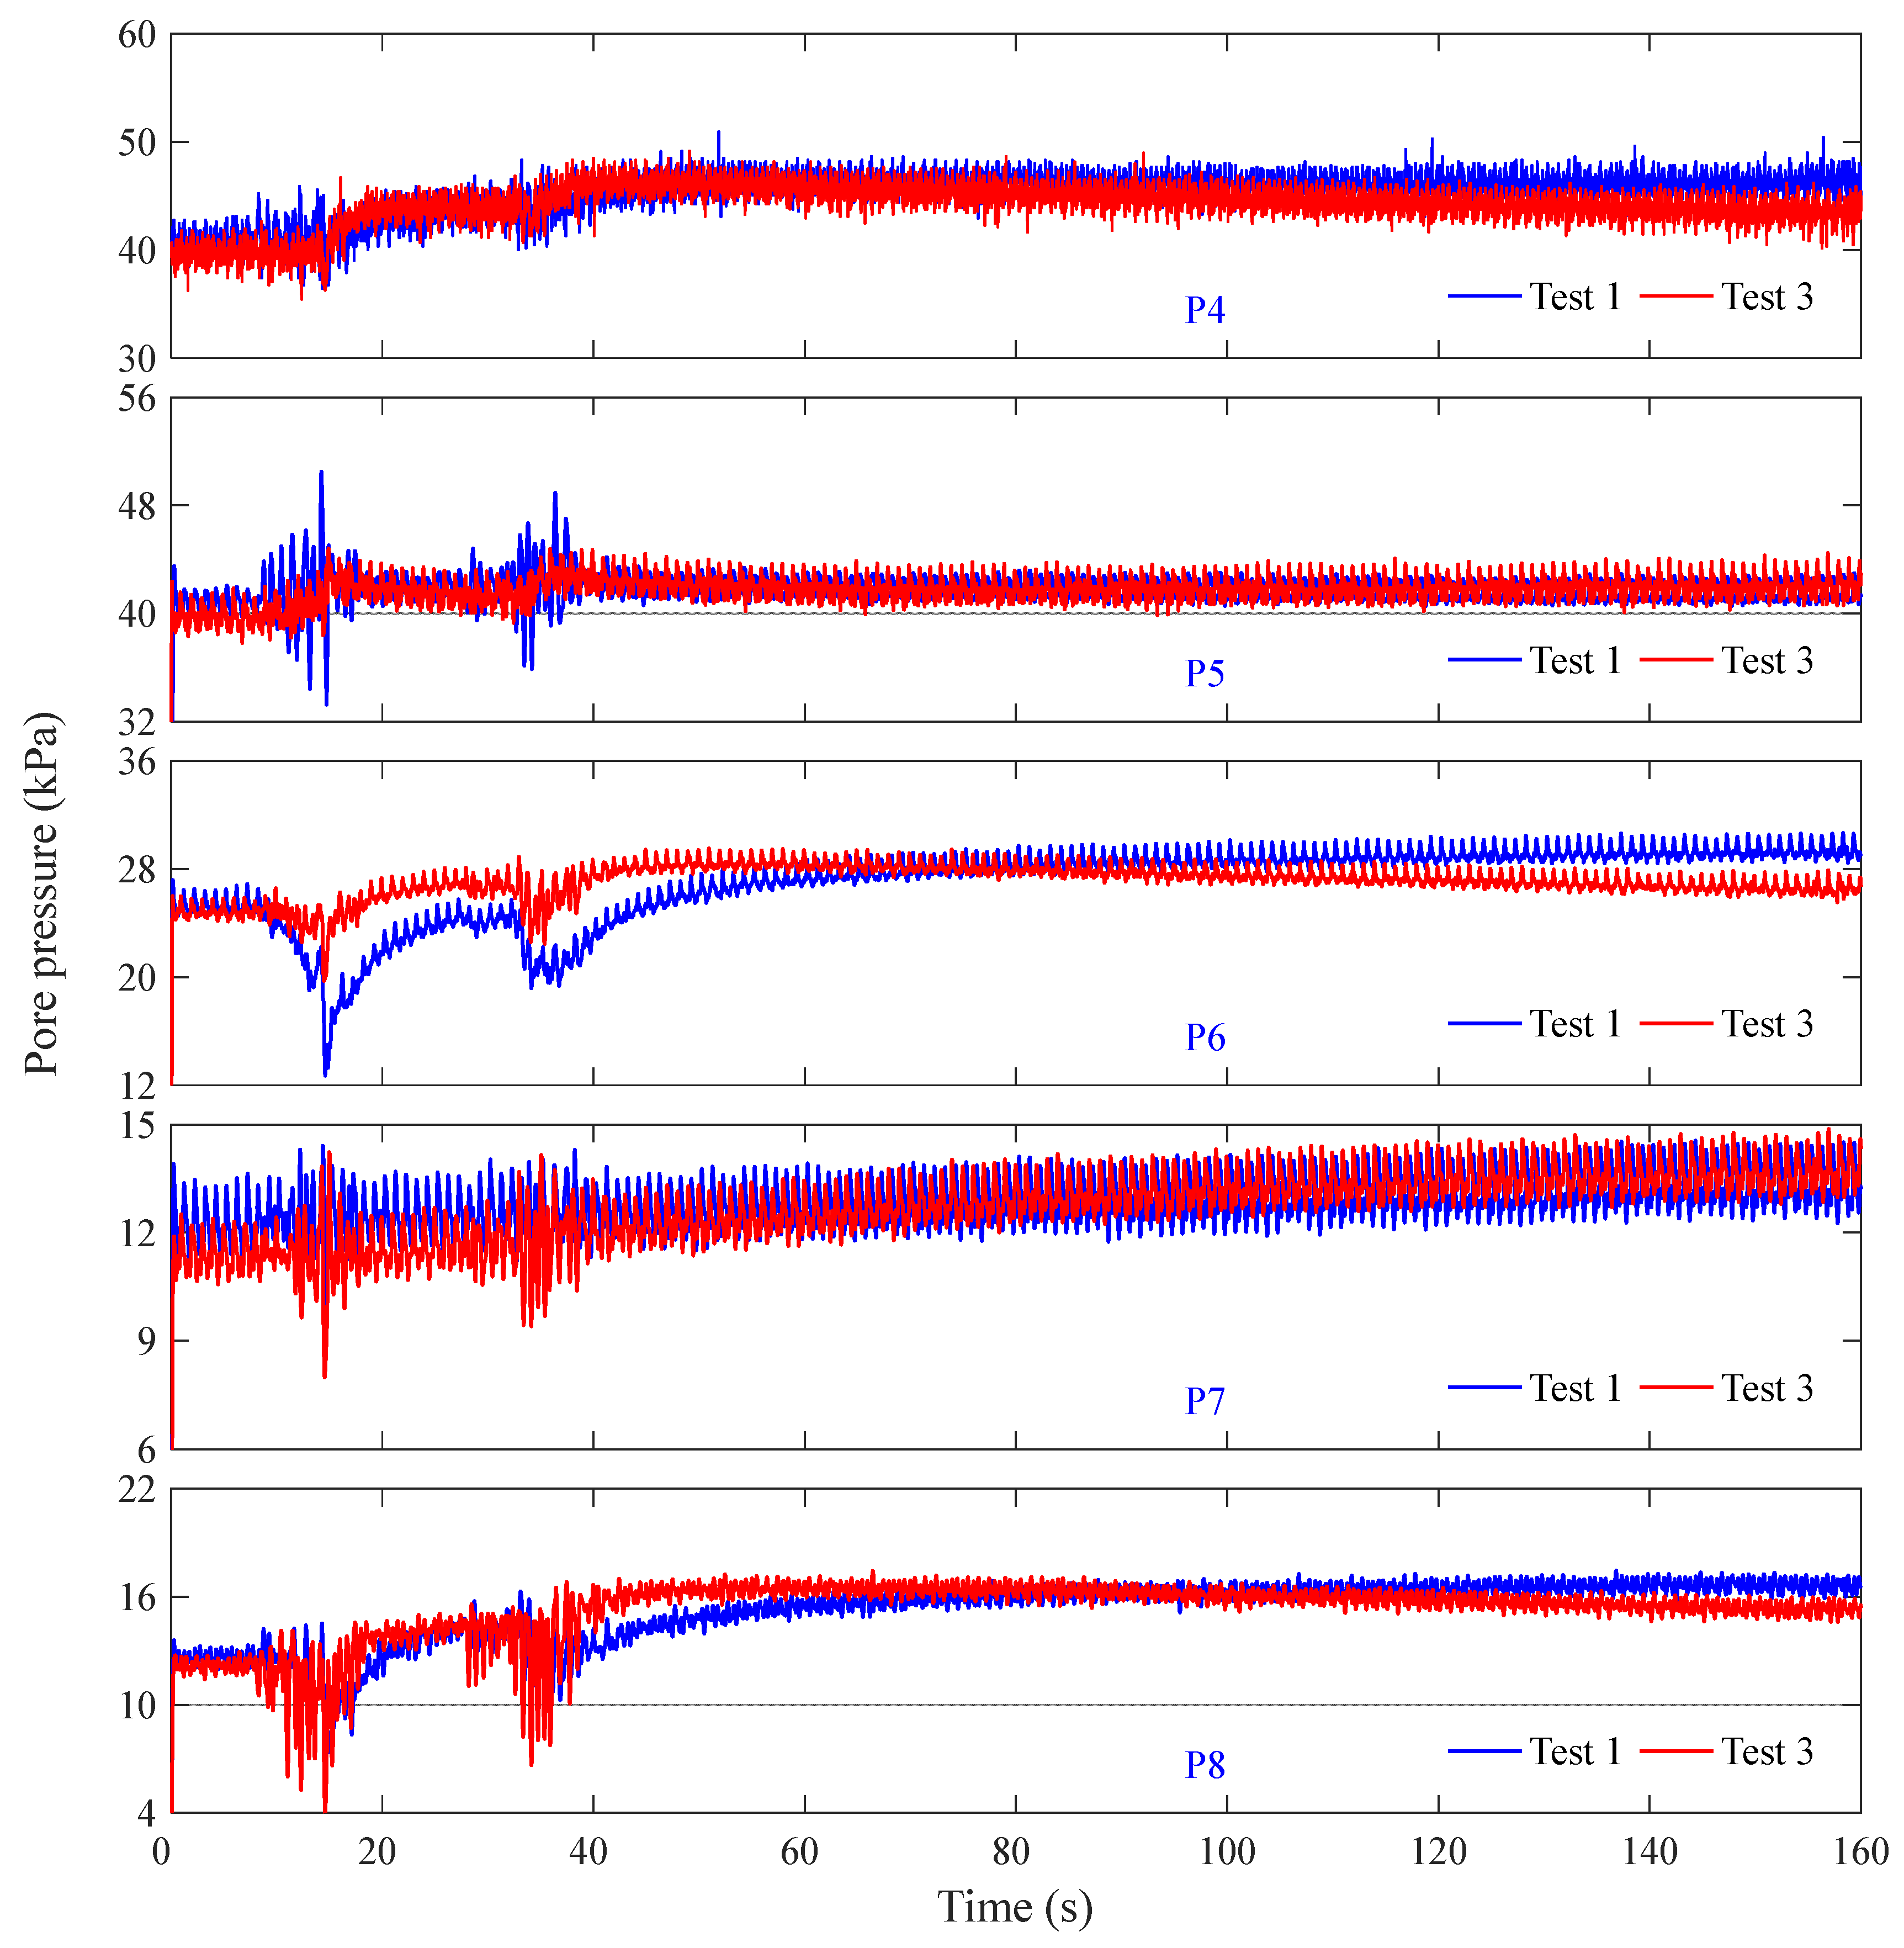
4.2.2. Dynamic Responding of Pore Pressure

Figure 17 shows the comparison of the pore pressure responding at typical positions in the coral sand foundation in Test 1 and Test 3. It can be seen that the pore pressure responding patterns in Test 1 and Test 3 are also basically consistent, and the accumulated magnitudes of excess pore pressure are basically the same. The above results show that the seismic intensity does not strongly affect the pore pressure inside the coral sand foundation, while it has a more significant effect on the displacement of the revetment breakwater and runway.

5. Conclusions

In this study, three groups of centrifuge shaking table tests were performed, to comprehensively explore the seismic dynamics of a revetment breakwater, nearby aircraft runways, and their reclaimed coral sand foundation. According to the physical model test results, the following observations are obtained:
(1)
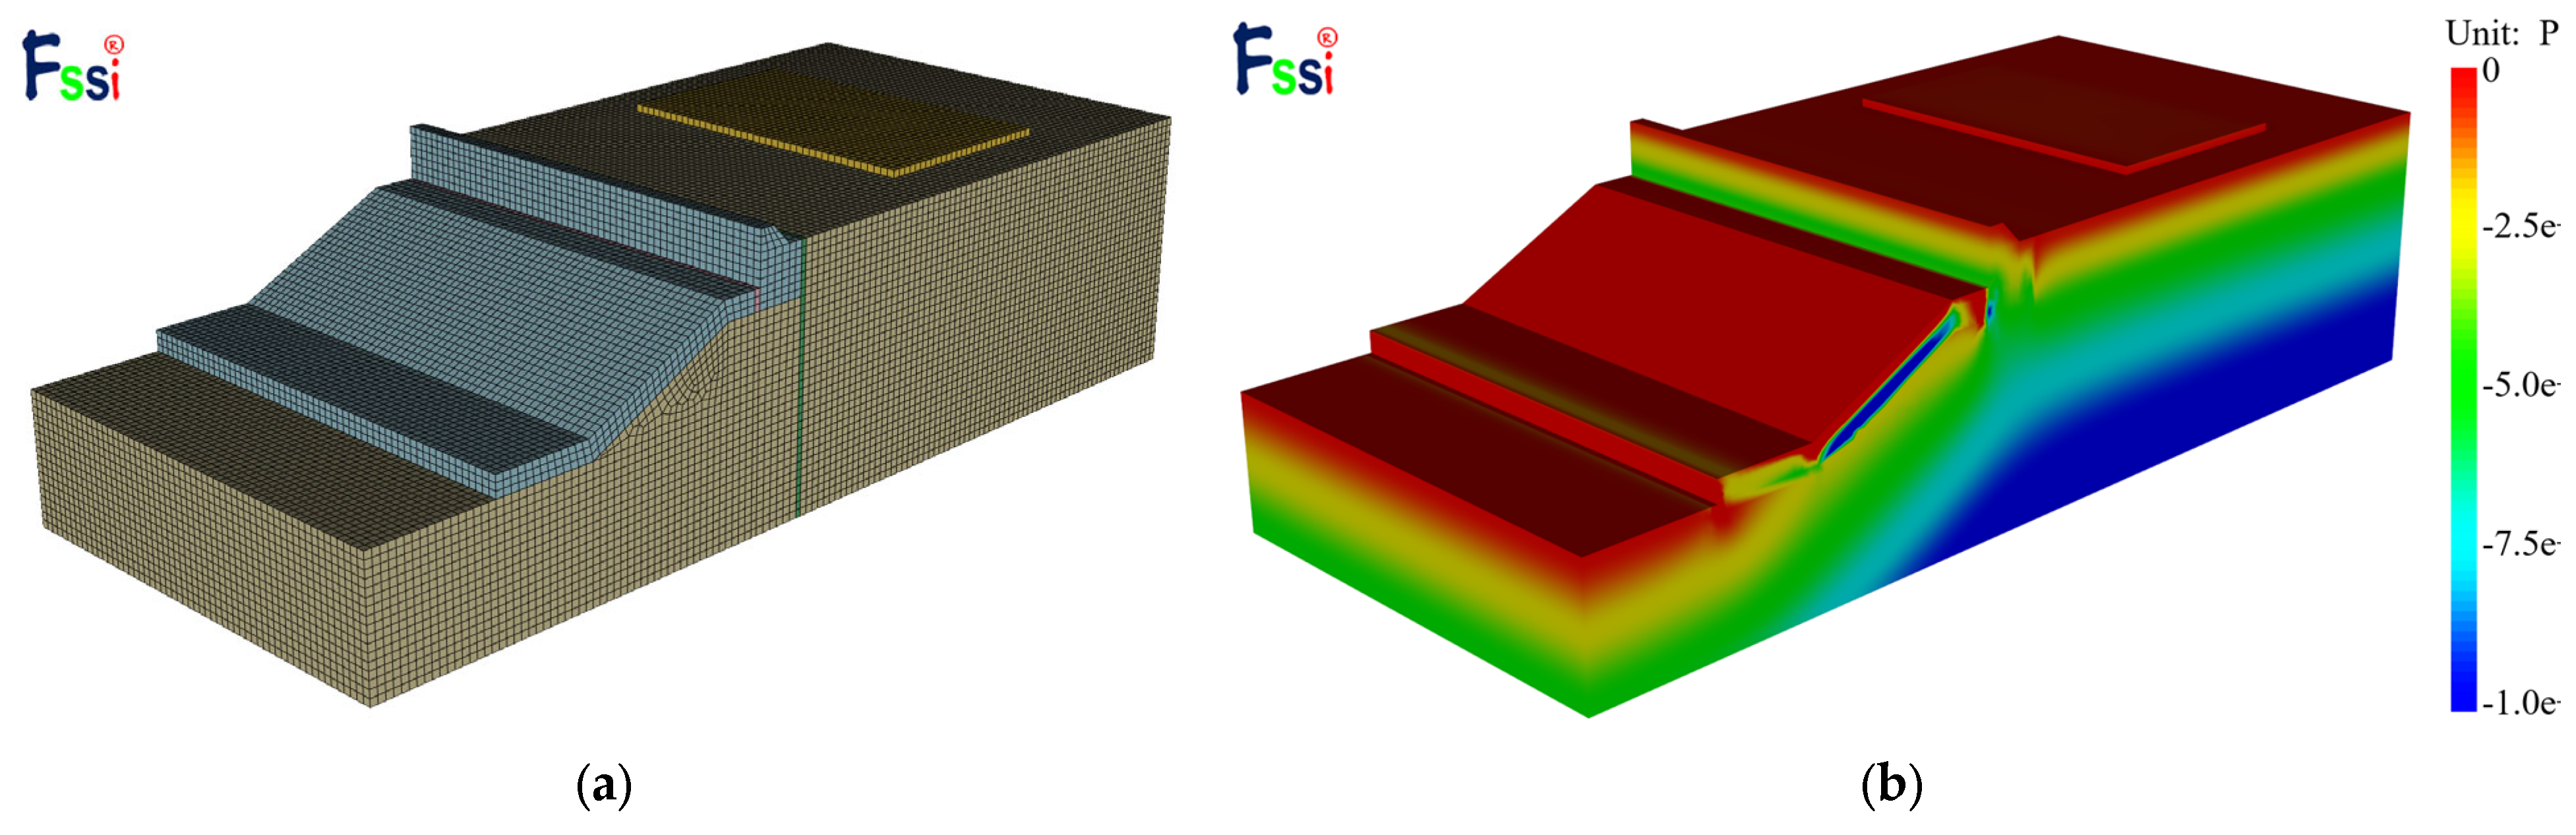
Under strong seismic loading, the final residual subsidence of the revetment breakwater and aircraft runway both are 0.5 mm. The peak residual pore water pressure in the coral sand foundation is up to 7 kPa, and the corresponding maximum excess pore pressure ratio is only 0.12, indicating that no liquefaction occurs in the coral sand foundation. Overall, the revetment breakwater and runways are in a repairable state after the attack of the strong seismic wave, and they show a good seismic resistance performance.
(2)
The coral sand foundation has a significant amplification effect on seismic waves. Additionally, the acceleration amplification at the top of the caisson can reach 5.78 times the base value.
(3)
The comparative study shows that the amplification effect on seismic waves is more significant, and the pore water pressure accumulates more rapidly with much greater amplitude in less dense coral sand foundations. As a result, the stability of the revetment breakwater and runways will become worse. The seismic intensity has less of an effect on the pore pressure responding in the coral sand foundation, but has a significant effect on the displacement of the breakwater and runway.
(4)
In the three tests, the development trend of the displacement of the revetment breakwater and aircraft runway is basically the same. The dynamic responding patterns of pore pressure in Test 1 and Test 2 are also basically similar, and, in particular, the phenomenon that the residual excess pore pressures at P6 and P8 become negative values occurs two times in both tests. It is indicated that the test repeatability is quite good and the credibility of the test results is high in this study.

Author Contributions

Conceptualization, J.Y.; methodology, J.Y., Y.Z. and K.H.; software, J.Y., Y.Z. and K.H.; validation, Y.Z., K.H. and X.L.; formal analysis, Y.Z., K.H. and X.L.; investigation, J.Y., Y.Z. and K.H.; resources, J.Y., Y.Z. and K.H.; data curation, Y.Z. and K.H.; writing—original draft preparation, Y.Z., K.H. and X.L.; writing—review and editing, J.Y.; visualization, K.H. and X.L.; supervision, J.Y.; project administration, J.Y.; funding acquisition, J.Y. All authors have read and agreed to the published version of the manuscript.

Funding

This research was funded by the National Natural Science Foundation of China, grant number is 51879257.

Institutional Review Board Statement

Not applicable.

Informed Consent Statement

Not applicable.

Data Availability Statement

Upon request.

Conflicts of Interest

The authors declare no conflict of interest.

References

  1. Ye, J.; He, K.; Shan, J. Experimental study on stability of revetment breakwater built on reclaimed coral reef islands in South China Sea under extreme wave impact. Blasting 2019, 36, 13–23. (In Chinese) [Google Scholar]
  2. He, K.; Ye, J. Physical modeling of the dynamics of a revetment breakwater built on reclaimed coral calcareous sand foundation in the South China Sea—Tsunami wave. Bull. Eng. Geol. Environ. 2021, 80, 3315–3330. [Google Scholar] [CrossRef]
  3. He, K.; Ye, J. Physical Modeling of the Stability of a Revetment Breakwater Built on Reclaimed Coral Calcareous Sand Foundation in the South China Sea-Regular Wave. Appl. Sci. 2021, 11, 2325. [Google Scholar] [CrossRef]
  4. Zhang, Y.; Ye, J. Physical modelling of the stability of a revetment breakwater built on reclaimed coral calcareous sand foundation in the South China sea-random waves and dense foundation. Ocean. Eng. 2021, 219, 108384. [Google Scholar] [CrossRef]
  5. Guo, M. Numerical Simulation of Wave Dynamic Response and Stability of Breakwaters on Reclaimed Reef. Master Thesis, China University of Geosciences, Beijing, China, 2020. [Google Scholar]
  6. Kirby, S.; Geist, E.; Lee, W.H.K. Great Earthquake Tsunami Sources: Empiricism and Beyond; USGS Tsunami Sources Workshop: Menlo Park, CA, USA, 2006. [Google Scholar]
  7. Zhou, Q.; Adams, W.M. Tsunamigenic Earthquakes in China, 1831 BC to 1980 AD. Sci. Tsunami Hazards 1986, 4, 131–148. [Google Scholar]
  8. Sun, L.; Zhou, X.; Huang, W.; Liu, X.; Yan, H.; Xie, Z.; Wu, Z.; Zhao, S.; Shao, D.; Yang, W. Preliminary evidence for a 1000-year-old tsunami in the South China Sea. Sci. Rep. 2013, 3, 1655. [Google Scholar] [CrossRef] [PubMed] [Green Version]
  9. Memos, C.D.; Protonotarios, J.N. Patras breakwater failure due to seismic loading. In Coastal Engineering 1992; American Society of Civil Engineers: Reston, VA, USA, 1993; pp. 3343–3356. [Google Scholar]
  10. Iai, S.; Kameoka, T. Finite element analysis of earthquake induced damage to anchored sheet pile quay walls. Soils Found. 1993, 33, 71–91. [Google Scholar] [CrossRef]
  11. Hamada, M.; Nakamura, S.; Ohsumi, T.; Megro, K.; Wang, E. The 1999 Ji-Ji earthquake, Taiwan-Investigation into damage to Civil Engineering structures. Jpn. Soc. Civ. Eng. 1999, 1999, 160. [Google Scholar]
  12. Sumer, B.M.; Kaya, A.; Hansen, N.E.O. Impact of liquefaction on coastal structures in the 1999 Kocaeli, Turkey earthquake. In Proceedings of the Twelfth International Offshore and Polar Engineering Conference, Kitakyushu, Japan, 26–31 May 2002; OnePetro: Richardson, TX, USA, 2002. [Google Scholar]
  13. Li, J. Seismic Dynamic Response Analysis of Breakwaters on Reclaimed Reef and Foundation. Master Thesis, China University of Geosciences, Beijing, China, 2020. [Google Scholar]
  14. Hao, M.; Zhang, Y. Analysis of terrain effect on the properties of ground motion. Acta Seismol. Sin. 2014, 36, 883–894+981. (In Chinese) [Google Scholar]
  15. Bao, X.; Liu, J.; Wang, D. Seismic response analysis of local layered sea reef site. J. Vib. Shock. 2020, 39, 55–64. (In Chinese) [Google Scholar]
  16. Liu, J.; Bao, X.; Li, S.; Zhao, Q.; Wang, F.; Wang, D. Seismic response analysis on reef site considering influence of lagoon. Comput. Aided Eng. 2020, 29, 46–50+69. (In Chinese) [Google Scholar]
  17. Yu, Y.; Deng, L.; Li, R. Centrifuge model test of the seismic response behavior of a sand slope. J. Tsinghua Univ. (Sci. Technol.) 2007, 47, 789–792. (In Chinese) [Google Scholar]
  18. Wang, N.; Zhang, W. Centrifuge model test for seismic response of concrete face rock fill dam. Hydro-Sci. Eng. 2003, 1, 18–22. (In Chinese) [Google Scholar]
  19. Hu, J.J.; Li, T.; Xie, L.; Li, Q.; Jiang, Z. Seismic response analysis of coral reef under pulse-like ground motions. Word Earthq. Eng. 2017, 33, 1–10. (In Chinese) [Google Scholar]
  20. Wu, Z.; Zhang, J.; Wang, Z.; Wu, X.; Wang, M. Time-frequency analysis on amplification of seismic ground motion. Rock Soil Mech. 2017, 38, 685–695. (In Chinese) [Google Scholar]
  21. Chaudhary, B.; Hazarika, H. Centrifuge modelling for stability evaluation of a breakwater foundation subjected to an earthquake and a tsunami. Ocean. Eng. 2018, 148, 169–181. [Google Scholar] [CrossRef]
  22. Ozaki, R.; Nagao, T. Verification of seismic stability of caisson type breakwater. In Proceedings of the 13th World Conference on Earthquake Engineering, Vancouver, BC, Canada, 1–6 August 2004. [Google Scholar]
  23. Chen, B.F.; Huang, C.F. Hydrodynamic forces on concrete sea wall and breakwater during earthquakes: Effects of bottom sediment layers and back-fill soil. Ocean. Eng. 2002, 29, 783–814. [Google Scholar] [CrossRef]
  24. Basu, D.; Pretell, R.; Montgomery, J.; Ziotopoulou, K. Investigation of key parameters and issues in simulating centrifuge model tests of a sheet-pile wall retaining a liquefiable soil deposit. Soil Dyn. Earthq. Eng. 2022, 156, 107243. [Google Scholar] [CrossRef]
  25. Ye, J.; Wang, G. Seismic dynamics of offshore breakwater on liquefiable seabed foundation. Soil Dyn. Earthq. Eng. 2015, 76, 86–99. [Google Scholar] [CrossRef]
  26. Yuksel, Y.; Berilgen, M.; Cihan, K.; Cevik, E.O.; Dizman, U.; Yalciner, A.C. The seismic responses of a rubble mound breakwater. In Proceedings of the The Sixteenth International Offshore and Polar Engineering Conference, San Francisco, CA, USA, 28 May–2 June 2006; OnePetro: Richardson, TX, USA, 2006. [Google Scholar]
  27. Miyamoto, T.; Yoshinaga, S.; Soga, F.; Shimizu, K.; Kawamata, R.; Sato, M. Seismic prospecting method applied to the detection of offshore breakwater units settling in the seabed. Coast. Eng. Jpn. 1989, 32, 103–112. [Google Scholar] [CrossRef]
  28. Chaudhary, B.; Hazarika, H.; Ishibashi, I.; Abdullah, A. Sliding and overturning stability of breakwater under combined effect of earthquake and tsunami. Ocean. Eng. 2017, 136, 106–116. [Google Scholar] [CrossRef]
  29. Chaudhary, B.; Hazarika, H.; Monji, N.; Nishimura, K.; Ishikura, R.; Kasama, K. Behavior of breakwater foundation reinforced with steel sheet piles under seismic loading. In Geotechnical Hazards from Large Earthquakes and Heavy Rainfalls; Springer: Tokyo, Japan, 2017; pp. 449–461. [Google Scholar]
  30. Memos, C.; Bouckovalas, G.; Tsiachris, A. Stability of rubble-mound breakwaters under seismic action. Coast. Eng. 2000, 2001, 1585–1598. [Google Scholar]
  31. Gao, R.; Ye, J. Experimental investigation on the dynamic characteristics of calcareous sand from the reclaimed coral reef islands in the South China Sea. Rock Soil Mech. 2019, 40, 3897–3908+3919. (In Chinese) [Google Scholar]
Figure 1. A real view of the geotechnical centrifuge TK-C500 utilized in the test.
Jmse 11 00041 g001
Figure 2. Schematic map of the physical model and the dimensions at model scale (Unit: mm).
Jmse 11 00041 g002
Figure 3. Grain size gradation of the original coral sand and the re-proportioned sand.
Jmse 11 00041 g003
Figure 4. Layout of the measurement sensors in the physical model (Unit: mm).
Jmse 11 00041 g004
Figure 5. A real view of the completed physical model.
Jmse 11 00041 g005
Figure 6. Comparison of the input and output seismic waveforms of centrifuge shaking table. (a) Horizontal. (b) Vertical.
Jmse 11 00041 g006
Figure 7. Comparison of the frequency distribution of the input and output seismic waves of centrifuge shaking table.
Jmse 11 00041 g007
Figure 8. Dynamic responding of displacement of the revetment breakwater and runway. (a) Runway. (b) Caisson. (c) Revetment.
Jmse 11 00041 g008aJmse 11 00041 g008b
Figure 9. Dynamic responding of acceleration at typical positions A0, A1, and A2. (a) Horizontal. (b) Vertical.
Jmse 11 00041 g009
Figure 10. Dynamic responding of horizontal acceleration of the revetment breakwater and runway. (a) Revetment breakwater. (b) Runway.
Jmse 11 00041 g010
Figure 11. Dynamic responding of pore pressure at P1 to P8 in the coral sand foundation. (a) P1 to P5. (b) P6 to P8.
Jmse 11 00041 g011aJmse 11 00041 g011b
Figure 12. Finite element mesh discretization and initial vertical effective stress distribution. (a) Finite element mesh. (b) Vertical effective stress.
Jmse 11 00041 g012
Figure 13. Comparisons of displacement responding at typical positions in Test 1 and Test 2. (a) Runway. (b) Caisson. (c) Revetment.
Jmse 11 00041 g013
Figure 14. Distribution of the amplification factor of seismic acceleration along the model height in Test 1 and Test 2 (only in horizontal).
Jmse 11 00041 g014
Figure 15. Time histories of pore pressure at typical positions in Test 1 and Test 2.
Jmse 11 00041 g015
Figure 16. Comparisons of displacement responding at typical positions in Test 1 and Test 3. (a) Runway. (b) Caisson. (c) Revetment.
Jmse 11 00041 g016
Figure 17. Comparison of pore pressure responding in the coral sand foundation in Test 1 and Test 3.
Jmse 11 00041 g017
Table 1. Dry density of the coral sand foundation and peak acceleration in the test.
Test No.Dry Density (kg/m3)Seismic Wave TypePGA of Seismic Wave (m/s2)
Test 11550Wenchuan × 0.76.12
Test 21400Wenchuan × 0.76.12
Test 31550Wenchuan × 0.373.23
Table 2. Excess pore pressure ratio at P1 to P8 in Test 1.
Pore Pressure
Sensor
Vertical   Effective   Stress     σ z 0   (kPa) Residual Pore PressureResidual Pore
Pressure Ratio ru
P137.000.00
P260.95.00.08
P3822.50.03
P492.27.00.08
P592.63.00.03
P641.55.00.12
P736.20.50.01
P863.66.00.09
Table 3. Excess pore pressure ratio at P1 to P8 in Test 2.
Pore Pressure
Sensor
Vertical   Effective   Stress     σ z 0   (kPa) Residual Pore PressureResidual Pore
Pressure Ratio ru
P137.03.50.09
P258.58.50.15
P377.48.00.10
P487.615.50.18
P586.915.00.17
P641.69.00.22
P739.76.50.16
P864.78.00.12
Disclaimer/Publisher’s Note: The statements, opinions and data contained in all publications are solely those of the individual author(s) and contributor(s) and not of MDPI and/or the editor(s). MDPI and/or the editor(s) disclaim responsibility for any injury to people or property resulting from any ideas, methods, instructions or products referred to in the content.

