Abstract
The Qatari mangroves of Al-Khor are being increasingly exposed to a wide variety of anthropogenic pollutants due to land reclamation and urban expansion. In this study, we evaluated the lethal and genotoxic effects of methylmercury, trace metals, and organotins, assessing mortality and aneuploidy levels (abnormal number of chromosomes) in the endemic shrimp Palaemon khori under laboratory conditions. In the experimental design, two different concentrations were used for each family of contaminant (single or combined): an environmental concentration equivalent to the maximum value reported in the environment and a value ten times higher, for a period of eight weeks. Survival decreased significantly when pollutants were administrated in combination, even at environmental concentrations (as shown by Cox proportional hazards ratios): similar levels of mortality would be reached by individual type of pollutants only at ten times the environmental concentration. This critical result, under controlled lab conditions, highlights the importance of monitoring mixtures of contaminant types over single ones in the marine environment. Aneuploidy was reported in all treatments and control ranging from 5% to 19% at week four and from 7% to 21% at week eight. All treatments presented significantly higher aneuploidy levels when compared to the control. However, no significant difference was observed between the two time periods, even though 30% of the treatments could not be assessed at week eight, as not enough animals were still alive. In conclusion, the use of endemic species should be considered a valuable tool to determine local perturbations, representing a regional bioindicator of multiple environmental stressors from the initial stages of contamination.
1. Introduction
Anthropogenic activities constitute an increasing source of pollution to water and sediment in coastal areas worldwide [1,2]. The Arabian Gulf (also known as the Persian Gulf) is a particularly impacted area [1,3], with Qatar facing substantial threats to its marine ecosystem from industrial pollution and large coastal modifications to accommodate industrial facilities and urban housing [4,5,6]. A significant percentage of the contaminants introduced into the marine environment nowadays can be potentially genotoxic, mutagenic or carcinogenic [7,8]. These compounds can alter the integrity and functionality of genetic material at non-cytotoxic and non-lethal concentrations [9] and can lead to delayed detrimental effects at the individual and the population level [10]. Presence of genotoxic contaminants, such as methylmercury, trace metals and organotins have been previously reported in the Arabian Gulf [5,11] and coastal surrounding countries, including Kuwait [12], Iran [13] and Qatar [5,14,15].
Methylmercury (MeHg) enters the marine environment through various pathways, but mainly through atmospheric deposition [16]. Its toxicity arises from its persistence and its tendency to bioaccumulate and bio-transfer in the food chain with potentially high concentrations in invertebrates and carnivorous fish [17,18]. In the Arabian Gulf, values of MeHg ranging from 0.112 to 0.865 mg/kg have been reported in tissues of various crustacean species in different locations [19], sometimes exceeding the maximum recommended level of 0.5 mg/kg wet weight [20]. In Qatar, concentrations of MeHg in local commercial fish species, such as Lethrinus nebulosus, were found to range from 0.064 to 0.871 mg/kg [21]. Methylmercury may complex with other chemical groups within the cells leading to DNA damage through free radical formation [22] and also produce chromosomal aberrations [23]: it has indeed been previously recognized as a genotoxic contaminant in aquatic organisms (e.g., [24]). Within marine animals, there has been genotoxicity studies on dolphins and fish [25,26] among others, with less data available on invertebrates. Recently, Leitão and colleagues [27] assessed the effect of some selected contaminants on the pearl oyster Pinctada radiata and reported Hg as being highly positively correlated to aneuploidy (abnormal number of chromosomes).
Most coastal areas and seas do contain either a high or limited amount of naturally occurring trace metals (TM), especially in the sediments [5]. Nevertheless, even at low concentrations their cationic forms are dangerous to living organisms because of their capacity to bind with short carbon chains and to bioaccumulate in protein-rich tissues [5,28]. Trace metals may indeed interfere with cellular metabolic functions causing harmful side effects [28,29]: their toxicity arises not only from the level of contamination but also from the biochemical role they play in the metabolic processes, as well as the extent to which they are absorbed and excreted [30]. Depending on the metal, these contaminants might not exert a strong impact individually, but when combined, their negative effects may be magnified [31,32], but also may be reduced (as in the case of the antagonistic effects of silver and copper in jellyfish [33]). The genotoxic effect of TM on marine invertebrates has been previously reported. Studies on the effect of TM on the cell aneuploidy in the mussels Anodonta cygnea, Unio tumidus and the gastropod Viviparus viviparus showed high levels of polyploid cells (42%) resulting from contamination by Cd, V, Cr, Ni, Cu, Mn, Zn, Fe, Sr and Hg [34]. Similarly, studies on the consequences of TM contamination on the oyster Crassostrea angulata using genotoxic endpoints revealed that marine contamination by Cd, Fe and Zn was linked to higher genetic abnormalities [35]. More recently, the genotoxic effect of trace metals on the Manila clam Ruditapes philippinarum was investigated and results revealed a strong correlation between aneuploidy and TM sediment contamination [36]. Other organisms for which such a correlation was observed include the bivalve Mytilus edulis [8], the pearl oyster P. radiata [37] and the barnacle Balanus improvisus [27].
Maritime activities have, in the past, also lead to the introduction of organotins (OT) into the marine environment until their ban in the 1980s (89/677/CEE). Organotins were used as wood protecting paints, disinfectants and biocides (especially in marine anti-fouling paints [38]), thus spreading worldwide from coastal zones to the open seas. This group of contaminants has a slow breakdown rate and, similar to MeHg and TM, also persists in the marine environment and bioaccumulate [39,40]. Organotin compounds, such as tributyltin (TBT) and its degraded products monobutyltin (MBT) and dibutyltin (DBT), can cause DNA damage, double-strand breaks, base damage and intra-strand crosslinks [41,42,43]. Their genotoxic effect has previously been reported in marine invertebrates, e.g., in the marine worm Platynereis dumerilii, and has been found to be dose-dependent with exposure [44]. Organotins have a high selectivity regarding their mode of action and have been classified as having neuro-, cyto- and genotoxic effects on several biological models such as the tunicate Styela plicata [45,46]. Specific reports on their genotoxicity are, however, rare compared to the reports on their other effects. The effect of TBT and triphenyltin (TPT) has been investigated in the model fish Danio rerio revealing that chronic exposure to low levels of TBT, TPT and binary mixtures of TBT are genotoxic to zebrafish [47].
There is also now a scientific consensus that the assessment of marine ecosystems’ health and the design of measures to enhance environmental quality should be performed using a combined approach, incorporating both chemical and biological measurements, in key sentinel species (e.g., [48,49]). Cytogenetic parameters and atypical cytogenetic features, such as aneuploidy, have shown their relevance as endpoint indicators for assessing marine environmental genotoxicity in different marine and invertebrate species, e.g., mussels M. edulis [50], the pearl oyster P. imbricata radiata [37] and the Manila clam R. philippinarum [36]. Moreover, in the Pacific oyster, Magallana gigas aneuploidy has been well documented [51,52], together with the negative relationship between aneuploidy and growth rate [53] and the persistence of aneuploidy levels, within and between generations [51,53,54].
A wide variety of marine organisms have been used as biomarkers to assess the state of the environment in which they reside [48]. The utilization of endemic species as biomarkers for local environments can offer a regional specific indicator of environmental stressors exclusive to that site [37,55]. Moreover, analyzing the impact of various pollutants that can biologically affect endemic species can give a better understanding and offer more effective means of monitoring and maintaining the integrity of local mangroves [56]. The objective of this study was to evaluate the mortality rate and the genotoxic impact (at the chromosomal level, i.e., aneuploidy) of MeHg, TM (Cr, Mn, Cd, V and Pb) and OT compounds (MBT, DBT and TBT) on the endemic shrimp P. khori, treated with different concentrations (environmental and ten times higher), individually (same type of contaminant) or in combination (more than one type of contaminant), over a time period of eight weeks.
2. Materials and Methods
2.1. Sample Collection
Live specimens (n = 750) of the shrimp P. khori (average size: 300 mm total length; Figure 1) were collected in early April 2016 at low tide from Al-Khor mangroves (25.690020° N, 51.55572° E; Figure 2), using fine nets in shallow water to facilitate the collection of specimens. Water temperature at the site varied slightly from 27 °C to 29 °C. Salinity values showed little variation between 42 ppt to 43 ppt and the pH was steady at 7.9. Immediately after collection, specimens were stored in ice boxes filled with aerated fresh seawater from the sampling sites and brought to the Environmental Science Center (ESC), Qatar University, where they were transferred to a large tank containing aerated seawater.
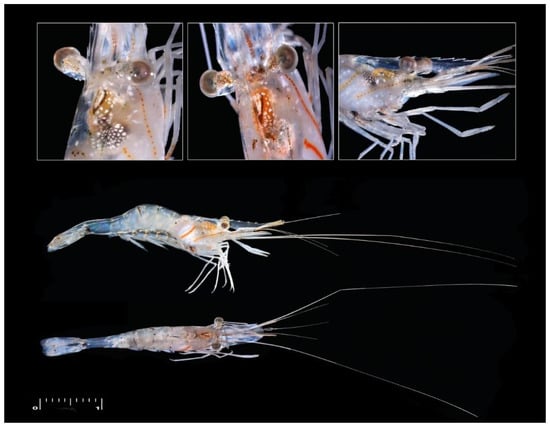
Figure 1.
The endemic palaemonid shrimp Palaemon khori (Picture courtesy of the Environmental Science Center photographic section, University of Qatar). Scale: 1 cm.
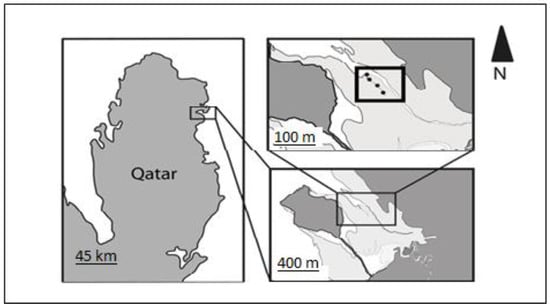
Figure 2.
Sampling site: Al-Khor, Qatar. Dark grey areas indicate land, light grey areas mangroves and white areas water. The thick rectangular box represents the sampling area, with dark circles indicating the sampling locations.
2.2. Experimental Design
Twenty-five small tanks (5 L) were prepared, each filled with 3 L of seawater, gently aerated, constantly filtered by activated carbon filters and maintained at a constant temperature of 22 °C and pH 8.01 (these physicochemical parameters were checked every three days). Each tank was dosed with a selected type of contaminant/combination of multiple types of contaminants (©Sigma Aldrich, Rockville, MD, USA) belonging to the three main group of aquatic pollutants (MeHg, TM and OT) known to be present in the area [49] at set concentrations (µg/L; Table 1): the highest concentration found in seawater obtained from the literature [Env] and a concentration ten times higher [10*Env]. To ensure that the concentration within the tank was constant (not affected by the activated carbon filters and evaporation), each tank was tested every three days to monitor the concentration of the pollutants. The concentration only needed to be adjusted to maintain the initial dosage after six weeks from the beginning of the experiment. There were two replicate tanks for each treatment (referred to as experiment 1 and experiment 2). Only one tank with natural seawater was used as control, in the attempt to reduce the number of animals removed from their natural environment, following ethical practice in the use of animals for research and assuming natural mortality in this tank would have been lower than in the treatments. After eight days of acclimation, 30 shrimp were placed in each 5 L tank and fed with goldfish flakes (ca. 500 mg) every three days for the full duration of the experiment. The experiment was run for a total of eight weeks to mimic a long-term exposure to the different treatments. The exposure time of eight weeks was chosen from the literature regarding aneuploidy [57,58]

Table 1.
Concentration (µg/L) of contaminants added to each tank. MeHg = Methylmercury; OT = Organotins (MBT = Monobutyltin; DBT = Dibutyltin; TBT = Tributyltin); TM = Trace metals. Env = environmental concentration; 10*Env = 10 times environmental concentration. Single = single type of contaminant; Combined = combination of different types of contaminants,-- = no contaminants added.
2.3. Mortality and Aneuploidy Scoring
Mortality was checked daily in all tanks, and any dead shrimp were removed. Ten individual shrimp (when available) were sampled from each tank, at four (T4) and eight weeks (T8) after initial dosing for aneuploidy evaluation. The specimens were submerged for 4 h in an aerated 0.09% solution of colchicine in seawater and kept at room temperature (23 °C–26 °C). The gonads were then dissected and subjected to a hypotonic treatment for 45 min in 0.9% solution of sodium citrate and fixed in a freshly prepared mixture of absolute ethanol and glacial acetic acid (3:1), following an established procedure [59]. Slides were prepared for each individual sample, according to the air drying technique of Thiriot-Quiévreux and Ayraud [60], and stained with Giemsa (4%, pH 6.8) for 15 min. Chromosome counts were made on apparently intact metaphases, by microscope observation (Nikon Eclipse E400 with incorporated Nikon DS-Fi1 image acquisition camera). The same observer to reduce the subjectivity associated with different observers performed the chromosome counting. Palaemon khori normally present 48 chromosomal pairs (2n = 96), 26 metacentric, 7 sub metacentric, 12 sub telocentric and 3 telocentric [59]. The level of aneuploidy was estimated by counting the total number of aneuploid metaphases over the total number of metaphases scored per tank.
2.4. Statistical Analysis
All analyses were performed using R 3.6.3 created by R Core Team, Pen. State [61]. Shrimp survival data from two replicated experiments with different treatments (Table 1) were compared with Kaplan–Meier curves [62,63], using log-rank statistics, pairwise tests and Cox proportional hazards ratios (survival package; survminer package [64]). The latter were based on the Akaike information criterion (AIC) and Concordance Index (from 0.5, random prediction to 1.0, perfect concordance) applied to different levels (control; EnvSingle: single type of contaminant at environmental concentration; 10*EnvSingle: single type of contaminant at ten times the environmental concentration; EnvCombined: two combined contaminants at environmental concentration; 10*EnvCombined: two combined contaminants at ten times the environmental concentration). Hazard ratios were visualized with forest plots. We used a censored model, as we removed ten animals at T4, which we do not know if they would have survived, and we stopped the experiment at T8 (surviving individuals were not followed any longer).
Average aneuploid levels could not be calculated for [10*TM], [TM + MeHg], [10*TM + MeHg] and [10*TM + OT] as not enough animals remained alive at T8 to allow for sampling. Aneuploidy ratios (rounded to percentage) were tested for significant differences among treatments (including the control) and time (T4 vs. T8) for the remaining treatments fitting a Generalized Linear Models (GLM; [61]) with Poisson distribution and log link function (null deviance/df = 34.48/33 = 1.04).
3. Results
The effects of the different treatments on the shrimp survival varied across contaminant combinations, but as no statistical differences were found between the two replicated experiments (Figure 3A), replicates were combined; separate analyses for experiment 1 and experiment 2 are presented in the Supporting Information section (Figures S1–S4). Overall, survival probability did not change significantly when the shrimp were dosed with a single type of contaminant at the concentration found in the environment (log-rank: p = 0.11; Figure 4A). This was sustained by analyzing each specific treatment individually (Figure 3B) or grouping all treatments as a category of a single type of contaminants (EnvSingle, Cox proportional hazards ratios: p = 0.181; Figure 3C). Single types of contaminants adversely affected survival when applied at ten times the recorded environmental concentration (log-rank: p = 0.00015; Figure 4B; Cox proportional hazards ratios: p = 0.005; Figure 3C), with the exception of MeHg (Cox proportional hazards ratios: p = 0.127; Figure 3B). A combination of more than one type of contaminant instead significantly reduced survival even at environmental concentration (log-rank: p = 0.00087; Figure 3B; Figure 4C; Cox proportional hazards ratios: p = 0.001; Figure 3C) and even more so at ten times that concentration (log-rank: p < 0.0001; Figure 3B; Figure 4D; Cox proportional hazards ratios: p < 0.001; Figure 3C). Pairwise comparisons among treatments on survival, using log-rank tests, are available in the Supporting Information section (Tables S1–S3).
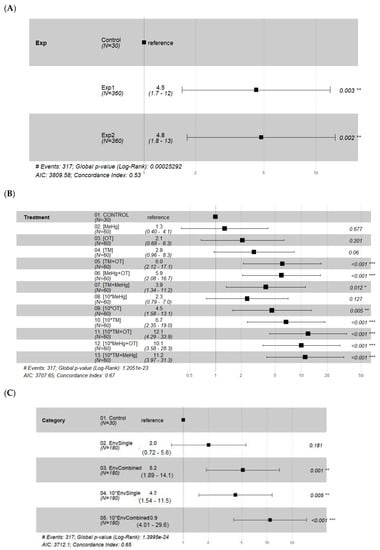
Figure 3.
Forest plots of hazard ratios: (A) experiments (control, experiment 1 and experiment 2); (B) individual treatments for experiment 1 and 2 combined (for actual concentration please refer to Table 1); (C) treatments for experiment 1 and 2 combined, grouped in categories (control; EnvSingle: single type of contaminant at environmental concentration; EnvCombined: two combined types of contaminants at environmental concentration; 10*EnvSingle: single type of contaminant at ten times the environmental concentration; 10*EnvCombined: two combined types of contaminant at ten times the environmental concentration). Number of events, global p-values and AIC and Concordance Index can be found below each plot. Asterisks denote different levels of significance: * p < 0.05; ** p < 0.01; *** p < 0.001.
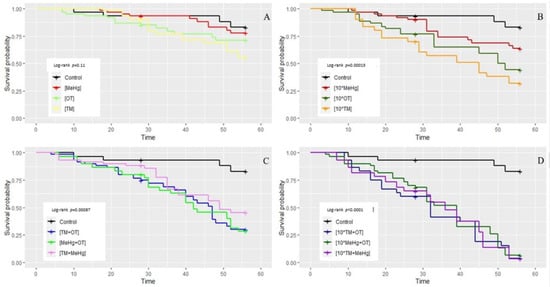
Figure 4.
Survival curves of Palaemon khori for eight weeks of the study, under different treatments (experiment 1 and 2 combined). Curves are grouped by categories: (A) single type of contaminant at reported environmental concentrations; (B) single type of contaminant at ten times the reported environmental concentration; (C) combination of two types of contaminants at reported environmental concentrations; (D) combination of two types of contaminants at ten times the reported environmental concentrations. Refer to the legend for colors. p values (log-rank model) are reported in each panel. Values of concentrations can be found in Table 1.
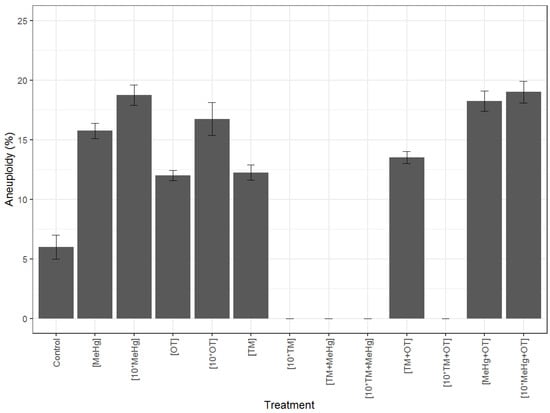
Aneuploid metaphases were observed in all treatments (Table S4/Figure 5) ranging from 5% to 19% at T4 and from 7% to 21% at T8, with the lowest aneuploid levels observed in the control tanks. Please note that in some cases it was not possible to sample ten alive animals at T8 time for aneuploidy analyses (presented as “na” in Table S4). No statistically significant difference was detected in aneuploidy levels between T4 and T8 for the same contaminant/contaminant combination (Table S4). All treatments presented significantly higher levels of aneuploidy than the control (Table S4; Figure 4).
4. Discussion
Mangroves are one of the most endangered coastal ecosystems worldwide [48]. The grey or white mangrove Avicennia marina is the most established coastal tree found in Qatar [49]. Large areas of these ecologically important mangroves have recently been uprooted as part of a port development scheme and work is currently underway to restore this damage. These mangroves provide one of the most productive areas of vegetation in a region where the extreme environmental conditions constrain most vegetation growth. An endemic species of palaemonid shrimp, Palaemon khori [50], has been described in the A. marina mangrove forest at Al-Khor, Qatar. This species represents an important component of the trophic chain within the mangrove-associated faunal community. The use of endemic species can be a valuable tool to determine local perturbations and can offer a region-specific bioindicator of environmental stressors (e.g., [51,52]). Moreover, the analysis of the impact of various contaminants that can biologically affect endemic species will result in a better understanding and more effective means of monitoring and maintaining the integrity of the local ecosystem [53].
One of the major concerns for the conservation of marine organisms is the introduction of further contaminants into their ecosystem. Some of these contaminants may prompt genetic changes (e.g., [7,8]). With anthropogenic activities continuously increasing and affecting the marine environment, analyses of the genotoxic potential of both individual contaminants and group of contaminants is gradually becoming more relevant [65]. Genotoxins may have high ecotoxicological relevance when chronic exposure to multiple contaminants takes place even at low doses [66], providing an early warning to long-term effects of contaminants [67].
Biomonitoring is a common tool to assess the contamination level of multiple pollutants in the natural environment. Yet, the mortality and genotoxic effects of such a mixture of pollutants remain less often investigated (but see higher toxicity recorded in juvenile white shrimp Penaeus setiferus treated simultaneously with MeHg and Cd [68]), or are not conclusive, including synergistic as well as antagonistic effects of pollutants [69]. The results obtained in this study after exposing the endemic mangrove shrimp P. khori to various levels of MeHg, TM (Cr, Cd, Mn, Pb and V) and OT compounds (MBT, DBT and TBT) showed that, even at the concentrations reported in the environment, a combination of multiple types of contaminants can significantly reduce survival (see also [70]). In our study, a single type of contaminant reached the same effects only when dosed at ten times those concentrations. This is an important and critical finding, which stresses the known but often disregarded notion that mixtures of contaminants, even at moderate concentrations, might affect individuals more than we might have anticipated and calls for monitoring of multiple contaminants at the same time to be more effective in the detection of the condition of the ecosystem [71,72] and management interventions.
In marine crustaceans, the gills are regarded as the most sensitive of the epithelia and are in direct contact with the water and thus susceptible to harm through passive diffusion of pollutants conducted via the membranes. Sentinel species exposed to trace metals in the water matrix show that pollutants tend to accumulate in gill tissues [73] and this causes both cytological and histochemical injury to the gill epithelium. This results in gill malfunctions and inhibition of oxygen consumption [71,74], explaining the mortalities observed. The data also indicate that the survival probability did not change significantly when the shrimp were dosed with a single type of contaminant at ambient concentrations. However, single types of contaminants adversely affected survival when applied at ten times the ambient concentrations. This is line with previous studies conducted on the pink shrimp Pandalus montagui, where researchers a reported a 10% increase in the mortality levels with higher pollutant dosage [75]. Note, however, the reduced survival of shrimp when mercury was one of the pollutants involved in the combination of contaminants. This agrees with previous reports that point to the synergism of the mixture of Hg and other pollutants, as observed by [76] investigating the mussel Perna viridis. Mercury has a high affinity for protein binding sites, accounting for the increased toxicity at relatively elevated concentrations in the environment [77]. The data also mimics that which was observed by [78,79], in which the crustacean Neomysis integer was exposed to combinations of metals in concentrations deemed to be individually safe.
Aneuploidy was reported in all treatments, including the control. Aneuploidy is known to be common in marine invertebrate populations, with animals recurrently presenting a low level of aneuploidy in their cells (e.g., [80,81,82]). In 2007, a scale for aneuploidy levels in the oyster Magallana gigas [83] was established, with aneuploidy levels less than 5% being classified as very weak, between 5 and 10% weak, between 10 and 14% normal weak, between 14 and 18% normal high, between 18 and 30% high, and more than 30% very high. In our study, the levels observed in the control situation both at T4 and T8 fall into the very weak stage of the above classification, whereas the levels found in the different treatments, at T4 and T8, ranged in most cases from normal high to high aneuploidy levels. All treatments presented significantly higher aneuploidy levels when compared to the control, highlighting the genotoxic nature of TM, MeHg and OT on P. khori. The genotoxic effect of TM observed in this study had been previously highlighted in several other species of marine invertebrates (e.g., Bolognesi & Hayashi, 2011, Cross & Rebordinos, 2003, Piló et al., 2017, Leitão et al., 2017), including in the Qatari local pearl oysters. However, previous studies on the genotoxicty of methylmercury and organotins in marine invertebrate were scarce. The higher levels of genotoxicity observed in this study were levied by the combined effect of more than one pollutant, highlighting the need of monitoring the mixture of contaminant types over single ones. No significant difference in aneuploidy levels was observed between exposure times, suggesting the reach of a threshold, however these results concern only treatments were comparisons were possible, since at eight weeks, 1/3 of the treatments could not be assessed, as not enough animals were still alive. All the used contaminants influenced the aneuploidy levels and their effect was detected already after four weeks of exposure. Further identification of which chromosomal pairs are being affected by chromosomal loss/gain in the different treatments. i.e., if aneuploidy is random or if it reveals a differential chromosomal susceptibility, would allow a better clarification of the relationship between the different genotoxic agents studied and the aneuploidy phenomenon in this species.
5. Conclusions
This study experimentally evaluated the effects of methylmercury, trace metals and organotins administrated as a single type or in different combinations at environmental or very high dosages on the shrimp P. khori during long-term exposure (eight weeks). Our results showed that survival decreased in shrimp exposed to a combination of multiple types of chemicals, even at the concentration reported in the environment. A genotoxic response (significantly higher aneuploidy levels than the control) was recorded in all treatments. This study highlights the importance of regular environmental biomonitoring of multiple genotoxic contaminants within the marine ecosystem, as a mix of pollutants (even at moderate concentrations) can significantly affect survival. Genotoxic effects (increase in the aneuploidy levels) were observed under laboratory conditions after only four weeks of exposure. A combined approach with chemical and biological assessments [50] in local invertebrates [83] used as key sentinel species could be a valuable tool to detect early warnings of pollution in the marine environment.
Supplementary Materials
The following supporting information can be downloaded at: https://www.mdpi.com/article/10.3390/jmse10070843/s1, Figure S1: Forest plots of hazard ratios: A individual treatments for experiment 1 (for actual concentration please refer to Table 1); C treatments for experiment 1 grouped in categories (control; EnvSingle: single contaminant at environmental concentration; 10*EnvSingle: single contaminant at 10 times the environmental concentration; EnvCombined: combined chemicals at environmental concentration; 10*EnvCombined: combined chemicals at 10 times the environmental concentration). Number of events, global p-values and AIC and Concordance Index can be found below each plot; Figure S2: Survival curves of Palaemon khori for eight weeks of the study, under different treatments (experiment 1). Curves are grouped by categories: A single contaminant at reported environmental concentrations; B single contaminants at 10 times the reported environmental concentration; C combination of contaminants at reported environmental concentrations; D combination of contaminants at 10 times the reported environmental concentrations. Refer to the legend for colours. p values (long-rank model) are reported in each panel. Values of concentrations can be found in Table 1; Figure S3: Forest plots of hazard ratios: A individual treatments for experiment 2 (for actual concentration please refer to Table 1); C treatments for experiment 2 grouped in categories (control; EnvSingle: single contaminant at environmental concentration; 10*EnvSingle: single contaminant at 10 times the environmental concentration; EnvCombined: combined chemicals at environmental concentration; 10*EnvCombined: combined chemicals at 10 times the environmental concentration). Number of events, global p-values and AIC and Concordance Index can be found below each plot; Figure S4: Survival curves of Palaemon khori for eight weeks of the study, under different treatments (experiment 2). Curves are grouped by categories: A single contaminant at reported environmental concentrations; B single contaminants at 10 times the reported environmental concentration; C combination of contaminants at reported environmental concentrations; D combination of contaminants at 10 times the reported environmental concentrations. Refer to the legend for colours. p values (long-rank model) are reported in each panel. Values of concentrations can be found in Table 1. Table S1: Pairwise comparisons among treatments on survival, using log-rank test for experiment 1. Significative differences are expressed in bold. Table S2: Pairwise comparisons among treatments on survival, using log-rank test for experiment 2. Significative differences are expressed in bold. Table S3: Pairwise comparisons among treatments on survival, using log-rank test for experiment 1 and 2 combined. Significative differences are expressed in bold. Table S4: Number of observed metaphases (in ten animals) with corresponding number of aneuploid metaphases for two replicated tanks (except the control) at four and eight weeks after dosage (T4 and T8). Aneuploidy levels were calculated as the ratio between aneuploid and total metaphases. Average aneuploid numbers were calculated for replicated tanks and used for statistical analyses.
Author Contributions
Conceptualization, H.H. and A.L. with discussions with C.B. and D.M.; methodology, H.H.; Statistical analysis, H.H., C.B. and M.C.; data curation, A.L.; writing—original draft preparation, H.H.; writing—review and editing, C.B., M.C. and A.L.; supervision, A.L., C.B. and D.M.; project administration, I.A.-M. All authors have read and agreed to the published version of the manuscript.
Funding
This research received no external funding.
Institutional Review Board Statement
Ethical review and approval were waived for this study. The project involved crustaceans (invertebrates) excluded from legislations on the use of animals in research. Ethical approval was obtained from the University of Salford (STR1617-92). Experiments were performed in accordance with the local regulations of Qatar University and ethical measures in the handling of the specimens were adopted, in accordance with the Guidelines for the treatment of animals in behavioral research and teaching as detailed by the Animal Care Committees of the Animal Behavior Society and the Association for the Study of Animal Behavior (https://doi.org/10.1016/j.anbehav.02/11/2019) (accessed on 4 April 2022).
Informed Consent Statement
Not applicable.
Data Availability Statement
All data is available in the paper and Supplementary Materials Section.
Acknowledgments
The authors are grateful to S. Al Saadi for her assistance in the sample preparation, M. Rafeek, M. Abdulkader and M. Pindath for their help in the experimental set up and shrimp maintenance. The authors are also indebted to Najat Hussain A. Al-Omari for her help with the imaging and would like to extend their acknowledgement to the Staff at the Environmental Science Center (ESC), Qatar University, for the support provided.
Conflicts of Interest
The authors declare no conflict of interest.
References
- Halpern, B.S.; Frazier, M.; Potapenko, J.; Casey, K.S.; Koenig, K.; Longo, C.; Lowndes, J.S.; Rockwood, R.C.; Selig, E.R.; Selkoe, K.A.; et al. Spatial and Temporal Changes in Cumulative Human Impacts on the World’s Ocean. Nat. Commun. 2015, 6, 7615. [Google Scholar] [CrossRef] [PubMed]
- Nogales, B.; Lanfranconi, M.P.; Piña-Villalonga, J.M.; Bosch, R. Anthropogenic Perturbations in Marine Microbial Communities. FEMS Microbiol. Rev. 2011, 35, 275–298. [Google Scholar] [CrossRef] [PubMed]
- Halpern, B.S.; Walbridge, S.; Selkoe, K.A.; Kappel, C.V.; Micheli, F.; D’Agrosa, C.; Bruno, J.F.; Casey, K.S.; Ebert, C.; Fox, H.E.; et al. A Global Map of Human Impact on Marine Ecosystems. Science 2008, 319, 948–952. [Google Scholar] [CrossRef] [PubMed]
- Sheppard, C.; Al-Husiani, M.; Al-Jamali, F.; Al-Yamani, F.; Baldwin, R.; Bishop, J.; Benzoni, F.; Dutrieux, E.; Dulvy, N.K.; Durvasula, S.R.V.; et al. The Gulf: A Young Sea in Decline. Mar. Pollut. Bull. 2010, 60, 13–38. [Google Scholar] [CrossRef]
- Freije, A.M. Heavy Metal, Trace Element and Petroleum Hydrocarbon Pollution in the Arabian Gulf: Review. J. Assoc. Arab Univ. Basic Appl. Sci. 2015, 17, 90–100. [Google Scholar] [CrossRef]
- Rushdi, A.I.; Al-Shaikh, I.; El-Mubarak, A.H.; Alnaimi, H.A.J.A.; Al-Shamary, N.; Hassan, H.M.; Assali, M.A. Characteristics and Sources of Anthropogenic and Biogenic Hydrocarbons in Sediments from the Coast of Qatar. Mar. Pollut. Bull. 2017, 124, 56–66. [Google Scholar] [CrossRef]
- Lewis, C.; Galloway, T. Reproductive Consequences of Paternal Genotoxin Exposure in Marine Invertebrates. Environ. Sci. Technol. 2009, 43, 928–933. [Google Scholar] [CrossRef]
- Bolognesi, C.; Cirillo, S. Genotoxicity Biomarkers in Aquatic Bioindicators. Curr. Zool. 2014, 60, 273–284. [Google Scholar] [CrossRef]
- Angeletti, D.; Carere, C. Monitoring the DNA of Wildlife. Comp. Ecogenotoxicol. 2014, 60, 252–254. [Google Scholar] [CrossRef][Green Version]
- Pampanin, D.M.; Brooks, S.J.; Grøsvik, B.E.; Le Goff, J.; Meier, S.; Sydnes, M.O. DNA Adducts in Marine Fish as Biological Marker of Genotoxicity in Environmental Monitoring: The Way Forward. Mar. Environ. Res. 2017, 125, 49–62. [Google Scholar] [CrossRef]
- De Mora, S.J.; Fowler, S.W.; Cassi, R.; Tolosa, I. Assessment of Organotin Contamination in Marine Sediments and Biota from the Gulf and Adjacent Region. Mar. Pollut. Bull. 2003, 46, 401–409. [Google Scholar] [CrossRef]
- Lyons, B.P.; Barber, J.L.; Rumney, H.S.; Bolam, T.P.C.; Bersuder, P.; Law, R.J.; Mason, C.; Smith, A.J.; Morris, S.; Devlin, M.J.; et al. Baseline Survey of Marine Sediments Collected from the State of Kuwait: PAHs, PCBs, Brominated Flame Retardants and Metal Contamination. Mar. Pollut. Bull. 2015, 100, 629–636. [Google Scholar] [CrossRef] [PubMed]
- Agah, H.; Leermakers, M.; Elskens, M.; Fatemi, S.M.R.; Baeyens, W. Total Mercury and Methyl Mercury Concentrations in Fish from the Persian Gulf and the Caspian Sea. Water Air Soil Pollut. 2006, 181, 95–105. [Google Scholar] [CrossRef]
- Al-Naimi, H.A.; Al-Ghouti, M.A.; Al-Shaikh, I.; Al-Yafe, M.; Al-Meer, S. Metal Distribution in Marine Sediment along the Doha Bay, Qatar. Environ. Monit. Assess. 2015, 187, 130. [Google Scholar] [CrossRef]
- Hassan, H.M.; Castillo, A.B.; Yigiterhan, O.; Elobaid, E.A.; Al-Obaidly, A.; Al-Ansari, E.; Obbard, J.P. Baseline Concentrations and Distributions of Polycyclic Aromatic Hydrocarbons in Surface Sediments from the Qatar Marine Environment. Mar. Pollut. Bull. 2018, 126, 58–62. [Google Scholar] [CrossRef]
- Sundseth, K.; Pacyna, J.M.; Pacyna, E.G.; Pirrone, N.; Thorne, R.J. Global Sources and Pathways of Mercury in the Context of Human Health. Int. J. Environ. Res. Public Health 2017, 14, 105. [Google Scholar] [CrossRef]
- Council, N.R. Toxicological Effects of Methylmercury; National Academies Press: Washington, DC, USA, 2000; ISBN 978-0-309-07140-6. [Google Scholar]
- Liu, L.; Aljathelah, N.M.; Hassan, H.; Giraldes, B.W.; Leitão, A.; Bayen, S. Targeted and Suspect Screening of Contaminants in Coastal Water and Sediment Samples in Qatar. Sci. Total Environ. 2021, 774, 145043. [Google Scholar] [CrossRef]
- Ghaeni, M.; Dami Pour, N.A.; Hosseini, M. Bioaccumulation of Polychlorinated Biphenyl (PCB), Polycyclic Aromatic Hydrocarbon (PAH), Mercury, Methyl Mercury, and Arsenic in Blue Crab Portunus Segnis from Persian Gulf. Environ. Monit. Assess. 2015, 187, 253. [Google Scholar] [CrossRef]
- European Commission. Commission Regulation (EC) No 1881/2006. Off. J. Eur. Union 2006, 2006, 5–24. [Google Scholar]
- Al-Ansari, E.; Abdel-Moati, M.A.; Yigiterhan, O.; Al-Maslamani, I.; Soliman, Y.; Rowe, G.T.; Wade, T.L.; Al-Shaikh, I.; Helmi, A.; Kuklyte, L.; et al. Mercury Accumulation in Lethrinus nebulosus from the Marine Waters of the Qatar EEZ. Mar. Pollut. Bull. 2017, 121, 143–153. [Google Scholar] [CrossRef]
- Ehrenstein, C.; Shu, P.; Wickenheiser, E.; Hirner, A.; Dolfen, M.; Emons, H.; Obe, G. Methyl Mercury Uptake and Associations with the Induction of Chromosomal Aberrations in Chinese Hamster Ovary (CHO) Cells. Chem. Biol. Interact. 2002, 141, 259–274. [Google Scholar] [CrossRef]
- Rania, M.A.; Abdel, K.; Elkholy, Y.M.; Helmy, N.A.; Eltoukhy, S.E.; Kayed, H.F. Alkyl Mercury Chloride Compounds-Induced Genotoxicity in Human Blood Cultures and Corrective Role of Ascorbic Acid (Vitamin C). N. Y. Sci. J. 2011, 4, 92–104. [Google Scholar]
- Ochi, T. Methylmercury, but Not Inorganic Mercury, Causes Abnormality of Centrosome Integrity (Multiple Foci of γ-Tubulin), Multipolar Spindles and Multinucleated Cells without Microtubule Disruption in Cultured Chinese Hamster V79 Cells. Toxicology 2002, 175, 111–121. [Google Scholar] [CrossRef]
- Betti, C.; Nigro, M. The Comet Assay for the Evaluation of the Genetic Hazard of Pollutants in Cetaceans: Preliminary Results on the Genotoxic Effects of Methyl-Mercury on the Bottle-Nosed Dolphin (Tursiops Truncatus) Lymphocytes in Vitro. Mar. Pollut. Bull. 1996, 32, 545–548. [Google Scholar] [CrossRef]
- Nagarani, N.; Kumaraguru, A.K. Influence of Marine Alga against Mercury-Induced Biochemical Changes, Structural Destabilization, and Genotoxicity in Marine Tiger Fish, Therapon Jarbua. Toxicol. Environ. Chem. 2012, 94, 1383–1400. [Google Scholar] [CrossRef]
- Leitão, A.; Al-Shaikh, I.; Hassan, H.; Ben Hamadou, R.; Bach, S. First Genotoxicity Assessment of Marine Environment in Qatar Using the Local Pearl Oyster Pinctada Radiata. Reg. Stud. Mar. Sci. 2017, 11, 23–31. [Google Scholar] [CrossRef]
- Davis, A. Pollution Studies with Marine Plankton: Part II. Heavy Metals. Adv. Mar. Biol. 1979, 15, 381–508. [Google Scholar] [CrossRef]
- Bolognesi, C.; Landini, E.; Roggieri, P.; Fabbri, R.; Viarengo, A. Genotoxicity Biomarkers in the Assessment of Heavy Metal Effects in Mussels: Experimental Studies. Environ. Mol. Mutagen. 1999, 33, 287–292. [Google Scholar] [CrossRef]
- Dallas, L.J.; Cheung, V.V.; Fisher, A.S.; Jha, A.N. Relative Sensitivity of Two Marine Bivalves for Detection of Genotoxic and Cytotoxic Effects: A Field Assessment in the Tamar Estuary, South West England. Environ. Monit. Assess. 2013, 185, 3397–3412. [Google Scholar] [CrossRef]
- Jakimska, A.; Konieczka, P.; Skóra, K.; Namieśnik, J. Bioaccumulation of Metals in Tissues of Marine Animals, Part I: The Role and Impact of Heavy Metals on Organisms. Polish J. Environ. Stud. 2011, 20, 1117–1125. [Google Scholar]
- Madden, E.F. The Role of Combined Metal Interactions in Metal Carcinogenesis: A Review. Rev. Environ. Health 2003, 18, 91–109. [Google Scholar] [CrossRef] [PubMed]
- Voua Otomo, P.; Reinecke, S.A.; Reinecke, A.J. Using the Comet Assay to Assess the Combined and Separate Genotoxic Effects of Cd and Zn in Eisenia Andrei (Oligochaeta) at Different Temperatures. Bull. Environ. Contam. Toxicol. 2014, 92, 285–288. [Google Scholar] [CrossRef] [PubMed]
- Lucas, C.H.; Horton, A.A. Short-Term Effects of the Heavy Metals, Silver and Copper, on Polyps of the Common Jellyfish, Aurelia Aurita. J. Exp. Mar. Bio. Ecol. 2014, 461, 154–161. [Google Scholar] [CrossRef]
- Bolognesi, C.; Hayashi, M. Micronucleus Assay in Aquatic Animals. Mutagenesis 2011, 26, 205–213. [Google Scholar] [CrossRef] [PubMed]
- Cross, I.; Rebordinos, L. Effect of Marine Contamination on the Genetic Population Structure of the Bivalve Crassostrea angulata. Ciencias Mar. 2003, 29, 239–250. [Google Scholar] [CrossRef][Green Version]
- Piló, D.; Carvalho, S.; Pereira, P.; Gaspar, M.B.; Leitão, A. Is Metal Contamination Responsible for Increasing Aneuploidy Levels in the Manila Clam Ruditapes Philippinarum? Sci. Total Environ. 2017, 577, 340–348. [Google Scholar] [CrossRef]
- Barsiene, J. Genotoxic Impacts in Klaipeda Marine Port and Bŭtinge Oil Terminal Areas (Baltic Sea). Mar. Environ. Res. 2002, 54, 475–479. [Google Scholar] [CrossRef]
- Omae, I. Organotin Antifouling Paints and Their Alternatives. Appl. Organomet. Chem. 2003, 17, 81–105. [Google Scholar] [CrossRef]
- Stewart, C.; De Mora, S.J. A Review of the Degradation of Tri (n—Butyl) Tin in the Marine Environment. Environ. Technol. 1990, 11, 565–570. [Google Scholar] [CrossRef]
- Michel, P.; Averty, B. Contamination of French Coastal Waters by Organotin Compounds: 1997 Update. Mar. Pollut. Bull. 1999, 38, 268–275. [Google Scholar] [CrossRef]
- Anderson, R.S.; Brubacher, L.L.; Calvo, L.M.; Burreson, E.M.; Unger, M.A. Effect of in Vitro Exposure to Tributyltin on Generation of Oxygen Metabolites by Oyster Hemocytes. Environ. Res. 1997, 74, 84–90. [Google Scholar] [CrossRef] [PubMed]
- Cookson, M.R.; Slamon, N.D.; Pentreath, V.W. Glutathione Modifies the Toxicity of Triethyltin and Trimethyltin in C6 Glioma Cells. Arch. Toxicol. 1998, 72, 197–202. [Google Scholar] [CrossRef] [PubMed]
- Ferreira, M.; Blanco, L.; Garrido, A.; Vieites, J.M.; Cabado, A.G.; Garrido-Maestu, A. In Vitro Approaches to Evaluate Toxicity Induced by Organotin Compounds Tributyltin (TBT), Dibutyltin (DBT), and Monobutyltin (MBT) in Neuroblastoma Cells. Agric. Food Chem. 2013, 61, 4195–4203. [Google Scholar] [CrossRef] [PubMed]
- Hagger, J.A.; Fisher, A.S.; Hill, S.J.; Depledge, M.H.; Jha, A.N. Genotoxic, Cytotoxic and Ontogenetic Effects of Tri-n-Butyltin on the Marine Worm, Platynereis Dumerilii (Polychaeta: Nereidae). Aquat. Toxicol. 2002, 57, 243–255. [Google Scholar] [CrossRef]
- Dopp, E.; Hartmann, L.M.; Florea, A.-M.; Rettenmeier, A.W.; Hirner, A.V. Environmental Distribution, Analysis, and Toxicity of Organometal(Loid) Compounds. Crit. Rev. Toxicol. 2004, 34, 301–333. [Google Scholar] [CrossRef]
- Florea, A.-M.; Büsselberg, D. Occurrence, Use and Potential Toxic Effects of Metals and Metal Compounds. Biometals 2006, 19, 419–427. [Google Scholar] [CrossRef]
- Micael, J.; Reis-Henriques, M.A.; Carvalho, A.P.; Santos, M.M. Genotoxic Effects of Binary Mixtures of Xenoandrogens (Tributyltin, Triphenyltin) and a Xenoestrogen (Ethinylestradiol) in a Partial Life-Cycle Test with Zebrafish (Danio Rerio). Environ. Int. 2007, 33, 1035–1039. [Google Scholar] [CrossRef]
- Hook, S.E.; Gallagher, E.P.; Batley, G.E. The Role of Biomarkers in the Assessment of Aquatic Ecosystem Health. Integr. Environ. Assess. Manag. 2014, 10, 327–341. [Google Scholar] [CrossRef]
- Khatir, Z.; Leitao-BenHamadou, A.; Lyons, B.P. The Biological Effects of Chemical Contaminants in the Arabian/Persian Gulf: A Review. Reg. Stud. Mar. Sci. Stud Mar Sci 2020, 33, 100930. [Google Scholar] [CrossRef]
- Baršiene, J.; Rybakovas, A.; Garnaga, G.; Andreikenaite, L. Environmental Genotoxicity and Cytotoxicity Studies in Mussels before and after an Oil Spill at the Marine Oil Terminal in the Baltic Sea. Environ. Monit. Assess. 2012, 184, 2067–2078. [Google Scholar] [CrossRef]
- Barranger, A.; Akcha, F.; Rouxel, J.; Brizard, R.; Maurouard, E.; Pallud, M.; Menard, D.; Tapie, N.; Budzinski, H.; Burgeot, T.; et al. Study of Genetic Damage in the Japanese Oyster Induced by an Environmentally-Relevant Exposure to Diuron: Evidence of Vertical Transmission of DNA Damage. Aquat. Toxicol. 2014, 146, 93–104. [Google Scholar] [CrossRef] [PubMed]
- Bouilly, K.; Leitão, A.; McCombie, H.; Lapègue, S. Impact of Atrazine on Aneuploidy in Pacific Oysters, Crassostrea Gigas. Environ. Toxicol. Chem. 2003, 22, 219–223. [Google Scholar] [CrossRef] [PubMed]
- Leitão, A.; Boudry, P.; Thiriot-Quiévreux, C. Negative Correlation between Aneuploidy and Growth in the Pacific Oyster, Crassostrea Gigas: Ten Years of Evidence. Aquaculture 2001, 193, 39–48. [Google Scholar] [CrossRef]
- Bouilly, K.; McCombie, H.; Leitão, A.; Lapègue, S. Persistence of Atrazine Impact on Aneuploidy in Pacific Oysters, Crassostrea Gigas. Mar. Biol. 2004, 145, 699–705. [Google Scholar] [CrossRef]
- Baršienė, J.; Andreikėnaitė, L.; Garnaga, G.; Rybakovas, A. Genotoxic and Cytotoxic Effects in the Bivalve Mollusks Macoma Balthica and Mytilus Edulis from the Baltic Sea. Ekologija 2008, 54, 44–50. [Google Scholar] [CrossRef]
- Slingenberg, A.; Braat, L.; Van Der Windt, H.; Rademaekers, K.; Eichler, L.; Turner, K. Study on Understanding the Causes of Biodiversity Loss and the Policy Assessment Framework. Framework 2009, 54, 1–206. [Google Scholar]
- Frenzilli, G.; Martorell-Ribera, J.; Bernardeschi, M.; Scarcelli, V.; Jönsson, E.; Diano, N.; Moggio, M.; Guidi, P.; Sturve, J.; Asker, N. Bisphenol A and Bisphenol S Induce Endocrine and Chromosomal Alterations in Brown Trout. Front. Endocrinol. (Lausanne) 2021, 12, 161. [Google Scholar] [CrossRef]
- Hassan, H.; Leitão, A. Karyotype of Palaemon Khori (Decapoda: Palaemonidae). Vie milieu Life Environ. 2015, 65, 151–155. [Google Scholar]
- Thiriot-Quieveux, C.; Ayraud, N. Les Caryotypes de Quelques Especes de Bivalves et de Gasteropodes Marins. Mar. Biol. 1982, 70, 165–172. [Google Scholar] [CrossRef]
- R Core Team. R: A Language and Environment for Statistical Computing; R Core Team: Vienna, Austria, 2020. [Google Scholar]
- Therneau, T. A Package for Survival Analysis in R. In R Package Version 3.2-3. Available online: https://CRAN.R-Project.Org/Package=survival (accessed on 4 April 2022).
- Therneau, T.; Grambsch, P. Modeling Survival Data: Extending the Cox Model; Springer: New York, NY, USA, 2000. [Google Scholar]
- Kassambara, A.; Kosinski, M.; Biecek, P.; Fabian, S. Package ‘Survminer’. Drawing Survival Curves Using ‘Ggplot2′. In R Package Version 0.3.1. Available online: https://CRAN.R-Project.Org/Package=survminer2014 (accessed on 4 April 2022).
- Osman, A.G.M.; Abuel-Fadl, K.Y.; Kloas, W. In Situ Evaluation of the Genotoxic Potential of the River Nile: II. Detection of DNA Strand-Breakage and Apoptosis in Oreochromis Niloticus Niloticus (Linnaeus, 1758) and Clarias Gariepinus (Burchell, 1822). Mutat. Res. Genet. Toxicol. Environ. Mutagen. 2012, 747, 14–21. [Google Scholar] [CrossRef]
- Abdel-Shafy, H.I.; Mansour, M.S.M. A Review on Polycyclic Aromatic Hydrocarbons: Source, Environmental Impact, Effect on Human Health and Remediation. Egypt. J. Pet. 2016, 25, 107–123. [Google Scholar] [CrossRef]
- Rybakovas, A.; Barsiene, J.; Lang, T. Environmental Genotoxicity and Cytotoxicity in the Offshore Zones of the Baltic and the North Seas. Mar. Environ. Res. 2009, 68, 246–256. [Google Scholar] [CrossRef] [PubMed]
- Vanegas, C.; Espina, S.; Botello, A.; Villanueva, S. Acute Toxicity and Synergism of Cd and Zn in the White Shrimp Penaeus Setiferus Juveniles. Bull. Environ. Contam. Toxicol. 1997, 58, 87–92. [Google Scholar] [CrossRef] [PubMed]
- Al Naggar, Y.; Khalil, M.; Ghorab, M. Environmental Pollution by Heavy Metals in the Aquatic Ecosystems of Egypt. Open Access J. Toxicol. 2018, 3, 555603. [Google Scholar] [CrossRef]
- Wu, J.; Chen, H. Effects of Cadmium and Zinc on Oxigen Consumption, Ammonium Excretion, and Osmoregulation on White Shrimp (Litopenaeus Vannamei). Chemosphere 2004, 57, 1591–1598. [Google Scholar] [CrossRef]
- Benoit, J.M.; Gilmour, C.C.; Heyes, A.; Mason, R.P.; Miller, C.L. Biogeochemistry of Environmentally Important Trace Elements. Cai, Y., Braids, O.C., Eds.; ACS Symposium Series; American Chemical Society: Washington, DC, USA, 2002; Volume 835, ISBN 0-8412-3805-7. [Google Scholar]
- Ballesteros, M.; Rivetti, N.; Morillo, D.; Bertrand, L.; Amé, M.; Bistoni, M. Multi-Biomarker Responses in Fish (Jenynsia Multidentata) to Assess the Impact of Pollution in Rivers with Mixtures of Environmetal Contaminants. Sci. Total Environ. 2017, 595, 711–722. [Google Scholar] [CrossRef]
- Soegianto, A.; Charmantier-Daures, M.; Trilles, J.P.; Charmantier, G. Impact of Cadmium on the Structure of Gills and Epipodites of the Shrimp Penaeus Japonicus (Crustacea: Decapoda). Aquat. Living Resour. 1999, 12, 57–70. [Google Scholar] [CrossRef]
- Barbieri, E. Effects of Zinc and Cadmium on Oxygen Consumption and Ammonium Excretion in Pink Shrimp (Farfantepenaeus Paulensis, Pérez-Farfante, 1967, Crustacea). Ecotoxicology 2009, 18, 312–318. [Google Scholar] [CrossRef]
- Samuelsen, O.B.; Parsons, A.E.; Agnal, A.L.; Tjensvoll, T.; Lunestad, B.T.; Hannisdal, R. Mortality in the Rockpool Shrimp Palaemon Elegans Following Long-Term Exposure to Low Doses of the Anti-Parasitic Drug Teflubenzuron. Aquac. Environ. Interact. 2020, 12, 23–29. [Google Scholar] [CrossRef]
- Mohan, C.V.; Gupta, T.R.C.; Shetty, H.; Menon, N. Combined Toxicity of Mercury and Cadmium to the Tropical Green Mussel Perna Viridis. Dis. Aquat. Organ. 1986, 2, 65–72. [Google Scholar] [CrossRef]
- Barata, C.; Baird, D.J.; Nogueira, A.J.A.; Soares, A.M.V.M.; Riva, M.C. Toxicity of Binary Mixtures of Metals and Pyrethroid Insecticides to Daphnia Magna Straus. Implications for Multi-Substance Risks Assessment. Aquat. Toxicol. 2006, 78, 1–14. [Google Scholar] [CrossRef] [PubMed]
- Wah Chu, K.; Chow, K.L. Synergistic Toxicity of Multiple Heavy Metals Is Revealed by a Biological Assay Using a Nematode and Its Transgenic Derivative. Aquat. Toxicol. 2002, 61, 53–64. [Google Scholar] [CrossRef]
- Verslycke, T.; Vangheluwe, M.; Heijerick, D.; De Schamphelaere, K.; Van Sprang, P.; Janssen, C.R. The Toxicity of Metal Mixtures to the Estuarine Mysid Neomysis Integer (Crustacea: Mysidacea) under Changing Salinity. Aquat. Toxicol. 2003, 64, 307–315. [Google Scholar] [CrossRef]
- Thiriot-Quievreux, C. ‘Etude de l’aneuploïdie’ dans Differents Naissains d’Ostreidae Bivalvia; Springer: New York, NY, USA, 1986. [Google Scholar]
- Martinez-Exposito, M.; Martinez-Lage, A.; Pasantes, J.; Mendez, J. A Preliminary Study of Aneuploidy in Natural Populations in the Genus Mytilus. Cuad. Área Cienc. Mariñas Semin. Estud. Galegos 1992, 6, 49–55. [Google Scholar]
- Li, X.; Havenhand, J. Karyotype, Nucleolus Organiser Regions and Constitutive Heterochromatin in Ostrea Angasi (Molluscae: Bivalvia): Evidence of Taxonomic Relationships within the Ostreidae. Mar. Biol. 1997, 127, 443–448. [Google Scholar] [CrossRef]
- Chiarelli, R.; Roccheri, M.C. Marine Invertebrates as Bioindicators of Heavy Metal Pollution. Open J. Met. 2014, 4, 93–106. [Google Scholar] [CrossRef]
Publisher’s Note: MDPI stays neutral with regard to jurisdictional claims in published maps and institutional affiliations. |
© 2022 by the authors. Licensee MDPI, Basel, Switzerland. This article is an open access article distributed under the terms and conditions of the Creative Commons Attribution (CC BY) license (https://creativecommons.org/licenses/by/4.0/).