Abstract
Large ships adopt a central fresh water-cooling system that indirectly cools waste heat with seawater to discharge the ship′s waste heat out of the ship. Such a central fresh water-cooling system is essential for future electric powered ships. Since 2010, shipping companies have attempted to save energy by applying variable-speed cooling pumps to the central FW cooling system, but due to the minimum-required discharge pressure of the pump, they have applied the existing 3-way valve system alongside. However, since the control systems of the variable-speed cooling pump and the 3-way valve are controlled by the same output variable, the two control systems collide during operation. Therefore, for efficient energy-saving control, it is important to accurately model the central fresh water-cooling system and find the optimal control method on this basis. In this study, a ship’s central cooling system was mathematically modeled and verified by comparing it with the actual ship′s operation data. A control solution method to effectively save energy for the central cooling system was proposed
1. Introduction
1.1. Background
In the 21st century, oil prices have been steadily rising [1,2,3]. Since oil costs account for 50–70% of the total operating costs [3,4,5,6], shipping companies are attempting to reduce oil use [7,8] with efforts that include low-speed operation [9,10], hull modification [11,12], ship waste oil recovery [13], and optimal route selection, and studies on energy saving in ships actively continue [14,15].
As about 70% of the power energy load of a ship is used for electric energy, the most efficient way to save energy is to reduce the electric load [16,17,18]. The seawater cooling pump consumes more unnecessary power, because the motor′s capacity is selected with a surplus capacity of about 30% of the required capacity in consideration of pipe loss due to aging [17,19,20,21].
Shipping companies have adopted a central fresh water (FW) cooling system to minimize the harmful effects of seawater in ship pipeline systems, and improve system reliability. The central FW cooling system typically controls a 3-way valve only to keep fresh water temperature constant, and adjusts the flow rate of fresh water, bypassing the heat exchanger according to the fresh water outlet temperature [22,23,24].
However, the only 3-way valve applied central FW cooling system has inefficient operation. As seawater temperature decreases, or waste heat load in the ship decreases, fresh water flow into the heat exchanger decreases by means of the 3-way valve openings, so heat load on the heat exchanger decreases [25]. Fresh water bypasses the heat exchanger, the cooling efficiency of the heat exchanger decreases, and the power of the constant speed seawater pump, which is the cooling power, is wasted. Shipping companies apply variable-speed control devices to seawater cooling pumps to reduce such power wastage to save energy [26,27,28].
The central FW cooling system is applied via a VFD motor into the seawater pump, 3-way valve control system, and variable-speed control system. The seawater pump operation range on its inverter is from 33% to 100%, which is 60 Hz as rated. Input frequency is changed by the PI controller, of which the control reference is the 3-way valve outlet temperature. Considering the seawater pump output pressure, the minimal input frequency is set at 42% of the rated frequency. The openness of the 3-way valve is controlled by another PI controller, of which the control reference is the fresh water outlet temperature as well. Both independent controllers are designed to be controlled by the fresh water outlet temperature of the central FW cooling system [18,29].
The energy-saving control methods have already been studied and are much in use [20,24,30,31]. Moreover, the energy-efficient evaluating method for the adopted central cooling system has been studied in [32,33,34]. Giannoutsos, S.V. and Manias, S.N. [35] studied a self-tuned PID controller for seawater pumps. A study on problems occurring in the actual central cooling water system and an efficient control solution was first studied by Lee [36]. However, in the Lee study, as a new controller, the feed-forward controller was added. There is an issue that makes its acceptance, from the perspective of ship makers and ship owners, difficult. So, there is a need for a control solution to improve the control system in an easily applicable way, while simplifying the control system. Therefore, the purpose of this study is to propose a control method for energy saving that is easy to apply, inexpensive, stable, and efficient.
From the viewpoint of the control system, the two controllers influence each other in the central cooling system. Therefore, it is important to design the two controllers harmoniously. For an out of harmonized control case, two independent controllers occasionally lead to a situation in which the variable-speed seawater cooling pump operates at full load, and the 3-way valve operates at its minimum, as occurred in the Korea Maritime University training ship ‘Hannara’. This inefficient case is shown through a simulation.
Further, the objective of this study is to propose a control method for energy saving that is easy to apply and modify, and is inexpensive, reliable, and efficient. Through this study, the state space modeling and simulation of the central cooling water system is based on the manufacturer′s FAT (Factory Acceptance Test) of the training ship ‘Hanara’. The simulation with the model shows the collided control problem of the typical two controller system. To avoid the control collision, we present a control solution in which the seawater pump control system′s feedback point is changed from the existing 3-way valve outlet to 3-way valve inlet. The simulation utilizes MATLAB′s SIMULINK and compares the energy consumption of the current central cooling water system and the system to which the proposed control solution is applied.
1.2. Research Content and Composition
The ship′s main engine system, power generation system, and other auxiliary mechanical systems have independent cooling systems. Low-temperature fresh water is used as a coolant for each of these cooling systems. This fresh water is re-cooled by seawater in the central FW cooling system and then recirculated to each cooling system.
As shown in Figure 1, the central FW cooling system consists of a heat exchanger, a seawater pump, and a 3-way valve.
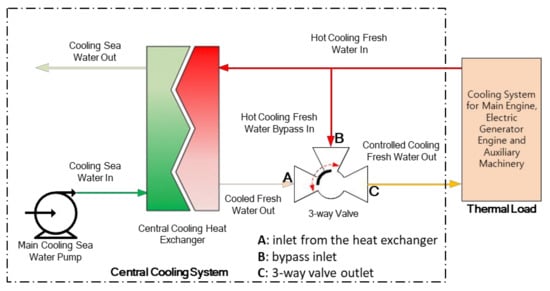
Figure 1.
Central FW cooling system.
First, the fresh water cools the various systems of the ship and raises the temperature.
The A part of this fresh water flows into the central cooling heat exchanger to exchange heat with seawater, and the rest is bypassed.
As shown in Figure 1, the cooled fresh water flows into side A of the 3-way valve, and the remaining bypassed fresh water flows directly into side B of the 3-way valve. On side C of the 3-way valve, the cooled and uncooled fresh water is combined and returned to the ship′s cooling system.
Meanwhile, seawater is supplied to the central cooling heat exchanger using the main seawater pump. The main seawater pump is rotated by a variable-speed motor driven by an inverter.
The inverter changes the frequency of the input power supplied to the seawater pump motor. This can change the seawater flow rate to the central cooling heat exchanger [37,38,39].
1.3. Actual Vessel Composition
The various parameters used in the study refer to the specifications of each piece of equipment of the central FW cooling system installed on the actual ship. For the comparative verification data, the power frequency of the variable-speed seawater cooling pump in operation, the temperature at the outlet of the heat exchanger, and actual operation data, we referred to [40].
The composition of the variable-speed seawater pump of the actual ship is shown in Figure 2.
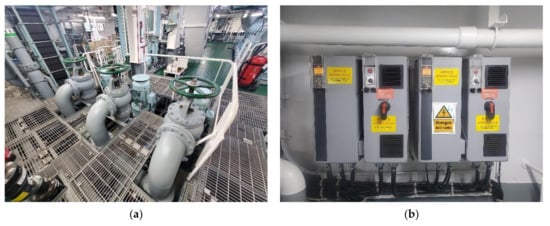
Figure 2.
(a) Seawater pumps (3 units in total); (b) variable-speed devices.
Three variable-speed seawater pumps were installed, each with a rated capacity of 400 m3/h. The variable-speed seawater pumps were designed so that each pump would take 50% thermal load. The inverter device for each variable-speed motor and an integrated controller were installed, and data information on the frequency change of the seawater cooling pump, fresh water temperature change, and seawater temperature was collected from the controller.
The fresh water heat exchanger of the actual ship is shown in Figure 3.
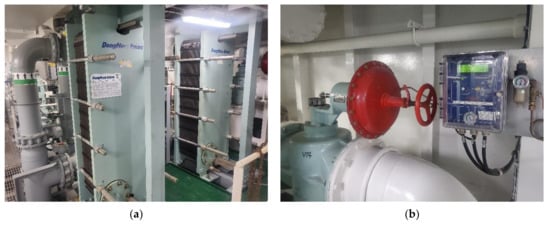
Figure 3.
(a) Central heat exchangers (2 units in total); (b) 3-way valve and controller.
A total of two plate coolers were installed, each with a heat transfer area of 90.4 m2 and a heat transfer efficiency of 450.6 kJ/m2 min °C (90% of specification in the data sheet). A plate heat exchanger was designed in the charged 50% thermal load. The heat exchanger was equipped with a controller and is shown in Figure 3. The central FW cooling system consisted of a heat exchanger, a seawater pump, and a 3-way valve for controlling the fresh water temperature, and the data on the opening degree of the 3-way valve and each temperature were recorded over time.
Table 1 shows the operational record of training ship Hannara [41]. Operational data are from the ship′s alarm and monitoring system (AMS) in the entry and departure exit section. The fresh water and seawater inlet temperatures were collected while the seawater pump was running at 60 Hz, and the 3-way valve controller reference temperature was set at 36 °C

Table 1.
Record of central FW cooling system in actual ship operation.
1.4. Research Procedures
This study, first, obtained a low-dimensional state space model, based on the operation data of the training ship, in SIMULINK of MATLAB, and simulated it. The validity of the modeling was verified by comparing the results with the training ship′s operation data.
Second, the input change of fresh water temperature was given to the simulated central cooling water system. The simulation confirmed what problems occur due to the collision of the two control systems in the existing ship’s central cooling water system.
Third, we proposed a control solution method to solve this problem and prove the effectiveness of the energy saving effect through simulation results.
2. System Modeling
2.1. Heat Exchanger Modeling
The heat exchanger of the ship′s central FW cooling system is a plate-type heat exchanger that exchanges heat between fluid and fluid. If the plate heat exchanger is simplified, it can be represented as shown in Figure 4. Heat exchanger efficiency as per the flow rate variation is not greatly affected by system status. This was ignored for the modeling. And Table 2 shows the symbols used in the modeling equations.
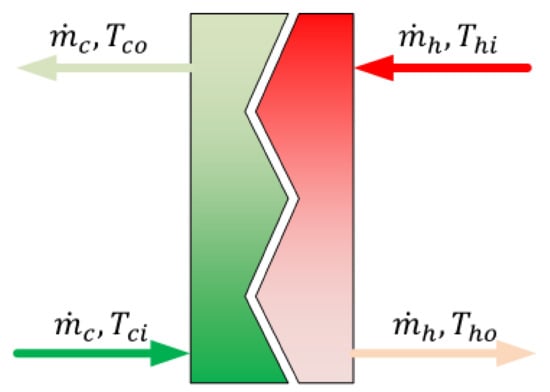
Figure 4.
Simplified plate-type heat exchanger.
Table 2.
Symbols.
Here, is the seawater input flow rate and temperature, and is the seawater outlet temperature, while is the fresh water input flow rate and temperature and is the fresh water outlet temperature that has passed through the heat exchanger.
The heat transfer rate from the fresh water side to the seawater side can be expressed as Equation (1) [42].
is the overall heat transfer coefficient of the heat exchanger, and is the heat transfer area of the heat exchanger. Assuming that volume and density are constant, in terms of energy balance, the amount of energy change on the fresh water side and the seawater side is the same as in Equations (2) and (3) [43].
Note that and are the mass of fresh water and seawater present inside the heat exchanger, respectively, while and are the specific heats of fresh water and seawater. Considering the density, and ignoring the temperature change in Equation (2), the masses of fresh water and seawater were and . Equations (2) and (3) above can be rewritten as Equations (4) and (5) [44]:
where and are the density of fresh water and seawater, and and are the flow rates of fresh water and seawater.
2.2. Seawater Pump Modeling
A centrifugal pump was used as the seawater pump. As shown Figure 5, the flow rate discharged by the seawater pump was proportional to rotational speed (rpm) of the pump [42,45].
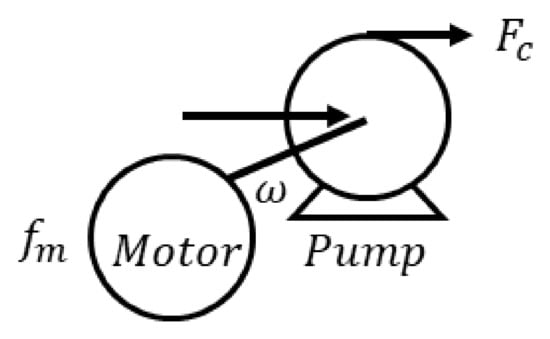
Figure 5.
Motor and seawater pump.
If is the flow rate when the pump rotates once, the pump discharge flow rate can be simplified as Equation (6):
Since the seawater pump was directly connected to the motor, the seawater flow rate changed according to the rotational speed of the motor. In the case of an induction motor, rotational speed is determined by input frequency Hz and number of poles of the motor. Since number of poles of the motor is fixed, rotational speed of the motor is determined by input frequency and can be written as Equation (7).
The seawater pump system was simply assumed to be a primary system.
In the flow system of the seawater pump, fluid capacitance was ignored among , which was the time constant, and only fluid flow resistance was left. The change amount of flow rate was equal to the difference between output flow rate changed from the output flow rate in steady state during time. The output flow rate in steady state can be obtained from Equation (7). This formula is summarized as Equation (8):
2.3. 3-Way Valve Modeling
The 3-way valve is shown in Figure 6. The actual valve flow rate was not proportional as valve opening was changed. However, in order to develop controller modeling, the valve flow rate was treated as a linearized operation at operating point.
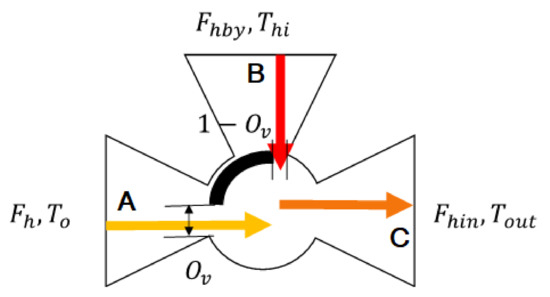
Figure 6.
3-way valve (installed downstream).
The 3-way valve was installed at end of the central cooling heat exchanger. Since the total fresh water flow rate input to the central FW cooling system and the fresh water output flow rate were the same in the end, they could be assumed to be the same as the one installed in front of the heat exchanger.
Figure 7 shows the 3-way valve installed in front of the heat exchanger.
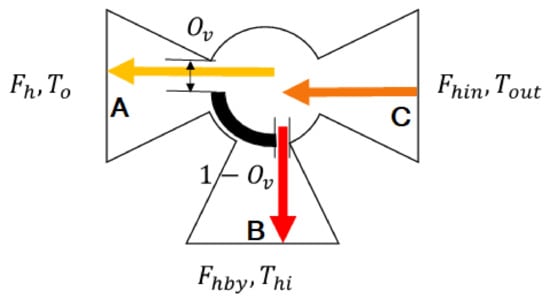
Figure 7.
3-way valve (installed upstream).
In the 3-way valve, the flow rate and temperature of fresh water bypassing the heat exchanger were and , and the flow rate and temperature of fresh water passing through the heat exchanger were and .
represents the opening degree of the 3-way valve and has a value in the range of . When is 0, the valve is completely closed, and the flow rate to the cooler becomes 0; when is 1, the valve is fully open, and the flow rate to the cooler becomes maximum.
In other words, the fresh water flow passing through heat exchanger is proportional to valve opening degree at input fresh water flow . Conversely, the flow rate of fresh water passing through heat exchanger is proportional to the closed opening degree of valve at .
Then, the fresh water flow rate change passing to heat exchanger is equal to the difference between steady-state fresh water flow rate and output fresh water flow rate during time.
In the flow system, flow resistance and capacitance are dynamic time constants of a 3-way valve and can be expressed as Equation (9) [45,46].
Since fresh water flow rate from the heat exchanger in a steady state was proportional to the 3-way valve opening degree at the total input fresh water flow rate, it can be expressed as Equation (10).
Therefore, if the dynamic state equation of flow rate of fresh water flowing to the heat exchanger through 3-way valve is expressed, Equations (9) and (10) can be arranged as Equation (11).
Conversely, the dynamic state equation of the fresh water flow rate that bypasses heat exchanger applied instead of and instead of in Equation (11). Then, it can be written as Equation (12).
On the other hand, Figure 6 shows that the change in the amount of heat at the outlet side of the 3-way valve is equal to the sum the change in the amount of heat of fresh water cooled through central cooling heat exchanger and the change in the amount of heat of fresh water bypassing the central cooling heat exchanger during time.
In Equation (13), is the rate of change in mass of fresh water at the outlet side of the 3-way valve.
is the mass of fresh water inside the 3-way valve, which can be converted into the product of volume and density, so Equation (13) is summarized as Equation (14).
2.4. Linearization Model at the Operating Point
Equations (4), (5), (8), (11), (12) and (14), which modeled the heat exchanger in Section 2.1, the seawater pump in Section 2.2, and the 3-way valve in Section 2.3, are as follows.
In the above equation, fresh water temperature and seawater temperature are measurable disturbances , and seawater pump motor power frequency and 3-way valve opening degree which are the control input, are the input variables of the central FW cooling system.
The flow rate of high-temperature fresh water through heat exchanger , the flow rate of fresh water bypassing heat exchanger , flow rate of seawater flow into the heat exchanger , the temperature of seawater-cooled fresh water through heat exchanger , the temperature of seawater heated through heat exchanger , and the outlet temperature of the 3-way valve , were set as the output variables and state variables.
Summarizing this, Equations (21) and (22) are the same.
If these equations were linearized by partial differentiation at the operating point, system matrix could be obtained.
Lastly, linearized at the operating point for the central FW cooling system, system matrix , input matrix , output matrix , and forward path matrix are expressed in Equations (23)–(26), respectively.
The used parameters in the actual ship′s central FW cooling system are shown in Table 3.
Table 3.
Parameters of central cooling system.
During normal operation, if input seawater temperature is 10 °C, the input fresh water temperature is 39 °C, the pump motor power input frequency is 60 Hz, and the 3-way valve opening degree is 0.95, system matrix A and input matrix B are expressed by Equations (27) and (28).
3. Simulation
3.1. Simulation Configuration for Steady State
Using MATLAB and Table 1 operational data, a simulation system was configured, as shown in Figure 8.
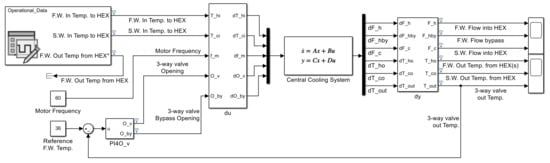
Figure 8.
Configuration of simulation with ship operational data.
The conditions and methods of the simulation were as follows.
When the seawater pump operates at 60 Hz in an actual ship, the entered fresh water temperature and seawater temperature are used.
The input frequency of the seawater pump was fixed at 60 Hz.
The outlet temperature of the central FW cooling system was controlled by the 3-way valve and PI controller, and the target value was set to 36 °C. A PI controller was used for simulation, so that the 3-way valve positional data were recorded at actual operation.
Actual operational data were sequentially input 12 times every 5 min.
The fresh water outlet temperature of the heat exchanger was obtained through simulation and actual fresh water outlet temperature of the heat exchanger were compared and verified according to operating conditions.
3.2. Simulation Results
Simulation results are shown in Figure 9, Figure 10, Figure 11 and Figure 12. Figure 9 shows the flow rate change for fresh water flow into the heat exchanger, bypass, and seawater supply into the heat exchanger. The speed of the seawater pump was fixed, as the input frequency was fixed at 60 Hz, and the seawater supplied to the heat exchanger was kept constant.
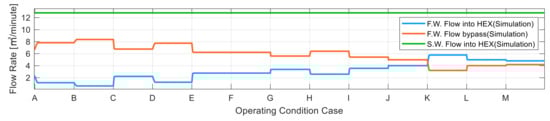
Figure 9.
Simulation FW and SW flow data.
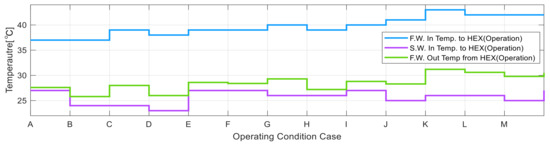
Figure 10.
Operational data graph for FW inlet/outlet and SW outlet temperature from/to HEX.
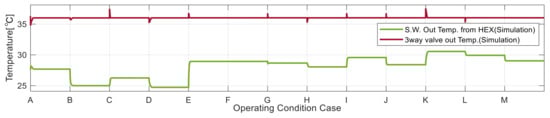
Figure 11.
Simulation graph for FW outlet temp. at 3-way valve and SW outlet temp.
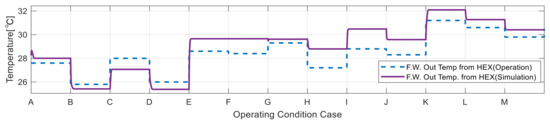
Figure 12.
Comparison of simulation and operational data for FW output temp from HEX.
Figure 10 shows the fresh water input temperature and seawater temperature input variation for the heat exchanger as per operational data.
Figure 11 shows that the 3-way valve outlet temperature was maintained well at 36 °C. On this basis, the 3-way valve openness worked well as the actual operating condition. The simulation result of the seawater outlet temperature from the heat exchanger is shown in Figure 11.
Referring to actual operating data, and as per Figure 12, the fresh water temperature input to the central FW cooling system varied from 37 to 43 °C. The dotted line is the actual fresh water outlet temperature of the ship′s heat exchanger, and the solid line is the simulation result. The two values showed a difference of about ±1 °C, and the temperature change trend of the two values was similar. This analysis shows that the modeling of the central FW cooling system worked correctly.
3.3. Simulation Configuration for Dynamic Response
The step input test for configuration is as shown in Figure 13. Conditions and methods of the simulation were as follows.
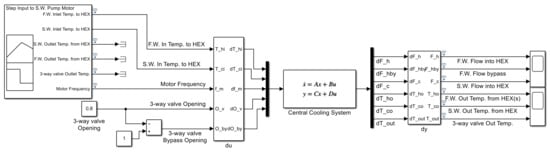
Figure 13.
Configuration for step input for simulation.
The 3-way valve opening was fixed at 80%.
The seawater pump input frequency was only step-down changed from 60 to 30 Hz.
The other input variables were kept steady.
Table 4 shows the data record for the step input to the seawater pump.
Table 4.
Record of central FW cooling system for step input to seawater pump.
Table 4 data were taken from the training ship Hannara to compare between the following simulation results and the actual responses against the step input response. The fresh water inlet temperature was changed from 4 to 43.1 °C, as per Table 4 and Figure 14 because fresh water was circulated through heat loads. Fresh water temperature eventually increased. Realistically, in an actual operating system, the fresh water return temperature to the heat loads is not able to sustain more than 38 °C for longer than 4 min. This is a limiting condition for recording data.
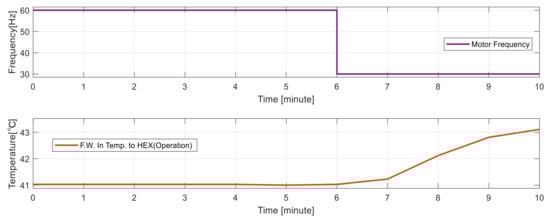
Figure 14.
Step down input to SW pump and FW inlet temperature to heat exchanger.
3.4. Simulation Result of Step Input
Figure 14 shows the simulation input data. Figure 15 compares the simulation and actual operation data. Figure 14 shows that step-down input was given to the seawater pump motor at 6 min. Figure 15 shows that, after the step-down input, the seawater and the fresh water outlet temperature from the heat exchanger followed the actual operation data. The 3-way valve outlet temperature similarly followed the actual operational data. Their temperature deviation was around 1 °C. The dynamic response trend was similar with actual operational behavior.
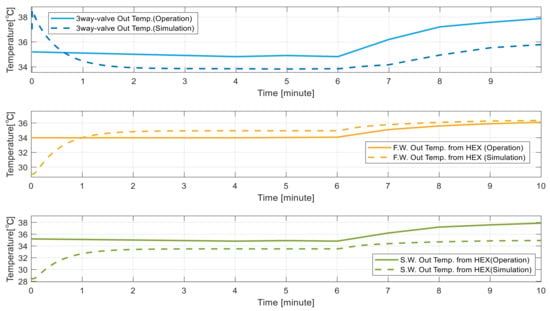
Figure 15.
Comparison of operation data and simulation results on step down input.
4. Step Input Simulation for Finding Inefficient Operation Case
4.1. Test Condition of A Typical Control Method
In order to find whether the typical central cooling system is run inefficiently, a step signal for fresh water supply temperature is applied to the modeled system. The step signal is composed of step up and step down, as shown in Figure 16. The sea water input temperature is constant at 23 °C.
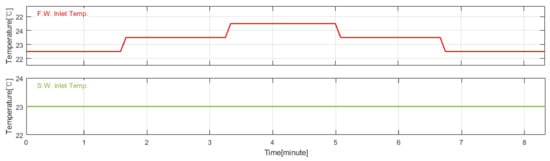
Figure 16.
Input signals.
The controller configuration is the same as described in chapter 1.3 previous. The typical two PI controllers are equipped on the system, as shown in Figure 17.
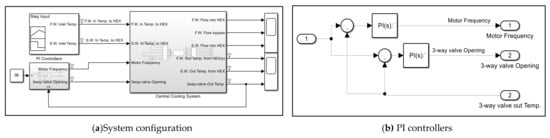
Figure 17.
Control system configuration with two PI controllers. (a) System configuration; (b) PI controllers.
The reference fresh water outlet temperature is 36 °C. The 3-way valve out temperature is the feed-back signal for both PI controllers. In other words, the two controllers get feed-back signals from the same point.
4.2. Test Result of a Typical Control Method
Figure 18 shows the result of sea water pump motor input frequency, 3-way valve openness, fresh water input temperature, and the controlled 3-way valve out fresh water temperature.
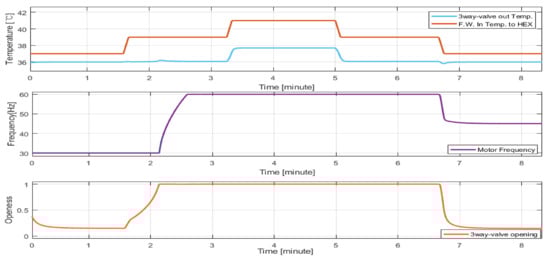
Figure 18.
Test result graph of the typical PI control method.
On the first row of the graph, from 3.2 min to 5.1 min, the 3-way valve out fresh water temperature is not maintained at 36 °C. When the 3-way valve is completely opened, the sea water pump motor input frequency is at its maximum. It would be expected that the heat load exceeds the heat exchanger capacity.
On the second row of the graph, around 6.8 min, the motor input frequency is not going down to 30 Hz as in the previous 0 ~ 1.6 min, even though the freshwater temperature is 37 °C. In other words, over 6.8 min, the sea water pump motor is run inefficiently.
4.3. A Suggested PI Control Method (Separated the Feed-Back Points)
In the previous simulation result, the issue was the sea water pump motor frequency did not decrease, even though the heat load decreased. The reason is that the 3-way valve controlled the 3-way valve outlet fresh water temperature rapidly before the sea water pump motor input frequency decreased.
So, in order to avoid the phenomenon, which was previously mentioned earlier in this paper, it is necessary to move the feed-back point for sea water pump motor input frequency control. If the feed-back point is moved to the fresh water outlet of the heat exchanger, the sea water pump is expected to only run at the required speed to cool down the heat load at the heat exchanger.
4.3.1. The Simulation Configuration for the Suggested Control Method
The PI controller for sea water pump motor gets the feed-back signal from the fresh water outlet point of the heat exchanger, as shown in Figure 19.
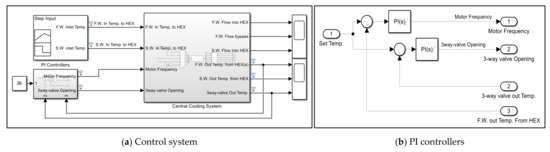
Figure 19.
Control system configuration with separated feed-back signals. (a) Control system; (b) PI controllers.
4.3.2. The Simulation Result for the Suggested Control Method
Figure 20 shows the result of the separated feed-back signals for the two PI controllers.
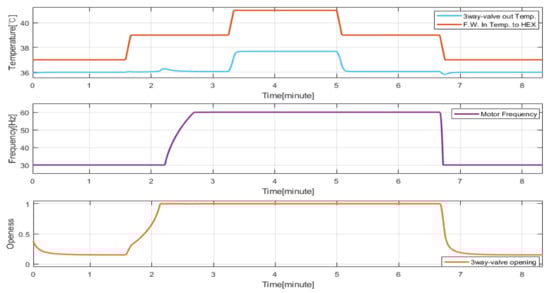
Figure 20.
The simulation result graph for separated feed-back signals.
The inefficient operation of sea water pump, wherein the motor input frequency did not decrease to 30 Hz, is not found over 6.8 min. At over 6.8 min, the motor is run at 30 Hz, which is the minimum operating frequency. The controlled fresh water temperature from the 3-way valve is acceptably maintained at 36 °C, except from 3.2 min to 5.1 min when the heat load exceeded the heat exchanger capacity.
4.4. Comparing the Typical PI Control Method and Separated Feed-Back Signal Control Method
The sea water pump is the equipment that can save the most energy. Comparing sea water pump input frequencies is a way to check if energy is saved. Figure 21 compares sea water pump motor input frequencies when using the typical PI control method and the separated feed-back signals PI control method.
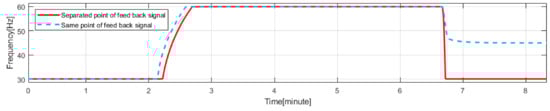
Figure 21.
Comparing S.W. pump motor input frequency.
As per Figure 21, if the central cooling system gets a step-down temperature input of fresh water, the separated feed-back signal control method operates more efficiently than using the same feed-back signal for the PI controllers.
5. Conclusions
In this study, model values were obtained that had been linearized at the operating point by modeling the ship’s central FW cooling system. A simulation was performed to verify the modeling, using the ship′s actual operational data. Steady-state and dynamic-response modeling were verified by comparing the heat exchanger fresh water outlet temperatures between the actual operational data of the ship and the simulation results. Then, through the model simulation, inefficient operation of the sea water pump was shown. Then it was proposed that feed-back signals for the sea water pump be moved to the heat exchanger outlet. This simulation result exhibited a more efficient operation than the control method, which used the same feed-back point. The proposed method is expected to be more accessible and less expensive to suit requirements for new buildings and existing ships that have already applied two controllers for the central cooling system. In terms of operation reliability, even if one controller is out of service, the central cooling system can be controlled.
In the future, using the proven modeling, we aim to design a stable controller that does not cause interference between the 3-way valve control system and the cooling sea-water pump control system. We intend to study a controller design for performance and efficient energy saving in response to irregular parameter changes, such as a decrease in the heat transfer coefficient, due to long-term operation, changes in seawater temperature, and changes in seawater flow, due to changes in the ship′s draft.
Author Contributions
Conceptualization, T.-Y.J. and C.-M.L.; methodology, T.-Y.J.; software, T.-Y.J. and C.-M.L.; investigation, J.-J.H. and C.-M.L.; writing—original draft preparation, T.-Y.J. and C.-M.L.; writing—review and editing, J.-J.H.; funding acquisition, J.-J.H.; supervision, J.-J.H.; project administration, J.-J.H. All authors have read and agreed to the published version of the manuscript.
Funding
This research received no external funding.
Institutional Review Board Statement
Not applicable.
Informed Consent Statement
Not applicable.
Data Availability Statement
This paper was written based on experiments conducted at the authors’ affiliated institutions.
Acknowledgments
Not applicable.
Conflicts of Interest
The authors declare no conflict of interest.
References
- Global 4 Ports Average Prices Singapore-Rotterdam-LA/LB Houston. Available online: https://shipandbunker.com/prices/av (accessed on 27 April 2022).
- Frischmann, T.; Hinz, O.; Skiera, B. Retailers’ use of shipping cost strategies: Free shipping or partitioned prices? Int. J. Electron. Commer. 2012, 16, 65–88. [Google Scholar] [CrossRef]
- Lee, C.-Y.; Lee, H.L.; Zhang, J. The impact of slow ocean steaming on delivery reliability and fuel consumption. Transp. Res. Part E Logist. Transp. Rev. 2015, 76, 176–190. [Google Scholar] [CrossRef]
- Lindstad, H.; Asbjørnslett, B.E.; Strømman, A.H. Reductions in greenhouse gas emissions and cost by shipping at lower speeds. Energy Policy 2011, 39, 3456–3464. [Google Scholar] [CrossRef]
- Chang, C.C.; Wang, C.-M. Evaluating the effects of speed reduce for shipping costs and CO2 emission. Transp. Res. Part D Transp. Environ. 2014, 31, 110–115. [Google Scholar] [CrossRef]
- Notteboom, T.E.; Vernimmen, B. The effect of high fuel costs on liner service configuration in container shipping. J. Transp. Geogr. 2009, 17, 325–337. [Google Scholar] [CrossRef]
- Dewan, M.H.; Yaakob, O.; Suzana, A. Barriers for adoption of energy efficiency operational measures in shipping industry. WMU J. Marit. Aff. 2018, 17, 169–193. [Google Scholar] [CrossRef]
- The Marine Environment Protection Committee. Guidelines for the Development of a Ship Energy Efficiency Management Plan (SEEMP). 2012. Available online: https://wwwcdn.imo.org/localresources/en/OurWork/Environment/Documents/213(63).pdf (accessed on 2 May 2022).
- Hou, Y.H.; Kang, K.; Liang, X. Vessel speed optimization for minimum EEOI in ice zone considering uncertainty. Ocean Eng. 2019, 188, 106240. [Google Scholar] [CrossRef]
- Hou, Y.H. Hull form uncertainty optimization design for minimum EEOI with influence of different speed perturbation types. Ocean Eng. 2017, 140, 66–72. [Google Scholar] [CrossRef]
- Cheng, X.; Feng, B.; Liu, Z.; Chang, H. Hull surface modification for ship resistance performance optimization based on Delaunay triangulation. Ocean Eng. 2018, 153, 333–344. [Google Scholar] [CrossRef]
- Abramowski, T.; Żelazny, K.; Szelangiewicz, T. Numerical analysis of influence of ship hull form modification on ship resistance and propulsion characteristics Part III Influence of hull form modification on screw propeller efficiency. Pol. Marit. Res. 2010, 17, 10–13. [Google Scholar] [CrossRef]
- Yu, Y.; Yang, C.; Li, J.; Zhu, Y.; Yan, Z.; Zhang, H. Screening of inexpensive and efficient catalyst for microwave-assisted pyrolysis of ship oil sludge. J. Anal. Appl. Pyrolysis 2020, 152, 104971. [Google Scholar] [CrossRef]
- Lützen, M.; Mikkelsen, L.L.; Jensen, S.; Rasmussen, H.B. Energy efficiency of working vessels–A framework. J. Clean. Prod. 2017, 143, 90–99. [Google Scholar] [CrossRef]
- Johnson, H.; Johansson, M.; Andersson, K. Barriers to improving energy efficiency in short sea shipping: An action research case study. J. Clean. Prod. 2014, 66, 317–327. [Google Scholar] [CrossRef]
- Lai, C.; Tsao, Y.; Tsai, C. Modeling, analysis, and realization of permanent magnet synchronous motor current vector control by MATLAB/Simulink and FPGA. Machines 2017, 5, 26. [Google Scholar] [CrossRef]
- Wang, Y.; Zhang, H.; Han, Z.; Ni, X. Optimization design of centrifugal pump flow control system based on adaptive control. Processes 2021, 9, 1538. [Google Scholar] [CrossRef]
- Dere, C.; Deniz, C. Load optimization of central cooling system pumps of a container ship for the slow steaming conditions to enhance the energy efficiency. J. Clean. Prod. 2019, 222, 206–217. [Google Scholar] [CrossRef]
- Koegler, A.F.; Evert, A.; Alt, N.S.; Schluecker, E. Parallel Operation of Centrifugal Pumps: Effects of Rotational Speed Differences due to Motor Slip. Chem. Eng. Technol. 2014, 37, 951–956. [Google Scholar] [CrossRef]
- Kim, Y.-H. A Study on Suitable Electric Energy Saving System for the Cooling System of Vessel. Master’s Thesis, Korea Maritime and Ocean University, Seoul, Korea, 2008. [Google Scholar]
- Hernandez-Solis, A.; Carlsson, F. Diagnosis of submersible centrifugal pumps: A motor current and power signature approaches. EPE J. 2010, 20, 58–64. [Google Scholar] [CrossRef]
- Qi, X.; Jiao, J.; Zheng, G. Research on optimize design method of ship sea water cooling system. In Proceedings of the 2016 13th International Computer Conference on Wavelet Active Media Technology and Information Processing (ICCWAMTIP), Chengdu, China, 16–18 December 2016; pp. 440–443. [Google Scholar]
- Theotokatos, G.; Sfakianakis, K.; Vassalos, D. Investigation of ship cooling system operation for improving energy efficiency. J. Mar. Sci. Technol. 2017, 22, 38–50. [Google Scholar] [CrossRef]
- Lee, J.-Y.; Yoo, H.-H.; Kim, Y.-H.; Oh, J.-S. A Study on the Energy Saving Method by controlling Capacity of Sea Water Pump in Central Cooling System for Vessel. J. Adv. Mar. Eng. Technol. 2007, 31, 592–598. [Google Scholar] [CrossRef]
- Deniz, C. Thermodynamic and Environmental Analysis of Low-Grade Waste Heat Recovery System for a Ship Power Plant. Int. J. Energy Sci. 2015, 5, 23–34. [Google Scholar] [CrossRef][Green Version]
- De Almeida, A.T.; Ferreira, F.J.T.E.; Both, D. Technical and Economical Considerations in the Application of Variable-Speed Drives With Electric Motor Systems. IEEE Trans. Ind. Appl. 2005, 41, 188–199. [Google Scholar] [CrossRef]
- Simpson, A.R.; Marchi, A. Evaluating the approximation of the affinity laws and improving the efficiency estimate for variable speed pumps. J. Hydraul. Eng. 2013, 139, 1314–1317. [Google Scholar] [CrossRef]
- Chantasiriwan, S. Performance of variable-speed centrifugal pump in pump system with static head. Int. J. Power Energy Syst. 2013, 33, 15–21. [Google Scholar] [CrossRef]
- Kocak, G.; Durmusoglu, Y. Energy efficiency analysis of a ship’s central cooling system using variable speed pump. J. Mar. Eng. Technol. 2018, 17, 43–51. [Google Scholar] [CrossRef]
- Qi, X.; Jiao, J.; Tang, T.; Chu, Y.; Shi, S. Study on optimize design of central cooling system. In Proceedings of the 2017 IEEE 2nd Information Technology, Networking, Electronic and Automation Control Conference (ITNEC), Chengdu, China, 15–17 December 2017; pp. 1512–1515. [Google Scholar] [CrossRef]
- Lee, C.C.; Yeh, T.K.; Chang, Y.H. Research on energy-saving control of the sea-water cooling pump in ships. In Proceedings of the 32th Symposium on Electrical Power Engineering, New Taipei City, Taiwan, 2–3 December 2011. [Google Scholar]
- Yimchoy, S.; Supatti, U. An Energy-Savings Evaluation Method for Variable-Frequency-Drive Applications on Water Pump Systems. In Proceedings of the 2021 24th International Conference on Electrical Machines and Systems (ICEMS), Gyeongju, Korea, 31 October–3 November 2021; pp. 603–608. [Google Scholar]
- Su, C.-L.; Chung, W.-L.; Yu, K.-T. An energy-savings evaluation method for adjustable-frequency drives on sea water cooling pumps on ships. In Proceedings of the 49th IEEE/IAS Industrial & Commercial Power Systems Technical Conference, Stone Mountain, GA, USA, 30 April–3 May 2013; pp. 1–10. [Google Scholar]
- Pariotis, E.G.; Zannis, T.C.; Katsanis, J.S. An Integrated Approach for the Assessment of Central Cooling Retrofit Using Variable Speed Drive Pump in Marine Applications. J. Mar. Sci. Eng. 2019, 7, 253. [Google Scholar] [CrossRef]
- Giannoutsos, S.V.; Manias, S.N. A Data-Driven Process Controller for Energy-Efficient Variable-Speed Pump Operation in the Central Cooling Water System of Marine Vessels. IEEE Trans. Ind. Electron. 2014, 62, 587–598. [Google Scholar] [CrossRef]
- Lee, C.-M.; Jeon, T.-Y.; Jung, B.-G.; Lee, Y.-C. Design of Energy Saving Controllers for Central Cooling Water Systems. J. Mar. Sci. Eng. 2021, 9, 513. [Google Scholar] [CrossRef]
- Irshad, K. Performance Improvement of Thermoelectric Air Cooler System by Using Variable-Pulse Current for Building Applications. Sustainability 2021, 13, 9682. [Google Scholar] [CrossRef]
- Tsamatsoulis, D. Optimizing the Control System of Clinker Cooling: Process Modeling and Controller Tuning. ChemEngineering 2021, 5, 50. [Google Scholar] [CrossRef]
- Cui, X.; Chua, K.J.; Islam, M.R.; Yang, W.M. Fundamental formulation of a modified LMTD method to study indirect evaporative heat exchangers. Energy Convers. Manag. 2014, 88, 372–381. [Google Scholar] [CrossRef]
- Hanjin Heavy Industry. Heat Balance Calculation; T/S Hannara, Korea Maritime & Ocean University: Seoul, Korea, 2018. [Google Scholar]
- Hanjin Heavy Industry. Plate Cooler Final; T/S Hannara, Korea Maritime & Ocean University: Seoul, Korea, 2018. [Google Scholar]
- Bequette, W.B. Process Control: Modeling, Design, and Simulation; Prentice Hall PTR: New Jersey, NJ, USA, 2003; p. 65. [Google Scholar]
- Vega, D.M.; Acevedo, H.G. Advanced Control System Design for a Plate Heat Exchanger. In Proceedings of the 2020 IX International Congress of Mechatronics Engineering and Automation (CIIMA), Cartagena, Colombia, 4–6 November 2020; pp. 1–6. [Google Scholar]
- Wang, Y.; You, S.; Zheng, W.; Zhang, H.; Zheng, X.; Miao, Q. State space model and robust control of plate heat exchanger for dynamic performance improvement. Appl. Therm. Eng. 2018, 128, 1588–1604. [Google Scholar] [CrossRef]
- Chaabane, N.; Wajdi, S.; Derbel, N. On the Modeling of a Centrifugal Pump. 2007. Available online: https://www.researchgate.net/publication/333292922_On_the_modeling_of_a_centrifugal_pump (accessed on 2 May 2022).
- Ogata, K. System Dynamics, 4th ed.; Pearson Prentice Hall: Seoul, Korea, 2016; p. 399. [Google Scholar]
Publisher’s Note: MDPI stays neutral with regard to jurisdictional claims in published maps and institutional affiliations. |
© 2022 by the authors. Licensee MDPI, Basel, Switzerland. This article is an open access article distributed under the terms and conditions of the Creative Commons Attribution (CC BY) license (https://creativecommons.org/licenses/by/4.0/).