Abstract
Disc pumps with radial straight blade are unconventional designs that have been developed for hard-to-pump mixtures for many industrial applications. They are frequently used in chemical industries, sub-sea petroleum pumping systems with multi-phase media and so on. Due to the radial straight blade arrangement, they may suffer from cavitation onsets when being used under different pressure conditions. To study the influence of cavitation characteristic inside the present disc pump flow passages, experimental data analysis on a radial blade disc pump for a wide flow rate range (0 to 110 m3/h) is obtained. In addition, the Reynolds averaged (RANS) approach using the RNG k-ε turbulence model, is carried out under different working conditions with and without cavitation modelling. Two different pump meshing models are also implemented: the first one without hub and shroud side channels between the discs and the volute casing, the second one with both side channels corresponding to the complete real case geometry. The comparisons between experimental and numerical results reveal first that the complete geometry meshing must be used to recover the experimental performance curve especially at low flow rates whatever the rotational speed. Secondly, the cavitation effect is found to take place in precise locations (straight blade and connection column) inside the impeller at high rotational speed and high flow rates. Their effects correspond to the unexpected performance curve deterioration found for the highest rotational speed and high flow rates. Moreover, with the decrease of the inlet absolute pressure, the cavitation degree becomes serious, and the coupling phenomenon of straight blade cavitation and connection column cavitation is formed, which enlarges the scope and enhances the degree of cavitation. The present study proposes a data reduction procedure when open loop experimental testing procedure is used for specific disc pump design and the importance of the impeller-side channels interactions on head pump decrease at low flow coefficients.
1. Introduction
The disc pump is also known as the Tesla pump. It is mainly composed of multi-layer stacked disc, rotating by an electric motor. The rotating kinetic energy of the disc is transferred to the energy of flowing medium mainly by the viscous force of flowing medium. Consequently, such pumps are more suitable when flowing medium has high viscosity, such as the oil mining and oil transport for sub-sea marine applications.
To improve the head performance of the Tesla pump, one has to increase the surface roughness or add ribs, holes, or grooves on the disc surfaces. It is also possible to use corotating discs equipped with small blade heights, which may reach higher flow rates and head values [1,2,3]. The maximum efficiency is generally lower than 50% due to the quite simple and crude impeller design characteristics [4].
Most of the pump models which come from industrial patents and related comparisons between experiments and computational fluid dynamics (CFD) approaches are quite rare and not always well documented.
At present, some researchers have already studied of this disc pump with radial straight blade. For example, Wang Chuan et al. [5] aim at the special impeller structure of the disc pump with discontinuous straight blades, based on the theoretical analysis results of the structural parameters of the pump casing, six kinds of pump casing with different flow cross-section area are selected for numerical simulation and three-dimensional internal flow field analysis, and the pressure distribution in the pump casing with different flow cross-sectional areas are obtained.
He Kunjian et al. [6] summarize the development of the disc pump, introduce the structural characteristics of the radial straight blade disc pump, expound the research progress of disc pump transport performance and internal flow characteristics.
The present analysis is based on existing experimental work performed on a disc pump model that has been experimentally tested in an open loop stand by Heng Yaguang et al. [7] introducing the experimental work of radial straight blade disc pump. The overall performance results of the pump design at different rotational speeds are given. The results show that such disc pump design is able to reach rather good head rise comparable to semi-open conventional pumps with even small tip blade values and the shroud cover. An evaluation of head losses, based on a one-dimensional analysis, assuming no cavitation, is also proposed by Heng Yaguang et al. [8] for the same disc pump. Both previous papers point out that cavitation onset can be responsible for unexplained specific head degradation that is not detected at low rotational speeds below 2000 rpm during open loop performance tests.
Qi Hao et al. [9] improve the structure of a disc pump impeller and obtain the numerical simulation analysis of the improved disc pump. The pressure and velocity of in the disc pump are obtained, and the distribution of air phase concentration, as well as the relation curve between different air phase volume fraction and pump head and efficiency are obtained. The results show that in the GAS-liquid two-phase flow, the liquid phase is mainly on the blade working face, and the corresponding air phase is mainly on the back of the blade.
Ennouri M et al. [10] handle the subject of the modelling and simulation of the flow inside a centrifugal pump through non-cavitating and cavitating conditions to provide highly reliable pumps. The modelling process starts with an unsteady numerical analysis under non-cavitating conditions to validate the numerical model and the solver comparing with the available testing data. The obtained pump performances are numerically compared with the experimental ones, and the outcome shows an acceptable agreement between both. Zhao Weiguo et al. [11] propose a scheme for arranging discontinuous bulge structures on the back of axial flow pump blades, and the numerical simulation of the pump is carried out to compare and analyze the changes of pressure, turbulent kinetic energy, cavitation and streamline distribution between the discontinuous bulges model and the original model.
Li Xi et al. [12] use CFX software, analyzes the hydraulic and cavitation performances of a portable pump. The relationships of hydraulic head, power, and efficiency with rate of flow are calculated. The relation curve of hydraulic head and NPSH is obtained, while the value of critical NPSH is calculated. Chen Bin et al. [13] study the cavitation characteristics of an axial-flow pump. Based on ANSYS CFX software, the curve of hydraulic characteristics is obtained, and it is found that the calculated results have errors with the experiments under the large flow condition. The critical cavitation pressure is obtained and the influence of inlet pressure and flow rate on cavitation volume fraction is analyzed.
Zhao Guoshou et al. [14] design a pair of parallel obstacle bars on the suction surface of axial-flow pump blade in order to control cavitation in an axial-flow pump. The cavitation experiments and numerical simulations are conducted to examine the control effects. Results show that the raised pressure around the leading edge by the obstacle can effectively depress blade cavitation generation and development although the hydraulic efficiency is inevitably affected and degrades by 5.6%. Wu Chenhui et al. [15] study the cavitation effect of an axial flow pump on its internal flow characteristics and energy conversion. The results shown that the cavitation volume fraction of the axial pump gradually increases as the effective net positive suction head decreases, which can induce undesirable flow states such as jet flow or vortex on the surface of the pump blade.
Jiang Jiarui et al. [16] take an automobile cooling water pump as the research object, adopt the numerical simulation technology to carry out steady and unsteady constant value simulation, then conduct cavitation research on the inside of the pump, and finally analyze the pressure pulsation characteristics. Liang Wuke et al. [17] study the cavitation inside an axial flow pump. The pump has no rear guide vane compared with the general axial flow pump. The horizontal axial-flow pump is tested and numerically simulated, and the test results are consistent with the numerical calculation results. The numerical simulation of the whole flow channel is carried out under the design condition. The cavitation characteristic and the cavitation volume fraction distribution are analyzed.
Xu Lianghai et al. [18] establish liquid–gas and liquid–solid phase relationships of a two-stage slurry pump using the theories of cavitation nucleation and solid–liquid two-phase flow. The relationship between gas and solid phases is derived, and the effect of solid-phase parameter characteristics on the cavitation characteristics in the pump is analyzed. Results show that the cavitation phenomenon reduces the overall pressure of the flow field of deep-sea mining slurry pump. Li Dong et al. [19] propose a method for multi-resolution cavitation status recognition of a centrifugal pump to improve the accuracy and universality of cavitation status recognition based on the vibration signal, and wavelet packet decomposition is used to extract the statistical eigenvalues of multi-scale time-varying moment of cavitation signal after reducing the clutter. The results show that the overall cognition rate of non-cavitation, inception cavitation and serious cavitation by using the vibration signal of one measuring point is more than 97.7%. Xu Bin et al. [20] study the tip clearance effect in a scaling axial flow pump used in a south–north water diversion project. This analysis is based on a modified turbulence model. The tip clearance effect is investigated through the mean velocity, pressure, and vorticity fields. Results show that there are two kinds of TLV structures in the tip region. Ahmed Ramadhan [21] detect and diagnose the cavitation phenomenon within centrifugal pumps using vibration technique. The results obtain vibration signal in both time and frequency domains were analyzed in order to gain a better understanding about the detection of cavitation in the pumps in question.
It is already well known that cavitation can destroy pump ability very abruptly and that a decrease of maximum 3% is generally recommended for pump users. This limiting value is defined as the NPSH (Net Positive Suction Head) available value and is generally given by the pump manufacturer for a given design. This paper presents the numerical set-up using CFX(ANSYS, inc., Pittsburgh, PA, USA) software that is used to verify the cavitation assumption made for proper data reduction analysis.
The well-known cavitation phenomenon is rarely mentioned in the open literature for similar disc pump designs due to its very exceptive and difference from centrifugal pump impeller geometry design as already mentioned. Section 2 presents the specific pump geometry and the corresponding experimental performance obtained for several rotational speeds and flow rates. Section 3 and Section 4 presents the overall pump performance using different CFD results obtained for pure water conditions (ignoring cavitation) and pure water with cavitation. The cavitation flow characteristics of disc pump which obtained in this paper are valuable for other researchers to design and optimize of disc pump.
2. Presentation of the Pump Geometry and Meshes Generation
The main technical and geometrical parameters of the radial straight blade disc pump which studied in this paper are given in Table 1. Figure 1 shows the specific impeller arrangement of such a pump. Two discs can rotate at the same rotational speed thanks to the presence of eight connection columns equally placed between each blade passage. Radial blades are placed on each disc with a large axial gap in between, so that the ratio between the total blade height 2 h (h and b are defined by Figure 1) versus the internal flow passage width b is equal to 0.5. Axial gap is defined as the gap between shroud blade and hub blade.

Table 1.
Main parameters of disc pump with Radial Straight Blade.

Figure 1.
Disc impeller material object and 3D Model of it.
Main components of this disc pump are straight radial bladed impeller and volute casing. The computational domain of the disc pump is modeled by Unigraphics software(Siemens A & D, Plano, TX, USA.), the computational domain composed inlet pipe, impeller, volute casing and outlet pipe. The 3D model of impeller is shown in Figure 1. In order to avoid the backflow at the inlet and outlet pipe becoming too large, and to reduce simulation error, the inlet and outlet pipe domain are prolonged appropriately, see Figure 2. Because the connection column between the hub and shroud is important for the cavitation flow, the connection column structures are considered in this simulation. The balance holes in the impeller are also considered. The computational domain with side chambers (hub and shroud chamber) and balance hole is shown in Figure 3.
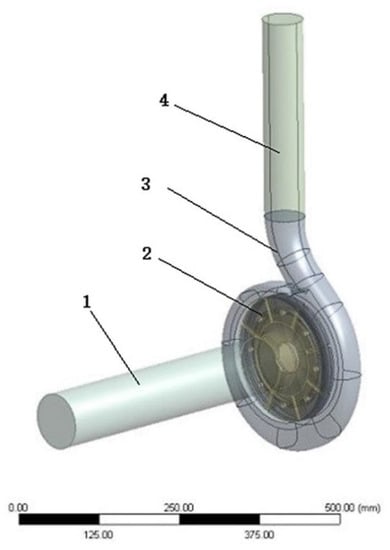
Figure 2.
3D model of disc pump flow channel with radial straight blade. 1—inlet extension pipe; 2—impeller; 3—volute casing; 4—outlet extension pipe.
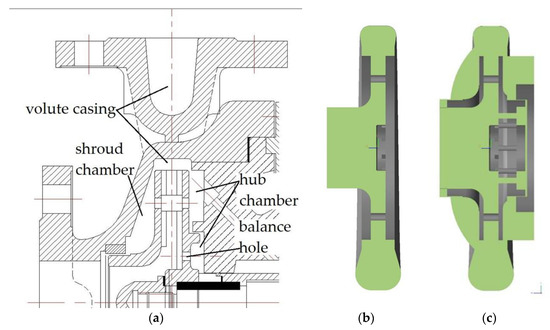
Figure 3.
The cross-section diagram (a), computational domain without side chambers (hub and shroud chamber) and balance hole (b) vs. computational domain with side chambers (hub and shroud chamber) and balance hole (c).
The whole 3D domain mesh is divided by a well-adapted unstructured tetrahedral mesh, while the mesh area with poor quality is aimed and the cell accuracy of the mesh is continuously adjusted. The sharp corners in the fluid domain are eliminated and the distortion rate of the mesh is reduced to improve simulation accuracy. For areas with complex flow channel profile such as radial straight blades and connection columns, local mesh refinement and wall boundary layer refinement are performed, and the results of numerical simulation of meshes are checked for mesh independence validation. It can be seen from Table 2, when the number of mesh is greater than 5.51 million, the change of the outlet pressure of the disc pump under the design conditions is less than 0.8%. Through consider balance of calculation accuracy and economy, the total number of pump mesh finally uses 5.51 million. Among them, the mesh numbers of the impeller and the pump casing are 2.68 million and 2.13 million, respectively. An example of mesh density is given in Figure 4.

Table 2.
Mesh independence validation.

Figure 4.
The mesh section of the impeller and casing flow channel and the partial mesh section near the connection column.
3. Numerical Models and Boundary Conditions
3.1. Flow Control Equations and Cavitation Models
In this paper, the Reynolds-averaged Navier–Stokes equations are used to solve the complex flow region, assuming that the fluid is an incompressible viscous turbulent fluid, the control equation is shown as follows:
where: is the velocity, p is the pressure, centrifugal force is added as a dynamic source term (term B), μ and are the laminar viscosity and the turbulent viscosity respectively and is the density.
The effective density and viscosity of the mixture are respectively given by:
where: is the vapor volume fraction (for = 1 vapor and for = 0: liquid). The density and the viscosity of liquid and vapour are presumed to be a constant model [10,11].
The cavitation model adopts the Zwart–Gerber–Belamri cavitation model, which considers the growth and collapse of bubbles with the homogeneous multiphase model and the Rayleigh–Plesset equation. During the phase transition, the reason why the volume fraction of the vapor increases is that the density of the vapor core decreases continuously. Therefore, correcting the vapor volume fraction term in the mass cavitation equation, replace in the condensation equation with (1−). In this model, the evaporative phase and condensed phases are respectively [10,11]:
where is velocity component, is bubble generation rate, is bubble condensation rate, and are the pressure of the liquid and the saturated vapor pressure, respectively; denote the nucleation site volume fraction, = 5 × 10⁻⁴; is the evaporation coefficient, = 50; is the condensation coefficient, = 0.01; Compared with other cavitation models, the Zwart–Gerber–Belamri cavitation model is more robust, more stable, easier to converge, and can observe obvious cavitation motions.
3.2. Boundary Conditions and Solution Control Set
CFX software is used to simulate the full three-dimensional steady cavitation of the disc pump. The turbulence model adopts the RNG k-ε model considering the influence of rotation and curvature [10]. The saturated vapor pressure of water at room temperature (20 °C) is 2339 Pa [11], the average diameter of the bubble is 2 × 10⁻⁶ m, and the surface tension is 0.072 N/m. The coupling surface between the overcurrent components is set as the interface, and the Frozen Rotor Model interface is adopted to realize the dynamic and static coupling between the casing and impeller and use the “None” option to deal with the transfer of flow parameters between the casing and the impeller. The reference pressure value is set to 0 Pa, and the convergence accuracy is set to 10−6. The wall is one of the main factors for turbulence and vorticity, and the treatment of the wall will obviously improve the accuracy of the numerical calculation results. Usually cavitation occurs near the wall, and the method of wall treatment determines the accuracy of cavitation flow simulation with a certain extent. In this work, a no-slip condition is adopted at the wall, and a scalable wall function that can be automatically adjusted to meet the applicable requirements, so scalable wall function is used in the near-wall region. The wall function relaxes the restriction on the first layer meshes near the wall; at the same time, it can avoid the deterioration of the calculation results when the distance from the wall named y+ < 15, and the turbulent wall function can give a consistent solution for any fine mesh. When y+ > 11, the performance of the wall function is consistent with the standard wall function. The total pressure inlet and mass flow outlet are used. The generation of cavitation in the disc pump is realized by reducing the total pressure of the pump inlet, and the mass flow rate outlet can ensure that the pump operates under the given conditions. The entire flow field is calculated as the initial vapor phase volume fraction of 0.
4. Analysis of the Simulation Results
4.1. Comparisons with Experimental Results
The present disc pump is tested on a specific test bench which is designed based on the usual standard centrifugal pump test bench, which is shown in Figure 5. Pressure sensor accuracy is ±0.2%, torque meter accuracy is ±0.1%, electromagnetic flowmeter accuracy is 0.5% in this test bench. The relative uncertainty of water head at 2900 rpm is 2.01% (see from reference [7]), which meet the requirements of test standards.
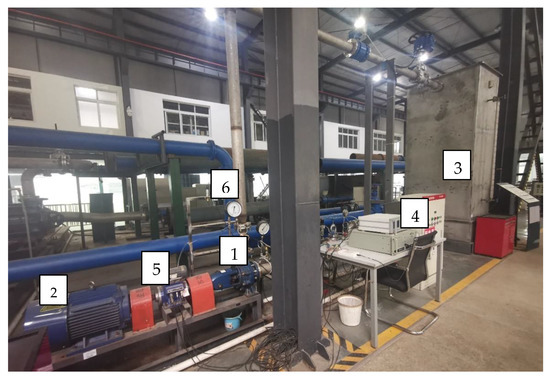
Figure 5.
Open cycle test stand for blade disc pump performance measurements. 1—Disc pump; 2—variable frequency motor; 3—water tank; 4—power control unit; 5—torque sensor; 6—pressure sensor.
Experimental results are plotted in Figure 6, using effective head and volume flow rate, for 2900 rpm. Several simulations are performed for two version of the pump geometry. The first simulation corresponds to the complete pump geometry including both side chambers between the discs and the volute casing. It is labelled as “CFD results/complete” The second one corresponds to a simpler configuration for which the two side chambers are neglected. It is labelled as “CFD results/simple”.
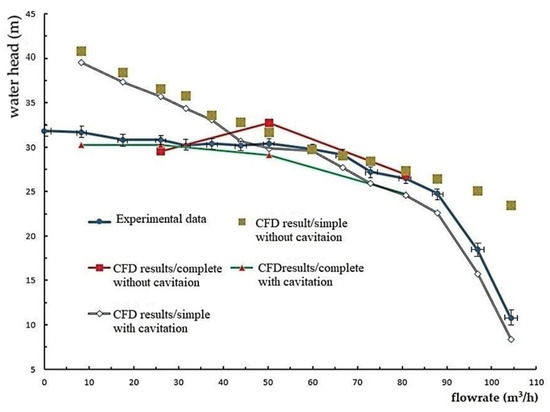
Figure 6.
Comparison curve between simulation results and experimental results of the present blade disc pump.
This allows to check how side chambers can modify the overall water head curves, also see Figure 3. Both simulations are performed without and with cavitation modelling. When cavitation is numerically analyzed, the inlet absolute pressure is obtained from the measured inlet static pressure sensor placed in front of the present pump.
It can be seen from Figure 6 that, when cavitation is not considered, in the middle flow rate band (40–90 m3/h), the simulation results on the water head are slightly higher than the experimental ones, with a difference of less than 5%. However, for the smaller flow rate band (0–40 m3/h), the simulated water head obtained using “CFD results/simple” meshing is much higher than the experimental one. In the large flow rate band (90–110 m3/h), the water head is still higher than experimental one. Note that these numerical values well correspond to the ones derived from similarity laws for single water phase as previously mentioned by Heng et al. [7]. When considering cavitation effects, numerical results are lower compared with numerical results without cavitation and are now close to experimental ones for high flow rates. This confirms that cavitation is present for this rotational speed using the present open loop test stand.
For high flow rates, the relative effects of the side chambers are weak as far as overall head performance is concerned. However, for low flow rates, where strong flow unsteadiness and reverse condition may occur as for lots of centrifugal pumps, the simulation must include the side chambers between hub and shroud external walls and the volute casing. This is clearly shown looking at the CFD results obtained comparing “CFD results/complete” and “CFD results/simple” with cavitation effects or not.
Consequently, when cavitation is not considered and for low flow rate values, it is important to use the complete pump geometry to correctly simulate the effective pump head performances for the whole volume flow range for such an unconventional design. This consideration has been often mentioned for most of the low specific pump conventional designs.
It shows that, in the simulation of the flow field of the radial straight blade disc pump, the calculation results considering the effect of cavitation and side chambers region are more consistent with the experimental data; in addition, it is also shown that the cavitation leads to the reduction of the water head of the blade disc pump, cavitation intensity increases with the increase of the flow rate.
By taking the example of flow rate condition (corresponding to Q = 25.96 m3/h, 0.32 Qd), the comparison between different calculation results and experimental results is shown in Table 3 below. In Table 3, the relative error values between the simulation results and the experimental results is defined as:
where is the simulated water head, is the experimental water head.

Table 3.
Comparison of experimental data and simulated data under different conditions.
It can be seen from Table 3 that for this flow rate condition of Q = 25.96 m3/h (0.32 Qd), simulations performed ignoring the side chambers side (“CFD results/simple”) without cavitation give results that are 16.98% larger than the experimental ones. When the cavitation is considered without side chambers, the error of the simulation result is smaller than the experimental result, but with a reduced difference (only 9.61% larger). When considering both cavitation and the complete pump geometry, water head decreases significantly, the simulated data being now quite close to the experimental data.
4.2. Cavitation Flow Structures in the Present Disc Pump Impeller
Local flow patterns are presented in this section when cavitation is detected from CFD results at design flow rate conditions. For convenience to understand, a meridional cut of the disc pump impeller passage is shown on Figure 7. The main passage geometrical parameters are recalled according to the information on Table 1 with additional details on connection column’s location and dimension. The impeller rotates around the z-axis. The rotation direction is counterclockwise when viewed from the inlet of impeller, that is, it rotates in the sequence of the straight blade serial No. 1 to 8, as shown in Figure 8.
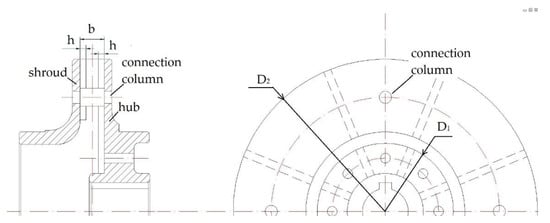
Figure 7.
Diagram of the impeller internal main structure and dimensions of the disc pump.
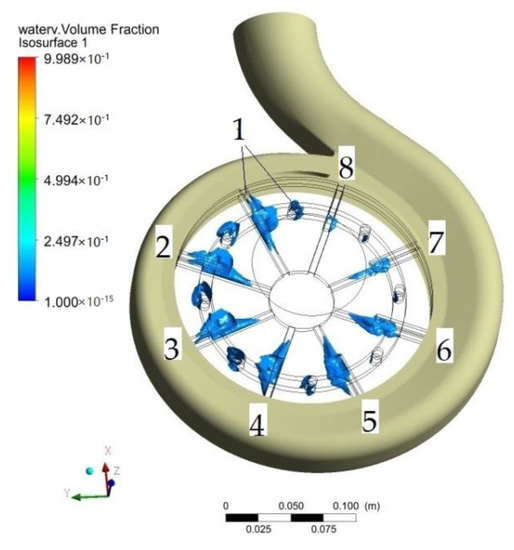
Figure 8.
Distribution of cavitation iso-surface inside the impeller of disc pump (Qd = 80.9 m3/h).
The blades located on the rear hub disc start at a very small radius compared with the blades located on the shroud front disc. A strong local geometrical blockage allows the inlet radial velocity to increase, avoiding strong incidence angle on the shroud blade region. This explains why a first group cavitation pattern is detected close to the low-pressure areas near the volute tongue and close to the suction sides downstream the blades fixed on the shroud disc. (Figure 8).
Figure 8 shows that in the steady calculation for the BEP (best efficiency point) flow rate (Qd = 80.9 m3/h), the volume fraction distribution corresponding to the value of 10% occurs close to the inner straight blade and the connection column, and the surface of the bubble is defined as the isosurface with 10% of the air volume fraction. It can be seen from Figure 9 that the bubbles generated by cavitation mainly appear in the middle of the rear straight blade, and the cavitation at the inlet and outlet sides of the straight blade is not obvious. In addition, the negative pressure is that exists behind the connection column corresponds to large cavitation flows. As previously mentioned, for low flow rate results, the relative position of the impeller and the volute is an important parameter for the inhomogeneous spatial distribution of cavitation areas. The large section area of the volute close to the casing tongue is a high-pressure area, and the degree of cavitation is relatively weakened, as shown for blade number 7 and 8, whereas cavitation areas increase for blade numbers 1 to 6. This can also be seen from the Figure 9a. It can also be seen from Figure 9b that cavitation starts from the edge of the pressure surface of the straight blade, passes through the axial gap between the blades and spreads towards the middle of the flow channel, forming a large cavitating area behind the suction surface of the straight blade, the negative pressure area leads to the large cavitation areas. Another major cavitation area is present downstream the connection column location. Local flow detachments can be observed which are related to high local velocities and losses that make the local pressure locally lower despite the increase of the mean static pressure due to centrifugal effects.

Figure 9.
Internal cavitation iso-surface and representative radial cross-section cavitation distribution of the impeller of disc pump (Qd = 80.9 m3/h). (a) cavitation iso-surface distribution of blade numbers 1 to 8, (b) cavitation distribution of a representative radial cross-section.
Figure 10 shows the cavitation distribution of different sections in the impeller of the blade disc pump under the flow rate condition (80.9 m3/h). In this figure, 0 mm is the midsection of the impeller, 4 mm is the starting position of the straight blade of the impeller, 8 mm is the position of the impeller shroud, and -8 mm is the position of the impeller hub, referring to Figure 8, also. In order to represent the cavitation distribution near the impeller shroud and hub, the 7.95 mm section near 8 mm is used to display the cavitation distribution near the impeller shroud, and the −7.95 mm section is used to display the cavitation distribution near the hub. It can also be seen from Figure 10 that cavitation mainly occurs near the 4 mm section, where due to the shear and disturbance of the fluid by the straight blades, the flow velocity changes greatly, and cavitation occurs.
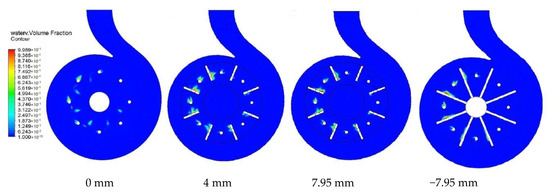
Figure 10.
Cavitation distribution in the internal section of the impeller and volute of the blade disc pump (Q = 80.9 m3/h).
The pressure distribution of the four sections (0, 4, 7.95, −7.95 mm) of the impeller in Figure 11 and the cavitation results in Figure 10 are corroborated each other, the blue area that appears behind the rotation direction of the blade in the figure is the low pressure area. It can be seen from the velocity vector distribution in the left figure of Figure 12 that the fluid inside the impeller is accelerated by the straight blades, and the flow velocity increases after the kinetic energy obtained from blades, because the circumferential velocity of fluid in the impeller increases when the impeller diameter enlarges, so the fluid’s absolute velocity increases with the increase of the impeller diameter, too. In the vicinity of the connection column, the change of flow occurs due to the disturbance of the connection column. It can also be seen from the distribution figure of the axial circular section of the velocity vector in Figure 12b, the velocity in the axial direction mainly presents the characteristics of high flow velocity near the straight blade and low flow velocity in the center of the flow channel. Because the pressure in the area with high flow velocity is lower, the cavitation area also mainly occurs in the area with high flow velocity.
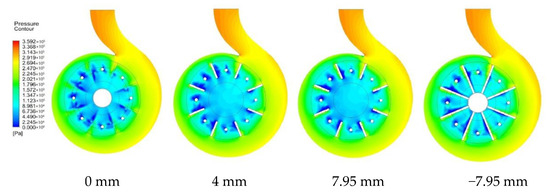
Figure 11.
Pressure distribution of internal section of blade disc pump impeller.

Figure 12.
Velocity vector distribution of internal section of blade disc pump impeller (a,b).
4.3. Internal Cavitation Characteristics of Blade Disc Pump Impeller under Different Flow Rate
The following results are obtained for an initial pressure equal to standard conditions at inlet pump domain to illustrate cavitation development for four different flow rates as shown on Figure 13.
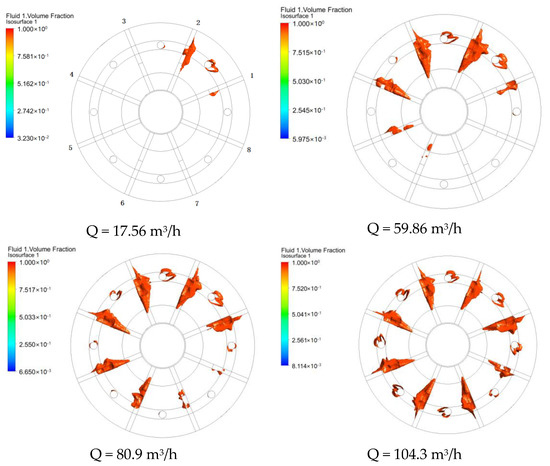
Figure 13.
Cavitation distribution inside the impeller under different flow rates of the blade disc pump.
Figure 13 shows the distribution of cavitation inside the impeller under the four flow rates of 17.56 m3/h (0.217 Qd), 59.86 m3/h (0.74 Qd), 80.9 m3/h (Qd) and 104.3 m3/h (1.29 Qd), respectively. The bubble surface is defined as the isosurface with 95% bubble body fraction.
For increasing flow rates, cavitation spreads gradually. At low flow rate (Q = 17.56 m3/h), cavitation mainly occurs on the “blade No. 1” and “blade 2 + connection column 2” near the casing tongue. Cavitation also mainly occurs in the middle area of straight blades with a small extent, and the cavitation domain is small. When the flow rate increases up to 59.86 m3/h, the cavitation area becomes larger with different expansion depending on the blade location in the tangential direction, and different degrees of cavitation appeared on blades No. 1–6 and connection columns No. 2–4, among them, the cavitation of No. 2, No. 3 and No. 4 blades is particularly obvious. When the flow rate reaches 80.9 m3/h, the degree and cavitation expansion continue to increase, different degrees of cavitation appeared on all blades of No. 1–8 and all connection columns of No. 1–8, especially the cavitation of No.1–6 blades and No.2–4 connection columns. When the flow rate increases to 104.3 m3/h, the degree and scope of cavitation continue to increase, different degrees of cavitation appeared on all blades of No. 1–8 and all connection columns of No. 1–8, and the degree and scope of cavitation became larger. This is because the flow rate increases, and the absolute flow velocity inside the impeller increases, resulting in a larger area below the saturated vapor pressure and a larger cavitation scope. For the highest flow rate, all cavitation areas increase due to larger local velocities.
4.4. Internal Cavitation Characteristics of the Impeller of the Blade Disc Pump under Different Inlet Pressures
Given that the impeller inlet flow rate is constant at 96.87 m3/h (1.2 Qd), the cavitation flow distribution inside the impeller is calculated and analyzed under three different pump inlet pressure conditions, which is shown in Figure 14.

Figure 14.
Distribution of cavitation inside the impeller under different inlet pressures of the blade disc pump (Q = 96.87 m3/h).
Figure 14 shows the distribution of cavitation inside the impeller under three different absolute inlet pressures of 54,000 Pa (Figure 14a), 64,000 Pa (Figure 14b), and 100,000 Pa (Figure 14c). The bubble surface is defined as the isosurface with 95% volume fraction of the bubble volume.
It can be seen from Figure 14 that as the absolute pressure of the inlet decreases, the degree of cavitation becomes severe, it can also be seen in the figure with the inlet pressure of 54,000 Pa that with the increase of the cavitation area, the straight blade cavitation and the connection column cavitation are connected. That is, straight blade and connection column coupled cavitation appears, which enhances the range and scope of cavitation.
The pressure in the impeller of the blade disc pump decreases with the gradual decrease of the inlet pressure. When the pressure in the impeller is lower than the saturated vapor pressure of the liquid, cavitation occurs, resulting in bubbles. At this time, the air bubbles are mainly concentrated in the suction surface of the straight blade close to the shroud, as shown in Figure 14c. The cavitation area in the impeller is limited, which has little effect on the fluid flow in the flow channel. When the inlet suction pressure continues to decrease, the cavitation process in the impeller continues to develop, the area of cavitation on the suction surface of the straight blade increases, and the air bubbles slowly extend along the blade surface to the rear of the impeller rotation direction and the front and rear sides of the straight blade, and accumulate on the side of the inner wall of the flow channel close to the suction surface, as shown in Figure 14b. At this time, the degree of cavitation gradually develops. When the cavitation process continues to develop, the air bubbles at the position of the suction surface of the straight blade and the hub can extend and spread to the entire area of the blade, the area of the bubbles also increases gradually. At this time, the development of cavitation has an impact on the energy exchange in the impeller, which reduces the water head performance of the pump. After that, the air bubbles on the suction side are further accumulated and connect with the air bubbles on the pressure side and block the flow path, which greatly reduces the pump performance. At this time, it is in a serious state of cavitation. At the end of the cavitation process, a large number of air bubbles are piled up in the impeller flow channel, causing serious blockage and limiting the flow channel, affecting the normal flow of the fluid, and causing fractured cavitation, as shown in Figure 14a. It can also be seen from Figure 14 that due to the influence of the different cross-sectional area of the volute casing and the position of the casing tongue, the air bubbles on the blade are not evenly distributed, and with the aggravation of the degree of cavitation, the degree of uneven distribution of bubbles in the impeller gradually decreases.
4.5. Analysis of Cavitation Flow Characteristics of Representative Points inside the Blade Disc Pump Impeller under Cavitation Condition
In order to research the distribution characteristics of pressure and cavitation in a single flow channel inside the blade disc pump impeller, the flow channel between the straight blade 1 and the straight blade 8 is selected as the representative flow channel inside the impeller. A total of 122 representative points is defined in this flow channel to obtain the pressure and cavitation data on the points. The spatial position distribution of the points is shown in Figure 15.
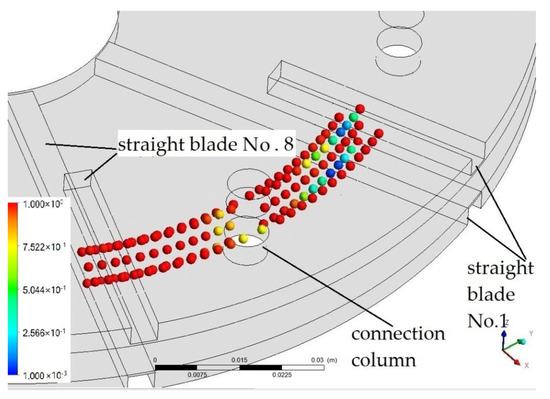
Figure 15.
Spatial distribution of measuring points inside the impeller. (the different color of balls shows the different liquid volume fraction).
4.5.1. Radial Pressure and Cavitation Characteristics in the Impeller of Straight Blade Disc Pump
Three rows of measuring points in the radial direction are analyzed. The three rows of measuring points are located on the same axial section (the same Z coordinate) and different radii (different R). Figure 16 is a distribution view of the three rows of the points. The abscissa is the different rotation angles, represented by θ, and the ordinate is the different radii of the impeller, represented by R. The outer layer has the largest radius, so its chord length is the longest, so after expansion, it is a trapezoid with an outer long line and an inner short line. The inner measuring point is on an arc with a radius of R = 71 mm from the rotation axis, the middle is R = 75 mm, and the outer side is R = 79 mm.

Figure 16.
Distribution view of the position of radial measuring points inside the impeller.
Figure 17 shows the distribution of the liquid phase component of the three rows of data points in the radial direction inside the impeller. The three curves in the figure correspond to the three rows of liquid phase component data points on the inner side, middle and the outer side, respectively. It can be seen from Figure 17 that the liquid component in the inner side does not change much, and the liquid composition in the middle and the outer side fluctuates greatly in the connection column area. It shows that cavitation occurs in the middle and outside of the connection column, and the minimum volume fraction of the liquid phase appears on the connection column, that is, the 13th point of the outer layer in the figure, and its value is 0.778. Due to the space limited of the chart, only the values of the liquid phase components of the outer curve are shown in the figure, and the values of the inner and middle curves refer to the outer curve.
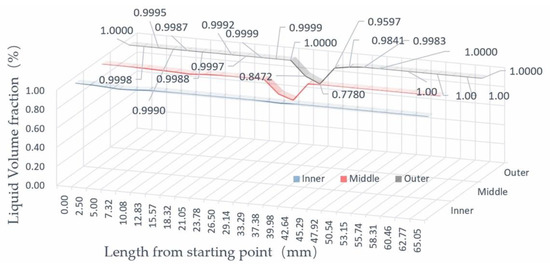
Figure 17.
Distribution of liquid components at radial points inside the impeller.
It can be seen from Figure 18 that the static pressure of the fluid in a single channel shows a trend of first cutting down and then going up, and there is a local increase in the pressure before the connection column. This is due to the stagnation pressure of the velocity reduction before the connection column and the pressure reduction after the connection column. It is the low-pressure area generated on the back side of the connection column because the fluid flows bypass the connection column, and its pressure distribution law conforms to the law of impeller doing work on the fluid. In the impeller flow channel, the total pressure has a minimum value at the inner side and the rear of the outer side of the connection column, because the fluid is squeezed by the connection column here, the flow velocity becomes larger, and the pressure becomes smaller.
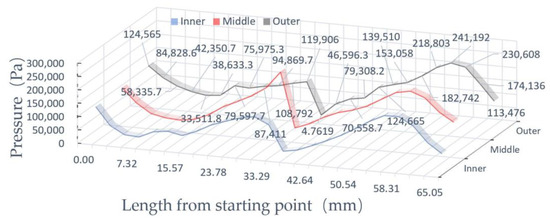
Figure 18.
Pressure distribution of radial points inside the impeller.
4.5.2. Axial Pressure and Cavitation Distribution in the Impeller of Straight Blade Disc Pump
Analyze the three series points in the axial direction of a flow channel with connection column. The three series of points are located on the same impeller radius (the same R), and the position of the axial section is different (the Z coordinates are different). Figure 19 is a distribution view of the three rows of measuring points. The abscissa is different rotation angles, represented by θ. Different angles are different from the starting position of the straight blade. The ordinate is the different axial heights of the impeller, represented by Z, refer to Figure 7, the middle layer is the middle section of the impeller, defined as z = 0 mm, the upper layer is z = 4 mm, and the lower layer is z = −4 mm.

Figure 19.
Definition of the position of the axial measuring point inside the impeller.
Figure 20 shows the distribution of the liquid phase composition of the three rows of data points in the axial direction inside the impeller. The three curves in the figure correspond to the three rows of liquid phase composition data points in the upper, middle and lower layers, respectively. It can be seen from Figure 20 that the liquid phase composition of the intermediate layer does not change much, and only the liquid phase composition decreases near the connection column. The liquid composition of the upper layer (straight blade of the impeller shroud) and the lower layer (straight blade of the hub) of the No. 1 straight blade fluctuates greatly. The liquid components decrease in the connection connecting column area at the upper, middle and lower measuring points. It shows that cavitation occurs on the straight blade and the connection column area, and the minimum volume fraction of liquid phase appears at the 5th point behind the straight blade, and its value is 0.076. Due to the limited space of the chart, only the specific values of the liquid phase components of the lower layer curve are listed in the figure, and the values of the upper layer and middle layer curves refer to the lower curve.
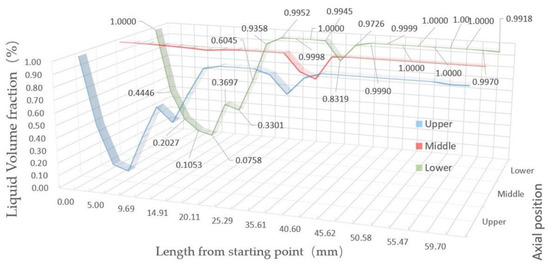
Figure 20.
Distribution of liquid components at axial measuring points inside the impeller.
It can be seen from Figure 21 that the static pressure of the three series of measurement points in a single channel shows a trend of first cut down and then go up. There is a local rise in pressure before the connection column due to the stagnation pressure of the reduced velocity. The pressure drops behind the connection column is due to the fluid flowing bypassing. There is pressure distribution law of the low-pressure area generated on the back side of the connection column conforming to the law of work done by the impeller on the fluid.
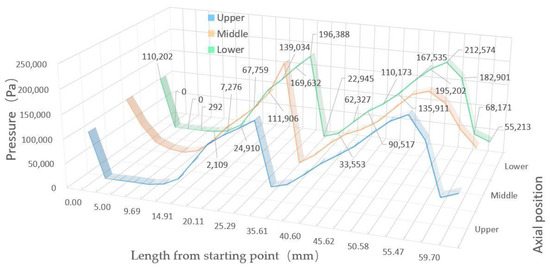
Figure 21.
Pressure distribution of axial measuring points inside the impeller.
In the impeller flow channel, the static pressure has a minimum value at the inner side and the rear of the outer side of the connection column, because the fluid is squeezed by the connection column here, the flow velocity becomes larger, and the pressure becomes smaller. The pressure in the flow channel has two peaks, which are on the pressure surface of the connection column and the pressure surface of the straight blade. The pressure on the pressure surface of the straight blade is slightly lower than the pressure on the pressure surface of the connection column, and the peak pressures are 212,574 Pa and 196,388 Pa respectively.
5. Conclusions
In this paper, a three-dimensional cavitation numerical simulation and experiment of the full flow channel of a radial straight blade disc pump under different working conditions are carried out. Highlights on inner flow features and external characteristic are presented and the main conclusions are given below.
(1) When cavitation is not considered, in the middle flow rate band range (40–90 m3/h), the simulation result of the water head is slightly higher than the experimental result, and the error is less than 5%; however, in the small flow rate band (0–40 m3/h) and the large flow band (90–110 m3/h), the simulated water head is much higher than the experimental results. After considering the effect of cavitation, in the large flow rate band, the water head decreases significantly and is closer to the experimental result. In the small flow rate band, the simulated water head is much higher than the experimental results, but when consider the cavitation and the complete pump geometry that included the side chambers between impeller and volute casing, the simulation result of the water head is slightly lower than the experimental result, less than 5%. In the middle flow rate band range (40–90 m3/h), water head when considering cavitation is slightly lower than that without cavitation, which is closer to the experimental results.
(2) At the design flow rate (80.9 m3/h), the air bubbles generated by the cavitation inside the impeller of the blade disc pump mainly appear in the middle of the straight blade, the cavitation of the straight blade is not obvious at the inlet and outlet sides of the blade. In addition, the negative pressure area behind the connection column is also found as the main area of cavitation. It can also be seen from the relative positions of the impeller and the volute casing that the distribution of cavitation exhibits spatial inhomogeneity due to the volute interaction. The cavitation starts from the edge of the pressure surface of the straight blade, passes through the axial parallel surface of the straight blade, and spreads to the middle of the flow channel. A large negative pressure area is formed behind the suction surface of the straight blade, and the negative pressure area leads to the appearance of a large cavitation area.
(3) As the absolute pressure of inlet decreases, the cavitation level becomes stronger as already observed in any pump. However, cavitation areas seem to be limited to the suction and midchannel sides of the impeller and never spread into the whole impeller passage as in conventional impeller designs of axial and centrifugal pumps. No strong flow blockage can be observed, allowing this kind of pump to continuously working under severe cavitation conditions. This can also explain why these kinds of pumps are used in multi-phase flow condition.
(4) The static pressure in a single channel of impeller shows a trend of cuts down first and then goes up. A local rise in pressure occurs before the connection column. The static pressure become cut down from middle surface to the rear of connection column. The static pressure has a minimum value at the rear of connection column. The pressure in the flow channel has two peaks, which are on the pressure surface of the connection column and the pressure surface of the straight blade. The peak pressure on the pressure surface of the straight blade is lower than the peak pressure on the pressure surface of the connection column.
(5) As the absolute pressure of the inlet decreases, the cavitation degree becomes serious, and the coupling phenomenon of straight blade cavitation and connection column cavitation is formed, which enhances the scope and degree of cavitation. In order to improve the anti-cavitation ability, the location of connection column should be moved to the smaller or bigger diameter direction, because when the location changes, the connection column cavitation and straight blade cavitation will separate. This is valuable for the design of radial straight blade disc pump.
Author Contributions
Conceptualization, W.Z.; methodology, W.Z.; software, W.Z. and K.S.; validation, B.G., Q.J. and H.L.; formal analysis, W.Z. and K.S.; performance test, W.Z. and K.S.; resources, W.Z. and Q.J.; data curation, W.Z.; writing—original draft preparation, W.Z.; writing—review and editing, H.L. and W.Z.; project administration, W.Z.; funding acquisition, W.Z. All authors have read and agreed to the published version of the manuscript.
Funding
This research was funded by National Natural Science Foundation of China, grant number 51939005; Science and Technology Department of Sichuan Province Supported Project (2020YFH152); Open Research Subject of Key Laboratory (Fluid and Power Machinery Research Base) of Ministry of education, grant number LTDL2021-011.
Institutional Review Board Statement
Not applicable.
Informed Consent Statement
Not applicable.
Data Availability Statement
Not applicable.
Conflicts of Interest
The authors declare no conflict of interest. The funders had no role in the design of the study; in the collection, analyses, or interpretation of data; in the writing of the manuscript; or in the decision to publish the results.
Nomenclature
| b | impeller passage channel width in impeller outlet; units (m) |
| h | blade height of shroud blade and hub blade in impeller, shroud and hub blade height is identical in this paper; units (m) |
| n | rotation speed of impeller; units (r/min) |
| Z | number of blades in impeller; units (m) |
| D | diameter;(mm) |
| Q | flow rate of pump, (m3/h) |
| Subscripts | |
| 1 | impeller inlet section |
| 2 | impeller outlet section |
| 3 | base circle of volute casing |
| in | inlet pipe |
| out | outlet pipe |
| d | design condition; commonly referred to the best efficiency point (BEP), when rotation speed is 2900 r/min, the design flow rate defined by BEP is 80.9 m3/h; |
References
- Max, I.G. Rotary Disc Slurry Pump. U.S. Patent No. 4773819, 27 September 1988. [Google Scholar]
- Max, I.G. Rotary Disc Pump. U.S. Patent No. 4940385, 10 July 1990. [Google Scholar]
- Max, I.G. Rotary Disc Pump. U.S. Patent No. 7097416B2, 29 August 2006. [Google Scholar]
- Yin, S.M. The Optimization of Subsea Mudlift Disc Pump and the Development of Its Multi-Stage Pump. Master’s Thesis, China University of Petroleum (East China), Qingdao, China, 2012. (In Chinese). [Google Scholar]
- Wang, C.; Zhang, Y.; Yu, Y.; Wang, D. Research on Unsteady Characteristics and Inflow Mechanism of Different Pumping Chamber of Disc Pump. J. Eng. Therm. Energy Power 2021, 36, 6. [Google Scholar]
- He, K.; Zhang, W.; Jiang, Q.Y.; Zhang, H.; Heng, Y.; Bois, G. Research Progress on Pumping Performance and Internal Flow of Disc Pump. J. Xihua Univ. (Nat. Sci. Ed.) 2021, 40, 10–17. [Google Scholar]
- Heng, Y.; Han, Y.; Zhang, H.; Zhang, W.; Bois, G.; Jiang, Q.; Wang, Z.; Liu, X. Tesla Bladed Pump (Disc Bladed Pump) Preliminary Experimental Performance Analysis. Energies 2020, 13, 4873. [Google Scholar] [CrossRef]
- Heng, Y.; He, K.; Jiang, Q.; Zhang, W.; Bois, G.; Liu, X. An Analysis on Hydraulic Loss in a Co-Rotating Bladed Disc Pump. JMSE J. Mar. Sci. Eng. 2022, 10, 214. [Google Scholar] [CrossRef]
- Qi, H.; Li, B. The numerical simulation of the two -phase flow of the gas liquid in the disc pump. China Pet. Mach. 2009, 37, 34–37. [Google Scholar]
- Zwart, P.J.; Gerber, A.G.; Belamri, T. A two-phase flow model for predicting cavitation dynamics. In Proceedings of the Fifth International Conference on Multiphase Flow, Yokohama, Japan, 30 May–4 June 2004. [Google Scholar]
- Zhao, W.; Zhao, F.; Lu, J. Study on the control of cavitation of axial flow pump with discontinuous bulges on the back of blades. J. Eng. Thermophys. 2021, 42, 96–105. [Google Scholar]
- Li, X.; Hou, X.; Wang, T.; Hu, B. Analysis of hydraulic performance and airborne performance of portable pumps. Mar. Eng. 2019, 41, 56–60. [Google Scholar]
- Chen, B.; Zhang, H.; Wang, Y.; Ch, X. Cavitation characteristics of high-speed submersible axial-flow pump. J. Drain. Irrig. Mach. Eng. 2021, 39, 109–115. [Google Scholar]
- Zhao, G.S.; Wu, R.; Che, B.X.; Cao, L.L.; Wu, D.Z. Blade cavitation control by obstacles in axial-flow pump. J. Zhejiang Univ. (Eng. Sci.) 2021, 55, 742–749. [Google Scholar]
- Wu, C.; Tang, F.; Yang, F.; Xie, L.; Sun, D. Numerical simulation analysis of cavitation impact on energy conversion characteristics of an axial flow pump impeller. Adv. Sci. Technol. Water Resour. 2019, 39, 49–56. [Google Scholar]
- Jiang, J. Research on Cavitation Characteristics of Automobile Cooling Water Pump. Doctoral Dissertation, Xihua University, Chengdu, China, 2020. [Google Scholar]
- Liang, W.; Hou, C.; Dong, W.; Wei, Q.; Wu, Z. Numerical analysis of cavitation characteristics of horizontal axial-flow pump. J. Drain. Irrig. Mach. Eng. 2020, 38, 764–769. [Google Scholar]
- Xu, H.; Chen, W.; Xu, C. Cavitation performance of multistage slurry pump in deep-sea mining. AIP Adv. 2019, 9, 105024. [Google Scholar]
- Dong, L.; Zhu, J.C.; Wu, K.; Dai, C.; Liu, H.L.; Zhang, L.X.; Guo, J.N.; Lin, H.B. Cavitation Status Recognition Method of Centrifugal Pump Based on Multi-Pointand Multi-Resolution Analysis. J. Appl. Fluid Mech. 2021, 14, 315–329. [Google Scholar]
- Xu, B.; Shen, X.; Zhang, D.; Zhang, W. Experimental and Numerical Investigation on the Tip Leakage Vortex Cavitation in an Axial Flow Pump with Different Tip Clearances. Processes 2019, 7, 935. [Google Scholar] [CrossRef]
- Al-Obaidi, A.R. Investigation of effect of pump rotational speed on performance and detection of cavitation within a centrifugal pump using vibration analysis. Heliyon 2019, 5, e01910. [Google Scholar] [CrossRef] [PubMed]
Publisher’s Note: MDPI stays neutral with regard to jurisdictional claims in published maps and institutional affiliations. |
© 2022 by the authors. Licensee MDPI, Basel, Switzerland. This article is an open access article distributed under the terms and conditions of the Creative Commons Attribution (CC BY) license (https://creativecommons.org/licenses/by/4.0/).