Abstract
This study analyzed the phenotypic and internal fruit quality diversity of six superior Nai plum trees to provide detailed phenotypic profiles and preliminary relational hypotheses, supporting superior genotype re-selection for breeding. Using leaves and mature fruits, we conducted diversity, correlation, and principal component analysis (PCA) on all quantitative traits. The average Shannon–Wiener index (H′) for qualitative traits was 0.543, and the average coefficient of variation for quantitative traits was 19.98%. Correlation analysis revealed complex trait relationships, including the synchronous variation between the total number of soluble solids (TSS) and reducing sugars (RS) or soluble sugars (SS) and the opposite trends between the TSS and potassium (K), magnesium (Mg), or soluble protein (SP). PCA extracted four principal components (cumulative contribution: 91.074%) from all traits. Based on factor scores, S6 ranked highest, indicating its potential as a comprehensive candidate. The findings offer a theoretical basis for Nai plum cultivation and breeding.
1. Introduction
Nai plum (Prunus salicina Lindl. var. cordata), also known as peach plum, is a small deciduous tree of the genus Prunus in the family Rosaceae. It originates from Gutian County, Fujian Province, and is a natural hybrid between peach and plum. The variety is named for its peach-like flavor [1], It is regarded as one of China’s famous, special, excellent and precious economic tree species. Cultivation extends widely across humid southern regions of the country, underpinning its significant economic value [2]. The fruit displays favorable morphological and qualitative traits, including thick flesh, high juiciness, a sweet taste, a small pit, and a high edible yield, It is also rich in protein, vitamins, lipids, minerals and organic acids. Considered an excellent green health-oriented food with low alcohol and high sugar content, it is often referred to as the ‘King of plum’ [1]. Beyond fresh consumption, the fruit can be processed into dried plums, honey-preserved products, canned goods, jam, and similar items as well as further developed into nutritious health-focused foods with a distinctive flavor profile [3].
In research on fruit tree germplasm resources, genetic diversity analysis based on phenotypic data has become a key approach for mining valuable genetic resources. Current studies in this field mainly proceed along two dimensions: one focuses on establishing a multi-dimensional trait evaluation system, and the other emphasizes core quality traits that determine commercial value. In constructing trait evaluation systems, researchers commonly integrate multiple phenotypic datasets to reveal germplasm variation. Ren used six superior almond seedlings as plant materials and systematically investigated their leaf phenotypic traits, photosynthetic characteristics, fruit external quality, three diameters of the stone fruit, and stone fruit weight [4]. The study found an abundant variation in quantitative traits and significant correlations among them, leading to the selection of superior local germplasm. Lu et al. performed correlation analysis and principal component analysis on ten traits—including single fruit weight, single kernel weight, kernel percentage, and single kernel weight—using 38 superior sweet almond apricot plants [5]. Their work elucidated relationships among fruit traits and enabled the comprehensive selection of candidate superior plants for breeding new varieties. In fruit trees, the ultimate goal of phenotypic evaluation lies in fruit quality, which directly determines the practical value of germplasm resources [6]. The concept of quality has expanded from traditional external attributes such as fruit size and color [7] to internal edible qualities, including the sugar–acid ratio and flavor compounds. For instance, Yang et al. noted that the soluble sugar content in plum fruit governs its sweetness, and it also influences the levels of secondary metabolites (e.g., polyphenols and pigments) and the associated antioxidant capacity [8], which are relevant to nutritional health [7]. Furthermore, commercial traits related to storage, transport and appearance—such as resistance to fruit cracking in melon [9]—along with the content of mineral elements that form the nutritional foundation [10] have also attracted considerable research attention. These studies demonstrate that the fruit quality is a complex trait influenced by multiple characteristics, and evaluation based on any single index may be one-sided. This indicates that current research trends are shifting from the examination of single or localized traits toward the comprehensive evaluation of multi-dimensional quality traits encompassing appearance, edibility, nutrition, processing, and other attributes. Within this context, integrating systematic phenotypic diversity analysis with in-depth multi-dimensional quality evaluation to screen germplasm resources with superior comprehensive traits from high-quality provenances has become an important issue to be addressed in fruit tree germplasm innovation and new cultivar breeding.
To date, research on Nai plum has primarily focused on single-provenance studies [11] and analyses of the internal quality of individual fruits [12]. No research has yet been reported on the genetic diversity of Nai plum trees from different provenances. Currently, the Nai plum industry faces several challenges, such as high production costs and susceptibility to brown heart disease [13], making the development of new varieties an urgent priority. In this study, six superior Nai plum plants from three provenances were used as materials to analyze the correlation and diversity between phenotypic traits and intrinsic fruit quality. This work aims to provide candidate superior plants for breeding new Nai plum varieties and to lay a theoretical foundation for the introduction, cultivation, and varietal improvement of Nai plum.
2. Materials and Methods
2.1. Overview of the Test Site
The study was conducted at the Tianping Agricultural Science and Technology Park in Yanling County, Zhuzhou City. The site is situated in the central Luoxiao Mountains, with an elevation ranging from 200 to 400 m, at latitude 26°03′ N and longitude 113°34′ E. The region experiences a subtropical monsoon climate, which is characterized by a mean annual temperature of approximately 18 °C and an average annual precipitation of 1400 mm. Rainfall is primarily concentrated between April and September, accounting for 60–70% of the annual total, which aligns with the water requirements of Nai plum during its growing season. The accumulated temperature ≥ 10 °C ranges from 5800 to 6200 °C·d, which is sufficient to meet the thermal demands throughout the entire growth cycle, including budbreak, flowering, and fruit development. The annual sunshine duration averages 1500–1700 h, providing moderate light conditions. The frost-free period lasts 280–300 d, with a low risk of freezing injury, thereby ensuring safe overwintering and the spring shoot growth of Nai plum trees. The area is surrounded by extensive primitive forest coverage, contributing to high concentrations of negative oxygen ions in the air and an absence of industrial pollution, collectively forming favorable cultivation conditions for Nai plum.
2.2. Testing Material
The experimental materials consisted of Nai plum from the same cultivar but different geographic origins. All materials were cultivated under identical, centralized conditions. Following this, selection was performed based on key traits including the fruit yield per plant, single fruit weight, proportion of fruits reaching maturity at the theoretical harvest period, and overall tree growth vigor. This process resulted in the identification of superior individual plants that performed significantly above the population average for all evaluated traits. Specifically, six distinct superior individuals were selected from three provenances: Yanling County in Hunan Province, China Lechang City in Guangdong Province, China and Liuyang City in Hunan Province, China. These were sequentially designated as S1, S2, S3, S4, S5, and S6 (Table 1). All trees were five years old.

Table 1.
Six sources of superior Nai plum trees.
2.3. Measured Traits
2.3.1. Observation of Leaf Phenotypic Traits
At the stage of leaf growth cessation, ten healthy and complete mature leaves were collected from the outer canopy in each of the four cardinal directions (east, south, west, and north) for each superior plant. The total number of leaves tested was 40. The leaf fresh weight was determined using an electronic balance (accuracy: 0.01 g). The transverse and longitudinal diameters of the leaf blade and petiole were measured with a digital vernier caliper (range: 0–150 mm). Leaf color parameters were recorded using a CR-400 Minolta chroma meter (Tokyo, Japan). For each trait, three replicate measurements were taken, and the mean value was calculated and used for subsequent analysis.
2.3.2. Fruit Quality Analysis
At the fruit-ripening stage, ten ripe fruits exhibiting complete appearance and normal development were randomly selected from both the upper and lower canopy layers in each of the four cardinal directions of each superior plant, resulting in a total of 40 fruits per plant. All sampled fruits had been bagged with identical material prior to harvest. The following traits were measured on all fruits. For each trait, three replicate measurements were taken, and the mean value was calculated.
Fruit appearance quality was assessed for all fruits with reference to the standard NY/T 2924-2016 (Descriptive Guidelines and Data Standard for Plum Germplasm Resources) [14] using the visual observation method. The observed traits included fruit shape, fruit top shape, fruit core adhesion, the presence or absence of a kernel, and kernel shape. Following the fresh-keeping method described by Zhang, Zhou, and Huang [15], the Nai plum fruits were placed into a ventilated box and transferred to cold storage to provide fresh samples for the subsequent detection of fruit quality traits and texture traits. The weight of a single fruit and the fresh weight of the nucleus were determined using an electronic balance with an accuracy of 0.01 g. The longitudinal and transverse diameters of the fruit, fruit stalk, and fruit nucleus were measured using a digital vernier caliper with a range of 0–150 mm. For all quantitative traits, three replicate measurements were taken per fruit, and the mean value was used for analysis.
Fruit internal quality was determined by measuring key components with the following instruments according to their respective standard methods: a modified Abbe refractometer (YLSZJ-SB-020, China), an enzyme-linked immunosorbent assay (ELISA) analyzer (YLSZJ-SB-250, China), a nitrogen determinator (YLSZJ-SB-007, China), and an inductively coupled plasma optical emission spectrometry (ICP-OES) instrument (YLSZJ-SB-235, China). The content of soluble solids was analyzed according to the agricultural industry standard NY/T 2637-2014 [16]; the contents of reducing sugar and soluble sugar were determined following the agricultural industry standard NY/T 1278-2007 [17]; the titratable acidity content was measured according to the national standard GB 12456-2021 [18]. The soluble protein content was quantified by referencing the method of Zhao et al. [19], and the starch content was determined by throne colorimetry. Furthermore, the contents of seven mineral elements, namely calcium, potassium, total phosphorus, magnesium, total nitrogen, iron, and zinc, were determined according to the second method specified in the national standard GB 5009.268-2016 [20].
The sensory texture quality of fruits was determined with reference to the standard NY/T 2924-2016 [14]. For the assessment, three fruits were randomly selected from each plant. The color parameters of the peel, pulp, and kernel were measured using a CR-400 Minolta chroma meter. The fruit texture was measured using a texture analyzer (TA.XT Plus, Stable Micro Systems, USA) equipped with a 36 mm diameter cylindrical probe (P/36). The test settings were as follows: test speed, 10 mm/s; compression distance, 20 mm; trigger force, 0.049 N. The following texture profile analysis parameters were determined: hardness (the initial peak force during the first compression cycle), adhesiveness (the work required to overcome the attractive forces between the fruit flesh and the probe surface), toughness (the overall resistance to fracture), cohesiveness (the strength of the internal bonds maintaining the sample’s structure), elasticity (the rate at which the sample recovers its original height after deformation), gumminess (the force required to disintegrate a semi-solid sample to a state ready for swallowing), and chewiness (the energy required to masticate a solid sample to a state suitable for swallowing). For each trait, three replicate measurements were taken, and the mean value was calculated.
2.4. Statistical Analysis of Data
The original data were organized using Microsoft Excel, from which descriptive statistics—including the maximum, minimum, mean, range, Shannon–Wiener diversity index, standard deviation (SD), and coefficient of variation (CV)—were derived. Drawing on the methods for analyzing quantitative traits employed by Wang Honglin [1], Yang Lukuan [8], and Shen Cairui [21], statistical analyses including difference, correlation, and principal component analyses were performed on the experimental data using SPSS 27.0 and Origin 2024 software. It is important to note that the experimental materials consisted of only six pre-selected superior individual plants. Therefore, the primary aim of applying these analytical methods was to provide a detailed phenotypic description for these six specific trees and to generate preliminary relational hypotheses, investigating whether significant phenotypic gaps exist among their traits. This work is intended to establish initial hypotheses for subsequent verification in large-scale studies.
Difference Analysis: Using SPSS 27.0 software, all quantitative leaf and fruit trait data were first tested for the homogeneity of variances. Subsequently, a one-way analysis of variance (ANOVA) was conducted to test for significant differences among groups. Where ANOVA results were significant, Fisher’s Least Significant Difference (LSD) post hoc test was applied for multiple comparisons. The significance level was set at α = 0.05.
Correlation Analysis: Using Origin 2024 software, all quantitative leaf and fruit trait data were assessed for normality. Given that most trait data did not meet the assumption of normal distribution, the non-parametric Spearman’s rank correlation analysis was employed.
Principal Component Analysis (PCA): First, all quantitative leaf and fruit trait data were standardized to z-scores (mean = 0, standard deviation = 1) to eliminate scale effects. The analysis and generation of graphical outputs were then performed using SPSS 27.0 and Origin 2024 software. A single, integrated Principal Component Analysis (PCA) was performed by combining all measured traits into a single matrix. The objective was to examine how the six superior individuals are distributed within the multi-dimensional space defined by all traits and to identify which traits collectively drive their differences.
- (1)
- Coefficient of variation calculation:
Coefficient of variation = standard deviation/average
- (2)
- Shannon–Wiener diversity index (H′) calculation:
H′ = −Σ(pi ln(pi))
In the formula, pi denotes the proportion of the number of individuals of the ith species to the total number of individuals in the community.
- (3)
- Comprehensive factor score calculation:
Dn = Σmj=1bjn ∗ Yj
In the formula, Dn denotes the composite score of the nth sample; m denotes the number of common factors; bjn denotes the score of the jth common factor of the nth sample; and yj denotes the contribution rate of the jth common factor
3. Results and Analysis
3.1. Comparison of Leaf Traits
The leaf traits of the six superior Nai plum plants are compared in Figure 1 and Figure 2. Significant differences (p < 0.05) were observed among the plants for most leaf traits, although no significant differences were found in the leaf transverse diameter, petiole longitudinal diameter, or the color index b1. The leaf transverse diameter ranged from 30.84 mm to 35.53 mm with S2 exhibiting the maximum value (35.53 mm). Petiole longitudinal diameter varied from 9.06 mm to 13.69 mm, the highest being recorded in S1 (13.69 mm). The b1 value ranged from 13.73 to 16.37 with S4 showing the highest measurement (16.37). The single-leaf weight of S1 was 0.26 g, which was lower than that of the other five superior plants. The leaf color indices L, a, b, C, and h° showed limited variation among plants. L ranged from 33.58 to 35.79 (maximum in S4: 35.79), a from −6.07 to −4.26 (maximum in S1: −4.26), C from 14.81 to 17.48 (maximum in S4: 17.48), and h° from 106.49° to 112.41° (maximum in S2: 112.41°).
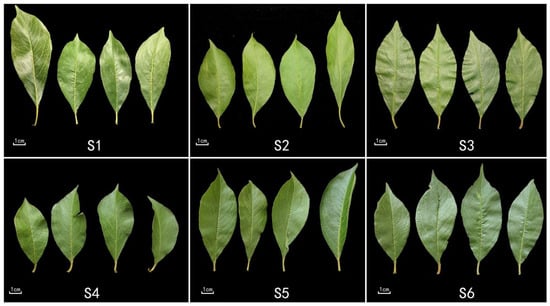
Figure 1.
Morphological characteristics of leaves from six superior Nai plum trees.
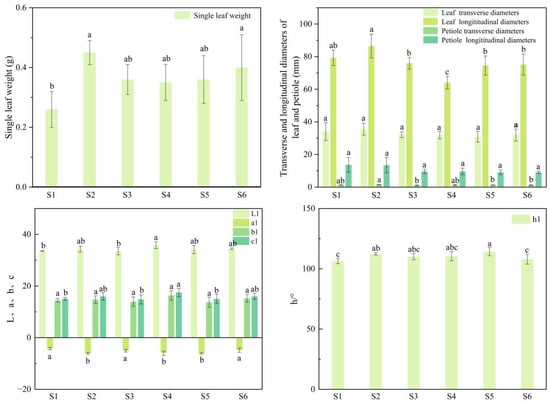
Figure 2.
Leaf phenotypic traits of six superior Naili plum trees. Note: L1, a1, b1, c1, h1: leaf color indices; different lowercase letters indicate significant differences p < 0.05. The same applies below.
3.2. Comparison of Fruit Quality
3.2.1. Comparison of Fruit Appearance Quality Traits
The fruit appearance quality traits of the six superior Nai plum plants are presented in Table 2 as well as Figure 3 and Figure 4. Significant differences (p < 0.05) were observed in these traits among the superior plants. The single fruit weight ranged from 52.19 g to 66.14 g with S4 having the highest value (66.14 g). The fruit transverse diameter varied from 46.00 mm to 49.40 mm, and S4 was the largest (49.40 mm). The fruit longitudinal diameter ranged from 46.04 mm to 51.05 mm, where S1 recorded the maximum (51.05 mm). The stalk transverse diameter spanned from 1.78 mm to 2.24 mm, the largest of which was found in S6 (2.24 mm). The stalk longitudinal diameter ranged from 10.85 mm to 13.30 mm with S2 showing the greatest value (13.30 mm). The fresh stone weight varied between 1.24 g and 1.59 g, and it was highest in S4 (1.59 g). The stone transverse diameter ranged from 15.10 mm to 33.64 mm; S4 exhibited the largest measurement (33.64 mm), and both S4 and S3 displayed comparatively larger values within this trait. The stone longitudinal diameter ranged from 21.04 mm to 29.97 mm with S4 again being the largest (29.97 mm). Significant differences in this trait were noted between S3, S4 and the other superior plants. The stone shape of all superior plants was obovate, while the fruit shape was primarily ovate to elliptical. The fruit apex was mostly concave, and stone adhesion was mainly clingstone and freestone. The kernel rate for plants other than S4 and S6 was approximately 50%.
Table 2.
Fruit appearance traits of six superior Naili plum trees.
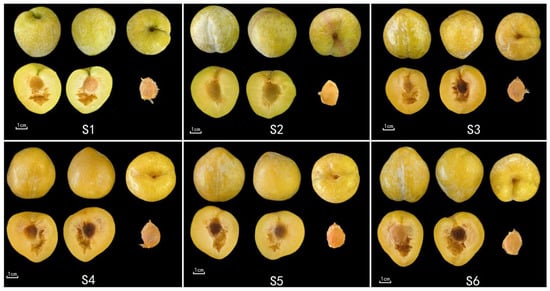
Figure 3.
Fruit morphological characteristics of six superior Nai plum trees.
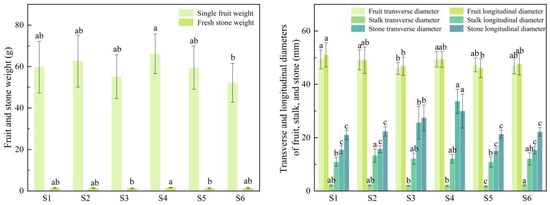
Figure 4.
Fruit appearance traits of six superior Naili plum trees.
3.2.2. Comparison of Fruit Internal Quality
The total amount of total soluble solids, reducing sugar, soluble sugar, titratable acidity, starch, soluble protein, calcium, potassium, total phosphorus, magnesium, total nitrogen, iron, and zinc was determined in the fruits of the six superior Nai plum plants (Figure 5). Significant differences (p < 0.05) were observed in the intrinsic fruit quality among the superior plants. The total soluble solids content ranged from 12.2% to 14.2% with S5 showing the highest value (14.2%). The reducing sugar content varied between 7.75% and 8.71%, and it was highest in S5 (8.71%). Similarly, the soluble sugar content ranged from 8.15% to 9.11% with S5 again recording the maximum (9.11%). In contrast, the titratable acidity content ranged from 0.40% to 0.54%, the greatest being in S1 (0.54%). The starch content ranged from 1.07 g/100 g to 2.72 g/100 g, reaching its peak in S6 (2.76 g/100 g). The calcium content varied from 44.8 mg/kg to 74.2 mg/kg with the highest level found in S4 (74.2 mg/kg). The potassium content ranged from 2192 to 2327 mg/kg with S2 containing the highest level (2327 mg/kg). The total phosphorus varied between 190 and 203 mg/kg, reaching its maximum in S3 (203 mg/kg). The magnesium levels ranged from 76.5 to 83.3 mg/kg and were highest in S6 (83.3 mg/kg). The total nitrogen content fell between 0.129 and 0.146 g/100 g with S4 showing the greatest value (0.146 g/100 g). The iron concentration ranged from 1.26 to 2.02 mg/kg, and it was highest in S4 (2.02 mg/kg). The zinc content varied from 0.705 to 1.13 mg/kg, and it also peaked in S4 (1.13 mg/kg). The soluble protein content ranged from 0.101 to 0.192 mg/g with S2 recording the maximum value (0.192 mg/g).
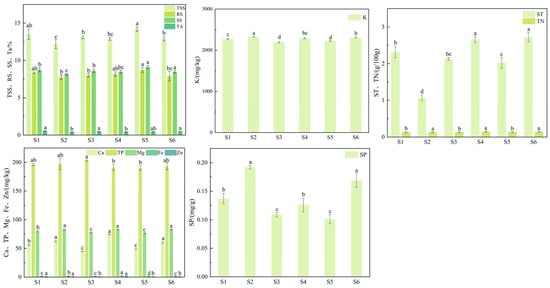
Figure 5.
Fruit internal quality traits of six superior Naili plum trees. Note: TSS: total soluble solids; RS: reducing sugars; SS: soluble sugars; TA: titratable acidity; ST: starch; Ca: calcium; K: potassium; TP: total phosphorus; Mg: magnesium; TN: total nitrogen; Fe: iron; Zn: zinc; SP: soluble protein. The same applies below.
3.2.3. Comparison of Fruit Sensory Quality
The color indices of different fruit tissues from the six superior plants are shown in Figure 6, while the fruit texture traits are shown in Figure 7. Significant differences (p < 0.05) were observed in most color parameters among the superior plants. However, no significant differences were found in the peel color indices b2 and c2 nor in the flesh color indices L3, a3, b3, c3, and h3. The b2 value ranged from 28.66 to 31.47 with S1 having the highest value (31.47). The c2 value varied between 29.05 and 31.56, reaching a maximum in S2 (31.56). For flesh color, L3 ranged from 49.56 to 53.59 (highest in S1: 53.59), a3 from 3.72 to 4.80 (highest in S6: 4.80), b3 from 20.66 to 21.77 (highest in S6: 21.77), c3 from 21.06 to 22.32 (highest in S6: 22.32), and h3 from 77.65 to 80.78 (highest in S2: 80.78). In contrast, greater variation was observed among plants for peel color indices a2 and h2 as well as for the kernel color index L4. Specifically, a2 ranged from 0.22 to 5.20 (highest in S4: 5.20), h2 from 79.98 to 89.63 (highest in S1: 89.63), and L4 from 40.67 to 50.47 (highest in S1: 50.47). Although the kernel color indices L4, a4, b4, c4, and h4 showed slightly wider fluctuations than those of the flesh, the observed variation did not affect the overall kernel color quality. No significant differences were observed among the superior plants for the fruit texture traits of hardness, toughness, cohesiveness, elasticity, gumminess, and chewiness, although considerable data variation was noted. Hardness ranged from 7006.54 to 13,642.70 (maximum in S3: 13,642.70), toughness from 4.86 to 10.76 (maximum in S3: 10.76), cohesiveness from 0.13 to 0.21 (maximum in S3: 0.21), elasticity from 25.40% to 72.10% (maximum in S3: 72.10%), gumminess from 688.40 to 2464.36 (maximum in S3: 2464.36), and chewiness from 279.18 to 1493.13 (maximum in S3: 1493.13). The browning incidence ranged from 0% to 7% with S6 showing the highest incidence (7%). In contrast, the adhesiveness differed significantly among the superior plants, ranging from 119.60% to 9.58%, where S3 exhibited the highest absolute value (−119.60%). The negative values indicate that the fruit tissue adhered to the probe surface during upward retraction, generating a downward tensile force.
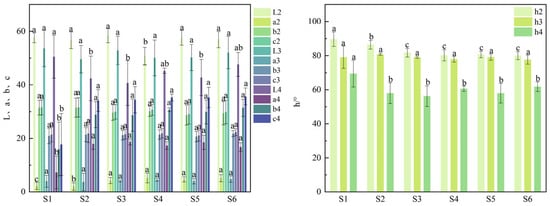
Figure 6.
Fruit color traits of six superior Naili plum trees. Note: L2, a2, b2, c2, h2: peel color indices; L3, a3, b3, c3, h3: flesh color indices; L4, a4, b4, c4, h4: kernel color indices. The same applies below.
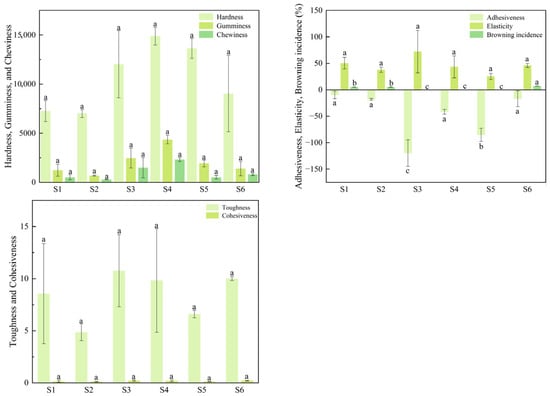
Figure 7.
Fruit texture traits of six superior Naili plum trees.
3.3. Diversity Analysis of Quality Traits
The fruit quality traits of Nai plum were graded and digitally encoded with reference to NY/T 2924-2016 [14]. The main items assessed are shown in Table 3, including fruit shape, fruit apex shape, stone adherence (clingstone, semi-freestone, or freestone), presence of a hollow core, and presence or absence of a kernel.
Table 3.
Grading and scoring of qualitative traits.
The Shannon–Wiener diversity index (H′) was applied to assess the genetic diversity of quality traits in the superior plants. The results of the trait diversity analysis are presented in Table 4. The average H′ value across quality traits was 0.543 with the highest H′ recorded for fruit shape (1.050). The H′ value for the core shape was 0, indicating that all samples exhibited an obovoid form. Fruit shape and stone adhesion displayed the greatest phenotypic variation. Observed fruit shapes included round, ovate, elliptical, and cordate with ovate accounting for 58.8% of the samples. Stone adhesion phenotypes were classified as clingstone, semi-freestone, or freestone, among which clingstone accounted for 49.4%.
Table 4.
Distribution frequencies and genetic diversity index (H′) for qualitative traits.
3.4. Diversity Analysis of Quantitative Traits
The diversity analysis of quantitative traits for the six superior Nai plum plants is presented in Table 5. The coefficient of variation (CV) for the 54 quantified traits ranged from 2.26% to 86.06%, with an average of 23.17%, reflecting substantial diversity. Chewiness showed the highest CV (86.06%) with values ranging from 184.70 to 2449.94 and a mean of 828.60. This was followed by adhesiveness, peel color index a2, and browning incidence with CVs of 85.97%, 81.58%, and 75.00%, respectively. Their respective ranges were 137.35 to 4.56, 3.62 to 7.78, and 0 to 7%, and mean values were −48.47, 3.09, and 2.8%. For adhesiveness, positive and negative values only indicate the direction of the probe force. These results indicate rich genetic diversity in these traits. In contrast, the fruit potassium content ranged from 2192 to 2327 mg/kg (mean: 2269 mg/kg), total phosphorus from 190 to 203 mg/kg (mean: 195 mg/kg), and magnesium from 76.50 to 83.30 mg/kg (mean: 80.53 mg/kg). The CVs for these three traits were relatively low, at 2.26%, 2.45%, and 3.67%, respectively.
Table 5.
Statistics for quantitative traits.
3.5. Correlation Analysis of Leaf Phenotypic Traits
Using Origin 2024 software, a correlation heatmap analysis was performed on 10 leaf phenotypic traits of the six superior Nai plum plants (Figure 8). The analysis revealed a synchronous variation trend between the following trait pairs: single leaf weight and leaf transverse diameter; single leaf weight and petiole transverse diameter; leaf transverse diameter and leaf longitudinal diameter; leaf transverse diameter and petiole transverse diameter; leaf longitudinal diameter and petiole longitudinal diameter; and between L1 and c1. An opposite variation trend was observed between the leaf longitudinal diameter and b1 as well as between h1 and a1 and between h1 and c1.
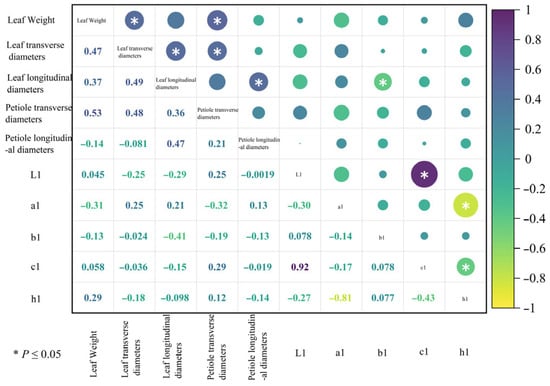
Figure 8.
Correlation analysis of leaf phenotypic traits from six superior Naili plum trees. Note: The size of the circle in the upper right corner corresponds to the size of the number in the lower left corner. The same applies below.
3.6. Correlation Analysis of Fruit Traits
3.6.1. Correlation Analysis of Fruit Appearance Quality
Using Origin 2024 software, a correlation heatmap analysis of eight fruit appearance traits was performed for the six superior Nai plum plants (Figure 9). The results indicated a trend of synchronous variation among several trait pairs. Specifically, synchronous variation trends were observed between the following pairs: fruit weight and fruit transverse diameter, fruit longitudinal diameter, stalk transverse diameter, stone weight, stone transverse diameter, and stone longitudinal diameter; fruit transverse diameter and fruit longitudinal diameter, stalk transverse diameter, stone weight, stone transverse diameter, and stone longitudinal diameter; fruit longitudinal diameter and stalk transverse diameter, stone weight, and stone longitudinal diameter; stalk transverse diameter and stone weight; stone weight and stone transverse diameter, as well as stone longitudinal diameter; and stone transverse diameter and stone longitudinal diameter. No opposite variation trends were detected among the fruit appearance traits examined.
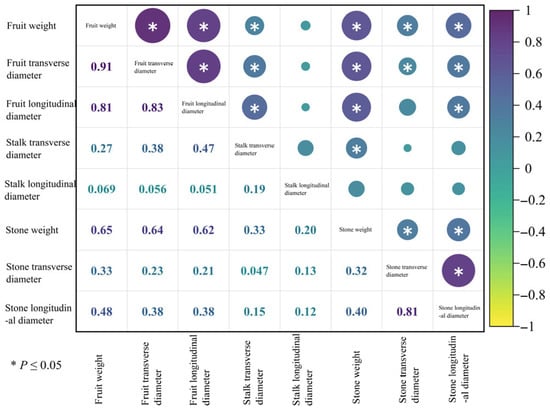
Figure 9.
Correlation analysis of fruit appearance quality in 6 superior Naili plum trees.
3.6.2. Correlation Analysis of Fruit Internal Quality
A correlation heatmap analysis of 13 fruit internal quality traits across the six superior Nai plum plants was performed using Origin 2024 software; the results are shown in Figure 10. Synchronous variation trends were identified among the following traits: total soluble solids with both reducing sugar and soluble sugar; reducing sugar with soluble sugar; soluble sugar with titratable acidity; titratable acidity with starch; starch with total nitrogen; calcium with potassium, magnesium, total nitrogen, iron, and zinc; potassium with magnesium, total nitrogen, iron, and soluble protein; magnesium with total nitrogen, iron, zinc, and soluble protein; total nitrogen with iron and zinc; and iron with zinc. In contrast, opposite variation trends were observed between soluble solids and potassium, magnesium, and soluble protein, as well as between soluble sugar and potassium, magnesium, and soluble protein.
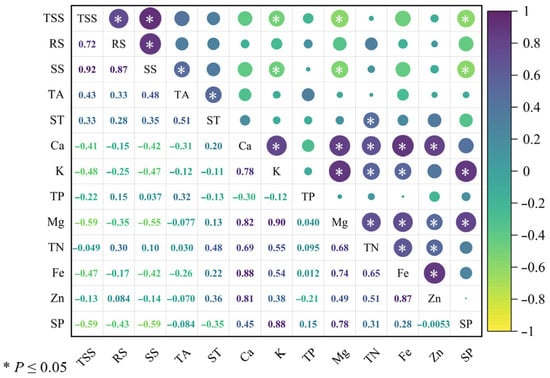
Figure 10.
Correlation analysis of fruit internal quality in six superior Naili plum trees.
3.6.3. Correlation Analysis of Fruit Sensory Quality
A correlation heatmap analysis of fruit color traits for the six superior Nai plum plants was performed using Origin 2024 software with the results presented in Figure 11. The analysis revealed synchronous variation trends between the following pairs of sensory quality traits: a2 and a3, a4, b4, and c4; b2 and c2, h2, and L3; h2 and h3 and h4; L3 and h4; a3 and b3 and c3; b3 and c3; l4 and h4; a4 and b4 and c4; and b4 and c4. Opposite variation trends were identified between l2 and b2, c2; a2 and h2, h3 and h4; b2 and a4; c2 and a4; h2 and a3, a4, b4, c4; a3 and h3; c3 and h3; l4 and a4; a4 and h4; b4 and h4; and c4 and h4.
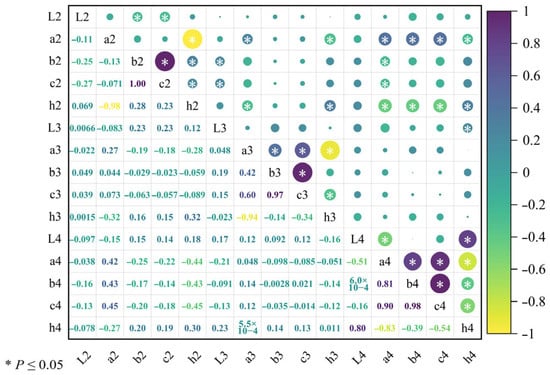
Figure 11.
Correlation analysis of fruit color in six superior Naili plum trees.
A correlation heatmap analysis of fruit texture traits was performed for the six superior Nai plum plants using Origin 2024 software (Figure 12). Among the texture traits, synchronous variation trends were observed between hardness and both gumminess and chewiness; between adhesiveness and brown heart incidence; between toughness and cohesiveness, elasticity, and chewiness; between cohesiveness and both elasticity and chewiness; and between gumminess and chewiness. Opposite variation trends were identified between brown heart incidence and both hardness and gumminess.
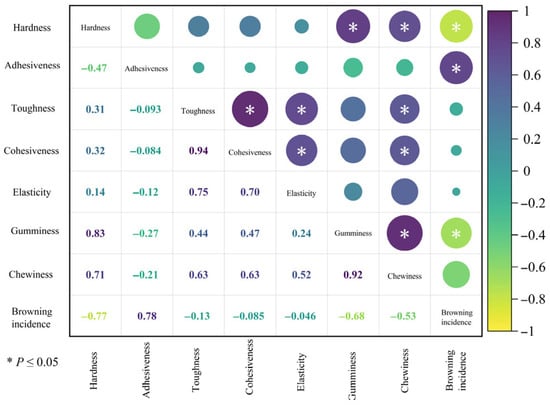
Figure 12.
Correlation analysis of fruit texture traits in six superior Naili plum trees.
3.7. Principal Component Analysis of Traits in Six Superior Nai Plum Trees
Following the standardization of all quantitative trait data, four principal components were extracted based on the criterion of eigenvalues greater than 1.000. The results are presented in Table 6 and Figure 13. The cumulative contribution rate of the first four principal components reached 91.074%, indicating that they adequately represent the original trait information. The first principal component had the largest eigenvalue of 17.417, accounting for 32.253% of the variance. The second principal component had an eigenvalue of 14.729, contributing 27.275% of the variance. Subsequently, scores for each principal component and a comprehensive score were calculated based on the four principal component coefficients, as shown in Table 7. Among the six superior plants, S6 achieved the highest comprehensive score, ranking first. This suggests that S6 may combine relatively favorable fruit shape and taste, making it a noteworthy candidate with comprehensive trait performance.
Table 6.
Principal component analysis of traits in six superior Nai plum trees.
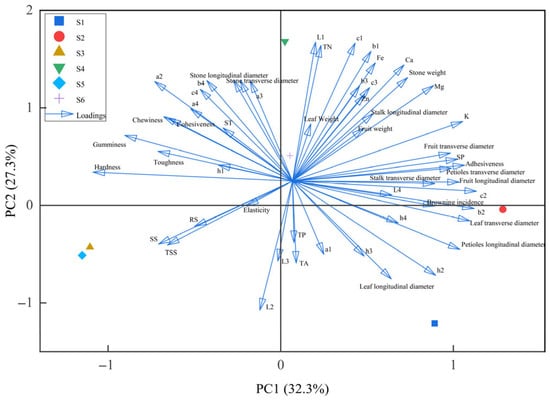
Figure 13.
PCA plot of phenotypic traits in the six superior Nai plum trees.
Table 7.
Principal component scores for the six Nai plum trees.
4. Discussion
Plant phenotypic traits are the integrated outcome of interactions between genetic and environmental factors shaped by long-term natural selection and human intervention [22]. Traits that can be visually observed and measured—such as leaves, flowers, and fruits—serve as direct and effective markers of genetic diversity. Leaves, functioning as organs for photosynthesis, respiration, and transpiration, largely determine a plant’s resource acquisition, utilization efficiency, and environmental adaptation. The synergy and trade-offs among leaf traits are influenced by plant functional types and climatic factors, which profoundly shape plant resource use strategies and niche differentiation [23]. During crop domestication, artificial selection has significantly reshaped leaf trait association networks, leading cultivated varieties toward agronomic forms that favor higher productivity [24]. Thus, analyzing leaf trait diversity holds important value for revealing trajectories of germplasm domestication and improvement. Studying the diversity of fruit traits helps clarify the extent, patterns, and environmental adaptation of variation among different provenances, which aids in exploring germplasm potential and provides a foundation for breeding novel germplasm [25]. Examples from grape [26], persimmon [27], brassica fruit [28], strawberry [29], and other germplasm resources demonstrate rich diversity in both fruit appearance and internal quality traits.
Observation of the six pre-selected superior Nai plum individuals revealed that the range of variation in fruit traits—particularly those related to fruit texture and flavor substances—was substantially greater than that in leaf traits. This phenomenon suggests that fruit traits, which are directly related to edibility and under the influence of anthropogenic selection, possess higher genetic plasticity. This aligns with the findings of Ren [30] on plum from the National Forest Tree Germplasm Bank, which similarly reported richer diversity in apricot fruit traits. Therefore, analyzing the variation patterns of these traits and their intrinsic relationships is a crucial and effective approach to understanding the current state of Nai plum germplasm domestication and assessing its breeding potential. A comparison of the data from this study with reported values for Nai plum from the Guangxi and Guizhou production regions [31,32] revealed a distinct phenotypic profile. While the principal constituents of the internal fruit quality were consistent, the average single fruit weight in this study was 59.30 g. This is significantly lower than the average weights reported for Guangxi (86.43 g) and Guizhou (approximately 100 g) regions. In contrast, the average soluble solids content (13.10%) and soluble sugar content (8.60%) here were higher than the corresponding averages from Guangxi (11.23% and 7.05%, respectively). This combination of “smaller fruit size but higher flavor compound concentrations” may be attributed to the different genetic backgrounds of the germplasm from various geographic origins. Alternatively, it could reflect distinct anthropogenic selection pressures tailored to local consumer preferences and environmental adaptations. This finding tentatively suggests the existence of divergent domestication trajectories within the Nai plum industry: one favoring larger fruit size and another prioritizing concentrated flavor. The genetic and molecular mechanisms underlying these potential branches warrant further investigation. The study suggests that the significant variation in the content of several mineral elements in fruit quality may be attributed to differences in the availability of these elements within the micro-site soil conditions despite similar overall growing environments. Factors such as the soil pH, organic matter content, and microbial community structure can influence the availability of trace elements like Fe and Zn. Although the number of superior individuals observed was limited (n = 6), the phenotypic variation present among these individuals under consistent cultivation conditions provides valuable trait leads for subsequent large-scale germplasm resource identification.
The correlation analysis revealed certain synchronous variation trends among the traits. For instance, a positive co-variation was observed between soluble solids content (SSC) and both reducing sugars and total soluble sugars, supporting the finding that the total sugar accumulation is the primary contributor to the sweetness of Nai plum [8]. Conversely, an opposite variation trend was found between SSC and the contents of K, Mg, and soluble protein. This suggests a potential trade-off between the accumulation of photosynthetic products (e.g., sugars) and the uptake/allocation of mineral elements. Notably, this finding implies that simultaneously enhancing both sugar content and mineral nutrient concentrations in fruits through breeding may pose a significant challenge. Furthermore, complex synchronous trends were identified among the color parameters of the peel, flesh, and kernel. This coordinated variation may be driven by a shared transcriptional regulatory network governing the biosynthesis of pigments such as anthocyanins or carotenoids across different fruit tissues. This insight provides a valuable clue for the potential molecular manipulation of fruit coloration.
Principal component analysis (PCA) is employed in the genetic diversity evaluation of germplasm resources to simplify the data structure by reducing multiple complex traits to a few independent dimensions [33]. In the PCA conducted on all traits, four principal components were extracted with a cumulative contribution rate of 91.074%, indicating that they adequately represent the original trait information. It is noteworthy that individual S6 achieved the highest comprehensive score, suggesting that it may combine relatively favorable fruit shape and taste, making it a noteworthy candidate with comprehensive trait performance.
5. Conclusions
The primary limitation of this study is that all analyses are based on phenotypic data from only six superior individuals within the same cultivar. Consequently, the results are applicable only to describing these specific individuals and cannot be used to infer the genetic parameters of the broader cultivar population. However, the significant phenotypic variation observed among these individuals under highly consistent cultivation conditions may reflect stable variations induced by factors such as epigenetic modifications or long-term micro-environmental interactions. This provides an instructive individual case for subsequent research. The main value of this work lies in offering a detailed phenotypic description and preliminary relational hypotheses for these six pre-selected, potentially valuable genotypes. In future work, we will increase the number of independent samples and the diversity of provenances to re-examine trait relationships among Nai plum from different geographic origins, using the present findings as a reference for comparative analysis. This will be integrated with transcriptomic, metabolomic, and molecular marker techniques to provide a multi-dimensional, in-depth analysis of the genetic basis and regulatory networks underlying key traits in Nai plum. Furthermore, research will be strengthened on the correlations between vegetative appearance (branches and leaves) and internal fruit quality traits, exploring the potential of using external morphological indicators as predictive markers for internal quality. These efforts aim to furnish a more comprehensive scientific basis for new cultivar selection and industrial application.
Author Contributions
Experiments conception and design, F.S. and S.W.; methodology, F.S., J.L. and K.Y.; software, K.Y.; validation, F.S.; investigation, J.L., K.Y., Y.L. (Yao Li), T.X. and X.Z.; data curation, K.Y., Y.L. (Yutong Li) and X.L.; writing—original draft preparation, K.Y.; writing—review and editing, F.S. and K.Y.; visualization, K.Y.; supervision, F.S. and S.W.; project administration, S.Z.; funding acquisition, F.S., S.W., M.Z. and Y.W. All authors have read and agreed to the published version of the manuscript.
Funding
This research was supported by the Yuelushan Laboratory Breeding Project (YLS-2025-ZY02051); Hunan Province Degree and Graduate Education Reform Research Project (2025JGYB233); Sub-project of the National Key R&D Program of China during the 14th Five-Year Plan Period (2022YFD2200404) and Hunan Forestry Science and Technology Research and Innovation Fund Project (XLK202432).
Institutional Review Board Statement
Not applicable.
Data Availability Statement
The original contributions presented in this study are included in the article. Further inquiries can be directed to the corresponding author.
Conflicts of Interest
The authors declare no conflicts of interest.
References
- Wang, H.L.; Zhao, K.; Zhao, X.Z.; Wang, H.; Ma, Y.H. Fruit Quality Analysis and Comprehensive Evaluation of Prunus salicina Lindl. var. cordata from Different Regions in Guizhou. Guizhou Agric. Sci. 2022, 50, 94–104. [Google Scholar] [CrossRef]
- Zhang, G.P.; Luo, X.H. Effects of Spraying “Trace Element Water-Soluble Fertilizer” on Yield and Quality of Prunus salicina Lindl. var. Cordata. Xiandai Hortic. 2018, 21, 4–5. [Google Scholar] [CrossRef]
- Deng, C.H. Early Fruiting, High Yield, Stable Yield and High Quality Cultivation Techniques of Prunus salicina Lindl. var. cordata in Southern China. Hunan Agric. Sci. 2011, 38, 22–23. [Google Scholar] [CrossRef]
- Ren, Z. Comparative Study on Photosynthetic Characteristics and Fruit Quality of Excellent Prunus dulcis Seedlings. Master’s Thesis, Tarim University, Alar, China, 2022. [Google Scholar] [CrossRef]
- Lu, L.X.; Wang, X.R.; Wang, W.; Wang, Y.M.; Jia, Q.B.; Song, J.T.; Jin, Y.L.; Liu, X.J.; Yan, W.J. Investigation and Analysis on Fruit Characters of Excellent Sweet-Kernel Apricots (Prunus armeniaca var. dulcis) Selections. China Fruits 2024, 66, 30–35. [Google Scholar] [CrossRef]
- Zhang, Y.; Cheng, Y.D.; Ma, Y.R.; Guan, J.F.; Zhang, H. Regulation of Pear Fruit Quality: A Review Based on Chinese Pear Varieties. Agronomy 2024, 15, 58. [Google Scholar] [CrossRef]
- Shi, S.Y.; Ma, X.W.; Xu, W.T.; Zhou, Y.G.; Wu, H.X.; Yao, Q.X.; Luo, C.; Wang, S.B. Diversity Analysis of Fruit Quality Characteristics in Different Mango Germplasms. Chin. J. Trop. Crops 2014, 35, 2168–2172. [Google Scholar] [CrossRef]
- Yang, L.K.; Li, H.Z.; Wang, Z.X.; Shao, F.L.; Wang, H.Q. Analysis of Fruit Quality Differences among Six Prunus salicina L. Varieties. J. Food Saf. Qual. 2025, 16, 267–275. [Google Scholar] [CrossRef]
- Xue, Q.M.; Li, H.; Du, T.S. Mild Water Deficit during Maturity Reduces Cracking Rate of Greenhouse Muskmelon While Improving Fruit Quality. Agric. Water Manag. 2025, 313, 109465. [Google Scholar] [CrossRef]
- Sihle, M.; Roshila, M.; Jonnalagadda, S.B. Elemental Composition and Nutritional Value of the Edible Fruits of Transvaal Red Milkwood (Mimusops zeyheri) and Impact of Soil Quality. Environ. Monit. Assess. 2019, 191, 135. [Google Scholar] [CrossRef]
- Peng, C.; Deng, L.P.; Tan, H.J.; Meng, W.C.; Luo, J.L.; Zhang, Z.W.; Cheng, H.Q.; Chang, X.X.; Qiu, J.S.; Lu, Y.S. Relationship between Fruit Quality of Prunus salicina var. cordata and Soil and Leaf Nutrients. J. Cent. South Univ. For. Technol. 2022, 42, 27–35,52. [Google Scholar] [CrossRef]
- Yang, J.; Ma, Z.F.; Liu, G.H. Effects of Potassium Nutrition on Photosynthesis and Chlorophyll Fluorescence in Leaves of Nai Plum. Chin. Agric. Sci. Bull. 2010, 26, 238–244. [Google Scholar]
- Liu, H.D.; Deng, G.Z.; Zhou, M.; Deng, H.Q. Current Situation, Existing Problems and Development Suggestions of Nai Plum Industry in Rucheng County, Hunan Province. Agric. Eng. Technol. 2025, 45, 14–16. [Google Scholar] [CrossRef]
- NY/T 2924-2016; Description Specification for Plum Germplasm Resources. China Agricultural Press: Beijing, China, 2016.
- Zhang, B.; Zhou, W.; Huang, G.H. Experimental Study on Fresh-Keeping of Nai Plum. Jiangxi Food Ind. 2001, 1, 16–18. [Google Scholar] [CrossRef]
- NY/T 2637-2014; Refractometric Method for Determination of Total Soluble Solids in Fruits and Vegetables. China Agriculture Press: Beijing, China, 2014.
- NY/T 1278-2007; Determination of Soluble Sugar in Vegetables and Products—Shaffer-Somogyi Method. China Agriculture Press: Beijing, China, 2007.
- GB 12456-2021; National Food Safety Standard—Determination of Total Acid in Foods. Standards Press of China: Beijing, China, 2021.
- Zhao, Y.Y.; Dai, Y.; Cui, X.M.; Zhang, W.B. Determination of Soluble Protein Content in Radix Aconiti Kusnezoffii by Coomassie Brilliant Blue G-250 Staining. J. Yunnan Univ. Natl. Nat. Sci. Ed. 2006, 15, 235–237. [Google Scholar] [CrossRef]
- GB 5009.268-2016; National Food Safety Standard—Determination of Multi-Elements in Foods. Standards Press of China: Beijing, China, 2016.
- Shen, C.R.; Lin, M.J.; Wu, C.Y.; Hao, Q. Comparison of Biological Characteristics and Fruit Quality Evaluation of 16 Ziziphus jujuba Seedling Superior Strains. Non-Wood For. Res. 2023, 41, 171–181. [Google Scholar] [CrossRef]
- Wang, S.Y.; Yang, S.C.; Jiang, S.L.; Zhang, G.; Zhao, Y.A.; Wang, R.H.; Feng, J.; Yang, L.J.; Wang, J. Phenotypic Diversity Analysis and Evaluation of 57 Phalaenopsis Germplasm Resources. Seeds 2023, 42, 70–76. [Google Scholar] [CrossRef]
- Sun, K.; Sun, R.J.; Liu, L.; Li, Y.B.; Zhou, G.S.; Xu, Z.Z. Global Coordination and Trade-Off of Grassland Species Traits and Climatic Drivers. J. Ecol. 2025, 113, 3210–3224. [Google Scholar] [CrossRef]
- Lei, Z.Y.; Li, Z.L.; Wright, I.J.; Zhang, W.F.; He, D.H.; Zhang, Y.L. Network Architecture of Leaf Trait Correlations Has Shifted Following Crop Domestication. Plant Cell Environ. 2025, 48, 1410–1424. [Google Scholar] [CrossRef]
- Zhi, J.Z.; Meng, Z.C.; Du, H.; Zhao, L.J.; Liu, X.M.; Zhang, J.C. Diversity Analysis and Comprehensive Evaluation of Fruit Traits in Yunnan Banana Local Germplasms. Seeds 2023, 42, 84–92. [Google Scholar] [CrossRef]
- Wang, J.; Wei, Y.J.; Zhu, W.L.; Huang, X.F.; Liu, Y.; Liang, D. Diversity Evaluation of Main Agronomic Traits in Fruits of 77 Vitis vinifera Germplasm Resources. Non-Wood For. Res. 2025, 43, 161–168. [Google Scholar] [CrossRef]
- Zhang, Q.; Pu, T.T.; Wang, Y.R.; Hu, Y.F.; Li, H.W.; Han, W.J.; Suo, Y.J.; Fu, J.M. Diversity Evaluation of Fruit Quality in Different Persimmon Germplasms. J. China Agric. Univ. 2025, 30, 61–71. [Google Scholar] [CrossRef]
- Lv, T.F.; Gao, F.; Su, T.B.; Dong, Y. Developmental Genetics of Fruit Diversity in Brassicaceae. Curr. Opin. Plant Biol. 2025, 85, 102707. [Google Scholar] [CrossRef] [PubMed]
- Wang, Y.; Whitaker, C.; Simpson, D.; Oibricht, K. Professor Staudt Collection: Fruit Diversity in Fragaria virginiana Mill. and Fragaria chiloensis (L.) Mill. Acta Hortic. 2021, 1309, 127–138. [Google Scholar] [CrossRef]
- Ren, T.T. Fruit Phenotypic Diversity Analysis and Quality Evaluation of Prunus mandshurica Clones. Master’s Thesis, Shenyang Agricultural University, Shenyang, China, 2024. [Google Scholar] [CrossRef]
- An, B.Y.; Qu, S.; Liu, X.J.; Zhang, Y.B.; Song, H.W.; Li, F. Fruit Quality Analysis and Comprehensive Evaluation of Different Plum Cultivars. North. Hortic. 2019, 1, 25–29. [Google Scholar]
- Ban, L.; Chen, H.; Ban, D.J. Introduction Performance of Nai Plum in Changshun, Guizhou. Fruit Grow. Friend 2021, 1, 6–7. [Google Scholar] [CrossRef]
- Zhou, Y.H.; Lu, W.D.; Ma, X.L.; Gao, J.L.; Fan, X.Q.; Guo, J.F.; Chen, Y.Q.; Lin, M.; Shi, S.B. Phenotypic Characterization and Genetic Diversity Analysis of Seed Watermelon Germplasm Resources. J. China Agric. Univ. 2023, 28, 119–132. [Google Scholar] [CrossRef]


Disclaimer/Publisher’s Note: The statements, opinions and data contained in all publications are solely those of the individual author(s) and contributor(s) and not of MDPI and/or the editor(s). MDPI and/or the editor(s) disclaim responsibility for any injury to people or property resulting from any ideas, methods, instructions or products referred to in the content. |
© 2026 by the authors. Licensee MDPI, Basel, Switzerland. This article is an open access article distributed under the terms and conditions of the Creative Commons Attribution (CC BY) license.