Article

Soil Organic Carbon Dynamics in Contrasting Soil Types Under Short-Rotation Woody Crop Production

by
Aistė Masevičienė
1,2,* and
Lina Žičkienė
1,2
1
Bioeconomy Research Institute, Vytautas Magnus University Agriculture Academy, 44248 Kaunas, Lithuania
2
National Environmental and Agricultural Research Laboratory, Vytautas Magnus University Agriculture Academy, 44248 Kaunas, Lithuania
*
Author to whom correspondence should be addressed.
Agriculture 2026, 16(2), 281; https://doi.org/10.3390/agriculture16020281
Submission received: 17 November 2025 / Revised: 8 January 2026 / Accepted: 19 January 2026 / Published: 22 January 2026
(This article belongs to the Section Agricultural Soils)

Abstract

Intensive agriculture, ecosystem degradation, and declining soil quality highlight the urgent need for sustainable land use strategies. The cultivation of short-rotation woody crops (SRC), combined with fertilization using sewage sludge digestate (SSD), offers a promising approach to recycle nutrient-rich waste and promote soil organic carbon (SOC) accumulation. This study evaluated SOC concentrations, stocks and their spatial distribution in the 0–20 cm soil layer under SRC cultivation, with and without SSD fertilization, across contrasting soil types in Eastern Lithuania. The investigated soils included mineral (Luvisols (LV), Retisols (RT), Planosols (PL), Arenosols (AR)), organo-mineral (Gleysols (GL)), and organic soils (Histosols (HS)), representing textures from sand to peat and classified according to the World Reference Base for Soil Resources (WRB). Part I assessed baseline SOC variability in unproductive areas planted with hybrid poplars (Populus spp.) and hybrid aspen (Populus tremula × P. tremuloides) up to 20 years old. Part II examined SOC changes in three SRC fields of different ages (3–10 years), including unfertilized and SSD-fertilized stands. SOC concentrations increased consistently from mineral (1.14–1.80%) to organo-mineral (2.13–3.20%) and organic soils (6.37–17.53%). Heavier-textured soils accumulated more SOC than lighter soils, showing a strong positive correlation between SOC and soil texture (r = 0.82, p ≤ 0.01). SRC cultivation increased SOC across all soil types, while SSD fertilization further enhanced accumulation, with fertilized fields showing SOC increases of 0.50–1.07 percentage points and carbon stocks by 18.8–41.7 t ha−1, compared with smaller increases in unfertilized fields. Spatial visualization of SOC further highlighted long-term accumulation patterns across soil types, confirming the trends observed under SRC cultivation and SSD fertilization.

1. Introduction

Globally, ecosystem degradation and climate-related pressures—such as biodiversity loss, declining soil quality, and reduced agricultural productivity—are intensifying due to long-term soil mismanagement and the expansion of intensive farming systems [1,2,3]. Globally, agricultural soils lose approximately 7.4 million tons of organic carbon annually. Among these soils, mineral cropland soils, which store nearly 12% of global soil carbon, are particularly vulnerable, often losing 15–40% of their carbon due to cultivation and tillage practices [4,5,6]. Studies have shown that the greatest reduction in soil carbon occurs in the upper soil layer (up to 50 cm), which accounts for roughly 16% of total carbon loss within the top 1 m of soil [7]. As a result, agricultural soils often exhibit low organic matter content, reduced fertility, and diminished resilience. Increasing soil organic carbon (SOC) is therefore essential for improving soil structure, nutrient retention, and long-term ecosystem stability [8,9,10]. Recent global assessments further show that agriculture has created a substantial global soil carbon debt, with model-based analyses indicating that soils would contain significantly more carbon in the absence of agricultural land use. These losses are concentrated in key agricultural regions, where both cropping and grazing systems contribute to pronounced SOC depletion, highlighting priority areas for restoration efforts [11,12].
Soil organic carbon (SOC) is widely recognized as a key indicator of soil biodiversity, quality, and ecological stability. Healthy soils act as the largest terrestrial carbon sink, and the accumulation of stable SOC contributes both to improved soil functioning and to the mitigation of atmospheric carbon levels, supporting climate regulation [13,14,15,16]. Land-use strategies such as converting cropland to forested systems have been shown to increase SOC, as forest soils contain nearly 40% of terrestrial organic carbon [17]. Yet, land-use changes can affect nutrient availability and soil quality in diverse ways, depending on climate, soil type, crop species, and management practices [18,19,20,21,22]. However, SOC responses to land-use change vary widely depending on soil texture, climate, vegetation type, and management intensity, and these interactions remain insufficiently quantified in many regions [23,24].
In recent years, short-rotation woody crops (SRC) have emerged as a promising land-use option, particularly on marginal and contaminated soils, offering potential benefits for both environmental and soil quality [25,26]. To sustain nutrient supply in these systems, sewage sludge digestate (SSD) has been proposed as an effective amendment, capable of improving soil fertility, enhancing nutrient cycling, and supporting circular economy principles [26,27,28]. SSD applications have been shown to increase SOC, nitrogen, and phosphorus levels, especially in sandy and nutrient-poor soils [29,30,31,32,33,34]. However, most existing studies on SRC and SSD are short-term and restricted to a single soil type, limiting the ability to assess long-term SOC trends across contrasting soil textures [35].
Integrating historical SOC datasets with digital soil mapping and updated chemical analyses provides a robust framework for evaluating current soil conditions and detecting long-term changes. Accordingly, the aim of this study was to evaluate SOC concentrations, their temporal changes, and accumulation across diverse soils under SRC cultivation, with and without SSD fertilization. This approach directly addresses the identified research gap by linking past and present SOC measurements across multiple soils, enabling a more comprehensive understanding of long-term SOC dynamics.

2. Materials and Methods

2.1. Experimental Setup

The research was conducted in three interrelated parts designed to comprehensively assess soil organic carbon (SOC) concentration, accumulation, and spatial distribution in Eastern Lithuania.
Part I of the Experiment. SOC concentration and accumulation were assessed across different soil types and soil textures in Eastern Lithuania, specifically within the municipalities of Vilnius, Anykščiai, Ukmergė, Švenčionys, Širvintos, Molėtai, Trakai, and Šalčininkai. The study was conducted in unproductive and less suitable agricultural areas. This part provided a regional-scale baseline assessment of SOC variability depending on soil type and texture and served as a reference for subsequent experimental parts.
Part II of the Experiment was carried out in the same region, focusing on three fields located in the Vilnius (54°34′01″ N; 25°38′54″ E), Anykščiai (55°20′16″ N; 25°02′36″ E), and Molėtai (55°06′56″ N; 25°30′54″ E) districts. These fields differed not only in soil typology but also in plantation establishment timing (2010 (Anykščiai), 2016 (Vilnius), and 2020 (Molėtai)) and fertilization regimes (fertilized and not fertilized). In Part II, the observed SOC dynamics were interpreted in relation to soil typology and the initial SOC concentrations determined in Part I. This enabled the assessment of SOC changes under short-rotation woody crop (SRC) cultivation and fertilization with SSD practices. In addition, changes in SOC over a period exceeding 30 years were evaluated in the fields using archival data.
Part III of the Experiment—Digitization of SOC data. The SOC data obtained in Stage II were visualized in three steps. In the first step, SOC values were mapped using standardized colors according to organic carbon richness groups (Table 1) [36]. Where direct measurements were not available, theoretical SOC levels were estimated based on average concentrations in mineral soils with different moisture content and texture (Table 2) [37]. The second and third steps presented only the measured SOC data from the experimental fields described in Stage II, displayed using the same standardized color scheme according to soil contours and organic carbon richness groups. Thus, Part III integrates and synthesizes the results of Part II through Geographic Information System (GIS)-based spatial analysis rather than constituting an independent experimental stage.
Together, these three experimental parts form a coherent methodological framework: Part I establishes baseline SOC concentrations across soil types and textures, Part II evaluates SOC changes under SRC management and fertilization, and Part III provides spatial visualization and interpretation of SOC distribution and dynamics.
All soils studied in Experiments I and II are located in the Baltic Highlands and Eastern Lithuania zones, based on pedological soil classification [38].

2.2. Short-Rotation Woody Crops (SRC) Cultivation Technology and Fertilization

The experimental fields were planted with short- rotation woody crops (SRC)—Populus species—hybrid poplars (Populus spp.) and hybrid aspen (Populus tremula × P. tremuloides) (cultivation period up to 20 years). The selected experimental fields were located as follows: Field 1 (Vilnius district)—6-year-old hybrid poplar; Field 2 (Anykščiai district)—10-year-old hybrid aspen; and Field 3 (Molėtai district)—3-year-old hybrid poplar. Short-rotation woody crops (SRC) in Fields 1 and 3 were not fertilized. In contrast, hybrid aspens in Field 2 were fertilized twice during their 10-year growth period with dried granulated SSD. The first fertilization occurred in 2016, after six years of growth, and the second in 2019, after nine years of growth.
The fertilization rate using SSD was 21 t ha−1 (dry matter basis) in 2016 and 19.09 t ha−1 in 2019. Application rates were calculated to ensure that the annual input of heavy metals from the SSD did not exceed the maximum permissible limits for soil application [39]. In this case, the limiting element was zinc, and the allowable SSD rate was determined based on its concentration. The chemical composition of sludge is presented in Table 3.
SSD spread outside is incorporated into the soil with disks at a depth of 0–10 cm and no later than within 2 calendar days of its spreading.

2.3. Research Sites and Sampling

Study sites within each field were selected based on the predominant soil type and texture (granulometric composition). Soil samples were collected from the 0–20 cm arable layer during either autumn or spring. Each composite sample, used to determine agrochemical indicators, was formed from 25–30 individual soil cores to minimize the influence of atypical points and ensure representative test results. Composite sampling was conducted by walking diagonally across the field, covering at least 100 m in fields up to 5 hectares in size [39]. The sampling routes were recorded using a GPS device, and their coordinates were stored to enable the repetition of sampling at the same locations in future surveys. This approach allows for accurate monitoring of changes in agrochemical properties over time.

2.4. Soil Types and General Characteristics

Eastern Lithuania, within the municipalities of Vilnius, Anykščiai, Ukmergė, Švenčionys, Širvintos, Molėtai, Trakai, and Šalčininkai, features a variety of soils in SRC fields, differing in texture, organic matter content, and chemical properties.
Soils at the experimental sites were systematically classified into three main groups for comparative analysis based on their properties and the World Reference Base for Soil Resources (WRB) [40]: mineral soils—Gleyic Luvisols (LVg), Haplic Luvisols (LVh), Calcaric Luvisols (LVk), Eutric Retisols (RTe), Eutric Planosols (PLe), and Haplic Arenosols (ARh); organo-mineral soils—Eutric Gleysols (GLb) and Mollic Gleysols (GLv); and organic soils—Pachiterric Histosols (HSs-ph) and Bathiterric Histosols (HSs-d). This classification provides a consistent framework for describing soil characteristics and analyzing soil organic carbon (SOC) concentrations and accumulation across different soil types.

2.4.1. Part I of the Experiment

In the 0–20 cm layer of mineral soils, pHKCl ranged from 3.9 to 7.5. Concentrations of available phosphorus (P2O5) ranged from very low to very high (20–387 mg kg−1), and available potassium (K2O) concentrations also ranged from very low to very high (34–390 mg kg−1). Mineral nitrogen (Nmin) concentrations in the 0–60 cm soil layer ranged from very low to high (1.55–21.90 mg kg−1).
In the 0–20 cm layer of organic soils, pHKCl ranged from 3.8 to 7.4. Available P2O5 concentrations varied from very low to very high (40–480 mg kg−1), and available K2O concentrations ranged from very low to very high (44–484 mg kg−1). Nmin concentrations in the 0–60 cm layer ranged from low to very high (10.50–129.58 mg kg−1).
The predominant soil texture was as follows: sandy loam (SL), and loam (L) (in Luvisols, Retisols, and Planosols); loamy sand (LS), and sandy loam (in Arenosols); sandy loam and peaty (in Gleysols); and peat (in Histosols).

2.4.2. Part II of the Experiment

Part II of the experiment was conducted in three distinct fields located in Eastern Lithuania. The first field (Field 1), located in the Vilnius district, encompassed 37 ha of area, with predominant soils being Eutric Retisols (RTe) and Haplic Luvisols (LVh). The soil texture was classified as sandy loam (SL), and the terrain was undulating. In the 0–20 cm soil layer, soil pHKCl ranged from 5.3 to 5.9. The concentration of available phosphorus (P2O5) ranged from medium to very high (110–276 mg kg−1), while available potassium (K2O) ranged from very low to high (96–193 mg kg−1). The concentration of mineral nitrogen (Nmin) in the 0–60 cm soil layer was very low, ranging from 1.75 to 3.44 mg kg−1.
The second field (Field 2), located in the Anykščiai district, had a fertilized area of 42 ha. The dominant soil types were Calcaric Luvisols (LVk), Haplic Luvisols (LVh), and Eutric Retisols (RTe), with sandy loam (SL) texture prevailing in the upper soil layer. The terrain was flat to slightly undulating. Soil pHKCl varied between 5.1 and 6.7. Available P2O5 concentrations ranged from very low to extremely high (42–724 mg kg−1), and available K2O concentrations ranged from high to extremely high (174–441 mg kg−1). Nmin concentrations at 0–60 cm depth ranged from low to high (3.90–12.89 mg kg−1).
The third field (Field 3), located in the Molėtai district, consisted of a 71 ha area and was characterized by hilly terrain. The dominant soil types were Haplic Luvisols (LVh) and Calcaric Luvisols (LVk), with a sandy loam (SL) texture. Soil pHKCl ranged from 5.4 to 7.4. Available P2O5 concentrations ranged from very low to low (11–70 mg kg−1), while available K2O ranged from low to very high (84–208 mg kg−1). The Nmin concentration in the 0–60 cm soil layer varied from very low to low (1.55–6.06 mg kg−1).

2.5. Methods for Determining Soil Agrochemical Parameters and SOC Accumulation

At the experimental sites, soil agrochemical parameters were assessed in the 0–20 cm layer for soil organic carbon (SOC), pHKCl, available phosphorus (P2O5), and available potassium (K2O). Mineral nitrogen (Nmin) was determined in both the 0–30 cm and 30–60 cm soil layers.
Soil pH was measured using a 1:5 (soil/liquid) soil suspension in 1 M KCl. The suspension was shaken for 60 min, allowed to settle for 1 h, and the pH was then measured at 20 ± 2 °C using a pH meter in accordance with ISO 10390:2021 [41].
Available phosphorus (P2O5) and available potassium (K2O) were extracted using a 1:20 (soil/liquid) soil-to-solution ratio with an ammonium lactate-acetic acid extractant (pH 3.7). The suspension was shaken for 4 h. Available P2O5 concentrations were determined spectrophotometrically using ammonium molybdate with a Shimadzu UV-1800 spectrophotometer (Shimadzu corporation, Kyoto, Japan). Available K2O concentrations were determined via flame emission spectroscopy using a JENWAY PFP7 flame photometer (Jenway Limited, Dunmow, UK), according to the Egner–Riehm–Domingo method [42].
Mineral nitrogen (Nmin) was extracted using a 1:5 (soil/liquid) soil suspension in 1 M KCl solution. The suspension was shaken for 60 min at 20 ± 2 °C. Following agitation, the suspension was filtered and analyzed using a flow injection analysis (FIA) system with an FIASTAR 5000 analyzer (FOSS Analytical AB, Höganäs, Sweden). The Nmin concentration was calculated as the sum of nitrate, nitrite, and ammonium nitrogen, in accordance with ISO 14256-2:2005 [43].
Soil organic carbon (SOC) was determined by dry combustion according to ISO 10694:1995, using a Liqui TOC II total carbon analyzer (Analytik Jena AG, Jena, Germany). The carbon in the soil was oxidized to carbon dioxide (CO2) by heating the sample to a minimum of 900 °C in a carbon-free synthetic air stream. To quantify organic carbon, carbonates were first removed using 4 M hydrochloric acid (HCl). If the carbonate content was known, the concentration of organic carbon was calculated by subtracting the carbonate carbon from the total carbon content. In the absence of carbonates, organic carbon was determined directly by using the infrared method, in accordance with ISO 10694:1995 [44].
Soil organic carbon accumulation (SOCaccum expressed in tonnes per hectare, t ha−1) was also evaluated at experimental sites. SOCaccum was calculated from the measured SOC, bulk density, and humus layer thickness using the following formula [36]:
S O C a c c u m = S O C × T S × S G
where SOCaccum—organic carbon accumulation in the soil (t ha−1); SOC—soil organic carbon concentration (%); TS—soil bulk density (g cm−3); SG—thickness of the humus layer in the soil (cm).

2.6. GIS-Based Mapping of Soil Organic Carbon Distribution

Digital maps were created using ESRI ArcGIS Desktop 10.5.1 software and the following spatial data layers: soil organic carbon (based on experiment part II and archival data) and soil types. The resulting digital maps depict the spatial distribution (%) of soil organic carbon concentrations across the studied plots located in Vilnius (Field 1), Anykščiai (Field 2), and Molėtai (Field 3) districts, classified according to richness groups. Digital maps (Figures 4–6) were created based on the number of study stages, which depended on whether the SRP was fertilized with SSD. In Field 1 and Field 3, SRP was not fertilized with SSD, and soil samples were analyzed in two stages to monitor changes in SOC concentration over time: A—study period (1989–1990); B—study period (2018–2020) (Figures 4 and 6). In contrast, in Field 2, SRP was fertilized with SSD, and soil samples were analyzed in 3 stages: A—study period (1989–1990); B—study period (2018–2020); C—study period (2021) (Figure 5). The digital map legend indicates different levels of organic carbon concentration (very low, low, medium, high, and very high), with colors corresponding to each group, allowing for a clear distinction between SOC concentration classes. This method enables the assessment of temporal and spatial changes and facilitates a more accurate interpretation of soil fertility patterns.

2.7. Statistical Analysis of Experimental Data

The research data were processed using Microsoft Office Excel 2010. Descriptive statistics, including minimum (min) and maximum (max) values, arithmetic means ( x ¯ ), medians, and standard deviations (σ), were calculated. The coefficient of variation (CV) was used to assess data variability. A CV of less than 10% was considered to indicate low variation, 10–20% as moderate variation, and greater than 20% as high variation. Relationships between variables were evaluated using correlation and regression analysis. The STATISTICA 9 software package was employed to calculate correlation coefficients and ratios and to express the strength and direction of relationships between the variables under study [45,46].

3. Results

3.1. Soil Organic Carbon (SOC) Concentration and Accumulation in Different Soil Types

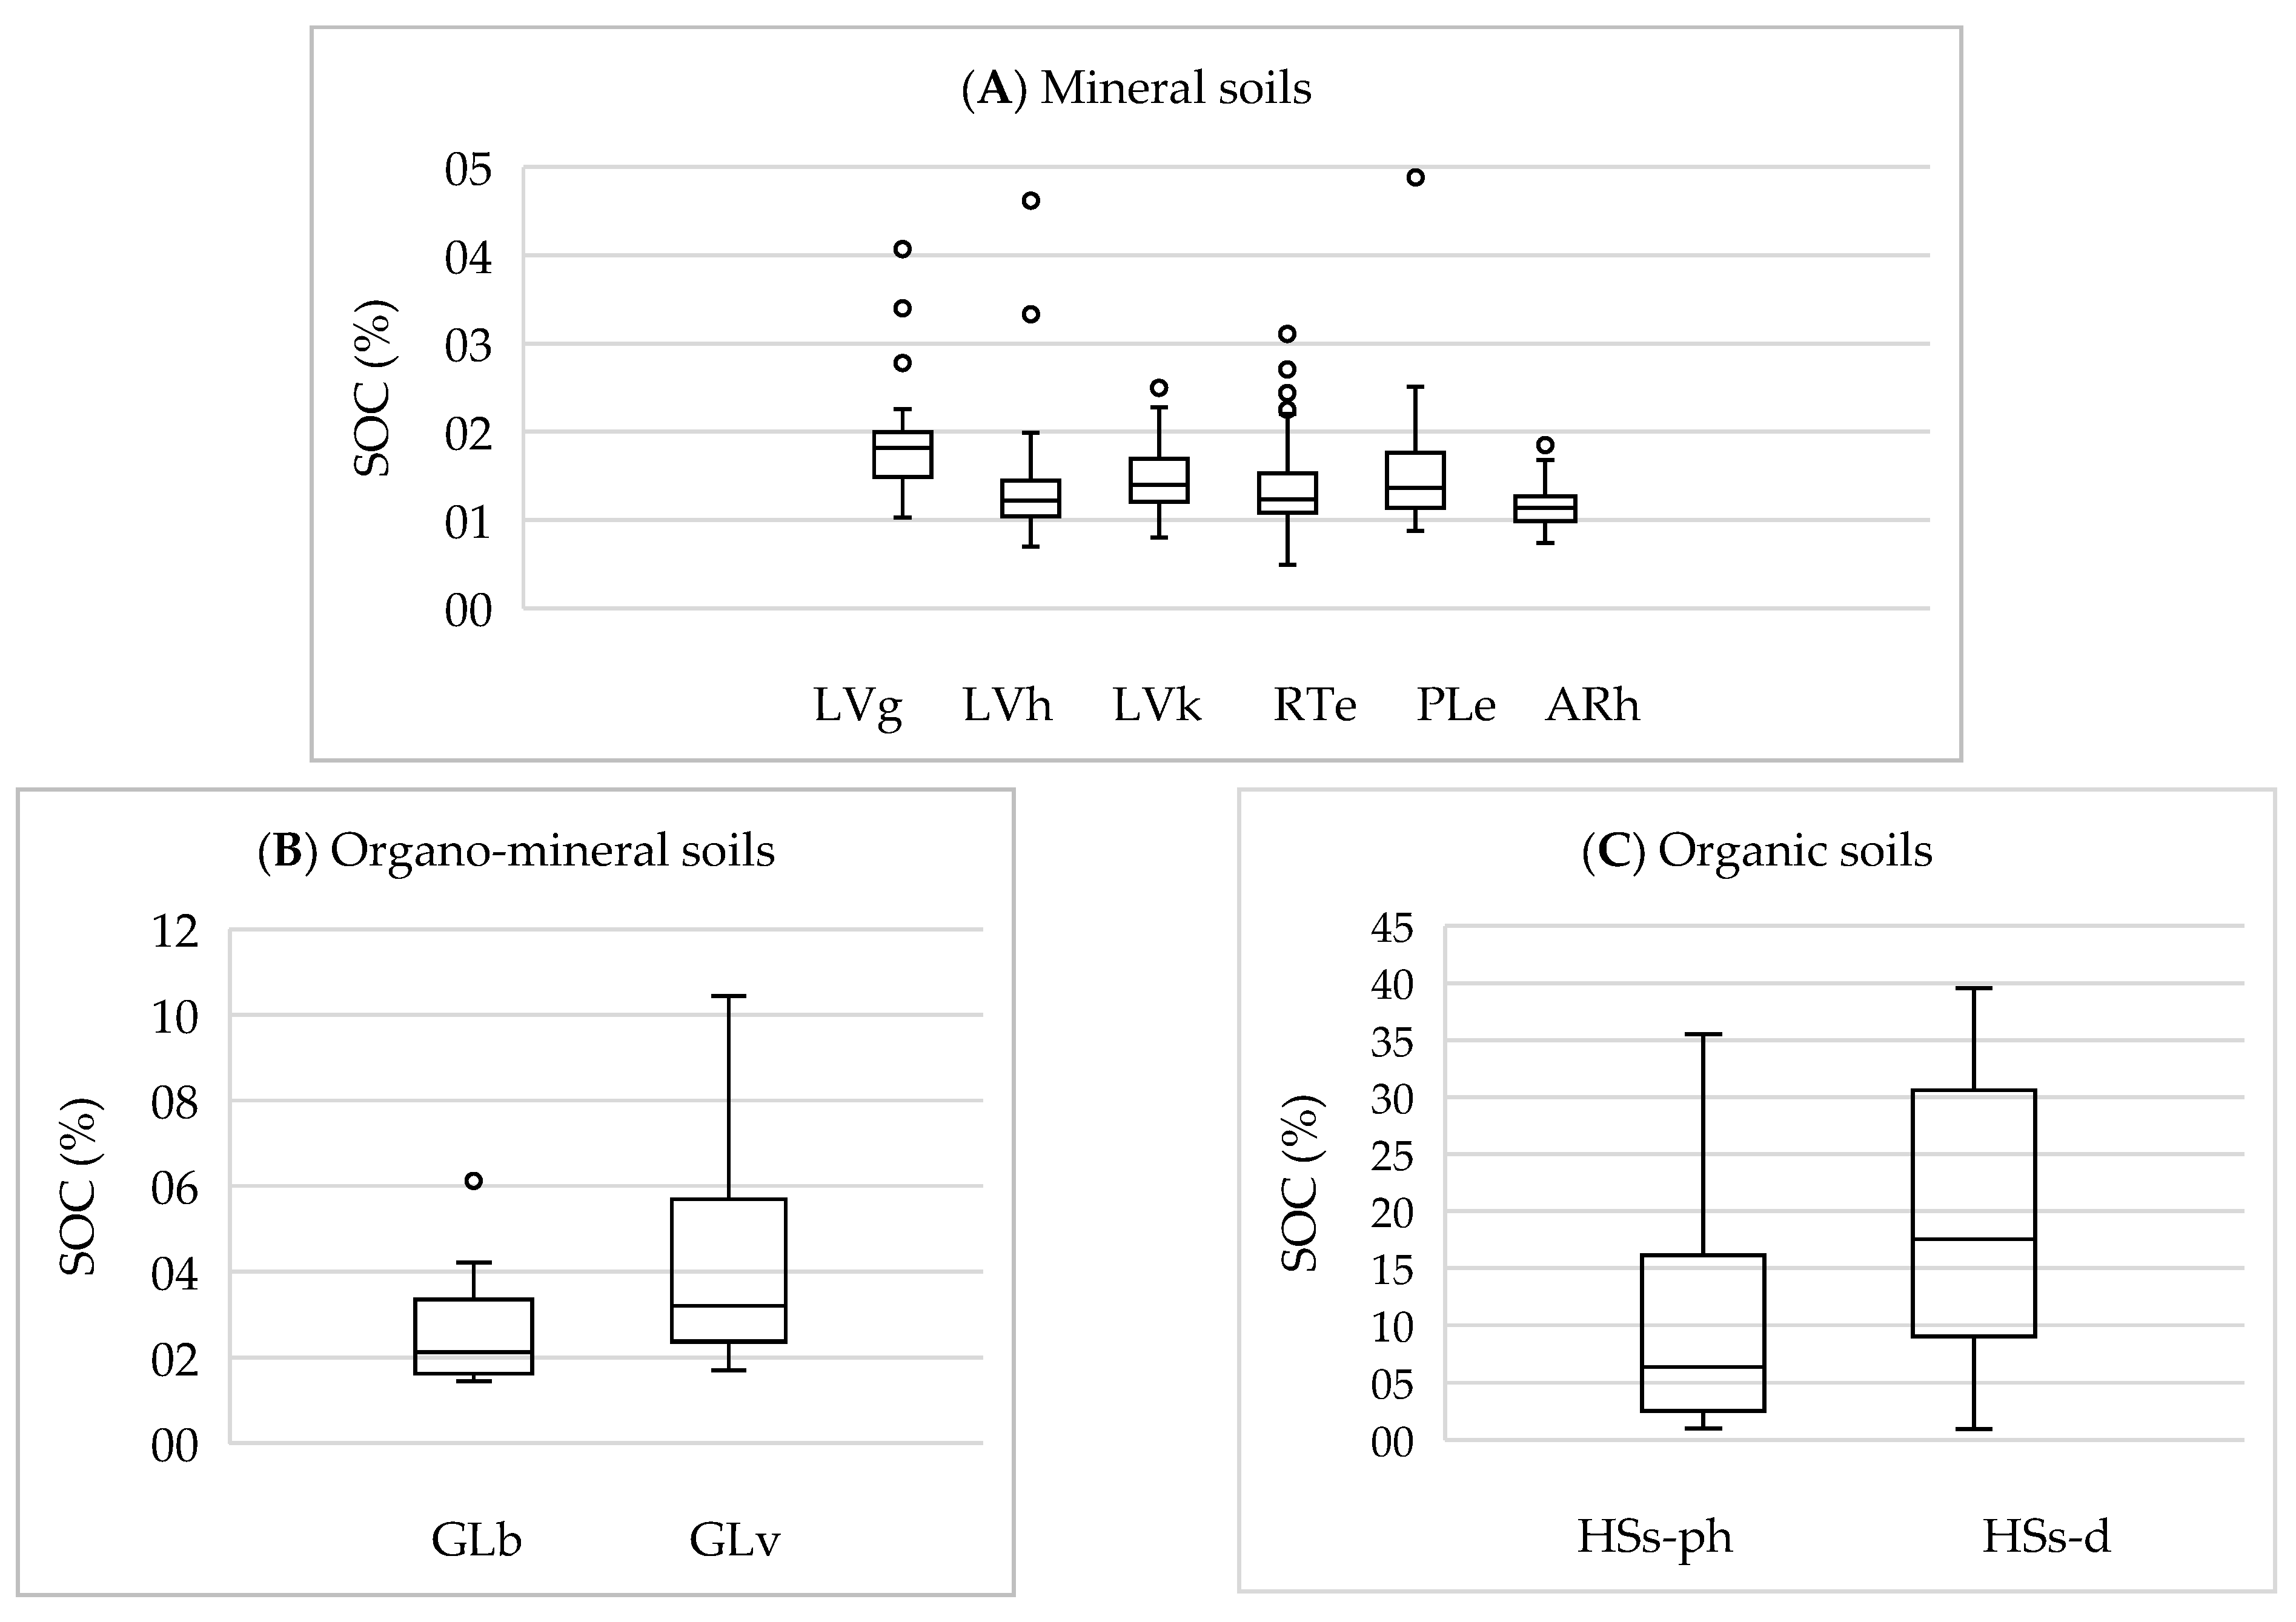
Part I of the Experiment. Accurate estimation of changes in soil organic carbon (SOC) is critical for assessing anthropogenic impacts on climate change. As SOC content is strongly influenced by soil type and texture, we conducted an analysis of SOC concentrations across various soil groups in Eastern Lithuania. A total of 400 soil samples were collected prior to fertilization with dried granulated SSD. Based on their properties and for comparison purposes, individual soils were grouped into three categories: mineral soils (Figure 1A), organo-mineral soils (Figure 1B), and organic soils (Figure 1C). All samples were taken from the 0–20 cm soil layer.
The largest group consisted of mineral soils, especially Eutric Retisols (n = 133), reflecting their predominance in the study region. The median SOC concentration in mineral soils ranged from 1.14% to 1.80% (Figure 1A). The smallest group—organo-mineral soils—included only two subtypes (Eutric Gleysols and Mollic Gleysols) and a total of 29 samples. Their SOC concentrations were 2.13% and 3.20%, respectively (Figure 1B).
The organic soils group, although consisting of just two subtypes (Pachiterric Histosols and Bathiterric Histosols), was more extensively represented (n = 59 samples) due to the widespread occurrence of such soils in the region. The SOC concentrations in these soils were 6.37% and 17.53%, respectively (Figure 1C).
Statistical analysis revealed a strong positive relationship (r = 0.74, p ≤ 0.01) between SOC concentration (y; %) and soil type (x). This relationship is described by a linear positive correlation equation, y = 1.3972x − 3.2672. SOC concentration increased consistently from mineral to organo-mineral and finally to organic soils. Based on the World Reference Base for Soil Resources (4th edition, 2022) [40] soil classification and the measured SOC levels in the 0–20 cm layer, the soils were ranked in descending order of SOC concentration as follows: Histosols -> Gleysols -> Luvisols -> Planosols -> Retisols -> Arenosols.
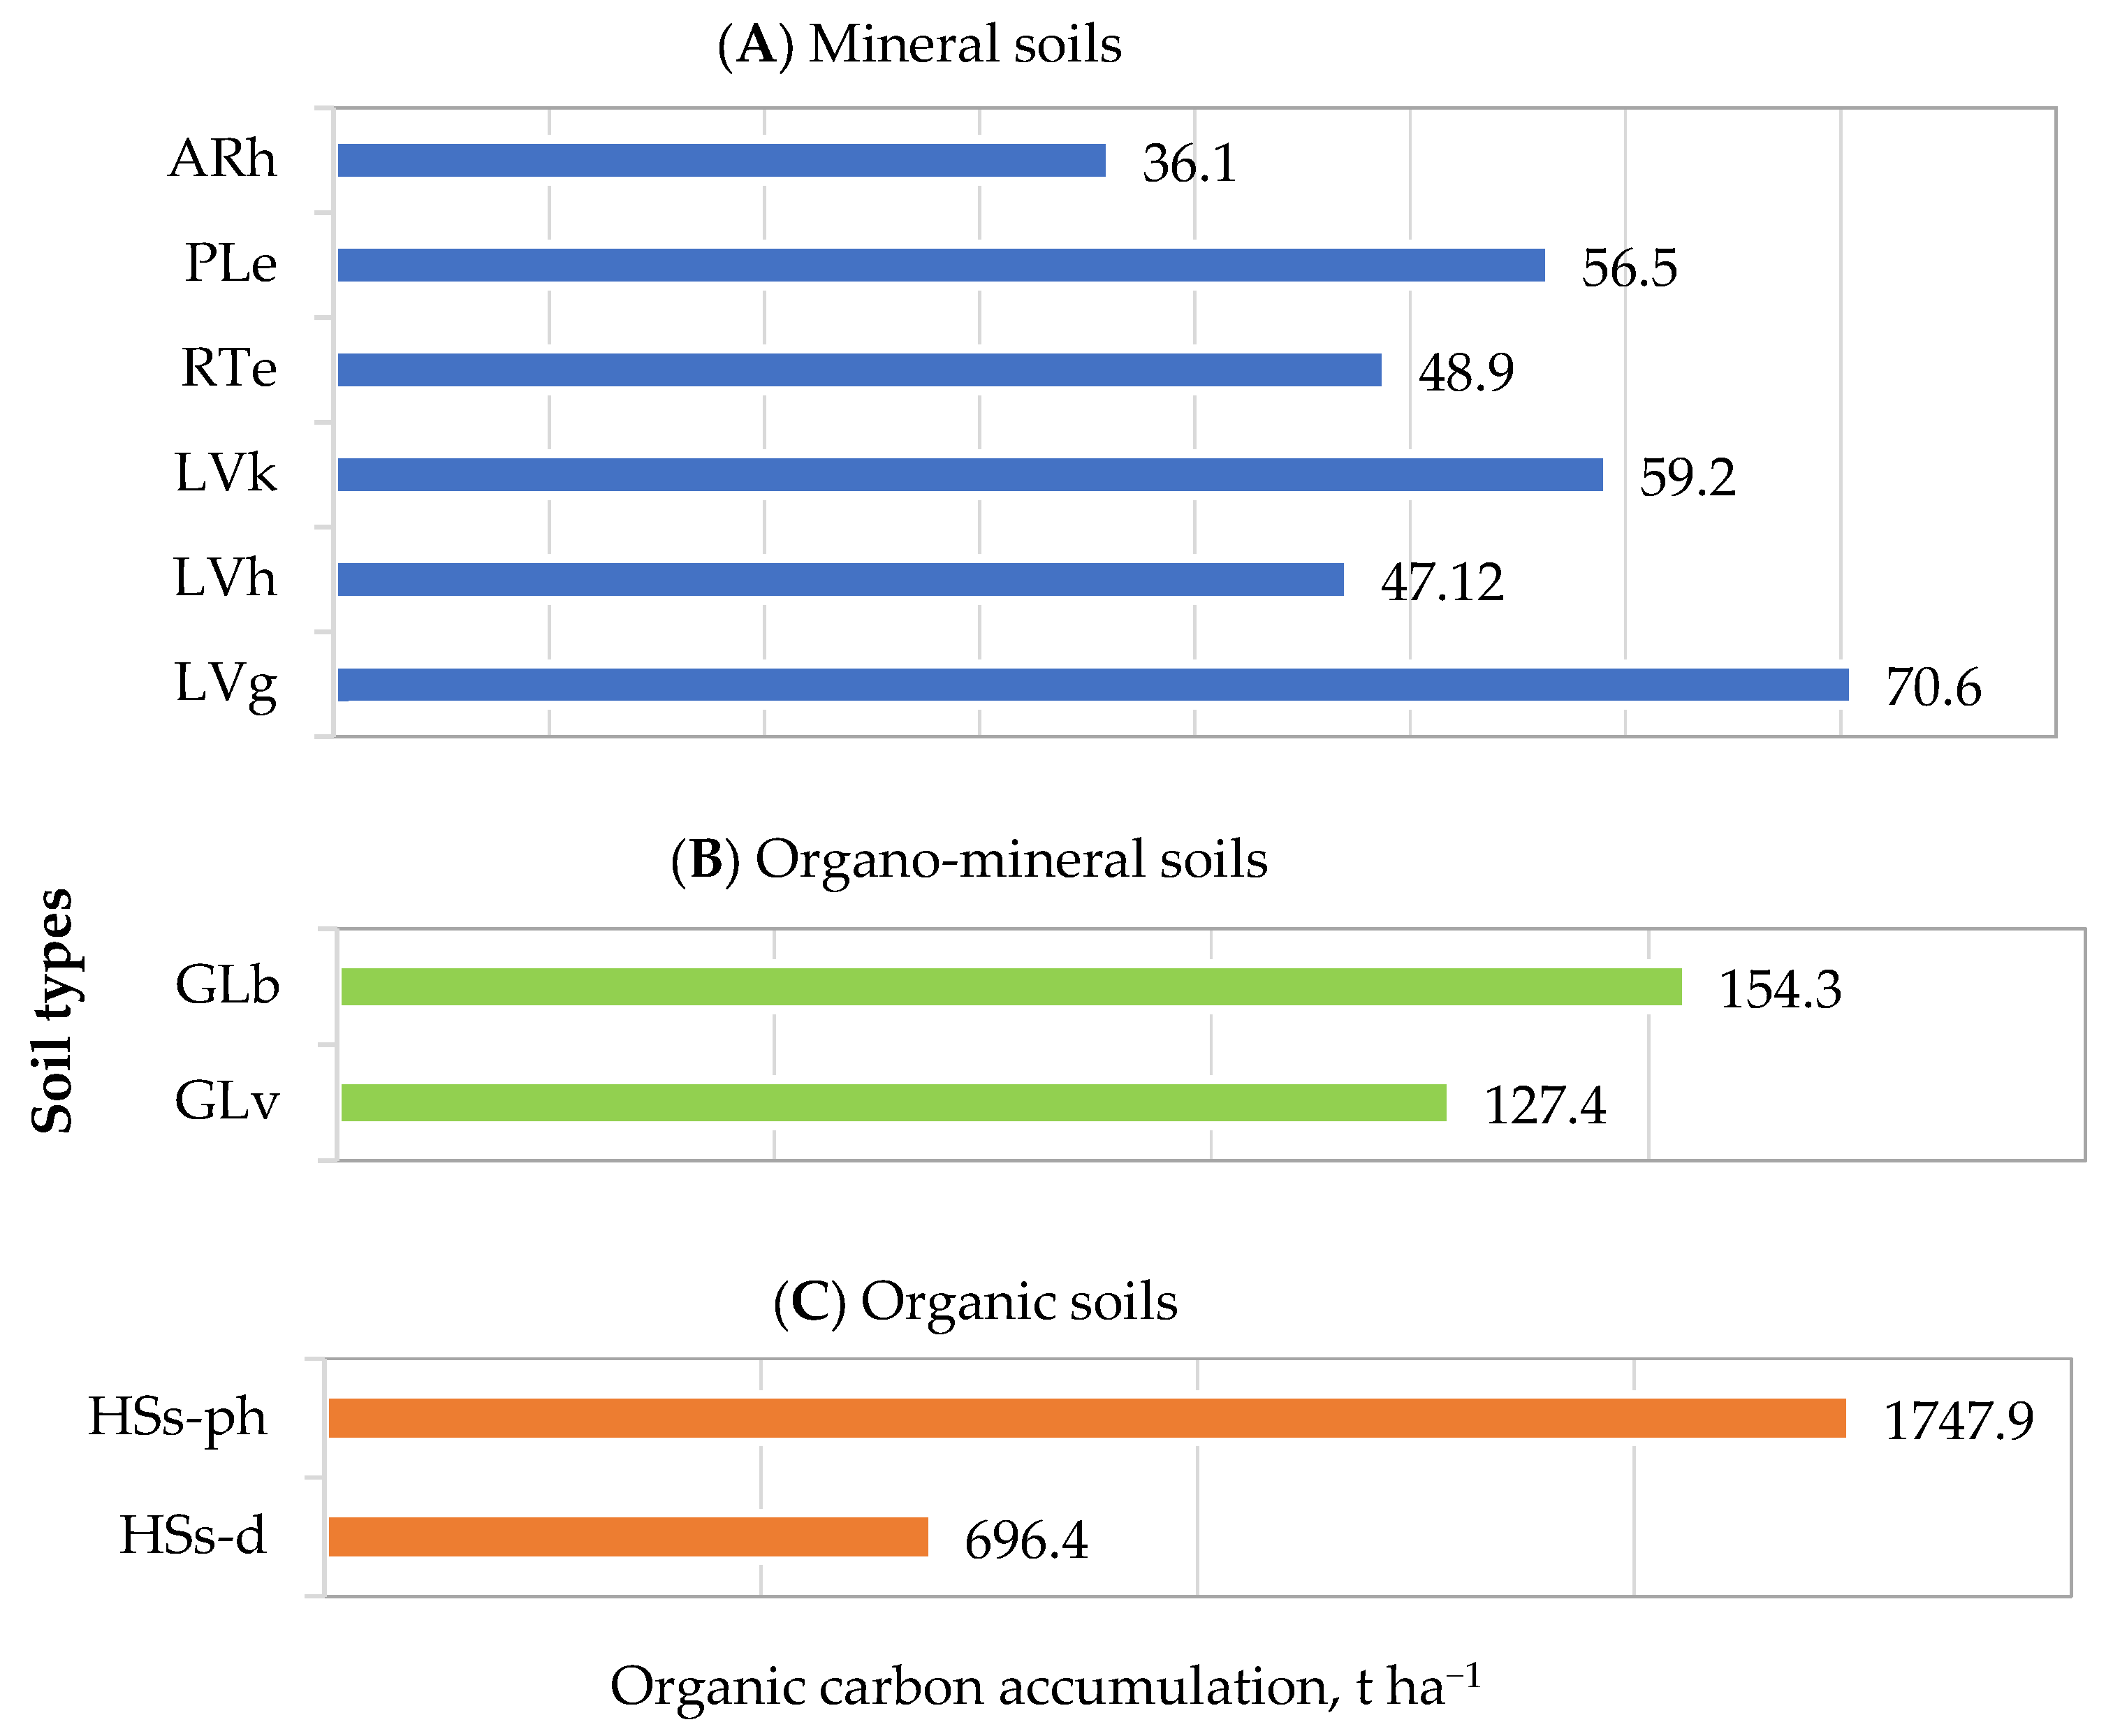
After determining the concentrations of SOC in different soil types, SOC accumulations (t ha−1) were also calculated (Figure 2A–C). The thickness of the humus layer varied between soil types: in mineral soils it ranged from 25 to 28 cm; in organo-mineral soils, from 34 to 35 cm; and in organic soils, from 50 to 100 cm.
The results indicated that SOC accumulations were the lowest in mineral soils, ranging from 36.1 to 70.6 t ha−1 (Figure 2A). This variation is expected, as SOC accumulation depends not only on soil properties but also on environmental factors. For instance, marked differences were observed between Haplic Arenosols, Gleyic or Calcaric Luvisols, and Eutric Planosols. Furthermore, SOC accumulation is strongly influenced by the thickness of the humic layer, which, as demonstrated, varied substantially between soil types. In organo-mineral soils, SOC accumulation differed less between the two soil subtypes examined—Eutric Gleysols and Mollic Gleysols—ranging from 127.4 to 154.3 t ha−1 (Figure 2B). In contrast, organic soils (Pachiterric and Bathiterric Histosols) demonstrated the highest levels of SOC accumulation (Figure 2C). Notably, Bathiterric Histosols accumulated 1051.5 t ha−1 more SOC than Pachiterric Histosols, reflecting the substantial carbon storage potential of deeper peat horizons.

3.2. Soil Organic Carbon Concentration and Accumulation in Soils of Different Textures

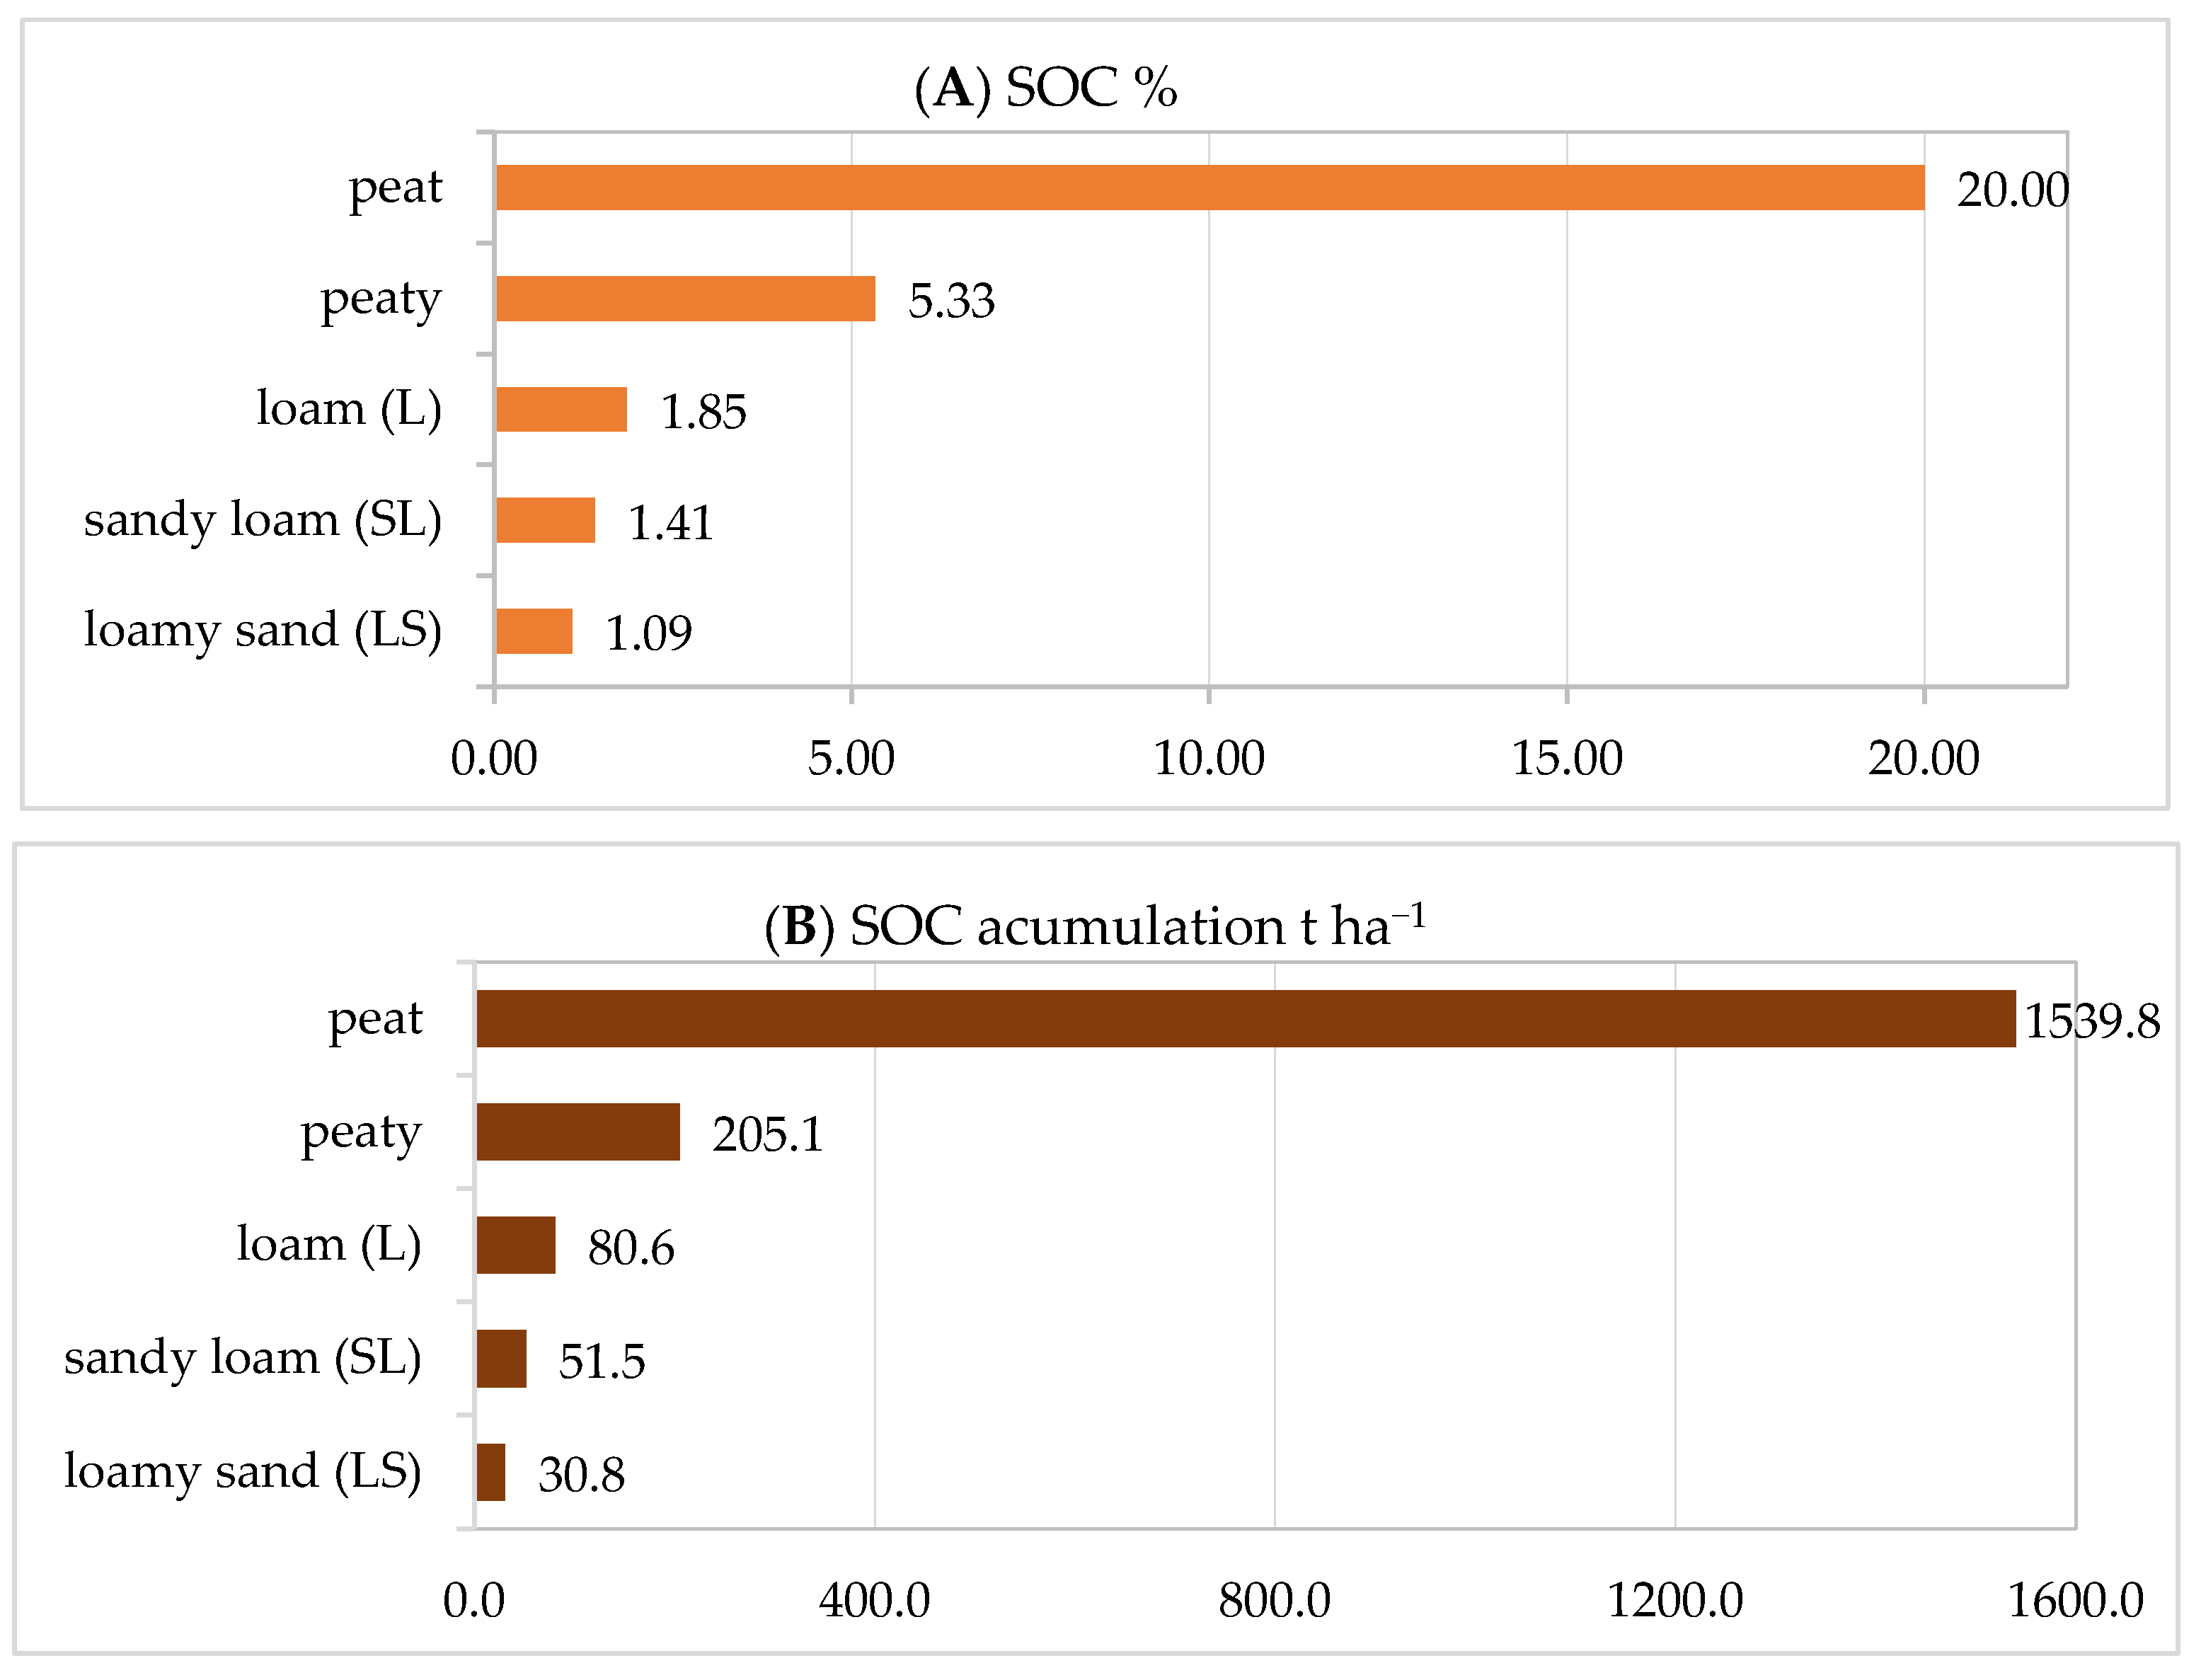
Part I of the Experiment. Soil texture plays a crucial role in the accumulation of soil organic carbon (SOC) and the preservation of carbon resources within the soil. The distribution of SOC concentrations across soils with varying soil textures is presented in Figure 3.
The lowest SOC concentration (1.09%) was observed in loamy sand soil (Figure 3A). According to the SOC evaluation scale provided in the methodological section (Table 1), this represents a low concentration. Similarly low SOC levels were found in sandy loam and loam soils. Although trends emerged here that as the soil texture became heavier, i.e., as the clay particles in its composition increased, the SOC concentration in the soil tended to rise.
Analysis of soils of organo-mineral and organic origin revealed particularly high SOC concentrations: 5.33% in peaty and 20.0% in peat soils (Figure 3A). These findings confirm that, as soils transition from mineral to organo-mineral and eventually to organic types, SOC concentrations increase substantially. Correlation analysis further demonstrated a strong positive relationship (r = 0.82, p ≤ 0.01) between SOC concentration (y; %) and soil texture (x). This is described by a linear positive correlation equation, y = 4.175x − 6.5904. The same trends are seen when calculating the accumulation of organic carbon in tons per hectare in soils of different textures (Figure 3B).

3.3. The Influence of Sewage Sludge Fertilization on Changes in Soil Organic Carbon Concentration and Accumulation in Soil

Part II of the Experiment. When cultivating SRC plantations of different ages and fertilizing them with treated sewage sludge (SS) (in Anykščiai district), SOC concentrations and their accumulation in different soil types tended to increase. In all fields, regardless of whether SRC was fertilized with SSD or not, SOC concentrations in soils were higher compared to the concentrations determined 30 years earlier (Table 4).
In Field 1 (Vilnius district), where 6-year-old poplars were grown, SOC concentrations in LVh and RTe soils increased by 0.09 and 0.30 percentage points, respectively, while SOC accumulation increased by 3.4 and 10.9 t ha−1, respectively. In Field 3 (Molėtai district), with third-year poplars and a higher soil productivity score, SOC concentrations and accumulations in soils were found to be slightly higher than in the first field. SOC concentrations in LVh and LVk soils increased by 0.26 and 0.08 percentage points, respectively, over the study period, while SOC accumulation increased by 9.6 and 2.9 t ha−1, respectively. The highest SOC concentrations and accumulations were observed in the soils of Field 2 (Anykščiai district), where SRC plantations were fertilized with sewage sludge (SS) twice during a 10-year growth period. After the first fertilization, SOC concentrations in different soils increased by 0.36 to 0.70 percentage points, and SOC accumulation by 13.7 to 27.2 t ha−1 compared to the initial soil studies. After the second fertilization with sewage sludge, SOC concentrations and their accumulation in soils also increased compared to the indicators determined after the first fertilization with SS, but within a slightly smaller range (0.14–0.37 percentage points).
Summarizing the results, it was observed that over three decades the most pronounced changes in SOC concentrations and accumulation were recorded in Field 2 (Anykščiai district), where SRP plantations were fertilized with SS twice. From the beginning of the study, these indicators in different soils increased by 0.50 to 1.07 percentage points and by 18.8 to 41.7 t ha−1, respectively (Table 4). These more significant changes were influenced not only by fertilization with dried, granulated sewage sludge but also likely by the continuous cultivation of SRC vegetation for ten years, which promoted greater organic carbon accumulation in the soil through leaf litter and root development. In contrast, in the first and third fields, the changes over three decades were very similar despite differences in plantation age. It is also important to note that all three experimental fields had previously been used for agricultural purposes prior to SRC establishment. Therefore, the results of this study support previous findings indicating that SOC accumulation in soils begins to intensify following afforestation or the establishment of SRC on agricultural land—typically after at least one decade and often only after several decades.

3.4. Digitization of Soil Organic Carbon Results in Maps and Evaluation

Part III of the Experiment. The generated digital maps enabled clear interpretation of SOC richness categories across the studied fields. These maps, constructed from SOC data (Part II of the Experiment and archival sources) together with soil type layers, depict the spatial distribution (%) of SOC concentrations in Vilnius (Field 1), Anykščiai (Field 2), and Molėtai (Field 3) (Figure 4, Figure 5 and Figure 6). Areas of low and high SOC can be visually identified, as well as their temporal changes. In Field 2 (SSD-fertilized), SOC was monitored in three sampling stages (Figure 5), whereas in Fields 1 and 3 it was assessed in two stages (Figure 4 and Figure 6).
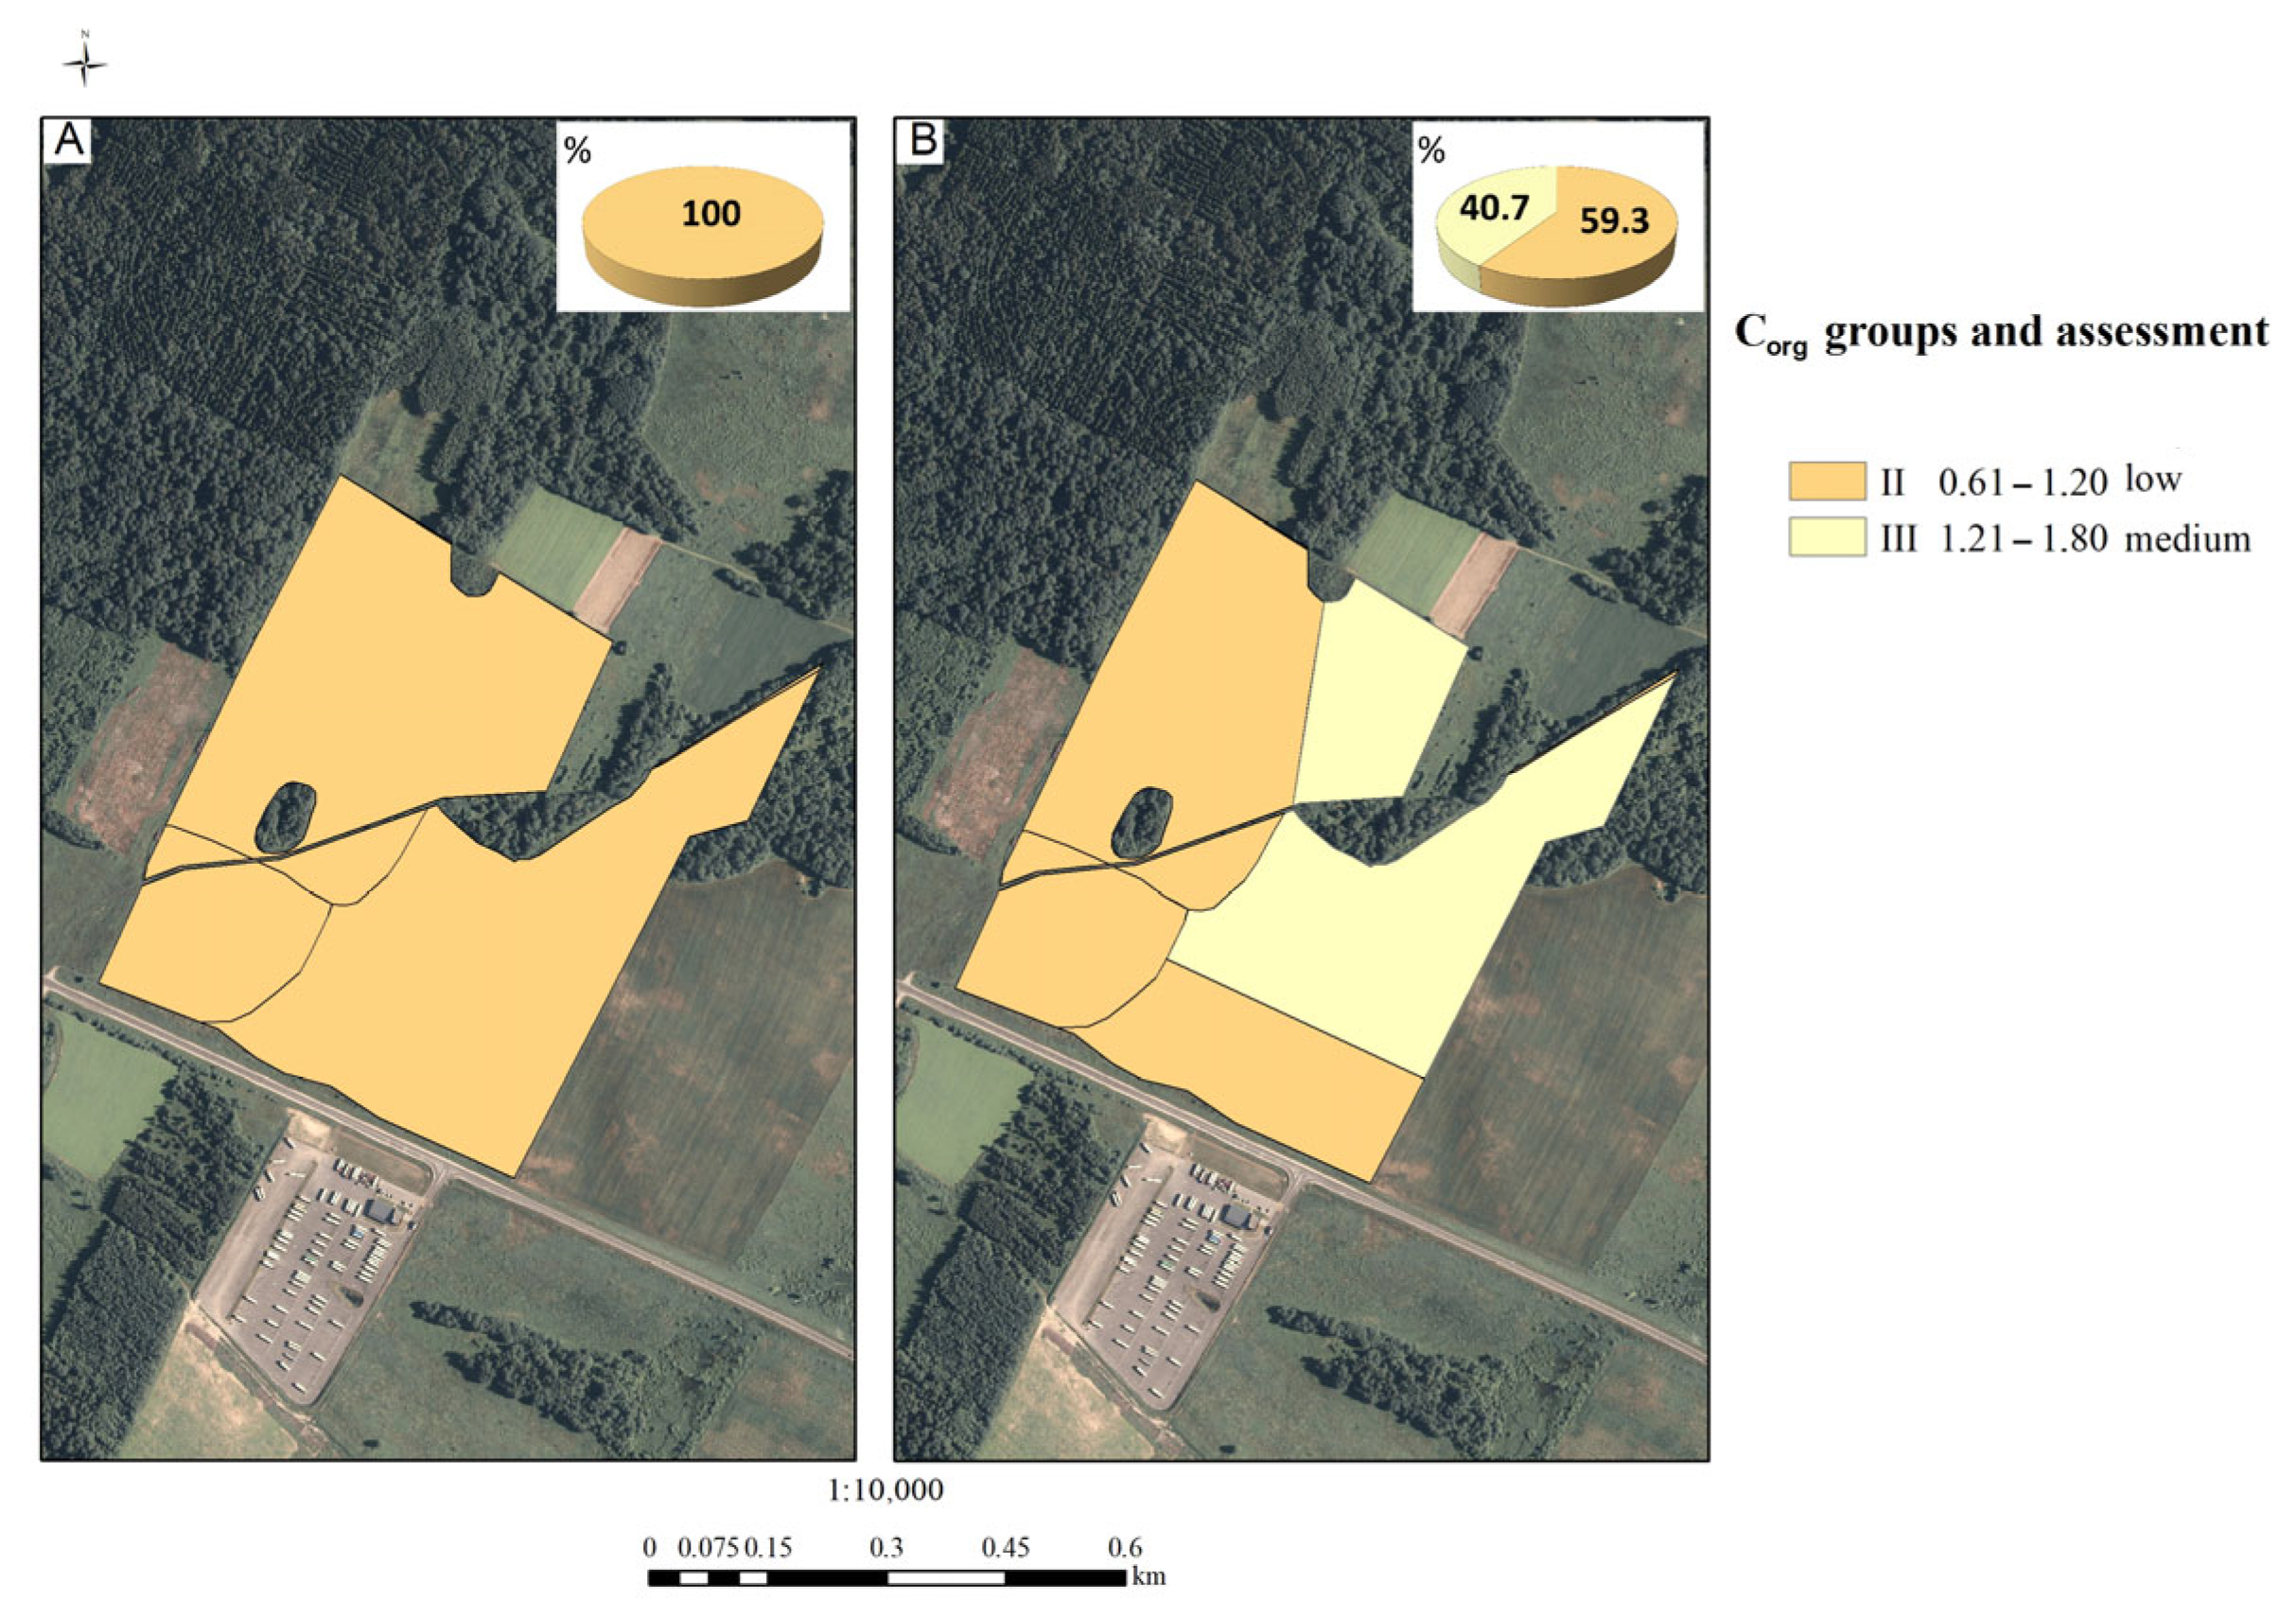
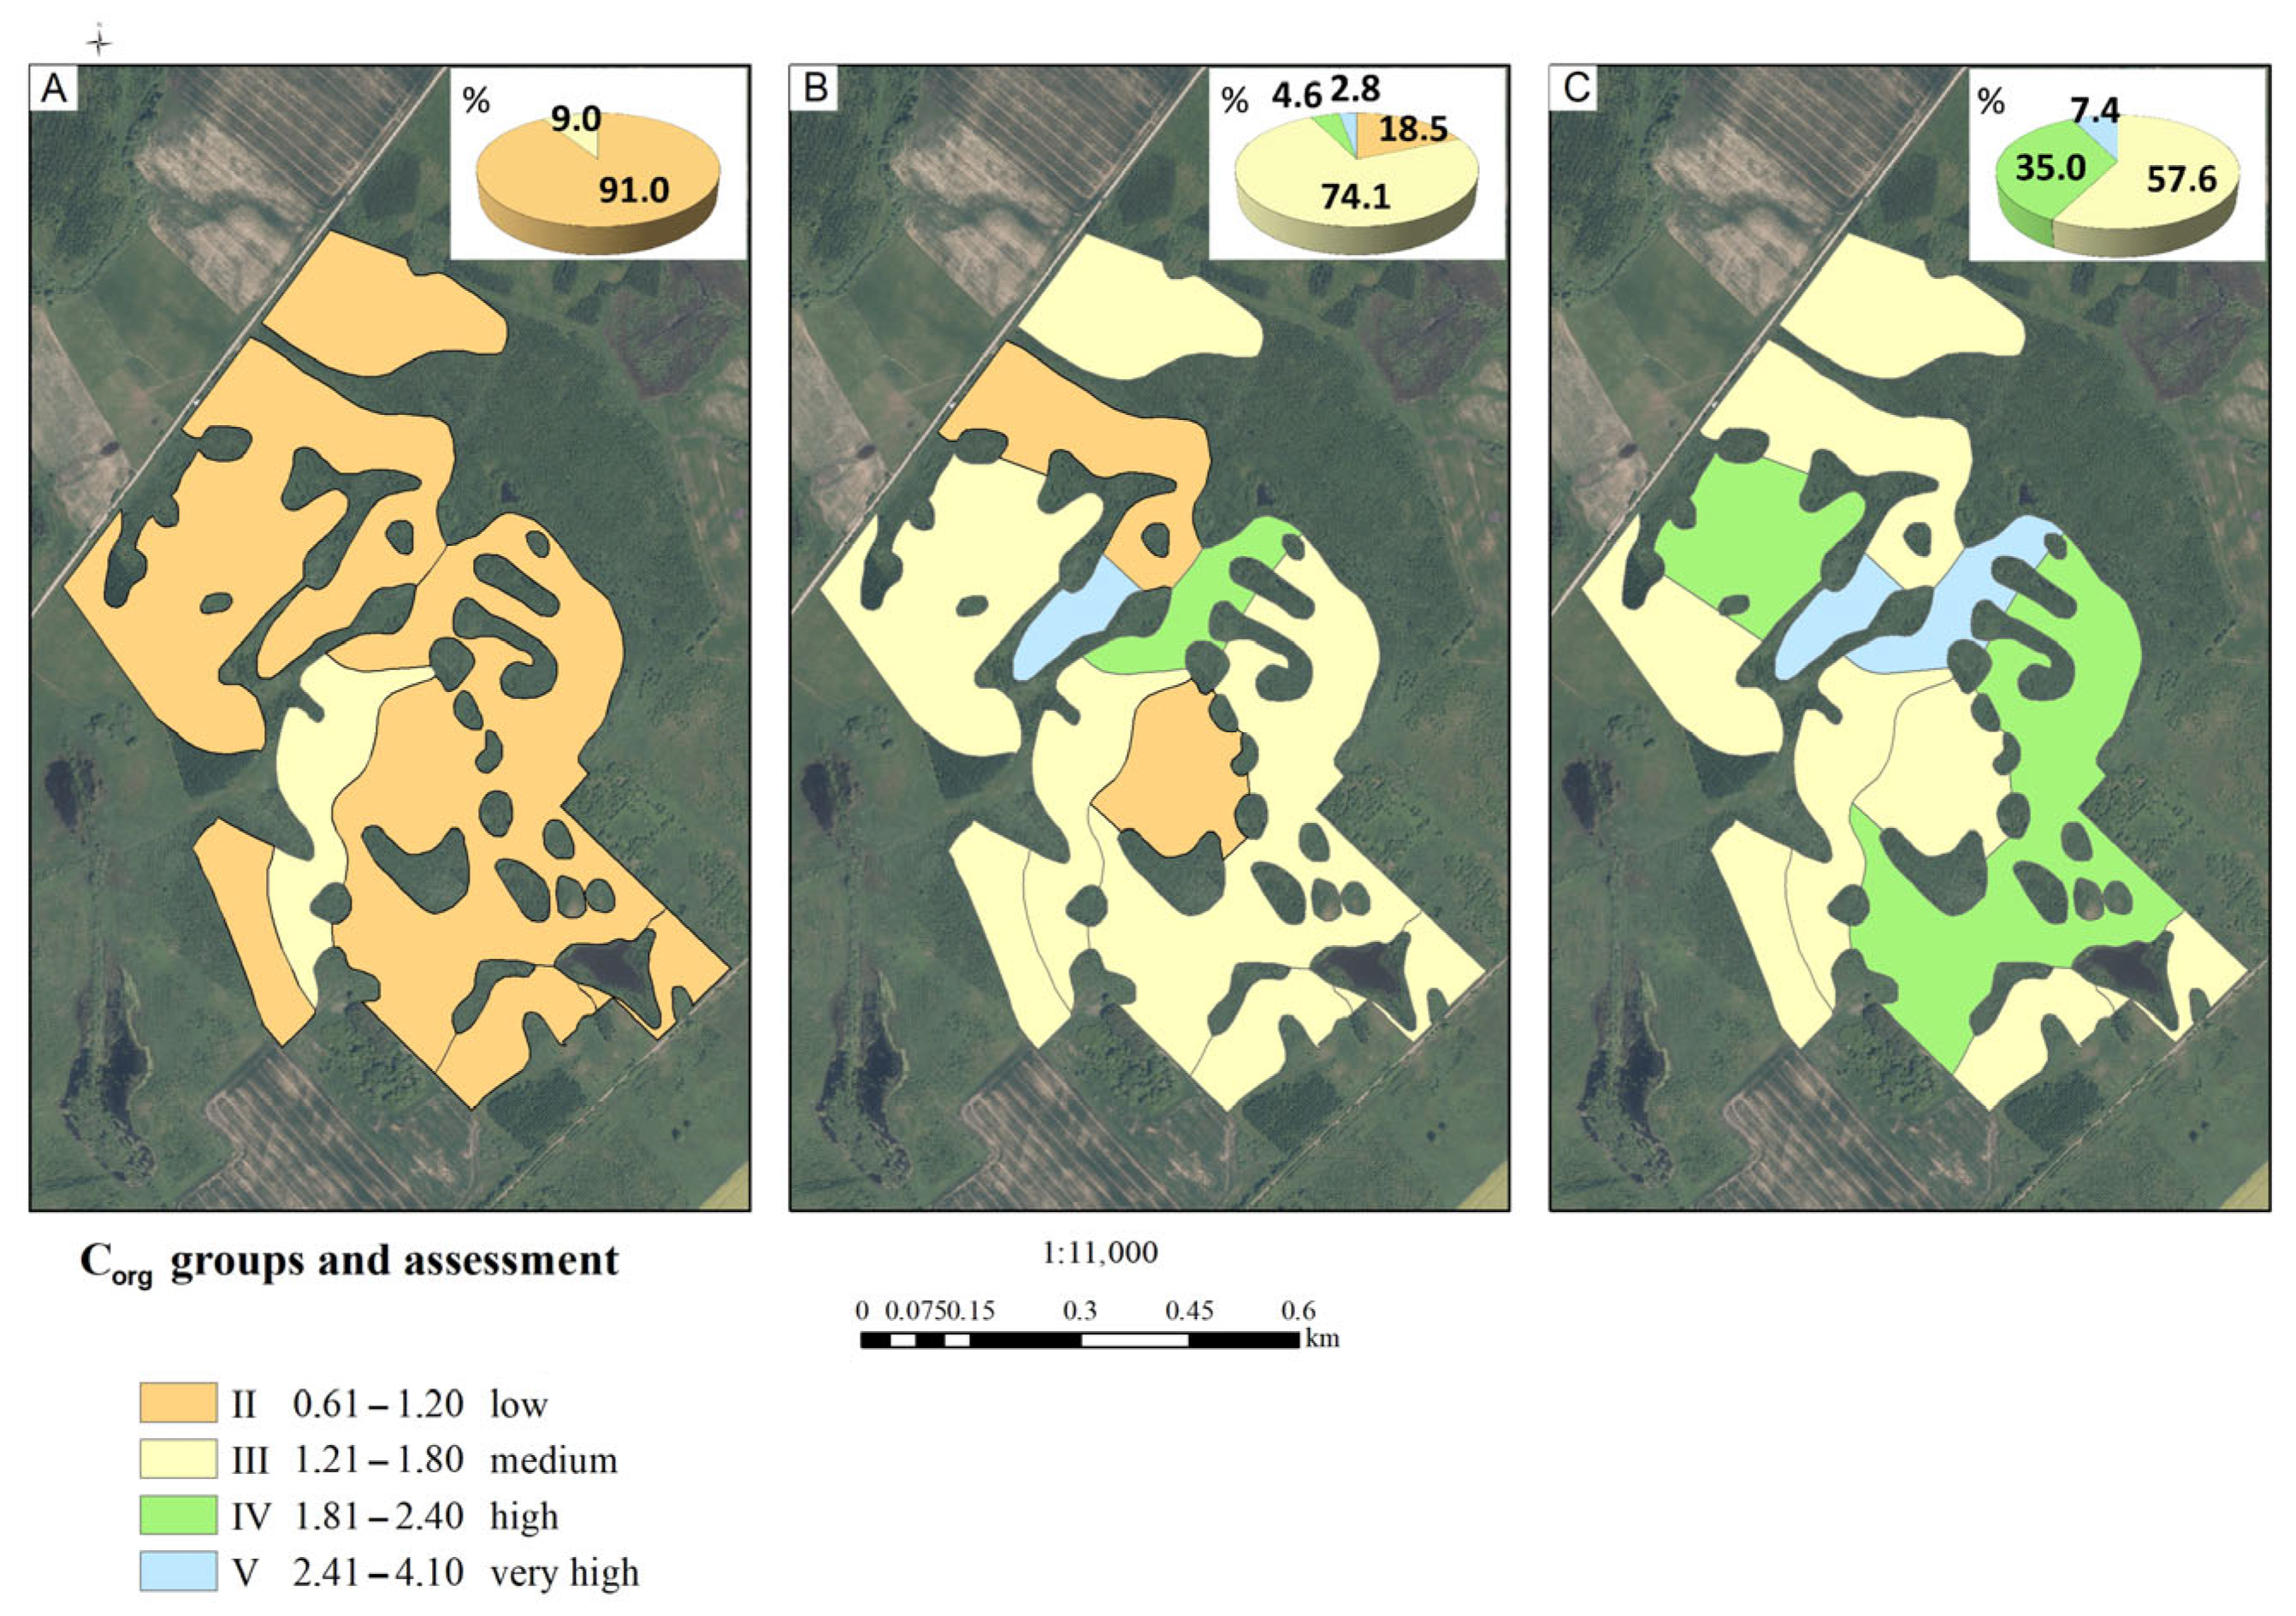
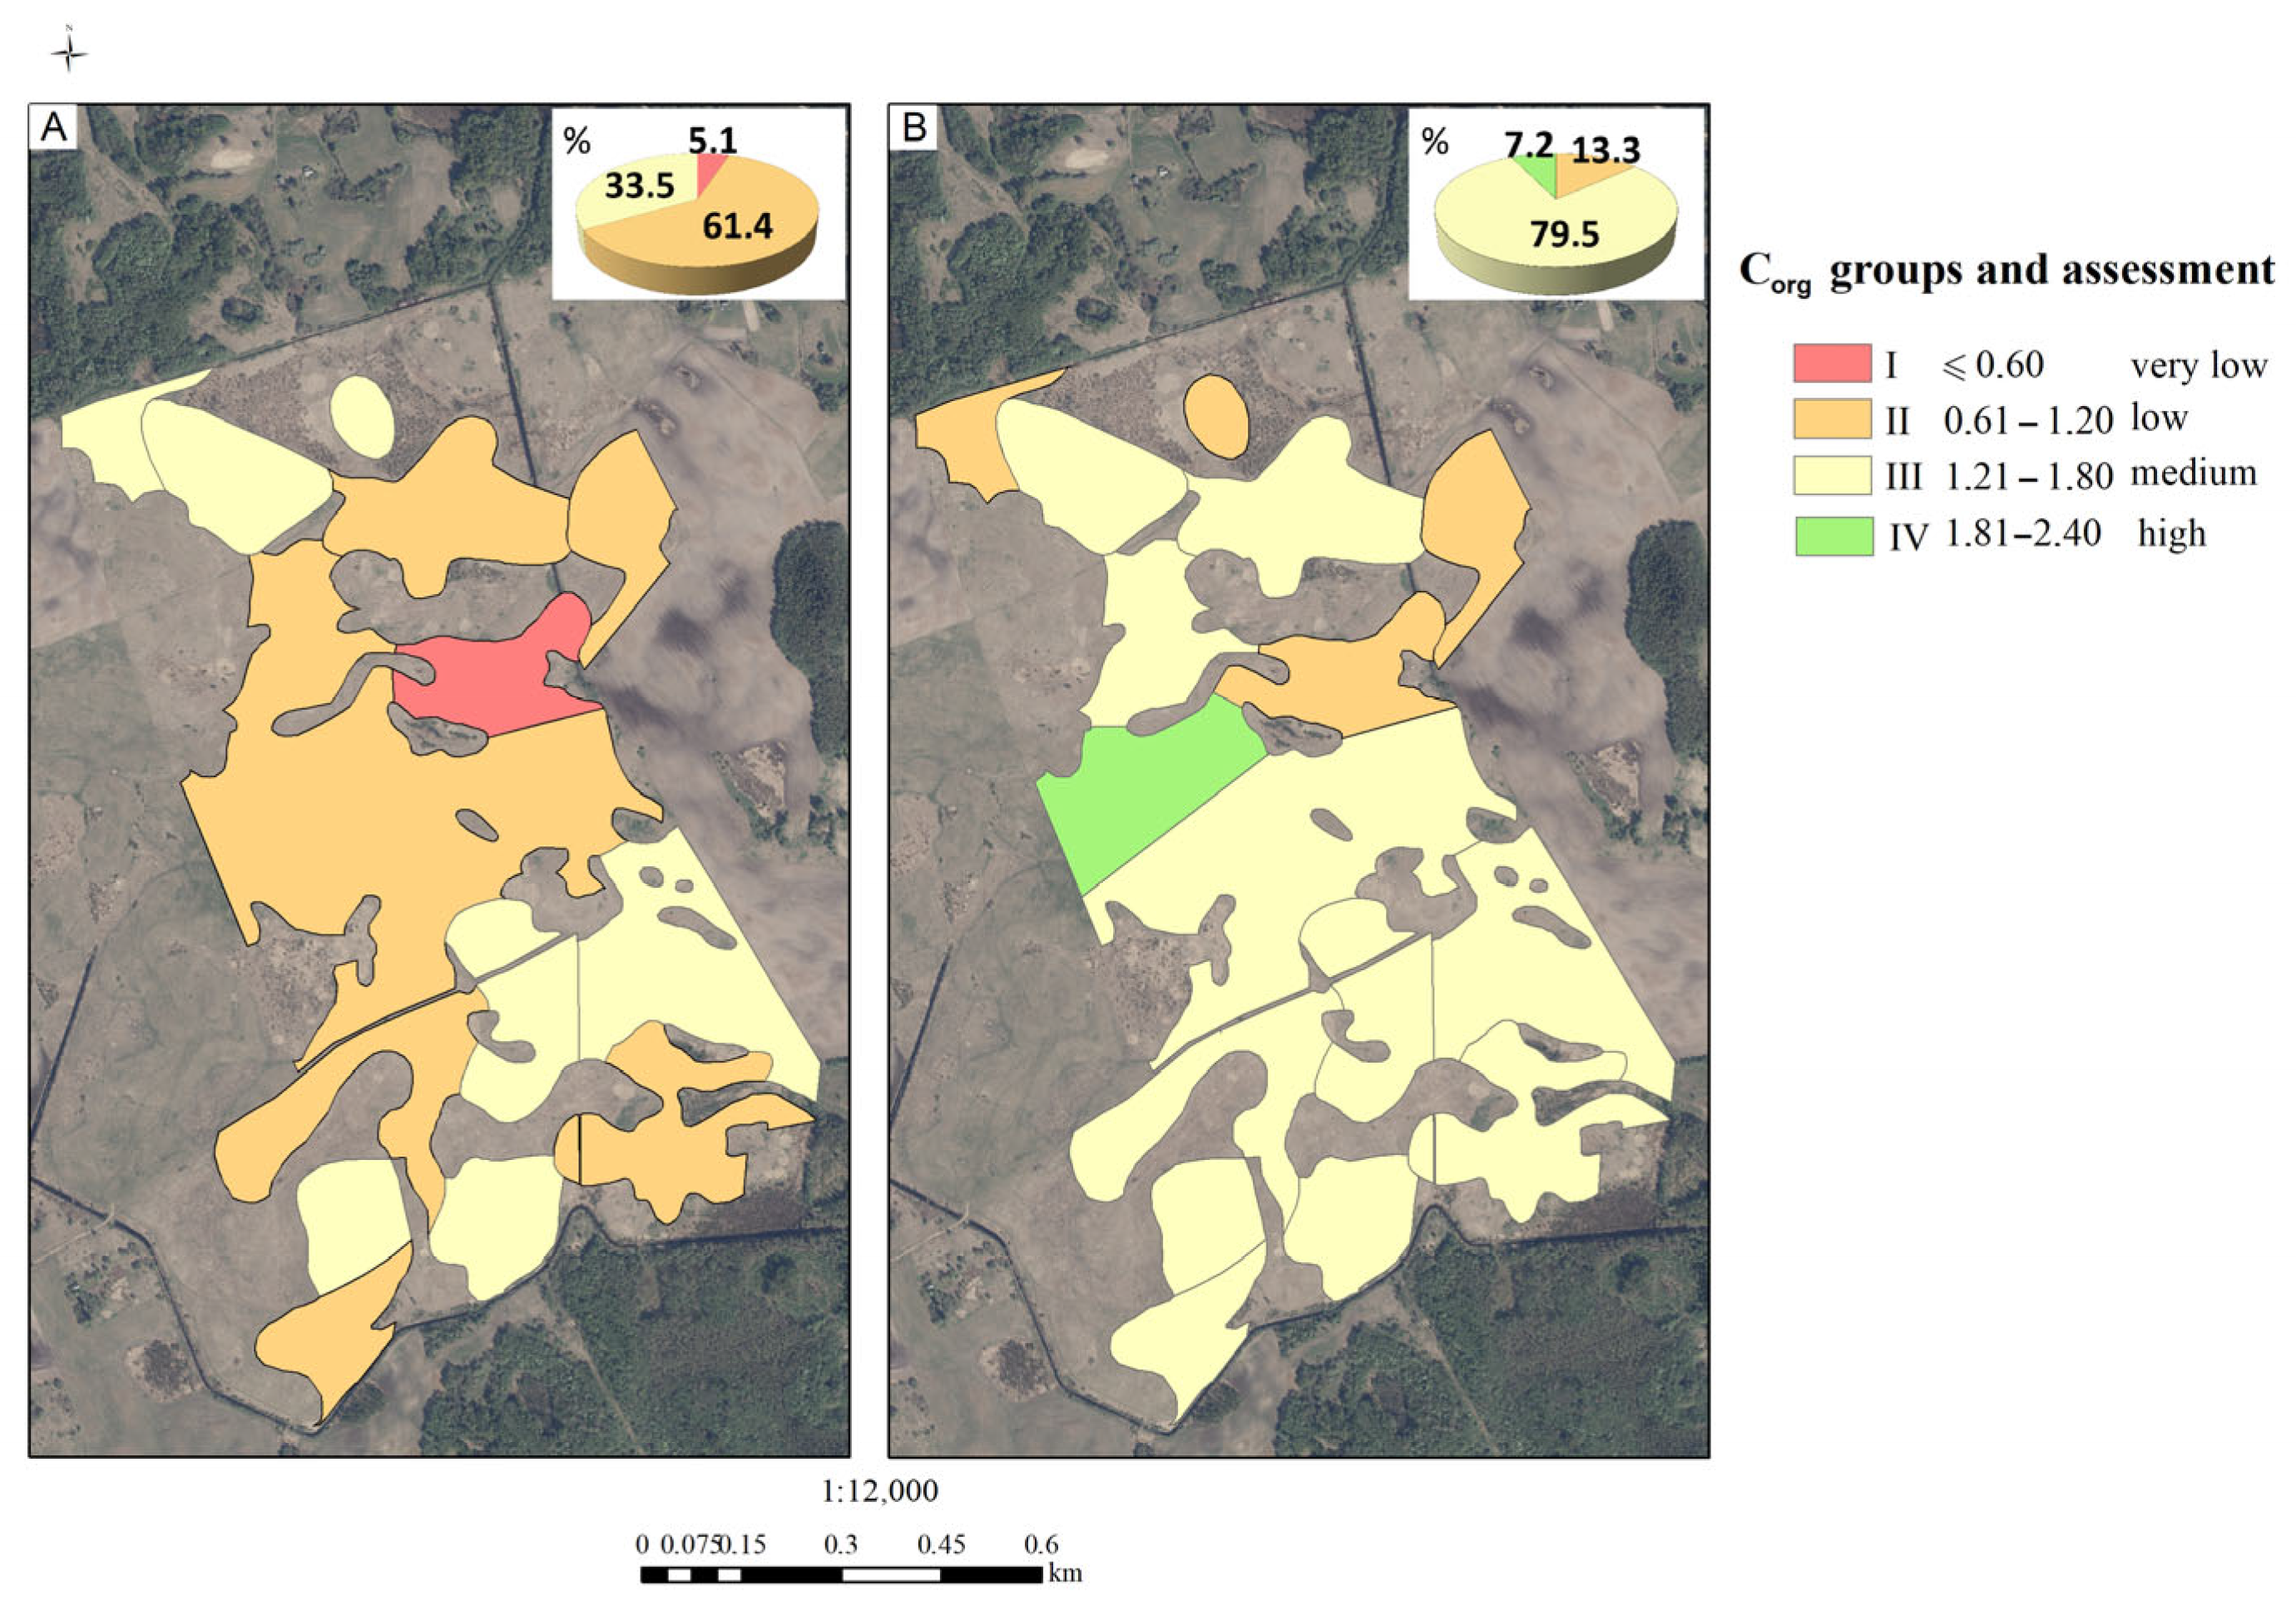
In the generated maps (Figure 4A, Figure 5A and Figure 6A), SOC in the soil is represented according to research results from 1989–1990. Points in the experimental fields where no research was conducted are depicted based on theoretical average values of organic carbon concentrations in the soil, taking into account varying soil moisture conditions and texture (according to Table 2). In the maps (Figure 4B, Figure 5B and Figure 6B), SOC richness groups are shown using conventional colors for comparison in the same areas, based on soil sampling conducted during the later study period (2018–2020; 2021), i.e., approximately three decades after the first phase of the study.
In the map (Figure 4A), it can be observed that Field 1 (Vilnius district) was dominated by soils with a low SOC concentration. Areas with low or medium organic carbon concentrations are visually distinguishable, making it convenient to assess changes in this indicator over time. The results indicate that SOC concentration in the soil increased following six years of SRC cultivation. The area with a low SOC concentration (<0.60%) in the experimental field decreased by 40.3%, while soils with a medium concentration (0.61–1.20%) accounted for 40.7% (Figure 4B).
When growing SRC and fertilizing them with SSD, the experimental Field 2 (Anykščiai district) recorded the best results regarding the changes in SOC concentration in the soil (Figure 5A). In the first phase (1989–1990), the studied field was dominated by soils with low SOC concentration, which accounted for 91.0% of the total area. Positive changes in SOC concentration in the soil were observed after the first fertilization of SRC plantations with SSD. Soils with medium SOC concentration (1.21–1.80%) accounted for 74.1% of the total soil area, while soils with high (1.81–2.40%) and very high (2.41–4.10%) SOC concentrations comprised 4.6% and 2.8%, respectively. The remaining 18.5% had low SOC (Figure 5B). However, the highest SOC concentrations in soils were found after the second fertilization with SSD (third stage in 2021). Low-concentration soils no longer appeared, while soils with high and very high SOC concentrations increased by 30.4 and 4.6 percentage points, respectively (Figure 5C).
In the experimental Field 3 (Molėtai district), soils of higher productivity were already predominant during the first stage (1989–1990) and were characterized by slightly higher SOC concentrations (Figure 6A). At that time, soils with medium SOC concentrations (1.21–1.80%) accounted for 33.5% of the area. Following the establishment of SRC stands and subsequent investigations, positive changes in SOC concentrations were observed (Figure 6B). Soils with very low SOC concentrations were no longer present, while the proportion of soils with medium concentrations increased by 46 percentage points, and those with high concentrations constituted 7.2% of the total studied area.
The results of this study demonstrate that, over a period of approximately three decades, all three experimental sites—located in the Vilnius, Anykščiai, and Molėtai districts—showed increases in SOC levels, particularly in areas where SRC were established and fertilized with treated SSD, which is important for mitigating CO2 emissions, as higher SOC enhances soil structural stability, promotes aggregation, and forms organo-mineral complexes that protect organic matter from rapid microbial decomposition, thereby retaining more carbon in the soil and reducing its release into the atmosphere. The most pronounced improvements were observed in the experimental Field 2 at the Anykščiai site, where successive SSD applications led to the complete elimination of low-SOC soils and a substantial expansion of soils with high and very high SOC concentrations. These findings underscore the potential of SRC cultivation combined with SSD fertilization as an effective strategy for enhancing soil carbon sequestration.

4. Discussion

4.1. Role of Soil Type in SOC Dynamics

In this study, soil type emerged as one of the main factors controlling soil organic carbon (SOC) accumulation under short rotation woody crops (SRC) plantations and provided the primary framework for interpreting long-term SOC changes. This finding is consistent with the well-established role of soil properties in regulating SOC dynamics across different land-use systems.
Carbon accumulation in soil is influenced not only by climatic factors (e.g., temperature and precipitation), land use, and vegetation but also by human economic activities, both past and present [47,48,49]. It is further determined by the soil’s intrinsic properties, such as parent materials, humus fraction, the thickness of the humus horizon, and soil bulk density [47,50]. Numerous studies conducted in Central and Eastern European countries, Ireland, the United Kingdom, and other European regions emphasize the strong influence of soil type on SOC stocks and their spatial distribution at national or regional scales [12,47,50,51].
Soil type integrates the effects of climate, topography, soil moisture regime, and texture, which explains its strong control over SOC accumulation in both topsoil and subsoil layers [52,53]. These integrative properties help explain the variation in SOC concentrations observed among different soil types in Europe and in the present study. For example, Gleysols can store large amounts of SOC due to terrain features associated with elevated soil moisture levels [54].
Previous studies have demonstrated that SOC concentrations in mineral, organo-mineral, and organic soils can differ several-fold. In the United Kingdom, SOC stocks in Histosols were reported to be nearly four times higher than in mineral soils and approximately 1.5 times higher than in organo-mineral soils such as Histic Gleysols and Podzols (organo-mineral soils) [55]. Similar trends were reported by De Vos and co-authors (2015), although the calculated SOC amounts were higher than those reported in the UK [47]. In Ireland, organic soils (Histosols) contained between 1.6–4.0 and 1.1–3.7 times more SOC than mineral and organo-mineral soils, respectively, when assessed to a depth of 100 cm [51]. Renou-Wilson et al. (2022) further showed that organic soils store approximately twice as much SOC as mineral soils at the national scale [56].
Our results under SRC plantations show comparable patterns but with more pronounced contrasts among soil groups. Specifically, SOC stocks were 4.5 times higher in organic soils than in organo-mineral soils (Gleysols) and 8.1 times higher than in mineral soils. These differences likely reflect regional soil characteristics, particularly variation in soil moisture regimes and the depth of humus-rich layers, which enhance SOC preservation under SRC management.
At the 0–20 cm soil depth, SOC concentrations in our study area followed a clear descending order: Histosols–Gleysols–Luvisols–Planosols–Retisols–Arenosols (Figure 1). This distribution closely resembles patterns reported for forest soils in Lithuania, where similar soil types were examined over a broader spatial extent [50]. In that study, SOC stocks (0–30 cm depth) decreased in the order: Histosols–Cambisols–Gleysols–Luvisols–Retisols–Podzols–Planosols–Fluvisols–Arenosols. Comparable soil-type-related SOC gradients have also been observed in Western European countries, although the ranking varies depending on depth and soil classification systems [51,55].
As reported in other studies [51,55], we also observed somewhat larger standard deviations from the mean values. These deviations were greater when evaluating organic soils (Histosols) and organo-mineral soils (Mollic Gleysols (GLv)). Although several outliers were identified within mineral soil groups, the number of observations within each soil category was sufficient to reliably capture SOC trends.
Overall, these results confirm that soil type exerts a dominant control on SOC accumulation under SRC plantations. Recognizing soil-specific differences in SOC storage capacity is therefore essential for interpreting long-term SOC dynamics and for guiding SRC establishment and management in a carbon sequestration context.

4.2. Role of Soil Texture in SOC Dynamics

The differences in SOC accumulation observed among soil types in this study can be partly explained by soil texture, particularly the proportion of clay particles, which plays a key mechanistic role in SOC stabilization. The observed SOC patterns therefore suggest that soil texture represents an important secondary control on SOC dynamics under SRC plantations.
Soil texture plays a key role in carbon storage in mineral soils and has long been recognized as a major regulator of SOC resources in relevant climate zones [12,57]. A substantial proportion of soil organic matter is closely associated with its mineral components, particularly with clay particles and, to a lesser extent, with silt fractions. Numerous studies have demonstrated the critical importance of the clay fraction for SOC accumulation, stabilization, and long-term preservation in soil [58,59].
In England and Wales, heavy clay soils have been shown to contain higher SOC concentrations than sandy soils in wet climatic conditions [60]. Najmuldeen H. Hamarashid et al. (2010) similarly reported that the capacity of soils to retain organic matter was greater in clay- and silt-rich fractions than in sand, and that soil texture significantly influenced carbon mineralization as well as microbial population structure and activity [61]. Consistent relationships between clay content and SOC dynamics have also been reported in other studies [62,63,64].
In the present study, comparable trends were observed under SRC cultivation, as SOC concentrations increased with increasing clay content (i.e., as soil texture became heavier) (Figure 3). This pattern indicates enhanced SOC stabilization in finer-textured soils and supports the mechanistic role of clay in protecting organic carbon from decomposition.
In soil science, the relationship between clay content and SOC dynamics is reflected in the ratio index of the aforementioned indicators, which allows assessing the condition of the soil from degraded to very good. The ratio should exceed 1:10 (SOC/clay) across soils of varying texture to reduce SOC deficits and enhance carbon stabilization [65,66]. In this context, the SOC/clay ratio provides a useful indicator for interpreting SOC stabilization potential in the soils examined in this study.
Overall, these findings indicate that soil texture, and particularly clay content, contributes to SOC stabilization under SRC plantations. Consideration of textural variability is therefore important for interpreting SOC distribution patterns and their response to SRC management across different soil types.

4.3. Effect of Sewage Sludge Fertilization on SOC Accumulation

Fertilization practices represent an important management component influencing SOC dynamics under SRC plantations. Among organic amendments, sewage sludge digestate (SSD) has received increasing attention due to its potential to enhance soil organic matter content while simultaneously supplying essential nutrients. Understanding the role of SSD application within SRC plantations is therefore important for interpreting SOC accumulation.
Sewage sludge has been widely recognized as a soil amendment that improves soil quality and increases organic matter content in many agricultural soils [28]. It provides essential nutrients, including nitrogen (N), phosphorus (P), organic carbon, sulfur (S), and various microelements [67,68,69,70]. Previous studies have shown that the application of sewage sludge, particularly on light-textured soils with initially low SOC levels, can lead to increases in SOC concentrations as well as total nitrogen and phosphorus availability [33,34].
The magnitude of SOC accumulation following sewage sludge application depends on several interacting factors, including soil texture, application rate, and previous land management. In many cases, increases in SOC are proportional to the amount of sludge applied and tend to be more pronounced in loamy soils than in clay soils [28]. Achkir et al. (2023) similarly reported that the application of different sewage sludge rates to soils of contrasting textures (clay–silt and sandy–clay) resulted in significant increases in organic matter, total organic carbon, and nutrient contents compared to unfertilized controls [71].
Several studies have further demonstrated that soils fertilized with sewage sludge digestate may contain substantially higher SOC stocks than soils receiving mineral fertilizers alone. For example, SSD-amended soils have been reported to contain up to three times more organic carbon than soils fertilized with inorganic fertilizers, without inducing adverse effects related to heavy metal accumulation [70,72,73].
In the present study, the most pronounced increases in SOC concentrations and stocks were observed in fields where SRC plantations were fertilized twice with SSD. These changes appear to reflect the combined effect of SSD application and SRC stand development. More pronounced SOC accumulation was associated with sites where SRC had been established for approximately 10 years, likely due to increased inputs of leaf litter and other biomass. In contrast, fields with younger SRC stands (three to six years after planting) exhibited more moderate SOC changes.
All three experimental fields were previously under agricultural use prior to SRC establishment. In line with previous studies, SOC accumulation following the conversion of agricultural land to SRC appears to become more evident after an initial transition period, as organic carbon inputs are gradually incorporated into soil organic matter fractions [74,75]. During the early years after planting, SOC stocks may temporarily decline as carbon is preferentially allocated to aboveground biomass.
Overall, these findings highlight the combined role of SRC cultivation duration and SSD application in enhancing SOC stocks. Considering both management practices and stand development is therefore essential for interpreting SOC responses and evaluating the potential of SRC systems for sustainable soil carbon sequestration.

4.4. Digital Mapping of SOC Distribution

From a spatio-temporal perspective, the results of this study demonstrate that digital soil mapping provides a robust framework for interpreting long-term soil organic carbon (SOC) dynamics in SRC plantations. This approach enables an integrated assessment of SOC spatial patterns and their evolution over multiple decades, which is essential for sustainable land-use planning and carbon sequestration strategies.
SOC is a key indicator of soil health and fertility, and its spatial and temporal variability is governed by interactions between pedological properties and management interventions. By integrating field measurements with soil type information and other spatial layers, digital soil mapping allows the development of high-resolution SOC maps for different time periods and supports the interpretation of long-term SOC accumulation trajectories across heterogeneous landscapes [76,77,78].
Digital maps revealed a consistent long-term increase in SOC across the investigated areas, confirming the trends identified in the field-based SOC assessments, particularly in field sections where SRC cultivation and SSD fertilization were applied. The long-term SOC accumulation dynamics depicted in the maps indicate that targeted management interventions can substantially modify SOC distribution patterns—shifting from low-SOC dominance toward a greater proportion of high and very high SOC categories. These trends align with previous studies that emphasize the reliability of digital SOC maps for interpreting spatial and temporal changes [76,77,78].
SOC accumulation likely reflects improved soil structural stability, enhanced aggregation, and the formation of stable organo-mineral complexes associated with SSD applications. These mechanisms reduce the rate of organic matter mineralization and promote long-term carbon retention in the soil.
Overall, digital soil mapping proved to be a reliable and practical tool for interpreting both spatial and temporal SOC dynamics under SRC plantations and partial SSD fertilization, supporting the integration of spatial analysis into long-term SOC assessment frameworks. This provides valuable support for decision-making aimed at enhancing soil carbon sequestration and promoting climate-resilient land-use practices.

5. Conclusions

Mineral soils (Gleyic Luvisols, Haplic Luvisols, Calcaric Luvisols, Eutric Retisols, Eutric Planosols, and Haplic Arenosols) had the lowest SOC (1.14–1.80%), organo-mineral soils (Eutric Gleysols and Mollic Gleysols) showed intermediate SOC (2.13–3.20%), and organic soils (Pachiterric Histosols and Bathiterric Histosols) exhibited the highest SOC (6.37–17.53%). SOC concentration increased consistently from mineral to organo-mineral and finally to organic soils, following a clear soil-type gradient defined by the World Reference Base for Soil Resources (WRB) classification. These results confirm that soil type is the main factor influencing SOC accumulation, with differences related to soil moisture regime, organic matter content, and humus layer thickness.
SOC concentrations increased with heavier soil textures. Soils with a greater proportion of fine particles, such as clay, consistently stored more carbon than lighter-textured soils (loamy sand), showing a positive correlation between SOC and soil texture (r = 0.82, p ≤ 0.01). This highlights the role of soil physical properties in stabilizing and retaining organic carbon. In peaty and peat soils, high SOC concentrations were primarily related to high organic matter content rather than textural effects.
Over the study period of approximately three decades, SOC increased in fields with SRC plantations established on former low-productivity agricultural land. In Field 2 (Anykščiai district) fertilized twice with SSD, SOC rose by 0.50–1.07 percentage points and accumulation by 18.8–41.7 t ha−1. In fields without SSD fertilization (Vilnius and Molėtai districts), SOC also increased due to SRC growth (6-year and 3-year periods) but to a lesser extent (0.08–0.30 percentage points and 2.9–10.9 t ha−1), reflecting the contribution of leaf litter deposition and root development. These results highlight the additional positive effect of SSD as an organic fertilizer while confirming that SRC cultivation alone promotes significant SOC accumulation.
Digital soil mapping proved to be a reliable tool for assessing spatial and temporal SOC dynamics under SRC plantations. The SOC maps illustrated long-term shifts from low-SOC dominance to higher SOC classes, particularly in fields with SRC cultivation and SSD fertilization. Integration of field measurements with soil type information enabled spatially explicit interpretation of SOC accumulation, demonstrating that digital mapping effectively supports the evaluation of management-induced SOC changes and informs sustainable land-use and soil carbon sequestration strategies.

Author Contributions

Conceptualization, A.M. and L.Ž.; methodology, A.M. and L.Ž.; software, A.M. and L.Ž.; formal analysis, A.M. and L.Ž.; investigation, A.M. and L.Ž.; data curation, A.M.; writing—original draft preparation, A.M. and L.Ž.; writing—review and editing, A.M. and L.Ž.; visualization, A.M. and L.Ž.; supervision, L.Ž.; project administration, L.Ž. All authors have read and agreed to the published version of the manuscript.

Funding

This work was financially supported by the LIFE program project “Nutrient recycling circular economy model for large cities—water treatment sludge and ashes to biomass to bio-energy—NutriBiomass4LIFE” (LIFE17/ENV/LT000310) and National Environmental and Agricultural Research Laboratory (Vytautas Magnus University Agriculture Academy).

Institutional Review Board Statement

Not applicable.

Data Availability Statement

The datasets used in this study originate from a project in which the public dissemination of raw primary data was neither required nor implemented. Only summarized results were made publicly available through the project reports; therefore, the raw datasets underlying this analysis are not publicly accessible.

Acknowledgments

This article was prepared based on the implemented LIFE program project. We would like to thank the LIFE program for the financial support and the opportunity to carry out the research presented in this article. We are also very grateful to the anonymous reviewers and editors for their valuable review comments and suggestions that have significantly improved this article.

Conflicts of Interest

The authors declare no conflicts of interest.

References

  1. Uddin, M.J.; Hooda, P.S.; Mohiuddin, A.S.M.; Haque, M.E.; Smith, M.; Waller, M.; Biswas, J.K. Soil organic carbon dynamics in the agricultural soils of Bangladesh following more than 20 years of land use intensification. J. Environ. Manag. 2022, 305, 114427. [Google Scholar] [CrossRef] [PubMed]
  2. Karstens, K.; Bodirsky, B.L.; Dietrich, J.P.; Dondini, M.; Heinke, J.; Kuhnert, M.; Müller, C.; Rolinski, S.; Smith, P.; Weindl, I.; et al. Management-induced changes in soil organic carbon on global croplands. Biogeosciences 2022, 19, 5125–5149. [Google Scholar] [CrossRef]
  3. Ahirwal, J.; Kumar, A.; Maiti, S.K. Effect of fast-growing trees on soil properties and carbon storage in an afforested coal mine land (India). Minerals 2020, 10, 840. [Google Scholar] [CrossRef]
  4. Haddaway, N.R.; Hedlund, K.; Jackson, L.E.; Kätterer, T.; Lugato, E.; Thomsen, I.K.; Jørgensen, H.B.; Isberg, P.E. How does tillage intensity affect soil organic carbon? A Systematic review protocol. Environ. Evid. 2016, 5, 1. [Google Scholar] [CrossRef]
  5. Cole, C.V.; Stewart, J.W.B.; Ojima, D.S.; Parton, W.J.; Schimel, D.S. Modelling Land Use Effects of Soil Organic Matter Dynamics in the North American Great Plains. In Ecology of Arable Land—Perspectives and Challenges; Clarholm, M., Bergström, L., Eds.; Developments in Plant and Soil Sciences; Springer: Dordrecht, The Netherlands, 1989; Volume 39, pp. 89–98. [Google Scholar]
  6. Davidson, E.A.; Ackerman, I.L. Changes in soil carbon inventories following cultivation of previously untilled soils. Biogeochemistry 1993, 20, 161–193. [Google Scholar] [CrossRef]
  7. Berhongaray, G.; Alvarez, R.; De Paepe, J.; Caride, C.; Cantet, R. Land use effects on soil carbon in the Argentine Pampas. Geoderma 2013, 192, 97–110. [Google Scholar] [CrossRef]
  8. Macdonald, L.M.; Farrell, M.; Baldock, J.A. Soil organic matter—What the science tells us. Grains Res. Update 2020, 28–35. Available online: https://grdc.com.au/__data/assets/pdf_file/0030/393843/GRDC-Grains-Research-Update-Proceedings-Barellan-2020-WEB.pdf (accessed on 24 July 2025).
  9. Eurostat. Eurostat Regional Yearbook 2009; European Commission: Luxembourg, 2009; Available online: https://ec.europa.eu/eurostat/web/products-statistical-books/-/ks-ha-09-001 (accessed on 24 July 2025).
  10. Lal, R. Soil carbon management and climate change. In Soil Carbon; Hartemink, A., McSweeney, K., Eds.; Progress in Soil Science; Springer: Cham, Switzerland, 2014; pp. 339–361. [Google Scholar]
  11. Sanderman, J.; Hengl, T.; Fiske, G.J. Soil carbon debt of 12,000 years of human land use. Proc. Natl. Acad. Sci. USA 2017, 114, 9575–9580. [Google Scholar] [CrossRef]
  12. Wiesmeier, M.; Urbanski, L.; Hobley, E.; Lang, B.; von Lützow, M.; Marin-Spiotta, E.; van Wesemael, B.; Rabot, E.; Ließ, M.; Garcia-Franco, N.; et al. Soil organic carbon storage as a key function of soils–A Review of drivers and indicators at various scales. Geoderma 2019, 333, 149–162. [Google Scholar] [CrossRef]
  13. European Commission. EU Soil Strategy for 2030: Reaping the Benefits of Healthy Soils for People, Food, Nature and Climate. In Communication from the Commission to the European Parliament, the Council, the European Economic and Social Committee and the Committee of the Regions, COM/2021/699 Final; European Commission: Brussels, Belgium, 2021; Available online: https://eur-lex.europa.eu/legal-content/EN/TXT/?uri=CELEX:52021DC0699 (accessed on 24 July 2025).
  14. Lal, R. Soil carbon sequestration impacts on global climate change and food security. Science 2004, 304, 1623–1627. [Google Scholar] [CrossRef]
  15. Powlson, D.; Gregory, P.; Whalley, W.; Quinton, J.; Hopkins, D.; Whitmore, A.; Hirsch, P.; Goulding, K. Soil management in relation to sustainable agriculture and ecosystem services. Food Policy 2011, 36, 72–87. [Google Scholar] [CrossRef]
  16. Stockmann, U.; Adams, M.A.; Crawford, J.W.; Field, D.J.; Henakaarchchi, N.; Jenkins, M.; Minasny, B.; McBratney, A.B.; Courcelles, V.D.R.D.; Singh, K.; et al. The Knowns, known unknowns and unknowns of sequestration of soil organic carbon. Agric. Ecosyst. Environ. 2013, 164, 80–99. [Google Scholar] [CrossRef]
  17. Mayer, M.; Prescott, C.E.; Abaker, W.E.; Augusto, L.; Cécillon, L.; Ferreira, G.W.; James, J.; Jandl, R.; Katzensteiner, K.; Laclau, J.; et al. Tamm Review: Influence of forest management activities on soil organic carbon stocks: A Knowledge synthesis. For. Ecol. Manag. 2020, 466, 118127. [Google Scholar] [CrossRef]
  18. Dobermann, A.; Bruulsema, T.; Cakmak, I.; Gerard, B.; Majumdar, K.; McLaughlin, M.; Reidsma, P.; Vanlauwe, B.; Wollenberg, L.; Zhang, F.; et al. Responsible plant nutrition: A new paradigm to support food system transformation. Glob. Food Secur. 2022, 33, 100636. [Google Scholar] [CrossRef]
  19. Ramesh, T.; Bolan, N.S.; Kirkham, M.B.; Wijesekara, H.; Kanchikerimath, M.; Srinivasa Rao, C.; Sandeep, S.; Rinklebe, J.; Ok, Y.S.; Choudhury, B.U.; et al. Chapter One—Soil organic carbon dynamics: Impact of land use changes and management practices: A Review. In Advances in Agronomy; Sparks, D.L., Ed.; Academic Press Inc.: Cambridge, MA, USA, 2019; Volume 156, pp. 1–107. [Google Scholar]
  20. Saygin, F.; Alaboz, P.; Dengiz, O.; Şenol, H. The Effect of organic waste applications on soil aggregation and soil organic carbon fractions. Commun. Soil Sci. Plant Anal. 2023, 54, 1644–1656. [Google Scholar] [CrossRef]
  21. Guo, L.B.; Gifford, R.M. Soil carbon stocks and land use change: A Meta-analysis. Glob. Change Biol. 2002, 8, 345–360. [Google Scholar] [CrossRef]
  22. Brandão, M.; Canals, L.M. Global Characterization factors to assess land use impacts on biotic production. Int. J. Life Cycle Assess. 2013, 18, 1243–1252. [Google Scholar] [CrossRef]
  23. Lal, R. Soil organic matter and crop yield. J. Soil Water Conserv. 2020, 75, 27–32. [Google Scholar] [CrossRef]
  24. Minasny, B.; Malone, B.P.; McBratney, A.B.; Angers, D.A.; Arrouays, D.; Chambers, A.; Chaplot, V.; Chen, Z.-S.; Cheng, K.; Das, B.S.; et al. Soil carbon 4 per mille. Geoderma 2017, 292, 59–86. [Google Scholar] [CrossRef]
  25. Shepard, J.P.; Tolbert, V.R. The Role of Short-Rotation Woody Crops in Sustainable Development. United States. 1996. Available online: https://www.osti.gov/servlets/purl/463585 (accessed on 15 March 2025).
  26. Wild, S.R.; Jones, K.C. Organic contaminants in waste waters and sewage sludges: Transfer to the environment following disposal. In Organic Contaminants in the Environment—Environmental Pathways & Effects; Jones, K.C., Ed.; Elsevier: London, UK, 1991; pp. 133–158. [Google Scholar]
  27. Petersen, S.O.; Henriksen, K.; Mortensen, G.K.; Krogh, P.H.; Brandt, K.K.; Sørensen, J.; Madsen, T.; Petersen, J.; Grøn, C. Recycling of sewage sludge and household compost to arable land: Fate and effects of organic contaminants, and impact on soil fertility. Soil Tillage Res. 2003, 72, 139–152. [Google Scholar] [CrossRef]
  28. Aggelides, S.; Londra, P. Effects of compost produced from town wastes and sewage sludge on the physical properties of a loamy and a clay soil. Bioresour. Technol. 2000, 71, 253–259. [Google Scholar] [CrossRef]
  29. Bai, J.; Sun, X.; Xu, C.; Ma, X.; Huang, Y.; Fan, Z.; Cao, X. Effects of sewage sludge application on plant growth and soil characteristics at a Pinus sylvestris var. mongolica plantation in Horqin sandy land. Forests 2022, 13, 984. [Google Scholar] [CrossRef]
  30. Abreu-Junior, C.H.; de Lima Brossi, M.J.; Monteiro, R.T.; Cardoso, P.H.S.; da Silva Mandu, T.; Nogueira, T.A.R.; Ganga, A.; Filzmoser, P.; de Oliveira, F.C.; Firme, L.P.; et al. Effects of sewage sludge application on unfertile tropical soils evaluated by multiple approaches: A Field experiment in a commercial Eucalyptus plantation. Sci. Total Environ. 2019, 655, 1457–1467. [Google Scholar] [CrossRef] [PubMed]
  31. Alvarenga, P.; Mourinha, C.; Farto, M.; Santos, T.; Palma, P.; Sengo, J.; Morais, M.-C.; Cunha-Queda, C. Sewage sludge, compost and other representative organic wastes as agricultural soil amendments: Benefits versus limiting factors. Waste Manag. 2015, 40, 44–52, Erratum in Waste Manag. 2015, 44, 227. [Google Scholar] [CrossRef]
  32. Mañas, P.; Castro, E.; de las Heras, J. Application of treated wastewater and digested sewage sludge to obtain biomass from Cynara cardunculus L. J. Clean. Prod. 2014, 67, 72–78. [Google Scholar]
  33. Zhao, Q.; Chu, S.; He, D.; Wu, D.; Mo, Q.; Zeng, S. Sewage sludge application alters the composition and co-occurrence pattern of the soil bacterial community in Southern China forestlands. Appl. Soil Ecol. 2021, 157, 103744. [Google Scholar] [CrossRef]
  34. Mukhopadhyay, R.; Jat, H.S.; Singh, R.; Rai, A.; Meena, R.P.; Singh, V.K.; Sharma, P.C. Restoring soil quality and carbon sequestration potential of waterlogged saline land using subsurface drainage technology in semiarid region of India. Sci. Total Environ. 2023, 878, 162850. [Google Scholar]
  35. Baum, C.; Leinweber, P.; Weih, M.; Lamersdorf, N.; Dimitriou, I. Effects of short rotation coppice with willows and poplar on soil ecology. Agric. For. 2009, 59, 183–191. [Google Scholar]
  36. Staugaitis, G.; Masevičienė, A.; Žičkienė, L. Studies of Soil Organic Carbon (Humus) in Agricultural Land; Recommendations; Lithuanian Centre for Agricultural and Forestry Sciences: Vilnius, Lithuania, 2022; 32p. (In Lithuanian) [Google Scholar]
  37. Staugaitis, G.; Mažvila, J.; Adomaitis, T. Humus content. In Innovative Solutions of Soil Science and Agrochemistry Science: Monograph; Lithuanian Agricultural and Forest Science Center, Agrochemical Research Laboratory: Vilnius, Lithuania, 2015; pp. 207–210. (In Lithuanian) [Google Scholar]
  38. Juodis, J. Dirvožemių rajonai. In Lietuvos Dirvožemiai; Lietuvos mokslas: Vilnius, Lithuania, 2001; kn. 32; pp. 699–707. (In Lithuanian) [Google Scholar]
  39. Normative Document LAND 20-2005. On Approval of Requirements for Handling and Utilization of Sewage Sludge. Order of the Minister of the Environment of the Republic of Lithuania No. 349 of 29 June 2001 (Summary Version From 1 January 2025). Available online: https://e-tar.lt/portal/lt/legalAct/TAR.3536A8337E8A/asr (accessed on 25 April 2025).
  40. IUSS Working Group WRB. World Reference Base for Soil Resources: International Soil Classification System for Naming Soils and Creating Legends for Soil Maps, 4th ed.; International Union of Soil Sciences (IUSS): Vienna, Austria, 2022; Available online: https://www.isric.org/sites/default/files/WRB_fourth_edition_2022-12-18.pdf (accessed on 10 January 2025).
  41. ISO 10390:2021; Soil Quality—Determination of pH. ISO: Geneva, Switzerland, 2021. Available online: https://www.iso.org/standard/75243.html (accessed on 10 September 2025).
  42. Egnér, H.; Riehm, H.; Domingo, W.R. Investigations on soil chemical analysis as a basis of the evaluation of plant nutrient status of soils II. Chemical extraction methods for phosphorus and potassium determination. Lantbr. Ann. 1960, 26, 199–215. [Google Scholar]
  43. ISO 14256-2:2005; Soil Quality—Determination of Nitrate, Nitrite and Ammonium in Field-Moist Soils by Extraction with Potassium Chloride Solution. ISO: Geneva, Switzerland, 2005. Available online: https://www.iso.org/standard/32399.html (accessed on 10 September 2025).
  44. ISO 10694:1995; Soil Quality—Determination of Organic and Total Carbon After Dry Combustion (Elementary Analysis). ISO: Geneva, Switzerland, 1995. Available online: https://www.iso.org/standard/18782.html (accessed on 10 September 2025).
  45. Hill, T.; Levicki, P. Statistics Methods and Applications, 1st ed.; StatSoft Inc.: Tulsa, OK, USA, 2005; 800p. [Google Scholar]
  46. Sakalauskas, V. Data Analysis with Statistica; Margi raštai: Vilnius, Lithuania, 2003; 236p. (In Lithuanian) [Google Scholar]
  47. De Vos, B.; Cools, N.; Ilvesniemi, H.; Vesterdal, L.; Vanguelova, E.; Carnicelli, S. Benchmark Values for forest soil carbon stocks in Europe: Results from a large-scale forest soil survey. Geoderma 2015, 251, 33–46. [Google Scholar] [CrossRef]
  48. Wasak, K.; Drewnik, M. Land use effects on soil organic carbon sequestration in Calcareous Leptosols in former pastureland—A Case study from the Tatra Mountains (Poland). Solid Earth 2015, 6, 1103–1115. [Google Scholar] [CrossRef]
  49. Zhou, Y.; Biswas, A.; Ma, Z.; Lu, Y.; Chen, Q.; Shi, Z. Revealing the scale-specific controls of soil organic matter at large scale in Northeast and North China Plain. Geoderma 2016, 271, 71–79. [Google Scholar] [CrossRef]
  50. Armolaitis, K.; Varnagirytė-Kabašinskienė, I.; Žemaitis, P.; Stakėnas, V.; Beniušis, R.; Kulbokas, G.; Urbaitis, G. Evaluation of organic carbon stocks in mineral and organic soils in Lithuania. Soil Use Manag. 2021, 38, 355–368. [Google Scholar] [CrossRef]
  51. Jarmain, C.; Cummins, T.; Jovani-Sancho, A.J.; Nairn, T.; Premrov, A.; Reidy, B.; Renou-Wilson, F.; Tobin, B.; Walz, K.; Wilson, D.; et al. Soil organic carbon stocks by soil group for afforested soils in Ireland. Geoderma Reg. 2023, 32, e00615. [Google Scholar] [CrossRef]
  52. Hobley, E.; Wilson, B.; Wilkie, A.; Gray, J.; Koen, T. Drivers of soil organic carbon storage and vertical distribution in Eastern Australia. Plant Soil 2015, 390, 111–127. [Google Scholar] [CrossRef]
  53. Wiesmeier, M.; Barthold, F.; Blank, B.; Kögel-Knabner, I. Estimation of total organic carbon storage and its driving factors in soils of Bavaria (Southeast Germany). Geoderma Reg. 2014, 1, 67–78. [Google Scholar] [CrossRef]
  54. Mayes, M.; Marin-Spiotta, E.; Szymanski, L.; Erdoğan, M.A.; Ozdoğan, M.; Clayton, M. Soil Type mediates effects of land use on soil carbon and nitrogen in the Konya Basin, Turkey. Geoderma 2014, 232, 517–527. [Google Scholar] [CrossRef]
  55. Vanguelova, E.I.; Nisbet, T.R.; Moffat, A.J.; Broadmeadow, S.; Sanders, T.G.M.; Morison, J.I.L. A New evaluation of carbon stocks in British forest soils. Soil Use Manag. 2013, 29, 169–181. [Google Scholar] [CrossRef]
  56. Renou-Wilson, F.; Byrne, K.A.; Flynn, R.; Premrov, A.; Riondato, E.; Saunders, M.; Walz, K.; Wilson, D. Peatland Properties Influencing Greenhouse Gas Emissions and Removal; Environmental Protection Agency: Wexford, Ireland, 2022; 78p.
  57. Sun, T.; Wang, Y.; Hui, D.; Jing, X.; Feng, W. Soil properties rather than climate and ecosystem type control the vertical variations of soil organic carbon, microbial carbon, and microbial quotient. Soil Biol. Biochem. 2020, 148, 107905. [Google Scholar] [CrossRef]
  58. Zinn, Y.L.; Lal, R.; Bigham, J.M.; Resck, D.V.S. Edaphic controls on soil organic carbon retention in the Brazilian Cerrado: Texture and mineralogy. Soil Sci. Soc. Am. J. 2007, 71, 1204–1214. [Google Scholar] [CrossRef]
  59. Dungait, J.A.J.; Hopkins, D.W.; Gregory, A.S.; Whitmore, A.P. Soil organic matter turnover is governed by accessibility not recalcitrance. Glob. Change Biol. 2012, 18, 1781–1796. [Google Scholar] [CrossRef]
  60. Verheijen, F.G.A.; Bellamy, P.H.; Kibblewhite, M.G.; Gaunt, J.L. Organic carbon ranges in arable soils of England and Wales. Soil Use Manag. 2005, 21, 2–9. [Google Scholar] [CrossRef]
  61. Hamarashid, N.H.; Othman, M.A.; Hussain, M.-A.H. Effects of soil texture on chemical compositions, microbial populations and carbon mineralization in soil. Egypt. J. Exp. Biol. (Bot.) 2010, 6, 59–64. [Google Scholar]
  62. Blanco-Moure, N.; Gracia, R.; Bielsa, A.C.; López, V.M. Soil organic matter fractions as affected by tillage and soil texture under semiarid mediterranean conditions. Soil Tillage Res. 2016, 155, 381–389. [Google Scholar] [CrossRef]
  63. Amsili, J.P.; Van Es, H.M.; Schindelbeck, R.R. Cropping system and soil texture shape soil health outcomes and scoring functions. Soil Secur. 2021, 4, 100012. [Google Scholar] [CrossRef]
  64. Li, H.; Van den Bulcke, J.; Mendoza, O.; Deroo, H.; Haesaert, G.; Dewitte, K.; De Neve, S.; Sleutel, S. Soil texture controls added organic matter mineralization by regulating soil moisture–evidence from a field experiment in a maritime climate. Geoderma 2022, 410, 115690. [Google Scholar] [CrossRef]
  65. Prout, J.M.; Shepherd, K.D.; McGrath, S.P.; Kirk, G.J.D.; Haefele, S.M. What is a good level of soil organic matter? An Index based on organic carbon to clay ratio. Eur. J. Soil Sci. 2021, 72, 2493–2503. [Google Scholar] [CrossRef]
  66. Rasmussen, C.; Heckman, K.; Wieder, W.R.; Keiluweit, M.; Lawrence, C.R.; Berhe, A.A.; Blankinship, J.C.; Crow, S.E.; Druhan, J.L.; Hicks Pries, C.E.; et al. Beyond clay: Towards an improved set of variables for predicting soil organic matter content. Biogeochemistry 2018, 137, 297–306. [Google Scholar] [CrossRef]
  67. Deviatkin, I.; Lyu, L.; Chen, S.; Havukainen, J.; Wang, F.; Horttanainen, M.; Mänttäri, M. Technical implications and global warming potential of recovering nitrogen released during continuous thermal drying of sewage sludge. Waste Manag. 2019, 90, 132–140. [Google Scholar] [CrossRef]
  68. Falayi, T. Alkaline recovery of phosphorous from sewage sludge and stabilisation of sewage sludge residue. Waste Manag. 2019, 84, 166–172. [Google Scholar] [CrossRef]
  69. Diacono, M.; Montemurro, F. Long-term effects of organic amendments on soil fertility. In Sustainable Agriculture; Lichtfouse, E., Hamelin, M., Navarrete, M., Debaeke, P., Eds.; Springer: Dordrecht, The Netherlands, 2011; Volume 2, pp. 761–786. [Google Scholar]
  70. Khan, M.H.; Kaleem, M. Effect of sewage sludge on soil properties, productivity and accumulation of nutrients and heavy metal in Fenugreek (Trigonella foenum-graceum) and their availability in soil. Ann. Plant Soil Res. 2017, 19, 100–104. [Google Scholar]
  71. Achkir, A.; Aouragh, A.; El Mahiv, E.M.L.M.; Labjar, N.; El Bouch, M.; Ouahidi, L.; Badza, T.; Farhane, H.; El Moussaoui, T. Implication of sewage sludge increased application rates on soil fertility and heavy metals contamination risk. Emerg. Contam. 2023, 9, 100200. [Google Scholar] [CrossRef]
  72. El Moussaoui, T.; Belloulid, M.O.; Elharbili, R.; El Ass, K.; Ouazzani, N. Simultaneous assessment of purification performances and wastewater byproducts management plans towards a circular economy: Case of Marrakesh WWTP. Case Stud. Chem. Environ. Eng. 2022, 6, 100228. [Google Scholar] [CrossRef]
  73. Ngwu, O.; Ezike, C.; Okechukwu, G. Influence of different rates of sewage sludge on soil physico-chemical properties, growth and yield of Bambara Groundnut (Vigna subterranean) in an Ultisol. Agrotechnology 2021, 10, 223. [Google Scholar]
  74. Davis, M.; Nordmeyer, A.; Henley, D.; Watt, M. Ecosystem carbon accretion 10 years after afforestation of depleted subhumid grassland planted with three densities of Pinus nigra. Glob. Change Biol. 2007, 13, 1414–1422. [Google Scholar] [CrossRef]
  75. Li, D.; Niu, S.; Luo, Y. Global patterns of the dynamics of soil carbon and nitrogen stocks following afforestation: A Meta-Analysis. New Phytol. 2012, 195, 172–181. [Google Scholar] [CrossRef]
  76. Radočaj, D.; Gašparović, M.; Jurišić, M. Open Remote Sensing Data in Digital Soil Organic Carbon Mapping: A Review. Agriculture 2024, 14, 1005. [Google Scholar] [CrossRef]
  77. Pouladi, N.; Gholizadeh, A.; Khosravi, V.; Borůvka, L. Digital Mapping of Soil Organic Carbon Using Remote Sensing Data: A Systematic Review. Catena 2023, 232, 107409. [Google Scholar] [CrossRef]
  78. Ji, X.; Purushothaman, B.; Prasad, R.V.; Aravind, P.V. Developing a Digital Mapping of Soil Organic Carbon on a National Scale Using Sentinel-2 and Hybrid Models at Varying Spatial Resolutions. Ecol. Indic. 2024, 167, 112654. [Google Scholar] [CrossRef]
Figure 1. Soil organic carbon (SOC) concentration (%) across different soil types based on WRB classification. (A) Mineral soils: Gleyic Luvisols (LVg, n = 26), Haplic Luvisols (LVh, n = 64), Calcaric Luvisols (LVk, n = 25), Eutric Retisols (RTe, n = 133), Eutric Planosols (PLe, n = 18), and Haplic Arenosols (ARh, n = 39). (B) Organo-mineral soils: Eutric Gleysols (GLb, n = 12) and Mollic Gleysols (GLv, n = 17). (C) Organic soils: Pachiterric Histosols (HSs-ph, n = 12) and Bathiterric Histosols (HSs-d, n = 47). Box plots represent the interquartile range (IQR), with the bottom and top of each box indicating the first and third quartiles, respectively. The horizontal line within each box denotes the median. Dots beyond the whiskers represent outliers—values that deviate significantly from the majority of the data.
Agriculture 16 00281 g001
Figure 2. Organic carbon accumulation (t ha−1) in different soil types. (A) Mineral soils: LVg—Gleyic Luvisols (n = 26), LVh—Haplic Luvisols (n = 64), LVk—Calcaric Luvisols (n = 25), RTe—Eutric Retisols (n = 133), PLe—Eutric Planosols (n = 18), ARh—Haplic Arenosols (n = 39). (B) Organo-mineral soils: GLb—Eutric Gleysols (n = 12), GLv—Mollic Gleysols (n = 17). (C) Organic soils: HSs-ph—Pachiterric Histosols (n = 12), HSs-d—Bathiterric Histosols (n = 47).
Agriculture 16 00281 g002
Figure 3. (A) Average soil organic carbon (SOC) concentration (%) across different soil textures. (B) Soil organic carbon accumulation (t ha−1) across different soil textures. Sample sizes for each texture: loamy sand (LS) (n = 20), sandy loam (SL) (n = 297), loam (L) (n = 6), peaty (n = 16), and peat (n = 62).
Agriculture 16 00281 g003
Figure 4. SOC concentration distribution (%) by richness groups in Field 1 (Vilnius district): (A) first experimental period (1989–1990); (B) second experimental period (2018–2020).
Agriculture 16 00281 g004
Figure 5. SOC concentration distribution (%) by richness groups in Field 2 (Anykščiai district): (A) first experimental period (1989–1990); (B) second experimental period (2018–2020); (C) third experimental period (2021).
Agriculture 16 00281 g005
Figure 6. SOC concentration distribution (%) by richness groups in Field 3 (Molėtai district): (A) first experimental period (1989–1990); (B) second experimental period (2018–2020).
Agriculture 16 00281 g006
Table 1. Assessment of organic carbon concentration in the 0–20 cm soil layer in mineral and organic soils in Lithuania [36].
Soil Organic Carbon (SOC) Richness GroupsSOC Concentration %Soil Concentration Assessment
in mineral soils
I≤0.60very low
II0.61–1.20low
III1.21–1.80medium
IV1.81–2.40high
V2.41–4.10very high
VI4.11–5.80extremely high
in organic soils
VII5.81–12.00extremely highpeaty
VIII12.01–18.00peaty/peat
IX>18.00peat
Table 2. Average organic carbon concentration (%) in the arable layer (0–20 cm) of mineral soils, classified by moisture regime and soil texture in Eastern Lithuania [37].
Soil TexturePlain SoilsAlluvial SoilsEroded Soils
Normal
Humidity
HypogleyicHypergleyic
Sand0.81.01.41.20.7
Sandy loam1.01.42.31.80.9
Clay loam and loam1.31.63.93.20.9
Table 3. Chemical composition of dried granulated SSD produced by Closed Joint-Stock Company Vilniaus vandenys in 2016 and 2019.
pHDry Matter Content
%
Organic Matter Content
%
Ntotal
%
Ptotal
%
Cu
mg kg−1
Pb
mg kg−1
Zn
mg kg−1
Ni
mg kg−1
Cr
mg kg−1
Cd
mg kg−1
Hg
µg kg−1
2016
6.792.053.85.112.82363.7100.11321.148.579.53.740.597
2019
6.998.254.64.531.80340.457.81573.559.871.22.230.594
Table 4. Soil organic carbon and accumulation in different soil types.
Soil (WRB) 1Topsoil TextureSoil Organic Carbon (SOC)
%
Soil Organic Carbon Deposits (SOCD)
t ha−1
1986–19902018–202020211986–19902018–20202021
Field 1 (Vilnius district)
RTeSL 20.901.20-32.243.1-
LVhSL0.961.05-33.436.8-
x ¯ /Median0.91/0.971.18/1.23-32.4/34.542.0/43.8-
min/max0.64/1.040.85/1.36-23.2/37.930.9/49.5-
σ/CV (%)0.16/17.090.20/17.10-5.6/17.17.3/17.3-
Field 2 (Anykščiai district)
LVkSL1.131.491.6343.857.562.6
LVhSL0.991.692.0639.066.280.7
RTeSL1.011.561.9138.760.073.8
x ¯ /Median1.03/1.071.55/1.371.87/1.7239.8/42.762.0/53.774.7/67.0
min/max0.68/1.390.97/3.331.18/3.7125.6/54.540.8/130.548.6/145.4
σ/CV (%)0.20/19.660.58/37.60.65/34.68.1/20.323.0/37.125.5/34.1
Field 3 (Molėtai district)
LVhSL1.201.46-43.853.4-
LVkSL1.131.21-42.845.7-
x ¯ /Median1.19/1.131.42/1.42-43.6/41.352.2/52.2-
min/max0.55/1.641.03/1.91-20.8/59.038.9/72.2-
σ/CV (%)0.30/25.30.24/16.6-10.5/24.28.6/16.5-
1—Field 1: RTe—Eutric Retisols, LVh—Haplic Luvisols, Field 2: LVk—Calcaric Luvisols, LVh—Haplic Luvisols, RTe—Eutric Retisols; Field 3: LVh—Haplic Luvisols, LVk—Calcaric Luvisols; 2—SL—sandy loam.
Disclaimer/Publisher’s Note: The statements, opinions and data contained in all publications are solely those of the individual author(s) and contributor(s) and not of MDPI and/or the editor(s). MDPI and/or the editor(s) disclaim responsibility for any injury to people or property resulting from any ideas, methods, instructions or products referred to in the content.