Abstract
Airflow regulation is essential for optimizing pesticide deposition in orchard spraying. This study developed an airflow attenuation model for a five-port air-assisted sprayer by integrating jet dynamics with crown resistance characteristics. The tree crown was modeled as a porous medium with calibrated resistance coefficients, and airflow attenuation was described using momentum conservation theorems, with initial conditions derived from jet decay profiles at the outlet. Validation included free-space airflow measurements and field trials in three fruit tree species. In free-space tests, the model showed a maximum relative error of 22.31% and a mean error of 12.26%. Field tests yielded a maximum error of 25.92%, with mean errors of 14.85% and 15.76% at 2300 and 2800 rpm, respectively. The model provides a theoretical basis for intelligent airflow control aimed at improving deposition and reducing drift.
1. Introduction
Chemical control is essential for maintaining crop yield and quality in intensive orchard and nursery production systems. Air-assisted orchard sprayers deliver pesticides using high-velocity airflow, and their primary advantage is aerodynamic stress that enhances droplet penetration and improves deposition uniformity within crown [1,2]. Research has shown that optimizing aerodynamic parameters such as airflow velocity and flux distribution can reduce the deposition disparities between leaf adaxial and abaxial surfaces by over 40% [3,4]. However, inappropriate airflow regulation may cause droplet drift to non-target areas [5], underscoring the dual effect of aerodynamic stress. Although moderate crown porosity improves penetration, excessive airflow can increase droplet loss. These findings emphasize the need for airflow attenuation models that incorporate crown aerodynamic resistance to enable precise spraying.
Current research primarily focuses on free-space airflow modeling based on classical jet theory. Zhu et al. [6] developed velocity prediction equations for five-nozzle sprayers within a 0.79 m range. Zeng & Takahashi [7] proposed a first-order closure model with general applicability for predicting wind flow within and above vegetation canopies, which demonstrated agreement with the measured wind speed data across six crown types. Walklate et al. [8] analyzed the conservation equations for momentum and turbulent kinetic energy in a two-dimensional air jet penetrating a uniform crop canopy from a moving sprayer, demonstrating that both velocity and turbulent kinetic energy decay exponentially along the jet centerline. Friso et al. [9] formulated a mathematical model for airflow velocity distribution within canopies using jet flow equations, deriving an attenuation equation to describe wind speed decay during air-assisted pesticide application through orchard tree canopies.
To address these research gaps, this study proposed a multi-physics coupling approach. First, tree canopies were modeled as anisotropic porous media using the Darcy-Forchheimer equations [10], with drag coefficients (Cd) calibrated through wind tunnel experiments for representative fruit tree species [11,12]. Second, a 3D airflow attenuation model was developed by incorporating initial jet parameters, crown resistance, and dynamic leaf responses [13,14]. The model introduced the concept of a leaf aerodynamic response threshold [15] to investigate the leaf motion under varying airflow velocities and its effect on droplet coverage. A boundary layer theory framework was employed to construct a leaf aerodynamic response velocity model under nonperiodic excitation using the convolution integral method.
While existing studies have addressed individual factors such as free-space airflow and leaf-porosity interactions, there remains a lack of a comprehensive model that captures airflow attenuation along the entire jet trajectory during air-assisted spraying, particularly one that integrates crown resistance dynamics. This study bridges this gap by developing a coupled physical-mathematical model that incorporates jet dynamics, crown resistance, and leaf aerodynamic response, enabling accurate prediction of airflow attenuation both in free space and within tree canopies. The proposed model provides a theoretical basis for real-time airflow control in precision orchard spraying for enhancing deposition uniformity and minimizing drift, with the secondary benefit of improving energy efficiency.
2. Materials and Methods
2.1. Air Velocity Attenuation Model
Classical air jet theory offers a robust framework for analyzing the attenuation and spatial distribution of airflow discharged from nozzles into quiescent environments [16,17]. The air jet process involves complex physical phenomena, including energy transfer, momentum transport, fluid entrainment, and turbulent diffusion between air masses with varying velocities. These interactions are primarily governed by the formation and evolution of vortical structures within the free shear layer generated by velocity discontinuities at the nozzle outlet (Figure 1).
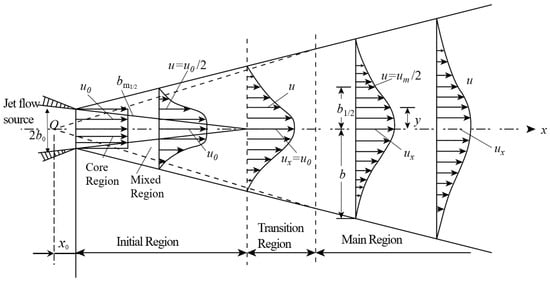
Figure 1.
Schematic diagram of turbulent jet. (Note: The arrows in the figure indicate the direction of airflow, and the length of the arrows indicates the air velocity).
The hydrodynamic structure of free jets displayed distinct flow zones along the axial direction. A shear layer originating from the nozzle exit expanded bidirectionally, forming a turbulent mixing zone characterized by intense momentum exchange between the jet flow and the surrounding medium. The central region where the jet maintained its exit velocity without turbulent interference was referred to as the potential core. The axial segment extending from the nozzle exit to the end of the potential core was defined as the initial region.
Following the initial region, a transition zone emerged where the potential core dissipated and turbulent structures began to merge. Although this intermediate region possessed distinct flow characteristics, it could be omitted in analytical models because of its limited streamwise length. Further downstream, the flow entered the main region as a fully developed turbulent zone, where self-similar velocity profiles emerged and governed the flow behavior.
Within the transition zone, the turbulent diffusion propagated radially inward toward the jet centerline, where the axial velocity (ux, m s−1) representing the peak velocity across the jet cross-section underwent the progressive attenuation along the axial direction as the downstream distance x from the nozzle exit increased. As illustrated in Figure 1, the key parameters included: x0, denoting the distance from the spray outlet to the jet origin (m); xt, indicating the termination point of the transition zone (m); u0, the initial exit velocity (m s−1); b0, representing the jet radius (m); and the spreading radius b, calculated using b = Cm(x − x0).
For multi-port spray heads, the airflow can be modeled as originating from an arcuate slit discharging into an incompressible medium of equal density. Randall [18] derived the formula for the maximum axial air velocity in the jet main region based on the theorem of kinetic energy as follows:
where ux0 is centerline velocity at nozzle exit (m s−1); n is the ratio of the integral of the mean velocity square at 2b0 at the exit to the maximum velocity square on the centerline, experimentally calibrated as 0.76 through particle image velocimetry; Cm is jet momentum coefficient in fully developed region, empirically determined as 0.22; r0 is arc radius of nozzle manifold assembly (m); and A1 is a constant validated as 0.316 via wind tunnel measurements [16].
This study utilized a five-port nozzle (Figure 2) with the following features: (1) directional precision for spatial airflow partitioning and zonal dosage control; (2) high-pressure pneumatic transmission via flexible ducts connected to centrifugal blowers; and (3) compressed airflow delivery to target zones through bifurcated channels. To establish the computational framework, the following assumptions were adopted (as shown in Table 1):
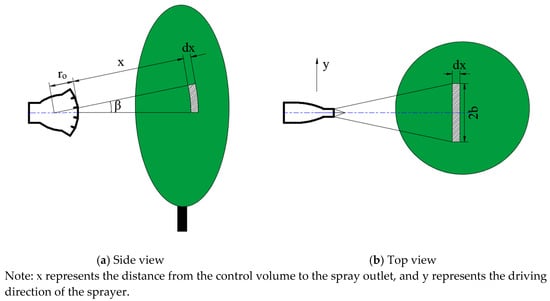
Figure 2.
Control volume definition diagram.

Table 1.
Key assumptions of the airflow attenuation model.
Schlichting et al. [19] proposed that the velocity profiles in the jet core region exhibited self-similarity characteristics obeying the following scaling relationships:
where uxm is the average velocity over the 2b; and A2, A3 are constants.
Within the horizontal plane at a distance x from the nozzle, the control volume dimensions were defined by the width of 2b and the thickness of dx. Vertically, the control volume constituted a sector with the thickness of dx, the arc angle of β, and the inner arc radius of β(r0 + x). The differential volume is given by:
The inlet (a) and outlet (a + da) cross-sectional areas satisfy:
Applying the conservation of momentum theorem for the control volume, the difference between the inflow and outflow momentum fluxes Mi and Mo integrated over the projected area of the control volume should be equal to the drag F produced by the crown (leaf and branch).
The inflow momentum flux is
where ρa is the air density (kg m−3). The above equation is rewritten by (3) and (4), and the inlet momentum flux at the control volume is expressed as follows:
Similarly, the outflow momentum flux of the control volume can be expressed as follows:
In the control volume, the drag F is:
where Cd is the drag coefficient related to the characteristics of the plant crown; and dS is the leaf area of the control volume, which can be expressed as:
where ρl is leaf area density (m−1).
Substituting Equations (10)–(12) into Equation (8) and simplifying to obtain the following equation:
The above equation represents the differential model describing spray airflow attenuation within the tree crown. The experimental data indicated that x0 = −0.015 m and the radius of the five-port sprayer was r0 = 0.175 m. Given the relatively short spray distance, the values x0 and r0 were omitted from Equation (14) to simplify the calculations. As demonstrated by Zhang et al. [20], the crown resistance coefficient exhibited an exponential relationship with the air velocity of . Constants A4 and A5 were determined experimentally, allowing Equation (14) to be simplified as follows:
The nonlinear differential equation was solved to obtain the variation rule of the airflow velocity with distance, as follows:
where C1 is the integration constant, A4 and A5 are constants determined by experiment, Ct (Ct = A4A5ρl/4) is the parameter determined by the crown structure, ρl is leaf area density (m−1). Given the initial position coordinates at the crown edge as xin and the initial velocity upon entering the crown as ux|in, the solution can be derived from Equation (1):
The boundary condition derived above was substituted into Equation (17), yielding an expression for the variation in air velocity with distance within the crown as follows:
In practical air velocity control systems, the sprayer’s outlet air velocity is typically calculated in reverse based on the target crown characteristics, including leaf area density and thickness, entry position into the crown, and required critical air velocity at the crown end (Figure 3). During spraying operations, the crown height and the sprayer’s movement direction may change in real time, requiring real-time control of spraying parameters. The outlet air velocity is determined using the spray end velocity ux|out, the distance between the crown and sprayer outlet xin, and the position at the crown’s end xout. For optimal spraying performance, if the final velocity at the crown end ux|out is given, the spray end velocity should fall between the first and second critical disturbance wind speeds [21,22]. Using the crown end velocity and position as the boundary conditions, Equation (18) can be reformulated as Equation (19). Combining Equations (19) and (17) facilitates the calculation of the required outlet air velocity during spraying. This air velocity can be adjusted by modifying the fan speed or altering the air inlet and outlet areas. The resulting equation presents a theoretical basis for the intelligent regulation of air-assisted spraying air velocity.
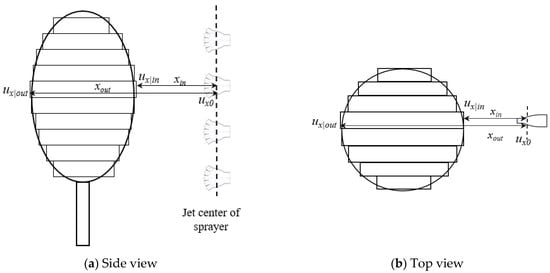
Figure 3.
Schematic diagram of air-assisted spray.
2.2. Airflow Velocity Decay Test for Spraying
An experiment was conducted to investigate the airflow field characteristics of a selected test object by examining the external airflow field of a five-port nozzle in April 2021. Developed by Nanjing Forestry University, this nozzle integrated five air channels and atomizing nozzles (Figure 4). The outer casing was produced via 3D printing using polyethylene resin, and the atomizing nozzle was a fan-shaped TPC8001 model (Guangdong Boyuan Spray Technology Co., Ltd., Guangzhou, China). The rear end of the nozzle was connected to a centrifugal fan outlet through an air duct, allowing high-speed airflow generated by the fan to be delivered to the nozzle outlet.
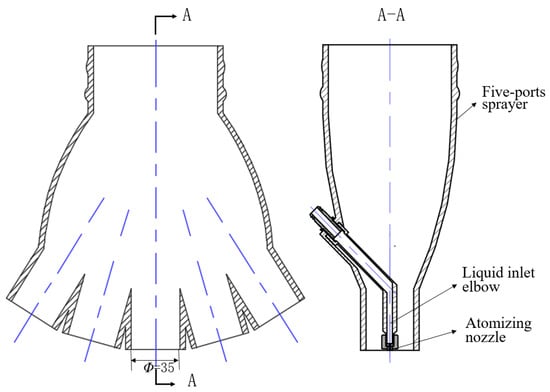
Figure 4.
Structure diagram of five-port nozzle.
The test apparatus comprised a five-port nozzle, centrifugal fan, air duct, multi-point anemometer, and a data acquisition laptop (Legion Y7000 2019, Lenovo Group, Hefei, China) (Figure 5). The fan of the sprayer served as the air source, and the outlet air velocity was regulated by adjusting the fan speed, which was set to 2300 rpm in this test. The air velocity at the nozzle outlet was measured using a multi-point wind speed testing system (SYSTEM model 6242, Kanomax Japan Inc., Osaka, Japan) with a 0963-00 probe. The system measured the wind speeds from 0 to 50 m s−1, with a resolution of 0.1 m s−1, and an accuracy of ±0.5 m s−1 for 10.0–24.9 m s−1 and ±1.0 m s−1 for 25.0–50.0 m s−1. The experiment was conducted indoors in a windless factory environment with no obstacles within a 10 m radius. All the connections were assembled and inspected for airtightness. During the single-nozzle tests, the adjacent air ducts were removed and positioned opposite to the test nozzle to avoid interference. The average outlet air velocity was 28.97 ± 1.29 m s−1, with the maximum inter-outlet variation of 0.73 m s−1, indicating the negligible error. The measurement points were arranged as shown in Figure 5b: 6 vertical rows spaced 0.1 m apart from the nozzle centerline and 13 downstream distances of 0.1, 0.3, 0.5, 0.7, 0.9, 1.1, 1.3, 1.5, 2, 2.5, and 3 m, yielding 13 × 11 measurement points. The air velocity was recorded at a sampling frequency of 100 Hz for 60 s, and the data were automatically collected using Multichannel Anemomaster Software (Multi-channel Anemomaster for Windows, Kanomax Japan Inc., Osaka, Japan). The results were averaged over the 60 s period.
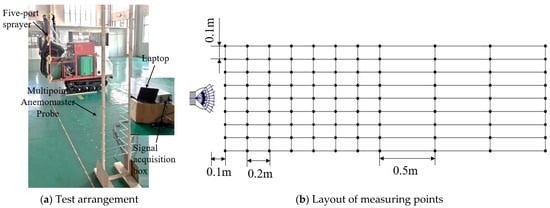
Figure 5.
Air-flow field test of five-port nozzle.
Using the same procedure, the outlet airflow speed of the sprayer with nozzles installed on both sides was tested. Seventeen probes were mounted on a vertical scale rod at 0.15 m intervals, ranging from 0.3 to 2.7 m above the ground and numbered 1 to 17 from top to bottom. The probes were aligned with the sprayer nozzle arms and positioned 0.5 m from the sprayer outlet to measure the air velocity at that distance. A multi-point anemometer system was used again, with the data sampled at 100 Hz for 60 s. All the data were recorded automatically and averaged over the measurement period.
2.3. Field Experiments
To validate the accuracy of the air velocity decay model, three fruit tree species, including pear, peach, and tea, were selected for verification in July 2022. The air velocity measurements were first conducted in an orchard. The trees were then cut at the roots, kept moist, and transported to the laboratory. The drag coefficients were measured, and the leaf area density was calculated in a wind tunnel following the method of Zhang et al. [20]. The steps for measuring leaf area density were as follows: (1) randomly collecting 50 representative leaves from the crown, measuring their areas using a leaf area meter, and computing the average leaf area; (2) scanning the tree contours on both sides using a 2D laser sensor (UTM-30LX, Hokuyo Automatic Co., Ltd., Osaka, Japan) mounted on the sprayer and reconstructing a 3D contour model in MATLAB (2018b) to calculate tree volume; and (3) computing the leaf area density using the appropriate formula. The three test trees are shown in Figure 6, and their characteristic parameters are listed in Table 2.
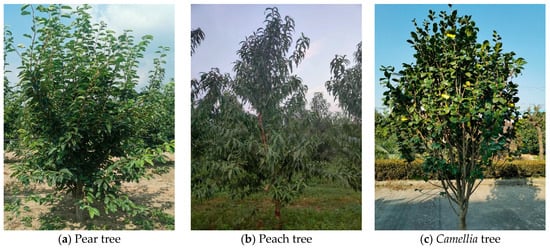
Figure 6.
Three test sample trees.
Table 2.
Characteristic parameters and test conditions of test sample trees.
During the experiment, the sprayer with five-port nozzles was operated in the orchard, and the actual outlet air velocity ux0 was measured. Anemometers were used to record air velocity at the crown inlet and outlet at the same height (Figure 7). To avoid measurement errors caused by leaf obstruction inside the crown, all the sampling points were positioned outside the crown. Four layers of sampling points spaced 0.6 m apart were arranged at both the crown inlet and outlet from the nozzle center. The inlet xin and outlet xout positions were recorded as measurement references. Sampling points were placed in the midsection of the crown to avoid the main trunk. The tests were conducted at two fan speeds: 2300 and 2800 rpm. A hot-wire anemometer (Hot-wire Anemometer AR866+, SMART SENSER, Dongguan, China) connected to a computer via a USB was used for the measurement, with a sampling frequency of 100 Hz. The maximum air velocity recorded during each sampling period was used as the final measurement value at each point.
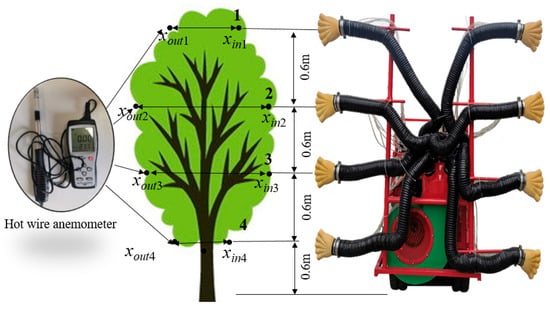
Figure 7.
Diagram of test device and sampling point layout.
3. Results
This section may be divided by subheadings. It should provide a concise and precise description of the experimental results, their interpretation, as well as the experimental conclusions that can be drawn.
3.1. Airflow Velocity Distribution of a Single Nozzle in Air
The air velocity contour of the single five-port nozzle (Figure 8) demonstrated that the outlet air velocity expanded outward in a fan-shaped pattern and decreased along the radial direction. A significant velocity drop occurred between adjacent outlet gaps, whereas this difference became less pronounced with increasing distance. When x < 1.0 m, the airflow remained narrow, with limited interaction between neighboring jets, and distinct velocity peaks were observed at the center of each outlet along the circumference. For x > 1.0 m, the jets from adjacent outlets were entirely merged, resulting in circumferentially minor velocity fluctuations. This behavior is aligned with the simplified model of a radially decaying fan-shaped airflow field.
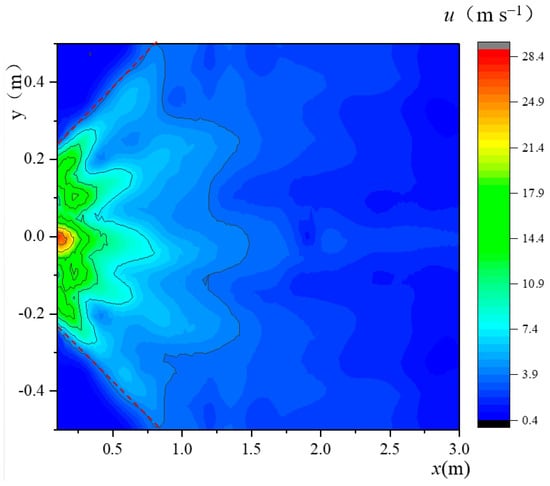
Figure 8.
Air velocity contour of the single five-port nozzle.
A comparison between the air velocity along the nozzle centerline and the theoretical values from Equation (1) (Figure 9) suggested that the airflow velocity decreased exponentially after exiting the nozzle, with a strong agreement between the measured and predicted results. At 1 m from the nozzle, the velocity dropped to 6.03 m s−1, approximately 20% of the initial speed, and the rate of decay decreased with the increasing distance. The measured decay was slightly faster than the theoretical prediction, and the measured values were consistently lower. This deviation could be due to environmental factors such as atmospheric pressure, temperature, and humidity. To improve efficiency and reduce energy consumption, the nozzle-to-target distance should be minimized, or dual-side spraying should be employed to lower the required outlet velocity.
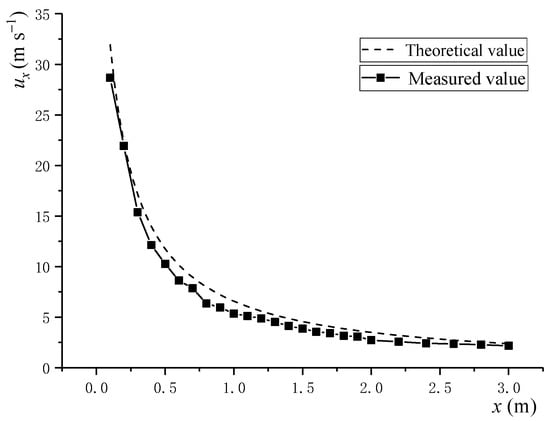
Figure 9.
Airflow velocity attenuation curve in the centerline of five-port nozzle without obstruction of trees.
The test results from the dual-sided multi-nozzle airflow field (Figure 10) indicated the average air velocities of 11.4 and 11.6 m/s, with the coefficients of variation of 17.9% and 24.2%, respectively. The maximum air velocity difference was 5.5 m s−1, with the highest value occurring at the upper boundary of the airflow field as an area in direct contact with ambient air, resulting in a more rapid velocity decay. For the individual nozzles, the central outlet exhibited a higher velocity than the lateral positions, with the air velocity decreasing from the center outward. Owing to the variability in the outlet velocities and fan-shaped airflow patterns across different nozzles, air velocity predictions should be tailored to each specific spray position.
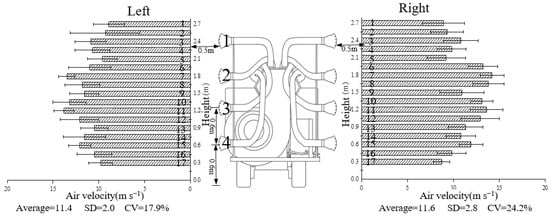
Figure 10.
Air velocity distribution of multi-nozzle combination. Note: Average is the average value of air velocity, m s−1; SD is the standard deviation , where N is the total number of air velocity measurement data, i is the i-th data point, and is the average air velocity),; and CV is air velocity variation coefficient (CV = SD/), %.
In practical spray decision-making, the interference between adjacent nozzles was neglected, and the crown spray area was segmented based on Equation (18) (Table 3). In the absence of crown obstruction, the maximum relative error between the measured and predicted air velocities was 22.31% (at right-side point 1), where the airflow interacted with the ambient air at the jet boundary, reducing the prediction accuracy. The measurement points located at the centers of the nozzles (points 3, 7, 11, and 15) showed stable behavior with minimal cross-jet interference, which is consistent with the jet decay theory. In the regions where the jets overlapped, higher relative errors were observed owing to turbulent mixing. All relative errors were below 25%, satisfying the accuracy requirements for spray air velocity prediction.
Table 3.
Measured and predicted air velocity of multi-nozzle combination of sprayer.
3.2. Crown Drag and Drag Coefficient
The tree samples were brought back to the laboratory to measure the aerodynamic resistance and corresponding resistance coefficients. The results are shown in Figure 11, where the drag force and drag coefficient exhibited a power function relationship with air velocity. The experimental data indicated that Camellia tree had the lowest structural flexibility and deformation capacity, whereas peach trees displayed better adaptive deformation under airflow. The fitted relationships between tree drag coefficients and air velocities are summarized in Table 4. A power function was used for curve fitting, yielding determination coefficients greater than 0.93.
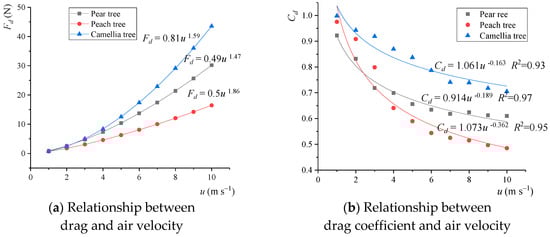
Figure 11.
Drag and drag coefficient of three tree canopies.
Table 4.
Relationship between three tree drag coefficients and air velocity.
3.3. Crown Air Velocity Decay Test Results
The field test results from the three naturally grown trees (Table 4) were compared with theoretical predictions based on Equations (18) and (19), incorporating the measured crown characteristics (Figure 12). Within the range of x < 0.2 m, the curves remained nearly flat, indicating the jet transition zone where the airflow velocity equaled the outlet speed. At the crown end, the free jet equation consistently overestimated the airflow velocity compared with the crown decay model. For instance, in the pear tree, the velocity difference at point 3 reached 4.21 m s−1, increasing with distance, which confirmed the crown’s obstructive effect as a porous medium. The magnitude of this discrepancy reflects the crown resistance, which is closely related to the leaf area density and capacity of the leaves for deformation. The higher density and lower flexibility resulted in greater resistance and faster airflow decay.
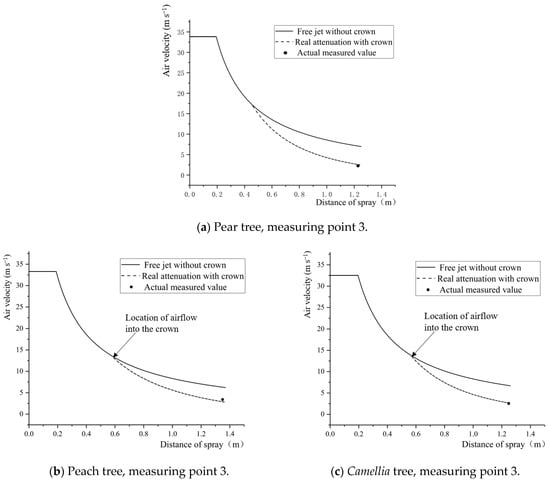
Figure 12.
Free jet and attenuation law in crown of three fruit trees.
The observed airflow decay patterns are directly governed by crown-specific parameters. The pear tree showed moderate decay, driven by its high leaf area density (LAD = 7.23 m−1) and limited streamlining (Cd = 0.914u−0.189). In contrast, the Camellia tree, with high LAD and a stable drag coefficient (Cd = 1.061u−0.163), presented a denser, rigid structure causing consistently high resistance. These insights enable variable-rate spraying by linking crown type to airflow demand. For example, penetrating a dense Camellia crown requires a higher outlet velocity than a flexible peach crown. The model (Equation (18)) provides the functional basis for intelligent sprayers to auto-adjust fan speed using species-specific parameters, optimizing penetration while minimizing energy use and drift.
The analysis of Table 5 and Table 6 indicated that Equation (18) could predict inlet air velocities with relative errors below 15%, showing better accuracy than the outlet predictions, where the maximum error reached 25.92%. The average outlet prediction errors for pear, peach, and Camellia trees were 14.08%, 16.39%, and 13.62%, respectively.This systematic deviation could be attributed to subtle environmental factors present even in controlled indoor settings, such as localized air currents, minor fluctuations in ambient temperature and humidity affecting air density and sensor calibration, or background turbulence induced by the sprayer fan and surrounding equipment which could be due to environmental influence. Conversely, certain outlet speeds exceeded the predictions, attributed to the model’s assumption of uniform leaf area density, whereas the actual canopies exhibited non-uniform distributions. Despite the maximum outlet error of 25.92%, the absolute error remained small owing to the low true values and instrument sensitivity. Overall, with total errors under 20%, the model presented sufficient accuracy for practical spray airflow prediction and supported airflow decision making in orchard spraying operations.
Table 5.
Air velocity attenuation test results of three sample trees at a fan speed of 2300 rpm.
Table 6.
Air velocity attenuation test results of three sample trees at a fan speed of 2800 rpm.
4. Discussion
The comprehensive validation results confirm that the proposed airflow attenuation model effectively characterizes the velocity decay from the outlet of a five-port air-assisted sprayer, both in free space and when penetrating orchard tree canopies. The discussion herein interprets these findings, elucidates the model’s implications, and contextualizes its contribution within the existing body of knowledge.
4.1. Model Performance and Key Innovations
The model showed consistent predictive accuracy, with mean relative errors below 16% across test scenarios. Maximum errors occurred at spray boundaries (22.31% in free space) and at low crown exit velocities (up to 25.92%), primarily due to turbulent interactions between adjacent jets and the simplified treatment of the crown as a homogeneous porous medium. These limitations are inherent to theoretical simplifications and do not undermine the model’s overall utility.
A key advance of this model is the integration of crown resistance directly into the jet dynamics framework. Unlike prior models that treated crown interaction separately or focused solely on free-jet behavior [6,8,9], our approach incorporates empirically derived, velocity-dependent drag coefficients (Figure 11, Table 4). This allows the model to capture the dynamic effects of leaf reorientation and streamlining at varying air velocities, offering a more physiologically realistic representation of crown aerodynamics.
4.2. Implications for Precision Spraying and Intelligent Control
The primary practical value of this model lies in its application to intelligent airflow regulation. By providing a quantitative relationship between the fan outlet velocity, crown characteristics (leaf area density, thickness), and the resulting velocity at a target depth within the crown (Equation (18)), the model enables reverse calculation of the required operational parameters. This capability is crucial for achieving the dual objectives of sufficient droplet penetration and minimal drift [1,4]. The model suggests that to maintain a terminal velocity within the optimal range for droplet deposition (between the first and second critical disturbance air velocities [21,22]), the outlet velocity must be precisely tuned according to the specific tree species and growth stage, as reflected by their distinct drag coefficients. The successful prediction of inlet air velocities with errors generally below 15% confirms the model’s reliability for setting these initial conditions in a control system. Although outlet predictions showed higher relative errors, the absolute errors remained small, indicating the model’s suitability for practical spray decision-making where trends and approximate values are often sufficient for effective control logic.
4.3. Limitations and Future Research
Despite its promising results, this study has certain limitations that point to future research directions. Firstly, the model assumes a homogeneous leaf area distribution, whereas real crowns are inherently heterogeneous. This simplification likely contributed to the higher errors at the crown outlet. Future research will focus on integrating real-time crown sensing technologies, such as LiDAR or multispectral imaging, to capture spatial variations in leaf area density and crown geometry. By coupling these data with the proposed model, a dynamic zonal resistance map could be generated, enabling adaptive airflow control that responds to crown heterogeneity during spraying operations. Secondly, the effect of the sprayer’s forward motion was neglected. While justified for high-velocity jets, integrating a dynamic component accounting for vehicle speed would enhance the model’s accuracy for real-time, on-the-go spraying applications. Thirdly, the current model assumes low ambient wind conditions, consistent with the controlled validation environment (air velocities < 1.7 m/s, Table 2). This simplification allowed a focused analysis of the jet-canopy interaction. In practical field applications, higher ambient winds would deflect the spray jet, alter its entrainment, and modify the effective velocity profile, thereby challenging the model’s predictions. Future work should integrate the vector difference between jet and ambient wind velocities into the momentum framework. Coupling the model with real-time wind sensors or high-fidelity CFD simulations that include ambient flow fields will be essential steps toward developing a robust control system for variable wind conditions. Finally, the model employs species-averaged parameters for leaf area density and drag coefficients, which do not account for individual tree variability due to age, pruning, or health. However, its framework is inherently adaptable, as these parameters (ρl, Cd) serve as inputs. Future efforts should focus on rapid sensing methods, such as LiDAR or multispectral imaging, to map canopy traits at the individual or zone level, enabling precision control that accommodates intra-species variation. Additionally, validation across a broader range of crops would further demonstrate model generalizability and enrich the species-specific parameter database.
In conclusion, the developed model provides a sound theoretical foundation for optimizing air-assisted spraying. By quantitatively linking sprayer operation to crown aerodynamics, it represents a significant step toward intelligent, precision orchard management that can enhance pesticide application efficiency while mitigating environmental impact.
5. Conclusions
Extensive experimental results confirmed that the outlet air velocity of air-assisted sprayers played a critical role in pesticide deposition on plant foliage. Excessive air velocity led to increased drift, whereas insufficient speed compromised deposition efficiency and uniformity. To optimize pesticide applications and support the development of a air velocity control system for orchard sprayers, a predictive model was developed to characterize air velocity attenuation with distance from the sprayer outlet.
Assuming the crown as a porous medium and neglecting the sprayer’s forward velocity, a differential equation for air velocity decay was established based on momentum conservation. The wind tunnel experiments demonstrated a power-law relationship between the crown drag coefficients and air velocity, accounting for the decay in both free air and crown environments. The single- and multi-nozzle airflow experiments confirmed the model assumptions, with a maximum relative error of 22.3% in free air (as low as 2.08% near the jet center and higher at the edges and overlap zones). Field tests on actual trees yielded outlet air velocity prediction errors below 20%, validating the model’s effectiveness for air velocity prediction and intelligent control in air-assisted spraying. The model provides a practical tool for manufacturers and agricultural users to move beyond uniform, high-volume spraying. For the orchard manager, the model enables targeted spraying by calculating the precise fan setting (e.g., a specific rpm) needed to maintain an effective droplet-carrying velocity at the far side of a tree crown, based on its species, density, and width. For the machine designer, the model offers a reliable control algorithm, which can be integrated with crown sensing systems for real-time adjustment. In summary, this work translates aerodynamic theory into an actionable framework for achieving the dual goals of superior pest control and environmental stewardship in modern orchards.
Author Contributions
Conceptualization, C.Z. and H.Z.; methodology, C.Z.; software, S.F.; validation, C.Z., S.F. and B.C.; formal analysis, C.Z.; investigation, C.Z.; resources, H.Z.; data curation, B.C.; writing—original draft preparation, C.Z.; writing—review and editing, C.Z.; visualization, S.F.; supervision, H.Z.; project administration, H.Z.; funding acquisition, C.Z. and H.Z. All authors have read and agreed to the published version of the manuscript.
Funding
This research was funded by Talent Introduction Project of Anhui Science and Technology University (JXYJ202302) and National key Research and Development Program of China (2018YFD0600202-04).
Data Availability Statement
The original contributions presented in this study are included in the article. Further inquiries can be directed to the corresponding author.
Acknowledgments
We deeply thank reviewers and editors for giving relevant revision advice for improvement of the paper.
Conflicts of Interest
The authors declare no conflicts of interest.
Abbreviations
The following abbreviations are used in this manuscript:
| Drag, N | |
| Drag coefficient, (−) | |
| Air density, kg m−3 | |
| Leaf area density, m−1 | |
| x | Downstream distance from the nozzle exit, m |
| Distance from the spray outlet to the jet origin, m | |
| Termination point of the transition zone, m | |
| ux | Air velocity, m s−1 |
| u0 | Initial exit velocity, m s−1 |
| Cm | Jet momentum coefficient, (−) |
| b0 | Jet radius, m |
| b | spreading radius |
| ux0 | Centerline velocity at nozzle exit, m s−1 |
| Arc radius of nozzle manifold assembly, m | |
| β | Arc angle (º) |
| uxm | Average velocity, m |
| ux|in | Velocity upon entering the crown, m s−1 |
| ux|out | Velocity at exit from crown, m s−1 |
| Initial position coordinates at the crown edge, m | |
| Position at the crown’s exit, m | |
| n | Constant, (−) |
| A1 | Constant, (−) |
| A2 | Constant, (−) |
| A3 | Constant, (−) |
| A4 | Constant, (−) |
| A5 | Constant, (−) |
| C1 | Integration constant, (−) |
| Ct | Constant, (−) |
| N | Total number of air velocity measurement data, (−) |
| i | The i-th data point, (−) |
| SD | Standard deviation, (−) |
| CV | Variation coefficient, % |
References
- Osterman, A.; Godeša, T.; Hočevar, M.; Širok, B.; Stopar, M. Real-time positioning algorithm for variable-geometry air-assisted orchard sprayer. Comput. Electron. Agric. 2013, 98, 175–182. [Google Scholar] [CrossRef]
- Miranda-Fuentes, A.; Rodríguez-Lizana, A.; Cuenca, A.; González-Sánchez, E.J.; Blanco-Roldán, G.L.; Gil-Ribes, J.A. Improving plant protection product applications in traditional and intensive olive orchards through the development of new prototype air-assisted sprayers. Crop Prot. 2017, 94, 44–58. [Google Scholar] [CrossRef]
- Hołownicki, R.; Doruchowski, G.; Świechowski, W.; Godyń, A.; Konopacki, P.J. Variable air assistance system for orchard sprayers; concept, design and preliminary testing. Biosyst. Eng. 2017, 163, 134–149. [Google Scholar] [CrossRef]
- Bahlol, H.Y.; Chandel, A.K.; Hoheisel, G.-A.; Lav, R. The smart spray analytical system: Developing understanding of output air-assist and spray patterns from orchard sprayers. Crop Prot. 2020, 127, 104977. [Google Scholar] [CrossRef]
- Miranda-Fuentes, A.; Rodríguez-Lizana, A.; Gil, E.; Agüera-Vega, J.; Gil-Ribes, J.A. Influence of liquid-volume and airflow rates on spray application quality and homogeneity in super-intensive olive tree canopies. Sci. Total Environ. 2015, 537, 250–259. [Google Scholar] [CrossRef] [PubMed]
- Zhu, H.; Derksen, R.C.; Krause, C.R.; Brazee, R.D.; Fox, R.D.; Ozkan, H.E. Spray deposition in taxus and air velocity profile for a fiveport, air-assist sprayer. In Proceedings of the 2004 ASAE Annual Meeting, Ottawa, ON, Canada, 1–4 August 2004; American Society of Agricultural and Biological Engineers: St Joseph, MI, USA, 2004; p. 1. [Google Scholar]
- Zeng, P.; Takahashi, H. A first-order closure model for the wind flow within and above vegetation canopies. Agric. For. Meteorol. 2000, 103, 301–313. [Google Scholar] [CrossRef]
- Walklate, P.J.; Weiner, K.L.; Parkin, C.S. Analysis of and experimental measurements made on a moving air-assisted sprayer with two-dimensional air-jets penetrating a uniform crop canopy. J. Agric. Eng. Res. 1996, 63, 365–377. [Google Scholar] [CrossRef]
- Friso, D.; Baldoin, C.; Pezzi, F. Mathematical modeling of the dynamics of air jet crossing the canopy of tree crops during pesticide application. Appl. Math. Sci. 2015, 9, 1281–1296. [Google Scholar] [CrossRef]
- Koch, K.; Samson, R.; Denys, S. Aerodynamic characterisation of green wall vegetation based on plant morphology: An experimental and computational fluid dynamics approach. Biosyst. Eng. 2019, 178, 34–51. [Google Scholar] [CrossRef]
- Molina-Aiz, F.D.; Valera, D.L.; Alvarez, A.J.; Madueño, A. A wind tunnel study of airflow through horticultural crops: Determination of the drag coefficient. Biosyst. Eng. 2006, 93, 447–457. [Google Scholar] [CrossRef]
- Cao, J.; Tamura, Y.; Yoshida, A. Wind tunnel study on aerodynamic characteristics of shrubby specimens of three tree species. Urban For. Urban Green. 2012, 11, 465–476. [Google Scholar] [CrossRef]
- Endalew, A.M.; Debaer, C.; Rutten, N.; Vercammen, J.; Delele, M.A.; Ramon, H.; Nicolaï, B.M.; Verboven, P. A new integrated CFD modelling approach towards air-assisted orchard spraying. Part I. Model development and effect of wind speed and direction on sprayer airflow. Comput. Electron. Agric. 2010, 71, 128–136. [Google Scholar] [CrossRef]
- Hong, S.W.; Zhao, L.; Zhu, H. CFD simulation of pesticide spray from air-assisted sprayers in an apple orchard: Tree deposition and off-target losses. Atmos. Environ. 2018, 175, 109–119. [Google Scholar] [CrossRef]
- Li, J.; Li, Z.; Ma, Y.; Cui, H.; Yang, Z.; Lu, H. Effects of leaf response velocity on spray deposition with an air-assisted orchard sprayer. Int. J. Agric. Biol. Eng. 2021, 14, 123–132. [Google Scholar] [CrossRef]
- Brazee, R.D.; Fox, R.D.; Reichard, D.L.; Hall, F.R. Turbulent Jet Theory Applied to Air Sprayers. Trans. ASAE 1981, 24, 266–272. [Google Scholar] [CrossRef]
- Fox, R.D.; Brazee, R.D.; Reichard, D.L.; Hall, F.R. Power in an air sprayer jet. Trans. ASAE 1982, 25, 1181–1184. [Google Scholar] [CrossRef]
- Randall, J.M. The relationships between air volume and pressure on spray distribution in fruit trees. J. Agric. Eng. Res. 1971, 16, 1–31. [Google Scholar] [CrossRef]
- Schlichting, H.; Kestin, J. Boundary Layer Theory; McGraw-Hill: New York, NY, USA, 1961; Volume 121. [Google Scholar]
- Zhang, C.; Zhou, H.; Xu, L.; Ru, Y.; Ju, H.; Chen, Q. Wind tunnel study of the changes in drag and morphology of three fruit tree species during air-assisted spraying. Biosyst. Eng. 2022, 218, 153–162. [Google Scholar] [CrossRef]
- Zhang, C.; Zhou, H.; Xu, L.; Ru, Y.; Ju, H.; Chen, Q. Measurement of morphological changes of pear leaves in airflow based on high-speed photography. Front. Plant Sci. 2022, 13, 900427. [Google Scholar] [CrossRef] [PubMed]
- Xu, L.; Wu, Y.; Zhou, H.; Zhang, J.; Zhang, C. Analysis of spatial motion attitude and droplet deposition effect of tree leaves in response to wind vibration. Trans. Chin. Soc. Agric. Eng. (Trans. CSAE) 2024, 40, 71–81. [Google Scholar]
Disclaimer/Publisher’s Note: The statements, opinions and data contained in all publications are solely those of the individual author(s) and contributor(s) and not of MDPI and/or the editor(s). MDPI and/or the editor(s) disclaim responsibility for any injury to people or property resulting from any ideas, methods, instructions or products referred to in the content. |
© 2025 by the authors. Licensee MDPI, Basel, Switzerland. This article is an open access article distributed under the terms and conditions of the Creative Commons Attribution (CC BY) license.