Abstract
Establishing an accurate high-moisture corn ear fragmentation model using the Discrete Element Method is crucial for studying the processing and fragmentation of high-moisture corn ears. This study focuses on high-moisture corn ears during the early harvest stage, developing a fragmentable corn ear model and calibrating its bonding parameters. First, based on the Hertz–Mindlin method in the Discrete Element Method, a three-layer corn cob bonding model consisting of pith, woody ring structure, and glume was established. Through a combined experimental and simulation calibration approach, the bonding parameters of the cob were determined using Plackett–Burman tests, the steepest ascent tests, and Box–Behnken tests. Subsequently, the same method was applied to establish a corn kernel bonding model, with the kernel bonding parameters calibrated through the steepest ascent and Box–Behnken tests. In order to arrange the kernel models on the cob model to achieve the construction of a complete ear model, this paper proposes a “matrix coordinate positioning method”. Through calculations, this method enables the uniform arrangement of corn kernels on the cob, thereby accomplishing the establishment of a composite model for the high-moisture corn ear. The bonding parameters between the cob and kernels were determined through compression tests. Finally, the reliability of the model was partially validated through shear testing; however, potential confounding variables remain unaccounted for in the experimental analysis. While this study establishes a theoretical framework for the design and optimization of machinery dedicated to high-moisture corn ear fragmentation processes, questions persist regarding the comprehensiveness of variable inclusion during parametric evaluation. This analytical approach exhibits characteristics analogous to incomplete system modeling, potentially limiting the generalizability of the proposed methodology.
1. Introduction
In the feed processing industry, it is common practice to directly crush harvested corn ears into granules or powder. However, the qualification of the crushing quality directly affects the quality of the feed [1,2,3,4]. With the advancement of numerical simulation technology, an increasing number of researchers have applied this technology to the establishment of corn ear models and the study of the threshing process [5,6,7,8]. Nevertheless, research on the theory of corn ear breakage is still relatively scarce. Therefore, establishing a reliable high-moisture corn ear (HMCE) model using the Discrete Element Method (DEM) and accurately calibrating its bonding parameters are crucial. This holds significant theoretical importance for the design and optimization of HMCE crushing devices, as well as for the analysis of the crushing mechanism [9,10].
The HMCE model consists of two parts: the corn cob and the corn kernels, and its establishment process is relatively complex. Scholars both domestically and internationally have already constructed models and calibrated parameters for the corn cob and kernels separately. Li et al. introduced an approach to model the corn cob and determined the contact parameters along with Poisson’s ratio using compression experiments [11]. Zhang et al. used the DEM to simulate compression tests, investigating the compressive strength of corn cobs of different lengths. The results indicated that length significantly affects their mechanical properties [12]. These studies overlooked the mechanical differences between the pith, woody ring, and glume. Zou et al. examined the three parts of the corn cob (pith, woody ring, and glume), indicating that these parts affect the mechanical properties of the corn cob differently. However, they failed to create a DEM for it [13]. In recent years, numerous scholars have employed the DEM to construct layered models for crop stalks. For instance, Li et al. created a two-layer stalk model, calibrated the bonding parameters for interactions between the skin–skin and pith–skin, and validated the model’s reliability through physical experiments [14]. Xin et al. used a particle-layering method to fill particles representing corn stalks. This model was then applied to stalk-crushing experiments. These methods provide a reference for establishing the corn cob model [15].
Scholars have extensively explored corn kernel models. Su et al. calibrated the bonding parameters of the DEM for corn kernels through uniaxial compression tests. They also simulated three types of centrifugal discs in a corn centrifugal crushing tester using DEM, and the results aligned with experimental outcomes [16,17]. Zhou et al. created four corn kernel models with different precision levels. They figured out the coordinates and arrangement rules for filling spheres [18,19]. Li et al. proposed a method for constructing corn kernel models and calibrated the contact parameters of corn kernels using an improved inclined plane drop method and funnel method [20]. However, these studies did not account for the connection relationship between corn kernels and the cob.
Currently, there is limited research on modeling methods for HMCE. Li et al. proposed a method for discrete element models based on DEM, using corn ears as an example to validate the reliability of the model [21]. Han et al. used a combination of the Hertz–Mindlin and Bonded V2 contact models to develop a DEM for the middle part of a threshable corn ear. They determined the key bonding parameters for individual corn kernels and the cob, and confirmed the model’s validity by matching simulation outcomes with experimental data [22]. Although the aforementioned models are structurally precise, they exhibit poor adaptability when simulating the crushing of corn ears. Therefore, developing an HMCE model capable of simulating crushing scenarios holds significant importance for related research.
Therefore, this study established a crushable model of HMCEs and calibrated the bonding parameters between corn kernels and cob. The bonding parameters between the cob and kernels were determined through compression tests, while shear tests were conducted to validate the model reliability. Compared with existing corn ear models, the three-layer heterogeneous structure model of the cob (pith, woody ring structure, and glume) developed in this research achieved differential characterization of mechanical properties between cob layers. By employing the matrix coordinate positioning method, precise spatial arrangement of kernels was realized. The constructed non-homogeneous high-moisture corn ear crushing model enabled simultaneous crushing of kernels and cob. These research results provide a theoretical foundation for the design and optimization of crushing machinery for HMCEs.
2. Materials and Methods
2.1. Density and Moisture Content Testing of HMCE
The study chose HMCE (Yuanke 105 WG) from Jilin Agricultural University’s experimental field one week pre-harvest as the research object. The ears’ outer leaves were taken off, and the ear part was kept for measurement. The density of the corn cob and kernels was measured separately using the water displacement method, yielding results of 1077 kg/m3 and 5740 kg/m3, respectively. Ten ears with no obvious damage were selected, and their initial weight (m1) was recorded using an electronic balance. After drying in an oven at 105 °C for 48 h, the weight (m2) was obtained. Using Equation (1), it was determined that HMCE has a moisture content of 34% [23].
where M is the moisture content of HMCEs, m1 is the initial weight of HMCEs, and m2 is the weight of HMCEs after drying.
2.2. Physical Property Tests of Corn Cobs and Kernels
Shear tests on the corn cob and kernels were performed with a universal testing machine. A mid-section length of 90 mm was selected for the corn cob to determine the critical shear load of both the corn cob and the corn kernels. Each group was tested 10 times at a falling velocity of 2 mm/min, and the average value of the test results was taken. The results are shown in Table 1 and Table 2, As shown in Figure 1.

Table 1.
Physical test results of corn cob.
Table 2.
Physical test results of corn kernels.
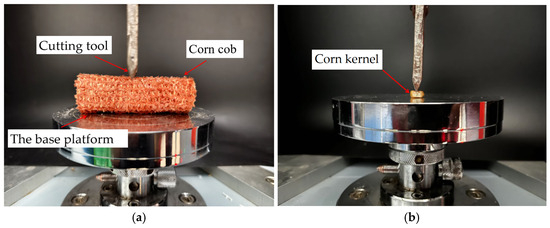
Figure 1.
Physical shear tests. (a) Shear test of corn cob; (b) shear test of corn.
Based on the experimental results and parameters from the references, the intrinsic and contact parameters of the materials were obtained, as shown in Table 3.
Table 3.
Material inherent parameters and interaction parameters.
2.3. Establishment of the DEM
To characterize the original features of the corn cob [13], this study established a composite HMCE model using EDEM software (EDEM2020). The model was filled with the glume, woody ring, and pith of the ear cob. The three-part model was processed using a meshing method to obtain the radius and coordinates of the inscribed spheres for each mesh. The obtained inscribed sphere radius and coordinate data were imported into the rapid filling module in EDEM to complete the creation of the cob model. To reduce simulation time and improve efficiency, a corn cob model with a length of 90 mm was established, as shown in Figure 2.
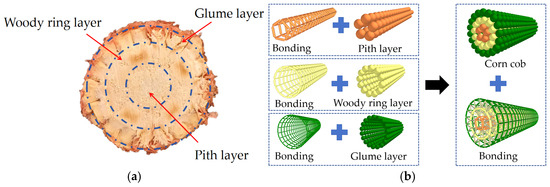
Figure 2.
DEM Simulation Model of Corn Cob. (a) Physical Structure of Corn Cob; (b) Structure of the DEM Model for Corn Cob.
In order to ensure thorough crushing of corn kernels and improve the model’s validity, all particles of the fragmentation units must remain separated or tangent to each other. Therefore, the corn kernels are simplified into a nine-ball filling model, with each filling ball connected by bonding bonds. Taking the geometric center O of the corn cob as the coordinate origin, as shown in Figure 3, the coordinates (x1, y1) of each filling ball relative to the connecting ball O1 in the local coordinate system are determined using the polygon cutting and filling method. Through Formulas (2) and (3), the two-dimensional coordinates (X1, Y1) of each filling ball in the corn kernel relative to the geometric center O of the cob can be determined. The Z-coordinate remains consistent with the cob, and the kernels are uniformly distributed on the cob. Finally, an HMCE fragmentation model is established, as shown in Figure 4.
where R is the radius of the corn cob (mm), i is the circumferential position index of the kernel, k is the number of arrangement cycles, and θ is the axial tilt angle of the kernel.
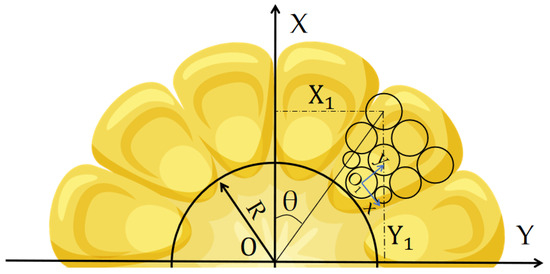
Figure 3.
Cross-sectional coordinate system of the HMCE cob.
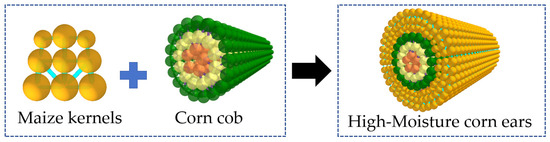
Figure 4.
DEM simulation model of the HMCE cob.
2.4. Simulation Experiment
2.4.1. Corn Cob Calibration
The simulation employed the H-M bonded particle model. Due to the excessive number of parameters to be calibrated, the pith and woody ring were set as isotropic, while the glume was set as anisotropic. The normal and tangential SPUA of the bonding bonds for the pith, woody ring, and their connecting parts were set to be consistent, as were the critical normal and tangential stresses. To quickly screen the key parameters affecting the critical shear load of the corn cob, a PB test was first conducted to assess the importance of simulation parameters. A SAT was then conducted to ascertain each factor’s ideal range. Lastly, the best parameter combination for the corn cob breakage model was found using a B-B test.
Based on preliminary experiments and a review of relevant literature [11,26,27,28], the parameter ranges were selected as shown in Table 4. Shear simulation tests were performed on the corn cob using the PB experimental design approach in order to determine the primary elements affecting the maize cob’s critical shear load.
Table 4.
PB test parameter levels.
In the simulation experiment, the axial falling velocity was set to 2 mm/min, consistent with the falling velocity used in the physical tests. The shear test simulation is illustrated in Figure 5.
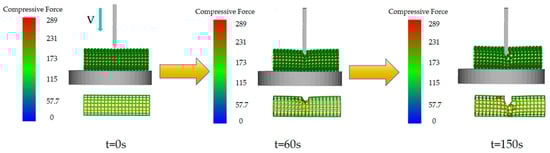
Figure 5.
Time-dependent diagram of shear simulation test for corn cob.
2.4.2. Corn Kernel Calibration
The bonding parameters of the corn kernels have a significant impact on the critical shear load of the kernels. The SAT was conducted for each factor listed in Table 5, with the value ranges for the steepest ascent test path determined based on preliminary experiments and literature [16,29,30,31]. The falling velocity for the shear simulation test was set to 2 mm/min, consistent with the falling velocity used in the physical tests. The shear test simulation is showed in Figure 6.
Table 5.
Arrangement and results of the SAT on corn kernel.
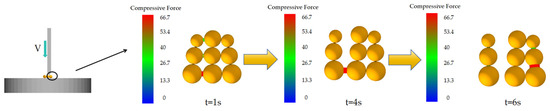
Figure 6.
Time-dependent diagram of shear simulation test for corn kernels.
The results in Table 5 indicate that when the normal SPUA of the kernels is 6 × 10⁹, the tangential SPUA is 7 × 10⁸, the critical normal stress is 3 × 10⁶, and the critical tangential stress is 1 × 10⁶, the critical shear load is 80.5 N. Compared to the critical shear load of 77.89 N obtained from the physical tests, the error is only 3.3%.
Based on the results of the SAT, the fifth group of tests was selected as the center point, while the fourth and sixth groups were defined as the highest and lowest points, respectively, for the B-B experiment. The parameter levels for the B-B test are shown in Table 6. The optimal parameter combination was determined by analyzing the results.
Table 6.
B-B test parameter levels for corn kernel.
3. Results
3.1. Corn Cob Bonding Parameter Calibration Results
3.1.1. PB Experimental Results for Corn Cob
Based on Section 2.4.2, a PB experiment was conducted. During the simulation, the time step was set to 5 × 10⁻⁹, and the simulation lasted 150 s. The dimensions of the simulated corn cob matched those of the physical experiment. The test results are shown in Table 7. Under different parameter combinations, the measured critical shear load varied, with the range of critical shear loads being 820.34–207.565 N.
Table 7.
PB test design and results.
Table 8 presents the significance analysis of the factors examined in the PB experiment. The test results indicate that the model’s p-value is 0.0096 < 0.01, demonstrating significance and reliability. The coefficient of determination, R2 = 0.9653, demonstrates a high degree of correlation between the model and the experimental data, indicating excellent agreement and a strong predictive capability of the model. The adjusted R2 (R2 adj) = 0.8683, indicating that the model explains the variability of the response variable after accounting for the number of independent variables in the model. Combined with Table 8 and Pareto Chart Figure 7, it is shown that the critical tangential stress of the pith (A) has the greatest influence on the critical shear load of the corn cob, followed by the critical tangential stiffness of the woody ring (C), the tangential SPUA of the glume (E), and the critical tangential stress between the woody ring and the glume (N). Other factors have no significant effect on the critical shear load (p > 0.05).
Table 8.
Analysis of the PB test factors’ significance.
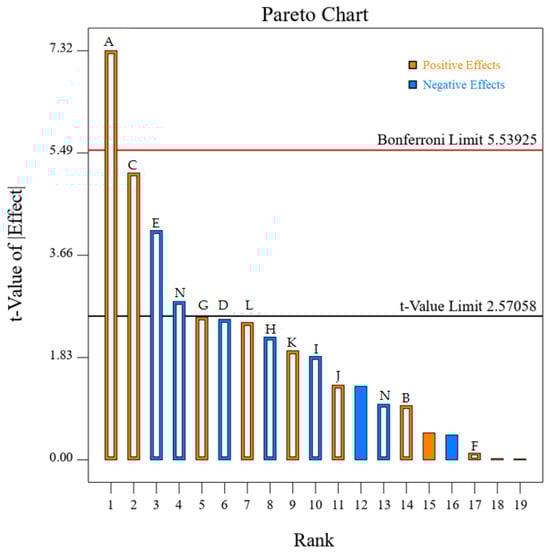
Figure 7.
Pareto chart of the PB test.
3.1.2. Results of the SAT for Corn Cob
Based on the results of the PB experiment, the factors significantly affecting the critical shear load were selected for the steepest ascent experiment. Among them, the critical tangential stress of the pith (A) and the critical tangential stiffness of the woody ring (C) has a positive effect on the critical shear load, while the tangential SPUA of the glume (E) and the critical tangential stress between the woody ring and the glume (N) has a negative effect on the critical shear load. For other non-significant factors, the values were set to the midpoint of the range for each level in the table: B was 5.5 × 10⁸, D was 5.5 × 10⁶, F was 2.75 × 10⁹, G was 2.75 × 10⁶, H was 2.75 × 10⁹, I was 5.5 × 10⁸, J was 5.5 × 10⁷, K was 5.5 × 10⁸, L was 5.5 × 10⁸, and M was 5.5 × 10⁷. The results of the SAT are shown in Table 9.
Table 9.
Arrangement and results of the SAT on corn cob.
3.1.3. Results of the B-B Experiment for Corn Cob
According to the principle of minimizing the comprehensive error, the bonding parameter values of the third experimental level were selected as the center point in the follow-up test, and the factor levels of Test 2 and Test 4 were used as the low and high levels of the B-B test, respectively. For other bonding parameters with relatively minor comprehensive effects, the midpoint values were used. The design and results of the B-B experiment are shown in Table 10.
Table 10.
Design and results of the B-B test for corn cob.
Through quadratic multiple regression fitting of the experimental data, a regression equation was derived, with the critical load serving as the response variable, as shown in Equation (4). Figure 8 illustrates the comparison between the fitted equation and the simulation tests, demonstrating the accuracy of the established model.
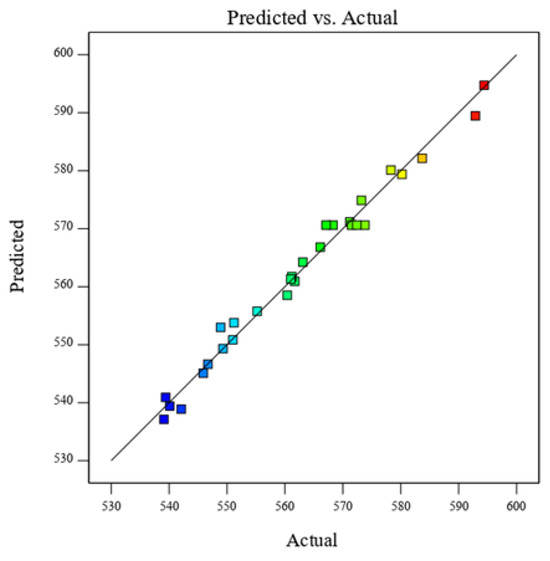
Figure 8.
Predicted vs. Actual Values of Critical Shear Load.
In the ANOVA Table 11, the regression model has a p-value < 0.0001, indicating that the relationship between the four factors (critical tangential stress of the pith (A), critical tangential stiffness of the woody ring (C), tangential SPUA of the glume (E), and critical tangential stress between the woody ring and the glume (N)) and the critical shear load is highly significant. The lack-of-fit term of the model is not significant, and the coefficient of determination R2 = 0.985, with the adjusted coefficient of determination R2adj = 0.9701, indicating that the model has a sufficiently high fit. In this model, A, C, E, N, A2, C2, E2, and N2 have a highly significant effect on the critical shear load, while the interaction terms AE, CE, and CN also show high significance. The remaining terms are not significant.
Table 11.
Analysis of variance table for the B-B test of corn cob.
3.1.4. Response Surface Analysis of Bonding Parameters for Corn Cob
Based on the regression model, the response surfaces illustrating the interactions between significant influencing factors are shown in Figure 9. From Figure 9a, it can be observed that under the lower critical normal and tangential stress of the pith, the critical shear load increases with the increase in the tangential SPUA of the glume. At higher tangential SPUA of the glume, the critical normal and tangential stress of the pith slightly increases, but the change is almost negligible. As shown in Figure 9b,c, as the critical normal/tangential stiffness of the woody ring increases, the influence of the tangential SPUA of the glume on the critical shear load becomes more pronounced, while the influence of the critical tangential stress between the woody ring and the glume on the critical shear load is relatively smaller. Combining the ANOVA Table 11, the order of influence of these four parameters on the critical shear load is E > C > N > A. Among them, the critical normal and tangential stress of the pith has the least impact on the critical shear load of the corn cob. The pith tissue, characterized by its porous spongy structure, exhibited mechanically weakened properties, with critical normal and tangential stresses contributing less than 8% to shear strength (p < 0.01), thereby forming a functional buffer layer. The glume layer, functioning as a composite protective system, achieved multi-stage energy dissipation through its fractal fibrous network and gradient lignin distribution, which enhanced critical shear strength and established a viscoelastic–plastic buffering mechanism. The woody ring structure and its bonding connections with the glume layer demonstrated hardwood-like characteristics with high rigidity, primarily serving a load-bearing role during cob shear deformation and significantly contributing to the cob’s mechanical performance. These findings align well with the actual structural and mechanical properties of corn cobs [12].
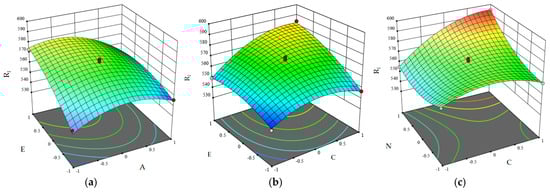
Figure 9.
Influence of Interaction Terms on Critical Shear Load; (a) Influence of A and E. (b) Influence of C and E. (c) Influence of N and C.
3.1.5. Optimization of Bonding Parameters for Corn Cob
To identify the optimal combination of simulation parameters, the regression model was refined based on Equation (4). The experimentally determined critical shear load of 562.14 N for the corn cob was established as the optimization objective. The corresponding objective function and constraint equations are formally defined in Equation (5).
The optimal solution of the equation was obtained as follows: A was 2.3 × 10⁸ Pa, C was 2.45 × 10⁹ N/m3, E was 2.57 × 10⁹ N/m3, and N was 6.12 × 10⁷ Pa. Figure 10 shows a comparative curve of shear test results between the corn cob axle simulation and actual physical experiments. In the figure, the simulation and experimental results demonstrate high consistency in overall trends. Both curves exhibit a gradual increase in shear force with growing shear displacement, with distinct peaks occurring at approximately 8 mm displacement in both cases, indicating material yielding. The established corn cob axle model accurately reflects the mechanical characteristics of corn cob axles.
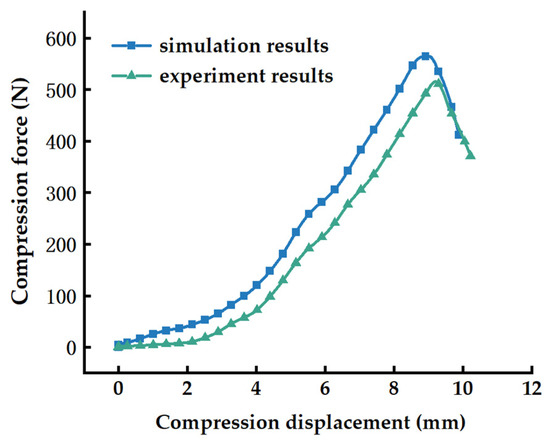
Figure 10.
Comparison Curve of Simulation and Experimental Results for the Corn cob.
3.2. Corn Kernel Bonding Parameter Calibration Results
3.2.1. Results of the B-B Experiment for Corn Kernels
Based on Section 2.4.2, a B-B experiment was conducted with a simulation time step of 2 × 10⁻⁶ and a simulation duration of 20 s. Twenty-nine sets of experiments were conducted in total. The experimental design and results are shown in Table 12.
Table 12.
Design and results of the B-B test for corn kernel.
Considering the existing influences among the main parameters and the interactions between factors, a quadratic multiple regression fitting was performed on the experimental results. A quadratic regression equation for corn kernels under shear force was established, as shown in Equation (6) below.
As shown in Table 13. The coefficient of determination R2 = 0.9976, and the adjusted coefficient of determination adjustedR2adj = 0.9952, indicate that the regression equation has a good fit. As shown in 13, the regression model p < 0.0001, indicates that the model is strongly significant. Additionally, the lack-of-fit term p > 0.05 suggests that there are no significant error issues. Among the influencing factors, X2, X1×2, X1×3, X3×4, X12, X22, X32, and X42, have a highly significant impact on the critical shear load X1, X4, X2×4, and have a significant impact on the critical shear load, while the remaining factors have no significant effect on the critical shear load.
Table 13.
Analysis of variance table for the B-B test of corn kernel.
3.2.2. Response Surface Analysis of Bonding Parameters for Corn Kernels
Based on the ANOVA results, the statistically significant parameter interactions are shown in Figure 11. The interaction terms X1×3, X3×4, and X2×4 have a significant impact on the critical shear load (p < 0.05), The statistically significant parameter interactions are illustrated in the figure. From Figure 11a, it can be observed that when X3 and X4 are at intermediate levels, X1 and X2 first increase and then decrease. From Figure 11b, it can be seen that when X2 and X4 are at intermediate levels, the rate of change of X1 is slightly greater than that of X3, which may be due to the relatively small influence of X3 on the critical shear load. From Figure 11c, it is evident that when X1 and X3 are at intermediate levels, X2 shows an initial increase followed by a decrease, while X4 exhibits a slight increase followed by a minor decrease with a low rate of change. This is because the influence of X4 on the critical shear load is less than that of X2. From Figure 11d, it can be observed that when X1 and X2 are at intermediate levels, both X3 and X4 show an initial increase followed by a decrease.
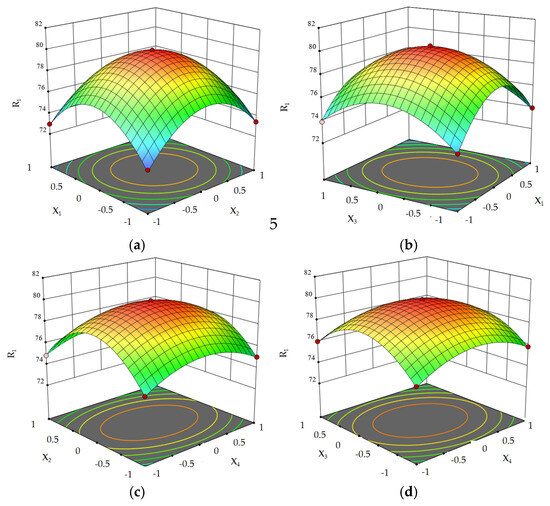
Figure 11.
The influence of interaction terms on the critical shear load: (a) The influence of X1 and X2. (b) The influence of X3 and X1. (c) The influence of X2 and X4. (d) The influence of X3 and X4.
3.2.3. Optimization of Bonding Parameters for Corn Kernels
In the regression equation, the critical normal stress X3 is not sufficiently significant, so its intermediate value of 3 × 10⁶ Pa is adopted. The regression model is optimized based on the equation. The physical measured value of the critical shear load for the corn cob, which is 77.89 N, is set as the optimization target. The corresponding objective and constraint equations are shown in Equation (7).
The optimal solution of the equation is obtained as follows: X1 is 6.53 × 10⁹ N/m3, X2 is 6.5 × 10⁸ N/m3, X3 is 3 × 10⁶ Pa, X4 is 1 × 10⁶ Pa. As shown in Figure 12, the simulation curve and physical test curve exhibit a highly consistent trend. This indicates that the established corn kernel simulation model can accurately capture the variation of stress with strain during the shear process, demonstrating that the calibrated model effectively reflects the shear characteristics of corn kernels.
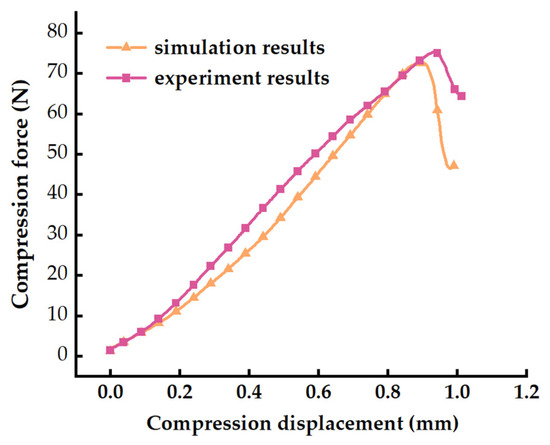
Figure 12.
Comparison Curve of Simulation and Experimental Results for the Corn kernel.
3.3. Calibration of Bonding Force Parameters Between Corn Kernels and Corn Cob
Combining the bonding parameter data from the simulation calibration model of related studies [22,32], the compression test validation of the kernel–cob bonding model is shown in Figure 13. The indenter’s descent speed was set to 0.5 mm/s. Through continuous testing and calibration, the bonding parameters between corn kernels and corn cob were determined as follows: normal SPUA 4.21 × 10⁹ N/m3, tangential SPUA 2.32 × 10⁹ N/m3, critical normal stress 1.48 × 10⁶ Pa, and critical tangential stress 0.8 × 10⁶ Pa. The optimal combination of bonding parameters was validated five times, yielding a simulation result of 5.63 ± 0.1. The discrepancy between the simulated data and the mean physical compression test remained below 5%. indicating that the parameter calibration results have high accuracy and reliability.
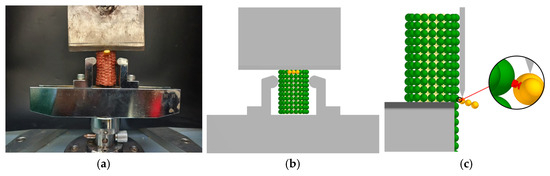
Figure 13.
Physical compression test and simulated compression test of the kernel–cob bonding model: (a) Physical compression test. (b) Simulated compression test. (c) Compression process.
3.4. Validation
To validate the calibration results of the simulation parameters for HMCEs, longitudinal shear tests of HMCEs were conducted using EDEM. The results were compared with physical test results, using the critical shear load as the evaluation criterion. The shear simulation tests were repeated three times. Based on the bonding parameter combinations obtained from Section 3.1.5, Section 3.2.2, and Section 3.3, the simulation bonding parameters were unified as shown in Table 14. The force–displacement curves obtained from the physical tests and the calibrated numerical simulations are largely consistent, with similar peak strengths, as illustrated in Figure 14.
Table 14.
Simulation bonding parameters for HMCE.
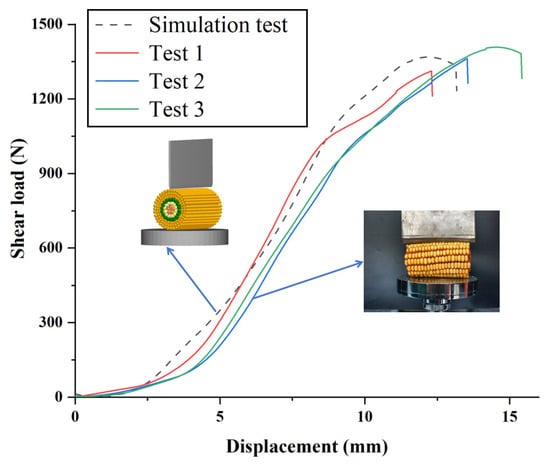
Figure 14.
Comparison between compression test results and simulation test results.
In the simulation tests, the average critical shear load of the HMCE was 1367.19 N. Compared to the laboratory test results, the model exhibited an error of 3.3% relative to the actual average critical shear load of 1413.25 N. According to previous parameter calibration studies, a maximum error range of 10% is acceptable. Therefore, the obtained bonding parameters are reliable.
4. Discussion
This study focuses on HMCE as the research subject. Using DEM, a model of HMCEs was established, and the bonding parameters of the corn cob were calibrated.
- Corn Cob Model and Parameter Calibration
The corn cob was modeled using a layered modeling approach, where the pith, woody ring structure, and glume were separately constructed. A three-layer discrete element model of the corn cob was developed using mesh division and particle-filling methods. The established model fully considers the actual structural and physical characteristics of the corn cob, making it more aligned with the real mechanical properties of the corn cob. This approach avoids the shortcomings of the single-layer cob model proposed by Li et al., which did not account for the mechanical differences among the pith, woody ring structure, and glume [11]. When selecting the influencing factors for the cob bonding model, the interactions between the pith–woody ring structure and the woody ring structure–glume were considered, addressing the limitations of Cui et al.’s research. Through layered calibration, it was determined that the tangential SPUA of the glume layer has the greatest impact on the critical shear load, which is consistent with the phenomenon of the glume layer cracking first during the actual failure process of the corn cob [26]. This significantly improved the model accuracy, with the calibrated cob shear load error being only 3.3%. By calibrating the bonding parameters of the corn cob and kernels, a combination of bonding parameters that could not be obtained experimentally was successfully determined.
- Kernel Model and Parameter Calibration
In this study, a nine-ball bonding model was employed to construct the corn kernel, and the bonding parameters were calibrated through shear tests. This approach not only ensures model accuracy but also meets the requirements for simulating breakage. Compared to the five-ball and two-ball models proposed by Wang et al., the nine-ball model better approximates the actual kernel morphology in terms of particle contact area and stress distribution, reducing the calibration error from 7.8% to 3.3% [33,34]. By introducing the H-M bonding contact model, the bonding between the kernel and the corn cob was achieved. Through comparative analysis of simulation and physical experiments, the error was found to be less than 5%. In contrast, although Cui et al. optimized the kernel–cob connection method, their kernel model did not account for breakage behavior [26].
- HMCE Model Establishment
In this study, a matrix coordinate positioning method was proposed to uniformly bond the corn kernel models onto the corn cob model. By using a centroid coordinate algorithm (formula), the coordinates of the center of any sphere in the kernel-filling spheres were determined, resulting in the construction of a breakable ear model containing 144 kernels. Compared to the homogenized ear model by Li et al. and the corn ear threshing model by Cui et al., this study, for the first time, achieved synchronous simulation of kernel and cob breakage through the combination of a three-layer cob model and a multi-sphere kernel model [11,26]. The model demonstrates high accuracy, with a relative error of 3.3% between the simulated and experimentally measured average critical shear load.
- Research Outlook
In this study, the selected corn ears only considered single moisture content and variety, without adequately addressing the mechanical differences of corn ears with different varieties and moisture contents. In future research, for the bonding models of different moisture contents, different contact parameters and bonding parameters will be used to describe and establish DEM models of corn ears with different moisture contents (15–35%), to study the effects of moisture on the core-to-core bonding parameters and kernel breakage, and to discuss the mechanical properties of corn ears at different moisture contents. For different varieties, differentiated corn ear models will be established to study the impact of kernel arrangement patterns on shear critical load and to develop variety-specific DEM models. Through simulating the breakage process of corn ears in crushing equipment, the breakage mechanism of corn ears will be analyzed and the working and structural parameters of the crusher will be optimized, so as to cut the design cost of physical prototypes. The model will mainly offer a theoretical basis for the design of crushers for HMCEs.
5. Conclusions
This study focuses on HMCE as the research subject. To enhance the accuracy of the HMCE breakage simulation in subsequent studies, a shear test-based calibration method was used to identify the hard-to-obtain bonding parameters for HMCE. By matching the results against experimental and numerical data, the model’s validity was established. The study’s conclusions are as follows:
Using a particle arrangement method, a corn cob model was established, dividing the cob into a three-layer structure consisting of the pith, woody ring structure, and glume. The kernel was simplified into a nine-sphere structure. The coordinate positions of the kernels relative to the cob were precisely calculated using a formula, ultimately determining the coordinates of the corn kernels and the particle coordinates of the kernel-filling spheres. Finally, a breakable HMCE model was constructed using the H-M bonding contact model.
Shear tests combined with calibration methods were employed to determine the mechanical parameters that are difficult to measure through physical experiments. The PB test was used to screen out factors significantly affecting the critical shear load. The steepest ascent test was then used to identify the optimal range of experimental levels. Finally, the B-B test was conducted to derive the best combination of simulation parameters: the critical normal/tangential stress of the pith was 2.3 × 10⁸ Pa, the critical normal/tangential stiffness of the woody ring structure was 2.45 × 10⁹ N/m3, the tangential SPUA of the glume was 2.57 × 10⁹ N/m3, and the critical tangential stress between the woody ring structure and glume was 6.12 × 10⁷ Pa.
The B-B test findings showed the developed quadratic regression model for the critical shear load of corn kernels demonstrated good reliability and accuracy. Through analysis and optimization, the optimal combination of bonding parameters for the corn kernels was determined as follows: normal SPUA of 6.1 × 10⁹ N/m3, tangential SPUA of 7.17 × 10⁹ N/m3, critical normal stress of 3.34 × 10⁶ Pa, and critical tangential stress of 1.02 × 10⁶ Pa.
The bonding force between the corn kernel and the corn cob was determined using the single-kernel compression method. The bonding parameters obtained were as follows: normal SPUA of 4.21 × 10⁹ N/m3, tangential SPUA of 2.32 × 10⁹ N/m3, critical normal stress of 1.48 × 10⁶ Pa, and critical tangential stress of 0.8 × 10⁶ Pa. The results of the physical experiments and simulation tests were in close agreement, confirming the reliability of the bonding model between the corn cob and the corn kernel.
Physical shear tests were conducted on HMCE using the aforementioned parameter combinations for validation. The results showed that the average relative error between the simulated results and the critical shear load was 5.29%, indicating a small margin of error. Additionally, the simulation curve was compared with the physical test curve, revealing a highly consistent trend between the two curves.
Author Contributions
The nine authors developed the research approach together. C.L., conceptualization, and writing—original draft; Z.L., writing—review and editing; L.G., formal analysis; writing—review and editing; T.X., formal analysis; writing—review and editing; W.F., formal analysis; writing—review and editing; M.L., formal analysis; writing—review and editing; D.Q., formal analysis; writing—review and editing; Y.W., formal analysis; writing—review and editing. J.W., formal analysis; writing—review and editing. All authors have read and agreed to the published version of the manuscript.
Funding
This research was funded by the “Research and development of high humidity corn ear crushing technology and supporting devices, grant number 20230202036NC”.
Institutional Review Board Statement
Not applicable.
Informed Consent Statement
Not applicable.
Data Availability Statement
The data that support the findings of this study are available from the corresponding author upon reasonable request.
Acknowledgments
In this paper, we received technical support from the College of Biological and Agricultural Engineering in Jilin University, including the licensed software of EDEM2020.
Conflicts of Interest
The authors declare no conflict of interest.
Abbreviations
| HMCE | High-moisture corn ear |
| ANOVA | Analysis of variance |
| DEM | The Discrete Element Method |
| PB | Plackett–Burman test |
| B-B | Box–Behnken test |
| H-M | Hertz–Mindlin |
| SAT | Steepest ascent test |
| SPUA | SPUA |
References
- Wang, Y.; Li, L.; Gao, S.; Guo, Y.; Zhang, G.; Ming, B.; Xie, R.; Xue, J.; Hou, P.; Wang, K.; et al. Evaluation of grain breakage sensitivity of maize varieties mechanically-harvested by combine harvester. Int. J. Agric. Biol. Eng. 2020, 13, 8–16. [Google Scholar]
- Duan, J.; Cheng, F.; He, C.; Liu, Y.; Wang, Y.; Guo, X. Research status and development trend of medium and small silage maize harvesters. J. Chin. Agric. Mech. 2024, 45, 305–310. [Google Scholar]
- de Oliveira, M.H.; Costa, C.; Pariz, C.M.; de Limao Meirelles, P.R.; Andreotti, M.; de Castilhos, A.M.; de Souza, D.M.; Ulian, N.d.A. Yield and nutritive value of mechanically processed corn silage from an integrated crop-livestock system. Semin. Cienc. Agrár. 2021, 42, 845–859. [Google Scholar]
- Borreani, G.; Tabacco, E.; Schmidt, R.J.; Holmes, B.J.; Muck, R.E. Silage review: Factors affecting dry matter and quality losses in silages. J. Dairy Sci. 2018, 101, 3952–3979. [Google Scholar] [PubMed]
- Zhao, H.; Huang, Y.; Liu, Z.; Liu, W.; Zheng, Z. Applications of Discrete Element Method in the Research of Agricultural Machinery: A Review. Agriculture 2021, 11, 425. [Google Scholar] [CrossRef]
- Wang, S.; Yu, Z.; Zhang, W. Study on the modeling method of sunflower seed particles based on the discrete element method. Comput. Electron. Agric. 2022, 198, 107012. [Google Scholar]
- Zheng, J.; Wang, L.; Wang, X.; Shi, Y.; Yang, Z. Parameter Calibration of Cabbages (Brassica oleracea L.) Based on the Discrete Element Method. Agriculture 2023, 13, 555. [Google Scholar] [CrossRef]
- Jiang, Y.; Tang, Y.; Li, W.; Zeng, Y.; Li, X.; Liu, Y.; Zhang, H. Determination Method of Core Parameters for the Mechanical Classification Simulation of Thin-Skinned Walnuts. Agriculture 2023, 13, 104. [Google Scholar]
- Zhang, Z.; Zeng, C.; Xing, Z.; Xu, P.; Guo, Q.; Shi, R.; Wang, Y. Discrete element modeling and parameter calibration of safflower biomechanical properties. Int. J. Agric. Biol. Eng. 2024, 17, 37–46. [Google Scholar]
- Li, C.; Liu, Z.; Liu, M.; Xu, T.; Ji, C.; Qiao, D.; Wang, Y.; Jiang, L.; Wang, J.; Feng, W. Design and Testing of Key Components for a Multi-Stage Crushing Device for High-Moisture Corn Ears Based on the Discrete Element Method. Appl. Sci. 2024, 14, 9108. [Google Scholar] [CrossRef]
- Li, X.; Du, Y.; Liu, L.; Zhang, Y.; Guo, D. Parameter calibration of corncob based on DEM. Adv. Powder Technol. 2022, 33, 103699. [Google Scholar] [CrossRef]
- Zhang, M.J. Study on the Mechanical Properties of Corncob and Corn Kernel Carpopodium. Ph.D. Thesis, Jilin University, Jilin, China, 2018. [Google Scholar]
- Zou, Y. Research on Bionic Technology of Key Components for Chopping Based on Corn Cob Field Decomposition. Ph.D. Thesis, Jilin University, Jilin, China, 2023. [Google Scholar]
- Liu, W.; Su, Q.; Fang, M.; Zhang, J.; Zhang, W.; Yu, Z. Parameters Calibration of Discrete Element Model for Corn Straw Cutting Based on Hertz-Mindlin with Bonding. Appl. Sci. 2023, 13, 1156. [Google Scholar] [CrossRef]
- Wang, X.; Tian, H.; Xiao, Z.; Zhao, K.; Li, D.; Wang, D. Numerical Simulation and Experimental Study of Corn Straw Grinding Process Based on Computational Fluid Dynamics-Discrete Element Method. Agriculture 2024, 14, 325. [Google Scholar] [CrossRef]
- Su, Y.; Xu, Y.; Cui, T.; Gao, X.; Xia, G.; Li, Y.; Qiao, M. Determination and interpretation of bonded-particle model parameters for simulation of maize kernels. Biosyst. Eng. 2021, 210, 193–205. [Google Scholar] [CrossRef]
- Su, Y.; Xu, Y.; Cui, T.; Gao, X.; Xia, G.; Li, Y.; Qiao, M.; Fan, H. A combined experimental and DEM approach to optimize the centrifugal maize breakage tester. Powder Technol. 2022, 397, 117008. [Google Scholar] [CrossRef]
- Zhou, L.; Yu, J.; Liang, L.; Wang, Y.; Yu, Y.; Yan, D.; Sun, K.; Liang, P. DEM Parameter Calibration of Maize Seeds and the Effect of Rolling Friction. Processes 2021, 9, 914. [Google Scholar] [CrossRef]
- Zhou, L.; Yu, J.; Wang, Y.; Yan, D.; Yu, Y. A study on the modelling method of maize-seed particles based on the discrete element method. Powder Technol. 2020, 374, 353–376. [Google Scholar] [CrossRef]
- Ji, J.; Jin, T.; Li, Q.; Wu, Y.; Wang, X. Construction of Maize Threshing Model by DEM Simulation. Agriculture 2024, 14, 587. [Google Scholar] [CrossRef]
- Li, X.; Du, Y.; Liu, L.; Mao, E.; Wu, J.; Zhang, Y.; Guo, D. A rapid prototyping method for crop models using the discrete element method. Comput. Electron. Agric. 2022, 203, 107451. [Google Scholar] [CrossRef]
- Han, D.; Zhou, Y.; Nie, J.; Li, Q.; Chen, L.; Chen, Q.; Zhang, L. DEM model acquisition of the corn ear with bonded particle model and its simulated parameters calibration. Granular Matter 2024, 26, 1–17. [Google Scholar] [CrossRef]
- Zhu, X.; Chi, R.; Ma, Y. Effects of Corn Varieties and Moisture Content on Mechanical Properties of Corn. Agronomy 2023, 13, 545. [Google Scholar] [CrossRef]
- Li, H.; Zeng, R.; Niu, Z.; Zhang, J. A Calibration Method for Contact Parameters of Maize Kernels Based on the Discrete Element Method. Agriculture 2022, 12, 664. [Google Scholar] [CrossRef]
- Liu, Y.; Li, Y.; Zhang, T.; Huang, M. Effect of concentric and non-concentric threshing gaps on damage of rice straw during threshing for combine harvester. Biosyst. Eng. 2022, 219, 1–10. [Google Scholar]
- Tao, C.; Maosheng, J.; Dongxing, Z.; Li, Y.; Xiantao, H.; Zhendong, W. Construction of the discrete element model for maize ears and verification of threshing simulation. Trans. Chin. Soc. Agric. Eng 2023, 39, 33–46. [Google Scholar]
- Xu, T.; Gou, Y.; Huang, D.; Yu, J.; Li, C.; Wang, J. Modeling and Parameter Selection of the Corn Straw-Soil Composite Model Based on the DEM. Agriculture 2024, 14, 2075. [Google Scholar] [CrossRef]
- Zhang, T.; Zhao, M.; Liu, F.; Tian, H.; Wulan, T.; Yue, Y.; Li, D. A Discrete Element Method Model of Corn Stalk and Its Mechanical Characteristic Parameters. Bioresources 2020, 15, 9337–9350. [Google Scholar]
- Mu, X.; Li, H.; Wang, Z.; Wang, Q.; Geng, D.; Zhu, J. Comparison of Crushing Effect of Differently Shaped Crushing Rollers on Whole-Plant Silage Maize. Agriculture 2023, 13, 1276. [Google Scholar] [CrossRef]
- Chiaravalle, A.G.; Cotabarren, I.M.; Pina, J. DEM breakage calibration for single particle fracture of maize kernels under a particle replacement approach. Chem. Eng. Res. Des. 2023, 195, 151–165. [Google Scholar]
- Han, D.; Tang, C.; Li, W.; Xu, L.; Chen, L. Calibration of corn kernel simulation parameters during harvest and evaluation of its adaptability. Comput. Part. Mech. 2024, 1–7. [Google Scholar]
- Yu, Y.; Fu, H.; Yu, J. DEM-based simulation of the corn threshing process. Adv. Powder Technol. 2015, 26, 1400–1409. [Google Scholar]
- Zhendong, W.; Tao, C.; Dongxing, Z.; Li, Y.; Xiantao, H.; Zepeng, Z. Design and Experiment of Rasp Bar Threshing Element of Corn Combine Harvester. Trans. Chin. Soc. Agric. Mach. 2021, 52, 115–123. [Google Scholar]
- Mousaviraad, M.; Tekeste, M.Z. Systematic Calibration and Validation Approach for Discrete Element Method (DEM) Modeling of Corn Under Varying Moisture Contents (MC). J. Asabe 2024, 67, 259–274. [Google Scholar]
Disclaimer/Publisher’s Note: The statements, opinions and data contained in all publications are solely those of the individual author(s) and contributor(s) and not of MDPI and/or the editor(s). MDPI and/or the editor(s) disclaim responsibility for any injury to people or property resulting from any ideas, methods, instructions or products referred to in the content. |
© 2025 by the authors. Licensee MDPI, Basel, Switzerland. This article is an open access article distributed under the terms and conditions of the Creative Commons Attribution (CC BY) license (https://creativecommons.org/licenses/by/4.0/).