Abstract
Manure management costs are a substantial component of overall costs on a modern dairy farm. Due to the slim margins of contemporary milk production operations, dairies are under constant pressure to increase milking herd sizes to take advantage of size economies that enable them to compete in the global marketplace. This study provides a current assessment of manure management and overall costs and returns on four standard sizes of dairies typical of the southern Great Plains, particularly north central Texas. The study is necessitated by the fact that the changing economic landscape has resulted in substantial changes in manure management practices. This study also forms the basis for additional analyses that will explore alternative value-added options for dairy manure management. We utilize the Farm-level Economic Model to holistically simulate the costs and returns of four representative dairy herd sizes—small (300 cows), medium (720 cows), large (1500 cows), and very large (5000 cows). Based on prevailing assumptions about land areas farmed and farm management practices, we find that dairy farms require between 0.18 and 0.4 ha/cow to manage manure based on crop nitrogen uptake rates, versus 0.67 to 0.95 ha/cow for crop phosphorus uptake rates. Manure application costs alone range from USD 55/cow (USD 225/ha) to USD 115/cow (USD 300/ha) depending on dairy size, but some of these costs are offset by fertilizer cost savings. Proportion of manure hauled offsite ranges from 9% to 67% for phosphorus-based applications, depending on herd size, and net incomes per cow are reduced by USD 60 to USD 100 (USD 4.33 to USD 8.27 per Mg of milk) if manure is applied based on phosphorus uptake rates as compared to nitrogen uptake rates of receiving crops. Generating a broad array of economically viable value-added product options from dairy manure would enable farmers to be more competitive in a market characterized by thin margins.
1. Introduction
As in most livestock intensive regions across the U.S.A., dairies in north central Texas have come under considerable pressure relating to manure management. Over the past three decades, manure management has been a leading factor in the exodus of many dairies to the Texas Panhandle and New Mexico. Consequently, the primary concentration of dairy production in Texas has shifted from north central Texas to the Texas Panhandle, with Erath County now falling from the top producing county in Texas, a position it held until August 2011, to the number five spot as of October 2024 [1,2], behind Hartley, Moore, Castro, and Parmer Counties, all located within the Texas Panhandle.
A primary economic driver for the movement of dairies to the Texas Panhandle is the cost of manure management in response to various environmental pressures. Dairies are included in the definition of concentrated animal feeding operations (CAFOs) and thus fall under the National Pollutant Discharge Elimination System (NPDES) of regulations that are, in general, not applicable to farms. Under NPDES permitting requirements, dairies must contain wastewater and judiciously discharge it to waste application fields. While, for dairies, NPDES permits apply to operations with at least 700 mature cows, even smaller operations may be subject to some of these requirements depending on the specific circumstances of their operations. Dairies also must apply all liquid and solid manure to fields at the agronomic uptake rates of crops for nitrogen and phosphorus, depending on soil test nutrient levels. Under current rates of manure generation on farms, dairies in impacted watersheds generally require approximately 0.8 ha per dairy cow to spread manure nutrients at sustainable phosphorus agronomic uptake rates. Dairies with inadequate lands for manure nutrient utilization are thus required to plan with other landowners for appropriate application offsite.
Due to these requirements, manure handling can be very expensive, as many studies indicate [3,4]. Given the small profit margins of dairies, it is very important to ascertain the costs of manure handling to determine the implications of alternative options for manure utilization or disposal. This is the primary rationale for the present study.
Another rationale for characterizing manure management costs has to do with the changing profile of manure handling practices over the past three decades [5]. In north central Texas, manure management practices have evolved substantially over the past decade. Contrary to the common practice of 10 to 15 years ago, many dairies now practice daily hauling and spreading with vacuum-fitted trucks (“honey wagons”). Instead of scraping and stockpiling manure, it is instead vacuumed, hauled, and applied directly to fields without storage [5]. This practice by many dairies in north central Texas means that storage structures are not needed as much for manure slurry and/or solids, and nutrient losses during storage and handling are also lower than in previous years. Furthermore, the risks associated with open lot runoff are minimized, a direct benefit of this practice is that producers can conserve manure nutrients, thus achieving fertilizer cost savings.
This study is based upon decades of agro-environmental assessments relating to dairies. In previous studies, watershed and large regional assessments were performed to inform policy and practice development for enhancing the economic and environmental sustainability of dairy, livestock, and crop operations, particularly in livestock intensive watersheds [6,7]. These assessments were part of federally funded projects initially focused on livestock and the environment and subsequently involving a broad range of conservation practice assessments in the U.S. and Canada. Outputs of these efforts included state-of-the-art biophysical and economic models that are critical components of the current analyses. As part of the broader effort, the Agricultural Policy Environmental eXtender (APEX) [8,9,10] was developed as an augmentation of the Erosion Productivity Impact Calculator (EPIC) [11]. APEX plays a key role in rigorous field-scale simulations. The Soil and Water Assessment Tool (SWAT) [12] is used primarily in these assessments as a watershed and large basin simulator. The Farm-level Economic Model [13] functions as a farm-level economic simulator for representative farms. All these models have been calibrated and validated through a broad spectrum of applications in North America, and APEX and SWAT have also been applied in virtually every continent. This study uses only FEM, since the focus is on economic assessments.
For this study, we also leverage recent collaborations on additional federally funded projects relating to biochar and the profitability of small- and medium-sized beef grazing and dairy operations [14,15,16]. Data assembled during recent studies highlighted the benefits of generating value-added manure byproducts such as biochar as alternative options for livestock and dairy producers [15,17]. This study focuses solely on conventional manure management. Subsequent studies will highlight the economics of utilizing manure for generating biosolids, energy (including biogas), and other value-added products.
The overarching goal of this study is to characterize manure handling costs to more effectively assess the costs and economic viability of alternative manure management practices with potential economic implications for dairy producers.
2. Background and Literature Review
Environmental challenges leading to the notable exodus of dairies from north central Texas relate to manure management, most notably the tendency for soil phosphorus levels to increase over time when manure is applied at higher rates than required for crop phosphorus uptake. Studies relating elevated soil phosphorus levels to eutrophication in downstream waters during the 1990s [18,19,20,21,22,23,24] illustrate the rationale behind pressures from the City of Waco, which blamed eutrophication of some downstream lakes in central Texas on the dairies upstream in the upper North Bosque River watershed, particularly the surface runoff of phosphorus from manure application fields. While scientific studies support the notion that point sources are also to blame for downstream eutrophication [25,26], some existing and most newer dairies found it easier to migrate northward to the Panhandle due to the prevailing pressures from downstream municipalities.
More recently, there has been an increased interest in nutrient circularity to promote long-term sustainability of food production [27]. There is heightened interest in regenerative agriculture and carbon farming methods [28]. While these trends are largely based on the need to address environmental sustainability, they afford increased soil health, which also provides long-term economic benefits to landowners.
Recently, manure utilization on dairies favors the use of manure as a nutrient source to minimize expenditure on purchased fertilizer nutrients. Owing to this economic incentive, many dairies have acquired more land and now use vacuum-fitted trucks to remove manure from lots and land for direct application on expanded cropping acreages. The expanded crop acreage also generates more forage to reduce expenditures on purchased feed, the largest component of costs on any dairy. This results in less manure nutrient loss but also increases some manure handling costs due to daily hauling and spreading operations [5].
Owing to these changes, there is a need to reassess the economics of manure management on dairies based on current practices to better determine the cost-effectiveness of alternative manure management options. As there are no readily available studies addressing this issue, the present study seeks to bridge the gap in literature with a comprehensive economic assessment of manure management on dairies in north central Texas. The implications and results obtained from this study would readily apply to dairies in the Panhandle of Texas, Oklahoma, and New Mexico. Since this study accounts for four size groups, the results relating to the larger size groups are also applicable to large dairies in other states, especially in California and New Mexico.
Much of the initial work on dairy manure management by this research team was part of a USEPA-funded National Pilot Project (NPP) on Livestock and the Environment [29]. Economic assessments of dairy manure management were a core component of multi-project, multi-disciplinary, and multi-institutional NPPs that were initiated in 1992 and lasted over 10 years. Dairy nutrient management scenarios were initially evaluated for open lot and free-stall dairies in north central Texas [30,31] and subsequently for smaller pasture-based dairies in northeast Texas [32]. Additional assessments in northeastern Iowa included dairy as well as other livestock operations and mixed crop-livestock systems [7].
To support the multidisciplinary assessments, in-stream and edge-of-field monitoring stations were established throughout the Bosque River watershed (BRW) (Figure 1) to provide monitoring data for biophysical model calibration and validation efforts. The upper portion of the BRW is the drainage area for a major portion of the dairy manure application fields in north central Texas. Economic assessments indicated that composting of dairy manure for end uses outside the watershed would provide the most environmentally beneficial results but would also entail substantial cost implications to the dairy producers [31]. Manure application at total crop agronomic phosphorus rates, particularly with incorporation, where practical, would yield substantial but smaller water quality benefits, and entail much less cost than composting. Economic and environmental impacts were also determined for manure application at total crop agronomic nitrogen rates, plant-available agronomic crop nitrogen, and phosphorus rates, as well as manure solids separation management [6,31].
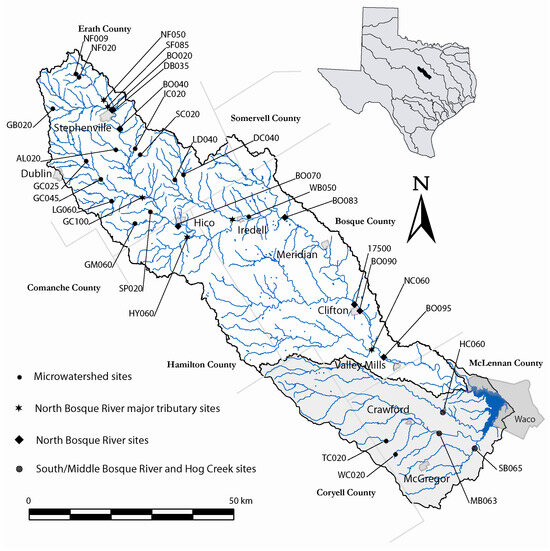
Figure 1.
The Bosque River watershed in Texas, showing locations of historical monitoring sites.
This study also builds upon the work of many other researchers who have assessed the costs and environmental implications of manure utilization on livestock production systems or mixed crop-livestock operations [33,34,35,36,37]. The holistic approach used in this study will contribute robust data on the economics of manure production, management, and utilization on contemporary dairy operations.
3. Materials and Methods
For this study, we leveraged decades of computer model development and application assets as well as extant data assembled to characterize the economics of conventional dairy manure management in north central Texas. A brief description of the modeling system follows, as well as the pertinent data utilized, prior to presentation of the results.
3.1. Modeling System
Farm-level economic simulations were performed with the Farm Economic Model (FEM) [13] Version 2.1. FEM is a whole-farm annual economic model that simulates the economic impacts of a wide range of scenarios on farm enterprises based on applicable behavioral practices. The model was developed primarily for environmental policy assessment as part of a National Pilot Project on Livestock and the Environment (NPP) [13,29], but is now widely applicable to a much broader range of agricultural policy assessments [38,39]. Both farm-level and watershed-scale impacts have been assessed. Recently, FEM was also integrated within a macro-modeling system that evaluates the economic and environmental impacts of agro-ecological practices across large geographic regions [6].
There are other well-known economic models, such as FARMSIM, CAPRI, and IFSM, that are used for agricultural economic assessments. For instance, FARMSIM [40] is a stochastic simulator, an enhanced version of FLIPSIM [41]. CAPRI [42] is a partial equilibrium model that is employed at a regional scale of analyses. IFSM [43] is a farm-level simulator that integrates biophysical and economic modules to estimate costs and returns of alternative policies or practices. Among these known models, IFSM comes closest to the types of simulations necessary for farm-scale economic assessments of the types addressed in this study. However, none of these or other models provide the rigorous simulation of crop production, manure management, and integrated dairy nutrition that FEM offers. The lack of rigorous environmental simulations in the other models is the reason why FEM was developed and is used for these types of analyses.
FEM simulates entire farms. Key components within the model include cropping systems and operations; livestock husbandry and nutrition; manure and waste management; equipment and machinery; types, sizes, and uses of land areas; structures and facilities; and exogenous factors. The cropping systems section of the model includes all aspects of crop management, including field operations, input purchases, and grain and other product sales. The livestock systems section includes all livestock operations, nutrition, manure production characteristics, and livestock herd management. Special modules in FEM account for manure handling and storage, manure application on land, and other manure use or disposal options. All equipment, facilities, and structures on the farm are accounted for in special modules that are designed to handle equipment purchase decisions and financing terms. Exogenous factors such as biophysical characteristics of the farm and government policy variables are also accounted for in the model.
Several FORTRAN routines within FEM estimate the costs and returns of a farm based on livestock and crop operation schedules; ownership and the characteristics of structures, facilities, and equipment; financing terms; land areas and uses; livestock nutrition; manure production and handling; as well as other pertinent aspects of each farm enterprise. Optimizations required within the model are handled within a General Algebraic Modeling System (GAMS, Version 21.2) [44] submodule that is linked to special model routines for transfer of relevant decision and exogenous variables. The following discussion includes components of the model that are directly related to the evaluation of the manure management practices presented in this paper. A brief schematic of FEM is provided in Figure 2.
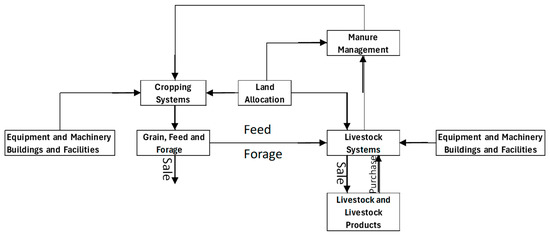
Figure 2.
Schematic of FEM.
To estimate the economic implications of manure management practices, almost every component of FEM is utilized. Manure production provides nutrients that offset inorganic fertilizer expenses. Manure nutrients count toward a limit on the rate of nutrient application on fields receiving manure. All components of manure management also entail costs, especially manure application on land and hauling offsite. Thus, the revenue and cost components of relevance are livestock and grain sales and purchases; machinery repair and maintenance; fuel and lubrication; machinery ownership expenses (interest and depreciation); cost of hired and owner/operator labor; custom operation costs; and pesticide costs.
FEM permits very flexible specification of the field operations performed for a cropping system. Individual field operations can be specified for each crop in the rotation, each unique year of the rotation pattern, and each field that is unique in terms of crop management. For each operation, very flexible and detailed specifications can be provided. Field operation information includes the date of the operation, proportion of the field covered, frequency of the operation within the specified year, an indicator variable specifying whether the operation is custom hired or performed by the owner/operator, and an indicator specifying the types of fields the operation applies to. It also includes a list of input specifications detailing the machinery used for that operation, custom rates, seeding rates, herbicide use, and other crop input parameters. Furthermore, multiple implements can be specified for any field operation. The horsepower rating of the power implement determines hourly fuel and lubrication costs, while the speed, width, and field efficiency of the implement determine how many hours are required for the operation.
The cost of a field operation is determined primarily by the hours required to complete that field operation. The hours required to complete a field operation on a hectare of land using a specific implement are given by
where is the hours required per unit area of land, is the width of the implement in meters, is the field travel speed of the implement in km/hour, is the implement field efficiency, and is a unit conversion constant equal to 10. In an operation involving multiple implements with different field travel speeds, widths, or field efficiencies, the hours per hectare of the operation are computed as the hours required for the slowest implement, i.e., the implement that covers the least amount of area per unit of time.
Once the hours of use are determined for a machine, its repair and maintenance and fuel and lubrication expenses are based on the agricultural machinery management specifications in ASAE EP496.1 [45,46] and ASAE D497.1 [47,48]. Specifically, repair and maintenance expenses for machinery used in operation in a given year are given by (2), which is derived from the ASAE formula for cumulative repair and maintenance:
where is the repair and maintenance expense for machinery used in field operation in year ,
is the number of hours machinery was used in field operations in year ,
is the number of hours machinery was used in all field operations in year ,
and are ASAE repair and maintenance factors,
is the purchase price of machinery , and
are the cumulative hours of use of machinery through the end of year .
Fuel expenses are also computed in the model as a function of hours of use of each implement and various machinery coefficients [45,46,47,48]. Fuel cost per hour is given as
where is the fuel cost per hour of use, is a unit conversion coefficient equal to 0.23 for gasoline engines and 0.17 for diesel powered engines, is the horsepower rating for the power implement, and is the fuel price per liter. Fuel cost per hectare is obtained by dividing by the hectares covered per hour. Fuel cost per year is obtained by multiplying by the hours of implement use throughout the entire year. Oil and other lubrication expenses are expressed as a fixed ratio of fuel expenses based on the applicable ASAE Standards [45,46,47,48], which is typically 15% of fuel expenses.
Machinery ownership expenses are also computed in FEM and are partly dependent on use, since the expected economic life of each machine is typically expressed in hours. Hours of machinery use are used to compute the expected economic life in years within the model. Machinery depreciation expenses are inversely proportional to expected economic life. Interest and principal payments, on the other hand, are given as functions of exogenous borrowing terms.
Costs of baling and hauling bales are functions of hay yields. This study utilized hauling costs reported in the Texas AgriLife crop and livestock enterprise budgets for 2024 [49]. Mowing, raking, and baling costs, on the other hand, were simulated within the model. For bermudagrass harvesting, the costs were determined based upon the machinery equations specified above. On the other hand, for corn silage harvesting, it was assumed that the producers would utilize custom harvesters since that is more cost-effective for the representative production area simulated, as compared to if the farmer had purchased the forage harvesting equipment required and incurred the associated overhead, operating, and maintenance expenses.
FEM also includes a livestock nutrition module that calculates the amounts of various feedstuffs used in livestock rations in conformity with general practice on livestock operations. The nutrition component of FEM mimics the constrained optimization behavior of producers to account for the cost of the ration, purchase of feeds, and use and sale of raised feed. Because feed costs typically account for about half of operating costs on dairy operations either directly or indirectly, model calibration efforts focus heavily on this component.
The specifications and coefficients used in this component rely heavily on information contained in National Research Council (NRC) publications on dairy cattle nutrition [50]. Details of the nutrition component involve the three main feed and nutrient specifications mentioned above ((a) livestock nutrient requirements and bounds, (b) livestock feed ingredient restrictions, and (c) livestock feed group restrictions) as well as data on feed nutrient contents.
Formulas for estimating nutrient requirements of livestock species as well as tabulated values are provided in the NRC [50]. Nutrient characteristics of feed ingredients are also provided in NRC [50] as well as other sources [51]. The model calculates nutrient requirements based on the inventory of the various types of livestock species in the herd, as well as the quantities of livestock products generated. For dairy cattle in lactation, nutrient requirements are a function of milk production levels, and to a lesser degree, maintenance and body weight gain. For other livestock on dairy operations, nutrient requirements are primarily a function of body weight gain and to a lesser degree, other livestock byproducts.
For this study, we assumed the same milk yield—11,940 kg/ (cow year)—for all the representative farms simulated. This milk yield is based on USDA NASS Quick Stats data for Texas for 2024 [52]. Given this assumed milk yield, the nutrient requirements and upper bounds for lactating cows for each representative farm are summarized in Table 1 for key nutrients. The numbers presented here are expressed on a total requirement basis rather than as a fraction of total dry matter intake.

Table 1.
Nutrient requirements and upper bounds for lactating cows.
Similarly, requirements and bounds were specified for calves, heifers, steers, and dry cows in the herd. The following constraints were also imposed upon the ration.
- Minimum and upper bounds on amounts or proportions of the ration that is composed of each specific ingredient.
- Minimum and upper bounds on proportions of the ration that are composed of each specific feed category (i.e., forage, grain, supplement).
Given the above requirements, bounds, and constraints, the rations for lactating cows and other livestock on each representative farm were determined by solving the following feed cost minimization problem:
where is the total cost of purchased feed for the dairy herd, is the price of feed ingredient , is the quantity of feed ingredient fed to the entire herd, is the amount of ingredient fed to livestock , is livestock ’s requirement for nutrient , is the concentration of nutrient in feed ingredient , is the maximum amount of nutrient that can be fed to livestock , and is the maximum amount of feed ingredient that can be fed to livestock . Prevailing prices of selected feed ingredients are displayed in Table 2.
Table 2.
Prices of selected feed ingredients used in dairy rations.
During simulations, the model computes a feed ration for each livestock species on the farm. This is a cost-minimizing bundle of feeds that supplies all the nutrients required for each species, subject to various other restrictions as specified above. Feed ration optimizations are performed by using an automated linear programming routine written in the General Algebraic Modeling System (GAMS) [44] format.
FEM also includes routines for calculating manure handling costs based upon the steps involved in collection, handling, and ultimate disposing of manure. To capture these costs, the model computes the cumulative impacts of each manure handling step on all manure characteristics. Specifically, the level of manure characteristic after the th handling step is given as:
where is the content of manure nutrient or characteristic after handling in Mg, is the content of manure nutrient or characteristic before handling also in Mg, and is the percentage impact of the th handling option on the content of manure nutrient or characteristic .
Given the crops or forages specified for various fields, manure application rates and required areas are estimated based on detailed options specified for manure utilization or disposal. An elaborate acreage calculation routine is utilized in FEM to ensure that adequate acreage is allocated for manure utilization. If manure application is pegged to crop agronomic rates, the rates simulated are based on relevant crop agronomic requirements, and acreage allocations are determined accordingly. If manure application rates are set to some arbitrarily specified levels, then those rates are maintained, and the acreage required for disposal is calculated appropriately. Acreage calculated for manure applications prioritize liquid manure applications before solid manure or slurries. This largely innocuous assumption is because liquid manure is more voluminous, and thus largely impracticable for hauling or piping across long distances. Once nearby, adequate acreage has been allocated to liquid manure, solid manure acreage requirements are determined, and any remaining land areas not receiving manure would be utilized based on the default land use of the operation. If acreage on the farm is inadequate for solid manure application, a manure hauling operation is simulated to reflect the practice of hauling the remaining manure offsite.
3.2. Study Area and Data Sources
The Cross Timbers region in north central Texas, including primarily Erath and Comanche counties, has been a prominent dairy production region for almost 40 years. Dairies were initially dry lot operations but are now predominantly larger freestall production systems. The land used in the region is mostly a mix of improved and native pasture, but most dairies also raise corn silage to supplement feed rations to reduce costs. In the present study, we assume a mix of improved pasture, coastal bermudagrass hay, and corn silage on each dairy. The improved pasture was also assumed to be a coastal bermudagrass pasture. The implication of alternatively simulating unimproved pasture on some of these fields is that larger land areas would be needed for manure application.
Field operations simulated for coastal bermudagrass fields are presented in Table 3, including forage harvesting that applies to hay fields but not to grazed pastures. The economic assessments were based upon a yield of 10.1 Mg/ha for hay fields and 5.6 Mg/ha for grazed improved pastures, which are reflective of prevailing yields in north central Texas. Corn silage yields were assumed to average 45.2 Mg/ha/year, mostly for irrigated fields. These yields were all based on prevailing yield values in the area and are similar to values used in Texas crop enterprise budgets [49]. In simulations, we distinguish fields receiving manure from those receiving only inorganic fertilizers. Bermudagrass hay fields are harvested three times a year, with each harvest cycle including separate and sequential mowing, raking, baling, and hauling operations. We assume that dairy producers perform all bermudagrass operations rather than utilizing custom operators. Equipment used in these operations are presented in the discussion below of representative farms.
Table 3.
Operations simulated for coastal bermudagrass fields.
A similar list of field operations simulated is provided in Table 4 for corn silage. It was assumed that corn silage harvest operations would be performed by a custom operator. Target yield for corn silage was assumed to be 45.2 Mg/ha, which reflects current average achievable yields in north central Texas. All other corn silage operations were assumed to be performed by the dairy producer. The table also indicates operations performed on fields receiving manure versus those applicable to fields not receiving manure.
Table 4.
Operations simulated for corn silage fields.
Acreage receiving manure is calculated based on manure nutrient content at the time of land application as compared to the agronomic nutrient requirement of receiving crops or forages. This is discussed in detail later in Section 3.4 after the presentation of the representative farms since the specifics depend upon land area, livestock inventory, and other farm-specific attributes.
3.3. Representative Farms for Economic Simulations
Representative farms were defined to represent the diversity of dairy operations in the north central Texas area. These operations were defined based upon total dairy herd size (including lactating and dry cows) as small (300 cows), medium (720 cows), large (1500 cows), and very large (5000 cows). Key features of these representative farms, including herd inventories and land area farmed are indicated in Table 5. Other important features, including key machinery for manure management, are also presented below.
Table 5.
Key features of representative dairy operations in north central Texas.
As implied by the data presented in Table 5, we assumed a constant proportion of each of seven age categories of dairy cows and steers as a fraction of total herd size. The seven dairy herd categories are presented in order of age from up to one-week-old calves to mature lactating and dairy cows. Notably absent from this are mature bulls as we assumed artificial insemination on all representative dairy operations in the study region.
Milk yields are assumed to be the same across the four representative farms—11,940 kg/(cow year), based on current USDA-NASS data. Total land in farms is based on published data accessed from USDA’s QuickStats [53] that presented statewide dairy herd size ranges and corresponding land areas farmed, enabling us to deduce an estimate of average cows per hectare for various size categories. However, the numbers in the table do not necessarily align completely with the estimates from USDA since data for the larger size categories were not readily separable from some of the smaller size groups. The fractional distribution of land in farms between bermudagrass and corn silage was based on prevailing land use practices in the area.
All representative farms were assumed to handle manure in the same manner. However, equipment differed between the four representative farm sizes due to the need to handle different volumes of manure, livestock numbers, and land areas. Table 6 provides the main set of equipment on each representative farm.
Table 6.
Characteristics of field machines after FEM calibration *.
All parameters indicated in the table are pertinent for cost calculations performed in FEM, as presented in Section 3.1. Hours refers to the total economic life in hours that the equipment is expected to have when purchased new. Width refers to the operating width of the implement, and speed indicates the field travel speed of the implement. Field Efficiency indicates the field efficiency of the implement represented as a percentage, while horsepower indicates the horsepower rating of the power equipment. Finally, RF1 and RF2 are repair factors as described in Section 3.1. Field efficiency, RF1, and RF2 were obtained from ASABE [47], Plastina [54], and Latz et al. [55]. The price information was obtained from equipment dealers in the north central Texas region, particularly Stephenville, Texas, and pertains to the early 2025 period. A number of these parameters were adjusted during FEM calibrations to ensure that the model estimated costs were consistent with reality. The parameters presented in Table 6 reflect the adjustments made during calibration efforts.
Not all equipment listed in Table 6 was simulated for all farms. It was assumed, for instance, that small and medium representative farms utilized the small liquid manure spreader, while large and very large operations used the large liquid manure spreader. However, the same equipment complements were assumed for other field operations.
Similar assumptions were made for the buildings, facilities, and structures on each representative dairy operation. Freestall barns, milking parlors, feed lanes, and other structures on a typical dairy farm in north central Texas, were sized based upon space requirements for dairies of the respective sizes (Table 7). Initial capital outlays were based on the University of Wisconsin Extension [56] with adjustments for 2024 costs for Texas dairy facilities.
Table 7.
Initial capital outlay for main facilities on representative dairies.
3.4. Current Manure Handling Practices
Manure handling practices on dairies in Texas have changed considerably over the past decade. Most dairies in north central Texas and other parts of the conterminous U.S. continue to handle manure in separate slurry and liquid waste fractions as has been the case for many decades. However, the manner and frequency of solid manure handling have changed substantially. Liquid waste is generated when dairies clean their milking parlors, about three times a day on average. The liquid waste is directed to runoff containment structures and gutters and berms are used to direct rainwater away from dairy manure. Dairies also recycle wastewater to minimize water use and ensure adequate capacity in runoff containment structures in the event of unanticipated storms. Liquid waste is ultimately captured in a lagoon, from which it is applied on liquid waste application fields.
The major change in dairy manure management is that dairies use vacuum-fitted trucks—also known as honey wagons—to collect solid manure and land apply it without storage or additional treatment. Due to the frequency of manure collection—once or twice daily—the manure collected by the vacuum-fitted trucks has a slurry constitution. The slurry fraction of manure generated on dairies is fresh manure deposited by the cows in the milking parlor, freestall, drip shed, and other confinement areas where the cows are housed. Because most dairies use a vacuum-fitted truck or honey wagon to collect manure and directly land apply it on predetermined fields, very little manure solids are left in the confinement areas to be cleaned out by flushing. Consequently, the slurry fraction of manure is the predominant component, implying that dairies could do with smaller waste containment structures as compared to previous situations. Frequent vacuum and direct application operations also mean that very little nitrogen is lost to volatilization during collection and storage. We estimate that about 5% of slurry manure nitrogen is lost prior to land application, as compared to 30 to 50% in previous settings [31,57]. We also estimate that roughly 95% of total manure generated on dairies is in the solid (slurry) fraction, as compared to 5% in the liquid waste fraction based on prevailing practices.
As part of permitting requirements, dairies in north central Texas apply manure on designated fields in accordance with the USDA-NRCS field office technical guide for Nutrient Management (FOTG 590) [58]. Manure slurry vacuumed from lots is applied on designated fields at rates that do not result in phosphorus buildup in the soils. To accomplish this process, manure application rates are calculated based upon soil test nutrient levels. Fields with low soil phosphorus levels can receive manure at the nitrogen agronomic rate of receiving crops. On the other hand, fields with high soil phosphorus levels receive manure at the phosphorus removal rate of receiving crops or forage. Manure applications at the phosphorus removal rate supply nitrogen at levels that are inadequate for crop growth [59]. Consequently, supplemental inorganic fertilizer nitrogen applications are made whenever manure applications are based on the phosphorus removal rate. For the present study, rather than determining which soil nutrient levels are applicable to each representative farm, we simulate manure application at both nitrogen and phosphorus removal rates and contrast their economic implications.
While a much smaller portion of manure nitrogen is lost through volatilization during manure handling, a substantial component of manure nitrogen is still considered to be plant unavailable during the first year after it is excreted by the cows. We assume here, as in previous studies [57], that 50% of manure nitrogen is plant unavailable within the first year after excretion. On the contrary, we assume that only 25% of manure phosphorus is plant unavailable within the first year of excretion. Besides the plant unavailable component, which eventually becomes available for plant uptake, we also assume that 15% of manure nitrogen is lost to volatilization during land application. We assume, however, that no manure phosphorus losses occur during land application.
Handling and application losses, as well as plant unavailable components of manure, are considered when calculating supplemental nitrogen applications. It is again worthy of note that manure handling losses utilized here are lower than in previous studies [6], due to daily hauling and spreading applications. Prices of major fertilizers are provided in Table 8.
Table 8.
Prices of selected fertilizers.
Land areas for manure applications were allocated using the elaborate acreage allocation routines within FEM, as described in Section 3.1. Acreages were allocated first for liquid manure applications because it is more practicable for dairy operators to haul off solid manure or slurries than to haul off large volumes of liquid manure. Once an adequate land area had been allocated for liquid manure, land was then allocated for solid manure applications.
3.5. FEM Validation
The economic model has been calibrated and validated for this study area in previous studies [6,7,31]. For the present study, we updated the model calibrations due to vastly different market conditions. FEM input parameters were adjusted within limits of acceptable economic and engineering coefficients, and equipment engineering coefficients were also adjusted accordingly. As stated previously, the original field machinery characteristics were obtained from [46,54,55], which were then adjusted during the calibration process. The resulting equipment prices and input coefficients relevant for this study are shown in Table 6, which are the input coefficients used in the FEM simulations.
During calibration, the performance of FEM was gauged using several goodness-of-fit metrics, chiefly the R2 statistic. The model was deemed adequately calibrated once total per hectare cost of each field operation was reasonably close to reported custom rate data [59,61]. For the most part, costs generated by the calibrated FEM were within 2% of the reported custom rate average for the respective operations in the north central Texas area. A comparison of the FEM simulated costs of field operations and the corresponding average custom rates are shown in Table 9.
Table 9.
Costs of simulated field operations and corresponding custom rates: USD/hectare.
3.6. Simulation Procedure
All four representative farms were simulated in FEM under both the nitrogen and the phosphorus manure application rates. As described in Section 3.1, an elaborate acreage allocation routine first allocated land to liquid manure and then to solid manure application based upon the agronomic uptake rates specified for each crop or forage. Any remaining land that did not receive manure received inorganic fertilizer at agronomic rates. If the land on the farm was inadequate for manure applications, the remaining portion of manure was hauled offsite for application at the prescribed rate. Each simulation produced various economic indicators, which are presented and described below.
4. Results and Discussion
To provide a comprehensive assessment of the economics of conventional manure management on dairies in north central Texas, we provide an overview of farm economics, including sections dealing with manure management costs, acreage required for judicious land application of manure, fertilizer cost savings from manure applications, portion of manure hauled offsite, feed ration costs, and net farm income. Each section outlines corresponding farm-level costs and other relevant indicators.
4.1. Manure Management Costs
Manure management costs are a sum of the costs incurred for both liquid and solid manure (slurry) collection, handling, hauling, and application for each representative farm. For slurry, the costs entailed include costs associated with collection using a vacuum-fitted truck, hauling, and application on designated fields. For liquid manure, the costs incurred relate to flushing or washing, transfer to a lagoon, and dewatering on to designated fields using a big gun sprinkler or pivot system. These costs are presented here by component and in total. Additional economic indicators presented below offset some of these manure management costs.
4.2. Land Areas Required for Manure Management
As alluded to above, the land area required for manure application depends upon the nutrient content of the manure at the time of land application, the nutrient content of the soils on which they are being applied, as well as the nutrient uptake rate of the receiving crop. The target yield of bermudagrass hay (10.1 Mg/ha) implies agronomic nutrient requirements for nitrogen, phosphorus, and potassium equivalent to 252 kg/ha, 33 kg/ha, and 176 kg/ha, respectively. Given the nutrient contents of fresh manure, and (primarily nitrogen) losses during handling, the land areas required for liquid and manure utilization on bermudagrass hay fields are provided in Table 10 for each representative farm. Similar computations are presented for pasturegrass (bermudagrass pastures) with a target yield of 5.6 Mg/ha and corn silage fields with a target yield of 45.2 Mg/ha on a wet weight basis. The land area required increases from the N rate to the P rate by about 366% for bermudagrass, 143% for pasturegrass, and 191% for corn silage. The land areas required per cow are higher for nitrogen-based manure application rates than in the situation where manure is stockpiled due to lower losses than indicated in Flowers et al. [57]) and Osei et al. [6].
Table 10.
Land area required for appropriate application of manure (hectares).
4.3. Manure Application Costs
Manure application costs are presented in Table 11 on a per unit area and per cow basis. These entail the costs incurred during hauling and spreading on fields operated by the dairy producer. They do not include costs incurred during milking parlor cleaning operations or costs associated with liquid waste storage in lagoons and dewatering. They also do not include costs relating to hauling manure offsite. These other costs are included in total manure handling costs, presented in Section 4.6.
Table 11.
Annual manure application costs.
Manure application costs are a function of the land area covered in spreading manure. We assume the same distance of 2.4 km to haul the manure from the freestalls and parlors to the fields. We also assume the same manure vacuuming operations regardless of the rate at which manure is applied. These costs also assume a manure spreader capacity of 18.9 cubic meters. The costs per unit area are lower with the P rate because the manure is spread over a greater land area, and thus, overhead costs are divided over a larger land area. However, per cow costs are higher in most cases, as expected, because total application costs are higher since more time is spent spreading manure. The only exception is the very large dairy, which has inadequate land area for manure utilization onsite under both the nitrogen-based and phosphorus-based application rates. Manure application costs are essentially about USD 300/ha for small operations and reduce to about USD 225/ha for very large operations. The manure application costs for small operations are in line with what Bentley et al. [4] obtained for northeast Iowa, where the dairy sizes were comparable to the small-sized dairies in the pesent study. In particular, manure application costs per cow for the P-based rate on the small dairies in north central Texas are within 2% of the USD 185.63/cow reported in Bentley et al. [4]. The relative manure application costs between nitrogen- and phosphorus-based rates are also supported by Ribaudo et al. [3] and many other studies including Osei et al. [3,31].
4.4. Fertilizer Cost Savings from Manure Applications
Fertilizer cost savings were calculated based on the nutrient contribution of manure as compared to identical fields where only inorganic fertilizer was applied. Annual fertilizer cost savings are indicated in Table 12 for each representative dairy operation and for the two agronomic rate scenarios. The data presented in the table indicate that dairies save substantially when manure is utilized on crop or forage fields or pastures for its nutrient content. All dairy operations save more in fertilizer expenses from a nitrogen-based application rate than a phosphorus-based rate simply because they have to haul off a substantial amount of their manure nutrients under the phosphorus-based rate. The amount of fertilizer cost savings reduces as they are required to haul of greater portions of manure. The last few rows in the table represent the fertilizer cost savings expressed as USD/ha farmed. Since the larger dairies farm a greater land area but smaller in terms of hectares per cow, these cost savings amount to a higher value per hectare farmed, though somewhat smaller when expressed on a per cow basis.
Table 12.
Fertilizer cost savings from manure applications per farm, per cow, and per hectare.
In short, the fertilizer cost savings presented in Table 12 are largely a function of the land area available for manure application on each operation. Until all manure is utilized, operations with larger land areas per cow stand to benefit more than those with smaller land areas. Note, in comparison, that Bentley et al. [4] obtained nutrient values for liquid and solid manure of approximately USD 128.60/(cow year) and USD 73.42/(cow year). The fertilizer cost savings reported here for the P rate scenario are lower simply because much of the manure is hauled offsite for the benefit of other landowners, and are thus not counted as cost savings for the dairy producer. This observation, that the adequacy of the land for manure application plays a key role in the economics of manure management, is widely supported by many previous studies [3,6,31,62].
4.5. Manure Hauling Costs
Proportions of manure hauled offsite are presented for all four representative farms and for both nitrogen- and phosphorus-based manure application rates (Table 13). As indicated previously, the phosphorus-based application rate requires more land for manure application on premise. In other words, more manure is utilized on the dairy premise if the application rate is higher (as with the nitrogen-based rate) than if it is lower (as with the phosphorus-based rate).
Table 13.
Proportion of manure hauled off the dairy and associated hauling cost.
Under the nitrogen-based application rate, only the very large dairy would have to haul off manure—roughly 7% of all manure produced on the farm. The smaller dairy sizes have adequate land areas to apply manure generated on their farms at the nitrogen-based rate. The corresponding annual hauling cost for the very large dairy amounts to approximately USD 16,418, the cost they would incur when they haul off 7% of their manure.
Under the phosphorus-based application rate, all farm sizes would need to haul off some portion of their manure to other land owners for appropriate disposal. The small dairy would need to haul off 9% of their manure, 54% for the medium-sized dairy, 50% for the large dairy, and 67% for the very large dairy. Corresponding annual hauling costs under the phosphorus scenario are also indicated in the table, ranging from roughly USD 1440/year for the small dairy to over USD 155,000/year for the very large dairy. Annual hauling costs expressed in USD/cow are also indicated in the table. For the phosphorus-based manure application rate, these costs range from about USD 4.80/cow for the small dairy to over USD 31/cow for the very large dairy.
Manure hauling costs represented here assume a hauling distance of 8 km to the designated land where manure can be applied. The costs would be proportionately greater if the distance were longer, and less if the distance were shorter. Manure hauling costs are directly in proportion to the total mass of manure. Manure hauled off the dairies would have a moisture content that is well over 50%. Thus, technologies that remove moisture from manure would reduce hauling costs, and would entail an overall net benefit if they are cost-effective to operate at the appropriate scale/size of the operation.
4.6. Total Manure Handling Costs
Total manure handling costs—including all costs related to manure collection, storage, handling, and application—are displayed in Table 14. These costs are once again presented for N-based and P-based application rates as the amount of manure applied onsite differs depending on the application rate, as does the portion hauled offsite. These costs also do not account for the fertilizer cost savings that are presented in Table 12. The data in the table suggests substantial costs of manure handling, that decline on a per cow basis for larger dairies. It also indicates clearly that manure nutrient management at the phosphorus-based rate leads to a substantially greater cost for all dairy size groups. This is partly because the manure is spread over larger land areas, and with a greater portion hauled offsite, and farmers do not benefit from all the nutrient content of their manure.
Table 14.
Total manure handling costs (USD cow−1 year−1).
The costs presented in Table 14 are also somewhat in line with Bentley et al. [4] and Howland and Karszes [63]. The notable difference between the present study and Bentley et al. [4] is that dairy farmers in north central Texas no longer incur sizable manure storage costs due to the daily hauling and spreading practices they now prefer. Nonetheless, manure handling costs are still substantial, though somewhat less per cow for the larger size dairies due to economies of scale reasons.
4.7. Costs of Dairy Feed Rations
Costs of dairy feed rations are a major component of total costs on any dairy operation. In this study, the cost of purchased dairy feed generally accounts for roughly 50% of total costs, ranging from 40 to 65% depending upon the amount of farm-raised forage and feed available to feed to the dairy cattle. Dairy feed costs are widely expected to be about half of total costs [64,65,66,67,68,69]. Thus, these results are in line with broad expectations.
As Table 15, indicates. The cost of purchased feed is close to USD 1850/(cow year) for the small dairy (or about 43% of total costs), but is as high as USD 2300 (or 56% of total costs) on the very large dairies. The range in cost is largely because of the land area farmed. Recall from Table 5 that small dairies are estimated to farm about 0.59 ha/cow each year on average while the very large dairies are estimated to farm only about 0.19 ha/cow annually on average. Thus, the larger land area not only serves to benefit small dairies in terms of fertilizer cost savings from manure utilization, it also reduces purchased feed cost. The overall net economic impact certainly depends on the cost of manure application and other operations necessary for raising feed and forages on the farm as compared to purchasing them.
Table 15.
Costs of purchased dairy feed.
4.8. Net Farm Incomes
General farm economic indicators are relevant as a gauge for the overall economic health of farms (Table 16). The results in Table 16 support the notion that dairies fared much better in 2024 due to lower than normal feed prices. Thus, with the exception of the small dairy size group, dairies are indicated to have obtained healthy net income margins in 2024. Under the nitrogen-based manure application rate, net income per Mg of milk ranged from almost USD 20 to about USD 22 for the larger size dairies, as compared to about USD 11 for the small size dairies. In contrast, under the phosphorus-based manure application rate, the net income margins fell to a range of USD 12 to under USD 14 per Mg for the three larger dairy sizes. It also fell to USD 7 for the small dairy size group. The substantial change in cost highlights the role manure management plays in the financial profile of contemporary dairy operations.
Table 16.
Net farm income of representative farms.
The results indicate that phosphorus-based manure application rates would reduce net income margins on the larger dairy operations more substantially—a change of between USD 7.48/(Mg year) (medium dairies) to USD 8.27/(Mg year) (very large dairies) annually, while the reduction in profit margin would be less, a change of about USD 4.33/(Mg year) on small operations. In general, it makes sense that operations with larger acreages are better off applying at the lower phosphorus-based rate and supplementing with inorganic fertilizer, as this allows them to more fully account for the manure nutrients. Sensitivity analyses to reflect varying land areas farmed per cow would enable us to infer the net economic impact to the larger operations of leasing and farming greater land areas in close proximity to the dairy operation.
The comparative results between nitrogen- and phosphorus-based manure application rates is in line with previous studies [6,31]. There are substantial environmental benefits to applying manure at the phosphorus removal rates as these are more sustainable in the long run. However, particularly for farms that do not have adequate land area, this entails substantial cost increases on an annual basis. Farmers may have to weigh the cost of purchasing additional land in order to reduce overall manure management costs and possibly raise additional forage to reduce feed costs. The optimal decision hinges on a comparison of the land values to the cost of manure hauling and nutrient value lost when manure is hauled offsite.
In terms of dairy size categories, the results indicate that the transition from small- to medium-sized dairies results in a substantial increase in net incomes per unit of milk output. While profit per farm continues to increase with increasing herd size, additional per unit profit gains are not realized. The results support the notion that size economies are clearly present in the dairy industry, particularly for those considering increasing their dairy herd sizes from the small to the medium size categories represented here. It is worthy of note, though, that some of these comparisons across size groups hinge on the farm’s land area per cow.
The results of the study have clear implications for employment and supply chains in dairy production regions. In particular, current manure handling methods mean that there are fewer options for transferring manure to crop and forage producers who are located a good distance from dairy operations. For this reason, there are hardly any manure hauling operators left in the north central Texas region, whereas that was a highly active business in the area in the early 2000s. Most dairies are handling their own manure management in order to save on inorganic fertilizer expenses. However, manure handling is still quite expensive, so the recent change in manure handling practices should not contribute substantially to an impact on economic sustainability for the farms and the rural areas they represent.
It is important to note that the results of this study are not directly transferable to most dairy regions in the United States. In particular, dairy production systems in the northeast and midwest entail heavier use of pasture with smaller scale dairy production units. The results obtained here are more applicable to medium to large dairies in the Texas, New Mexico, and California regions.
5. Conclusions
Manure management is an important component of contemporary dairy operations. To a large extent, issues revolving around manure production, handling, and utilization have played a significant role in the migration of dairy operations from north central Texas to the Texas Panhandle and New Mexico. Newer and larger dairies prefer the New Mexico–Texas Panhandle region because there are fewer environmental pressures there than in other regions in Texas. Studies aimed at developing alternative manure handling approaches for dairies would benefit from a current baseline assessment for manure handling, which is what this study seeks to provide. This is particularly pertinent since manure management in north central Texas dairies has transitioned to a greater use of vacuum-fitted trucks and daily hauling to apply manure on cropland or pastures.
Results of this study indicate that manure management entails substantial cost but also offers farmers significant fertilizer cost savings. Farmers with large land areas on their operations, such as the small representative dairy operation in this study, can save as much as USD 330 per cow annually in fertilizer expenses if manure is utilized on land at the phosphorus uptake rate of receiving crops, along with supplemental nitrogen application. Dairy farms with much less land area, such as the very large representative dairy in this study, may only save roughly USD 100 per cow annually when manure is applied at the nitrogen agronomic rate of receiving crops or forages. These fertilizer cost savings are a welcome offset to the substantial manure handling expenses dairy farmers incur daily. It is important to emphasize that these land areas assumed to be farmed on the representative operations do not necessarily reflect the actual practice on any given dairy within the size groups represented here.
Farms with large land areas also incur lower manure hauling costs. The small representative dairy is projected to haul off only about 9% of manure at a cost of USD 1440 annually under a phosphorus-based manure application regime. In contrast, the very large representative dairy is projected to haul off about 67% of their manure at an annual cost of over USD 155,000. These costs assume a hauling distance of 8 km, and the costs would be depending on how far the manure needs to be hauled.
The net income margins presented here indicate, as expected, that net incomes are higher with the larger dairy operations. The baseline year of the study—2024—was characterized by substantially lower feed costs, which enabled dairy farms of all sizes to enjoy reduced total expenses since purchased feed accounts for roughly half of all costs incurred by dairies. In typical years when feed costs are substantially higher, dairy farmers may face very tight margins and may not have the appetite to experiment with changes in manure management options.
Farms with large land areas are better off spreading the manure across the entire area available and utilizing supplemental nitrogen fertilizer. The drawback to this is that manure application at lower rates and over larger areas entails greater hauling and application costs. Sensitivity analyses with varying land areas farmed per cow would offer more insight into the relative economic viability of operating more land and spreading manure over the entire area.
The results of this study have substantial policy implications. First, applications at phosphorus removal rates are clearly more environmentally sustainable, but also more costly. Furthermore, larger farms clearly stand a better chance of profitably managing manure, particularly if they farm an adequate land area. Thus, to maintain the presence of smaller size operations, special policies may be required to provide support for these smaller operations. This support could be in the form of establishing cooperatives that enable smaller operations to share infrastructure to enhance their economic viability. Additionally, manure banking that provides avenues for sharing manure with forage and grain producers will make it easier for particularly small operations to reduce the cost of manure handling if they farm an inadequate amount of land. Finally, public support for production of value-added manure products such as biochar will also offer alternative income opportunities for all dairy operations, particularly smaller farms.
Author Contributions
Conceptualization, E.O. and E.K.; methodology, E.O.; software, E.O.; validation, E.O., L.H. and A.L.; formal analysis, E.O.; investigation, E.O., L.H., S.H.J. and A.L.; resources, E.O., S.H.J. and A.L.; data curation, E.O., E.K., S.H.J., L.H., A.L., K.W., J.M., J.S. and Z.L.; writing—original draft preparation, E.O.; writing—review and editing, E.O., E.K., S.H.J., L.H., A.L., K.W., J.M., J.S. and Z.L.; visualization, E.O. and L.H.; supervision, E.O., S.H.J., E.K. and A.L.; project administration, E.K., E.O., S.H.J. and A.L.; funding acquisition, E.K., E.O., S.H.J. and A.L. All authors have read and agreed to the published version of this manuscript.
Funding
This study was supported in part by U.S. Department of Agriculture (Conservation In-novation Grant, Project number: NR213A750013G032. It was also partly supported by U.S. Department of Agriculture National Institute of Food and Agriculture’s Foundational and Applied Science: Small and Medium Sized Farms Program, Grant number: 2022-67024-36151 and U.S. Department of Agriculture (Capacity Building Grants for Non-Land Grant Colleges of Agriculture Program, Grant number: 2020-70001-31552). The opinions and views expressed in this article are solely those of the author and do not necessarily reflect the opinions and views of the funding agencies.
Institutional Review Board Statement
Not applicable.
Data Availability Statement
The raw data supporting the conclusions of this article will be made available by the authors on request.
Conflicts of Interest
The authors declare no conflicts of interest.
References
- Milk Administrator. The Market Administrator’s Bulletin. Southwest Marketing Area. 2011. Available online: https://www.dallasma.com/file_map/order/2011/AUG11BUL.pdf (accessed on 14 April 2025).
- Milk Administrator. The Market Administrator’s Bulletin. Southwest Marketing Area. 2024. Available online: https://www.dallasma.com/file_map/order/2024/OCT24BUL.pdf (accessed on 14 April 2025).
- Ribaudo, M.; Kaplan, J.D.; Christensen, L.A.; Gollehon, N.; Johansson, R.; Breneman, V.E.; Aillery, M.; Agapoff, J.; Peters, M. Manure Management for Water Quality: Costs to Animal Feeding Operations of Applying Manure Nutrients to Land; USDA Economic Research Service, Agricultural Economic Report No. 824; USDA Economic Research Service: Washington DC, USA, 2003.
- Bentley, J.A.; Timms, L.L.; Tranel, L.F.; Brenneman, G.G.; Kohl, K.; Lenth, R.A. Economics of Dairy Manure Management in Iowa; 2016 Iowa State University Animal Industry Report; Iowa State University Digital Press: Ames, IA, USA, 2016; Volume 13. [Google Scholar] [CrossRef][Green Version]
- Osei, E.; Beran, L. Independent assessment of dairy manure and waste management processes and infrastructure. Department of Agriculture Education and Communication, Tarleton State University: Stephenville, TX, USA, 2019; Unpublished manuscript. [Google Scholar]
- Osei, E.; Du, B.; Bekele, A.; Hauck, L.; Saleh, A.; Tanter, A. Impacts of alternative manure application rates on Texas animal feeding operations: A macro level analysis. J. Am. Water Resour. Assoc. 2008, 44, 562–576. [Google Scholar] [CrossRef]
- Gassman, P.W.; Osei, E.; Saleh, A.; Rodecap, J.; Norvell, S.; Williams, J. Alternative practices for sediment and nutrient loss control on livestock farms in northeast Iowa. Agric. Ecosyst. Environ. 2006, 117, 135–144. [Google Scholar] [CrossRef]
- Williams, J.R.; Arnold, J.G.; Srinivasan, R. The APEX Model; BRC Report; No. 00-06; Blackland Research Center, Texas Agricultural Experiment Station, Texas Agricultural Extension Service, Texas A&M University System: Temple, TX, USA, 2000. [Google Scholar]
- Williams, J.R.; Arnold, J.G.; Kiniry, J.R.; Gassman, P.W.; Green, C.H. History of model development at Temple, Texas. Hydrol. Sci. J. 2008, 53, 948–960. [Google Scholar] [CrossRef]
- Gassman, P.W.; Williams, J.R.; Wang, X.; Saleh, A.; Osei, E.; Hauck, L.M.; Izaurralde, R.; Flowers, J.D. Invited Review Article: The Agricultural Policy/Environmental eXtender (APEX) Model: An Emerging Tool for Landscape and Watershed Environmental Analyses. Trans. ASABE 2010, 53, 711–740. [Google Scholar] [CrossRef]
- Williams, J.R. The erosion-productivity impact calculator (EPIC) model: A case history. Philos. Trans. R. Soc. B Biol. Sci. 1990, 329, 421–428. [Google Scholar]
- Arnold, J.G.; Srinivasan, R.; Muttiah, R.S.; Williams, J.R. Large Area Hydrologic Modeling and Assessment Part I: Model Development. JAWRA J. Am. Water Resour. Assoc. 1998, 34, 73–89. [Google Scholar] [CrossRef]
- Osei, E.; Gassman, P.; Saleh, A. Livestock and the Environment: A National Pilot Project: Economic and Environmental Modeling Using CEEOT; Texas Institute for Applied Environmental Research, Tarleton State University: Stephenville, TX, USA, 2000. [Google Scholar]
- Niraula, S.; Choi, Y.-K.; Payne, K.; Muir, J.P.; Kan, E.; Chang, W.-S. Dairy Effluent-Saturated Biochar Alters Microbial Communities and Enhances Bermudagrass Growth and Soil Fertility. Agronomy 2021, 11, 1794. [Google Scholar] [CrossRef]
- Jafri, S.H.; Adnan, K.M.M.; Baimbill Johnson, S.; Talukder, A.A.; Yu, M.; Osei, E. Challenges and Solutions for Small Dairy Farms in the U.S.: A Review. Agriculture 2024, 14, 2369. [Google Scholar] [CrossRef]
- Steiner, J.L.; Engle, D.M.; Xiao, X.; Saleh, A.; Tomlinson, P.; Rice, C.W.; Cole, N.A.; Coleman, S.W.; Osei, E.; Basara, J.; et al. Knowledge and Tools to Enhance Resilience of Beef Grazing Systems for Sustainable Animal Protein Production. Ann. N. Y. Acad. Sci. 2014, 1328, 10–17. [Google Scholar] [CrossRef]
- Choi, Y.K.; Srinivasan, R.; Kan, E. Facile and Economical Functionalized Hay Biochar with Dairy Effluent for Adsorption of Tetracycline. ACS Omega 2020, 5, 16521–16529. [Google Scholar] [CrossRef] [PubMed] [PubMed Central]
- Sharpley, A.N.; Chapra, S.C.; Wedepohl, R.; Sims, J.T.; Daniel, T.C.; Reddy, K.R. Managing Agricultural Phosphorus for Protection of Surface Waters: Issues and Options. J. Environ. Qual. 1994, 23, 437–451. [Google Scholar] [CrossRef]
- Carpenter, S.; Caraco, N.; Correll, D.; Howarth, R.; Sharply, A.; Smith, V. Nonpoint source pollution of surface waters with phosphorus and nitrogen. Ecol. Appl. 1998, 8, 559–568. [Google Scholar] [CrossRef]
- Xu, Y.; Elbakidze, L.; Yen, H.; Arnold, J.G.; Gassman, P.W.; Hubbart, J.; Strager, M.P. Integrated assessment of nitrogen runoff to the Gulf of Mexico. Resour. Energy Econ. 2022, 67, 101279. [Google Scholar] [CrossRef]
- Elizabeth, M.; Aillery, M.; Ribaudo, M.; Key, N.; Sneeringer, S.; Hansen, L.; Malcolm, S.; Riddle, A. Reducing Nutrient Losses from Cropland in the Mississippi/Atchafalaya River Basin: Cost Efficiency and Regional Distribution; ERR-258; U.S. Department of Agriculture, Economic Research Service: Washington, DC, USA, 2018. Available online: https://www.ers.usda.gov/publications/pub-details/?pubid=90175 (accessed on 9 March 2023).
- Sharpley, A.N.; Daniel, T.; Gibson, G.; Bundy, L.; Cabrera, M.; Sims, T.; Stevens, R.; Lemunyon, J.; Kleinman, P.; Parry, R. Best Management Practices to Minimize Agricultural Phosphorus Impacts on Water Quality; ARS-163; United States Department of Agriculture, Agricultural Research Service: Washington, DC, USA, 2006. Available online: https://naldc.nal.usda.gov/catalog/26763 (accessed on 4 April 2023).
- Delgado, J.A.; Groffman, P.M.; Nearing, M.A.; Goddard, T.; Reicosky, D.; Lal, R.; Kitchen, N.R.; Rice, C.W.; Towery, D.; Salon, P. Conservation practices to mitigate and adapt to climate change. J. Soil Water Conserv. 2011, 66, 118A–129A. [Google Scholar] [CrossRef]
- Sharpley, A.N.; Rekolainen, S. Phosphorus in agriculture and its environmental implications. In Phosphorus Loss from Soil to Water; Tunney, H., Carton, O.T., Brookes, P.C., Johnston, A.E., Eds.; CAB International: London, UK, 1997; pp. 1–53. [Google Scholar]
- McFarland, A.M.; Hauck, L.M. Determining nutrient export coefficients and source loading uncertainty using in stream monitoring data. JAWRA J. Am. Water Resour. Assoc. 2001, 37, 223–236. [Google Scholar] [CrossRef]
- McFarland, A.M.S.; Hauck, L.M. Relating Agricultural Land Uses to In-Stream Stormwater Quality. J. Environ. Qual. 1999, 28, 836–844. [Google Scholar] [CrossRef]
- Teleshkan, E.; Van Schoubroeck, S.; Spiller, M.; Van Passel, S. Assessing policy impacts on nutrient circularity: A comprehensive review. Nutr. Cycl. Agroecosyst. 2024, 129, 337–351. [Google Scholar] [CrossRef]
- Petropoulos, T.; Benos, L.; Busato, P.; Kyriakarakos, G.; Kateris, D.; Aidonis, D.; Bochtis, D. Soil Organic Carbon Assessment for Carbon Farming: A Review. Agriculture 2025, 15, 567. [Google Scholar] [CrossRef]
- Jones, R.; Frarey, L.; Bouzaher, A.; Johnson, S.R.; Neibergs, S. Livestock and the Environment: A National Pilot Project: Detailed Problem Statement; Report No. PR9304; Tarleton State University: Texas Institute for Applied Environmental Research: Stephenville, TX, USA, 1993. [Google Scholar]
- Pratt, S.; Jones, R.; Jones, C.A. Livestock and the Environment: Expanding the Focus; Report No. PR9603; Tarleton State University: Teas Institute for Applied Environmental Research: Stephenville, TX, USA, 1997. [Google Scholar]
- Osei, E.; PGassman, W.; Jones, R.D.; Pratt, S.J.; Hauck, L.M.; Beran, L.J.; Rosenthal, W.D.; Williams, J.R. Economic and environmental impacts of alternative practices on dairy farms in an agricultural watershed. J. Soil Water Conserv. 2000, 55, 466–472. [Google Scholar] [CrossRef]
- Osei, E.; Gassman, P.W.; Hauck, L.M.; Neitsch, S.; Jones, R.D.; McNitt, J.; Jones, H. Economic and environmental impacts of pasture nutrient management. J. Range Manag. 2003, 56, 218–226. [Google Scholar] [CrossRef]
- Rotz, C.A.; Kleinman, P.J.A.; Dell, C.J.; Veith, T.L.; Beegle, D.B. Environmental and economic comparisons of manure application methods in farming systems. J. Environ. Qual. 2011, 40, 438–448. [Google Scholar] [CrossRef]
- Smith, P.; Martino, D.; Cai, Z.; Gwary, D.; Janzen, H.; Kumar, P.; McCarl, B.; Ogle, S.; O’Mara, F.; Rice, C.; et al. Greenhouse gas mitigation in agriculture. Philos. Trans. R. Soc. B Biol. Sci. 2008, 363, 789–813. [Google Scholar] [CrossRef]
- Aguirre-Villegas, H.A.; Larson, R.A. Evaluating greenhouse gas emissions from dairy manure management practices using survey data and life cycle assessment. J. Clean. Prod. 2017, 143, 169–179. [Google Scholar] [CrossRef]
- Kaplan, J.D.; Johansson, R.C.; Peters, M. The manure hits the land: Economic and environmental implications when land application of nutrients is constrained. Am. J. Agric. Econ. 2004, 86, 688–700. [Google Scholar] [CrossRef]
- Rayne, N.; Aula, L. Livestock manure and the impacts on soil health: A review. Soil Syst. 2020, 4, 64. [Google Scholar] [CrossRef]
- Osei, E.; Jafri, S.H.; Gassman, P.W.; Saleh, A. Simulated Ecosystem and Farm-Level Economic Impacts of Conservation Tillage in a Northeastern Iowa County. Agriculture 2023, 13, 891. [Google Scholar] [CrossRef]
- Bosch, D.J.; Ogg, C.; Osei, E.; Stoecker, A.L. Economic models for TMDL assessment and implementation. Trans. ASABE 2006, 49, 1051–1065. [Google Scholar] [CrossRef][Green Version]
- Bizimana, J.C.; Richardson, J.W. Agricultural technology assessment for smallholder farms: An analysis using a farm simulation model (FARMSIM). Comput. Electron. Agric. 2019, 156, 406–425. [Google Scholar] [CrossRef]
- Richardson, J.W.; Nixon, C.J. FLIPSIM V: A General Firm Level Policy Simulation Model. B-1528. Department of Agricultural Economics, Texas A&M University: Temple, TX, USA, 1985. [Google Scholar]
- Britz, W.; Keeney, R. The CAPRI model—An Overview with a Focus on Comparison to GTAP. In Proceedings of the 13th Annual Conference on Global Economic Analysis, Penang, Malaysia, 9–11 June 2010; Global Trade Analysis Project (GTAP), Purdue University: West Lafayette, IN, USA, 2010. Available online: https://www.gtap.agecon.purdue.edu/resources/res_display.asp?RecordID=3257 (accessed on 5 November 2025).
- Rotz, C.A.; Kamphuis, G.H.; Karsten, H.D.; Weaver, R.D. Organic dairy production systems in Pennsylvania: A case study evaluation. J. Dairy Sci. 2007, 90, 3961–3979. [Google Scholar] [CrossRef]
- Brooke, A.; Kendrick, D.; Meeraus, A. GAMS: A User’s Guide; World Bank: Washington, DC, USA, 1992. [Google Scholar]
- ASAE EP496.1; Agricultural Machinery Management. ASAE Engineering Practice. American Society of Agricultural Engineers: St. Joseph, MI, USA, 1995.
- ASABE EP496.3; Agricultural Machinery Management. ASABE Engineering Practice. American Society of Agricultural Engineers: St. Joseph, MI, USA, 2006. Available online: https://elibrary.asabe.org/abstract.asp?aid=47748 (accessed on 29 January 2023).
- ASAE D497.1; Agricultural Machinery Management Data. American Society of Agricultural Engineers: St. Joseph, MI, USA, 1995.
- ASABE D497.5; Agricultural Machinery Management Data. American Society of Agricultural Engineers: St. Joseph, MI, USA, 2021. Available online: https://www.tractoresymaquinas.com/wp-content/uploads/2021/07/ASABE_D497.5.pdf (accessed on 29 January 2023).
- Texas AgriLife. Texas Crop and Livestock Enterprise Budgets. Texas A&M AgriLife Extension. 2025. Available online: https://agecoext.tamu.edu/resources/crop-livestock-budgets/ (accessed on 14 October 2025).
- NRC. Nutrient Requirements of Dairy Cattle, 7th ed.; National Academic Press: Washington, DC, USA, 2001. [Google Scholar]
- Hoard’s Dairyman. Directory of Feeds & Feed Ingredients; Macgregor, C., Ed.; W.D. Hoard & Sons Company: Fort Atkinson, WI, USA, 2015; ISBN 9780932147349. [Google Scholar]
- USDA NASS Quick Stats. United States Department of Agriculture, National Agricultural Statistics Service. 2024. Available online: https://QuickStats.nass.usda.gov (accessed on 15 November 2024).
- AMS. United States Department of Agriculture, Agricultural Marketing Service. Various Reports. 2024. Available online: http://ams.usda.gov/ (accessed on 2 October 2025).
- Plastina, A. Estimated Costs of Crop Production in Iowa; Ag Decision Maker. File A1-20. FM 1712 Revised January 2022; Iowa State University: Ames, IA, USA, 2023; Available online: https://www.extension.iastate.edu/agdm/crops/pdf/a1-20-2022.pdf (accessed on 12 March 2023).
- Latz, D.; Schnitkey, G. Machinery Cost Estimates for 2021. FarmDoc. Dly. 2021, 11, 143. [Google Scholar] [CrossRef]
- University of Wisconsin Extension. Building Cost Estimates—Dairy Modernization. 2025. Available online: https://shawano.extension.wisc.edu/files/2010/05/building-costs-factsheet.pdf (accessed on 15 October 2025).
- Flowers, J.; Osei, E.; Hauck, L.; Gassman, P.; McFarland, A. Livestock and the Environment: A National Pilot Project: Manure nutrient Application Rates and Other Assumptions Underlying APEX Runs; TIAER Information Bulletin 98-03; American Society of Agricultural and Biological Engineers: St. Joseph, MI, USA, 1998. [Google Scholar]
- USDA-NRCS. Field Office Technical Guide: 590. Nutrient Management. UDA-Natural Resources Conservation Service Washington DC. May 2019. Available online: https://www.nrcs.usda.gov/sites/default/files/2022-09/Nutrient_Management_590_NHCP_CPS_2017.pdf (accessed on 2 October 2025).
- Texas AgriLife Extension. 2020 Texas Agricultural Custom Rates. July 2020. Available online: https://agecoext.tamu.edu/wp-content/uploads/2020/07/TXCustomRatesSurvey2020.pdf (accessed on 15 October 2025).
- Quinn, R. Daily Trading News: DTN Retail Fertilizer Trends: Six Fertilizers Lead Nutrient Prices Higher. Available online: https://www.dtnpf.com/agriculture/web/ag/crops/article/2025/11/26/six-fertilizers-lead-nutrient-prices (accessed on 2 October 2025).
- Plastina, A.; Ann Johanns, M. Iowa Farm Custom Rate Survey; Ag Decision Maker. File A3-10. FM 1698 Revised March 2022; Iowa State University: Ames, IA, USA, 2023; Available online: https://www.extension.iastate.edu/agdm/crops/html/a3-10.html (accessed on 12 March 2023).
- Mann, J.; Grant, C. Economics of nutrient management systems for compliance with phosphorus regulations: Method and case study. Agric. Syst. 2015, 138, 10–17. [Google Scholar] [CrossRef]
- Howland, B.; Karszes, J. Manure Application Cost Study New York State Spring 2012; Extension Bulletin 2014-12; Dyson School of Applied Economics and Management, Cornell University: Ithaca, NY, USA, 2014; 40p, Available online: https://ecommons.cornell.edu/server/api/core/bitstreams/f62df2b0-5fe3-45ba-bff3-761e3ec6f5c8/content (accessed on 24 April 2025).
- Mosheim, R.; Lovell, C.A.K. Scale Economies and Inefficiency of U.S. Dairy Farms. Am. J. Agric. Econ. 2009, 91, 777–794. [Google Scholar] [CrossRef]
- USDA ERS. Various years. Milk Cost of Production Estimates. Available online: https://www.ers.usda.gov/data-products/milk-cost-of-production-estimates/ (accessed on 2 October 2025).
- Karszes, J.; Augello, L.; Dairy Business Summary: New York State. Dairy Farm Management. Charles H. Dyson School of Applied Economics and Management. Cornell University Agricultural Experiment Station. Report No. E.B.2022-11. 2019. Available online: https://dyson.cornell.edu/wp-content/uploads/sites/5/2022/07/EB_2022-11-VD-1.pdf (accessed on 2 October 2025).
- Bath, D.L. Nutritional Requirements and Economics of Lowering Feed Costs. J. Dairy Sci. 1985, 68, 1579–1584. [Google Scholar] [CrossRef] [PubMed]
- Gillespie, J.; Njuki, E.; Teran, A.; Structure, Costs, and Technology Used on U.S. Dairy Farms (Report No. ERR-334). U.S. Department of Agriculture, Economic Research Service. Available online: https://ers.usda.gov/sites/default/files/_laserfiche/publications/109626/ERR-334.pdf (accessed on 2 October 2025).
- Zwilling, B. Economic Review of Milk Costs in 2023 and Projections for 2024 and 2025. FarmDoc. Dly. 2024, 231. Available online: https://farmdocdaily.illinois.edu/wp-content/uploads/2024/12/fdd122024.pdf (accessed on 2 October 2025).
Disclaimer/Publisher’s Note: The statements, opinions and data contained in all publications are solely those of the individual author(s) and contributor(s) and not of MDPI and/or the editor(s). MDPI and/or the editor(s) disclaim responsibility for any injury to people or property resulting from any ideas, methods, instructions or products referred to in the content. |
© 2025 by the authors. Licensee MDPI, Basel, Switzerland. This article is an open access article distributed under the terms and conditions of the Creative Commons Attribution (CC BY) license (https://creativecommons.org/licenses/by/4.0/).