Abstract
Accurate plant phenotyping is crucial for gaining a deeper understanding of plant growth patterns and improving yield. However, the segmentation and measurement of 3D phenotypic data in maize remains challenging due to factors such as complex canopy structure, occlusion, and uneven point distribution. To address this, we propose a deep learning network, DUFA-Net, based on dual uncertainty-driven feature aggregation. This method employs a dual uncertainty-driven farthest point sampling (DU-FPS) strategy to mitigate errors caused by uneven point cloud density. Furthermore, for local feature encoding, we designed a Dynamic Feature Aggregation (DFA) module to model neighborhood structures and capture fine-grained geometric features, thereby effectively handling complex canopy structures. Experiments on a self-constructed maize dataset demonstrate that DUFA-Net achieves 95.82% segmentation accuracy and a mean IoU of 92.52%. Based on the segmentation results, six key phenotypic features were accurately extracted, showing high R2 values ranging from 0.92 to 0.99. Further evaluation on the Syau Single Maize dataset confirms the generalization capability of the proposed method, achieving 92.52% accuracy and 91.23% mIoU, outperforming five state-of-the-art baselines, including PointNet++, PointMLP, and CurveNet. These results highlight the effectiveness and robustness of DUFA-Net for high-precision organ segmentation and phenotypic trait extraction in complex plant architectures.
1. Introduction
Plant phenotype plays a vital role in agronomy and biology, providing important data for understanding plant growth, development, and environmental adaptability. However, traditional phenotyping methods that depend on manual measurement and visual observation exhibit inherent limitations in accuracy, efficiency, and comprehensiveness, and thus fall short of meeting the increasing demands of modern agricultural and biological research []. In recent years, advances in sensing technologies and computational performance have made three-dimensional (3D) data collection and phenotypic trait extraction increasingly feasible. Techniques such as LiDAR [,], depth cameras [,], and multi-view imaging [,,] have been widely adopted to acquire 3D plant data for the measurement of traits such as plant height, canopy diameter, leaf length, and leaf width. Wu et al. [] developed MVS-Pheno, a portable and cost-effective platform for high-throughput phenotyping of individual plants in field conditions. To address phenotyping challenges in small plants with complex structures, Wu et al. [] proposed MVS-Pheno V2 and validated its performance across four growth stages of three wheat cultivars. Wang [] performed a three-dimensional digital reconstruction of maize based on Phytomer and realized dynamic growth simulation. Sun et al. [] reconstructed point clouds of wheat from the seedling to the filling stage to enable full-cycle phenotyping. K. Hu et al. [] created a real-plant phenotyping dataset and conducted a comparative study on several SOTA NeRF models. These studies significantly advanced plant phenotyping but mainly focused on whole-plant reconstruction and trait extraction, with less emphasis on fine-grained organ-level segmentation, particularly for complex crops such as maize.
In 3D plant phenotyping research, although individual plant segmentation technology has made certain progress at the population level, it still faces many difficulties in the detailed analysis of large-scale, high-precision organs. Shen et al. [], in particular, argue that accurately separating stems and leaves in single-point cloud data continues to pose significant difficulties. Conventional segmentation methods, including region growing [,], watershed algorithms [,], and clustering techniques [], have been applied to plant organ segmentation with varying degrees of success. For instance, J. Li et al. [] applied region growing for high-precision stem and leaf segmentation in rapeseed. D. Li et al. [] combined clustering and region growing for dense point clouds. Mu et al. [] introduced a watershed-based clustering method for effective single-tree segmentation. However, these methods typically rely on empirically determined thresholds, which significantly influence segmentation performance []. Additionally, they rely extensively on low-level features such as color and spatial position, while lacking a deeper semantic understanding of the point cloud data, which limits their accuracy and scalability. Collectively, these disadvantages restrict their applicability to complex crop architectures and motivate the exploration of deep-learning-based approaches.
With the rapid development of deep learning, new opportunities have emerged for processing 3D plant data and extracting phenotypic parameters. These approaches substantially improve the efficiency and accuracy of automatic organ segmentation. For the 3D point cloud segmentation task, Qi et al. [] innovatively proposed PointNet to achieve end-to-end point cloud processing. However, the model exhibited limitations in capturing fine-grained local features, attributable to the absence of a hierarchical framework. To overcome this, PointNet++ [] was introduced, learning local features at multiple scales and performing better in complex segmentation tasks. Based on this, Y. Li et al. [,] proposed a point cloud segmentation method called DeepSeg3DMaize, which achieved high-precision segmentation results by introducing PointNet. Guo et al. [] enhanced PointNet++ with an attention module in the ASAP-PointNet model, attaining 95% accuracy and 86% Intersection-over-Union (IoU) for cabbage point cloud segmentation. Zhang et al. [] proposed a segmentation network based on a multi-view geometric graph encoder, which demonstrated strong performance and generalization on cucumber seedling point clouds. Turgut et al. [] compared six deep learning frameworks on a synthetic rose dataset, with PointNet++ achieving the highest accuracy. Li et al. further proposed PlantNet [] and PSegNet [], achieving up to 89.90% IoU on tobacco, tomato, and sorghum datasets, but were still limited by sampling robustness and the effectiveness of feature aggregation.
Although deep learning has greatly advanced plant point-cloud segmentation, existing plant-specific approaches still rely heavily on handcrafted thresholds or heuristic rules, and they often struggle to generalize across varying plant architectures. Meanwhile, generic point-cloud architectures, such as PointNet, PointNet++ and DGCNN [], provide strong feature extraction capabilities but remain limited by sensitivity to point-density variations, insufficient feature aggregation, and reduced robustness when handling complex organ overlap.
Unlike previous plant-specific networks and generic point-cloud architectures, DUFA-Net simultaneously addresses the challenges of imbalanced point sampling and insufficient feature aggregation. To achieve this, we propose a high-precision organ-level segmentation framework for maize point clouds with the following key innovations:
(1) DU-FPS: A dual uncertainty-based farthest point sampling strategy is proposed to enhance sensitivity to point cloud density variations, particularly in sparsely distributed regions, thereby improving sampling representativeness.
(2) DFA: A dynamic feature aggregation module is designed to adaptively adjust feature channel weights, enhancing feature representation and improving semantic discrimination for complex organ structures.
(3) DUFA-Net: Based on PointNet++, DUFA-Net integrates the DU-FPS and DFA modules to enhance the capability of the model in segmenting overlapping and structurally complex organs in maize point clouds.
(4) Leaf vein fitting: A geodesic-endpoint-based method is introduced to extract leaf morphological parameters more accurately, supporting precise phenotypic trait quantification.
2. Materials and Methods
2.1. High-Throughput Data Acquisition
To construct a comprehensive point cloud training dataset that captures the morphological and structural characteristics of maize organs, a series of experiments were conducted at the Garden Experiment and Training Center of Nanjing Forestry University (32°4′ N, 118°49′ E), using the maize cultivar Zhengdan 958 as the study subject. The experiment commenced on 13 May 2024. For ease of data acquisition and to ensure the quality of experimental samples, maize plants were grown individually in gallon pots (16 cm in diameter and 17.5 cm in height). Two seeds were sown per pot, and after germination, the more vigorous seedling was retained while the weaker one was removed. High-throughput image acquisition was carried out daily from 20 May 2024 (V2 stage, two-leaf stage) to 13 June 2024 (V6 stage, six-leaf stage), enabling the capture of point cloud data reflecting continuous plant growth over time.
To improve acquisition efficiency and maximize structural information capture, we designed and constructed a semi-automated multi-view image acquisition platform for high-throughput imaging of individual maize plants (Figure 1A). Unlike traditional setups in which the crop is fixed and the camera rotates, this platform integrates a camera, turntable, and support frame to automate image capture and achieve comprehensive multi-view coverage.
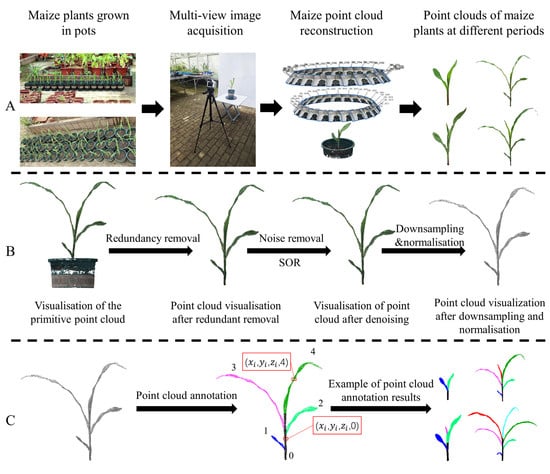
Figure 1.
Dataset construction. (A) High-throughput data acquisition and point cloud generation. (B) Point cloud preprocessing, including redundant point cloud removal, point cloud downsampling and normalization. (C) Point cloud data annotation using CloudCompare software (Version 2.10.2).
However, due to limitations in the field of view and light sensitivity of the camera, blind spots may arise, potentially resulting in incomplete 3D reconstruction. To mitigate this risk, we employed dual-height imaging, with two distinct camera positions: (1) at the same height as the plant apex, and (2) 10 cm above the plant apex. This approach improves structural coverage and reduces data loss in occluded regions. During data acquisition, each maize plant was placed on the turntable, which was rotated to systematically change the camera angle. This turntable is a rechargeable electric device equipped with wireless remote-control functionality. The rotation direction, speed, and angle can be precisely adjusted via the remote. By applying fixed rotation angles, it eliminates errors introduced by manual operation and ensures the stability required for high-quality point cloud reconstruction. A photo was taken every 15° of rotation, resulting in 48 multi-view images per plant. These images were subsequently used for 3D reconstruction and high-throughput phenotypic data generation. All image acquisition was conducted in a controlled indoor environment, free from wind and with stable lighting, to eliminate external interference. This experimental setup ensures efficient and accurate acquisition of point cloud data in a stable environment, providing a reliable foundation for subsequent structural analysis and model training.
2.2. Dataset Construction
2.2.1. Point Cloud Generation
In this study, the Structure from Motion (SfM) algorithm [] was employed to generate point cloud data of maize plants. SfM is a 3D reconstruction technique based on multi-view imagery. By estimating the camera poses from images captured at multiple angles and performing triangulation on corresponding image feature points, SfM computes the 3D coordinates of scene points, resulting in the generation of a sparse point cloud.
To further enhance the density and accuracy of the reconstructed data, the Multi-view Stereo (MVS) algorithm [] was applied to the SfM-generated sparse point cloud. MVS refines the reconstruction by generating additional 3D points through dense stereo matching, ultimately producing a high-fidelity dense point cloud of the maize plants.
The 3D reconstruction process was carried out using Agisoft Metashape [], a standalone software widely used for real-world 3D modeling. Metashape integrates both SfM and MVS algorithms to process digital images and produce 3D spatial data. In this study, Metashape was utilized to reconstruct dense point clouds of individual maize plants required for model training (Figure 1A). The software offers efficient processing, with the reconstruction of a single plant typically completed in approximately 10 min, depending on system performance and the number of input images.
2.2.2. Point Cloud Preprocessing
The initially generated point cloud data is typically characterized by a high spatial density and a large number of points, ranging from 3 million to 5 million. These raw point clouds often include multiple objects within the scene, such as the maize plants themselves, gallon pots, turntables, and various background artifacts. It is worth noting that the 3D reconstruction process of maize plants is often accompanied by the generation of noise points, especially on the leaf surface. These noise artifacts commonly occur during the feature matching stage.
To address these issues, a series of preprocessing steps was conducted (Figure 1B). First, non-relevant objects in the scene, such as the pot, turntable, and background structures, were manually removed. Only the point cloud data corresponding to the maize plants was retained. Next, the Statistical Outlier Removal (SOR) method [] was employed to reduce noise. This technique identifies and eliminates outliers by performing a statistical analysis of local point neighborhoods. Specifically, it calculates the average distance between each point and its nearest neighbors, and then classifies points as outliers based on a predefined standard deviation threshold, thereby effectively filtering out noise. Moreover, to enhance the efficiency of subsequent model training, uniform downsampling was performed to reduce the number of points per plant to a maximum of 40,960. Finally, the point cloud was scaled based on the known physical dimensions of the gallon pots, ensuring that the reconstructed model accurately reflected real-world measurements.
2.2.3. Point Cloud Annotation
Point cloud annotation is a labor-intensive task that requires significant manual involvement. Current research typically relies on open-source 3D point cloud annotation tools to facilitate this process. Among them, CloudCompare [] is a widely used open-source software that offers numerous plug-ins supporting point cloud processing, segmentation, registration, measurement, and related operations.
In this study, CloudCompare was employed to assist with the segmentation and annotation of maize plant point clouds, enabling the construction of a labeled maize point cloud dataset. During annotation, maize stems and leaves were manually selected and assigned corresponding labels. The stem was labeled as 0, while leaf labels were assigned sequentially starting from 1, following their natural growth order. As illustrated in Figure 1C, the annotated point cloud data were stored in .txt format, with each record containing the three-dimensional coordinates (x, y, z) of a point alongside its label. To improve visualization and organ differentiation, a color-coding scheme was applied. Stem points were uniformly colored, and leaves with the same label across different plants were assigned consistent colors. In total, 1100 point cloud samples were annotated for this study.
Since the point cloud data we collected covered multiple dates of continuous growth of maize plants, it was inevitable that some samples would be highly similar. Such redundant point clouds contributed little to feature diversity while increasing computational cost and reducing training efficiency. To address this, we implemented a voxel-based overlap screening strategy. Specifically, all 1100 annotated point cloud samples were voxelized, and the overlap ratio between consecutive samples was calculated. Point clouds with an overlap ratio greater than 0.9 were considered highly similar and removed from the dataset. This procedure ensured that the retained samples preserved sufficient morphological diversity while effectively reducing dataset size, thereby improving model training efficiency.
In the retained dataset (632 samples), 532 samples originated from 40 plants. Among these, 419 samples were used for training and 113 for validation. The remaining 100 samples came from the other 10 plants and were used exclusively as an independent test set. This partition ensures strict separation between the training/validation plants and the test plants, while preserving representative structural and developmental variation across the dataset.
2.3. Segmentation Network
2.3.1. DUFA-Net Training
PointNet++ employs Farthest Point Sampling (FPS) to downsample point clouds, but this strategy only considers spatial distance and is easily affected by uneven point cloud density and the presence of outliers. In the maize organ segmentation task, such limitations can significantly reduce sampling quality and model performance. Moreover, for maize plants with complex structures, PointNet++ considers only the relative positions between sampled points and their neighbors. This design limits the ability of the model to capture diverse local features, thereby impairing its capacity for effective local feature extraction.
To overcome these limitations, we propose DUFA-Net, a deep learning network built upon PointNet++ that integrates two novel components: Dual Uncertainty-driven Farthest Point Sampling (DU-FPS) and Dynamic Feature Aggregation (DFA). The overall structure of DUFA-Net is illustrated in Figure 2. The DU-FPS module (shown in the left dashed box) extends traditional FPS by incorporating both spatial distance and feature uncertainty, enabling the network to select more informative points in sparse, occluded, or structurally complex regions, thereby improving sampling quality and downstream segmentation robustness. The DFA module (shown in the right dashed box of) further enhances multi-scale feature representation by dynamically adjusting channel weights according to feature importance, allowing the net-work to more effectively capture fine-grained local details and differentiate overlapping or intertwined organs. By combining these modules, DUFA-Net not only addresses the density imbalance and sampling limitations of Point-Net++, but also improves semantic understanding and local feature extraction for complex maize structures.
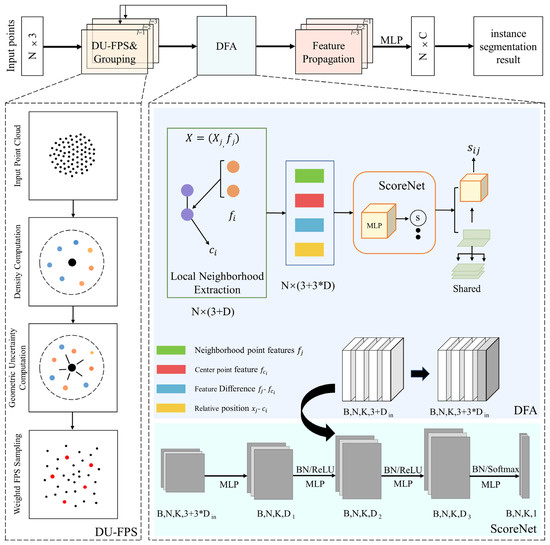
Figure 2.
DUFA-Net network structure diagram.
In order to enhance the representativeness and information content of sampling points in complex plant point clouds, DU-FPS extends the classic farthest point sampling (FPS) and incorporates geometric uncertainty and semantic uncertainty into the sampling criteria. The geometric uncertainty is estimated by computing the inverse of local point density. For each point , its local density is measured as the mean squared Euclidean distance to its k-nearest neighbors. Its geometric uncertainty is then defined as , indicating that sparsely distributed points carry more structural information. In parallel, semantic uncertainty is estimated from the input feature space. Given pointwise feature vectors , we compute the standard deviation across the feature dimensions to obtain an uncertainty measure . This reflects the variability or ambiguity in the feature representation, which is typically higher at object boundaries or occluded regions.
To balance the influence of both types of uncertainty, we normalize them to the range [0, 1] within each batch and compute a combined uncertainty score for each point using a linear fusion, as defined by the following expression
where and denote the normalized geometric and semantic uncertainty values, respectively, and is a balance factor.
During point selection, the standard FPS distance metric is modified to incorporate uncertainty-aware weighting. Specifically, for each candidate point, we compute an uncertainty-weighted Euclidean distance to the set of already selected centroids is computed as follows
where is a previously sampled centroid. In each iteration, the point with the maximum weighted distance is selected as the next centroid. This ensures that the sampling process prioritizes not only spatial coverage but also informational richness, favoring points that lie in structurally sparse or semantically uncertain regions. As shown in Figure 2, in the calculation of density and geometric uncertainty, black represents the center point, and other colors represent different neighborhood points.
To further effectively capture fine-grained geometric changes in plant point clouds and solve the fuzzy boundary problem, we combine ScoreNet [] dynamic feature aggregation with multi-scale receptive field fusion to design a Dynamic Feature Aggregation (DFA) module. The DFA module starts by sampling a subset of representative centroids from the input point cloud , using the proposed DU-FPS strategy. For each centroid , its local region is constructed by retrieving its K-nearest neighbors within a radius r. For each neighbor , we extract its associated feature and compute the relative position The grouped input is expressed as
where is the local neighborhood within radius r centered at .
To more effectively characterize local geometric structures, we construct a rich neighborhood representation by concatenating the raw neighbor feature , the repeated centroid feature , their feature difference , and the relative coordinates . This yields a concatenated vector of dimension 3D + 3 for each neighbor. To adaptively weigh the contribution of each neighbor, we introduce ScoreNet, a learnable MLP-based attention mechanism. It computes a soft weight for each neighbor as
These scores guide the aggregation of the weighted features
where is the shared MLP layer at depth l and is the local concatenated feature of neighbor . Then, channel-wise max pooling is applied to generate an abstracted feature for each centroid , yielding a new point set representation
To further improve geometric sensitivity across varying spatial scales, the module is extended to a Multi-Scale Grouping (MSG) structure. For each centroid, features are extracted at multiple radii , and their corresponding dynamic outputs are concatenated:
This dynamic and multi-scale design enables the DFA module to effectively capture fine-grained geometric variations, resolve fuzzy boundaries. By jointly optimizing DU-FPS and DFA, DUFA-Net achieves enhanced robustness and representational capacity in extracting and aggregating informative features from unstructured point cloud data. This results in improved segmentation performance and more accurate identification of maize organs at the point level.
2.3.2. Evaluation Indicators
Two widely adopted evaluation metrics, namely accuracy and mean Intersection over Union (mIoU), were used to quantitatively evaluate the performance of the proposed model in the point cloud segmentation task. Accuracy refers to the proportion of correctly predicted points (including true positives and true negatives) to the total number of points. The calculation method can be expressed as follows
where TP, FP, TN, and FN denote the numbers of true positive, false positive, true negative, and false negative points, respectively, within the current semantic class. However, accuracy alone may be insufficient to reliably assess model performance, particularly in the presence of class imbalance in point cloud data, where categories such as stems are substantially underrepresented compared to leaves.
To mitigate the limitations of accuracy in imbalanced datasets, mIoU is adopted as an additional metric. For a given class, IoU evaluates the ratio between the intersection and the union of the predicted and ground truth label sets. It can be expressed as follows
The mIoU is calculated as the average IoU across all C classes, which can be calculated as follows
Compared to accuracy, mIoU offers a more balanced and class-sensitive evaluation metric, which is particularly important for multi-class segmentation tasks involving imbalanced datasets. It enables a more thorough assessment of segmentation quality across all semantic classes and facilitates the identification of performance strengths and limitations associated with specific plant organs. The joint analysis of accuracy and mIoU can provide a comprehensive understanding of the classification and generalization capabilities of the model, while also providing valuable reference for architecture optimization and refinement.
2.4. Phenotypic Parameter Extraction
To extract key phenotypic traits from individual maize plants based on the point cloud data, we utilized the organ-level segmentation results generated by the DUFA-Net network. Six phenotypic parameters were computed: plant height (), crown diameter (), stem height (), stem diameter (), leaf length, and leaf width (Figure 3A,B). The calculation of plant height and crown width can be expressed as follows
where and denote the maximum and minimum coordinates along the vertical (z) axis of the plant, respectively, and and represent the maximum and minimum coordinates along the horizontal (x) axis of the plant.
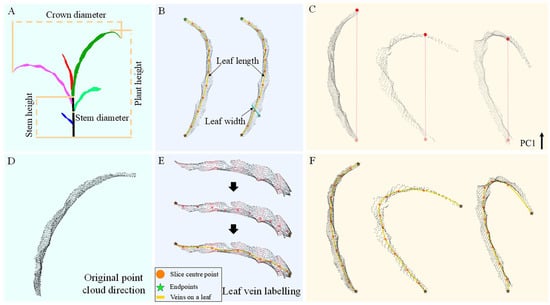
Figure 3.
This figure illustrates the methodology for phenotypic parameter extraction. (A) Measurement of plant height, crown diameter, and leaf base diameter in both vertical and horizontal orientations. (B) Measurement of individual leaf length and width. (C) Estimation of leaf length using the two endpoints along the primary principal component (PC1) direction. (D) Visualization of the original leaf orientation. (E) Leaf vein fitting based on geodesic endpoints. (F) Refined leaf length estimation based on vein fitting derived from the geodesic distance between endpoints.
Similarly, stem height and diameter can be calculated as follows
where , , , and , denote the maximum and minimum coordinates of the diameter segment along the z-, x-, and y-axes, respectively.
For leaf parameter extraction, direct measurement of leaf length and width via Euclidean distances in the X or Y direction is commonly used. However, such methods require orientation correction of the leaf and are only reliable for flat blades. Given the natural curvature of maize leaves, these conventional methods often lead to significant inaccuracies. To mitigate the challenges associated with blade orientation and curvature, a principal component analysis (PCA) [] based approach was employed. The direction of the first principal component (PC1) is used to represent the longitudinal axis of the leaf. Two endpoints along this direction are identified, and the shortest path between them is calculated as an estimate of the leaf length. While this method avoids manual alignment, it fails to capture the true arc length for curved leaves (the red line in Figure 3C), potentially introducing substantial errors.
To address this issue, a vein-fitting approach based on geodesic distance endpoints is proposed to more accurately capture the structural characteristics of naturally curved and bilaterally symmetric leaves. Specifically, Principal Component Analysis (PCA) is first applied to the segmented leaf point cloud to determine its principal axes (Figure 3D). The point cloud is then partitioned into ten equal intervals along the first principal component (PC1). For each interval, a representative center point is computed by averaging the spatial coordinates of all points within that segment. To mitigate the potential underestimation of leaf length caused by endpoint averaging, a graph-based method is employed to identify the true apical and basal endpoints of the leaf, which are subsequently incorporated into the set of center points (Figure 3E).
A k-nearest neighbor (k-NN) graph (k = 15) is constructed from the leaf point cloud, with edge weights defined by Euclidean distances to represent a discretized surface topology. To maintain topological continuity, only the largest connected component is preserved. Geodesic distances are then computed using the Dijkstra algorithm [], starting from an initial reference point (index 0). The point with the maximum geodesic distance is selected as a new source, and a second pass of the Dijkstra algorithm is performed to identify the final farthest point (denoted as ). This two-stage strategy robustly detects the two geodesic endpoints of the leaf. Subsequently, these endpoints are projected back into PCA space, and the sequence of center points is updated accordingly.
Finally, a cubic spline fitting is applied to the complete set of center and endpoint points, yielding a smooth approximation of the leaf vein curve (Figure 3F). This fitted curve provides a more accurate estimate of leaf length across various curvature levels. To compute leaf width, we measure the distances in the direction perpendicular to the vein curve, and define the maximum value as the leaf width.
3. Results
3.1. Semantic Segmentation Results of DUFA-Net Network
All model-related experiments in this study were conducted on a workstation equipped with an Intel® Core™ i5-13600KF CPU @ 3.50GHz, an NVIDIA RTX 4060 Ti GPU, and 64 GB of RAM, running the Windows 11 operating system. The deep learning models were implemented using the PyTorch 2.0.1 framework. The DUFA-Net network was trained for 300 epochs, with each epoch comprising 665 batches and a batch size of 8. The initial learning rate was set to 0.001.
As shown in Figure 4, the model accuracy improved rapidly during the initial 50 epochs, indicating effective parameter optimization in the early training phase. As training advanced, model performance progressively stabilized, reaching convergence at approximately epoch 150. At the final convergence, the classification accuracy and mean intersection over union (mIoU) reached 95.82% and 92.52%, respectively.
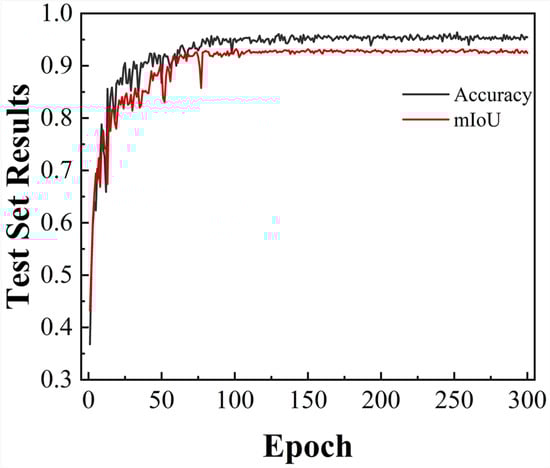
Figure 4.
Segmentation accuracy and mIoU of the DUFA-Net network as the number of training rounds changes.
To evaluate the segmentation effectiveness, we visualized the semantic segmentation results of DUFA-Net and compared them with manual annotations for maize plants at different growth stages (2 to 5 leaves), as shown in Figure 5A–D. The results demonstrate that the model successfully preserved the complete topological structure of the plants, and the segmentation outputs were highly consistent with the manual labels. In Figure 5A, where the stem endpoints are clearly defined, the model achieved high-precision segmentation, including in the complex region where leaves intersect the stem. In Figure 5B, despite the blurred structure at the apical end of the stem, the model exhibited only minor local mis-segmentation in the stem–leaf transition area (highlighted by the red box). Figure 5C,D further indicate that, although minor misclassifications occur at the stem–leaf junction, the overall segmentation results exhibit high reliability.
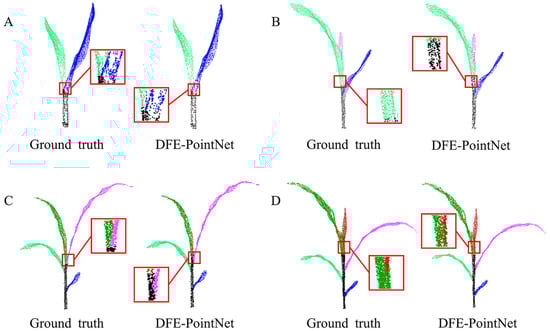
Figure 5.
Segmentation results of selected maize samples. Different colors represent different segmentation instances, and the same leaves or stems are shown in the same colors in both manual annotation and automatic segmentation results. Segmentation results of 2–5 leaves (A–D).
Morphological analysis suggests that these localized segmentation errors are primarily attributable to the inherent developmental variability of the maize apical meristem. The lack of well-defined anatomical boundaries in this region presents challenges for both manual annotation and automated prediction. However, these misclassified areas constitute only a minor portion of the overall plant structure, exerting minimal influence on the quality of the final segmentation. Consequently, the segmentation outcomes are deemed highly reliable. Overall, the DUFA-Net model demonstrates not only high accuracy in structural identification but also a degree of sensitivity to the developmental characteristics of plant organs, offering significant potential for advanced phenotyping applications.
3.2. Ablation Experiment Results
To investigate the contribution of each component, ablation experiments were conducted using two DUFA-Net variants alongside the baseline PointNet++ model. The results of these experiments are summarized in Table 1.

Table 1.
Ablation experiment.
In the DUFA-Net network, we employ density-aware farthest point sampling (DU-FPS) to improve the sampling representativeness of sparse regions. In the set abstraction layers, local features are processed with dynamic feature aggregation (DFA) using ScoreNet, which generates learnable weights conditioned on local point neighborhoods to adaptively emphasize important points. Multi-scale SA layers concatenate weighted features across different radii (SA1: npoint = 512, radius = [0.1,0.2,0.4], nsample = [32,64,128]; SA2: npoint = 128, radius = [0.4,0.8], nsample = [64,128]; SA3: global aggregation). Feature propagation layers upsample features back to each point (FP3: 1536→256, FP2: 576→128, FP1: 135→128).
All models were trained from scratch for 300 epochs with a batch size of 8 using the Adam optimizer (lr = 0.001, weight decay = 0.0001), and the learning rate was decayed by 0.5 every 20 epochs. Network A replaces the standard Farthest Point Sampling (FPS) with DU-FPS, which can be directly substituted without altering the feature extraction backbone. Network B removes the DU-FPS module and uses only the DFA encoder for feature encoding. When using DFA, the input feature channels are expanded, and the dynamic convolution parameters for the set abstraction layers are configured as: sa1.score_mlp = [64,128,256], sa2.score_mlp = [128,256,512], sa3.score_mlp = [256,512,1024].
All models were trained under the same hyperparameter settings to ensure fair comparison. The complete DUFA-Net model, which integrates DU-FPS and DFA, achieved the highest segmentation performance. Network B outperformed Network A, indicating that the DFA encoder contributes more significantly to feature extraction than sampling strategies alone. Compared to the original PointNet++ backbone, DFA captures richer, fine-grained features in complex canopy point clouds, yielding improvements of 3.39% in accuracy and 3.13% in mIoU. These results confirm the effectiveness of the proposed modules and highlight the importance of combining enhanced feature representation with adaptive sampling for high-quality point cloud segmentation.
3.3. Phenotypic Parameter Extraction Results
To evaluate the accuracy of phenotypic parameter extraction, we selected a test set comprising 100 maize plants, each with approximately 2 to 6 leaves, and assessed six key traits: plant height, crown diameter, stem height, stem diameter, leaf length, and leaf width. The correlation between the estimated values and the manually measured ground truth is illustrated in Figure 6.
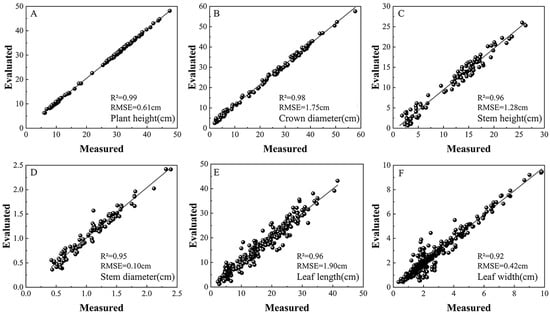
Figure 6.
Comparison between automatically extracted and manually measured values for six phenotypic parameters. Panels (A–F) correspond to plant height, crown width, diameter height, stem diameter, leaf length, and leaf width, respectively.
At the whole-plant level, six phenotypic parameters were evaluated across 100 individual samples. For plant height, the coefficient of determination (R2) was 0.99 and the root mean square error (RMSE) was 0.61 cm. For crown diameter, the corresponding values were 0.98 for R2 and 1.75 cm for RMSE, demonstrating a high degree of consistency with manual measurements. At the stem level, stem height and stem diameter were assessed. The coefficients of determination (R2) reached 0.96 and 0.95, respectively, with corresponding root mean square errors (RMSE) of 1.28 cm and 0.10 cm. These results confirm the effectiveness of the model in quantifying stem-related traits.
At the leaf level, the proposed segmentation algorithm successfully identified and analyzed a total of 393 leaves from the 100 maize plants. Leaf length and width were extracted for each leaf and subsequently compared to manual measurements. The findings revealed consistently strong correlations across all measured leaves, with R2 values of 0.95 and 0.92, and RMSE values of 1.90 cm and 0.42 cm for leaf length and leaf width, respectively. For leaf length estimation, we employed a vein fitting method based on geodesic distance endpoints, which achieved high accuracy, particularly in handling naturally curved leaves. Although leaf width estimation may be affected by Euclidean distance errors due to curvature in the leaf midrib, the overall deviation remained small and acceptable.
In summary, the six extracted phenotypic parameters showed strong agreement with manual measurements, confirming the accuracy, robustness, and applicability of our method in high-throughput phenotypic analysis. Notably, the leaf length estimation demonstrated particularly outstanding performance, highlighting the effectiveness of our geodesic vein fitting strategy in capturing complex leaf morphologies.
3.4. Cross-Dataset Validation Results
To further validate the segmentation performance of the DUFA-Net network for maize stem and leaf structures, we employed the public Syau Single Maize dataset [] for model evaluation. This dataset is specifically curated for the stem and leaf segmentation task in maize and includes 428 plant samples from multiple varieties, each containing 2 to 12 leaves. Each sample provides approximately 20,480 3D points, offering rich spatial information for model training and testing.
Figure 7 displays the instance segmentation outcomes of DUFA-Net applied to the Syau Single Maize dataset, in comparison with five representative point cloud segmentation methods, including PointNet++, DGCNN [], RandLA-Net [], CurveNet [], and PointMLP []. For samples with fewer leaves (e.g., three leaves), all methods exhibited relatively reliable performance, with the exception of PointMLP, which showed a higher incidence of segmentation errors. However, as the number of maize leaves increased (e.g., six leaves), RandLA-Net exhibited noticeable confusion in distinguishing between the fifth and sixth leaves. Moreover, with the exception of DUFA-Net, which consistently maintained high segmentation accuracy, the remaining methods began to produce segmentation errors, particularly along leaf boundaries and in regions with initial overlap.
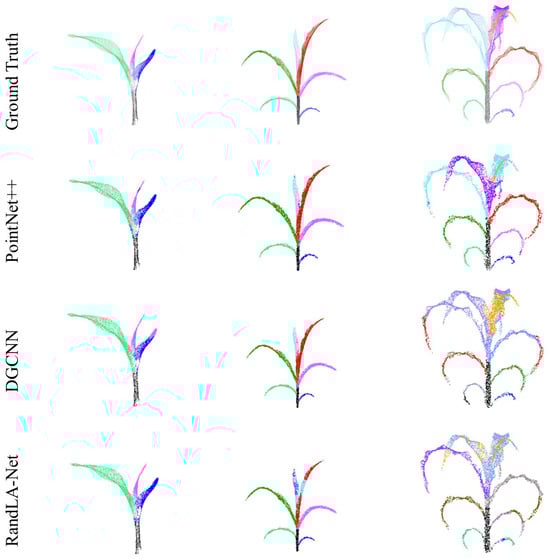
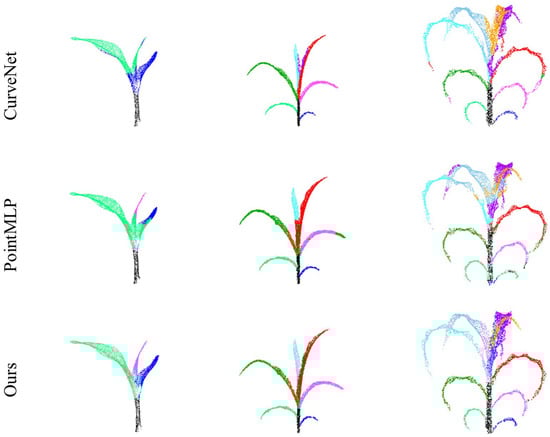
Figure 7.
The segmentation results of different algorithms in Syau Single Maize. The ground truth and results from different networks are presented in separate rows.
Overall, these models produced satisfactory segmentation results under conditions of relatively simple plant morphology and a limited number of leaves. However, as the complexity of the canopy structure increased with the number of leaves, and occlusions became more severe, only DUFA-Net was able to consistently achieve accurate identification and segmentation of individual leaves. Although PointNet++ and DGCNN maintained favorable performance in scenarios with a small number of leaves, owing to their respective advantages in hierarchical local feature learning and KNN-based feature space aggregation, their segmentation accuracy declined significantly in high-density cases. Specifically, due to the uneven point density and increased leaf occlusion in complex maize architectures, both models exhibited substantial misclassification, particularly at leaf edges and in overlapping regions.
Similarly, the other three methods (RandLA-Net, CurveNet, and PointMLP) also demonstrated limitations in handling increased morphological complexity. In contrast, DUFA-Net leverages a novel architectural design. It first applies the DU-FPS strategy to select more representative and uniformly distributed points in dense regions, followed by the Dynamic Feature Aggregation (DFA) module to enhance local feature representation, particularly at object boundaries and in overlapping regions. This design effectively mitigates misclassification issues arising from boundary ambiguity and complex spatial intersections. As a result, DUFA-Net exhibits a superior capacity to capture intricate geometric details, thereby significantly enhancing segmentation performance in challenging scenarios. More detailed segmentation results are shown in Figure A1.
Table 2 lists the quantitative evaluation results of all models. Except for DUFA-Net, PointMLP and CurveNet achieved the highest scores in Accuracy and mIoU, respectively. However, DUFA-Net outperformed all baseline models, achieving the highest segmentation accuracy of 92.51% and mean intersection over union (mIoU) of 91.22%. Compared with PointNet++, which lacks a dynamic feature enhancement mechanism, DUFA-Net improved its accuracy by 4.83% and mIoU by 4.38%, demonstrating the effectiveness of its architectural innovation.
Table 2.
Comparative results of the point cloud segmentation networks.
4. Discussion
Multi-view imaging to generate point clouds is a low-cost, high-detail, and color-rich 3D reconstruction method that effectively captures plant morphological features, especially exhibiting strong robustness in complex environments. Compared to traditional 3D scanning methods, multi-view imaging systems not only reduce equipment investment but also improve point cloud density and accuracy through algorithm optimization, maintaining high segmentation accuracy even under varying lighting and occlusion conditions. By constructing a high-throughput multi-view image acquisition system, we generated accurate single-plant point clouds and established a high-quality labeled dataset, laying a solid foundation for model training and evaluation.
To enhance the efficiency of organ-level point cloud segmentation, Elnashef et al. [] proposed a tensor-based computational pipeline that separates plant stems and leaves prior to applying the DBSCAN algorithm for individual leaf segmentation. Although this approach effectively reduces computational overhead, it demands expert-level parameter tuning and remains insufficient for resolving overlapping leaf structures. Zhang et al. [] integrated self-attention mechanisms into PointNet++ to enhance the segmentation of mechanical component point clouds. Their method achieved an accuracy of 86.6% and an mIoU of 0.84, representing improvements of 3.7% in accuracy and 0.03 in mIoU over the original PointNet++. Guo et al. [] embedded attention modules into PointNet for organ-level segmentation of cabbage point clouds, achieving an accuracy of 0.95 and an mIoU of 0.86. Although these attention-enhanced models outperform the baseline architectures, their effectiveness remains limited when applied to plant structures with more complex geometry or severely imbalanced point densities.
In comparison, the proposed DUFA-Net model achieved an accuracy of 95.82% and an mIoU of 92.52% on the structurally complex maize test set, demonstrating strong generalization capability in both ablation experiments and cross-dataset evaluations. Relative to existing organ-level plant segmentation methods [,], DUFA-Net provides an additional 1–4% point improvement in accuracy. Furthermore, when compared with five widely used baseline models, the proposed method delivers a substantial performance gain of 4–10% across key segmentation metrics, highlighting its effectiveness in handling dense, occluded, and morphologically intricate plant point clouds. Beyond segmentation, this study further addressed the morphological complexity of maize leaves. The introduced leaf vein fitting method, based on geodesic distance endpoints, provides a biologically meaningful representation of leaf curvature and enables precise extraction of phenotypic parameters. By comparing the extracted traits with manual measurements, we verified the accuracy and reliability of the proposed method.
Despite the aforementioned advantages, the proposed method still presents several limitations that merit further investigation. First, although DUFA-Net effectively alleviates point density imbalance, its performance may degrade in regions characterized by extremely sparse or noisy point clouds, such as those acquired under challenging field conditions. Future work could incorporate geometric priors or self-supervised denoising mechanisms to enhance robustness in such scenarios. Second, the dataset used in this study mainly includes early-stage maize; extending the framework to mature plants with more complex canopy structures or to other crop species would provide a more comprehensive assessment of its generalizability. Finally, although the computational cost of DUFA-Net remains acceptable, it is still higher than that of lightweight architectures. This suggests that model compression, pruning, or acceleration techniques could be explored to better support real-time or large-scale phenotypic analysis applications.
5. Conclusions
5.1. Methodological Innovations of DUFA-Net
In this study, we developed DUFA-Net, a deep learning model capable of achieving high-precision organ-level semantic segmentation of maize plant point clouds collected under field conditions. The model integrates two novel components, namely the DU-FPS module, which enhances point sampling by jointly considering spatial density and feature uncertainty, and the DFA module, which strengthens multi-scale feature aggregation for complex plant structures. The combined effect of these components substantially improves segmentation robustness and accuracy. On the self-constructed maize dataset, DUFA-Net achieved 95.82% overall accuracy and 92.52% mean Intersection over Union, demonstrating strong performance on dense, occluded, and structurally complex point clouds.
5.2. Phenotypic Trait Extraction
Based on the accurate segmentation results, a complete pipeline for automated phenotypic trait extraction was established. Six key traits (plant height, crown diameter, stem height, stem diameter, leaf length, and leaf width) were accurately obtained. To address curved leaf morphology, a geodesic-endpoint-based leaf vein fitting method was introduced, producing biologically meaningful leaf centerlines. All traits achieved coefficients of determination exceeding 0.92, confirming the precision and reliability of the framework.
5.3. Model Validation and Generalization
To evaluate robustness and generalization, ablation experiments confirmed the effectiveness of each component within DUFA-Net, with both DU-FPS and DFA contributing consistently to performance improvements across metrics. Experiments on the public Syau Single Maize dataset demonstrated strong generalization: DUFA-Net achieved 92.52% overall accuracy and 91.23% mean Intersection over Union, outperforming five baseline models (PointNet++, DGCNN, RandLA-Net, CurveNet, and PointMLP) by 4.83%, 10.08%, 8.95%, 4.73%, and 4.05%, respectively.
5.4. Implications and Future Work
Overall, this study presents an effective and technically advanced approach for segmentation and analysis of complex plant point cloud data. The proposed framework provides an efficient and adaptive solution for organ-level plant structure analysis and is expected to support agricultural digitalization, enhance crop monitoring and management, and promote intelligent field management technologies. Future work will extend DUFA-Net to multi-temporal and multi-species datasets, integrate multimodal sensing data, and improve the robustness of the model under varying environmental conditions.
Author Contributions
Conceptualization, L.J., Z.H. and C.L.; methodology, B.D. and Y.T.; software, Y.T. and C.L.; validation, B.D. and Y.T.; formal analysis, L.W.; investigation, B.D.; resources, Z.H.; data curation, B.D.; writing—original draft preparation, B.D.; writing—review and editing, L.J. and C.L.; visualization, C.L.; supervision, Z.H. and L.W.; project administration, L.J. All authors have read and agreed to the published version of the manuscript.
Funding
This research was financed by the Jiangsu Provincial Agricultural Science and Technology Independent Innovation Fund (CX(23)3127); the Science and Technology Support Program of Jiangsu Province (TJ-2023-034); the Natural National Science Foundation of China (NSFC) (12273012).
Institutional Review Board Statement
Not applicable.
Data Availability Statement
The data presented in this study are available on request from the corresponding author. The data are not publicly available due to ongoing research projects.
Conflicts of Interest
The authors Ling Jiang, Zhengwei Huang and Chun Li are from Jinpu Landscape Architecture Co., Ltd., where they serve as Teachers in school-enterprise cooperation. All authors declare no conflicts of interest.
Appendix A

Figure A1.
Maize with 2 to 9 leaves were segmented using different methods and then visually compared. Different colors represent different organ parts, and black circles mark segments that were segmented incorrectly by different algorithms.
References
- Jin, X.; Yang, W.; Doonan, J.H.; Atzberger, C. Crop phenotyping studies with application to crop monitoring. Crop J. 2022, 10, 1221–1223. [Google Scholar] [CrossRef]
- Ao, Z.; Wu, F.; Hu, S.; Sun, Y.; Su, Y.; Guo, Q.; Xin, Q. Automatic segmentation of stem and leaf components and individual maize plants in field terrestrial LiDAR data using convolutional neural networks. Crop J. 2022, 10, 1239–1250. [Google Scholar] [CrossRef]
- Hua, M.; Wu, Z.; Zhang, C.; Xu, Z.; Liu, X.; Zhou, W. Random access preamble design for 6G satellite-terrestrial integrated communication systems. Sensors 2025, 25, 5602. [Google Scholar] [CrossRef] [PubMed]
- Bono, A.; Marani, R.; Guaragnella, C.; D’Orazio, T. Biomass characterization with semantic segmentation models and point cloud analysis for precision viticulture. Comput. Electron. Agric. 2024, 218, 108712. [Google Scholar] [CrossRef]
- Teng, X.; Zhou, G.; Wu, Y.; Huang, C.; Dong, W.; Xu, S. Three-dimensional reconstruction method of rapeseed plants in the whole growth period using RGB-D camera. Sensors 2021, 21, 4628. [Google Scholar] [CrossRef]
- Innmann, M.; Kim, K.; Gu, J.; Nießner, M.; Loop, C.; Stamminger, M.; Kautz, J. Nrmvs: Non-rigid multi-view stereo. In Proceedings of the IEEE/CVF Winter Conference on Applications of Computer Vision, Snowmass Village, CO, USA, 1–5 March 2020; pp. 2754–2763. [Google Scholar]
- Wei, K.; Liu, S.; Chen, Q.; Huang, S.; Zhong, M.; Zhang, J.; Sun, H.; Wu, K.; Fan, S.; Ye, Z.; et al. Fast Multi-View 3D reconstruction of seedlings based on automatic viewpoint planning. Comput. Electron. Agric. 2024, 218, 108708. [Google Scholar] [CrossRef]
- Hua, M.; Meng, S.; Juan, Y.; Bian, B.; Liu, X. A Lightweight Stepwise SCMA Codebook Design Scheme for AWGN Channels. Forests 2025, 16, 257. [Google Scholar] [CrossRef]
- Wu, S.; Wen, W.; Wang, Y.; Fan, J.; Wang, C.; Gou, W.; Guo, X. MVS-Pheno: A portable and low-cost phenotyping platform for maize shoots using multiview stereo 3D reconstruction. Plant Phenomics 2020, 2020, 1848437. [Google Scholar] [CrossRef]
- Wu, S.; Wen, W.; Gou, W.; Lu, X.; Zhang, W.; Zheng, C.; Xiang, Z.; Chen, L.; Guo, X. A miniaturized phenotyping platform for individual plants using multi-view stereo 3D reconstruction. Front. Plant Sci. 2022, 13, 897746. [Google Scholar] [CrossRef]
- Wang, Y.J. Research on 3D Digitization and Visualization of MaizeMorphological Architecture Based on Phytomer. Ph.D. Thesis, Nanjing Agricultural University, Nanjing, China, 2020. [Google Scholar]
- Sun, S.; Zhu, Y.; Liu, S.; Chen, Y.; Zhang, Y.; Li, S. An integrated method for phenotypic analysis of wheat based on multi-view image sequences: From seedling to grain filling stages. Front. Plant Sci. 2024, 15, 1459968. [Google Scholar] [CrossRef]
- Hu, K.; Ying, W.; Pan, Y.; Kang, H.; Chen, C. High-fidelity 3D reconstruction of plants using Neural Radiance Fields. Comput. Electron. Agric. 2024, 220, 108848. [Google Scholar] [CrossRef]
- Shen, J.; Wu, T.; Zhao, J.; Wu, Z.; Huang, Y.; Gao, P.; Zhang, L. Organ segmentation and phenotypic trait extraction of cotton seedling point clouds based on a 3D lightweight network. Agronomy 2024, 14, 1083. [Google Scholar] [CrossRef]
- Fu, Y.; Niu, Y.; Wang, L.; Li, W. Individual-tree segmentation from UAV–LiDAR data using a region-growing segmentation and supervoxel-weighted fuzzy clustering approach. Remote Sens. 2024, 16, 608. [Google Scholar] [CrossRef]
- Vo, A.V.; Truong-Hong, L.; Laefer, D.F.; Bertolotto, M. Octree-based region growing for point cloud segmentation. ISPRS J. Photogramm. Remote Sens. 2015, 104, 88–100. [Google Scholar] [CrossRef]
- Li, Y.; Xie, D.; Wang, Y.; Jin, S.; Zhou, K.; Zhang, Z.; Li, W.; Zhang, W.; Mu, X.; Yan, G. Individual tree segmentation of airborne and UAV LiDAR point clouds based on the watershed and optimized connection center evolution clustering. Ecol. Evol. 2023, 13, e10297. [Google Scholar] [CrossRef] [PubMed]
- Yang, J.; Kang, Z.; Cheng, S.; Yang, Z.; Akwensi, P.H. An individual tree segmentation method based on watershed algorithm and three-dimensional spatial distribution analysis from airborne LiDAR point clouds. IEEE J. Sel. Top. Appl. Earth Obs. Remote Sens. 2020, 13, 1055–1067. [Google Scholar] [CrossRef]
- Miao, Y.; Li, S.; Wang, L.; Li, H.; Qiu, R.; Zhang, M. A single plant segmentation method of maize point cloud based on Euclidean clustering and K-means clustering. Comput. Electron. Agric. 2023, 210, 107951. [Google Scholar] [CrossRef]
- Li, J.; Qingqing, L.; Qiao, J.; Li, L.; Yao, J.; Tu, J. Organ-Level Instance Segmentation of Oilseed Rape at Seedling Stage Based on 3D Point Cloud. Appl. Eng. Agric. 2024, 40, 151–164. [Google Scholar] [CrossRef]
- Li, D.; Cao, Y.; Tang, X.S.; Yan, S.; Cai, X. Leaf segmentation on dense plant point clouds with facet region growing. Sensors 2018, 18, 3625. [Google Scholar] [CrossRef]
- Mu, Y.; Zhou, G.; Wang, H. Canopy lidar point cloud data k-means clustering watershed segmentation method. ISPRS Ann. Photogramm. Remote Sens. Spat. Inf. Sci. 2020, 6, 67–73. [Google Scholar] [CrossRef]
- Jin, S.; Su, Y.; Wu, F.; Pang, S.; Gao, S.; Hu, T.; Liu, J.; Guo, Q. Stem–leaf segmentation and phenotypic trait extraction of individual maize using terrestrial LiDAR data. IEEE Trans. Geosci. Remote Sens. 2018, 57, 1336–1346. [Google Scholar] [CrossRef]
- Qi, C.R.; Su, H.; Mo, K.; Guibas, L.J. Pointnet: Deep learning on point sets for 3d classification and segmentation. In Proceedings of the IEEE conference on computer vision and pattern recognition, Honolulu, HI, USA, 21–26 July 2017; pp. 652–660. [Google Scholar]
- Qi, C.R.; Yi, L.; Su, H.; Guibas, L.J. Pointnet++: Deep hierarchical feature learning on point sets in a metric space. Advances in neural information processing systems, 30. arXiv, 2017; arXiv:1706.02413. [Google Scholar]
- Li, Y.; Wen, W.; Miao, T.; Wu, S.; Yu, Z.; Wang, X.; Guo, X.; Zhao, C. Automatic organ-level point cloud segmentation of maize shoots by integrating high-throughput data acquisition and deep learning. Comput. Electron. Agric. 2022, 193, 106702. [Google Scholar] [CrossRef]
- Yinglun, L. Morphological and structural phenotypes extraction of maize using multi-source data and deep learning. Ph.D. Thesis, Jilin Agricultural University, Jilin, China, 2021. [Google Scholar]
- Guo, R.; Xie, J.; Zhu, J.; Cheng, R.; Zhang, Y.; Zhang, X.; Gong, X.; Zhang, R.; Wang, H.; Meng, F. Improved 3D point cloud segmentation for accurate phenotypic analysis of cabbage plants using deep learning and clustering algorithms. Comput. Electron. Agric. 2023, 211, 108014. [Google Scholar] [CrossRef]
- Zhang, Y.; Xie, Y.; Zhou, J.; Xu, X.; Miao, M. Cucumber seedling segmentation network based on a multiview geometric graph encoder from 3D point clouds. Plant Phenomics 2024, 6, 0254. [Google Scholar] [CrossRef] [PubMed]
- Turgut, K.; Dutagaci, H.; Galopin, G.; Rousseau, D. Segmentation of structural parts of rosebush plants with 3D point-based deep learning methods. Plant Methods 2022, 18, 20. [Google Scholar] [CrossRef]
- Li, D.; Shi, G.; Li, J.; Chen, Y.; Zhang, S.; Xiang, S.; Jin, S. PlantNet: A dual-function point cloud segmentation network for multiple plant species. ISPRS J. Photogramm. Remote Sens. 2022, 184, 243–263. [Google Scholar] [CrossRef]
- Li, D.; Li, J.; Xiang, S.; Pan, A. PSegNet: Simultaneous semantic and instance segmentation for point clouds of plants. Plant Phenomics 2022, 2022, 9787643. [Google Scholar] [CrossRef]
- Wang, Y.; Sun, Y.; Liu, Z.; Sarma, S.E.; Bronstein, M.M.; Solomon, J.M. Dynamic graph cnn for learning on point clouds. ACM Trans. Graph. Tog 2019, 38, 1–12. [Google Scholar] [CrossRef]
- Hartley, R.; Zisserman, A. Multiple View Geometry in Computer Vision; Cambridge University Press: Cambridge, UK, 2003. [Google Scholar]
- Seitz, S.M.; Curless, B.; Diebel, J.; Scharstein, D.; Szeliski, R. A comparison and evaluation of multi-view stereo reconstruction algorithms. In Proceedings of the 2006 IEEE Computer Society Conference on Computer Vision and Pattern Recognition (CVPR’06), New York, NY, USA, 17–22 June 2006; Volume 1, pp. 519–528. [Google Scholar]
- Agisoft. Agisoft Metashape Professional Edition, Version 2.2.1; Agisoft: St. Petersburg, Russia, 2025. Available online: https://www.agisoft.com/ (accessed on 22 April 2024).
- Cousineau, D.; Chartier, S. Outliers detection and treatment: A review. Int. J. Psychol. Res. 2010, 3, 58–67. [Google Scholar] [CrossRef]
- CloudCompare. CloudCompare, Version 2.10.2. CloudCompare, Online Resource. 2019. Available online: http://www.cloudcompare.org/ (accessed on 22 April 2024).
- Stegmüller, T.; Bozorgtabar, B.; Spahr, A.; Thiran, J.P. Scorenet: Learning non-uniform attention and augmentation for transformer-based histopathological image classification. In Proceedings of the IEEE/CVF Winter Conference on Applications of Computer Vision, Waikoloa, HI, USA, 2–7 January 2023; pp. 6170–6179. [Google Scholar]
- Li, D.; Shi, G.; Kong, W.; Wang, S.; Chen, Y. A leaf segmentation and phenotypic feature extraction framework for multiview stereo plant point clouds. IEEE J. Sel. Top. Appl. Earth Obs. Remote Sens. 2020, 13, 2321–2336. [Google Scholar] [CrossRef]
- Dijkstra, E.W. A note on two problems in connexion with graphs. In Edsger Wybe Dijkstra: His Life, Work, and Legacy; ACM: New York, NY, USA, 2022; pp. 287–290. [Google Scholar]
- Yang, X.; Miao, T.; Tian, X.; Wang, D.; Zhao, J.; Lin, L.; Zhu, C.; Yang, T.; Xu, T. Maize stem–leaf segmentation framework based on deformable point clouds. ISPRS J. Photogramm. Remote Sens. 2024, 211, 49–66. [Google Scholar] [CrossRef]
- Hu, Q.; Yang, B.; Xie, L.; Rosa, S.; Guo, Y.; Wang, Z.; Trigoni, N.; Markham, A. Randla-net: Efficient semantic segmentation of large-scale point clouds. In Proceedings of the IEEE/CVF Conference on Computer Vision and Pattern Recognition, Seattle, WA, USA, 13–19 June 2020; pp. 11108–11117. [Google Scholar]
- Xiang, T.; Zhang, C.; Song, Y.; Yu, J.; Cai, W. Walk in the cloud: Learning curves for point clouds shape analysis. In Proceedings of the IEEE/CVF International Conference on Computer Vision, Montreal, QC, Canada, 10–17 October 2021; pp. 915–924. [Google Scholar]
- Ma, X.; Qin, C.; You, H.; Ran, H.; Fu, Y. Rethinking network design and local geometry in point cloud: A simple residual MLP framework. arXiv 2022, arXiv:2202.07123. [Google Scholar] [CrossRef]
- Elnashef, B.; Filin, S.; Lati, R.N. Tensor-based classification and segmentation of three-dimensional point clouds for organ-level plant phenotyping and growth analysis. Comput. Electron. Agric. 2019, 156, 51–61. [Google Scholar] [CrossRef]
- Zhang, P.; Kong, C.; Xu, Y.; Zhang, C.; Jin, J.; Li, T.; Jiang, X.; Tang, D. An improved PointNet++ based method for 3D point cloud geometric features segmentation in mechanical parts. Procedia CIRP 2024, 129, 25–30. [Google Scholar] [CrossRef]
- Miao, T.; Zhu, C.; Xu, T.; Yang, T.; Li, N.; Zhou, Y.; Deng, H. Automatic stem-leaf segmentation of maize shoots using three-dimensional point cloud. Comput. Electron. Agric. 2021, 187, 106310. [Google Scholar] [CrossRef]
- Patel, A.K.; Park, E.-S.; Lee, H.; Priya, G.G.L.; Kim, H.; Joshi, R.; Arief, M.A.A.; Kim, M.S.; Baek, I.; Cho, B.-K. Deep learning-based plant organ segmentation and phenotyping of sorghum plants using LiDAR point cloud. IEEE J. Sel. Top. Appl. Earth Obs. Remote Sens. 2023, 16, 8492–8507. [Google Scholar] [CrossRef]
Disclaimer/Publisher’s Note: The statements, opinions and data contained in all publications are solely those of the individual author(s) and contributor(s) and not of MDPI and/or the editor(s). MDPI and/or the editor(s) disclaim responsibility for any injury to people or property resulting from any ideas, methods, instructions or products referred to in the content. |
© 2025 by the authors. Licensee MDPI, Basel, Switzerland. This article is an open access article distributed under the terms and conditions of the Creative Commons Attribution (CC BY) license (https://creativecommons.org/licenses/by/4.0/).