Abstract
Agrivoltaics, an emerging approach that integrates solar energy generation with agricultural production, offers an effective solution to land-use conflicts by enabling the simultaneous production of clean energy and crops. However, the shading effect of photovoltaic (PV) modules significantly alters both the quantity and distribution of light within crop canopies, creating challenges in balancing power output with crop light requirements. This study employs the Rhino–Grasshopper parametric modeling platform, combined with Ladybug and PVsyst, to conduct batch simulations of 44 configuration schemes for an agrivoltaic system in Lianyungang, Jiangsu Province. Annual simulations of the light environment and energy generation were performed, and model accuracy was validated through field measurements using Daily Light Integral (DLI), light uniformity (coefficient of variation, CV), and annual energy yield as key indicators to assess the effects of different module layouts and tilt angles. The results reveal pronounced seasonal variations in the system’s light environment. The tilt angle exhibits a seasonal reversal pattern: higher tilt angles in winter and spring substantially reduce DLI (up to a 44% decrease under high ground coverage ratio, GCR, conditions), whereas moderate tilt angles in summer and autumn enhance light transmission, with low-GCR layouts enabling DLI values exceeding 30.6 mol·m−2·d−1. Light uniformity was highest in the dual-row layout with 0.2 m spacing, maintaining a CV between 0.16 and 0.18. Energy yield peaked at a 30 tilt angle, showing a parabolic response pattern. Overall, this study proposes a photovoltaic module layout design method based on seasonal light distribution characteristics and the balance between agricultural and energy production goals. This method provides a scientific basis for structural layout planning and planting-model design in agrivoltaic systems and contributes to improving light-energy utilization efficiency and agricultural output, thereby achieving synergistic benefits between photovoltaic power generation and crop production.
1. Introduction
As the cornerstone of the modern global energy system, fossil fuels have long dominated the world’s energy supply [,]. Electricity, as the most efficient and convenient form of secondary energy, still relies heavily on fossil fuel combustion for its generation []. However, escalating environmental degradation, intensifying climate change, and the progressive depletion of non-renewable resources such as oil have accelerated the global transition toward a cleaner energy structure. This shift aims to reduce dependence on fossil fuels while promoting the development of renewable energy sources, including wind, solar, and hydropower [,]. Among these, solar energy stands out as one of the most promising and accessible resources due to its abundance, inexhaustibility, and environmental compatibility [].
Although solar technologies have advanced substantially, large-scale centralized PV power plants require extensive land resources. Under arable land protection policies, such installations are typically confined to marginal regions, including deserts and wastelands. This spatial mismatch between power generation sites and consumption centers not only increases transmission costs but also constrains the further expansion of PV energy deployment []. To address the conflict between limited land availability and growing energy demand, the concept of agrivoltaics has emerged []. Agrivoltaics—also known as agrivoltaic systems or agro-photovoltaics—integrates solar power generation with agricultural production by installing PV modules above farmland, greenhouses, or aquaculture ponds. This approach enables “power generation above, cultivation or breeding below.” It offers multiple advantages, including improved land-use efficiency [], economic co-benefits [], and environmental sustainability []. As a result, agrivoltaics has become a critical pathway for advancing energy transition and promoting sustainable agricultural development [,,].
However, coupling PV generation with crop cultivation also presents new challenges. The shading effects of PV modules can alter the microclimate within the system [], influencing key environmental factors such as light availability [], soil temperature [], air temperature and humidity [], and water evaporation []. These factors directly affect crop growth conditions. Among them, solar radiation plays a fundamental role in plant development by regulating photosynthetic efficiency, morphogenesis, and biomass accumulation, ultimately determining crop yield and quality [,]. Therefore, achieving a balance between maintaining high energy generation efficiency and ensuring adequate and suitable solar radiation for crops has become a critical scientific challenge for the advancement of agrivoltaic technology.
Early research on agrivoltaic systems primarily focused on crop adaptability, exploring how different crops respond physiologically to shading and how these responses affect yield. Numerous experimental studies have been conducted on crops such as soybean [], tomato [], wheat [], and grapevine [], analyzing the effects of PV-induced shading on photosynthetic performance, dry matter accumulation, and yield components. Building on this foundation, researchers began investigating PV module materials and light transmittance to mitigate the adverse effects of altered light environments on crop growth. For example, Gnayem et al. [] compared the impacts of various semi-transparent PV roofing materials—including glass, plastic silicon, and others—covering one-third of greenhouse roofs in a Mediterranean environment and found that such PV-integrated systems could simultaneously achieve renewable power generation and higher cucumber yields. Asa’a et al. [] addressed insufficient crop illumination under PV shading by enhancing the light-diffusing properties of PV materials. They fabricated 18 types of crystalline silicon semi-transparent modules and demonstrated that high-scattering PV materials could improve the internal light environment as effectively as commercial diffusive glass, providing valuable guidance for material selection to balance power generation and crop illumination. Jamil et al. [] conducted experiments using CdTe thin-film modules in strawberry cultivation and found that, under 70% light transmittance, strawberry yield exceeded that under full sunlight, while maintaining over 80% yield even at ≥70% transmittance—achieving a win–win outcome for both energy and agricultural productivity.
In addition, some studies have focused on the structural design and spatial layout of photovoltaic modules, such as the type of support structure [,], layout form [,], and array configuration []. These studies provide an important theoretical foundation for optimizing the structure and improving the performance of agrivoltaic systems. Due to the high costs and low repeatability of field experiments, environmental simulation is gradually becoming the mainstream method for analyzing the operational mechanisms and optimization potential of agrivoltaic systems. Compared to field experiments, simulation methods not only offer higher accuracy and applicability but also enable the rapid evaluation of various layout options during the design phase, making them a key tool in agrivoltaic light environment research. However, existing simulation studies are often limited to optimizing a single parameter or setting empirical thresholds, without systematically revealing the comprehensive light-energy response mechanisms under the coupled interaction of module tilt angle, GCR, and layout form.
However, existing research typically focuses on photovoltaic greenhouses and remains limited to field monitoring or single-energy generation simulations. There is a lack of systematic evaluation tools that integrate the configuration of modules, variations in the light environment, crop responses, and energy generation performance, which makes it difficult to quickly iterate and accurately validate design schemes. To address this issue, this study takes an open-field agrivoltaic system in Jiangsu Province as the research subject, constructing a coupled simulation framework with Ladybug and PVsyst. Through the parametric driving of Rhino-Grasshopper, 44 configurations (11 tilt angles × 4 layouts) were modeled and analyzed in batch automation. The study simultaneously explores the interactive effects of ground coverage ratio (GCR), layout form, and installation tilt angles, integrating simulations of solar radiation, shading distribution, and energy generation performance. This research aims to achieve three core objectives: (1) To construct an integrated model based on Ladybug ray-tracing and PVsyst energy generation simulations and verify its accuracy in simulating the agrivoltaic environment; (2) to quantify the environmental response mechanisms of structural parameters and reveal the seasonal variation patterns of the light environment (DLI and CV) under different tilt angles and GCR configurations, as well as the trade-offs with energy generation performance; and (3) to explore suitable layout schemes and tilt angle ranges, using multi-parameter collaborative analysis to determine recommended configurations under the dual constraints of agricultural and energy objectives, providing a directly applicable parametric design guide for engineering practices in similar regions.
2. Materials and Methods
2.1. Experimental Site Description
The experimental site is located in Lianyungang City, Jiangsu Province, China (34.32° N, 119.51° E), situated in the mid-latitude zone within the transition area between the warm temperate and subtropical climatic zones. It represents a typical monsoon climate region of the Huang–Huai–Hai Plain. According to meteorological observations from the past decade, the area has a perennial average temperature of 14.1 °C, an average annual precipitation of 883.6 mm, and a frost-free period of 220 days. The prevailing wind direction is southeasterly, with a multi-year average solar radiation of approximately 4891.7 MJ·m−2, an annual average sunshine duration of 2456.2 h, and an average daily solar radiation of 13.4 MJ·m−2. The region is dominated by a winter wheat–summer maize rotation system, which represents the main cropping pattern in China’s eastern grain production belt and provides reference value for similar mid-latitude regions. Within the project area, PV module steel-frame units were uniformly constructed. Each unit measures 6 m in the east–west direction and 4 m in the north–south direction, with the underside of the mounted PV modules positioned at a net height of 3.8 m above the ground. The modules are arranged in a tightly spaced longitudinal east–west configuration, as illustrated in Figure 1. Monocrystalline silicon PV modules with a rated power of 330 Wp were selected for the site, with detailed specifications provided in Table 1.
Figure 1.
(a) Aerial view of the agrivoltaic system; (b) agrivoltaic system model; (c) interior view of the agrivoltaic system.
Table 1.
Specifications of PV Modules.
2.2. Light Environment Monitoring
The experiment focused on the variation patterns of the light environment within the photovoltaic array area. The testing period was from 1 January to 30 April 2025. The environmental factors measured included both direct solar radiation intensity and scattered solar radiation inside and outside the photovoltaic array. Based on the geometric characteristics of a single-span photovoltaic array, the array was divided along the east–west axis into two typical areas: beneath the photovoltaic modules and between the modules. Solar total radiation intensity sensors were placed at the central position of the north–south axis of the structural unit, with four sets of repeated measurements. Each set included two measurement points: one beneath the module and one between the modules, and two control observation points were set in an open area without shading. All measurement points were uniformly located at a height of 1.5 m above the ground, corresponding to the crop canopy height, as shown in Figure 2.
Figure 2.
Schematic Layout of Monitoring Points.
The radiation sensors used in the experiment were total solar radiation sensors (model: S-LIB-M003) and HOBO micro-meteorological stations (model: H21-USB), both produced by Onset Computer Corporation, Bourne, MA, USA; the sensor accuracy is ±10 W m−2 and the logging interval is 10 min. The total solar radiation energy measured in the experiment was obtained by integrating the radiation intensity over time for each sampling interval.
2.3. Three-Dimensional Model Construction
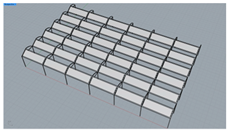
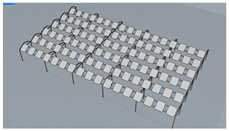
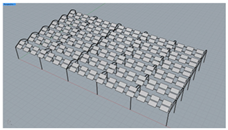
The 3D simulation modeling was conducted using Rhinoceros (Rhino), a NURBS-based surface modeling software widely applied in architectural and engineering design due to its high-precision geometric modeling and strong data interoperability across multiple formats []. To evaluate the effects of different PV module configurations on the light environment, a model with a 7 × 6 array layout (seven modules in the east–west direction and six in the north–south direction) was constructed, consisting of 42 standard steel-frame units. The total simulated area was 1008 m2. Four typical layout configurations, including single-row and double-row horizontal arrangements, were designed. The ground coverage ratio (GCR)—defined as the ratio of the horizontal projection area of PV modules to the total reference area—was selected as a key parameter to analyze its influence on the spatial distribution characteristics of the internal light environment. For each configuration, the installation tilt angle of the PV modules was incrementally increased from 0° to 50°, with a 5° step size, resulting in 11 different tilt settings in total. By driving parametric scripts, 44 configurations can be automatically modeled and updated in a short time, significantly improving efficiency compared to traditional manual adjustments.
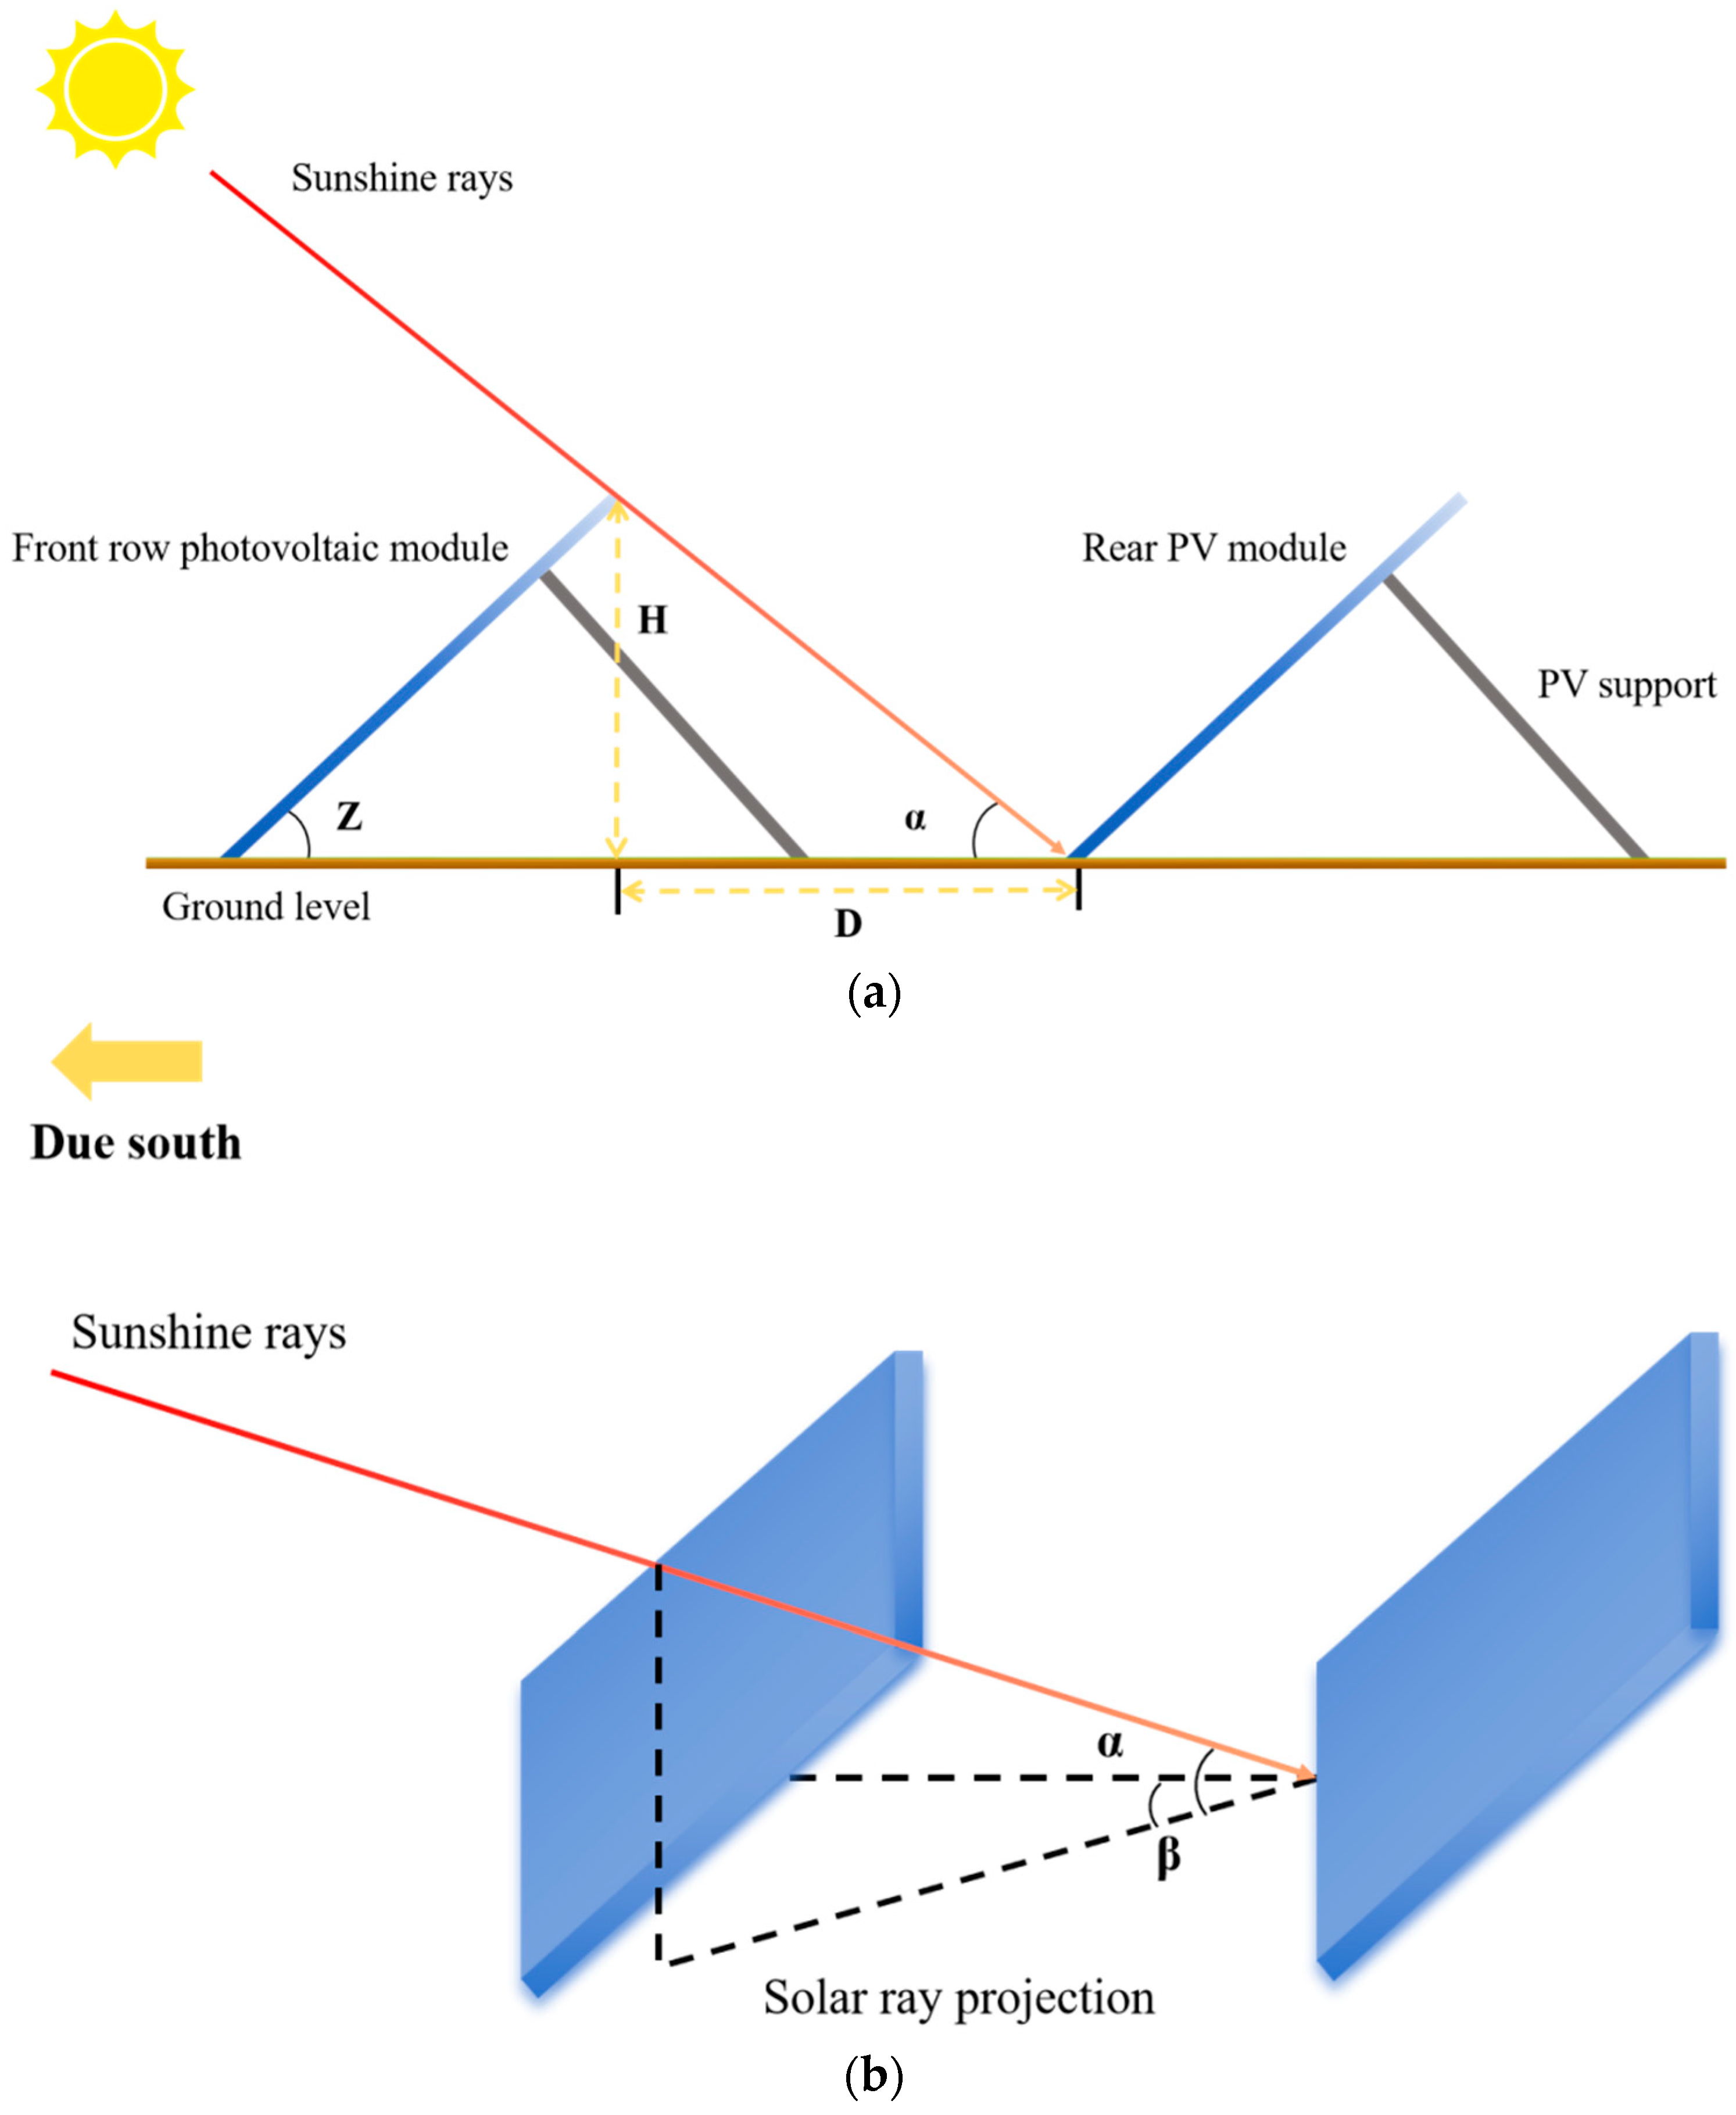
Since the experimental site is located in the Northern Hemisphere, the PV modules were oriented due south (azimuth angle fixed at 0°) to maximize incident solar radiation. Based on this orientation, the modules were mounted at precise inclination angles corresponding to their support frame geometry to ensure optimal solar exposure. When determining the array tilt, sufficient spacing between the front and rear module rows in the north–south direction was maintained to prevent mutual shading. According to the design principle, no shadowing should occur between arrays from 9:00 a.m. to 3:00 p.m. on the winter solstice—the day when the solar altitude is at its annual minimum []. The minimum spacing distance (D) between adjacent PV rows was calculated accordingly, as illustrated in Figure 3.
Figure 3.
(a) Schematic diagram of spacing between PV arrays; (b) Schematic diagram of solar array azimuth.
The calculation formulas for the solar altitude angle and solar azimuth angle are as follows:
where
- is the local geographic latitude, 34.32°;
- δ is the solar declination angle, with a value of −23.5° on the winter solstice;
- ω is the solar hour angle, which is −45° at 9:00 a.m., 0° at solar noon, and increases by approximately 15° per hour (negative in the morning and positive in the afternoon);
- H represents the height difference between the highest point of the front-row PV module and the lowest point of the rear-row module, which varies with the installation tilt angle.
From Equations (1)–(5), Equation (6) is obtained, which permits calculation of the minimum spacing between front and rear PV rows. By setting the center-to-center spacing of fixed PV arrays greater than this local minimum, zero shading from the front row onto the rear row is ensured between 09:00 and 15:00. The layout schemes listed in Table 2 have all been verified to satisfy this unshaded condition.
Table 2.
Configuration parameters of different PV module layout schemes.
2.4. Light Environment Simulation Software
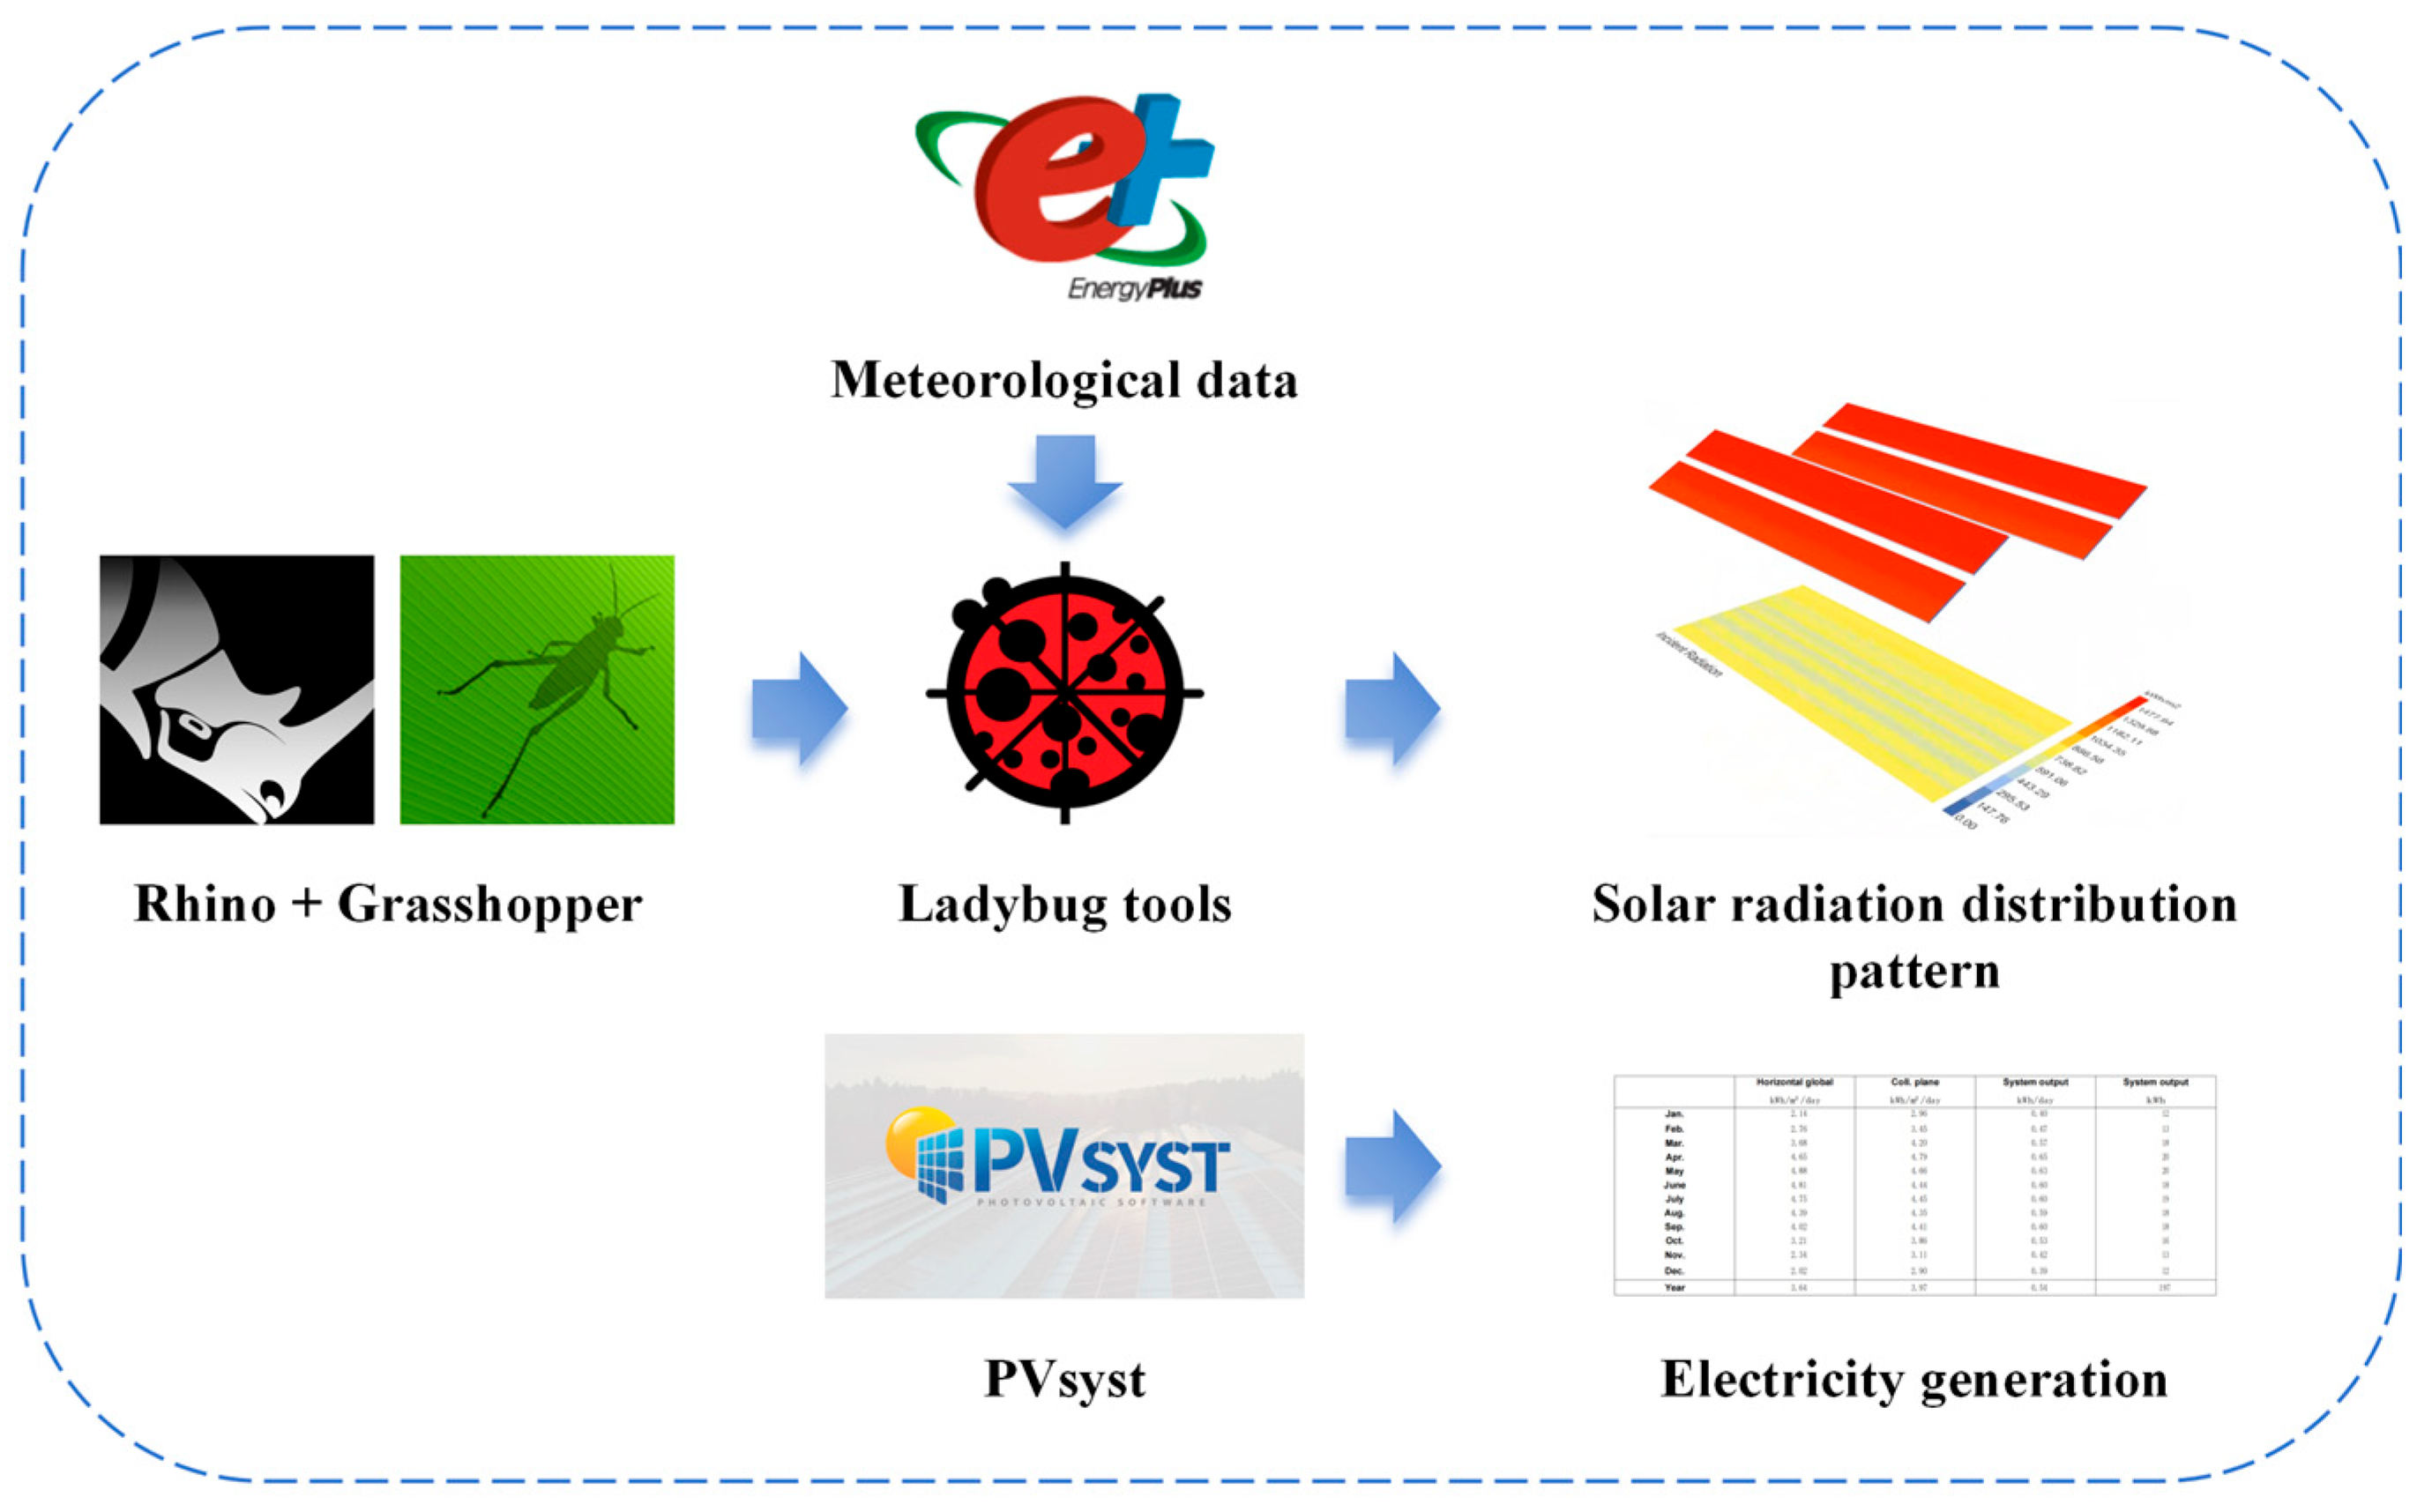
Grasshopper is a parametric modeling plugin for the Rhino platform, enabling geometric generation and logical control through visual node-based programming. It can be deeply integrated with various analytical tools for advanced design and simulation tasks. Ladybug, a Python-based visual analysis tool, supports the analysis and visualization of multiple environmental parameters, including meteorological data, solar paths, radiation intensity, and light distribution. Ladybug conducts light environment analysis by calling the Radiance lighting simulation engine. Radiance employs a Monte Carlo backward ray-tracing algorithm to precisely calculate the propagation, reflection, scattering, and absorption of light in space. It is widely used in building daylighting, solar access analysis, and indoor/outdoor light environment studies, and has become one of the internationally recognized standard tools for architectural light environment simulation [,].
2.5. Meteorological Data and Simulation Grid Setup
When performing solar radiation and light environment simulations using the Ladybug plugin, meteorological data must be incorporated. The EnergyPlus Weather (EPW) file format is widely used in building and environmental simulations and is standardized and released by the U.S. Department of Energy’s Office of Energy Efficiency and Renewable Energy (DOE EERE) in collaboration with the National Renewable Energy Laboratory (NREL). EPW data are constructed based on a Typical Meteorological Year (TMY), which integrates long-term hourly observational records and uses statistical selection methods to identify the year that best represents local long-term climatic characteristics. The dataset records 8760 h per year at hourly resolution, providing high-precision meteorological input for solar radiation simulation and light environment analysis [].
In this study, EPW data from the meteorological station closest to Lianyungang, Jiangsu Province were used as input to ensure that the simulation accurately reflects local climatic conditions. A 1 h calculation timestep was set for monthly radiation analysis. To comprehensively evaluate light environment characteristics, the simulation period was set based on the longest daylight day of the year (summer solstice), from 06:00 to 18:00, covering the main photosynthetically active periods for crops across different seasons. Considering the canopy structure of most crops suitable for agrivoltaic systems during their growth stage, the calculation plane was set at 1.5 m above the ground to accurately represent the light environment within the crop canopy. To precisely capture shading effects caused by PV modules, a high-resolution simulation grid of 0.1 m × 0.1 m was employed, balancing computational efficiency with the accuracy requirements for light environment analysis in open-field agrivoltaic systems.
2.6. Power Generation Simulation
Although this study primarily focuses on analyzing the availability and uniformity of light within the greenhouse, a simultaneous simulation of PV system power generation is necessary to comprehensively assess the system’s overall performance. The PVsyst software (v 7.4.8) was used to simulate power output under different PV module coverage configurations. PVsyst is one of the most widely used international tools for PV system performance analysis. It can accurately predict the hourly power generation of a PV plant throughout the year by considering meteorological data, module and inverter specifications, shading conditions, and system losses. Through this simulation, the trade-offs between light environment optimization and power generation performance under various installation angles and layout schemes can be quantified, as shown in Figure 4, providing a valuable reference for the integrated optimization of system structural parameters.
Figure 4.
Coupled light environment–power generation simulation framework for agrivoltaic systems.
2.7. Light Environment Evaluation Indicators
Photosynthetically Active Radiation (PAR) refers to the portion of the solar spectrum between 400 and 700 nm that is utilized by plants during photosynthesis. PAR is a crucial parameter in plant growth, influencing water use efficiency, leaf gas exchange, and overall photosynthetic activity. The Daily Light Integral (DLI) represents the total amount of PAR received over the course of a day. In agricultural cultivation, DLI is an essential metric for quantifying photosynthetically active radiation and plays a critical role in crop management and scientific research []. Simulation software typically outputs results in kWh·m−2, which can be converted to average instantaneous irradiance (W·m−2). By further multiplying by a factor of 2.02, PAR in μmol m−2 s−1 can be obtained. Integrating PAR over time yields the DLI in mol m−2·d−1 [].
Due to the opaque nature of PV modules, shaded areas exist within agrivoltaic systems, which can impede photosynthesis and reduce growth uniformity among crops. Therefore, maintaining a uniform light distribution is critical for crop cultivation within the system. The coefficient of variation (CV) is employed to quantify the variability of ground-level light distribution. CV is calculated as the ratio of the standard deviation to the mean []. A lower CV indicates that light values are concentrated around the mean, reflecting a more uniform distribution, whereas a higher CV signifies greater heterogeneity in light distribution across the analyzed area.
where
- μ is the mean value;
- σ is the standard deviation;
- n is the number of discretized grid cells within the calculation domain;
- represents the PAR at the i-th grid point (kWh·m−2);
- denotes the average PAR over all grid points (kWh·m−2).
3. Results
3.1. Model Validation
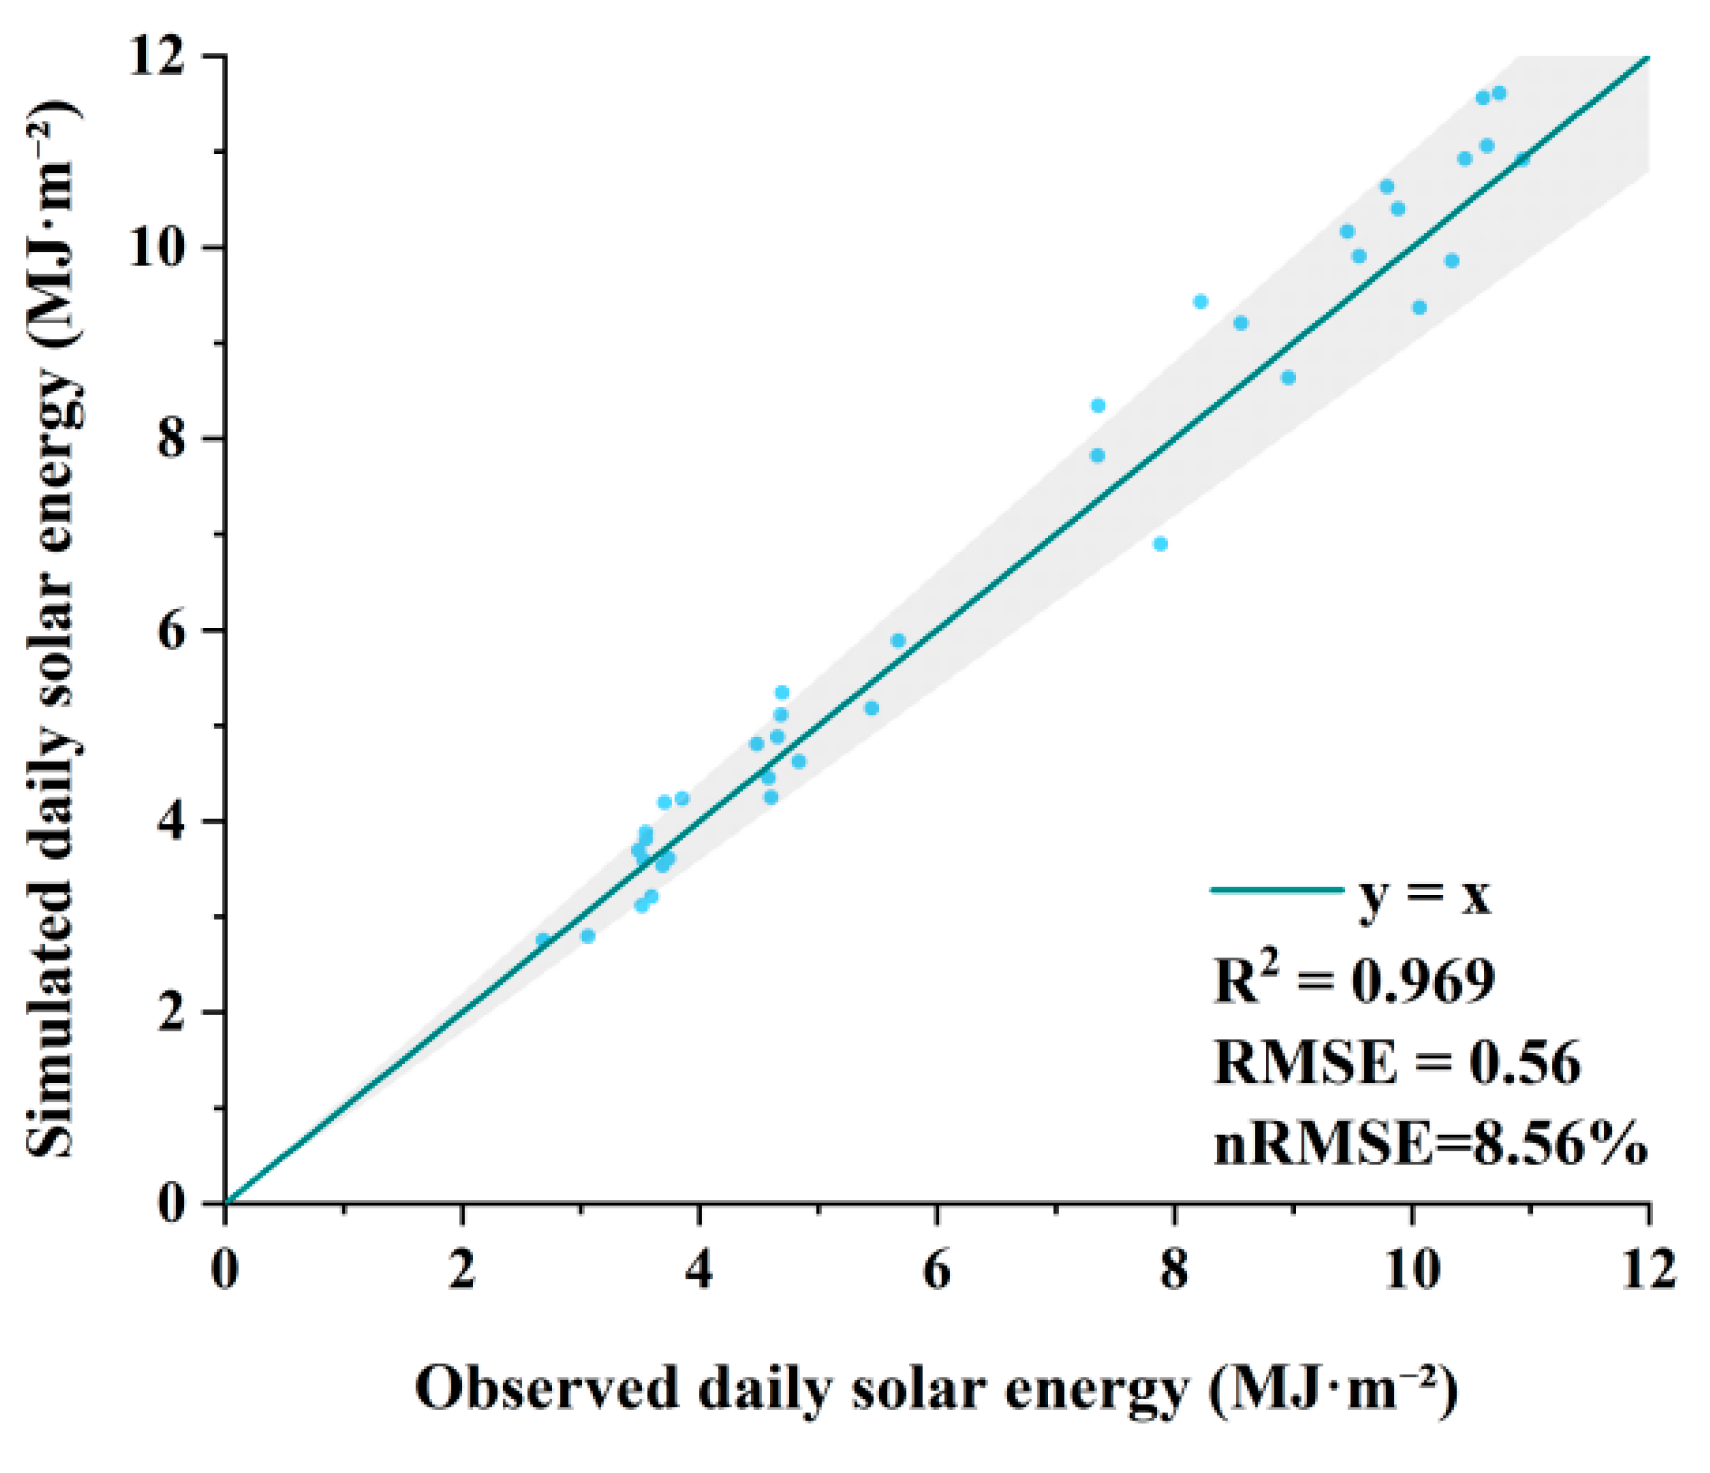
To assess the reliability of the Ladybug simulation results, this study deployed solar total radiation sensors at the Lianyungang test site from January 2025 to April 2024 to obtain daily integral values for comparison with the corresponding simulated values. Ten days of data were randomly selected each month, and after removing outliers, a total of 40 valid samples were obtained for model accuracy verification. This study used three indicators—R2, RMSE, and nRMSE—to evaluate the model’s goodness of fit and error magnitude. R2 measures the proportion of variance explained by the model, representing the correlation between simulated and measured values. The closer the value is to 1, the better the fit. RMSE measures the average error between simulated and observed values, with units identical to the measured values. nRMSE normalizes RMSE to the mean of the measured values, with smaller values indicating smaller errors. The threshold for judgment follows the recommended standard of Willmott []. The validation results, shown in Figure 5, indicate good agreement between the simulated and measured values, with R2 reaching 0.969, RMSE being 0.56 MJ·m−2, and nRMSE at 8.56%, below the high-accuracy threshold of 10%. This suggests that the Ladybug-Radiance model can reliably estimate the daily solar radiation within the agrivoltaic system. There is no significant systematic bias between the measured and simulated results, thus validating the reliability of the light environment simulation results in this study.
Figure 5.
Model validation: Comparison of measured and simulated daily integrated radiation. Blue dots: measured (x-axis) vs. simulated (y-axis) solar irradiance.
3.2. Typical Daily Solar Shadow Distribution
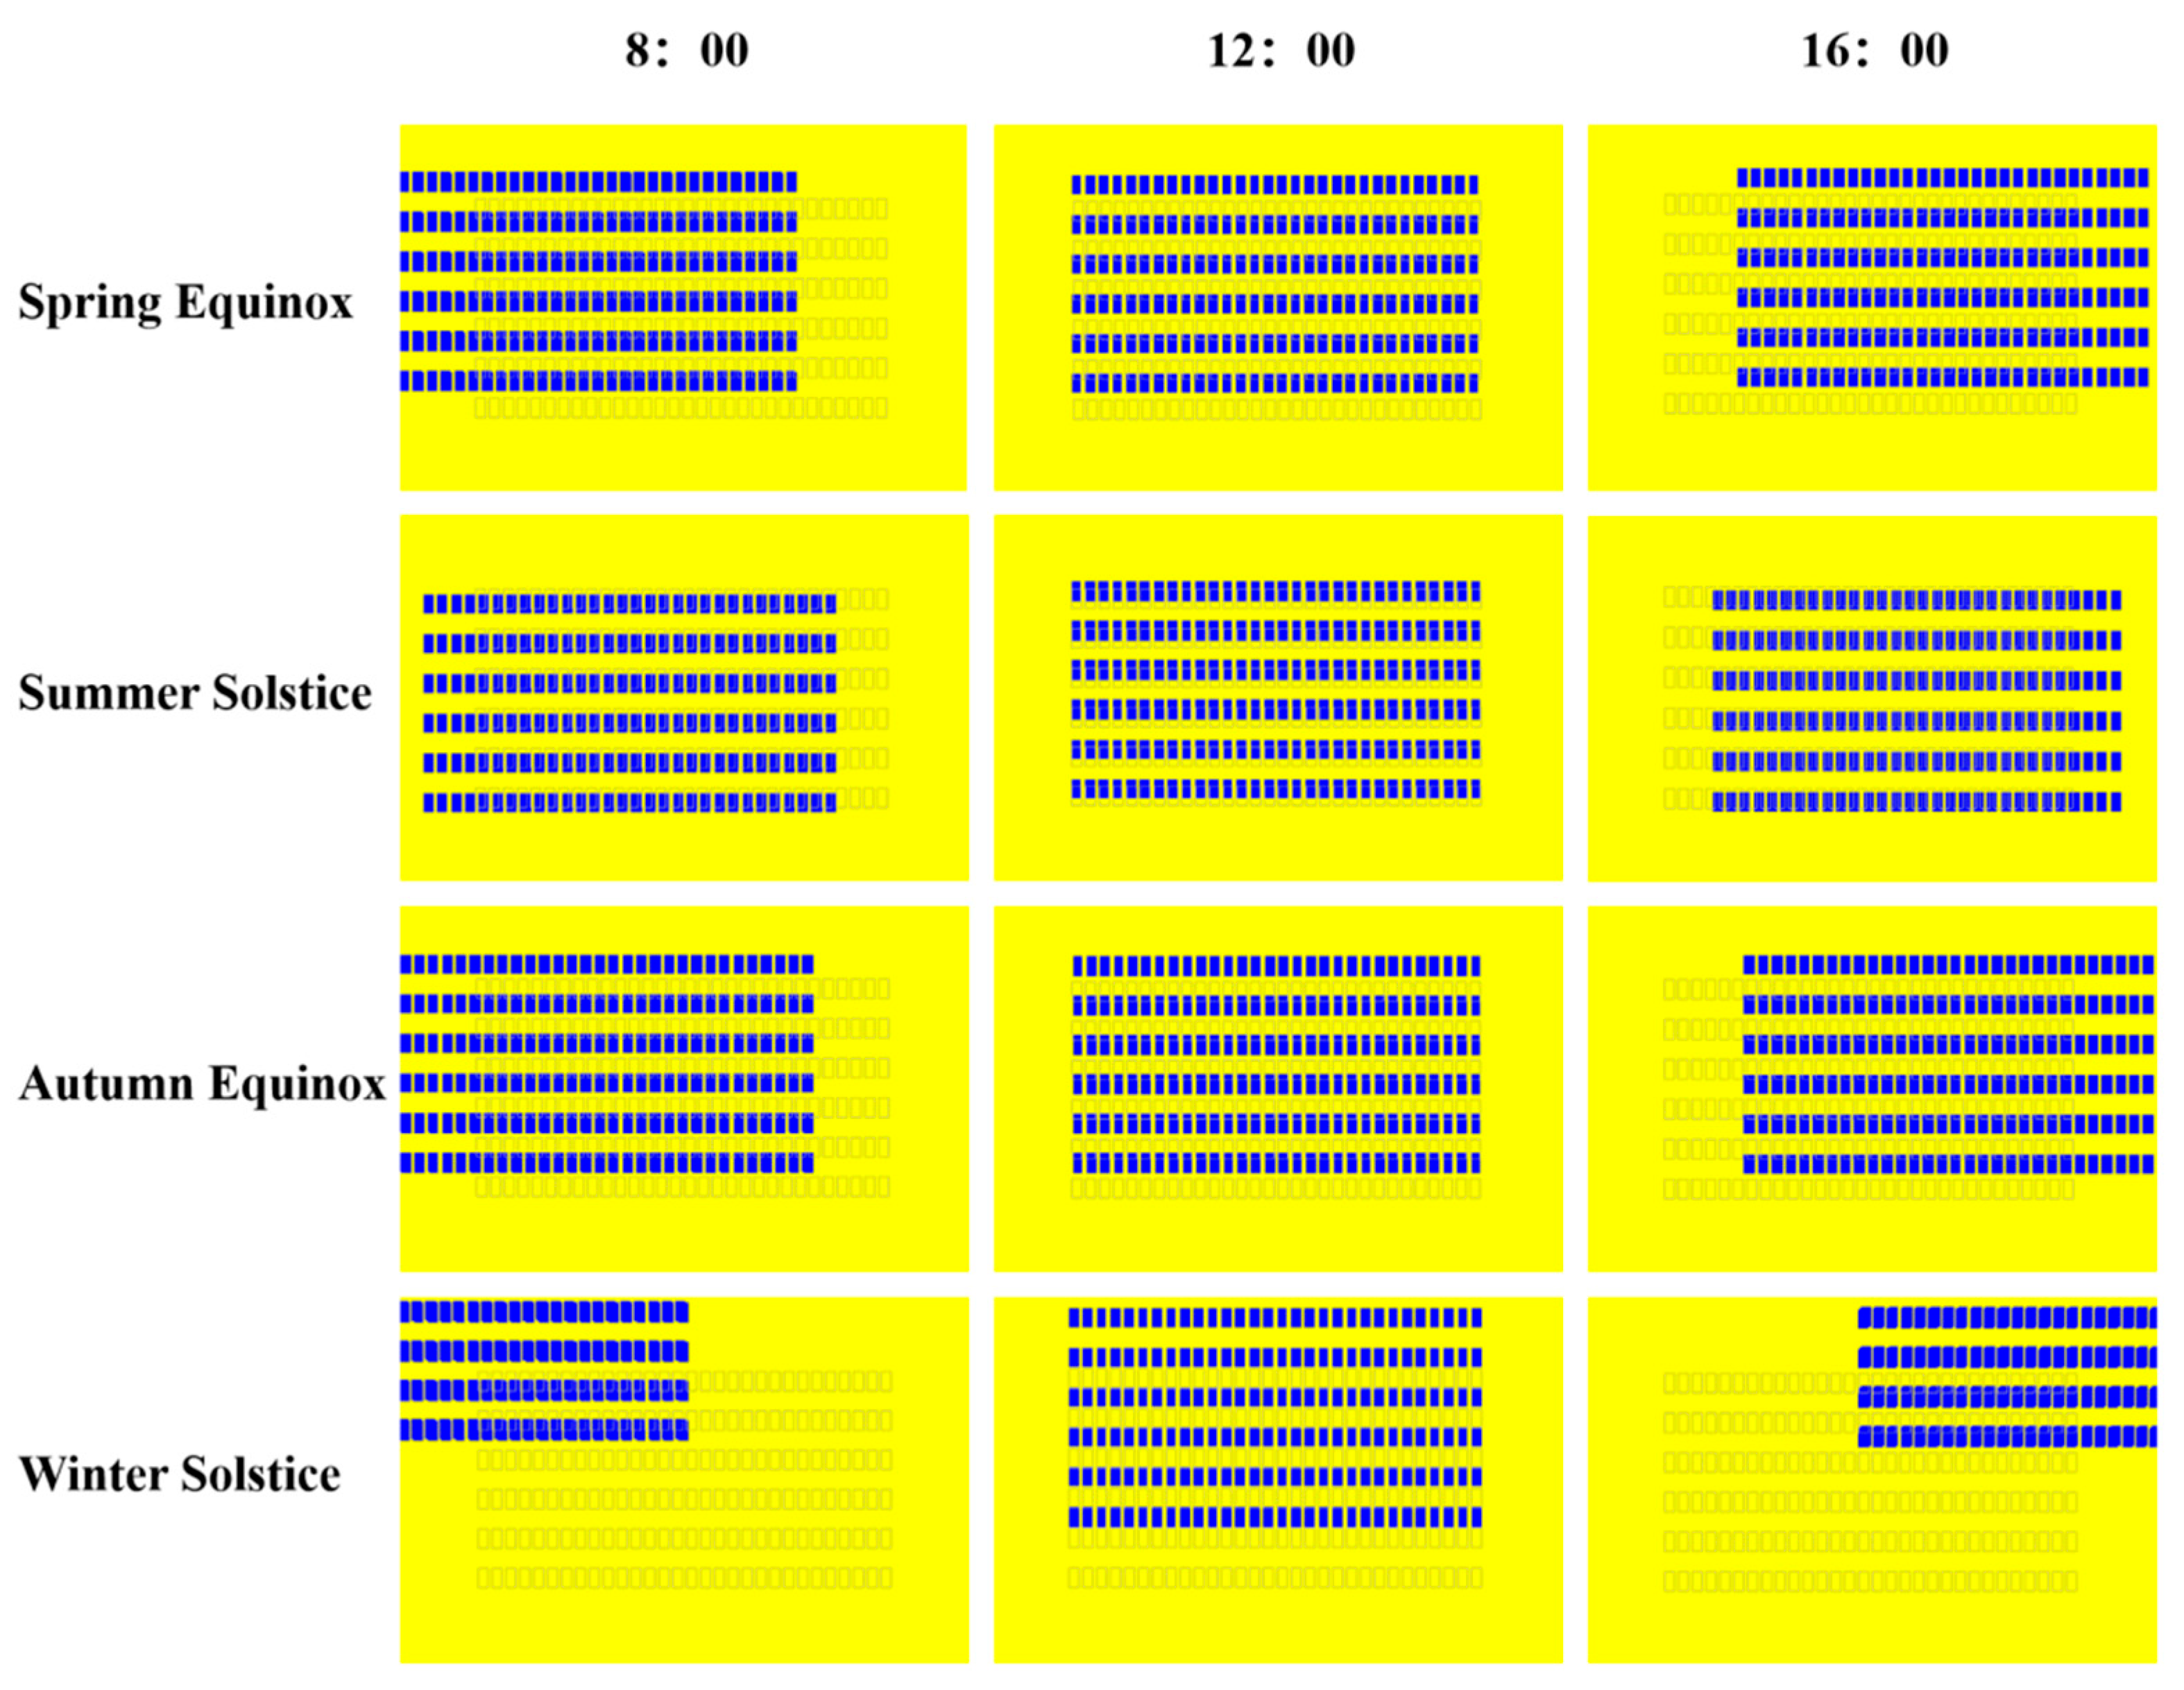
The shadow distribution of PV modules was simulated at three representative times—morning (08:00), noon (12:00), and late afternoon (16:00)—on the spring equinox, summer solstice, autumn equinox, and winter solstice of a typical year. As shown in Figure 6, during the spring, shadows were primarily concentrated in the inter-row areas of the PV array, while the area directly beneath the first southern row of PV modules remains largely unobstructed throughout the day, forming a distinct striped pattern. At 08:00, due to low-angle sunlight from the east, shadows extend approximately 9 m from the eastern edge of the array. At noon, shadows fully cover the interior of the array, reaching their maximum coverage for the day. By 16:00, they gradually shift eastward. Within these striped shadow zones, alternating blue (shaded) and yellow (unshaded) areas create a regularly spaced pattern. During the summer solstice, the solar altitude reached its annual maximum, significantly shortening PV module shadows and reducing shadowed areas. The areas directly beneath the modules remain shaded for most of the day, but north–south variation is minimal. In contrast, the inter-row areas receive ample sunlight, showing a marked improvement in light distribution compared with winter and spring.
Figure 6.
Spatiotemporal Distribution of Shadows.
At the autumn equinox, the solar declination returns to the equator, resulting in light conditions similar to those observed in spring. During the winter solstice, however, the solar altitude drops to its annual minimum, causing shadows to shift noticeably northward. At 08:00, the southern four rows of inter-row and under-module areas remain exposed to sunlight, while shadows extend approximately 20 m from the eastern edge of the array. At 12:00, shadows slightly shift southward and remain confined within the array. Although the areas under modules still receive some direct radiation, shadowing leads to a highly uneven light distribution throughout the day.
3.3. Impact of Tilt Angle Variation on Internal DLI Under Different Configurations
As shown in Figure 7, the daily light integral (DLI) within the system exhibited a typical annual pattern- lowest in winter, highest in summer, and intermediate in spring and autumn. Across all four PV layouts, DLI generally increased and then decreased over the year, with a gentle decline in July. Seasonal responses to tilt angle adjustments differ significantly in both direction and sensitivity. During spring and winter (January–March, October–December), DLI is highest at 0° tilt and declines sharply with increasing tilt. For example, under the T1 layout, DLI in January decreased from 10.86 to 6.04 mol m−2 d−1 as tilt increased from 0° to 50° (−44.38%), while December showed a similar drop of 47.34%. In contrast, reductions under T2–T4 are more moderate (24–28%), indicating that excessive tilt under low solar altitude significantly limits light availability. At the same tilt angle, lower GCR layouts transmit more light: in January at 0°, T2–T4 record DLI values around 13.3–13.6 mol m−2 d−1, notably higher than T1, and are less sensitive to tilt changes due to weaker inter-module shading.
Figure 7.
Monthly variation in DLI with installation tilt angle under different photovoltaic module layouts; (a) T1 configuration; (b) T2 configuration; (c) T3 configuration; (d) T4 configuration.
In autumn (e.g., September), higher solar altitude reduced DLI loss from tilt, with decreased of only 0.9–2.8% across layouts, though T1 remained the most sensitive. In spring to early summer (March–April), this sensitivity further weakens, with reductions of 5–10% and minimal differences among layouts, reflecting limited structural impact under moderate solar altitude. By summer (March–April), all layouts reach their annual DLI peak at 50° tilt. T1 shows the largest increase (23.06% in June), while T2–T4 rise by about 14%. Higher solar altitude and radiation enhance light penetration in inter-row areas, with low-GCR layouts outperforming T1. In June at 50° tilt, T2–T4 achieve DLI values of 30.6 mol m−2 d−1, compared to 26.84 mol m−2 d−1 for T1. These results demonstrate that DLI sensitivity to tilt is strongest in winter, weakens in spring and autumn, and reverses in summer, when higher tilt improves light distribution and favors low-GCR layouts.
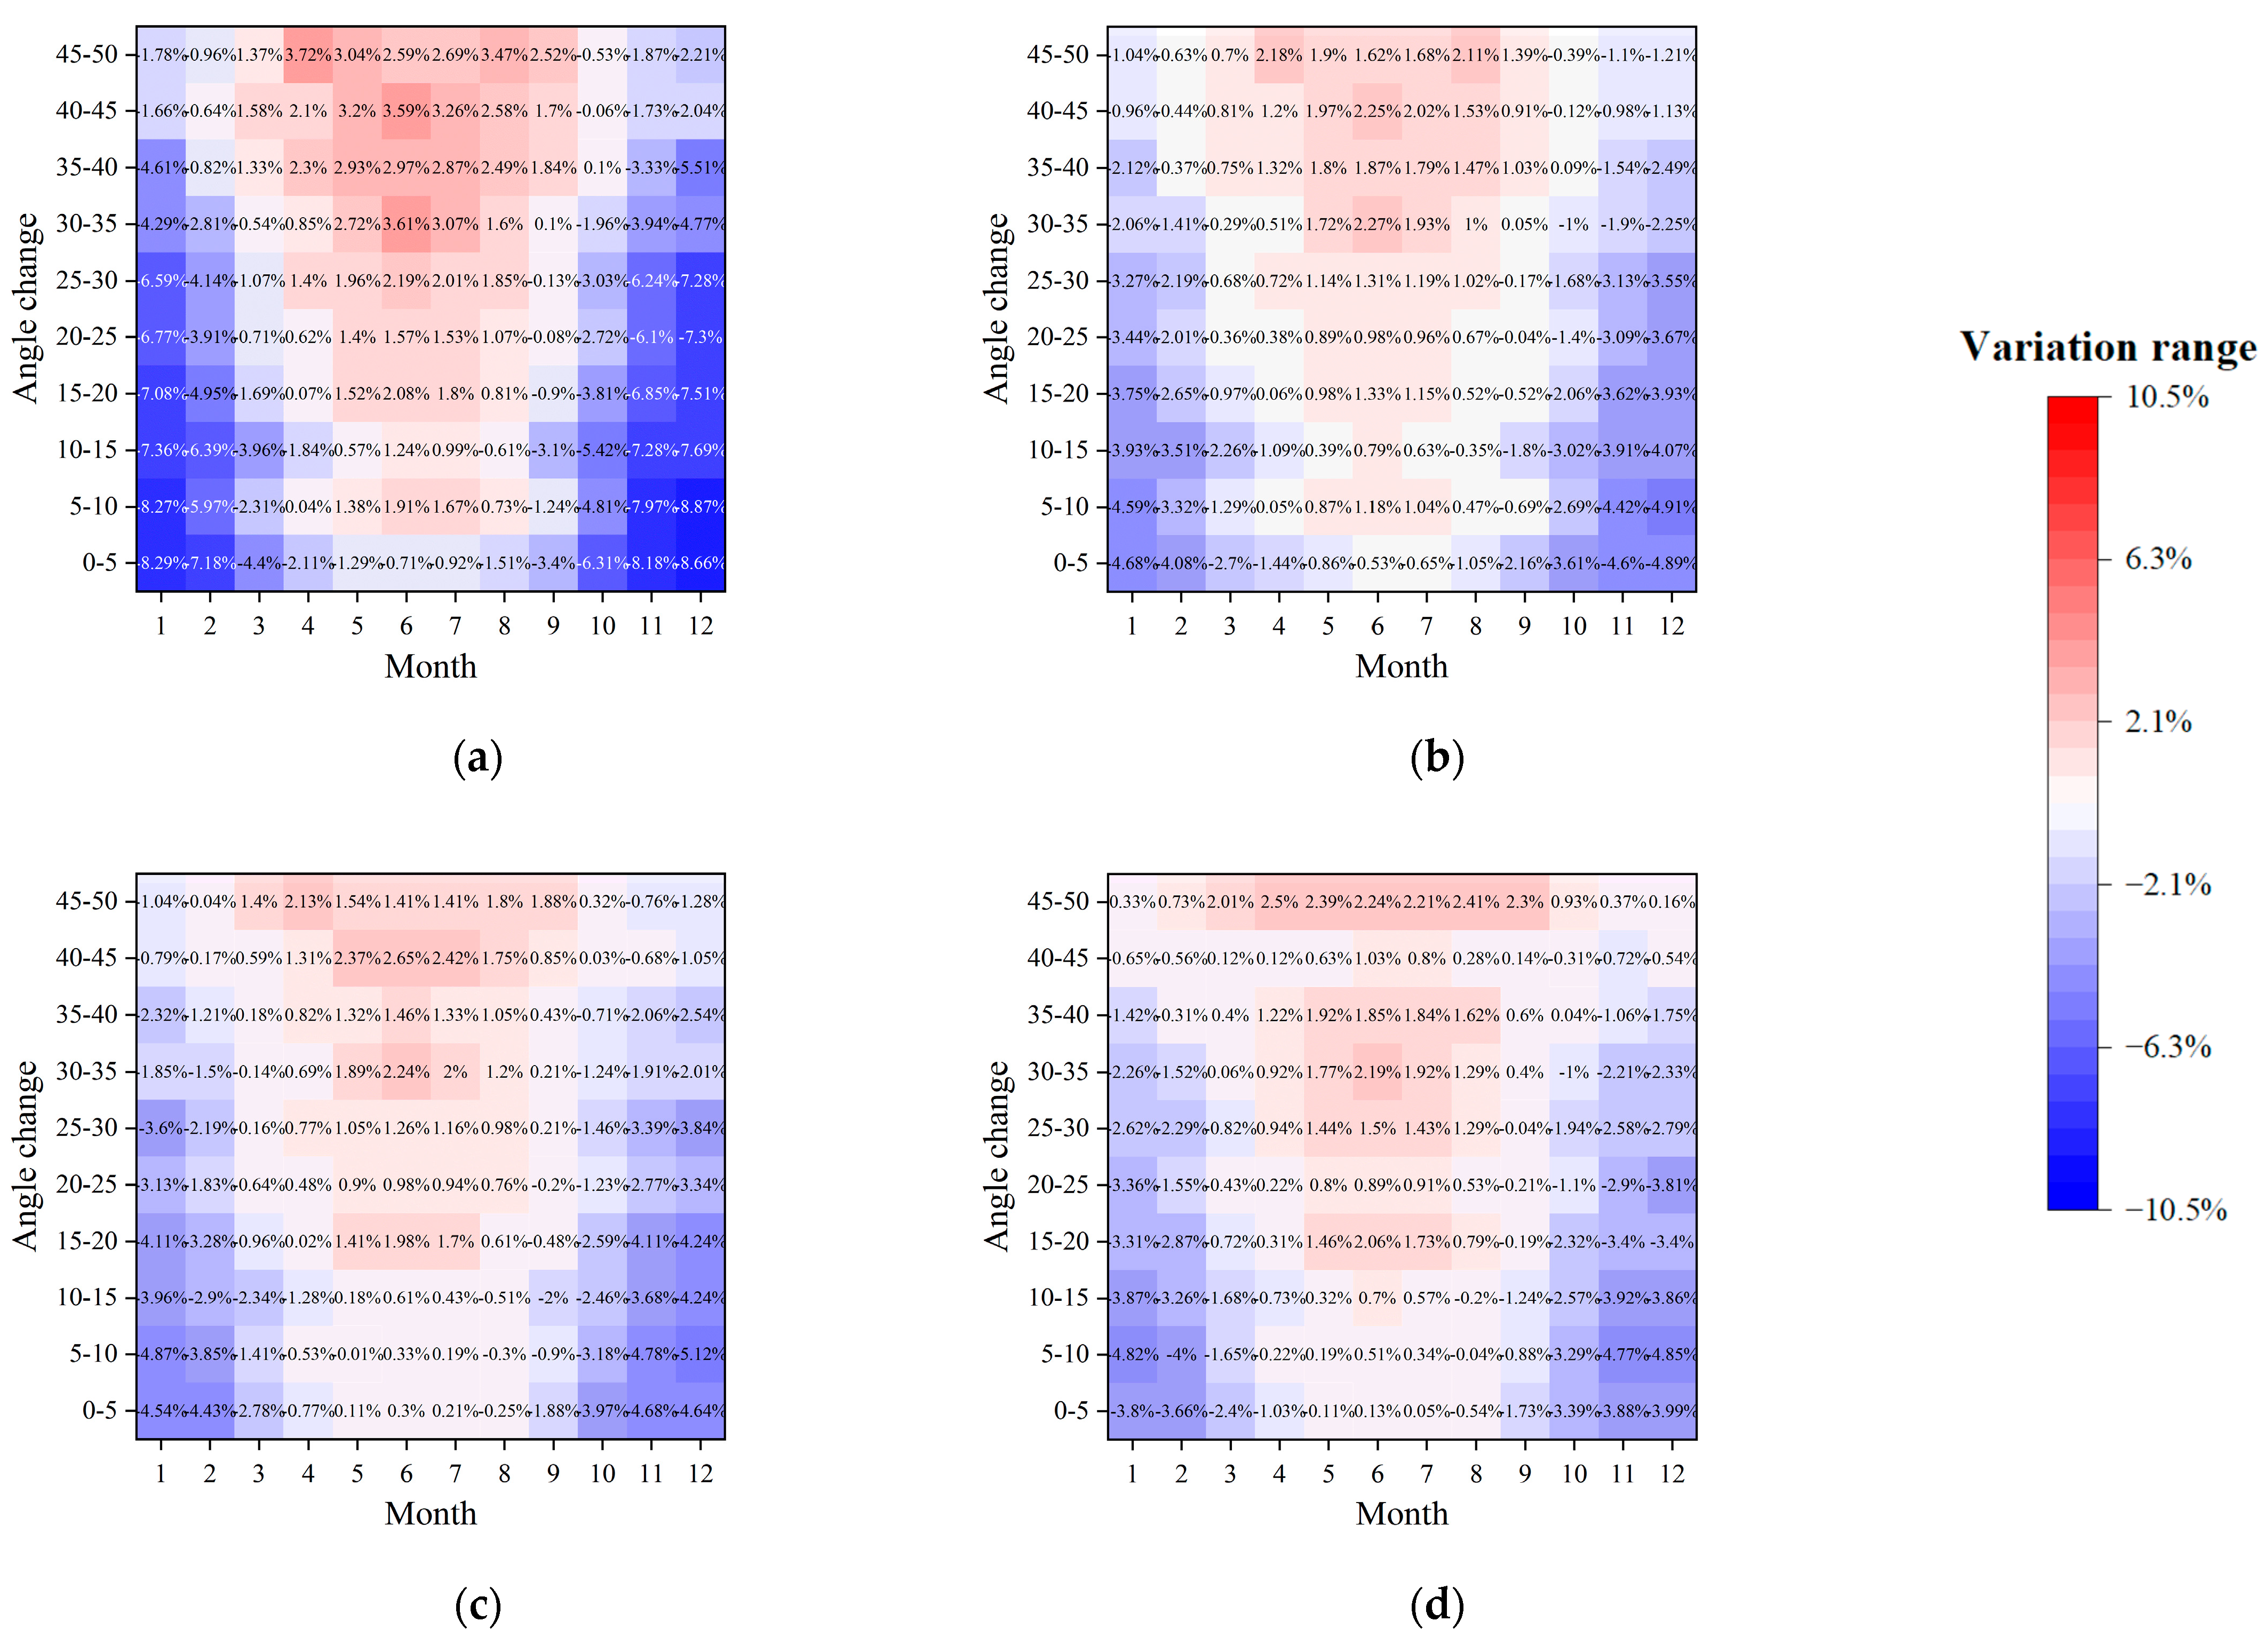
As illustrated in Figure 8, the DLI response to incremental increases in PV module tilt angle (in 5° step) showed distinct seasonal patterns across different layouts. In the high-GCR T1 layout, the most significant decline occurs in winter (January and December), with DLI decreasing by an average of 6% per 5° increment and a maximum single-step reduction of 8.29%. The most rapid decline appeared at low tilt angles (0–20°), while the decrease gradually weakens to below 2% at higher angles (40–50°). In contrast, the low-GCR layouts T2, T3, and T4 exhibited much lower winter sensitivity, with average DLI reductions of 2.98%, 3.02%, and 2.58% per 5° increment, and maximum reductions below 4.68%, indicating better adaptability to tilt changes under lower GCR conditions.
Figure 8.
Monthly variation in DLI sensitivity to tilt angle under different PV module configurations; (a) T1 configuration; (b) T2 configuration; (c) T3 configuration; (d) T4 configuration.
During the high-radiation summer period (May–July), the trend reversed: DLI increased steadily with increasing tilt angle, averaging a 2% rise per 5° increment and reaching a maximum of 3.61% in T1, suggesting that larger tilt angles enhanced solar radiation capture in summer. Low-GCR layouts showed more moderate increases (1.07–1.32% on average, maximum of 2.65%), indicating weaker tilt sensitivity under abundant solar radiation. In transitional seasons (March–April and September–October), DLI first declined slightly at low to moderate tilt angles (0–40°) and then increased modestly (0.07–3.72%) at higher angles, reflecting weak overall tilt sensitivity. T2–T4 showed even smaller variations during these periods, further indicating that tilt angle had limited influence on light distribution under intermediate solar altitude conditions.
3.4. Impact of Tilt Angle Variation on Light Uniformity Under Different Configurations
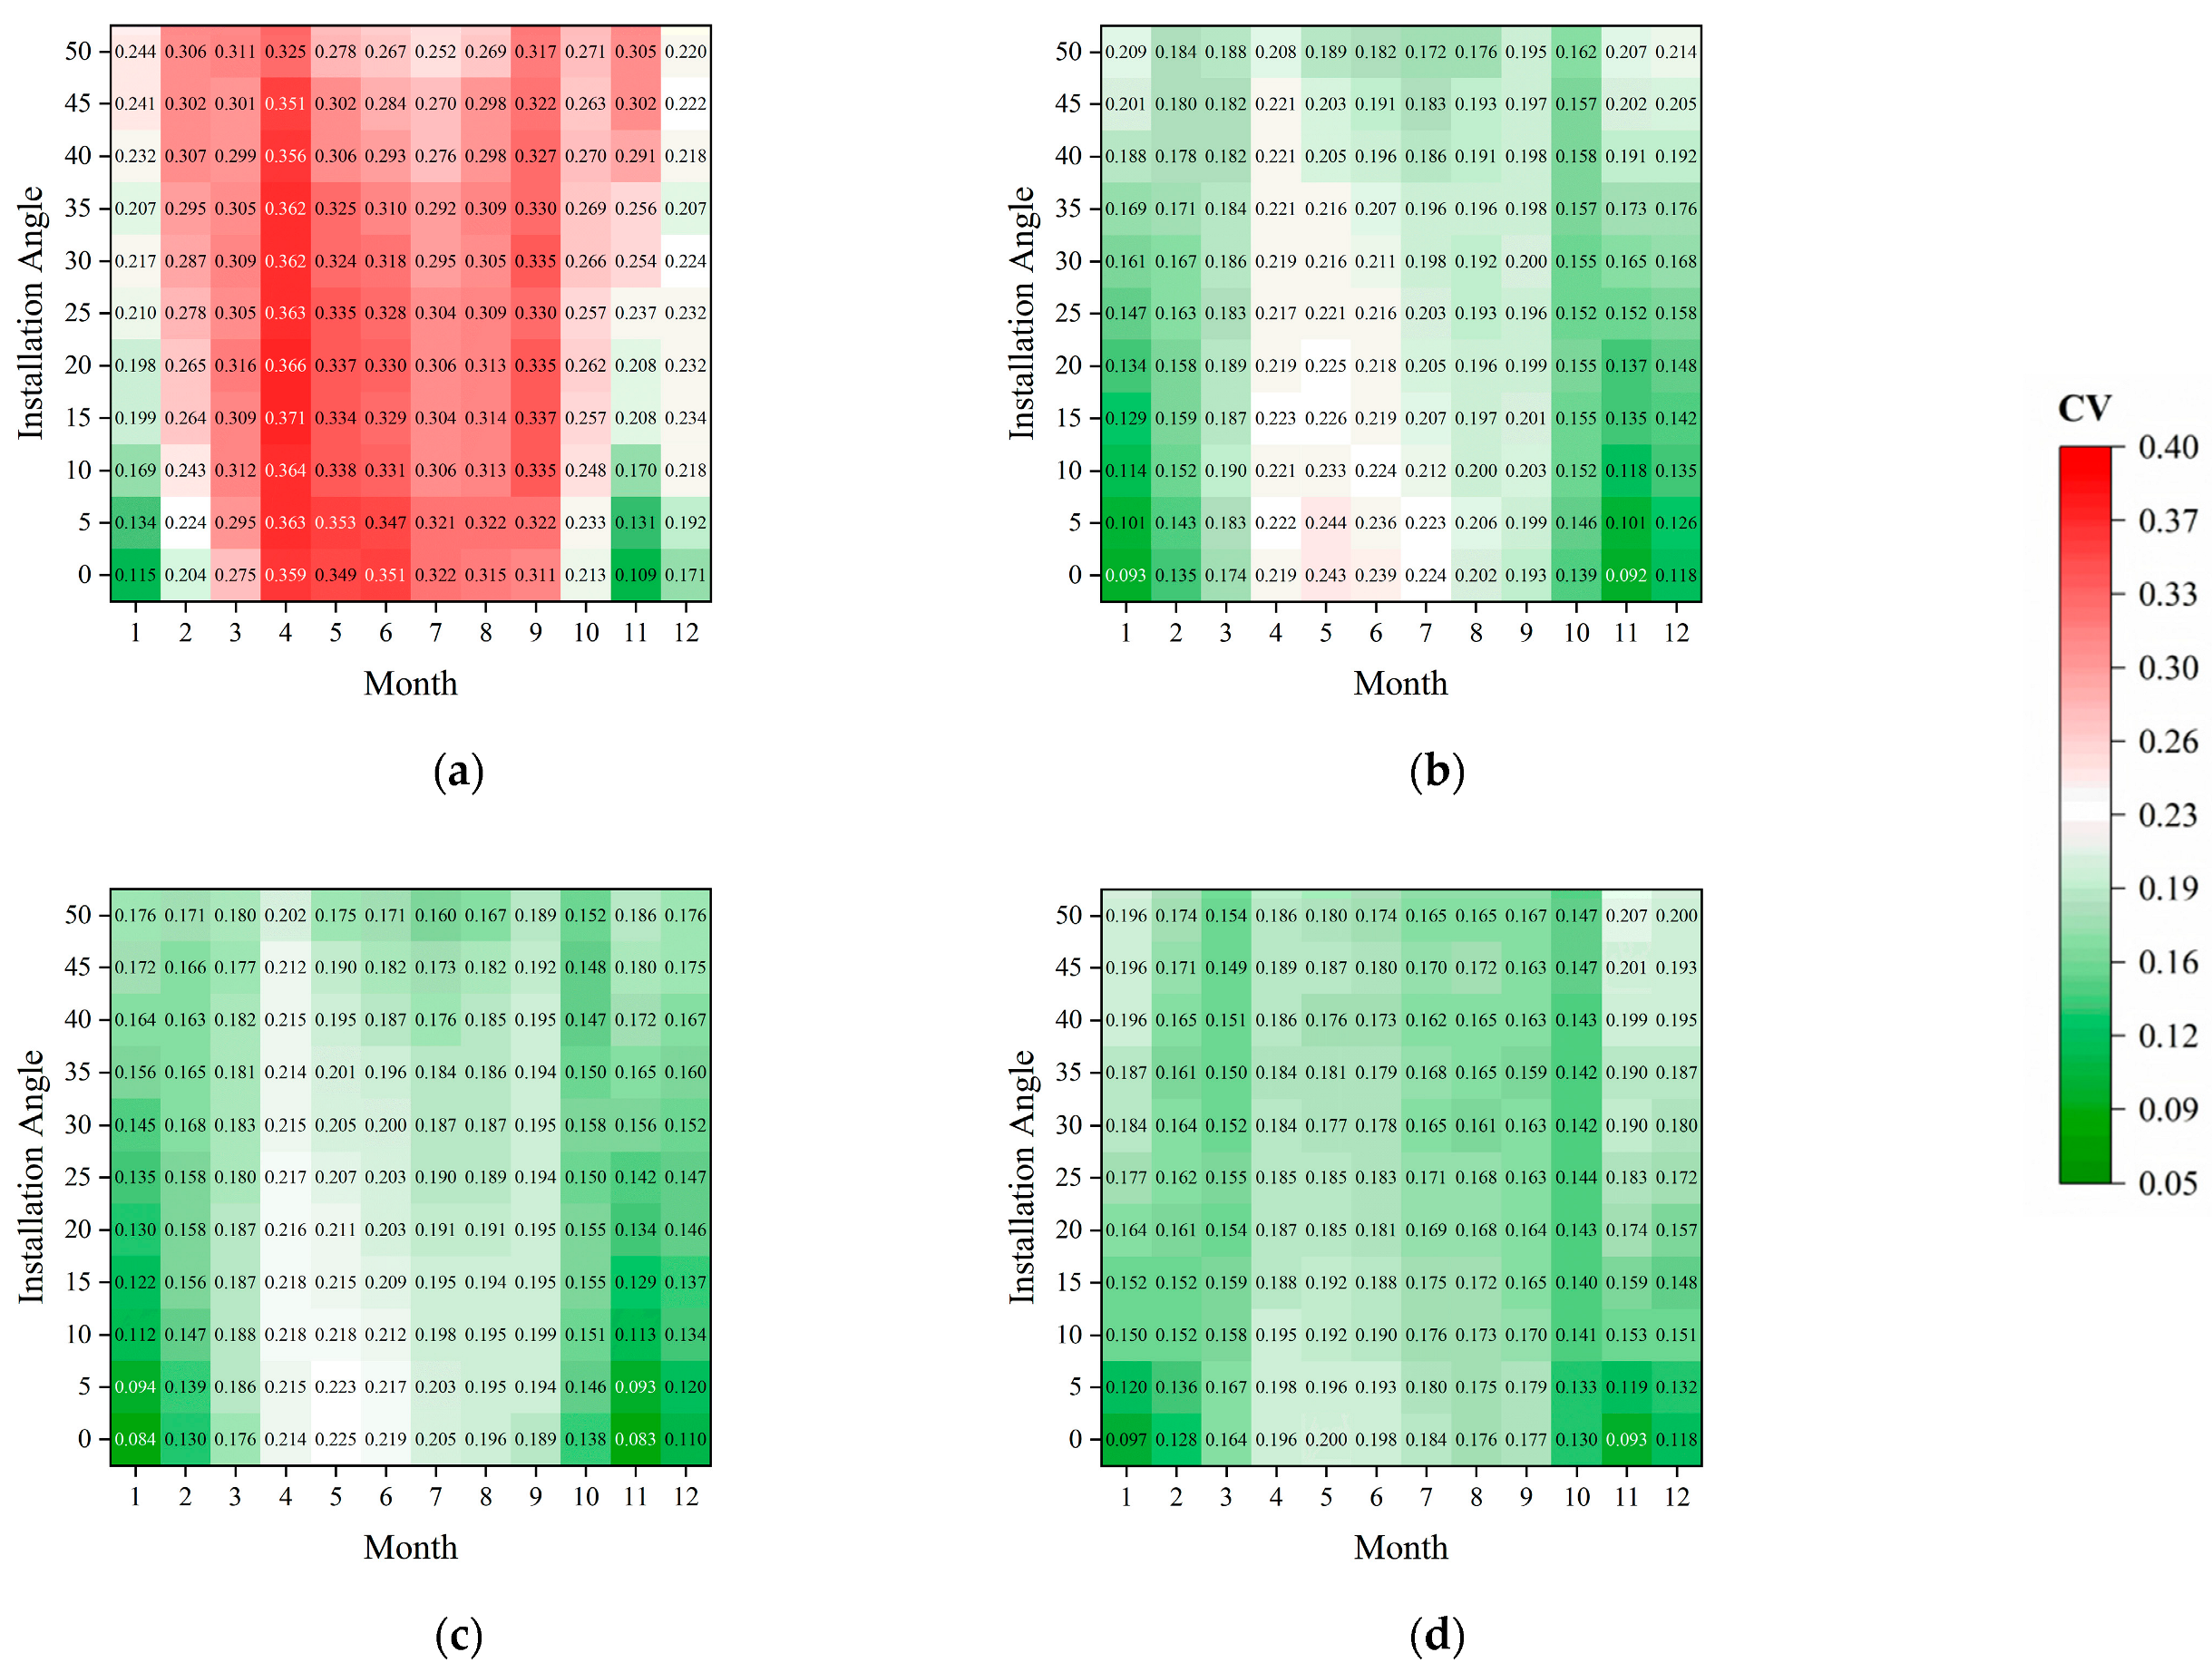
As shown in Figure 9, clear seasonal patterns in the coefficient of variation (CV) are observed across all PV module layouts, with T1 exhibiting the highest CV value (0.12–0.37) throughout the year, indicating the poorest light uniformity. During low-irradiance periods in winter, light uniformity improves at small tilt angles: at 0° tilt, the CV reaches its annual minimum of 0.12, whereas increasing the tilt to 50° raised it to 0.24. In contrast, higher tilt angles during summer, when solar altitude is greater, help reduce CV and enhance uniformity. Transitional months such as April and September show the highest CV values at equivalent tilt angles, as differences between under-module and inter-row areas are amplified by solar trajectory changes. These findings highlight the strong seasonal dependence of light uniformity on module tilt in the T1 layout.
Figure 9.
Annual variation in light uniformity (CV) with installation tilt angle under different PV module layouts; (a) T1 configuration; (b) T2 configuration; (c) T3 configuration; (d) T4 configuration.
The T2 layout exhibited better performance than T1, maintaining CV values between 0.09 and 0.24 annually. At small to moderate tilt angles (0–25°) in winter and spring, T2 achieved relatively high uniformity. However, increasing the tilt angle beyond this range resulted in a similar CV trajectory to T1, with values rising from 0.10 to 0.21. In summer, T2 offered clear advantages over T1, with lower CV values under the same tilt angles. Nevertheless, CV values still exceeded 0.23 in some months, indicating limited ability to regulate uniformity under specific structural and seasonal conditions.
In contrast, the T3 and T4 layouts showed more stable and uniform light environments. For T3, CV values remained within 0.08–0.23 throughout the year, with minimal fluctuation across tilt angles. Its CV stabilized around 0.17 in summer and remained within 0.16–0.18 in winter, with a maximum CV of 0.23 even at large tilt angles. T4 performed similarly but sightly better overall, with CV values between 0.09 and 0.21. During spring and winter, CV value of T4 was 0.10–0.018 lower than T1 and 0.01–0.05 lower than T2, and from April to September, it maintained superior uniformity at low and low medium tilt angles compared with T3. However, in certain low-irradiance months and tilt angles, Although T4′s CV was slightly higher than T3′s under some low-irradiance conditions, its annual mean CV remained the lowest (0.16–0.18).
Overall, T1 and T2 offered limited improvement in light uniformity within PV agriculture systems and performed particularly at high solar altitudes and large tilt angles. In contrast, T3 and T4 maintained relatively low CV values and superior uniformity throughout the year. Among all layouts, T4 provided the most stable light distribution, maintaining annual mean CV values within 0.16–0.18 across tilt angles, which represented a clear improvement over T1 and T2, and a slight advantage over T3.
3.5. Annual Energy Yield of Different PV Module Layouts and Installation Tilt Angles
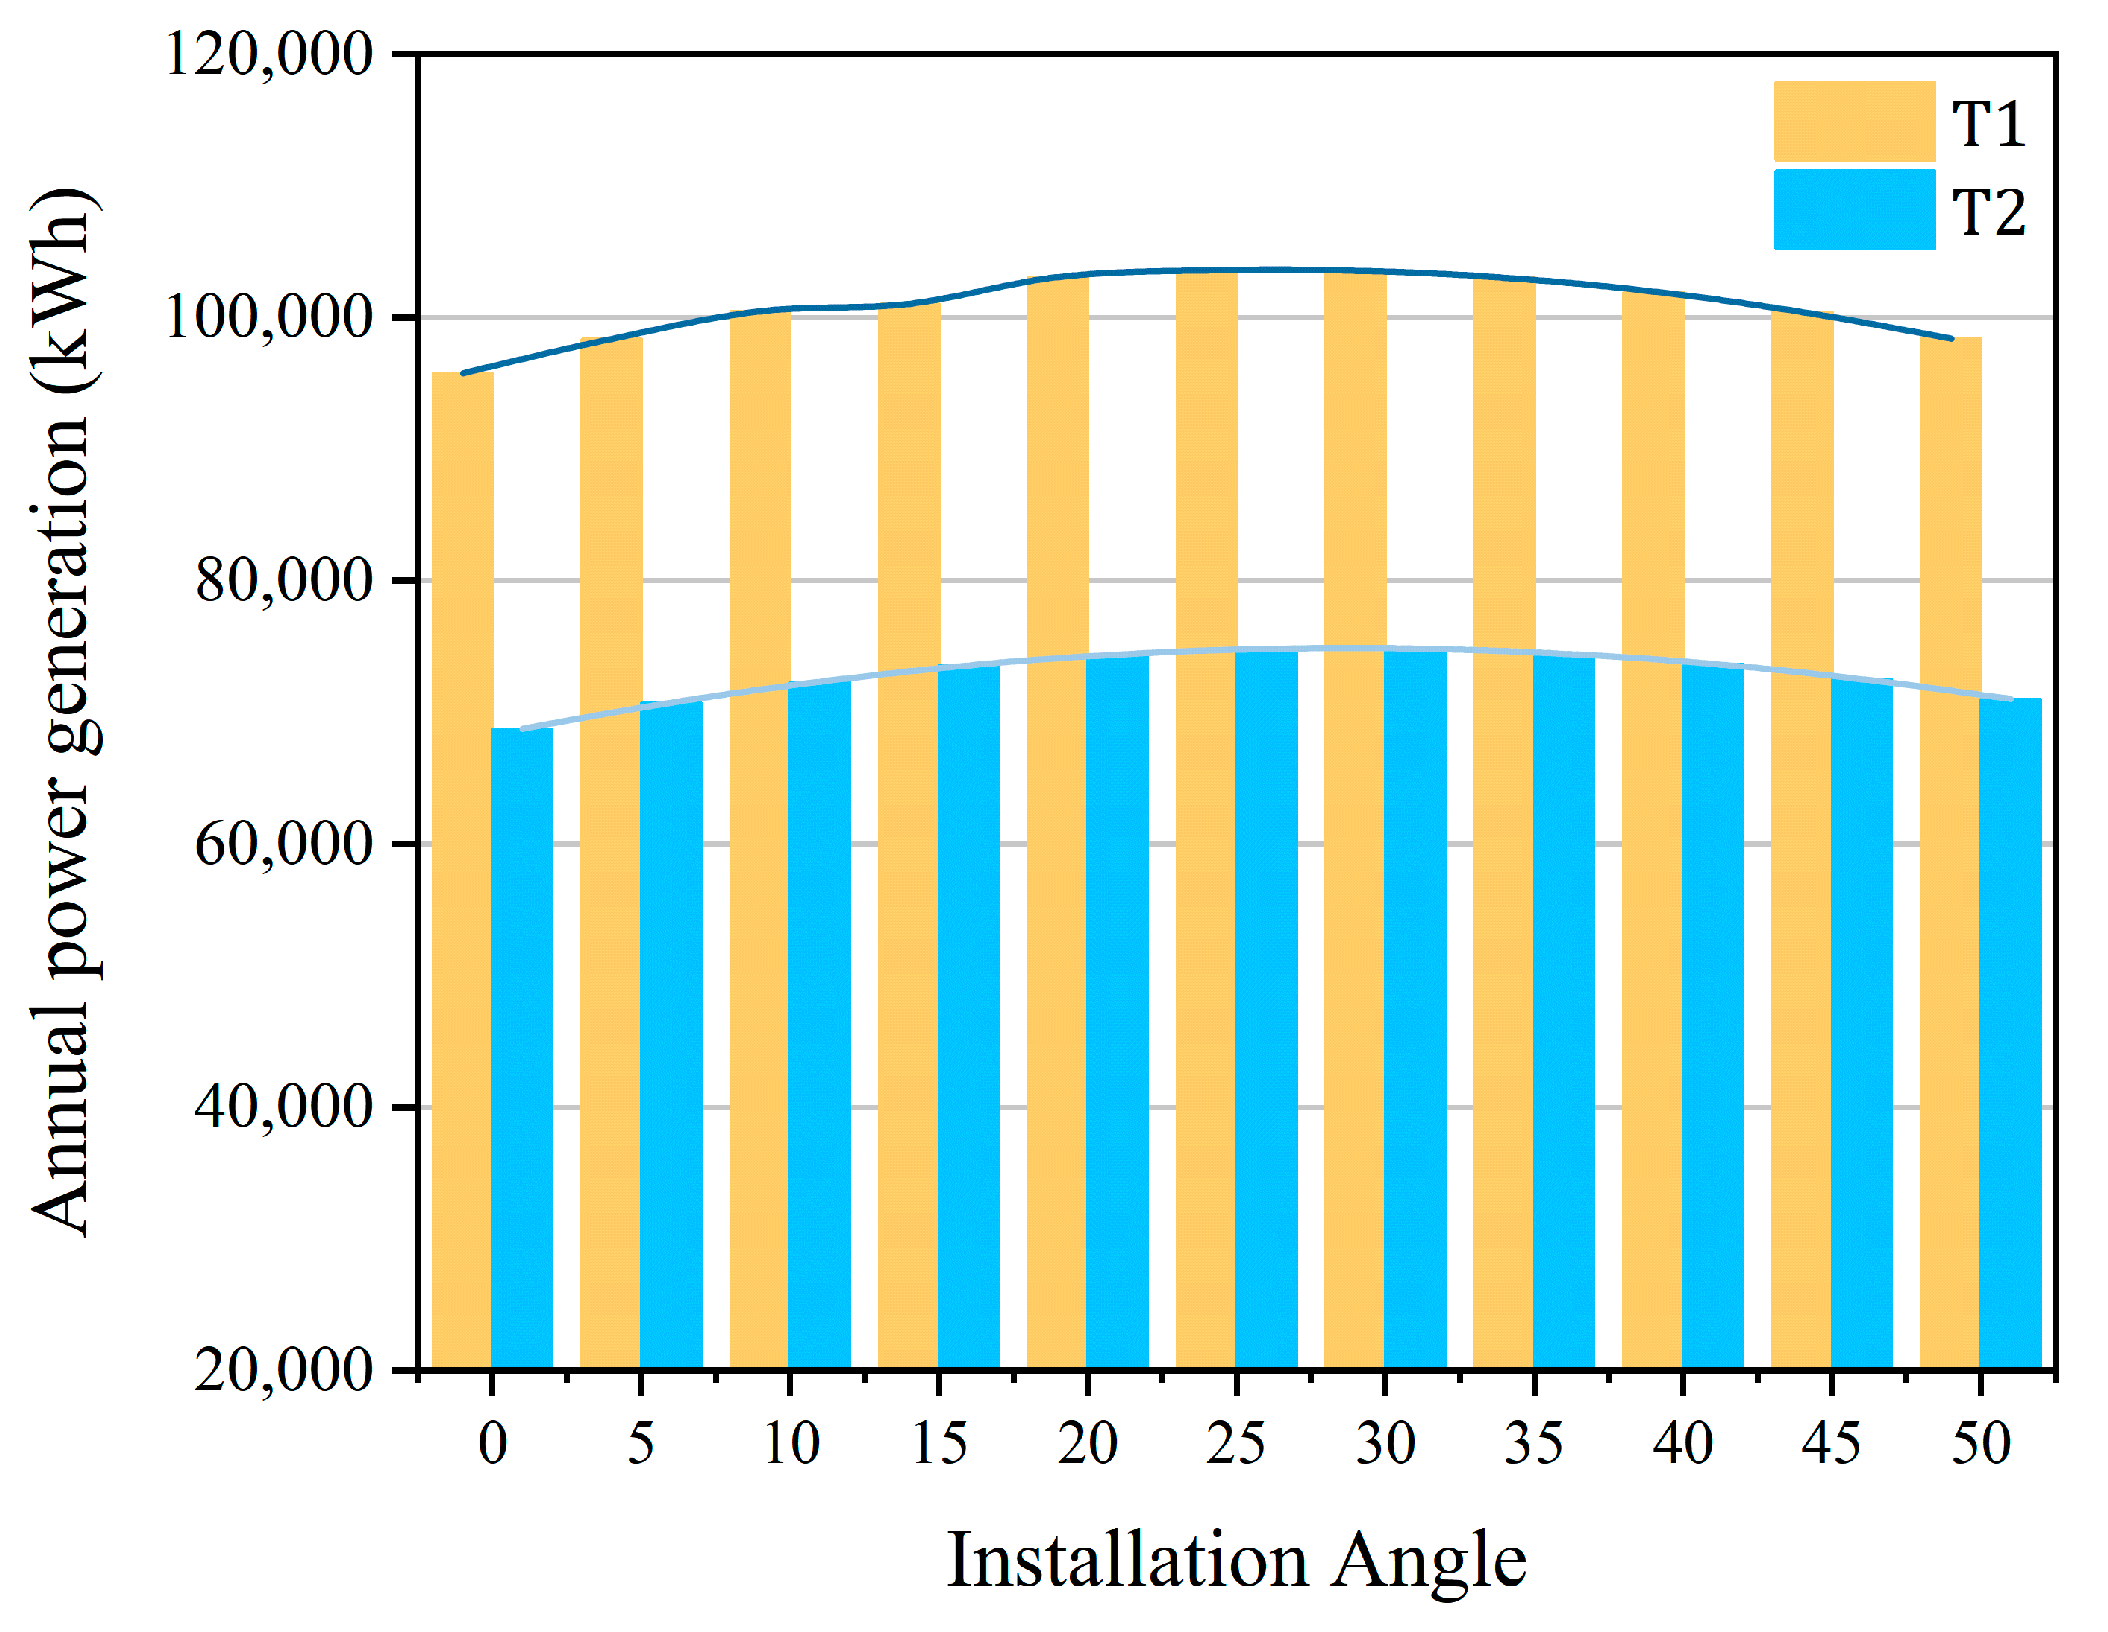
Given that the number of PV modules was identical in the T2, T3, and T4 layouts, the annual energy yield was simulated only for the T2 layout. As shown in Figure 10, the annual energy generation for both T1 and T2 followed a similar trend: it increased with the tilt angle, peaked at around 30°, and then gradually declined. The maximum annual energy output of T2 reaches 103,658 kWh at the optimal tilt angle of 30°. In the 20–30° range, the variation in energy yield remains below 0.5%, indicating that tilt angle had a marginal impact on system performance across different layouts. Compared with T1, the T2 layout has fewer PV modules, resulting in lower absolute energy yields at all tilt angles. However, the relative gain curve of T2 closely aligns with that of T1, with an approximately 8% increase in energy yield from 0° to 25°. At a 25° tilt, the annual energy generation reaches 74,826 kWh, and the rate of decline beyond 35° is consistent with T1, indicating similar sensitivity to tilt angle.
Figure 10.
Annual energy yield under different PV module layouts and installation tilt angles.
3.6. Comprehensive Evaluation of Light Environment and Power Performance
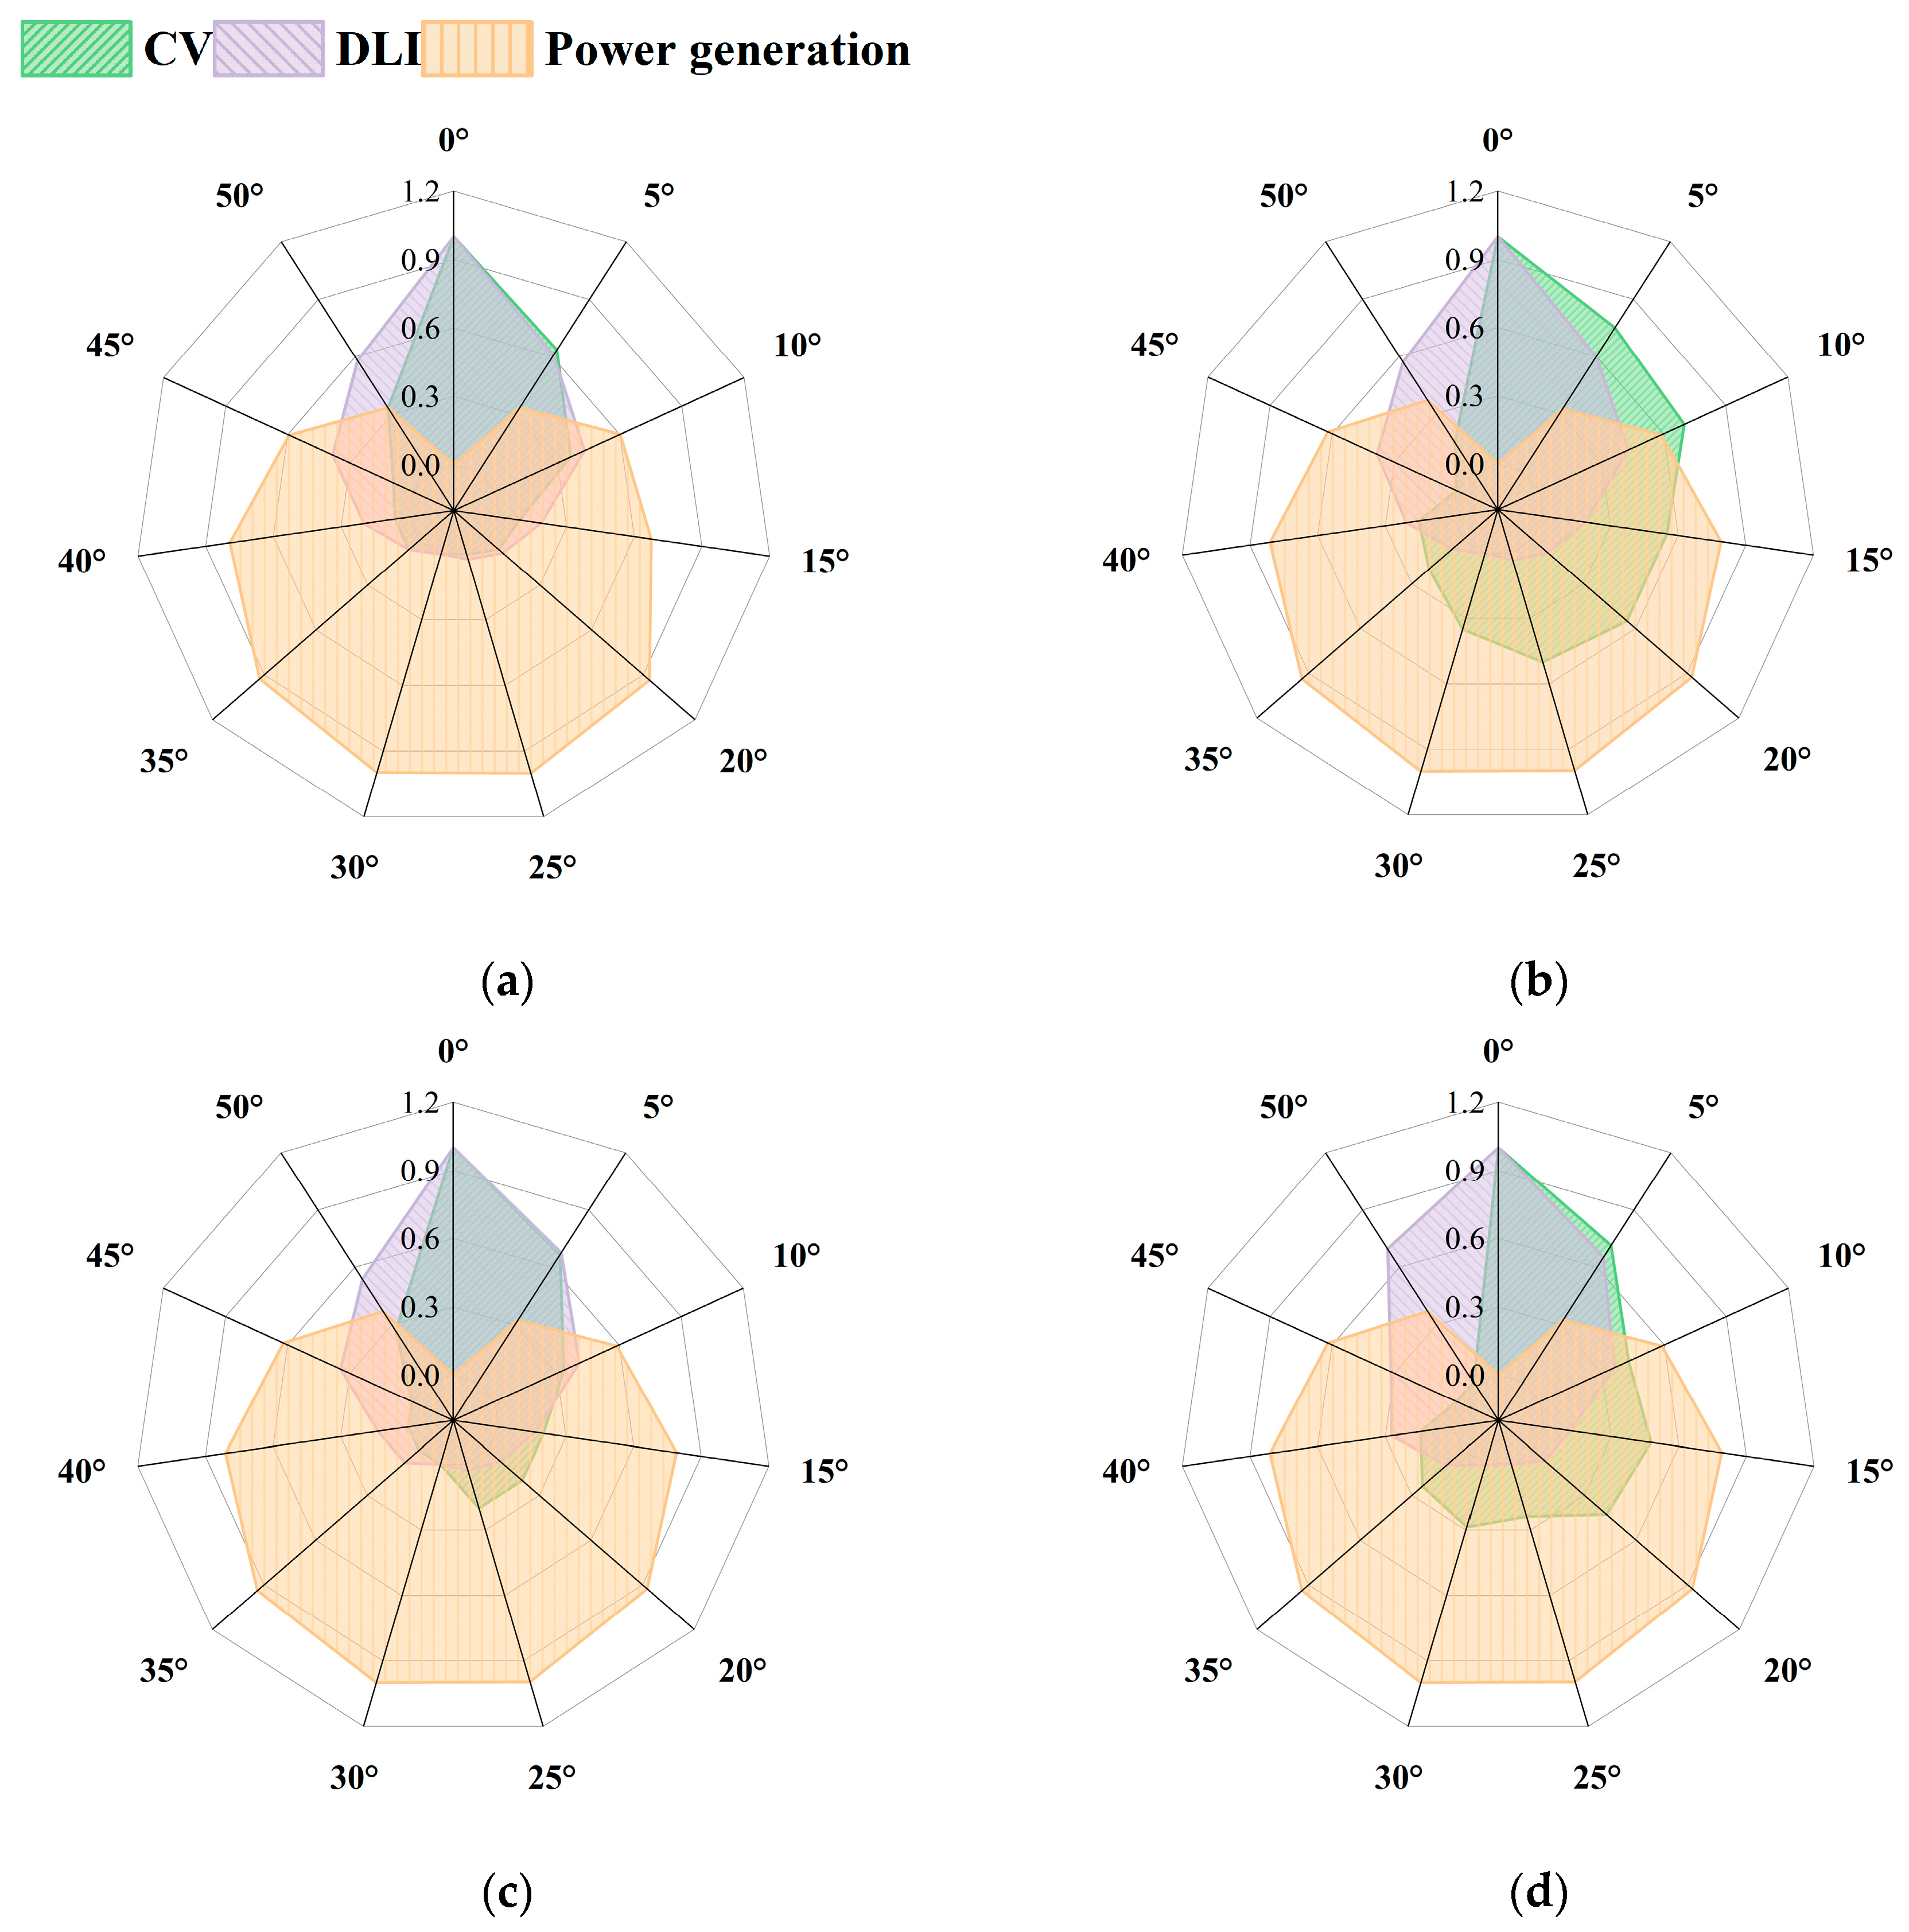
The design and implementation of agrivoltaic systems must consider not only the optimization of the internal light environment but also the electricity generation performance of PV modules, aiming to achieve a balance between light optimization and energy output. For four different PV module arrangement schemes and 11 installation tilt angles, the annual total electricity generation, in-system solar radiation, and light uniformity were normalized. Higher normalized values indicated superior performance at a given tilt angle, whereas lower values indicated poorer performance. The corresponding normalized values are presented in Figure 11. As shown in Figure 11, daily photosynthetically active radiation (PAR) initially decreased and then increased with increasing tilt angles. The best performance occurred at a 0° tilt angle. Among the four arrangements, the T4 configuration exhibited a relatively balanced light distribution and electricity generation within a moderate tilt angle range of 15–30°. In contrast, the T3 layout showed a slight decline in light uniformity within the same tilt range. The T2 configuration maintained good light uniformity, particularly at lower tilt angles, though its electricity output was relatively lower.
Figure 11.
Comprehensive optimization of PV module layout and tilt angle based on normalized DLI, light uniformity, and annual energy yield; (a) T1 configuration; (b) T2 configuration; (c) T3 configuration; (d) T4 configuration.
In summary, the T4 configuration at a 15–35° tilt angle provided a balance between power generation and light uniformity, making it a suitable baseline design for agrivoltaic systems. The T1 layout was more appropriate for scenarios demanding high tilt angles and maximum energy output, although localized shading may occur. It is best suited for crops with lower light requirements, where energy generation is prioritized. In contrast, T2 and T3 offer superior light uniformity at low tilt angles but involve some trade-offs in electricity output, making them suitable for high-value crops with higher light requirements. Ultimately, system configuration should be determined based on the trade-off between crop type, tilt angle, and overall system objectives. For high-value, light demanding crops, T3 or T4 with moderately reduced module density was recommended to enhance light conditions. If maximizing power output is the primary objective, a high-density T1 layout is preferred to optimize per-unit-area energy yield.
4. Discussion
4.1. Effects of Structural Parameters on Seasonal Light Environment Distribution and the Agro-Energy Trade-Off
The simulation results demonstrate that the tilt angle, spacing, and ground coverage ratio (GCR) of photovoltaic (PV) modules exhibit pronounced seasonal responses in shaping the internal light environment of agrivoltaic systems. The influence of tilt angle on the daily light integral (DLI) shows a typical seasonal inversion pattern: in winter, larger tilt angles intensify shadow overlap, leading to a significant reduction in sub-panel solar radiation; whereas in summer, moderate tilt angles improve light transmittance due to enhanced reflection and scattering. This variation essentially reflects the dynamic coupling between solar altitude and the geometric configuration of shading. Previous studies [] have shown that under fixed-tilt conditions, sub-panel light intensity often drops to 50–100 μmol·m−2·s−1 in winter but exceeds 400 μmol·m−2·s−1 in summer, confirming that changes in solar altitude primarily drive seasonal differences in shading intensity. Further studies have reported that seasonally optimized tilt adjustments can improve annual light energy capture, though high tilt angles combined with high GCR values significantly reduce sub-panel PAR [,]. Other research also indicates that properly controlled tilt angles can effectively reduce shading losses during winter and enhance light utilization in summer [], a pattern verified across both tropical and temperate climates. Overall, excessive tilt angles during winter exacerbate light scarcity, while moderate angles in summer enhance light transmission and overall system transparency. The findings of this study confirm these trends and further underscore the critical role of tilt optimization in regulating the seasonal light environment.
The structural layout of PV modules and the GCR fundamentally determine the light uniformity and agro-energy performance of agrivoltaic systems, serving as core parameters for integrated system optimization. The results indicate that the T4 configuration maintained the lowest coefficient of variation (CV = 0.16–0.18) throughout the year, significantly outperforming high-density layouts. An optimized structural layout effectively reduces the spatial heterogeneity of canopy light distribution, improves the balance of photosynthetically active radiation, and enhances both light-use efficiency and canopy-level photosynthetic synchrony [,]. Multiple studies have also confirmed that increasing row spacing or lowering array density markedly improves light uniformity, mitigates yield fluctuations caused by local shading, and demonstrates consistent trends under various climatic conditions []. Meanwhile, GCR exerts a decisive influence on the balance between energy production and light availability within agrivoltaic systems. High GCR values improve power generation per unit land area but considerably limit PAR availability for crops, constraining photosynthetic potential and biomass productivity. Conversely, moderate or low GCR configurations, though sacrificing some energy output, improve light transmittance and spatial uniformity, creating a more stable canopy micro-light environment that supports coordinated photosynthesis and enhances crop quality [].
Therefore, in system design, the optimization of PV structural configuration and GCR should transcend single-objective, power-oriented approaches and instead pursue dual-goal coordination between agricultural production and energy generation. Adopting dual-row layouts with moderate inter-row spacing and low-to-medium GCR values can enhance light uniformity, alleviate competition for radiation, and maintain high land-use efficiency for energy output. This integrated design achieves optimal spatial and temporal allocation of solar energy in agrivoltaic systems. Adopting a fixed annual tilt angle requires selecting a moderate compromise to balance winter-summer light demands with power generation benefits; implementing dual-season manual adjustment—switching between low-tilt spring-winter and high-tilt summer-autumn modes—can increase total generation but necessitates weighing operation and maintenance costs. The findings provide a generalizable framework and technical reference for structural optimization of agrivoltaic systems across diverse climatic regions and crop types.
4.2. Reliability of the Simulation Framework and Its Potential for Regional Application
Although this study uses Lianyungang as a case study, the modeling process and evaluation framework established in this research are not limited to the specific layout scheme in Lianyungang. The method can be replicated in different climate zones through the collaborative adjustment of GCR and tilt angle ranges, demonstrating strong generalizability. In low-latitude regions (<25° N), where the annual variation in solar altitude is small, GCR plays a more critical role in regulating the light environment. It is recommended to reduce the GCR to 25–30% and slightly decrease the tilt angle to 20–25° to avoid excessive shading. In contrast, in high-latitude regions (>45° N), where the winter solar altitude is extremely low, the tilt angle should be increased to 35–40° and the array spacing should be expanded to mitigate seasonal light deficiency.
Supported by the parametric modeling platform and photovoltaic simulation software, this method can be applied not only to different regions [], but also to various array layout forms [] and different support structures [] for agrivoltaic system design and evaluation. Compared with conventional field experiments, this framework enables rapid evaluation of multiple structural scenarios during the design stage, significantly reducing experimental duration and cost. Zhang et al. [], along with another study on photovoltaic greenhouses [], demonstrated through comparative analyses using Ecotect and bifacial_radiance that parametric modeling can accurately reproduce the spatiotemporal distribution of both light and energy generation, verifying its strong potential for cross-scenario application. Furthermore, this simulation approach can be readily extended to various “PV+” agricultural systems—such as photovoltaic greenhouses and aquavoltaic systems—through adaptive parameter adjustment, thereby enabling simultaneous assessment of light environments and energy performance. Overall, the modeling and analytical framework proposed in this study provides a unified and reliable technical foundation for structural optimization, layout design, and early-stage planning of diverse coupled agrivoltaic systems.
4.3. Limitations and Future Research Directions
This study focuses on constructing a light environment and energy generation coupling simulation framework and validating its applicability, which serves as the foundation for subsequent economic evaluation. As a methodological exploration, this research did not conduct crop full-growth-cycle planting experiments or develop a full-life-cycle cost model. The conclusions on light environment optimization need to be coupled with agronomic economic evaluation to guide actual investment decisions. Future research will build on the field, planting experimental data and full-life-cycle cost calculations of this optimized scheme to quantify crop yield benefits and system economics. Additionally, an empirical evaluation framework for the agrivoltaic synergistic effect will be developed to support the sustainable deployment and large-scale promotion of the system under diverse climates and planting models.
5. Conclusions
This study investigated an agrivoltaic system located in Lianyungang, Jiangsu Province, China, using the Ladybug platform for high-precision solar radiation simulation and PVsyst for annual energy yield analysis. By evaluating four PV module configurations at tilt angles ranging from 0° to 50°, the impacts of layout and tilt angle on both the internal light environment and energy output of the agrivoltaic system were comprehensively assessed. Results revealed pronounced seasonal variations in light availability: low tilt angles favored higher daily light integral (DLI) during low-radiation seasons (spring and winter), whereas higher tilt angles enhanced DLI in high-radiation periods. Among the layouts, T2–T4 layouts maintained more stable and higher DLI than T1 across all seasons. Light distribution uniformity was strongly influenced by layout, with T1 exhibiting the lowest uniformity (CV: 0.12–0.37), T2 improving it by approximately 30%, and T3–T4 achieving the most stable performance (annual CV: 0.08–0.23), particularly T4 with the highest uniformity. Annual power generation of all configurations peaked at a tilt angle of around 30°, with T1 achieving the highest energy yield (103,658 kWh), while T4 provided the best balance between energy output and light uniformity at moderate tilt angles (15–30°). These findings highlighted the trade-off between electricity generation and light environment optimization. T1 was best suited for power-oriented applications, whereas T2 and T3 were preferable for high-value, light-demanding crops, and T4 offered the most balanced solution for dual-purpose systems.
Author Contributions
Conceptualization, K.C. and E.B.; methodology, H.D. and L.Z.; software, H.D.; validation, S.T., J.Z. and J.G.; formal analysis, S.T.; investigation, J.G.; resources, X.W.; data curation, L.Z.; writing—original draft preparation, H.D.; writing—review and editing, X.W. and Y.L.; visualization, S.T.; supervision, E.B.; project administration, J.G.; funding acquisition, K.C. All authors have read and agreed to the published version of the manuscript.
Funding
This research was funded by the China Power Engineering Consulting Group Co., Ltd. Major Science and Technology Project (DG3-P01-2023) and the Ningxia Hui Autonomous Region Key R&D Program Project (2023BCF01022).
Data Availability Statement
The data presented in this study are available upon request from the corresponding author.
Conflicts of Interest
Authors Jinxin Zhang and Jiguang Guo were employed by the company China Power Engineering Consulting Group Co., Ltd. The remaining authors declare that the research was conducted in the absence of any commercial or financial relationships that could be construed as a potential conflict of interest.
References
- Emblemsvåg, J. Wind Energy Is Not Sustainable When Balanced by Fossil Energy. Appl. Energy 2022, 305, 117748. [Google Scholar] [CrossRef]
- Londoño-Pulgarin, D.; Cardona-Montoya, G.; Restrepo, J.C.; Muñoz-Leiva, F. Fossil or Bioenergy? Global Fuel Market Trends. Renew. Sustain. Energy Rev. 2021, 143, 110905. [Google Scholar] [CrossRef]
- Ly, A. Scaling up Renewables without Phasing down Fossil Fuels? Rethinking the Role of Financial Globalization. Energy Policy 2025, 204, 114654. [Google Scholar] [CrossRef]
- Renewables 2024—Analysis. Available online: https://www.iea.org/reports/renewables-2024 (accessed on 5 October 2025).
- World Energy Outlook 2024—Analysis. Available online: https://www.iea.org/reports/world-energy-outlook-2024 (accessed on 5 October 2025).
- Krozer, Y.; Bykuc, S.; Coenen, F. Growth of Renewable Energy: A Review of Drivers from the Economic Perspective. Energies 2025, 18, 5250. [Google Scholar] [CrossRef]
- Yamada, H. Autonomous Decentralized Cooperative Control DC Microgrid Deployed in Residential Areas. Energies 2025, 18, 5041. [Google Scholar] [CrossRef]
- Ghosh, A. Nexus between Agriculture and Photovoltaics (Agrivoltaics, Agriphotovoltaics) for Sustainable Development Goal: A Review. Sol. Energy 2023, 266, 112146. [Google Scholar] [CrossRef]
- Edouard, S.; Combes, D.; Van Iseghem, M.; Tin, M.N.W.; Escobar-Gutiérrez, A.J. Increasing Land Productivity with Agriphotovoltaics: Application to an Alfalfa Field. Appl. Energy 2023, 329, 120207. [Google Scholar] [CrossRef]
- Junedi, M.M.; Ludin, N.A.; Hamid, N.H.; Kathleen, P.R.; Hasila, J.; Ahmad Affandi, N.A. Environmental and Economic Performance Assessment of Integrated Conventional Solar Photovoltaic and Agrophotovoltaic Systems. Renew. Sustain. Energy Rev. 2022, 168, 112799. [Google Scholar] [CrossRef]
- Liu, W.; Omer, A.A.A.; Li, M. Agrivoltaic: Challenge and Progress. Agronomy 2023, 13, 1934. [Google Scholar] [CrossRef]
- Dinesh, H.; Pearce, J.M. The Potential of Agrivoltaic Systems. Renew. Sustain. Energy Rev. 2016, 54, 299–308. [Google Scholar] [CrossRef]
- Cho, J.; Park, S.M.; Park, A.R.; Lee, O.C.; Nam, G.; Ra, I.-H. Application of Photovoltaic Systems for Agriculture: A Study on the Relationship between Power Generation and Farming for the Improvement of Photovoltaic Applications in Agriculture. Energies 2020, 13, 4815. [Google Scholar] [CrossRef]
- Pelczar, S. An Overview of Open Field Agrivoltaic Systems: A Comprehensive Description of Combination of Agricultural and Energy Production. Sustain. Energy Technol. Assess. 2025, 80, 104369. [Google Scholar] [CrossRef]
- Ali Abaker Omer, A.; Li, M.; Zhang, F.; Hassaan, M.M.E.; El Kolaly, W.; Zhang, X.; Lan, H.; Liu, J.; Liu, W. Impacts of Agrivoltaic Systems on Microclimate, Water Use Efficiency, and Crop Yield: A Systematic Review. Renew. Sustain. Energy Rev. 2025, 221, 115930. [Google Scholar] [CrossRef]
- Dainelli, R.; Santoni, M.; Maienza, A.; Remelli, S.; Menta, C.; Zanotti, D.; Ghidesi, G.; Dal Prà, A. Weed and Grassland Community Structure, Biomass and Forage Value Across Crop Types and Light Conditions in an Organic Agrivoltaic System. Sustainability 2025, 17, 8119. [Google Scholar] [CrossRef]
- Tan, Y.; Liu, J.; Li, W.; Yin, J.; Chen, H.; Peng, Y.; Tan, J.; Wei, M. Agrivoltaics Development Progresses: From the Perspective of Photovoltaic Impact on Crops, Soil Ecology and Climate. Environ. Res. 2025, 266, 120540. [Google Scholar] [CrossRef]
- Teng, J.W.C.; Soh, C.B.; Devihosur, S.C.; Tay, R.H.S.; Jusuf, S.K. Effects of Agrivoltaic Systems on the Surrounding Rooftop Microclimate. Sustainability 2022, 14, 7089. [Google Scholar] [CrossRef]
- Ali Abaker Omer, A.; Liu, W.; Li, M.; Zheng, J.; Zhang, F.; Zhang, X.; Osman Hamid Mohammed, S.; Fan, L.; Liu, Z.; Chen, F.; et al. Water Evaporation Reduction by the Agrivoltaic Systems Development. Sol. Energy 2022, 247, 13–23. [Google Scholar] [CrossRef]
- Jiang, C.; Zhang, K.; Ma, Y.; Song, Y.; Li, M.; Zheng, Y.; Pan, T.; Lu, W. Comparison of Ray Tracing Software Performance Based on Light Intensity for Spinach Growth. Agriculture 2025, 15, 1852. [Google Scholar] [CrossRef]
- Baligar, V.C.; Elson, M.K.; He, Z.; Li, Y.; Paiva, A.d.Q.; Almeida, A.-A.F.; Ahnert, D. Impact of Ambient and Elevated [CO2] in Low Light Levels on Growth, Physiology and Nutrient Uptake of Tropical Perennial Legume Cover Crops. Plants 2021, 10, 193. [Google Scholar] [CrossRef]
- Hu, Y.; Zhang, X.; Ma, X. Agrivoltaics with Semitransparent Panels Can Maintain Yield and Quality in Soybean Production. Sol. Energy 2024, 282, 112978. [Google Scholar] [CrossRef]
- AL-agele, H.A.; Proctor, K.; Murthy, G.; Higgins, C. A Case Study of Tomato (Solanum lycopersicon var. Legend) Production and Water Productivity in Agrivoltaic Systems. Sustainability 2021, 13, 2850. [Google Scholar] [CrossRef]
- Yalçın, Ö.; Kuzyaka, D.; Özden, T. Agrivoltaic System Design for Sugar Beets and Wheat in Central Anatolia. Renew. Energy 2025, 245, 122800. [Google Scholar] [CrossRef]
- Magarelli, A.; Mazzeo, A.; Alhajj Ali, S.; Ferrara, G. Shading Enhanced Microclimate Variability, Photomorphogenesis and Yield Components in a Grapevine Agrivoltaic System in Semi-Arid Mediterranean Conditions in Puglia Region, Southeastern Italy. Sci. Hortic. 2025, 350, 114311. [Google Scholar] [CrossRef]
- Gnayem, N.; Magadley, E.; Haj-Yahya, A.; Masalha, S.; Kabha, R.; Abasi, A.; Barhom, H.; Matar, M.; Attrash, M.; Yehia, I. Examining the Effect of Different Photovoltaic Modules on Cucumber Crops in a Greenhouse Agrivoltaic System: A Case Study. Biosyst. Eng. 2024, 241, 83–94. [Google Scholar] [CrossRef]
- Asa’a, S.-N.; Bizinoto Ferreira Bosco, G.; Kyranaki, N.; van der Heide, A.; Sivaramakrishnan Radhakrishnan, H.; Poortmans, J.; Daenen, M. Assessing the Light Scattering Properties of C-Si PV Module Materials for Agrivoltaics: Towards More Homogeneous Light Distribution in Crop Canopies. Sol. Energy 2024, 276, 112690. [Google Scholar] [CrossRef]
- Jamil, U.; Pearce, J.M. Experimental Impacts of Transparency on Strawberry Agrivoltaics Using Thin Film Photovoltaic Modules under Low Light Conditions. Sol. Energy 2025, 290, 113375. [Google Scholar] [CrossRef]
- Hayibo, K.S.; Pearce, J.M. Vertical Free-Swinging Photovoltaic Racking Energy Modeling: A Novel Approach to Agrivoltaics. Renew. Energy 2023, 218, 119343. [Google Scholar] [CrossRef]
- Jamil, U.; Vandewetering, N.; Pearce, J.M. Solar Photovoltaic Wood Racking Mechanical Design for Trellis-Based Agrivoltaics. PLoS ONE 2023, 18, e0294682. [Google Scholar] [CrossRef]
- Lukač, N.; Špelič, D.; Štumberger, G.; Žalik, B. Optimisation for Large-Scale Photovoltaic Arrays’ Placement Based on Light Detection And Ranging Data. Appl. Energy 2020, 263, 114592. [Google Scholar] [CrossRef]
- Özdemir, Ö.E.; Bretzel, T.; Gfüllner, L.; Gorjian, S.; Katircioglu, Y.; Dur, B.; Trommsdorff, M. Design, Simulation, and Experimental Evaluation of an Agrivoltaic Greenhouse in Turkey. Results Eng. 2025, 26, 105278. [Google Scholar] [CrossRef]
- Riaz, M.H.; Imran, H.; Younas, R.; Butt, N.Z. The Optimization of Vertical Bifacial Photovoltaic Farms for Efficient Agrivoltaic Systems. Sol. Energy 2021, 230, 1004–1012. [Google Scholar] [CrossRef]
- Peter, H.R.; Sargent, K.; Penney, J.; Schmitz, T. Path Programming in Rhino 7 for Wire Arc Additive Manufacturing. Manuf. Lett. 2025, 44, 973–979. [Google Scholar] [CrossRef]
- GB 50797—2012; Design Code for Photovoltaic Power Stations. Ministry of Housing and Urban-Rural Development of the People’s Republic of China, General Administration of Quality Supervision, Inspection and Quarantine of the People’s Republic of China: Beijing, China, 2012.
- Freitas, J.d.S.; Cronemberger, J.; Soares, R.M.; Amorim, C.N.D. Modeling and Assessing BIPV Envelopes Using Parametric Rhinoceros Plugins Grasshopper and Ladybug. Renew. Energy 2020, 160, 1468–1479. [Google Scholar] [CrossRef]
- León-Sánchez, C.; Giannelli, D.; Agugiaro, G.; Stoter, J. Comparative Analysis of Geospatial Tools for Solar Simulation. Trans. GIS 2025, 29, e13296. [Google Scholar] [CrossRef]
- Wang, W.; Li, S.; Guo, S.; Ma, M.; Feng, S.; Bao, L. Benchmarking Urban Local Weather with Long-Term Monitoring Compared with Weather Datasets from Climate Station and EnergyPlus Weather (EPW) Data. Energy Rep. 2021, 7, 6501–6514. [Google Scholar] [CrossRef]
- Meng, Q.; Severin, S.N. Continuous Light Can Promote Growth of Baby Greens over Diurnal Light under a High Daily Light Integral. Environ. Exp. Bot. 2024, 220, 105695. [Google Scholar] [CrossRef]
- Zhang, W.; Yue, Z.; Ma, H.; Gao, Y.; Liu, W.; Huang, X.; Zhang, L.; Meng, X.; Kribus, A.; Vitoshkin, H.; et al. Agricultural Friendly Single-Axis Dynamic Agrivoltaics: Simulations, Experiments and a Large-Scale Application for Chinese Solar Greenhouses. Appl. Energy 2024, 374, 123891. [Google Scholar] [CrossRef]
- Schipper, R.; van der Meer, M.; de Visser, P.H.B.; Heuvelink, E.; Marcelis, L.F.M. Consequences of Intra-Canopy and Top LED Lighting for Uniformity of Light Distribution in a Tomato Crop. Front. Plant Sci. 2023, 14, 1012529. [Google Scholar] [CrossRef] [PubMed]
- Willmott, C.J. Some Comments on the Evaluation of Model Performance. Bull. Am. Meteorol. Soc. 1982, 636, 1309–1313. [Google Scholar] [CrossRef]
- Dhlamini, M.M.; Brent, A.C. The Impact of Fixed-Tilt PV Arrays on Vegetation Growth Through Ground Sunlight Distribution at a Solar Farm in Aotearoa New Zealand. Energies 2025, 18, 5412. [Google Scholar] [CrossRef]
- Kaddoura, T.O.; Ramli, M.A.M.; Al-Turki, Y.A. On the Estimation of the Optimum Tilt Angle of PV Panel in Saudi Arabia. Renew. Sustain. Energy Rev. 2016, 65, 626–634. [Google Scholar] [CrossRef]
- Cossu, M.; Yano, A.; Solinas, S.; Deligios, P.A.; Tiloca, M.T.; Cossu, A.; Ledda, L. Agricultural Sustainability Estimation of the European Photovoltaic Greenhouses. Eur. J. Agron. 2020, 118, 126074. [Google Scholar] [CrossRef]
- Wang, J.; Ge, Z.; Yang, X.; Ye, C.; Lin, Y. Study on the Optimum Tilted Angle of Solar Panels in Hainan Tropical Photovoltaic Facility Agricultural System. IOP Conf. Ser. Earth Environ. Sci. 2017, 61, 012073. [Google Scholar] [CrossRef]
- Apriani, S.; Mangkuto, R.A.; Saputro, A.G.; Chow, E.C. Performance Prediction and Optimisation of Even-Lighting Agrivoltaic Systems with Semi-Transparent PV Module in the Tropical Region. Sol. Energy 2024, 283, 113013. [Google Scholar] [CrossRef]
- Doubleday, K.; Oleskewicz, K.; Ovaitt, S.; Hickey, T.; Herbert, S.J.; Macknick, J. Impacts of Year-to-Year Weather Variability and Inter-Panel Spacing on Agrivoltaic Crop Yields in Massachusetts. Agrofor. Syst. 2025, 99, 152. [Google Scholar] [CrossRef]
- Willockx, B.; Lavaert, C.; Cappelle, J. Geospatial Assessment of Elevated Agrivoltaics on Arable Land in Europe to Highlight the Implications on Design, Land Use and Economic Level. Energy Rep. 2022, 8, 8736–8751. [Google Scholar] [CrossRef]
- Zhang, L.; Gong, J.; Yang, Z.; Wu, X.; Wang, W.; Yang, C.; Xu, G.; Wu, C.; Bao, E. Evaluating the Contribution of Decreasing Heights of Photovoltaic Panels on Light Environment and Agricultural Production in Agrivoltaic Systems. J. Clean. Prod. 2025, 495, 145091. [Google Scholar] [CrossRef]
- Arena, R.; Aneli, S.; Gagliano, A.; Tina, G.M. Optimal Photovoltaic Array Layout of Agrivoltaic Systems Based on Vertical Bifacial Photovoltaic Modules. Sol. RRL 2024, 8, 2300505. [Google Scholar] [CrossRef]
- Hussain, S.N.; Ghosh, A. Evaluating Tracking Bifacial Solar PV Based Agrivoltaics System across the UK. Sol. Energy 2024, 284, 113102. [Google Scholar] [CrossRef]
- Zhang, L.; Yang, Z.; Wu, X.; Wang, W.; Yang, C.; Xu, G.; Wu, C.; Bao, E. Open-Field Agrivoltaic System Impacts on Photothermal Environment and Light Environment Simulation Analysis in Eastern China. Agronomy 2023, 13, 1820. [Google Scholar] [CrossRef]
Disclaimer/Publisher’s Note: The statements, opinions and data contained in all publications are solely those of the individual author(s) and contributor(s) and not of MDPI and/or the editor(s). MDPI and/or the editor(s) disclaim responsibility for any injury to people or property resulting from any ideas, methods, instructions or products referred to in the content. |
© 2025 by the authors. Licensee MDPI, Basel, Switzerland. This article is an open access article distributed under the terms and conditions of the Creative Commons Attribution (CC BY) license (https://creativecommons.org/licenses/by/4.0/).