You are currently viewing a new version of our website. To view the old version click .
Agriculture
  • Article
  • Open Access

19 November 2025

Blue Light Enhances Photosynthetic Efficiency and Antioxidant Capacity in Mullein (Verbascum phlomoides L.) Seedlings

,
,
,
,
,
,
,
and
1
Department of Plant Production and Biotechnology, Faculty of Agrobiotechnical Sciences Osijek, Josip Juraj Strossmayer University of Osijek, Vladimira Preloga 1, 31000 Osijek, Croatia
2
ALKALOID d.o.o., Slavonska Avenija 6A, 10000 Zagreb, Croatia
3
Department of Industrial Plants Breeding and Genetics, Agricultural Institute Osijek, 31000 Osijek, Croatia
*
Author to whom correspondence should be addressed.
This article belongs to the Special Issue The Effects of LED Lighting on Crop Growth, Quality, and Yield

Abstract

The orange mullein is a biennial plant whose tall yellow flower spikes contain mucilage, saponins, and other medicinal compounds that have a beneficial effect on respiratory problems. As light quality is known to influence plant morphology and physiology, with effects often depending on the species, understanding these responses in mullein is of particular interest. Therefore, this study aimed to investigate the combined effects of different light-emitting diodes (white, red and blue) and their corresponding photon flux densities (PPFD) on the morphology, pigment composition, antioxidant activity, fluorescence parameters and OJIP transient curves in mullein (Verbascum phlomoides L.) seedlings. Seedlings grown under blue light, which had relatively higher PPFD, showed the greatest root length, leaf number, leaf and root fresh and dry biomass. Red light, with lower PPFD, resulted in the lowest values for these parameters. Compared to white light, pigment analysis showed that blue light increased chlorophyll a, total chlorophyll, carotenoid content, and the Chl a/b ratio. Also, blue light enhanced antioxidant activity, as well as the accumulation of phenolic compounds and flavonoids, indicating that it appeared to enhance the synthesis of secondary metabolites under this spectrum. In contrast, seedlings under red light exhibited the lowest ferric reducing antioxidant power values and tended to reduce levels of phenols and flavonoids, indicating a weaker antioxidative response. It was found that white light appeared to enhance the photochemical activity of photosystem II (PSII) and energy dissipation. Blue light improved linear electron transport, photosystem I (PSI) activity and overall photosynthetic performance. Red light preferentially increased electron flow towards the final acceptors of PSI, affecting the terminal part of the electron transport chain. Analysis of OJIP curves revealed spectrum and intensity-specific changes in the L, K, H, and G bands, demonstrating that light treatments with differing PPFDs selectively modulate PSII and PSI function.

1. Introduction

Orange mullein (Verbascum phlomoides L.) is one of 21 species of the genus Verbascum recorded in the flora of the Republic of Croatia [1]. It is distributed in almost all parts of the Republic of Croatia, and the highest concentration of habitats is recorded in central Croatia. At least 360 species of this biennial plant from the Scrophulariaceae family are known worldwide [2]. V. phlomoides is native to Europe, western Asia and northeast Africa, but today it also grows in Australia, North and South America and even Greenland. Wild mullein is a plant that in the first year creates a leaf rosette characterised by a multitude of hairs, and in the second year, a flowering stem with inflorescences of 2–9 flowers [3]. It blooms in the summer from July to September, when the yellow mullein flower is collected and valued as a natural remedy for respiratory problems. The expectorant effect of saponins, along with the soothing effect of mucus, makes mullein flowers one of the most useful medicinal drugs for the treatment of hoarseness, cough, bronchitis and asthma [4,5]. Also, some studies confirm anti-inflammatory [6,7] and antimicrobial activity [8] supporting its ethnopharmacological use. Species of the genus Verbascum are used in the treatment of haemorrhoids, rheumatic pain, superficial fungal infections, diarrhoea and even influenza viruses [9]. Furthermore, V. phlomoides and S. virgaureae contain cholinesterase and tyrosinase inhibitory activities that, with known strong antioxidant activity, would be helpful for Alzheimer’s and Parkinson’s disease patients and also have the potential to use plant extract in functional foods [10]. The medicinal properties of this plant are attributed to the content of biologically active compounds such as iridoids, saponins, flavonoids, phenylethanoids and neo-lignan glycosides [8,11,12].
Bioactive components are a very valuable source for phytochemical and pharmacological studies, and their production in the plant can change under different environmental conditions [13,14,15], especially with light intensity and quality [16,17]. Although most studies are focused on the medicinal properties of flowers, the whole plant of Verbascum phlomoides can be used for medicinal purposes [18,19]. Phytochemical analyses have shown that leaves contain significant amounts of phenolic acids and flavonoids, secondary metabolites, along with antioxidant and anti-inflammatory activities [20]. Light quantity and quality directly affect the biosynthesis of phenolics and flavonoids [21,22]. Considering that, we wanted to see how light affects the production of these compounds, and also to connect the adaptive physiology of the plant with its possible medicinal value.
Light is one of the most important environmental factors that affect plant growth and development through oxygenic photosynthesis [23]. Thus, it serves not only as the primary energy source for photosynthesis but also acts as a signal that regulates numerous physiological and morphological processes [24]. Depending on the intensity, photoperiod, spectral composition and spectral quality, light can stimulate or inhibit plant growth. However, when light intensity is present in excessive amounts, abiotic stress occurs, causing physiological damage to plants. In order to defend themselves against high light intensity, plants activate a series of signal transduction from chloroplasts to cells and from locally stressed tissues to other parts of the plant body [23]. Light quality, or the spectral composition of light, is one of the light-related parameters that plays a key role in plant development. Namely, different spectral regions induce different morphological and physiological responses [25]. In general, blue light regulates the opening and closing of stomata, thereby affecting gas exchange and photosynthesis [26,27]. It promotes the development of chloroplasts and the synthesis of chlorophyll [28], contributing to increased photosynthetic efficiency. Moreover, blue light is associated with more compact plant growth, greater leaf density, and shorter internodes [17,29]. Red light, on the other hand, stimulates stem, leaf and root elongation [30] and accelerates seed germination and flowering in many plant species. Also, red light increases macro- and microelements [31]. Plants perceive red light through phytochromes, photoreceptors that regulate the transition between the vegetative and generative phases of development. Studies have shown that combining different light spectra can significantly affect photosynthetic activity, opening of the photosystem II (PSII) reaction centre, and overall light energy conversion efficiency [32]. Therefore, the ability to control light conditions in growth chambers with artificial lighting (light-emitting diodes (LED) technology) has become an essential tool for research aimed at optimising plant growth and photosynthetic efficiency [33]. With the growing interest in sustainable crop production systems with optimised growth conditions, research on the effects of different light spectra, such as white, red and blue light, on photosynthesis and related physiological processes has gained momentum.
Constantly changing environmental conditions affect the structure and functionality of membranes, molecules involved in the photochemical reactions of photosynthesis, and protein complexes [34]. Excess light energy that surpasses the photosynthetic capacity of plants must be dissipated to avoid damage to the photosynthetic machinery and the overreduction of electron transport chains [35]. Chlorophyll fluorescence (ChlF) has been characterised as a sensitive, noninvasive, and rapid method for assessing plant performance by evaluating the efficiency of photosynthesis under different environmental conditions [36]. ChlF parameters provide insight into how absorbed light energy is utilised for photochemistry or dissipated as heat or fluorescence, thereby reflecting the efficiency and integrity of photosystem II (PSII) [34,37]. The kinetics of ChlF describe the energy transfer within photosystems I and II (PSI and PSII) [37], which play an important role in the absorption, transfer, and conversion of light energy. Since PSII significantly affects the overall dynamics of the electron transport chain, the assessment of its functionality by measuring the kinetics of the ChlF can be considered as an indicator of the influence of the environment on primary photosynthetic reactions [38,39]. ChlF is widely used as a rapid technique for evaluating the response of different plant species and/or genotypes to stress. It is used to screen for stress-resistant and stress-sensitive genotypes in different types of crops, i.e., to select genotypes in different breeding programs. The chlorophyll fluorescence induction curve, commonly referred to as the O-J-I-P kinetics, consists of four characteristic phases. In addition to these, intermediate phases such as the K, L, H, and G bends may also appear. These transitions are associated with the sequential reduction of components within the electron transport chain between PSII and PSI. Collectively, they provide valuable insights into PSII photochemistry, electron transfer efficiency, and potential photoinhibitory stress [38,40]. Studying the chlorophyll fluorescence response of mullein (Verbascum phlomoides L.) under controlled light conditions in climate chambers can provide valuable insights into its photosynthetic performance and adaptability. This will contribute to research on plant physiology and potential horticultural applications. Also, previous studies have shown that different light qualities significantly affect plant growth, chlorophyll fluorescence, and various physiological characteristics [41,42,43].
Therefore, this research aimed to examine the influence of different specific LED spectra (blue, red and white), each characterised by specific photon flux densities (PPFD), on growth, pigment composition, antioxidant activity and photosynthetic parameters in Verbascum phlomoides seedlings under controlled photoperiod. Therefore, the results of this study reflect the combined influence of spectral composition and light intensity, rather than spectral effects alone. We hypothesise that blue light will positively influence pigment accumulation and photochemical efficiency in young Verbascum phlomoides plants compared to red and white light. Conversely, red light is expected to reduce overall biomass. In contrast, white light is predicted to support balanced antioxidant responses and moderate growth, providing optimal coordination of photoprotection and development.

2. Materials and Methods

2.1. Plant Material, Growth Conditions and Light Treatments

The experiment was conducted at the Faculty of Agrobiotechnical Sciences in Osijek under controlled conditions in a climate chamber. Seeds of Verbascum phlomoides L. were collected during expeditions organised within the framework of the National Program for the Conservation and Sustainable Use of Plant Genetic Resources for Food and Agriculture of the Republic of Croatia, in the area of Vukovar-Srijem County (Municipality of Privlaka) in 2024.
Seeds were sown in polystyrene trays with 40 cells, filled with commercial Potgrond H substrate (Klasmann-Deilmann GmbH, Geeste, Germany). Young plants of Verbascum phlomoides L. were cultivated in a controlled-environment growth chamber under three different light treatments (white, blue, and red). The actual PPFD values measured at the canopy level were 173, 203, and 299 μmol m−2 s−1 for blue, white, and red LEDs, respectively. These represent the effective photon flux densities received by the plants under each treatment. The chamber was maintained at 24 °C (day/night), with a relative humidity of 50% and a photoperiod of 16 h light/8 h dark. Each treatment was represented by three independent trays (replicates), each containing 40 plants. In total, 120 plants per treatment were included in the experiment. Plants were grown until the seedling stage, corresponding to the development of 5–6 leaves. During cultivation, plants were watered regularly to maintain optimal soil moisture. Sampling was performed 30 days after sowing. The following morphological parameters (root length, number of leaves per plant, fresh leaf mass, fresh root mass, dry leaf mass, and dry root mass) were determined for each individual plant within each tray (40 plants per tray). In addition, 30 plants per treatment (10 plants randomly selected from each of the three replicates) were used to determine leaf area and specific leaf area. After morphological measurements, leaf samples were collected and immediately frozen at −80 °C for the subsequent determination of pigments, antioxidant activity, phenolic compounds, and flavonoids.

2.2. Sample Preparation

Prior to extraction, young leaves of Verbascum phlomoides L. samples were ground to a fine powder under liquid nitrogen using a mortar and pestle. The powdered tissue was then used for subsequent extractions: pigments and antioxidant compounds were extracted using acetone and ethanol, respectively, while flavonoid and phenol compounds were extracted using ethanol. All extractions were performed under cold conditions to minimise degradation of the target compounds.

2.3. Determination of Chlorophyll and Carotenoid Content

Approximately 0.05 g of powdered leaf tissue was placed into a 15 mL test tube, and 10 mL of acetone was added. The mixture was homogenised using a vortex mixer and subsequently centrifuged at 4000 rpm for 10 min at 4 °C. A 2 mL aliquot of the supernatant was collected for spectrophotometric measurement at 662, 644, and 440 nm. Chlorophyll a, chlorophyll b, total chlorophyll, and carotenoid concentrations were calculated using the Holm–Wettstein equations [44,45], and final values were expressed in mg g−1 fresh weight (FW):
Chlorophyll a = 9.784 × A662 − 0.990 × A644
Chlorophyll b = 21.426 × A644 − 4.65 × A662
Chlorophyll a + b = 5.134 × A662 + 20.436 × A644
Carotenoids = 4.695 × A440 − 0.268 × (chlorophyll a + b)

2.4. Determination of Antioxidant Capacity with FRAP Method

The antioxidant capacity of leaf samples was determined using the ferric reducing antioxidant power (FRAP) method, following Keutgen and Pawelzik [46]. An aliquot of the ethanol extract was mixed with the FRAP reagent, and the reaction mixture was incubated at 37 °C for 4 min. Absorbance was then measured at 593 nm. A calibration curve (y = 1162x + 0.0661, R2 = 0.9971) was constructed using increasing concentrations of FeSO4, and the results were expressed as mM FeSO4 g−1 fresh weight (FW). A series of calibration standards was prepared by dilution of a stock solution of 1 mM FeSO4 to obtain the following concentrations: 0 (blank), 0.1, 0.2, 0.4, 0.6, 0.8, and 1.0 mM FeSO4.

2.5. Determination of Total Phenols and Flavonoids

Total phenolic content was determined using the Folin-Ciocalteu method [47]. An aliquot of the ethanol leaf extract was mixed with distilled water, Folin-Ciocalteu reagent, and Na2CO3. After incubation at 37 °C for 60 min, absorbance was measured at 765 nm. Total phenol concentration was calculated from a calibration curve (y = 2.9937x + 0.0854, R2 = 0.9977) prepared with increasing concentrations of gallic acid (stock solution 5 mg mL−1 gallic acid, ST0, ST 0.05, ST 0.1, ST 0.15, ST 0.20, ST 0.25, ST 0.30, ST 0.35 mg mL−1 gallic acid), and results were expressed as gallic acid equivalents (mg GAE g−1 fresh weight, FW).
Flavonoid content was determined by adding AlCl3 and 96% ethanol to the extract, followed by homogenisation and incubation at room temperature for 60 min. Absorbance was measured at 415 nm, and total flavonoid concentration was calculated from a calibration curve (y = 0.0081x + 0.0221, R2 = 0.9913) prepared with increasing concentrations of quercetin. A series of calibration standards was prepared by dilution of a stock solution of 0,5 mg mL−1 quercetin to obtain the following concentrations: 0 (blank), 10, 40, 60, 80, 100 and 120 µg g−1. Results were expressed as quercetin equivalents (mg QE g−1 FW).

2.6. Efficiency of the Photosynthetic Activity in Young Verbascum Plants

The efficiency of the photosynthetic apparatus in Verbascum plants was evaluated through chlorophyll a fluorescence (ChlF) analysis. Measurements were carried out on the second fully developed leaf from the top of the plant (n = 12; four plants per replicate) using a Handy PEA fluorimeter (Hansatech Instruments Ltd., King’s Lynn, UK). Before data collection, leaves were dark-adapted for 30 min to ensure complete oxidation of the photosynthetic electron transport chain. Fluorescence induction curves (OJIP transients) were obtained by exposing the leaves to a saturating pulse of red light (peak at 650 nm) with an intensity of approximately 3200 μmol m−2 s−1 for one second. The JIP-test was applied to calculate characteristic structural and functional parameters describing the state and efficiency of the photosynthetic machinery [45]. A description of the parameters, along with their corresponding formulas, is presented in Table 1. Plants cultivated under three different light spectra (white (W), red (R), and blue (B)) were grown under controlled conditions, with plants exposed to white light serving as the control. For each treatment, mean values were calculated from 12 independent measurements, and results were expressed relative to their corresponding controls. Differences in the characteristic fluorescence phases (OK, OJ, JI, and IP) were presented as changes in relative variable fluorescence (ΔVOK, ΔVOJ, ΔVJI, and ΔVIP) normalised to the white-light control.
Table 1. Description and formulas of JIP-test parameters.

2.7. Data Analysis

The content of chlorophyll, carotenoids, total phenols, flavonoids, and antioxidant activity (FRAP) was determined spectrophotometrically. Chlorophyll and carotenoid contents were measured using a Varian Cary 50 UV-VIS spectrophotometer with Cary WinUV software (version 3.00(339)) (Varian Inc., Palo Alto, CA, USA), while total phenols, flavonoids, and FRAP antioxidant activity were determined using a TECAN microtiter plate reader (Tecan Group Ltd., Männedorf, Switzerland) with SPARK CONTROL software (Spark V 3.1. SP1).

2.8. Statistical Analysis

Data were collected and initially processed using Microsoft Excel 2019. Statistical analyses were performed using the ANOVA procedure in SAS Enterprise Guide 7.1. When a significant F value was observed, differences between treatment means were evaluated using Student‘s t-test (LSD) at a significance level of 0.05. For parameters related to photosynthetic activity, mean separation was performed using Tukey’s HSD Post Hoc test. Different letters indicate statistically significant differences at p < 0.05.

3. Results and Discussion

The present findings reflect responses of Verbascum phlomoides seedlings grown under blue, red, and white LED spectra that differed in PPFD. Because PPFD values were not equal across spectra, all responses described below should be interpreted as the combined effects of light quality and photon flux density.

3.1. Morphological Parameters of Verbascum phlomoides L.

One of the objectives of this study was to examine the effect of different specific LED spectra (blue, red and white) and their specific PPFD on the morphological characteristics of orange mullein seedlings, and the obtained results are presented in Figure 1a–f. Significant differences (p < 0.05) were found in all analysed morphological parameters depending on the type of spectral lighting, which also differed in PPFD intensity. Therefore, the observed effects may reflect combined spectrum and intensity responses.
Figure 1. Morphological parameters of the of young orange mullein (Verbascum phlomoides L.) leaves in relation to different light: (a) Root length (cm), (b) Number of leaves per plant, (c) Leaf fresh mass (g per plant), (d) Root fresh mass (g per plant), (e) Leaf dry mass (g per plant) and (f) Root dry mass (g per plant). Error bars represent standard deviation. Different letters indicate a significant difference at p < 0.05.
In general, seedlings grown under blue light exhibited the highest values for root length, number of leaves, leaf fresh and dry mass, and root fresh and dry mass. However, since blue light had the highest PPFD, its positive effect on biomass may partly reflect the influence of higher light intensity. In contrast, seedlings exposed to red light showed the lowest values for most parameters. The light spectrum had a marked effect on the seedling development of Verbascum phlomoides during the early growth stage. Root length was greatest under blue light (8.51 cm), which represented an increase of approximately 13.8% compared to white light (7.48 cm), while red light resulted in significantly shorter roots (5.69 cm), corresponding to a decrease of about 23.9% relative to white light. In contrast, the effect of the light spectrum on leaf number was less pronounced. No statistically significant difference was detected between white (5.55) and red light (5.57), whereas blue light significantly increased the number of leaves (6.27) by approximately 13% compared to white light. Blue light treatment resulted in a leaf fresh mass of 17.97 g, which is 52.7% higher than that achieved under white light (11.77 g). Conversely, the red light treatment yielded a biomass of only 6.78 g. This represents a substantial decrease, being 42.4% lower than the control white light treatment. Root fresh weight and leaf dry weight followed a similar trend, with both parameters being significantly higher under blue light and significantly lower under red light compared to the white light control. The most pronounced differences were observed in the root dry weight parameter, which showed an increase of 338% under blue light compared to the white light control. In contrast, plants grown under red light did not differ significantly from the control treatment.
Blue light exhibited the highest values of root length, number of leaves, leaf fresh and dry mass, and root fresh and dry mass. Similar trends have been observed in previous studies on other plant species. According to Johkan et al. [48], in experiments conducted on lettuce (Lactuca sativa), blue light increased root dry mass by more than 80% compared to fluorescent light, whereas red light promoted an increase in the fresh mass of aboveground organs, but tended to reduce tissue density. Although findings in this study for root development under blue light are consistent with those of Johkan et al. [48] in lettuce, the overall morphological response of Verbascum phlomoides differed. In contrast to lettuce, where red light stimulated shoot growth, V. phlomoides seedlings exposed to red light tended to reduce shoot biomass and leaf number. These inconsistencies may reflect species-specific sensitivity to light spectra and intensity, as well as differences in developmental stage and anatomical structure influencing light absorption and signal perception. Liu and van Iersel [49] reported that the light spectrum strongly affects photosynthetic efficiency and energy distribution within leaves. Although blue light is often associated with lower photosynthetic efficiency on an absorbed light basis, in this study, it promoted significantly greater root and leaf biomass accumulation, indicating a spectrum-specific response under controlled PPFD and photoperiod. This suggests that the observed morphological responses are not solely the result of photosynthetic activity, but also of photomorphogenic regulation mediated by blue-light receptors such as cryptochromes and phototropins.
Similar effects of light spectrum on plant morphogenesis have been reported in wheat (Triticum aestivum) grown under monochromatic LEDs. Goins et al. [50] observed that plants cultivated under monochromatic red light developed fewer tillers and exhibited reduced seed yield compared to those grown under white light. The addition of only 10% blue light to the red spectrum significantly increased shoot dry matter and photosynthetic rate, resulting in growth comparable to plants under white light. These findings align with results in this study, where Verbascum phlomoides seedlings exposed to red light had the lowest values for most morphological parameters, including root length and biomass, under controlled PPFD and photoperiod conditions. In contrast, in cucumber seedlings, red light was reported to enhance root growth and dry matter accumulation, whereas high blue light intensity was less important for root development [51]. These opposing responses suggest that the influence of light spectrum on plant growth is highly species-specific and may also depend on the developmental stage, light source type, spectral quality, and the physiological characteristics of each species.

3.2. Pigment Content in Young Verbascum Leaves

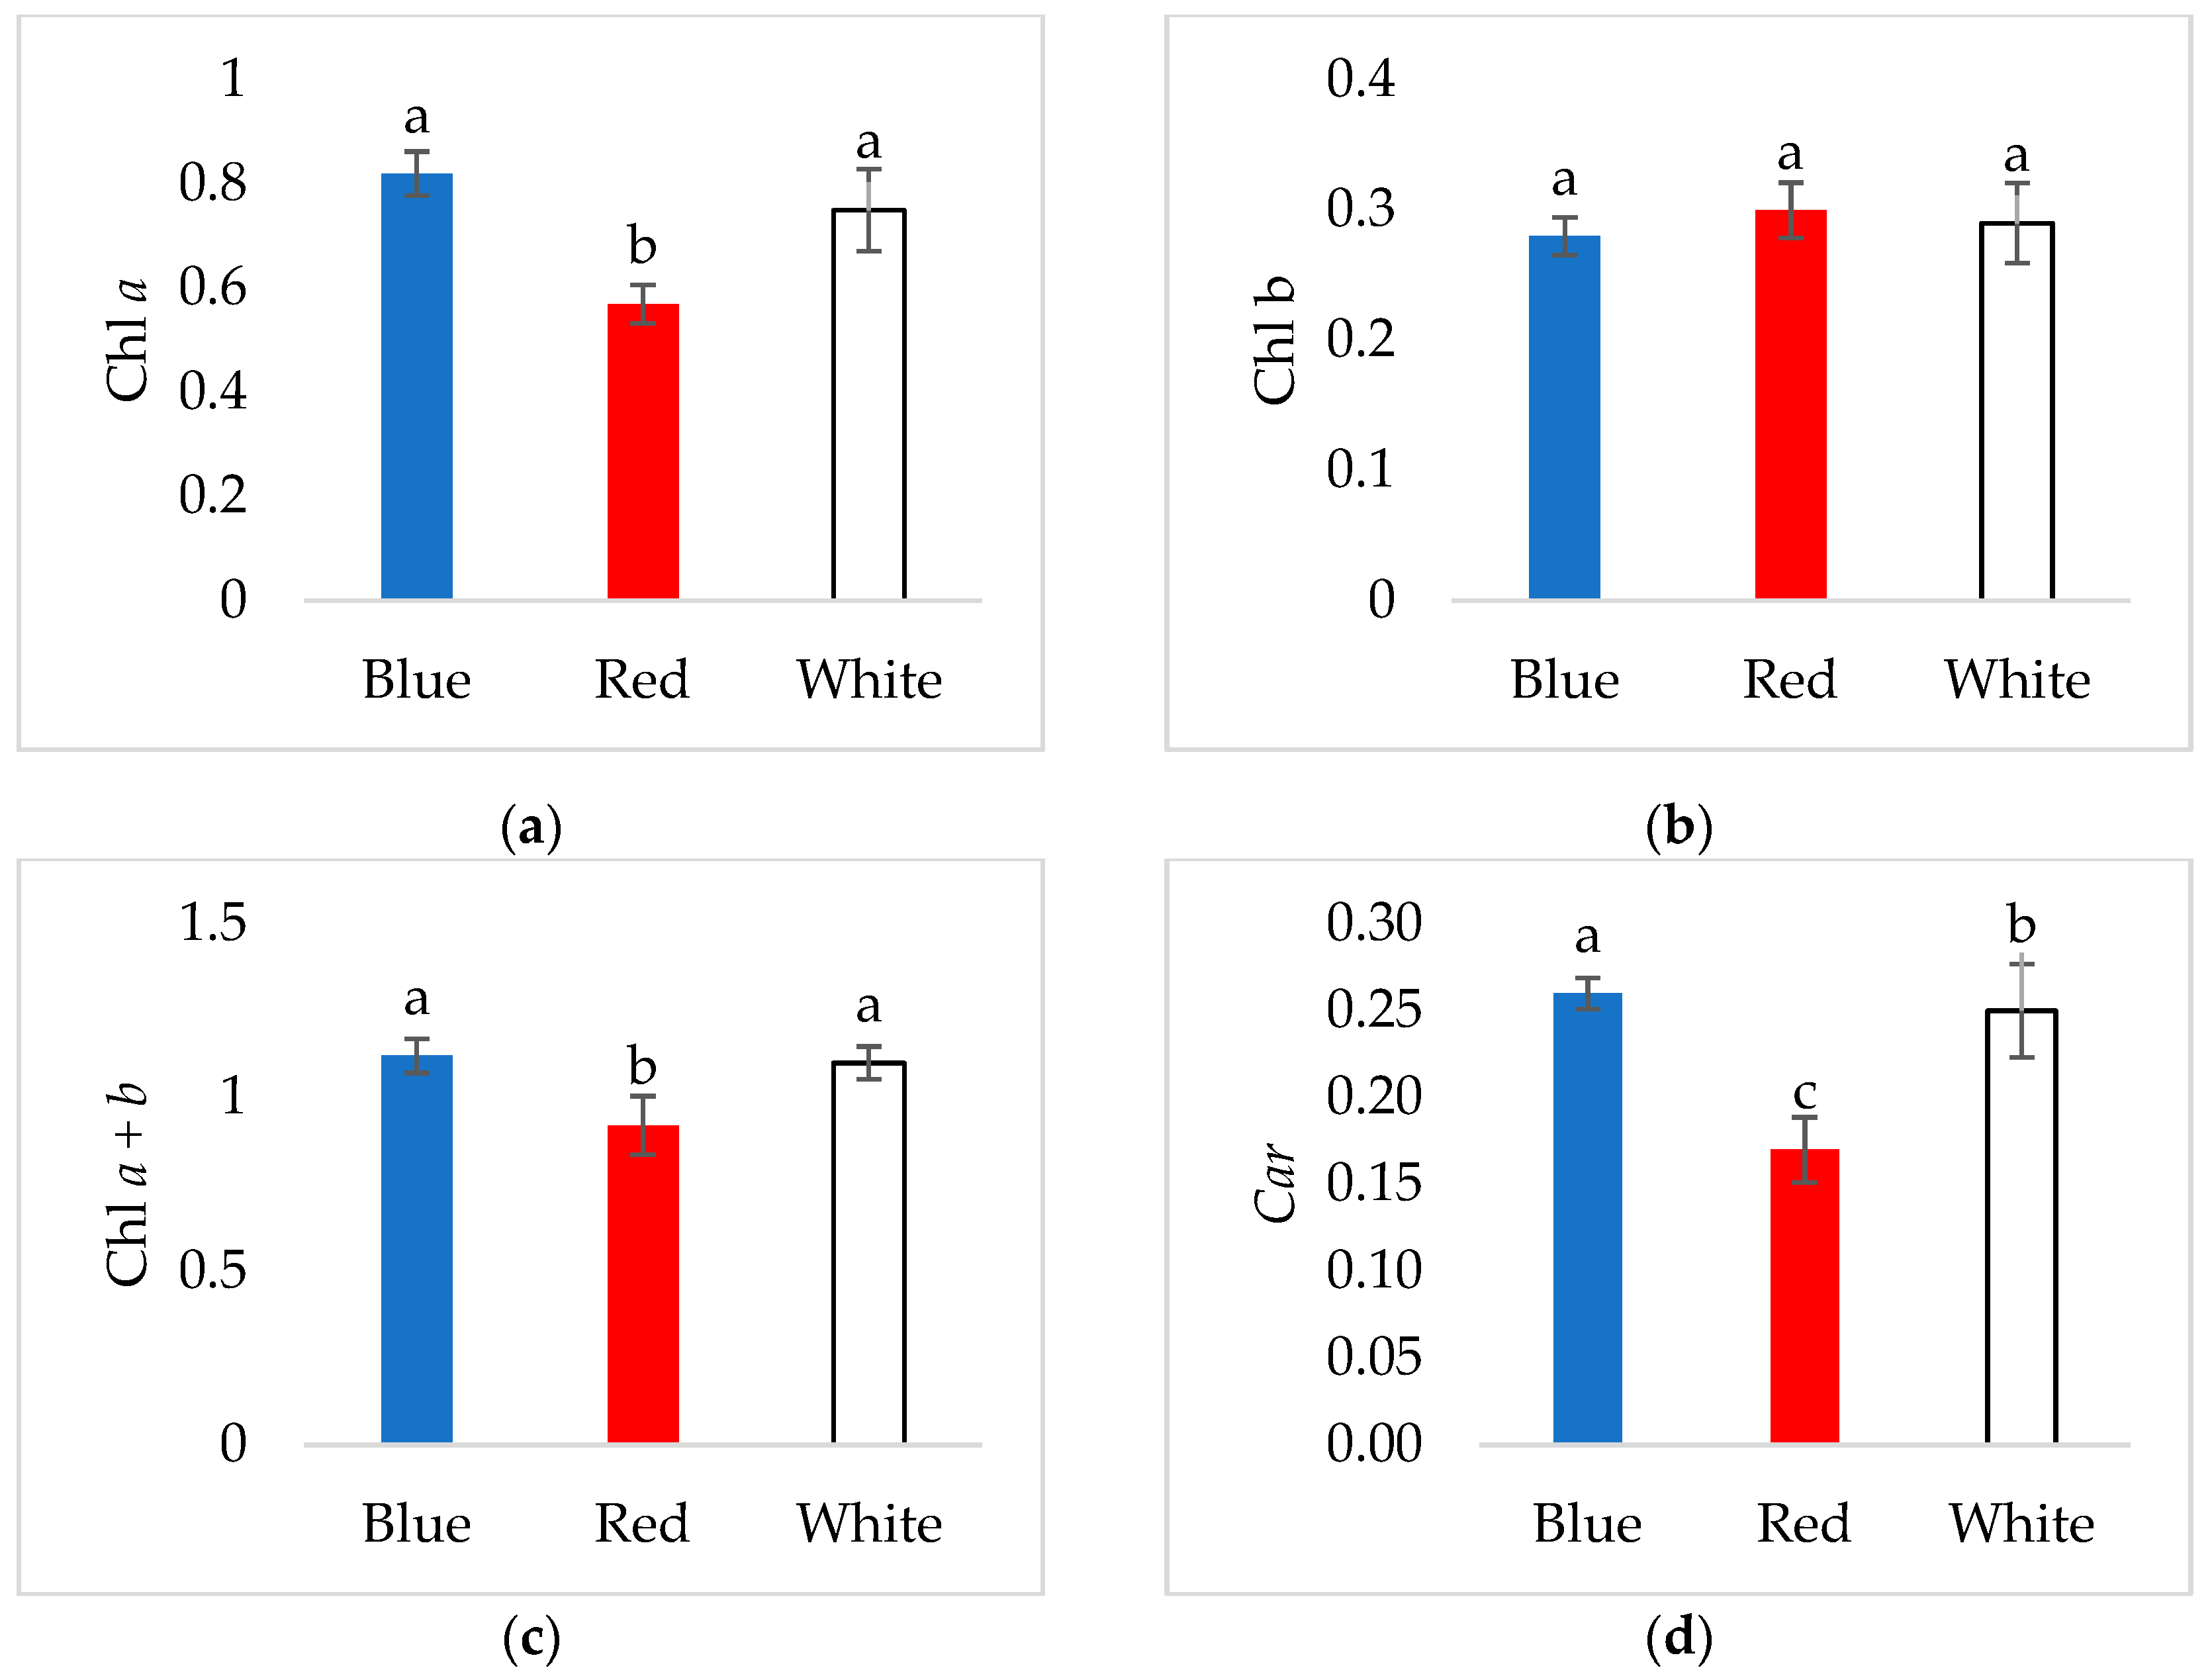
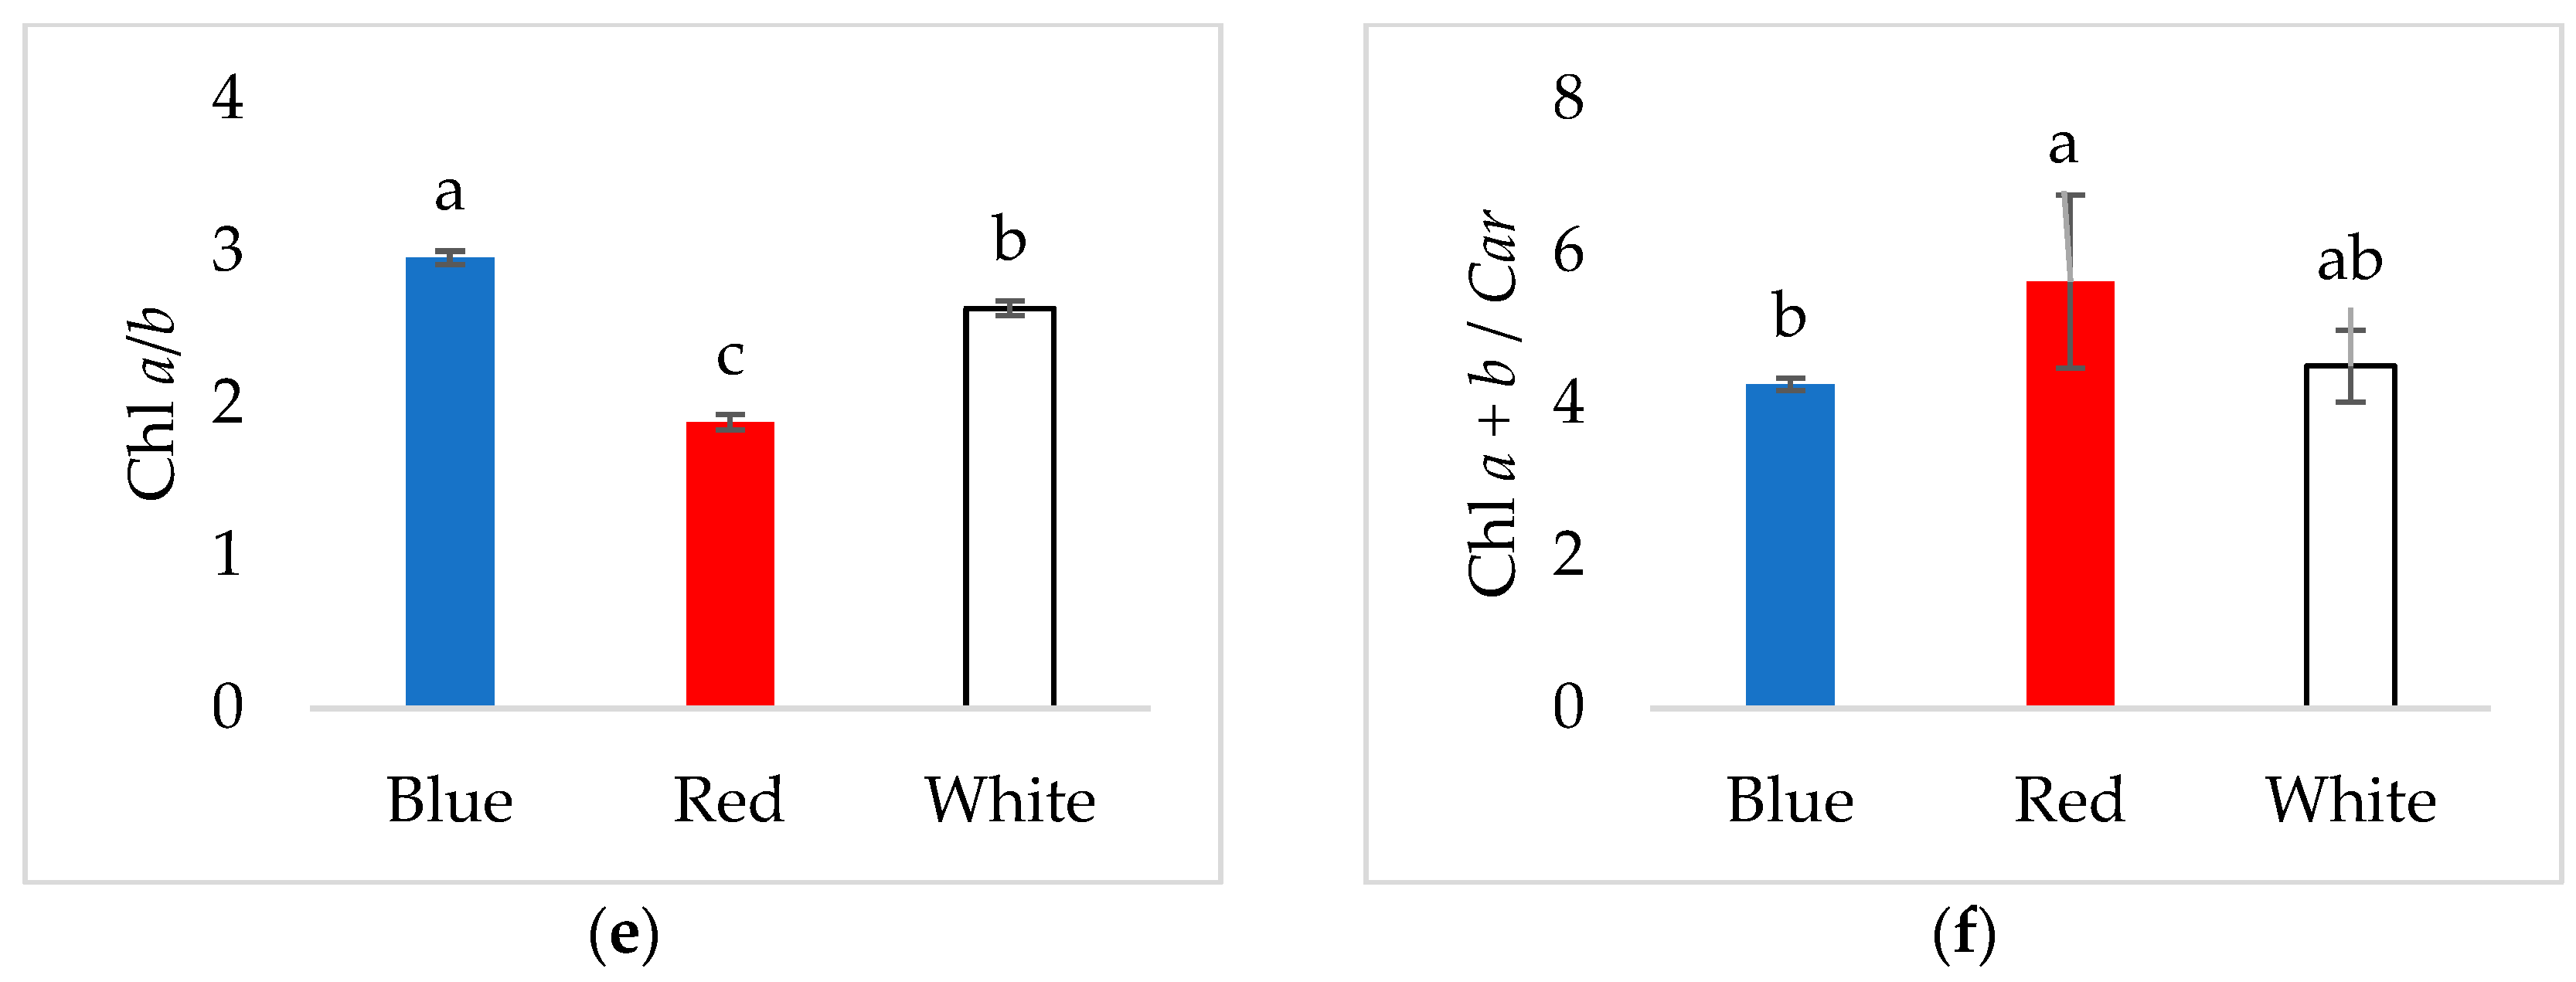
Light quality exerted a significant influence on all examined pigment content parameters, with the exception of chlorophyll b, for which no significant differences among treatments were detected Figure 2a–f. However, all treatments were conducted under controlled PPFD and a fixed 16-h photoperiod, ensuring that observed differences are primarily attributable to light spectrum. The highest concentration of chlorophyll a was observed under blue light, showing a significant increase compared to red light, and a similar trend was evident for the combined parameter Chl a + b.
Figure 2. Chloroplast pigments content of young orange mullein (Verbascum phlomoides L.) in concentration of fresh weight (FW) (mg g−1 FW) of leaves in relation to different light: (a) Chl a (Chlorophyll a (b) Chl b (Chlorophyll b), (c) Chl a + b (Chlorophyll a + b), (d) Car (Carotenoids), (e) Chl a/b (Chlorophyll a/b) and (f) Chl a + b/Car (Chlorophyll a + b/Carotenoids). Error bars represent standard deviation. Different letters indicate a significant difference at p < 0.05.
In comparison with white light, carotenoid content and the chl a/b ratio were significantly elevated under blue light, whereas both parameters tended to reduce under red light. An inverse response was observed for the Chl a + b/car parameter: no significant differences between recorded values on blue and red light were detected relative to white light, although values on blue light differed significantly from those on red light.
Similar spectral effects on chlorophyll content have been reported in Dendrobium officinale, where blue light significantly increased chlorophyll a, chlorophyll b, and total chlorophyll levels, while red light primarily promoted plant height and chlorophyll a/b [52]. These findings support the idea that blue light appears to promote pigment biosynthesis and photochemical performance, while red light influences elongation and energy dissipation processes, although such effects may vary across species and developmental stages. In this study, Verbascum phlomoides seedlings exposed to blue light, showed a strong response of chlorophyll a and carotenoid content, suggesting that shorter wavelengths may stimulate both pigment accumulation and photoprotective capacity during early developmental stages. Similar trends were also observed in other plant species. Hogewoning et al. [25] showed that blue light increased chlorophyll and carotenoid contents in cucumber leaves, which led to higher photosynthetic capacity and smaller specific leaf area. Johkan et al. [48] found that blue light promoted chlorophyll formation and biomass accumulation in lettuce seedlings, confirming that blue wavelengths are important for maintaining higher pigment content. In contrast, Li and Kubota [53] reported no significant differences in chlorophyll content among lettuce seedlings grown under different LED light spectra. Also, too much red light is often connected with lower pigment accumulation and weaker photosynthetic activity, as Zhang et al. [54] conducted a meta-analysis of 207 studies and reported that far-red light decreases chlorophyll content by approximately 11.88%. Comparable result was recorded in this study, where V. phlomoides seedlings grown under red light had lower chlorophyll and carotenoid levels. The higher chl a/b ratio under blue light may show a stronger activity of photosystem II and an adjustment of the plant to use short wavelengths more efficiently.
Chlorophyll is not only essential for photosynthesis and carbon fixation but also plays a crucial role in regulating plant growth and protecting cells from photooxidative damage. It acts as an important component of the plant’s defence against environmental stresses such as drought, high light intensity, or temperature fluctuations by dissipating excess energy and reducing the formation of reactive oxygen species (ROS). Therefore, variations in chlorophyll concentration under different light spectra may reflect not only changes in photosynthetic potential but also adjustments in photoprotective mechanisms [55]. V. phlomoides seedlings under blue light had not only higher pigment content but also better growth and physiological balance. Overall, these results suggest that the production of chlorophylls and carotenoids is strongly affected by the light spectrum and that blue light has an important role in protecting pigment stability and photosynthetic function during the early stage of seedling growth.
Importantly, all treatments were conducted under controlled PPFD and photoperiod conditions, ensuring that observed differences are primarily attributable to light spectrum rather than intensity or photoperiod. The plant responses observed under different LED lighting conditions should be interpreted within the context of 30-day-old seedlings, and spectral effects may vary across species and developmental stages.

3.3. Antioxidant Activity and Phenolic Content of Young Verbascum Leaves

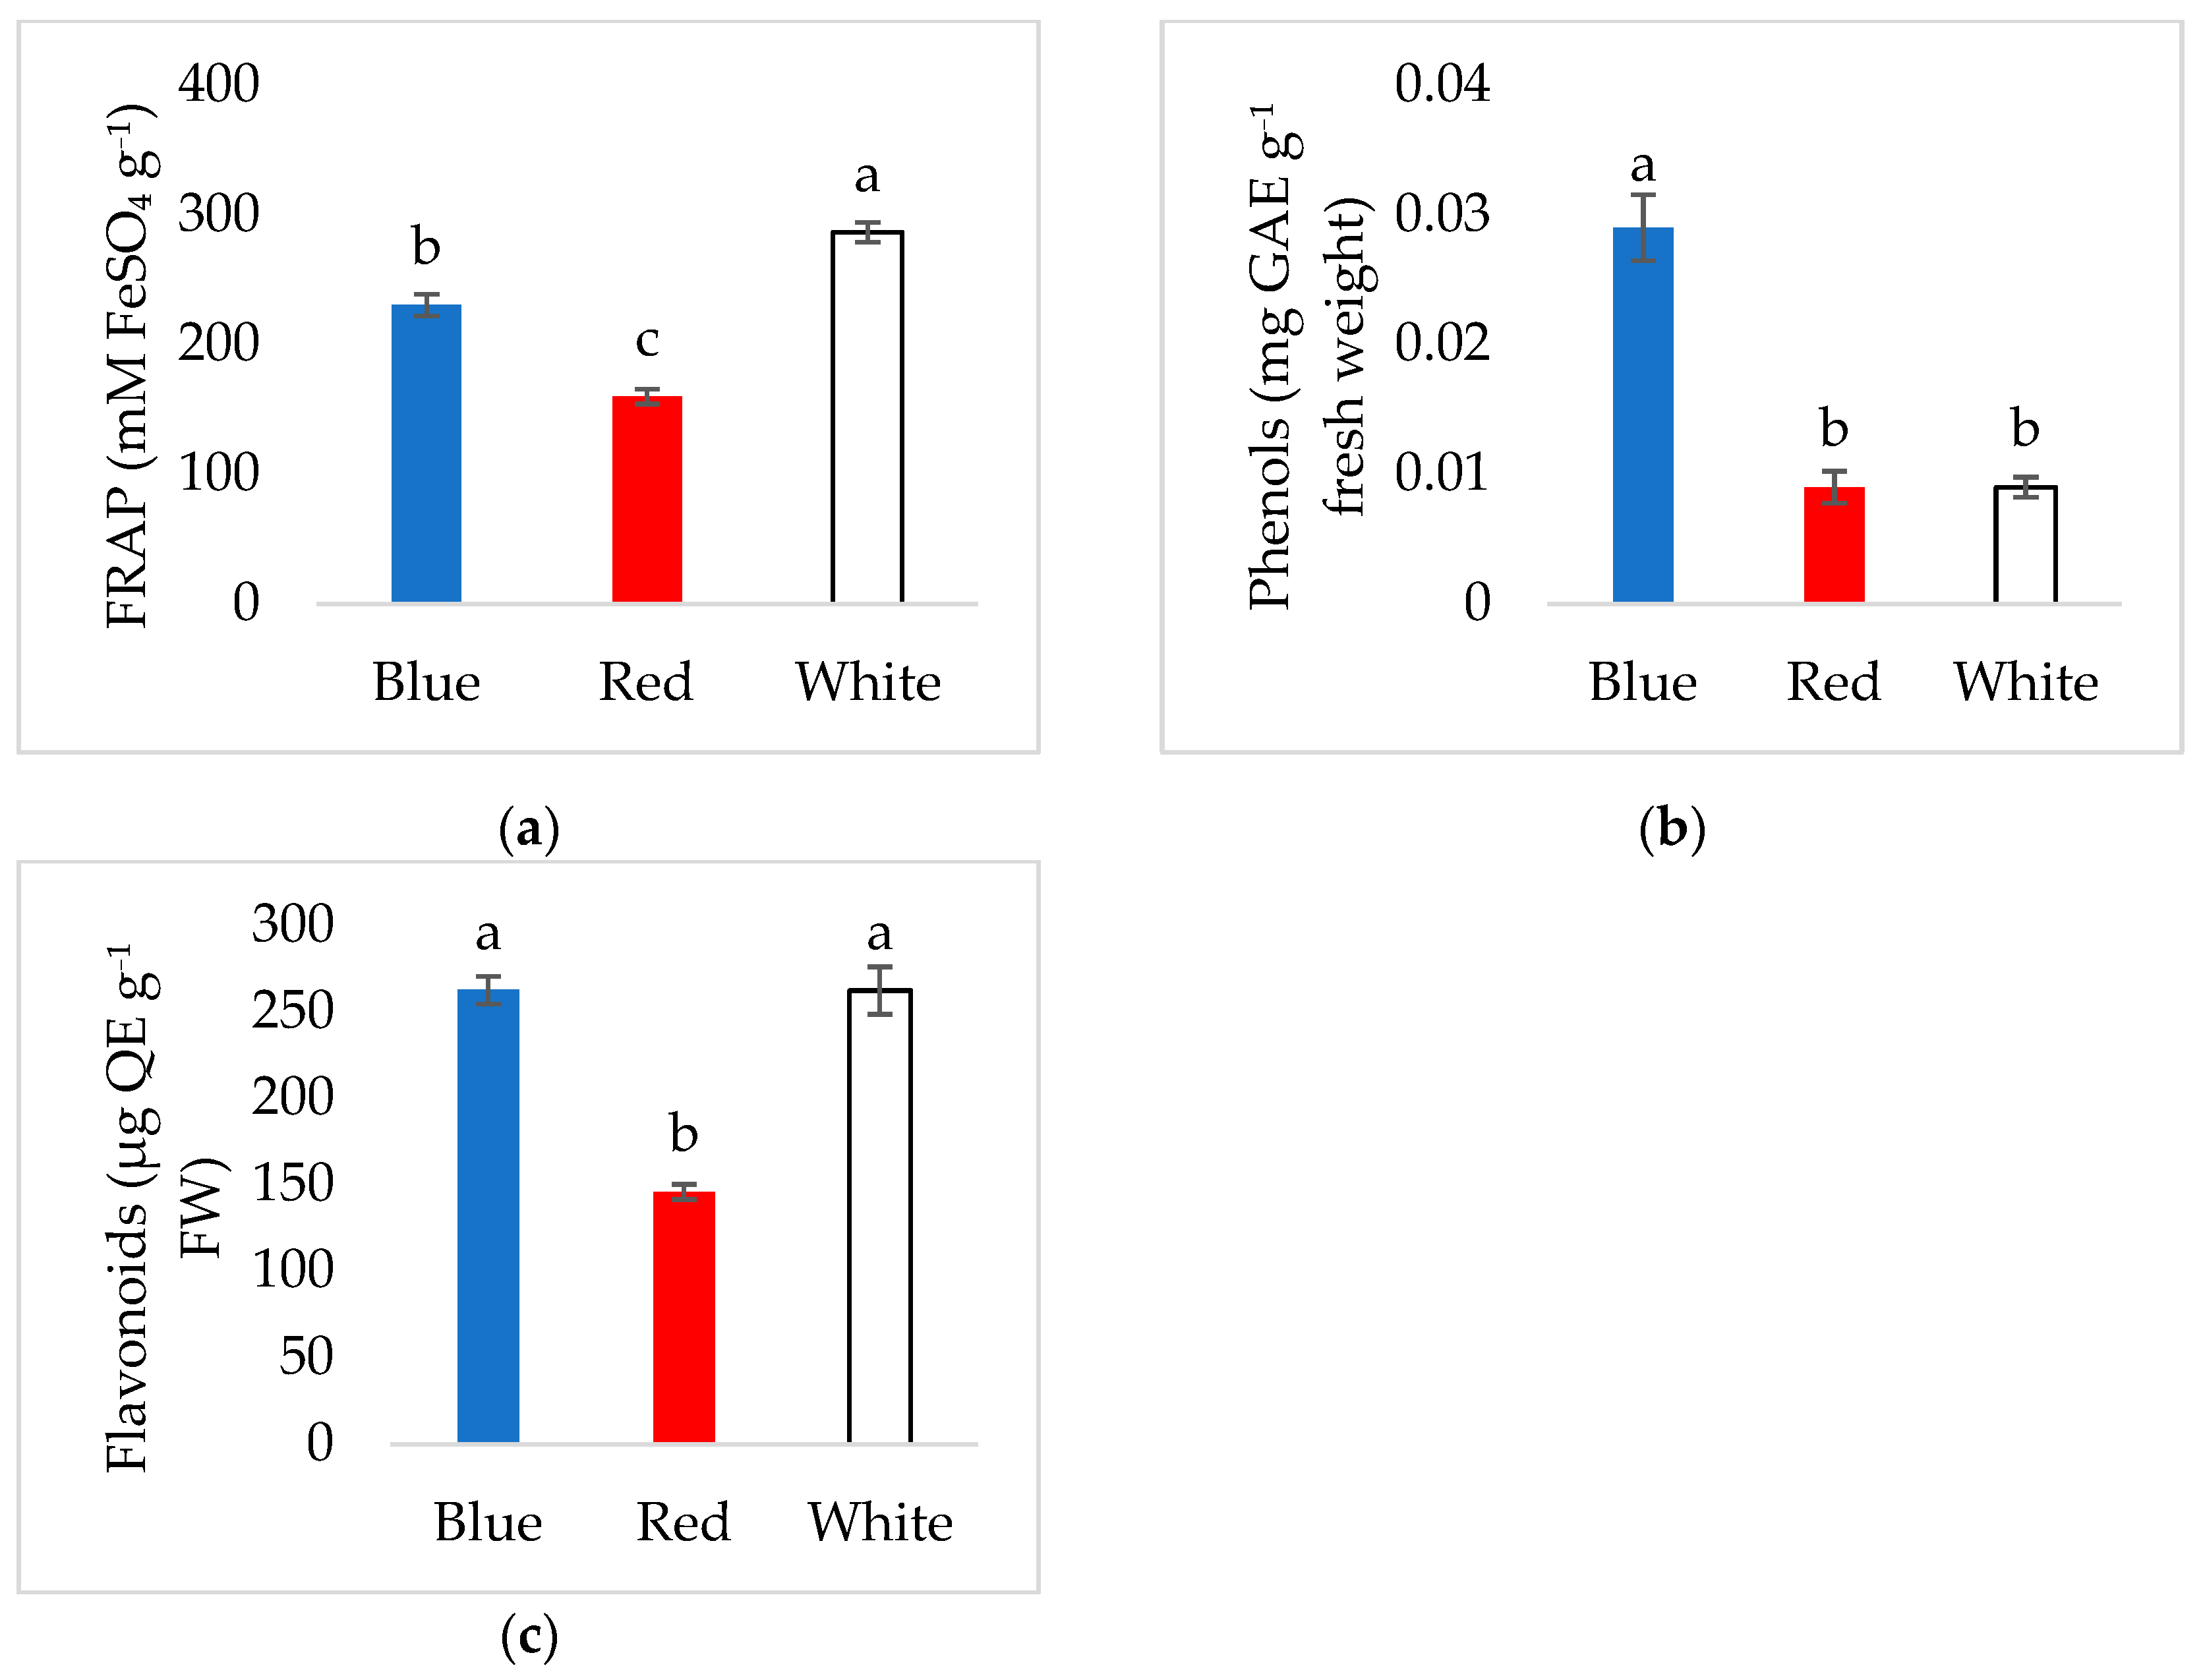
Total antioxidant activity in young Verbascum leaves, assessed via the FRAP assay, was markedly affected by the light treatments. Because PPFD was not equal across spectra, part of the observed variation may reflect differences in light intensity rather than spectral quality alone, as PPFD can modulate ROS formation and antioxidant responses. The highest total antioxidant activity (286.52 mM FeSO4 g−1 FW) was observed under white light, followed by blue light (230.46 mM FeSO4 g−1 FW), while the lowest value was recorded under red light (159.95 mM FeSO4 g−1 FW). These results indicate that white light promoted the greatest antioxidant capacity in young V. phlomoides seedlings, exceeding that under blue and red light by 24.3% and 79.1%, respectively (Figure 3a).
Figure 3. Antioxidant activity, total phenols and flavonoids content of young orange mullein (Verbascum phlomoides L.) leaves in relation to different light (a) FRAP (mM FeSO4 g−1), (b) Phenols (mg GAE g−1 fresh weight) and (c) Flavonoids (µg QE g−1 FW). Error bars represent standard deviation. Different letters indicate a significant difference at p < 0.05.
Previous studies have reported high antioxidant potential in Verbascum species. For instance, Kolarov et al. [56] found that methanolic extracts of V. phlomoides leaves exhibited strong antioxidant activity, with FRAP values reaching up to 48.18 mg Trolox equivalents per gram of dry weight. Furthermore, Grigorov et al. [20] reported DPPH values of 157.04 μg/m in Verbascum phlomoides leaves, confirming the naturally high antioxidant capacity of this species.
The observed light-dependent differences in antioxidant activity can be explained through the modulation of reactive oxygen species (ROS) and associated antioxidant systems. ROS levels in plants are maintained by enzymatic antioxidants (SOD, CAT, POD) and non-enzymatic compounds such as phenols and flavonoids, which are activated under stress conditions or in response to high-energy light (short-wavelength light such as blue or UV) [57]. Excess ROS generated under specific light conditions can act as signalling molecules, inducing antioxidant enzyme activities and secondary metabolite accumulation [58]. In this context, the lower antioxidant activity under red light may reflect a tendency to reduce ROS stimulation and consequently lower activation of the antioxidant system, whereas white light, containing both short and long wavelengths, likely promotes a more balanced ROS generation and optimal antioxidant response.
The phenol content was influenced by blue light, with significantly higher values recorded compared to red and white light. Blue light significantly increased phenol content, with red and white light resulting in 69% lower values compared to blue light (Figure 3b). Regarding flavonoid content, exposure to red light resulted in a reduction relative to white light, whereas exposure to blue light did not lead to a significant difference compared with white light. These findings are consistent with previous research by Thongtip et al. [59], who reported that exposure to blue light significantly increased total phenolics and flavonoids in microgreens of some Lamiaceae species, whereas red light had a less pronounced effect or even tended to reduce some flavonoid compounds. Blue wavelengths may stimulate the biosynthesis of phenolic compounds, potentially through the activation of phenylpropanoid pathways, while red light might inhibit certain flavonoid biosynthetic processes [60].
Monochromatic blue LED light effectively enhances flavonoid accumulation in various plant species, supporting its potential application in controlled cultivation systems to optimise the production of antioxidant-rich compounds. In the study by Ma et al. [61], monochromatic blue LED light significantly increased the accumulation of flavonoids in Scutellaria baicalensis compared to other light treatments, while Moradi et al. [62] reported that saffron plants grown under 100% blue light exhibited the highest flavonoid content, nearly 1.5 times higher than those grown under white light.
Since PPFD varied across the spectra, the observed antioxidant responses should be interpreted as the result of the interacting effects of light intensity and spectral quality. However, such responses are highly species-specific and may depend on mullein’s developmental stage.

3.4. Leaf Area and Specific Leaf Area of Young Verbascum Leaves

In Figure 4, the results of leaf area (a) and specific leaf area (b) of young Verbascum phlomoides L. plants are presented. Leaf area did not differ significantly between white light and the other treatments. The highest leaf area value was recorded under blue light, 26.69% higher than under white light, while the smallest was recorded under red light, 29.88% lower than under white light. Compared with red light, blue light resulted in an 80.68% greater leaf area. These results are consistent with previous studies showing that blue light promotes leaf expansion in various plant species. For example, Johkan et al. [48] reported that blue light increased LA in Lactuca sativa compared to red and FLUO lighting. Also, blue LED light significantly increased LA in soybean (Glycine max) seedlings compared to red light [44]. The increase in LA under blue light may be attributed to the activation of photoreceptors such as phototropins and cryptochromes, which promote cell elongation and leaf expansion [31,63].
Figure 4. (a) Leaf area (cm2) and (b) Specific leaf area (cm2/DM) of young orange mullein (Verbascum phlomoides L.) leaves in relation to different light conditions. Error bars represent standard deviation. Different letters indicate a significant difference at p < 0.05.
In contrast, the highest specific leaf area values were recorded in young Verbascum phlomoides L. plants grown under red light, differing significantly from the other two light treatments. No statistically significant difference was observed between white and blue light. Specific leaf area (SLA) is an important morphological trait reflecting leaf thickness and density, and it is often used as an indicator of how plants optimise light capture relative to leaf biomass. Monochromatic red light increased SLA in tomato plants, likely as a morphological adaptation to optimise light absorption under a narrow spectral range. Higher SLA under red light may enhance light capture efficiency per unit leaf mass but can also reduce photosynthetic capacity per unit area, reflecting a trade-off between leaf morphology and photosynthetic performance [64].
Because PPFD varied across the spectra, the leaf area and SLA responses observed here likely reflect the combined effects of spectral composition and light intensity rather than the spectrum alone. Thus, while blue and red wavelengths clearly influenced leaf morphology, their effects were modulated by differences in photon flux density across treatment. Moreover, such responses are highly species- and stage-specific; therefore, the present findings should be interpreted as specific to 30-day V. phlomoides seedlings.

3.5. Chlorophyll Fluorescence Parameters

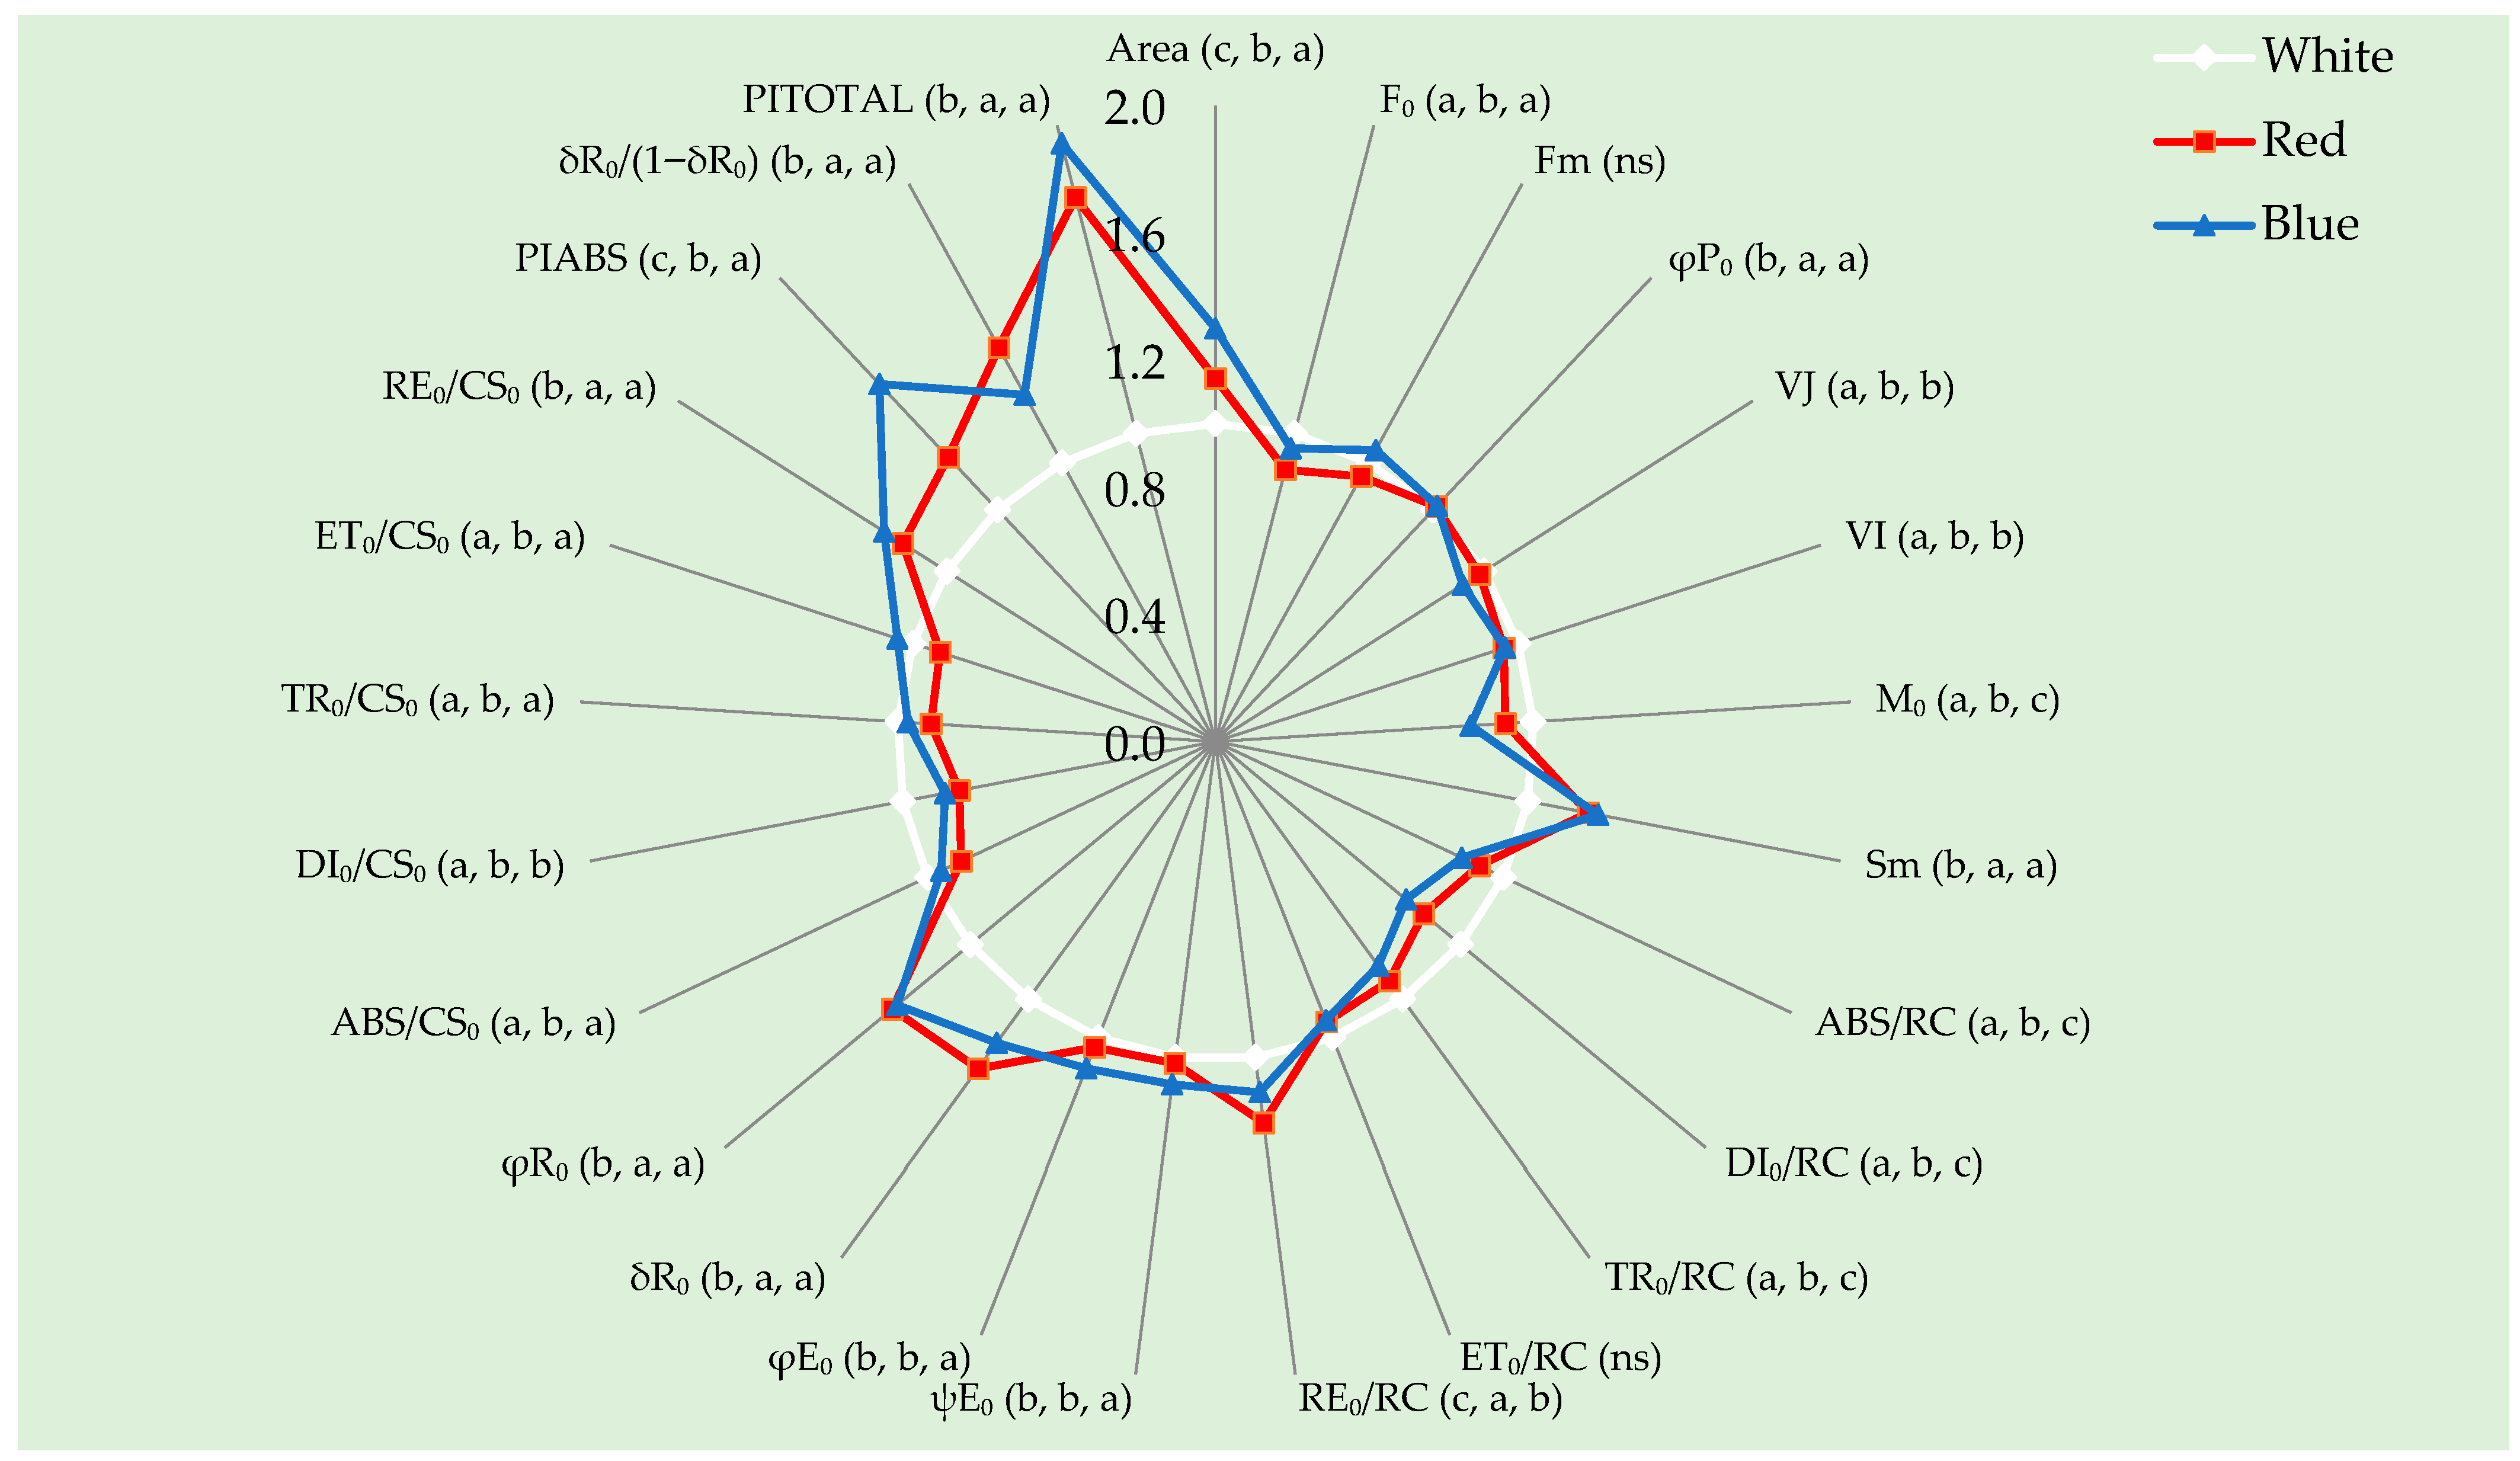
The effects of different light spectra on chlorophyll a fluorescence (ChlF) parameters in mullein grown in controlled conditions of a growth chamber when grown under white, red and blue light are shown in Figure 5. Since PPFD values differed among spectra, the resulting fluorescence parameters represent combined responses to both spectral quality and light intensity. White light was used as a reference value for comparison with red and blue lighting conditions.
Figure 5. Chlorophyll a fluorescence parameters in mullein (Verbascum phlomoides L.) grown under white, red, and blue light. Abbreviations of parameters are provided in the Section 2. Lines represent means (n = 12) of light relative to control (white light/line = 1). Letters in parentheses next to each parameter indicate statistical significance: the first letter corresponds to mullein grown under white light, the second to red light, and the third to blue light. Different letters indicate a significant difference at p < 0.05. NS denotes that differences between treatments were not statistically significant.
White light (control) treatment produced the highest values for VI (relative variable fluorescence at the I step), ABS/RC (absorption flux per PSII reaction center), DI0/RC (energy dissipated as heat per PSII reaction center), and TR0/RC (trapped energy flux leading to primary quinone (QA) reduction per RC) compared to red and blue light treatments. The higher VI points to a faster accumulation of intermediates between QA and secondary quinone (QB), reflecting a higher rate of electron transfer between PSII and the plastoquinone pool under white light conditions [37]. The higher ABS/RC indicates a greater amount of energy absorbed per active PSII reaction centre, which may reflect either a larger effective antenna size or a lower number of active reaction centres under white light [37]. The simultaneous increase in TR0/RC suggests that a larger proportion of this absorbed energy was used for photochemical charge separation, resulting in more electrons being transported from reduced QA to the plastoquinone pool. However, the elevated DI0/RC also indicates that more energy was dissipated as heat under white light, potentially as a protective mechanism to prevent overexcitation and maintain PSII stability [65]. Bayat et al. [66] examined the effects of growth under different light spectra on the subsequent high light tolerance in rose plants. In control samples, they found that white light was the cause of high values of ABS/RC, TR0/RC and DI0/RC, which is consistent with the results of this study. This suggests that white light, as a full-spectrum illumination resembling natural sunlight, promotes a balanced adjustment of energy utilisation and dissipation within PSII [31]. In contrast, Yang et al. [67] found in purple cabbage that ABS/RC, TR0/RC, and ET0/RC (electron transport flux beyond QA per RC) did not differ between white and blue light, while DI0/RC was lowest under white light, but all parameters markedly increased under red illumination. This highlights that the spectral responses of PSII vary considerably across plant species and developmental stages, emphasising species- and stage-specificity.
Blue light treatment resulted in the highest values for Area (total complementary area above the OJIP transient curve), ψE0 (probability that a trapped exciton moves an electron beyond QA), φE0 (quantum yield of electron transport beyond QA), PIABS (performance index on absorption basis), and PITOTAL (overall performance index including PSI activity) compared to red and white (control) light. The increase in Area under blue light indicates a larger electron acceptor pool on the PSI side, reflecting an apparent enhancement in the capacity of the photosynthetic apparatus to process electrons beyond QA [37]. The higher ψE0 and φE0 supported this. Together, these parameters indicate that blue light, under the specific PPFD conditions applied, improved the efficiency of linear electron flow, thereby facilitating a more effective reduction of the plastoquinone pool and PSI end acceptors [68,69]. However, differences in PPFD among treatments may also have contributed to these effects. Consequently, the increases in PIABS demonstrate that blue light significantly appeared to enhance both PSII performance and the overall photosynthetic performance index, which integrates energy absorption, trapping, and electron transport into a single measure [37]. These findings are consistent with reports that blue light under the tested PPFD may stimulate PSII repair and upregulate photosynthesis-related genes, leading to improved photosynthetic capacity [31,54]. Similar findings for PIABS were observed in purple cabbage, where different combinations of monochromatic light were tested. Blue light induced the highest PIABS values, whereas both white and red light resulted in equally low values [67]. Partially contrary to the findings in this study, white light was also found to cause low values of ψE0, φE0 and PIABS in roses. However, while in their study the highest values of these parameters were recorded under red light, in this study they were achieved under blue light [66]. On the other hand, blue light did not have the same effect on pea seedlings. In the study by Zhiponova et al. [70], white light was found to be the cause of the increase in φE0, PIABS and PITOTAL.
Red light treatment resulted in the highest values only for RE0/RC (electron flux reducing end acceptors of PSI per RC) compared to blue and white (control) light. In contrast to these results, the highest RE0/RC activity was determined in pea under the influence of white light [70]. The RE0/RC parameter reflects the electron flow that reduces PSI end-acceptors across the active PSII reaction centre [37]. Its increase under red light indicates that a larger number of electrons were successfully transported out of QA and utilised on the PSI acceptor side. This suggests that red light specifically stimulated electron flow in mullein plants towards the end of the electron transport chain, under the applied PPFD. Although red wavelengths efficiently drive photosynthetic electron transport, they can lead to excitation imbalance when used as the sole light source [31]. Overall, these findings suggest that red light, under the specific PPFD conditions applied, primarily increased the efficiency of electron transport in the terminal part of the photosynthetic electron transport chain, rather than having a general effect on PSII performance. However, differences in PPFD among treatments may also have contributed to these effects. This result is consistent with evidence that red light supports efficient charge separation and electron flow, but may require the presence of other wavelengths, such as blue light, for optimal regulation of PSII repair and excitation balance [68,69].
Red and blue monochromatic lights also induced pronounced changes in φP0 (maximum quantum yield of PSII photochemistry is an indicator of the photosynthetic efficiency of PSII), Sm (normalised area), δR0 (efficiency/probability that an electron moves from reduced intersystem carriers to PSI end acceptors), φR0 (quantum yield for reduction of PSI end acceptors), RE0/CS0 (electron flux reaching PSI per cross-section), δR0/(1 − δR0) (ratio expressing the efficiency of PSI electron acceptor reduction) and PITOTAL compared to white light. The increase in φP0 indicates a higher maximum quantum efficiency of PSII photochemistry, suggesting that these light qualities maintained PSII in a more optimal functional state [70]. The aforementioned increase in φP0 under red and blue light has also been confirmed in rose leaves [69]. In contrast, in mini green romaine lettuce, φP0 was lowest under red light, with no significant differences observed among the other treatments [71]. Furthermore, higher Sm values reflect a larger pool of electron carriers between QA and PSI end acceptors, implying a greater potential for electron transport and possibly an enhanced capacity of the photosynthetic apparatus to buffer excitation energy [37]. The observed increases in δR0 and φR0 indicate improved electron transfer efficiency to PSI end acceptors and a higher quantum yield of their reduction. White light and a combination of red and blue light at Pisum sativum seedlings also caused higher φR0 [70]. Similarly, the significant rise in RE0/CS0 indicates an increased electron flux per excited cross-section, leading to PSI reduction, which is consistent with the appearance of enhanced PSI activity under red and blue light [68]. The elevated δR0/(1 − δR0) further confirms that red and blue light promoted more efficient electron flow through the entire photosynthetic electron transport chain. The similarly high PITOTAL values observed under both red and blue light suggest that these spectral regions effectively support photosynthetic performance in mullein. Lee et al. [72] observed that PIABS and PITOTAL were significantly higher under blue light, while they decreased under red light in lettuce. Together, these results suggest that red and blue light not only sustain PSII photochemistry but also enhance PSI reduction, leading to improved overall photosynthetic electron transport capacity. These observations highlight that responses are species- and stage-specific and should not be overgeneralized. These observations align with previous studies, which have shown that red light supports PSII quantum efficiency, while blue light stimulates PSI activity and cyclic electron flow, resulting in a balanced and efficient photosynthetic electron transport network [31,69].
No significant differences were found among light treatments for Fm (fluorescence intensity when all PSII RCs are closed after a saturating light pulse) and ET0/RC, indicating that the maximal fluorescence yield and electron transport per reaction centre were not affected by spectral quality, and that no severe PSII photoinhibition occurred. Similar stability of Fm under different light qualities has been observed in Arabidopsis and tomato under moderate light intensities [73]. Contrary to these results, ET0/RC increased when testing the effect of different light spectra on the rose under the influence of white, blue and red light, respectively [66].
Therefore, fluorescence-based parameters should be viewed as indicative of overall responses to both light intensity and spectral composition. This interpretation aligns with the need to consider unequal PPFD as a contributing factor in photosynthetic performance differences.

3.6. OJIP Transient Curve

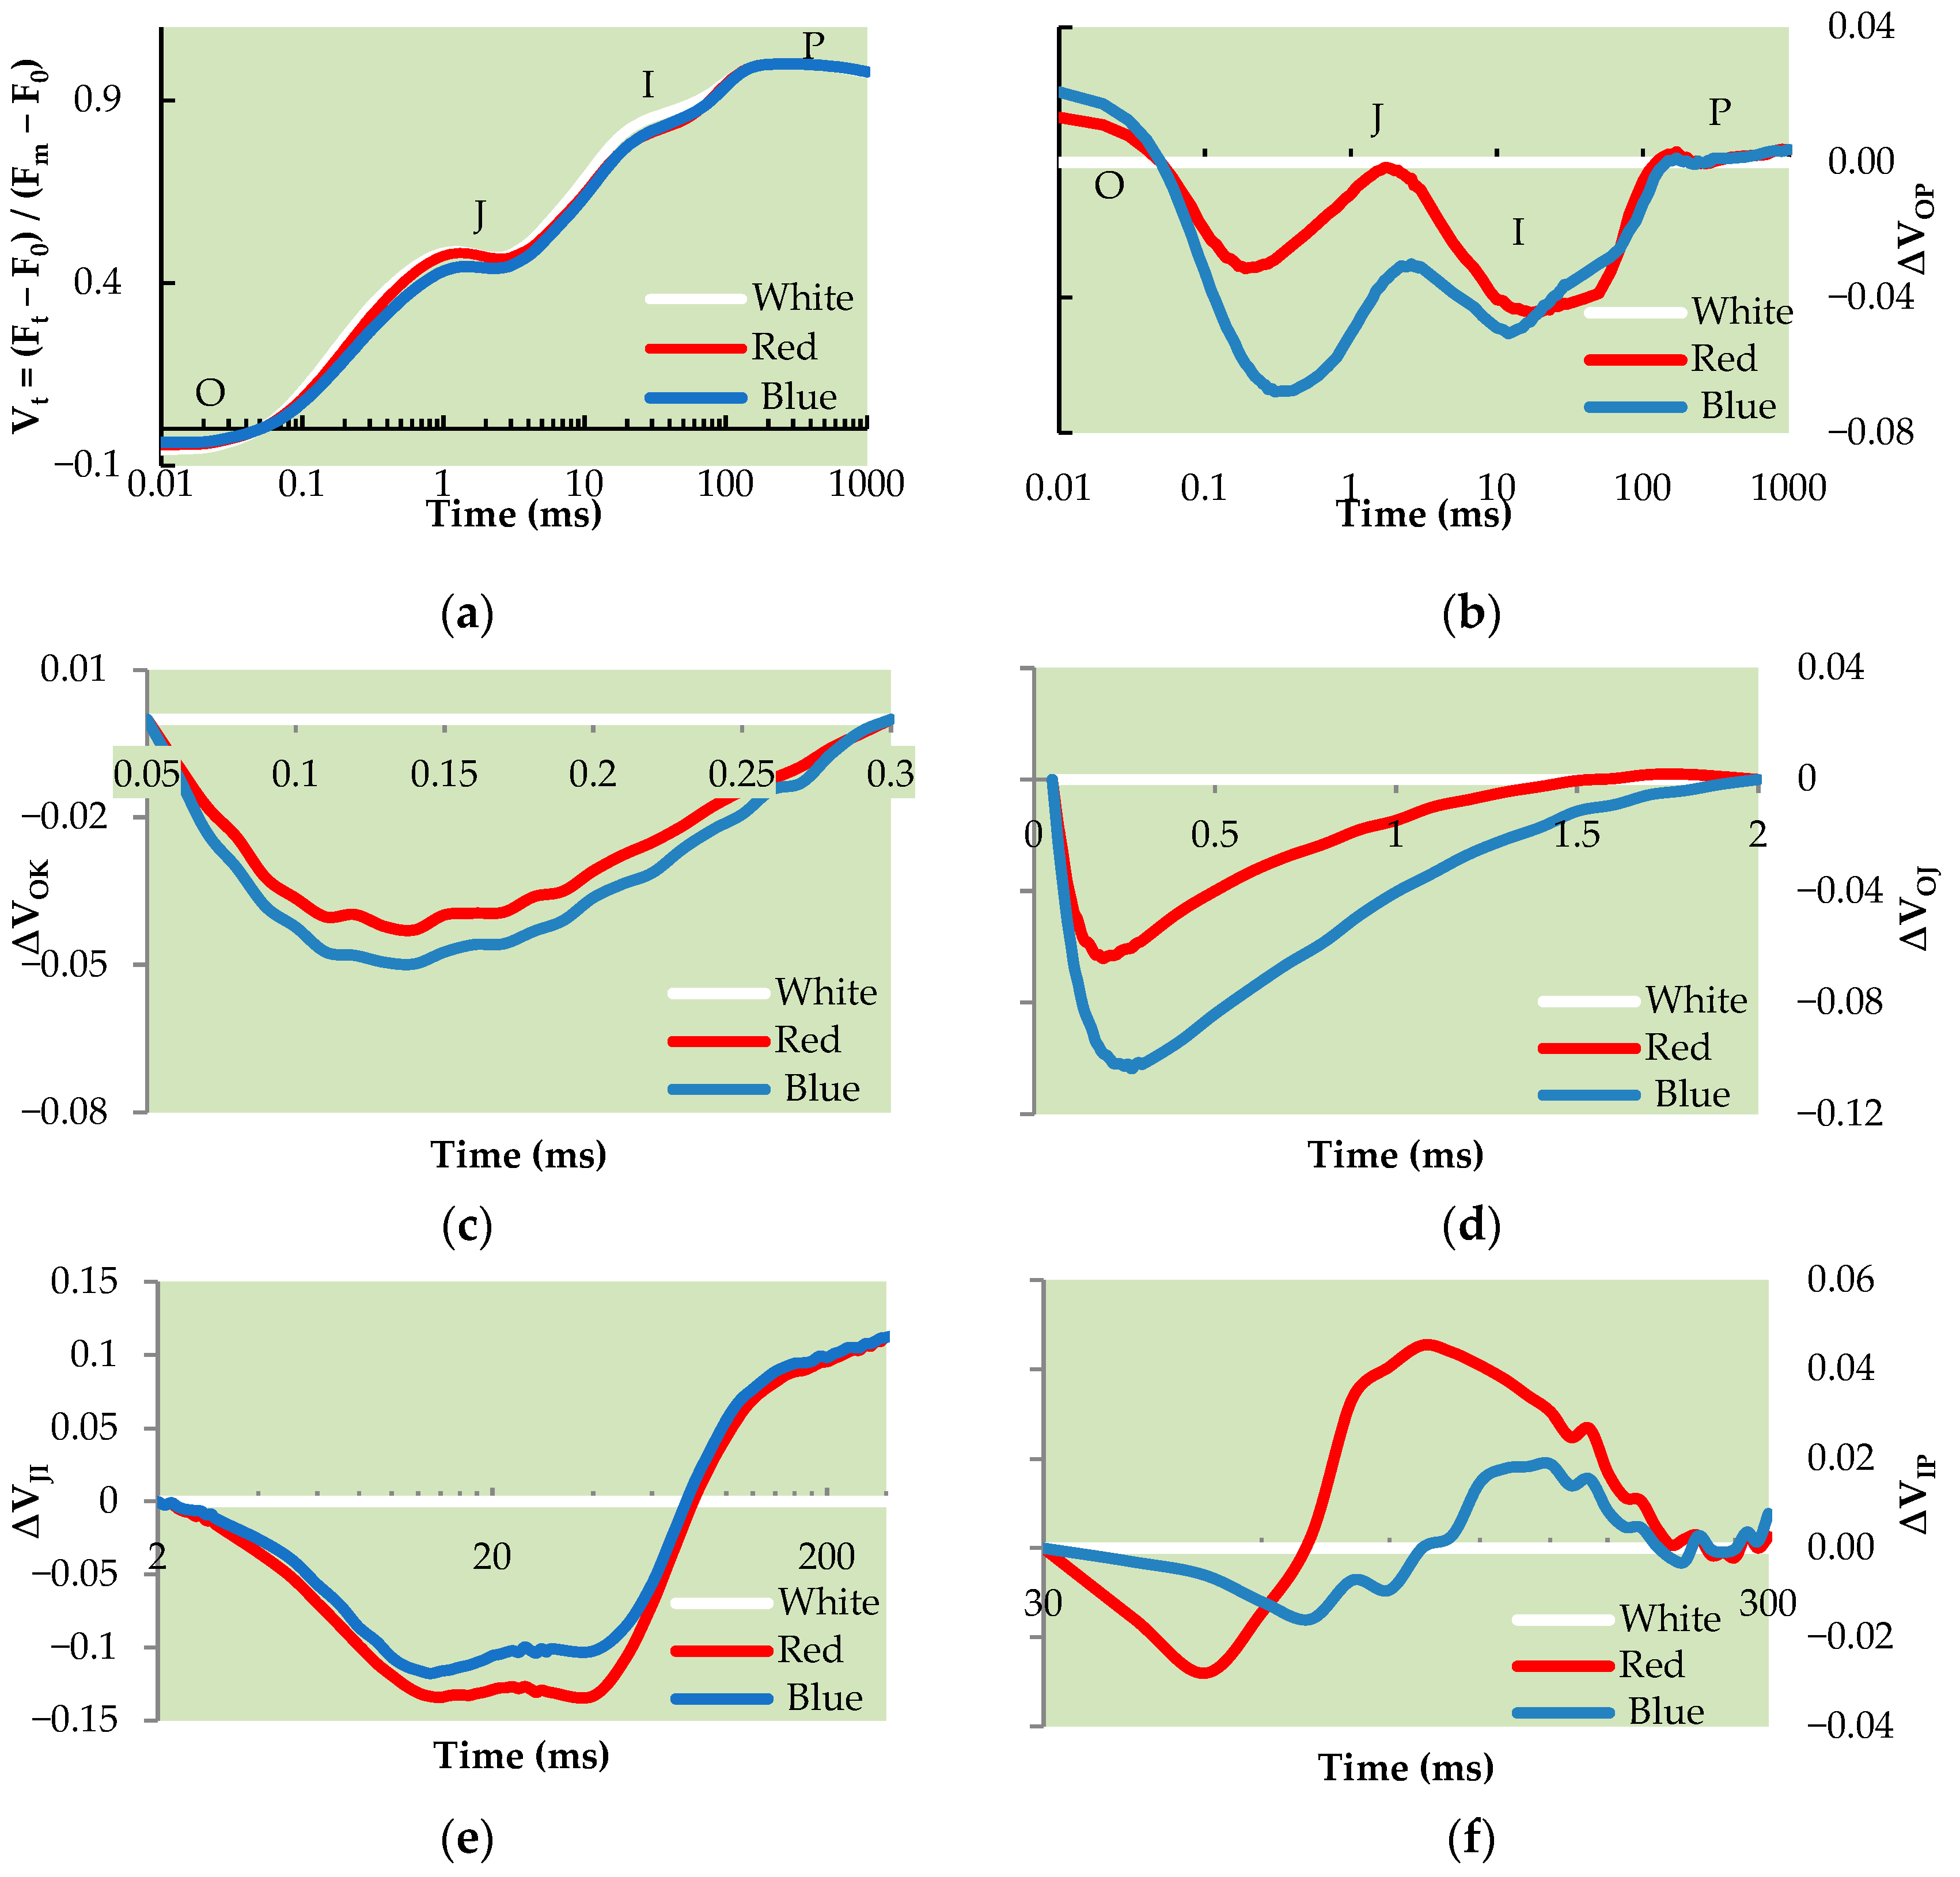
The effects of different light colours on mullein growth were also reflected in the shape and dynamics of the OJIP fluorescence curves (Figure 6). Both spectral quality and the differences in PPFD among treatments influenced the OJIP kinetics. Both blue and red light produced negative kinetics in the variable fluorescence difference (ΔVOP), as well as in the L, K and H bands, with more pronounced deviations under blue light exposure. On the other hand, a distinct difference was observed in the G-band. Namely, red light induced a positive curve, while blue light caused a transition from a negative to a positive curve at about 100 ms on a logarithmic time scale, highlighting a species- and stage-specific response. These results indicate similar changes in the behaviour of PSII under these two spectral conditions. Namely, both spectral regions affected the donor and acceptor sides of PSII comparably but differed in their influence on PSI-related processes and downstream electron transport.
Figure 6. Shapes and amplitudes of the OJIP transient curve determined on mullein grown under three different illuminations are shown as kinetics of relatively variable fluorescence Vt (a) and as kinetics of the difference ∆VOP (b). The kinetics of the difference ∆Vt for individual bands L (c), K (d), H (e) and G (f) are shown at different time scales. Steps O, J, I and P are indicated in the Vt and ∆VOP curves.
The negative L band observed under both red and blue light implies an increase in the energy connecting the PSII parts. This indicates coordination and efficiency of excitation energy transfer between neighbouring PSII units, which is probably an adaptive response of mullein plants to monochromatic light exposure [74]. Also, the negative K bands observed under both colours of light reflect a stable donor side of PSII and efficient electron donation to the QA acceptor. Conversely, a positive K band usually indicates damage to the OEC (oxygen-evolving complex) or stress on the donor side [75]. Therefore, the negative K bands in this study imply that neither red nor blue light caused photoinhibition on the donor side. The H bend, which represents the redox state of the plastoquinone (PQ) pool and the rate of electron transfer from QA to secondary quinone (QB) [76], was also negative under both spectral treatments. This suggests that the PQ pool remained reduced or that electron flow to PSI was temporarily faster than the reoxidation rate, indicating a dynamic balance between PSII electron donation and PSI acceptor capacity. The curves in the G bend were the only ones that differed between the blue and red light treatments. Under the effect of red light, a positive G bend was observed, indicating a limitation on the PSI acceptor side that is likely due to the accumulation of reduced ferredoxin or NADPH and slower P700 reoxidation [37]. In contrast, under blue light, the curve initially showed a negative deviation that turned positive around 100 ms. This suggests a dynamic adaptation of the PSI acceptor capacity, with rapid, early electron transfer followed by a transient saturation. In contrast to these results, Li et al. [77] reported that sweet pepper (Capsicum annuum L.) responded positively to both red and blue LED treatments in the L, K, and G bends. The observed modifications in OJIP curves thus likely reflect integrated responses to both light spectrum and photon flux density.

4. Conclusions

Since PPFD values were not equal across spectra, the observed results should be interpreted as the combined effects of spectrum and light intensity rather than light quality alone. Under the tested PPFD, blue light stimulated an increase in all morphological traits as well as leaf area, most pigment parameters, and resulted in the highest phenolic and flavonoid contents. Under white light, the highest antioxidant activity was recorded, and under red light, the highest specific leaf area was observed. These findings indicate that blue light contributes to the growth and development of high-quality Verbascum phlomoides L. seedlings. Since red light resulted in the lowest values for all investigated parameters, it can be concluded that the monochromatic use of red light is not suitable for seedling production. The photosynthetic apparatus of mullein exhibited different responses to blue and red light. Blue light appeared to enhance linear electron flow, photosystem I activity, and overall photosynthetic performance. Red light appeared to enhance electron transport toward the terminal part of the photosynthetic electron transport chain. Both blue and red light supported PSII photochemistry and maintained excitation energy balance. They also induced adaptive modifications in OJIP transition states. Observed changes in electron transport may indicate adjustments to different PPFDs among light spectra. Future studies using equal PPFD across spectra are needed to fully isolate spectral effects and determine their independent contribution to photosynthetic efficiency.

Author Contributions

Conceptualisation, M.T.K., A.M.K. and I.V.; methodology, M.T.K., A.M.K. and J.J.; software, J.J.; validation, T.V.; formal analysis, B.R.; investigation, M.T.K., A.M.K. and B.R.; resources, M.Đ.; writing—original draft preparation, M.T.K. and A.M.K.; writing—review and editing, T.V. and M.S.; supervision, T.V. and N.P.; project administration, T.V. All authors have read and agreed to the published version of the manuscript.

Funding

This work was funded by the European Union under the European Agricultural Fund for Rural Development (EAFRD) through the implementation of Intervention 70.05. ‘Support for the conservation, sustainable use and development of genetic resources in agriculture’ of the Republic of Croatia‘s Common Agricultural Policy Strategic Plan 2023–2027. Project funding number: 950-05/25-70-05/0012.

Institutional Review Board Statement

Not applicable.

Data Availability Statement

The original contributions presented in this study are included in the article. Further inquiries can be directed to the corresponding author.

Conflicts of Interest

Author Mario Đurić was employed by the company ALKALOID d.o.o. The remaining authors declare that the research was conducted in the absence of any commercial or financial relationships that could be construed as potential conflicts of interest.

References

  1. Nikolić, T. (Ed.) Verbascum phlomoides L. Flora Croatica Database; Faculty of Science, University of Zagreb: Zagreb, Croatia, 2015; Available online: http://hirc.botanic.hr/fcd (accessed on 6 October 2025).
  2. Ghahremani, A.; Pirbalouti, A.G.; Mozafari, H.; Habibi, D.; Sani, B. Phytochemical and morpho-physiological traits of mullein as a new medicinal crop under different planting pattern and soil moisture conditions. Ind. Crops Prod. 2020, 145, 111976. [Google Scholar] [CrossRef]
  3. Marian, E.; Gratiela Vicas, L.; Jurca, T.; Muresan, M.; Pallag, A.; Stan, R.L.; Sevastre, B.; Diaconeasa, Z.; Ionescu, C.M.L.; Hangan, A.C. Salvia officinalis L. and Verbascum phlomoides L.: Chemical, antimicrobial, antioxidant and antitumor investigations. Rev. Chim. 2018, 69, 365–370. [Google Scholar] [CrossRef]
  4. Garg, R.; Dobhal, K.; Singh, A. Utilization of Medicinal Herbal Plants in the Management of Respiratory Conditions. In Immunopathology of Chronic Respiratory Diseases; Athari, S.S., Nasab, E.M., Eds.; IntechOpen: London, UK, 2024. [Google Scholar] [CrossRef]
  5. Blanco-Salas, J.; Hortigón-Vinagre, M.P.; Morales-Jadán, D.; Ruiz-Téllez, T. Searching for scientific explanations for the uses of Spanish folk medicine: A review on the case of mullein (verbascum, Scrophulariaceae). Biology 2021, 10, 618. [Google Scholar] [CrossRef]
  6. Mihaylova, R.; Elincheva, V.; Gevrenova, R.; Zheleva-Dimitrova, D.; Momekov, G.; Simeonova, R. Targeting inflammation with natural products: A mechanistic review of iridoids from Bulgarian medicinal plants. Molecules 2025, 30, 3456. [Google Scholar] [CrossRef]
  7. Pongkitwitoon, B.; Putalun, W.; Triwitayakorn, K.; Kitisripanya, T.; Kanchanapoom, T.; Boonsnongcheep, P. Anti-inflammatory activity of verbascoside- and isoverbascoside-rich Lamiales medicinal plants. Heliyon 2024, 10, e23644. [Google Scholar] [CrossRef] [PubMed]
  8. Grigorov, M.; Pavlović, D.; Zlatković, B.; Dragićević, A.; Tadić, V.; Matejić, J.; Mladenović Antić, S.; Ilić, D.; Nešić, I. Comparative study of three Verbascum species (V. phlomoides, V. niveum and V. speciosum)—Chemical characterisation and biological activities. Nat. Prod. Commun. 2025, 20, 1–15. [Google Scholar] [CrossRef]
  9. Angeloni, S.; Zengin, G.; Sinan, K.I.; Ak, G.; Maggi, F.; Caprioli, G.; Kaplan, A.; Bahşi, M.; Çakılcıoğlu, U.; Bouyahya, A.; et al. An insight into Verbascum bombyciferum extracts: Different extraction methodologies, biological abilities and chemical profiles. Ind. Crops Prod. 2021, 161, 113201. [Google Scholar] [CrossRef]
  10. Paun, G.; Neagu, E.; Albu, C.; Radu, G.L. Verbascum phlomoides and Solidago virgaureae herbs as natural source for preventing neurodegenerative diseases. J. Herb. Med. 2016, 6, 180–186. [Google Scholar] [CrossRef]
  11. Armatu, A.; Bodîrlău, R.; Nechita, C.B.; Niculaua, M.; Teacă, C.A.; Ichim, M.; Spiridon, I. Characterization of biologically active compounds from Verbascum phlomoides by chromatography techniques. I. Gas chromatography. Rom. Biotechnol. Lett. 2011, 16, 6297–6304. [Google Scholar]
  12. Yılmaz, M.; Genç, G.E. Overview of ethnobotanical, phytochemical and biological activity relations of Verbascum species in worldwide. Turk. J. Biod. 2024, 7, 131–154. [Google Scholar] [CrossRef]
  13. Lisjak, M.; Ocvirk, D.; Špoljarević, M.; Teklić, T.; Liović, I.; Špoljarić Marković, S.; Volenik, M.; Mijić, A. The effect of seed priming with hydrogen sulfide on germination and biochemical indicators of drought stress in sunflower seedlings. Poljoprivreda 2025, 31, 1–12. [Google Scholar] [CrossRef]
  14. Negi, S.; Kumar, P.; Kumar, A.; Kumar, V.; Irfan, M. Environmental variables affecting apple fruit development and bioactive compounds: Biochemical insights and biotechnological advances. J. Plant Growth Regul. 2025, 1–20. [Google Scholar] [CrossRef]
  15. Rapčan, I.; Radočaj, D.; Jurišić, M. A length-of-season analysis for maise cultivation from the land-surface phenology metrics using the Sentinel-2 images. Poljoprivreda 2025, 31, 92–98. [Google Scholar] [CrossRef]
  16. Zhang, J.; Ge, J.; Dayananda, B.; Li, J. Effect of light intensities on the photosynthesis, growth and physiological performances of two maple species. Front. Plant Sci. 2022, 13, 999026. [Google Scholar] [CrossRef]
  17. Varga, I.; Kristić, M.; Lisjak, M.; Tkalec Kojić, M.; Iljkić, D.; Jović, J.; Kristek, S.; Markulj Kulundžić, A.; Antunović, M. Antioxidative Response and Phenolic Content of Young Industrial Hemp Leaves at Different Light and Mycorrhiza. Plants 2024, 13, 840. [Google Scholar] [CrossRef]
  18. Süntar, İ.; Tatlı, I.I.; Akkol, E.K.; Keleş, H.; Kahraman, Ç.; Akdemir, Z. An ethnopharmacological study on Verbascum species: From conventional wound healing use to scientific verification. J. Ethnopharmacol. 2010, 132, 408–413. [Google Scholar] [CrossRef]
  19. Gupta, A.; Atkinson, A.N.; Pandey, A.K.; Bishayee, A. Health--promoting and disease--mitigating potential of Verbascum thapsus L. (common mullein): A review. Phytother. Res. 2022, 36, 1507–1522. [Google Scholar] [CrossRef] [PubMed]
  20. Grigorov, M.; Pavlović, D. Quality control, phenolic content and in vitro antioxidant potential of orange mullein flower and leaf. Biol. Nyssana 2021, 12, 123–129. [Google Scholar] [CrossRef]
  21. Idris, A.; Linatoc, A.C.; Bakar, M.F.A.; Ibrahim, Z.T.; Audu, Y. Effect of light quality and quantity on the accumulation of flavonoid in plant species. J. Sci. Technol. 2018, 10, 32–45. [Google Scholar] [CrossRef]
  22. Jaakola, L.; Hohtola, A. Effect of latitude on flavonoid biosynthesis in plants. Plant Cell Environ. 2010, 33, 1239–1247. [Google Scholar] [CrossRef] [PubMed]
  23. Shi, Y.; Ke, X.; Yang, X.; Liu, Y.; Hou, X. Plants Response to Light Stress. J. Genet. Genom. 2022, 49, 735–747. [Google Scholar] [CrossRef]
  24. Chen, M.; Chory, J.; Fankhauser, C. Light signal transduction in higher plants. Annu. Rev. Genet. 2004, 38, 87–117. [Google Scholar] [CrossRef]
  25. Hogewoning, S.W.; Trouwborst, G.; Maljaars, H.; Poorter, H.; van Ieperen, W.; Harbinson, J. Blue light dose–responses of leaf photosynthesis, morphology, and chemical composition of Cucumis sativus grown under different combinations of red and blue light. J. Exp. Bot. 2010, 61, 3107–3117. [Google Scholar] [CrossRef]
  26. Song, Y.; Liu, W.; Wang, Z.; He, S.; Jia, W.; Shen, Y.; Sun, Y.; Xu, Y.; Wang, H.; Shang, W. Effect of different monochromatic LEDs on the environmental adaptability of Spathiphyllum floribundum and Chrysanthemum morifolium. Plants 2023, 12, 2964. [Google Scholar] [CrossRef]
  27. Lin, X.; Liu, S.; He, S.; Liu, J.; Liu, Y.; Ye, C.; Li, H. Stomatal opening and transcriptomic events in cut carnation leaves in response to blue light. Hortic. Environ. Biotechnol. 2025, 66, 1357–1376. [Google Scholar] [CrossRef]
  28. Li, Z.; Chen, Q.; Xin, Y.; Mei, Z.; Gao, A.; Liu, W.; Yu, L.; Chen, X.; Wang, N. Analyses of the photosynthetic characteristics, chloroplast ultrastructure, and transcriptome of apple (Malus domestica) grown under red and blue lights. BMC Plant Biol. 2021, 21, 483. [Google Scholar] [CrossRef]
  29. Spaninks, K.; Lamers, G.; van Lieshout, J.; Offringa, R. Light quality regulates apical and primary radial growth of Arabidopsis thaliana and Solanum lycopersicum. Sci. Hortic. 2023, 317, 112082. [Google Scholar] [CrossRef]
  30. Jishi, T.; Kimura, K.; Matsuda, R.; Fujiwara, K. Effects of temporally shifted irradiation of blue and red LED light on cos lettuce growth and morphology. Sci. Hortic. 2016, 198, 227–232. [Google Scholar] [CrossRef]
  31. Trivellini, A.; Toscano, S.; Romano, D.; Ferrante, A. The role of blue and red light in the orchestration of secondary metabolites, nutrient transport and plant quality. Plants 2023, 12, 2026. [Google Scholar] [CrossRef]
  32. Massa, G.D.; Kim, H.H.; Wheeler, R.M.; Mitchell, C.A. Plant productivity in response to LED lighting. HortScience 2008, 43, 1951–1956. [Google Scholar] [CrossRef]
  33. Olle, M.; Viršile, A. The effects of light-emitting diode lighting on greenhouse plant growth and quality. Agric. Food Sci. 2013, 22, 223–234. [Google Scholar] [CrossRef]
  34. Vidaković-Cifrek, Ž.; Tkalec, M. Chlorophyll a Fluorescence in Evaluation of Plant Responses to Environmental Signals. In Chlorophyll a Fluorescence Measurements in Croatia-First Twenty Years; Lepeduš, H., Viljevac Vuletić, M., Zdunić, Z., Eds.; Monograph of Agricultural Institute Osijek: Osijek, Croatia, 2023; pp. 19–27. Available online: https://www.poljinos.hr/wp-content/uploads/2023/10/Chlorophyll-a-Fluorescence-Measurements-in-Croatia-First-Twenty-Years.pdf (accessed on 6 October 2025).
  35. Murchie, E.H.; Lawson, T. Chlorophyll fluorescence analysis: A guide to good practice and understanding some new applications. J. Exp. Bot. 2013, 64, 3983–3998. [Google Scholar] [CrossRef]
  36. Brestič, M.; Živčák, M.; Hauptvogel, P.; Misheva, S.; Kocheva, K.; Yang, X.; Li, X.; Allakhverdiev, S.I. Wheat plant selection for high yields entailed improvement of leaf anatomical and biochemical traits including tolerance to non-optimal temperature conditions. Photosynth. Res. 2018, 136, 245–255. [Google Scholar] [CrossRef]
  37. Strasser, R.J.; Tsimilli-Michael, M.; Srivastava, A. Analysis of the Chlorophyll a Fluorescence Transient. In Chlorophyll a Fluorescence: A Signature of Photosynthesis; Papageorgiou, G.C., Govindjee, Eds.; Advances in Photosynthesis and Respiration; Springer: Dordrecht, The Netherlands, 2004; pp. 321–362. [Google Scholar]
  38. Strasser, R.J.; Srivastava, A.; Tsimilli-Michael, M. The Fluorescence Transient as a Tool to Characterise and Screen Photosynthetic Samples. In Probing Photosynthesis: Mechanisms, Regulation and Adaptation; Yunus, M., Pathre, U., Mohanty, P., Eds.; Taylor & Francis: London, UK, 2000; pp. 445–483. [Google Scholar]
  39. Barboričová, M.; Filaček, A.; Mlynáriková Vysoká, D.; Gašparovič, K.; Živčák, M.; Brestič, M. Sensitivity of fast chlorophyll fluorescence parameters to combined heat and drought stress in wheat genotypes. Plant Soil. Environ. 2022, 68, 309–316. [Google Scholar] [CrossRef]
  40. Stirbet, A.; Govindjee. On the relation between the Kautsky effect (chlorophyll a fluorescence induction), Photosystem II: Basics applications of the OJIPfluorescence transient. J. Photochem. Photobiol. B 2011, 104, 236–257. [Google Scholar] [CrossRef]
  41. Gao, Q.; Liao, Q.; Li, Q.; Yang, Q.; Wang, F.; Li, J. Effects of LED red and blue light component on growth and photosynthetic characteristics of coriander in plant factory. Horticulturae 2022, 8, 1165. [Google Scholar] [CrossRef]
  42. Jang, I.T.; Lee, J.H.; Shin, E.J.; Nam, S.Y. Evaluation of growth, flowering, and chlorophyll fluorescence responses of Viola cornuta cv. Penny Red Wing according to spectral power distributions. J. People Plants Environ. 2023, 26, 335–349. [Google Scholar] [CrossRef]
  43. Park, B.G.; Lee, J.H.; Shin, E.J.; Kim, E.A.; Nam, S.Y. Light quality influence on growth performance and physiological activity of Coleus cultivars. Int. J. Plant Biol. 2024, 15, 807–826. [Google Scholar] [CrossRef]
  44. Holm, G. Chlorophyll mutations in barley. Acta Agric. Scand. 1954, 4, 457–461. [Google Scholar] [CrossRef]
  45. Wettstein, D. Chlorophyll–letale und der submikroskopische Formwechsel der Plastiden. Exp. Cell Res. 1957, 12, 427–487. [Google Scholar] [CrossRef]
  46. Keutgen, A.J.; Pawelzik, E. Quality and nutritional value of strawberry fruit under long term salt stress. Food Chem. 2008, 107, 1413–1420. [Google Scholar] [CrossRef]
  47. Singleton, V.L.; Rossi, J.A. Colorimetry of Total Phenolics with Phosphomolybdic-Phosphotungstic Acid Reagent. Am. J. Enol. Vitic. 1965, 16, 144–158. [Google Scholar] [CrossRef]
  48. Johkan, M.; Shoji, K.; Goto, F.; Hashida, S.N.; Yoshihara, T. Blue light-emitting diode light irradiation of seedlings improves seedling quality and growth after transplanting in red leaf lettuce. HortScience 2010, 45, 1809–1814. [Google Scholar] [CrossRef]
  49. Liu, J.; Van Iersel, M.W. Photosynthetic physiology of blue, green, and red light: Light intensity effects and underlying mechanisms. Front. Plant Sci. 2021, 12, 619987. [Google Scholar] [CrossRef]
  50. Goins, G.D.; Yorio, N.C.; Sanwo, M.M.; Brown, C.S. Photomorphogenesis, photosynthesis, and seed yield of wheat plants grown under red light-emitting diodes (LEDs) with and without supplemental blue lighting. J. Exp. Bot. 1997, 48, 1407–1413. [Google Scholar] [CrossRef]
  51. Jin, D.; Su, X.; Li, Y.; Shi, M.; Yang, B.; Wan, W.; Wen, W.; Yang, S.; Ding, X.; Zou, J. Effect of red and blue light on cucumber seedlings grown in a plant factory. Horticulturae 2023, 9, 124. [Google Scholar] [CrossRef]
  52. Wang, Y.; Tong, Y.; Chu, H.; Chen, X.; Guo, H.; Yuan, H.; Yan, D.; Zheng, B. Effects of different light qualities on seedling growth and chlorophyll fluorescence parameters of Dendrobium officinale. Biologia 2017, 72, 735–744. [Google Scholar] [CrossRef]
  53. Li, Q.; Kubota, C. Effects of supplemental light quality on growth and phytochemicals of baby leaf lettuce. Environ. Exp. Bot. 2009, 67, 59–64. [Google Scholar] [CrossRef]
  54. Zhang, M.; Ju, J.; Hu, Y.; He, R.; Song, J.; Liu, H. Meta-Analysis of the Impact of Far-Red Light on Vegetable Crop Growth and Quality. Plants 2024, 13, 2508. [Google Scholar] [CrossRef]
  55. Mishra, G.; Dash, S.P.; Mahapatra, S.K.; Swain, D.; Rout, G.R. Deeper insights into the physiological and metabolic functions of the pigments in plants and their applications: Beyond natural colorants. Physiol. Plant. 2025, 177, e70168. [Google Scholar] [CrossRef]
  56. Kolarov, R.; Prvulović, D.; Gvozdenac, S. Antioxidant capacity of wild-growing orange mullein (Verbascum phlomoides L.). Agro-Knowl. J. 2021, 22, 127–135. [Google Scholar] [CrossRef]
  57. Li, J.; Liu, Y.; Wang, J.; Liu, M.; Li, Y.; Zheng, J. Effects of different LED spectra on the antioxidant capacity and nitrogen metabolism of Chinese cabbage (Brassica rapa L. ssp. Pekinensis). Plants 2024, 13, 2958. [Google Scholar] [CrossRef]
  58. Zha, L.; Liu, W.; Yang, Q.; Zhang, Y.; Zhou, C.; Shao, M. Regulation of ascorbate accumulation and metabolism in lettuce by the red: Blue ratio of continuous light using LEDs. Front. Plant Sci. 2020, 11, 704. [Google Scholar] [CrossRef]
  59. Thongtip, A.; Mosaleeyanon, K.; Janta, S.; Wanichananan, P.; Chutimanukul, P.; Thepsilvisut, O.; Chutimanukul, P. Assessing light spectrum impact on growth and antioxidant properties of basil family microgreens. Sci. Rep. 2024, 14, 27875. [Google Scholar] [CrossRef]
  60. Taulavuori, K.; Pyysalo, A.; Taulavuori, E.; Julkunen-Tiitto, R. Responses of phenolic acid and flavonoid synthesis to blue and blue-violet light depends on plant species. Environ. Exp. Bot. 2018, 150, 183–187. [Google Scholar] [CrossRef]
  61. Ma, J.; Zhang, J.; Xie, L.; Ye, J.; Zhou, L.; Yu, D.; Wang, Q.W. Light quality regulates growth and flavonoid content in a widespread forest understorey medicinal species Scutellaria Baicalensis Georgi. Front. Plant Sci. 2024, 15, 1488649. [Google Scholar] [CrossRef]
  62. Moradi, S.; Kafi, M.; Aliniaeifard, S.; Moosavi-Nezhad, M.; Pedersen, C.; Gruda, N.S.; Salami, S.A. Monochromatic blue light enhances crocin and picrocrocin content by upregulating the expression of underlying biosynthetic pathway genes in saffron (Crocus sativus L.). Front. Hortic. 2022, 1, 960423. [Google Scholar] [CrossRef]
  63. Takemiya, A.; Inoue, S.I.; Doi, M.; Kinoshita, T.; Shimazaki, K.I. Phototropins promote plant growth in response to blue light in low light environments. Plant Cell 2005, 17, 1120–1127. [Google Scholar] [CrossRef]
  64. Ke, X.; Yoshida, H.; Hikosaka, S.; Goto, E. Effect of red and blue light versus white light on fruit biomass radiation-use efficiency in dwarf tomatoes. Front. Plant Sci. 2024, 15, 1393918. [Google Scholar] [CrossRef]
  65. Miao, Y.; Chen, Q.; Qu, M.; Gao, L.; Hou, L. Blue light alleviates the inhibitory effect of low light on photosynthesis and enhances the accumulation of secondary metabolites in Digitalis purpurea. Plant Physiol. Biochem. 2019, 139, 52–61. [Google Scholar] [CrossRef]
  66. Bayat, L.; Arab, M.; Aliniaeifard, S.; Seif, M.; Lastochkina, O.; Li, T. Effects of growth under different light spectra on the subsequent high light tolerance in rose plants. AoB Plants 2018, 10, ply052. [Google Scholar] [CrossRef]
  67. Yang, B.; Zhou, X.; Xu, R.; Wang, J.; Lin, Y.; Pang, J.; Wu, S.; Zhong, F. Comprehensive analysis of photosynthetic characteristics and quality improvement of purple cabbage under different combinations of monochromatic light. Front. Plant Sci. 2016, 7, 1788. [Google Scholar] [CrossRef]
  68. Ouzounis, T.; Fretté, X.; Rosenqvist, E.; Ottosen, C.-O. Spectral effects of artificial light on plant physiology and secondary metabolism: A review. Hortic. Sci. 2015, 42, 291–298. [Google Scholar] [CrossRef]
  69. Hernández, R.; Kubota, C. Physiological responses of cucumber seedlings under different blue and red photon flux ratios using LEDs. Environ. Exp. Bot. 2016, 121, 66–74. [Google Scholar] [CrossRef]
  70. Zhiponova, M.; Paunov, M.; Anev, S.; Petrova, N.; Krumova, S.; Raycheva, A.; Goltsev, V.; Tzvetkova, N.; Taneva, S.; Sapunov, K.; et al. JIP-test as a tool for early diagnostics of plant growth and flowering upon selected light recipe. Photosynthetica 2020, 58, 399–408. [Google Scholar] [CrossRef]
  71. Maxwell, K.; Johnson, G.N. Chlorophyll fluorescence—A practical guide. J. Exp. Bot. 2000, 51, 659–668. [Google Scholar] [CrossRef]
  72. Lee, J.H.; Kwon, Y.B.; Choi, I.-L.; Yoon, H.S.; Kim, J.; Kim, Y.; Kang, H.-M. Changes in Spectral Reflectance, Photosynthetic Performance, Chlorophyll Fluorescence, and Growth of Mini Green Romaine Lettuce According to Various Light Qualities in Indoor Cultivation. Horticulturae 2024, 10, 860. [Google Scholar] [CrossRef]
  73. Kaiser, E.; Morales, A.; Harbinson, J. Fluctuating light takes crop photosynthesis on a rollercoaster ride. Plant Physiol. 2019, 179, 507–517. [Google Scholar] [CrossRef]
  74. Yusuf, M.A.; Kumar, D.; Rajwanshi, R.; Strasser, R.J.; Tsimilli-Michael, M.; Govindjee; Sarin, N.B. Overexpression of g-tocopherol methyl transferase gene in transgenic Brassica juncea plants alleviates abiotic stress: Physiological and chlorophyll a fluorescence measurement. Biochim. Biophys. Acta 2010, 1797, 1428–1438. [Google Scholar] [CrossRef] [PubMed]
  75. Zagorchev, L.; Atanasova, A.; Albanova, I.; Traianova, A.; Mladenov, P.; Kouzmanova, M.; Goltsev, V.; Kalaji, H.M.; Teofanova, D. Functional Characterization of the Photosynthetic Machinery in Smicronix Galls on the Parasitic Plant Cuscuta campestris by JIP-Test. Cells 2021, 10, 1399. [Google Scholar] [CrossRef]
  76. Dimitrova, S.; Paunov, M.; Pavlova, B.; Dankov, K.; Kouzmanova, M.; Velikova, V.; Tsonev, T.; Kalaji, H.; Goltsev, V. Photosynthetic efficiency of two Platanus orientalis L. ecotypes exposed to moderately high temperature–JIP-test analysis. Photosynthetica 2020, 58, 657–670. [Google Scholar] [CrossRef]
  77. Li, Y.; Xin, G.; Liu, C.; Shi, Q.; Yang, F.; Wei, M. Effects of Red and Blue Light on Leaf Anatomy, CO2 Assimilation, and the Photosynthetic Electron Transport Capacity of Sweet Pepper (Capsicum annuum L.) Seedlings. BMC Plant Biol. 2020, 20, 318. [Google Scholar] [CrossRef] [PubMed]
Disclaimer/Publisher’s Note: The statements, opinions and data contained in all publications are solely those of the individual author(s) and contributor(s) and not of MDPI and/or the editor(s). MDPI and/or the editor(s) disclaim responsibility for any injury to people or property resulting from any ideas, methods, instructions or products referred to in the content.

Article Metrics

Citations

Article Access Statistics

Multiple requests from the same IP address are counted as one view.