Article

DMSF-YOLO: A Dynamic Multi-Scale Fusion Method for Maize Tassel Detection in UAV Low-Altitude Remote Sensing Images

1
College of Information Engineering, Inner Mongolia University of Technology, Hohhot 010080, China
2
Inner Mongolia Key Laboratory of Intelligent Perception and System Engineering, Hohhot 010080, China
3
Inner Mongolia Synergy Innovation Center of Perception Technology in Intelligent Agriculture and Animal Husbandry, Hohhot 010080, China
*
Author to whom correspondence should be addressed.
Agriculture 2025, 15(12), 1259; https://doi.org/10.3390/agriculture15121259
Submission received: 11 April 2025 / Revised: 6 June 2025 / Accepted: 9 June 2025 / Published: 11 June 2025

Abstract

:
Maize tassels are critical phenotypic organs in maize, and their quantity is essential for determining tasseling stages, estimating yield potential, monitoring growth status, and supporting crop breeding programs. However, tassel identification in complex field environments presents significant challenges due to occlusion, variable lighting conditions, multi-scale target complexities, and the asynchronous and irregular growth patterns characteristic of maize tassels. In response to these challenges, this paper presents a DMSF-YOLO model for maize tassel detection. In the network’s backbone front, conventional convolutions are replaced with conditional parameter convolutions (CondConv) to enhance feature extraction capabilities. A novel DMSF-P2 network architecture is designed, including a multi-scale fusion module (SSFF-D), a scale-splicing module (TFE), and a small object detection layer (P2), which further enhances the model’s feature fusion capabilities. By integrating a dynamic detection head (Dyhead), superior recognition accuracy for maize tassels across various scales is achieved. Additionally, the Wise-IoU loss function is used to improve localization precision and strengthen the model’s adaptability. Experimental results demonstrate that on our self-built maize tassel detection dataset, the proposed DMSF-YOLO model shows remarkable superiority compared with the baseline YOLOv8n model, with precision (P), recall (R), m A P 50 , and m A P 50 : 95 increasing by 0.5%, 3.4%, 2.4%, and 3.9%, respectively. This approach enables accurate and reliable maize tassel detection in complex field environments, providing effective technical support for precision field management of maize crops.

1. Introduction

As a globally pivotal food grain, maize is widely cultivated in various regions due to its high nutritional content and substantial yield. Not only is maize a vital raw material for the food processing industry but it also holds significant importance in animal husbandry, serving as the main feed source for the livestock sector. As a monoecious cross-pollinating grass species, maize possesses a unique reproductive structure [1]. Each maize plant simultaneously contains male and female inflorescences: the tassel at the top of the plant releases pollen, while the ear, located in the leaf axils, receives pollen to complete the pollination process [2]. The tasseling stage represents a vital phase in maize growth and development, with the developmental state and quantity of tassels being vital indicators for predicting final maize yield [3]. Additionally, monitoring tassel growth is an effective measure for evaluating the overall growth status of maize plants. Traditional field monitoring of maize tassels typically relies on manual surveys, a method that is labor-intensive and faces challenges such as low efficiency and limited coverage [4]. To enhance monitoring efficiency while reducing costs, developing a low-cost, high-precision method for real-time monitoring of maize tassels, including their detection and counting, is essential for yield assessment, growth status monitoring, and plant counting [5].
Traditional methods for maize tassel recognition and counting primarily rely on machine learning algorithms and classical image processing techniques [6]. Kurtulmus et al. [7] achieved an accuracy rate of 81.6% in detecting tassel positions within maize canopy images under natural conditions through the integration of support vector machines (SVMs), morphological operations, and image binarization. Kumar et al. [8] proposed an adaptive threshold-based K-means clustering method for maize tassel detection and counting. This approach improves the applicability of static camera images for UAV-based remote sensing. Zan et al. [9] proposed a method for endpoint detection of tassels. They predominantly employed the random forest algorithm for classifying tassel and non-tassel regions, extracted tassel regions through morphological processing, and utilized the VGG16 network to identify maize tassels across varying developmental stages. The authors also developed a semi-automatic annotation tool to accelerate data labeling, significantly reducing time costs. With the rise of the low-altitude drone economy, computer vision and artificial intelligence are changing traditional agricultural management [10]. By utilizing unmanned aerial vehicles (UAVs) for automated image processing and data analysis, it is possible to rapidly achieve precise crop monitoring [11], disease diagnosis [12], and yield prediction [13]. Compared to conventional image analysis methods, convolutional neural networks (CNNs) are more effective in capturing image features, thus improving detection accuracy [14].
Several research efforts have focused on developing and advancing maize phenotyping detection methods, both domestically and internationally [15]. The methods primarily include remote sensing technology, spectral technology, and computer vision techniques. With advancements in satellite remote sensing technology, satellite images have become a valuable tool in agriculture, particularly for crop phenotyping [16]. However, under adverse weather conditions such as cloudy, rainy, or hazy environments, satellite remote sensing may suffer from low image resolution [17]. Spectral technology improves crop state identification by capturing continuous spectral band information [18]. However, it faces challenges such as complex data processing, high costs, and susceptibility to interference. In contrast, low-altitude UAV-based visible light remote sensing offers advantages such as low cost and ease of operation. By enabling close-range observation of crop phenotypic features, it provides reliable technical support for precision agriculture [19].
YOLO, a reliable single-stage real-time detection algorithm, owing to its high efficiency and accuracy, has gained widespread application in UAV target detection. Gao et al. [20] proposed the YOLOv5-Tassel (YOLOv5-T) model for UAV-based remote sensing platforms by integrating attention mechanisms, the YOLOv5_l network architecture, spatial pyramid pooling, and multi-scale dilated convolutions. Their study validated the feasibility of large-scale maize tassel detection. Zhang et al. [21] proposed a SwinT-YOLO identification model that employs the concept of transfer learning to accelerate training through pre-trained weights. Additionally, depth-separable convolution was used to solve the issue of identifying dense maize tassels in remote sensing images. Ref. [22] conducted segmentation experiments on maize tassels of different varieties using a U-Net model with VGG16 as the feature extraction network. The experiments demonstrated that U-Net consistently delivered high accuracy across complex scenarios. Pu et al. [23] proposed a lightweight maize tassel detection model. The model included the lightweight modules VoVGSCSP and GSConv to lower the computational complexity. Additionally, to ensure that the model maintained a higher detection accuracy while remaining lightweight, a mechanism for attention was also incorporated into the framework. Finally, the model’s effectiveness was demonstrated through a comparison with the mainstream YOLO series, highlighting its superior performance. Niu et al. [24] designed a maize tassel counting model based on YOLOv8 and further optimized the mean precision (mAP) using the Sparrow Search Algorithm (SSA). The improved algorithm increased accuracy by 3.27% and recall by 2.85% at a 5 m altitude. The model still kept high accuracy at various heights. Li et al. [25] developed an enhanced real-time wheat tassel detection and counting algorithm by enhancing YOLOv7 and DeepSORT. The model size was 79% of the original, while accuracy improved by 9.6%. Additionally, with an FPS of 19.2, the model ensured real-time wheat spike detection.
This study proposes a DMSF-YOLO network architecture to tackle the problem of multi-scale maize tassel detection. This architecture improves the detection accuracy of maize tassels in complex farmland scenarios with scale variations. The following are this paper’s primary contributions:
(1)
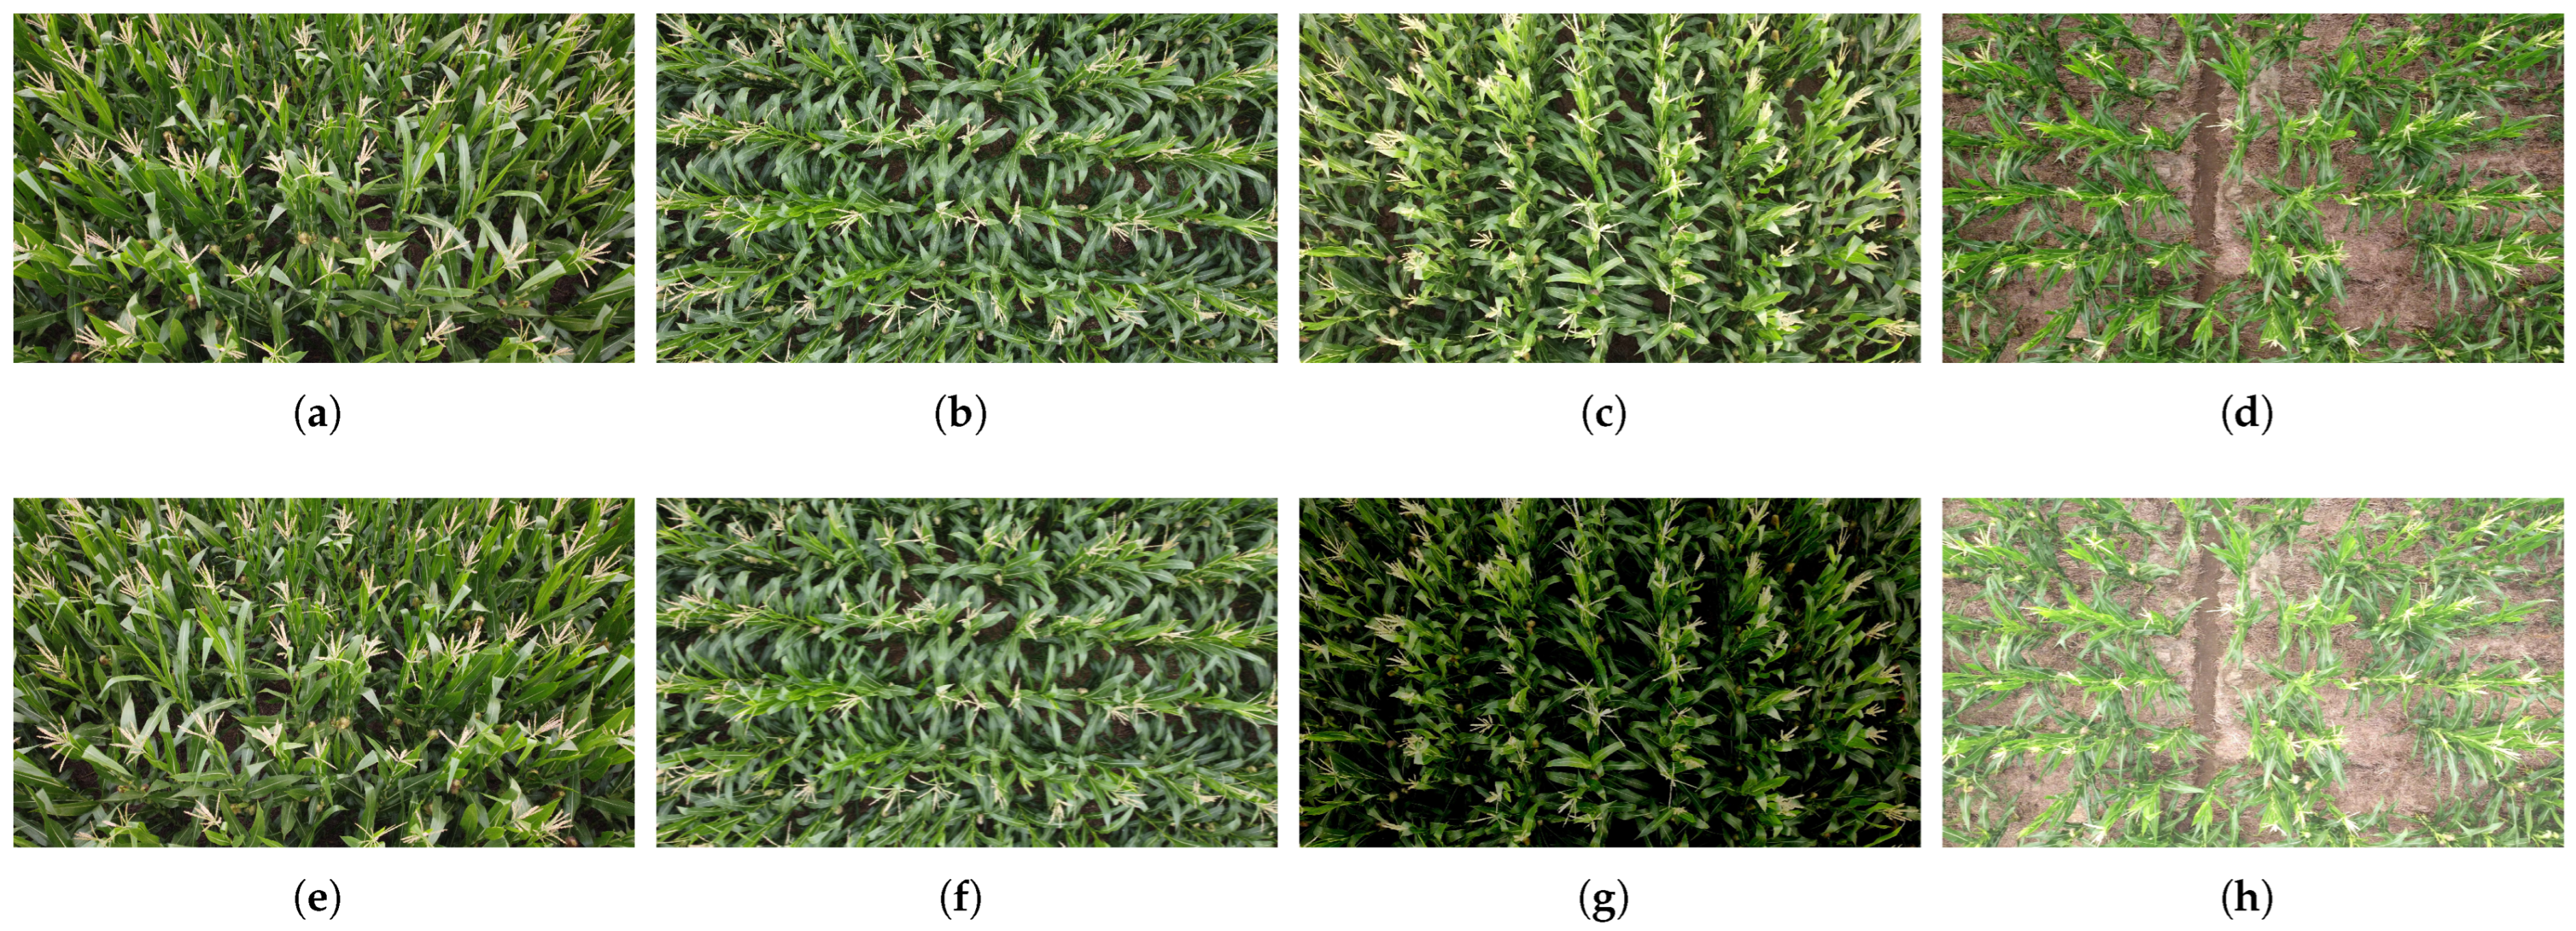
The paper constructs a multi-scale maize tassel dataset based on UAV low-altitude imagery. The dataset consists of 1806 images captured at different altitudes (3 m, 4 m, and 5 m) and angles (inclined and vertical views). It encompasses maize tassel characteristics under various lighting conditions, growth densities, and developmental stages.
(2)
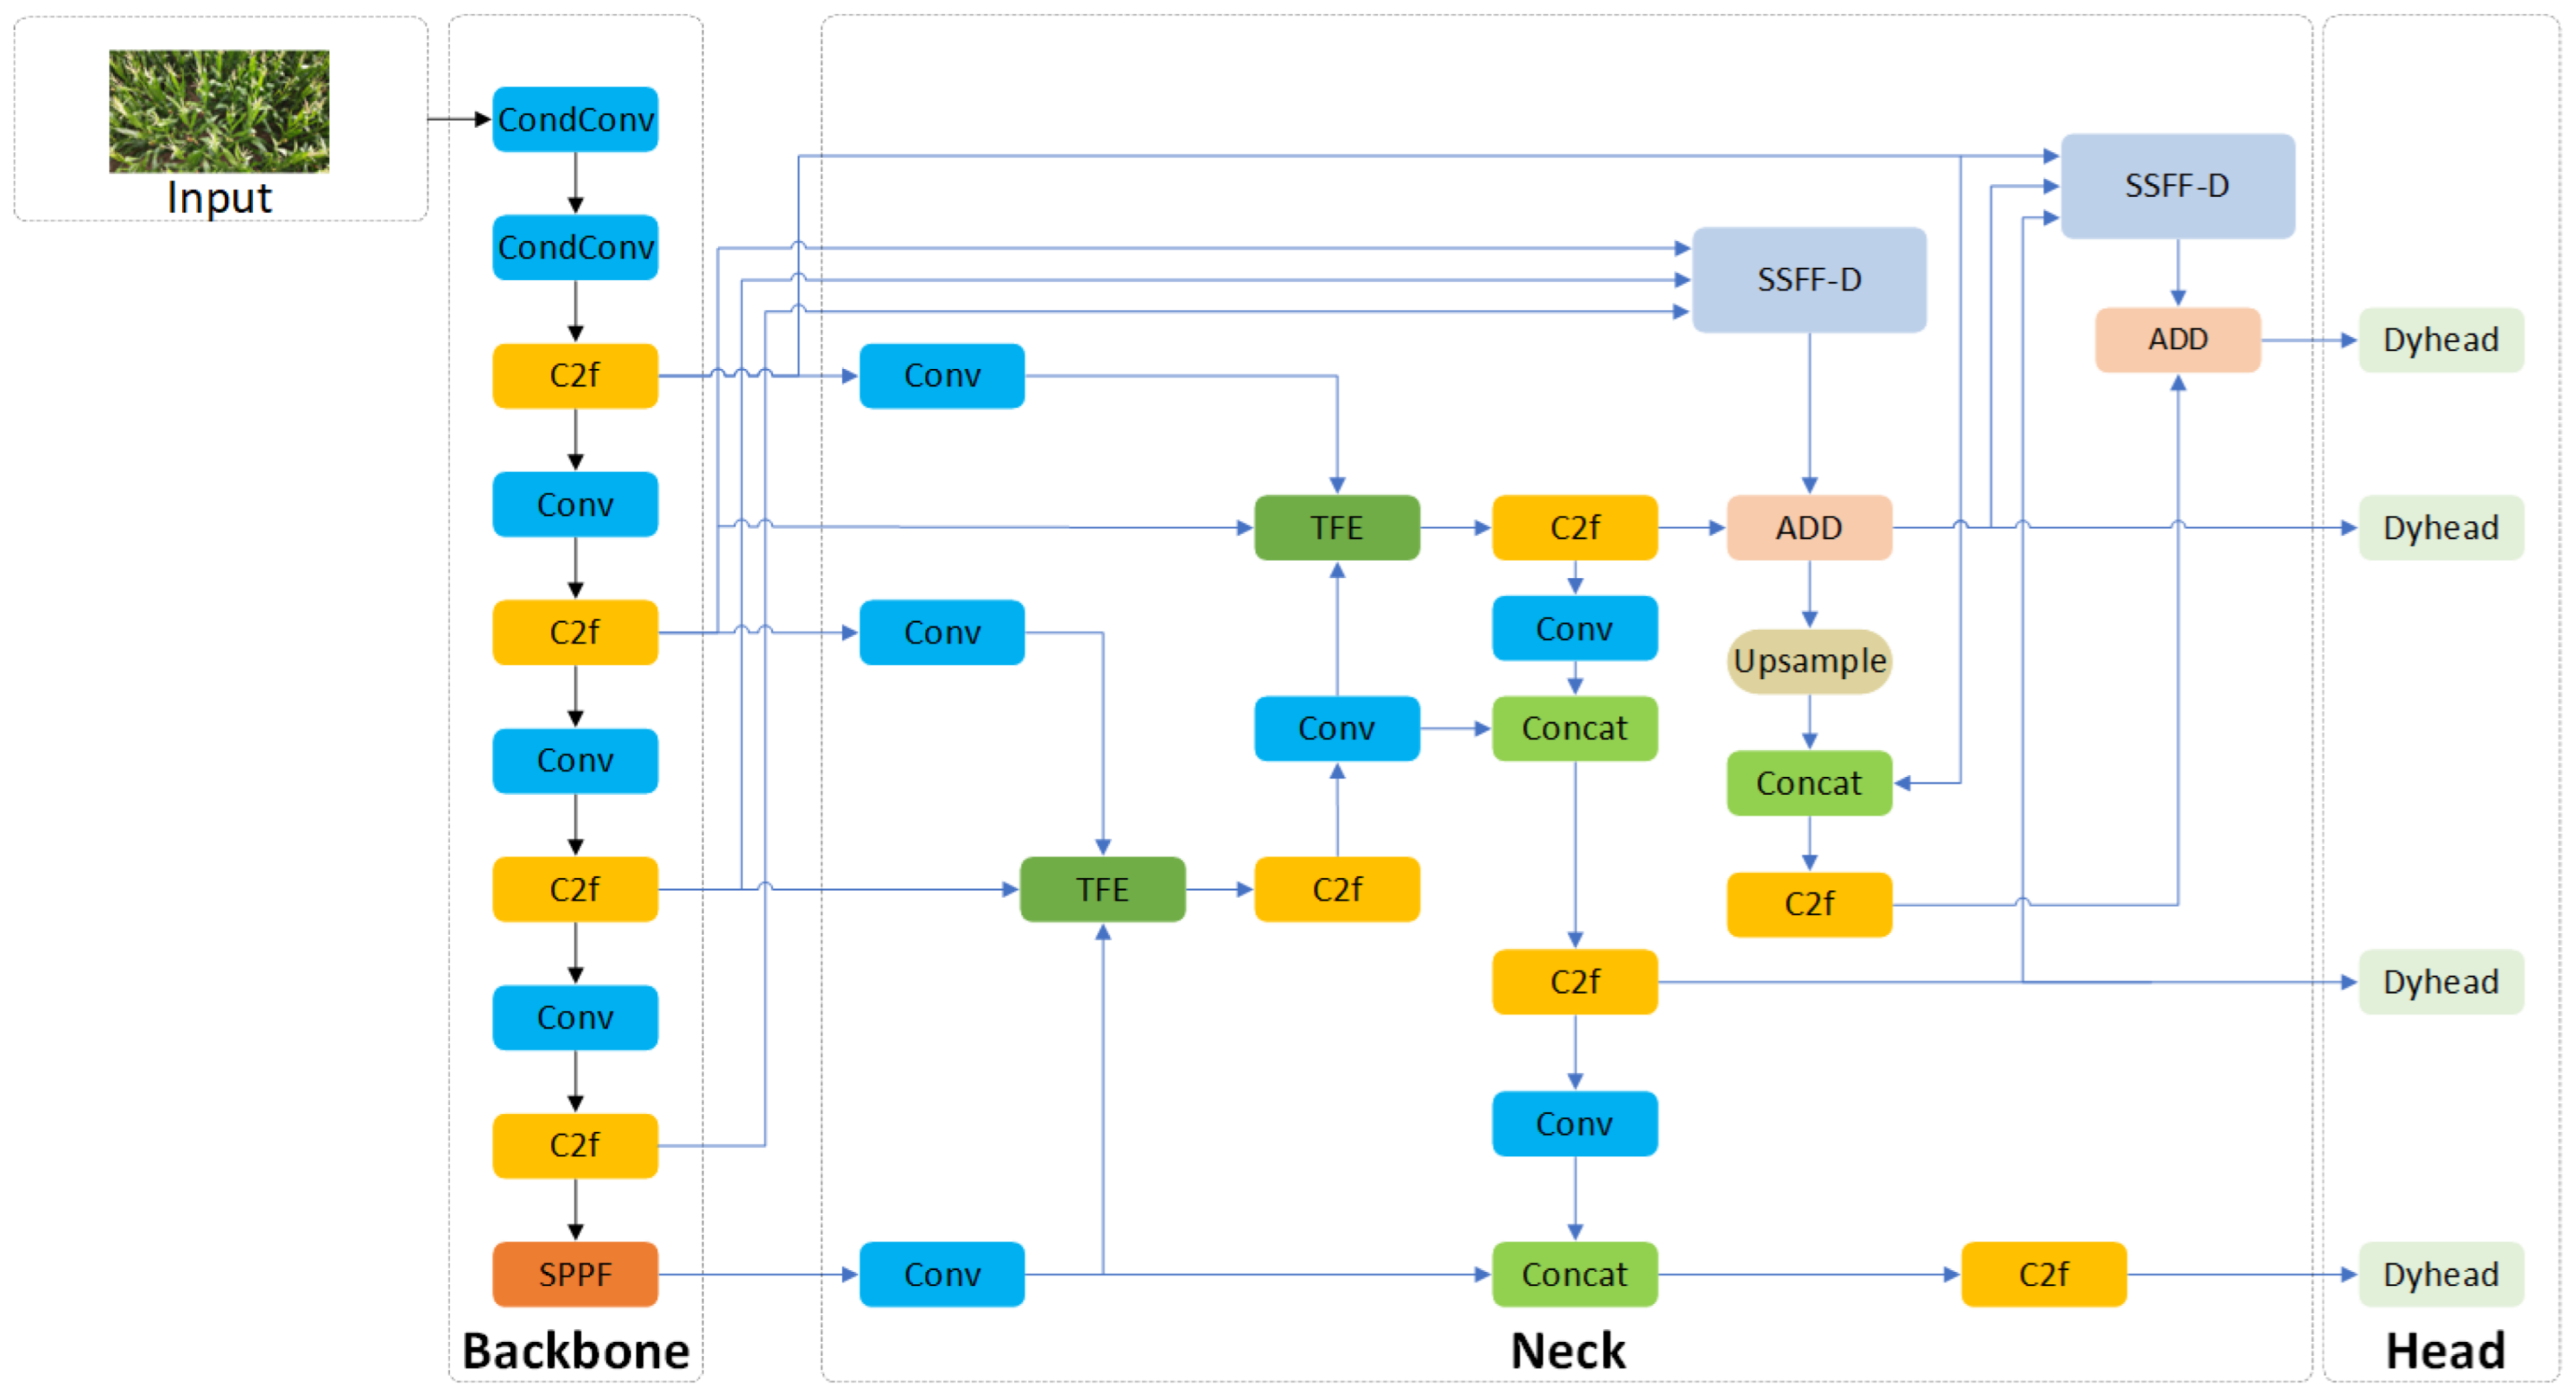
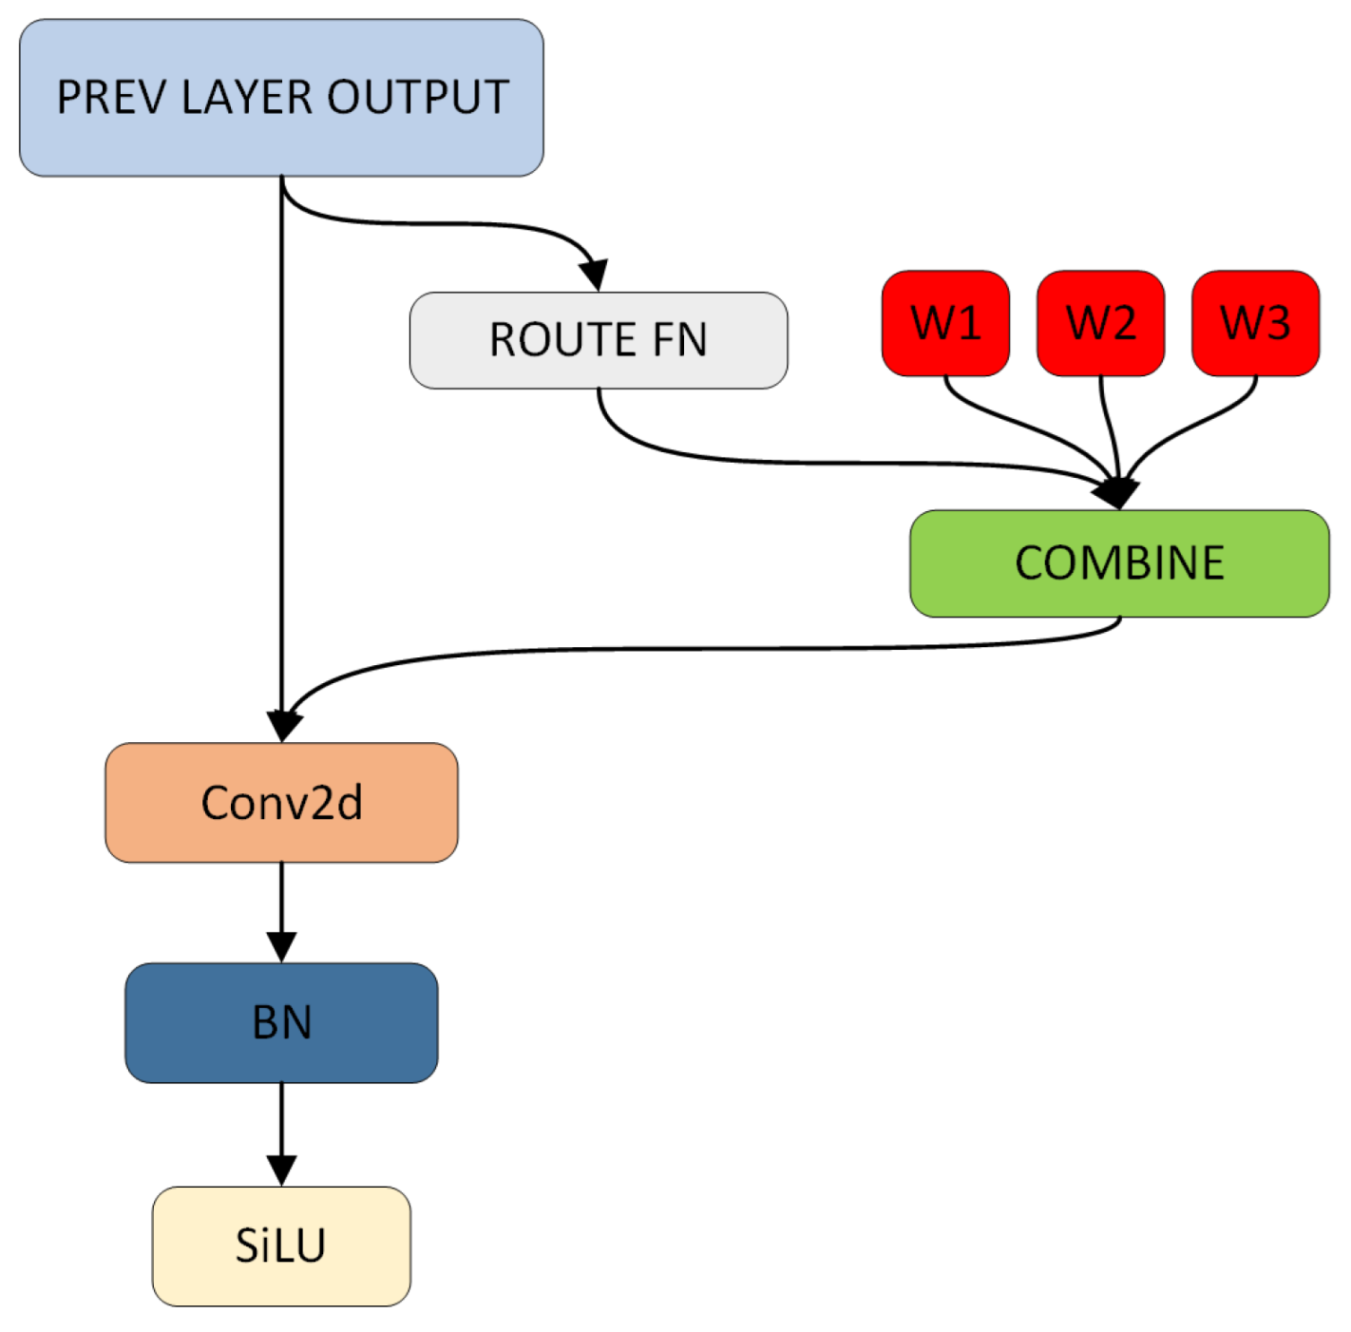
To enhance feature extraction efficiency, CondConv is integrated into the backbone. This modification optimizes model parameters by dynamically modifying the number of convolution kernels according to the feature distribution of different samples. This method effectively improves the model’s feature representation while reducing parameter redundancy, thereby optimizing the overall computational efficiency.
(3)
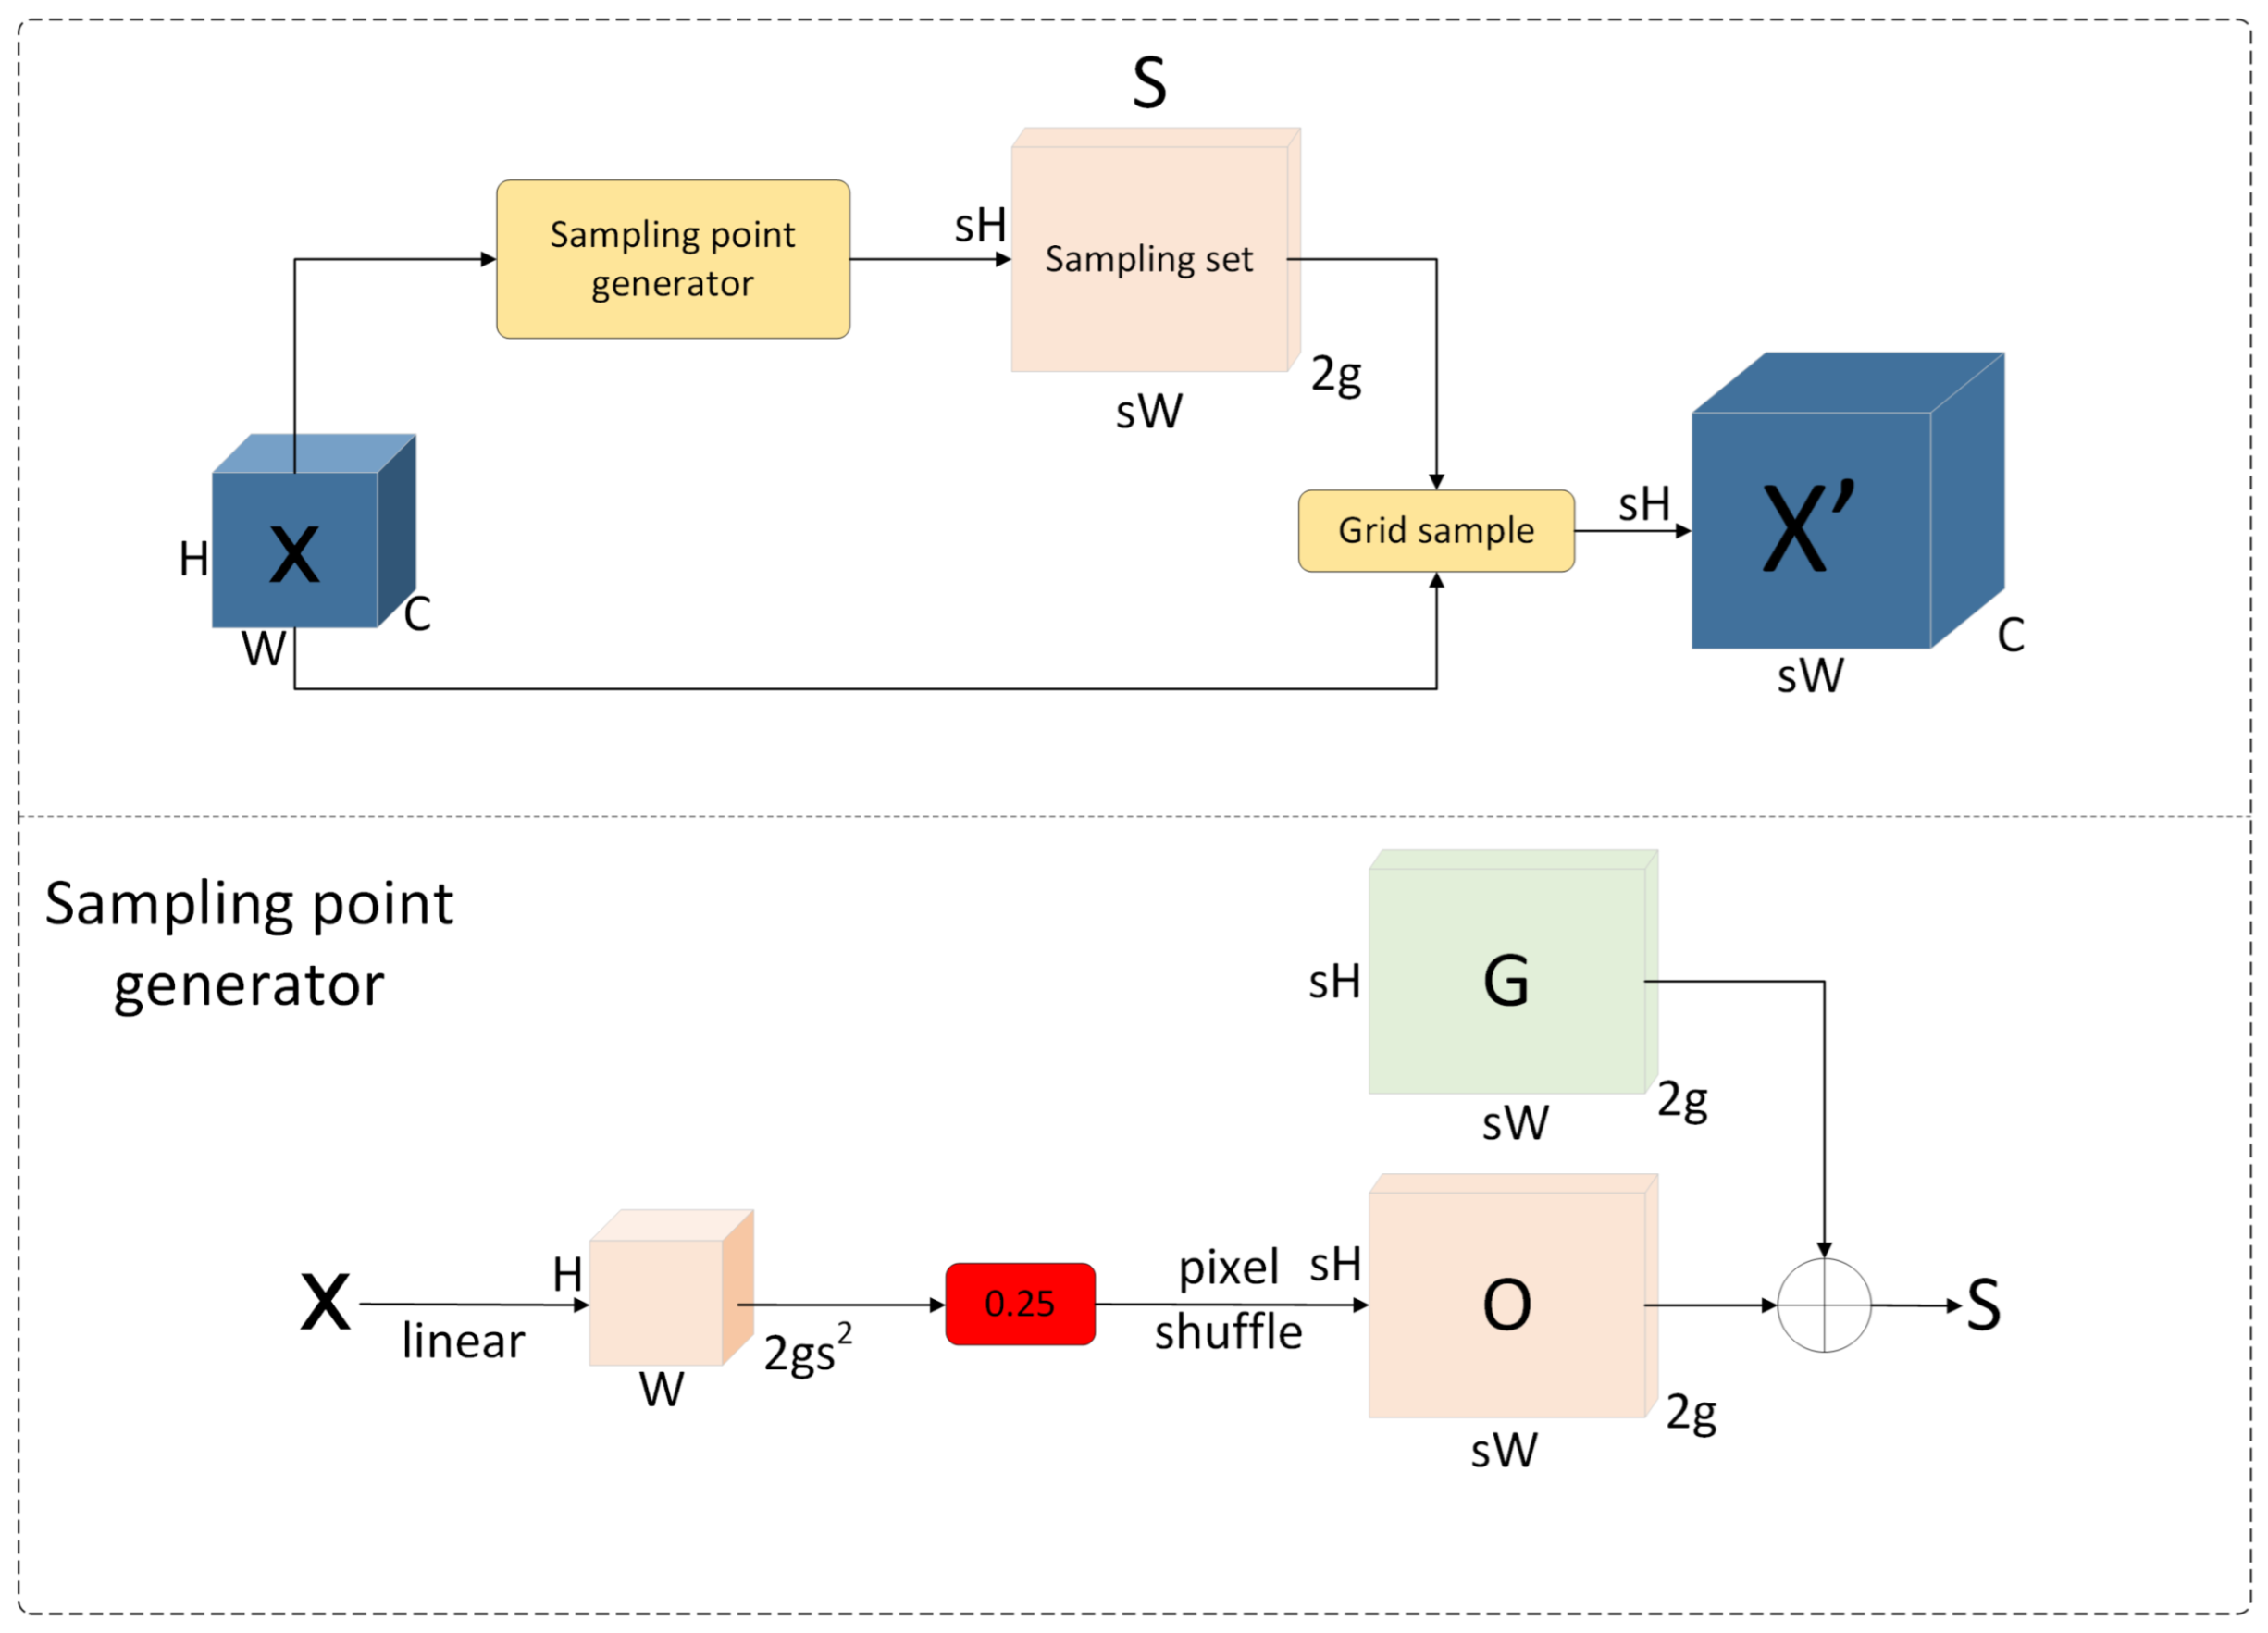
The neck incorporates an improved Attentional Scale Sequence Fusion (ASSF) structure and designs a novel Dynamic Multi-scale Fusion (DMSF-P2) feature fusion network. The enhanced algorithm integrates the Dysample mechanism, effectively reducing computational time. In addition, a P2 layer is added to further improve early tassel detection accuracy. These improvements significantly strengthen the fusion efficiency of multi-scale feature maps.
(4)
The Wise-IoU (WIoU) boundary loss function is introduced to accelerate model convergence, improve boundary regression accuracy, and further boost detection performance.

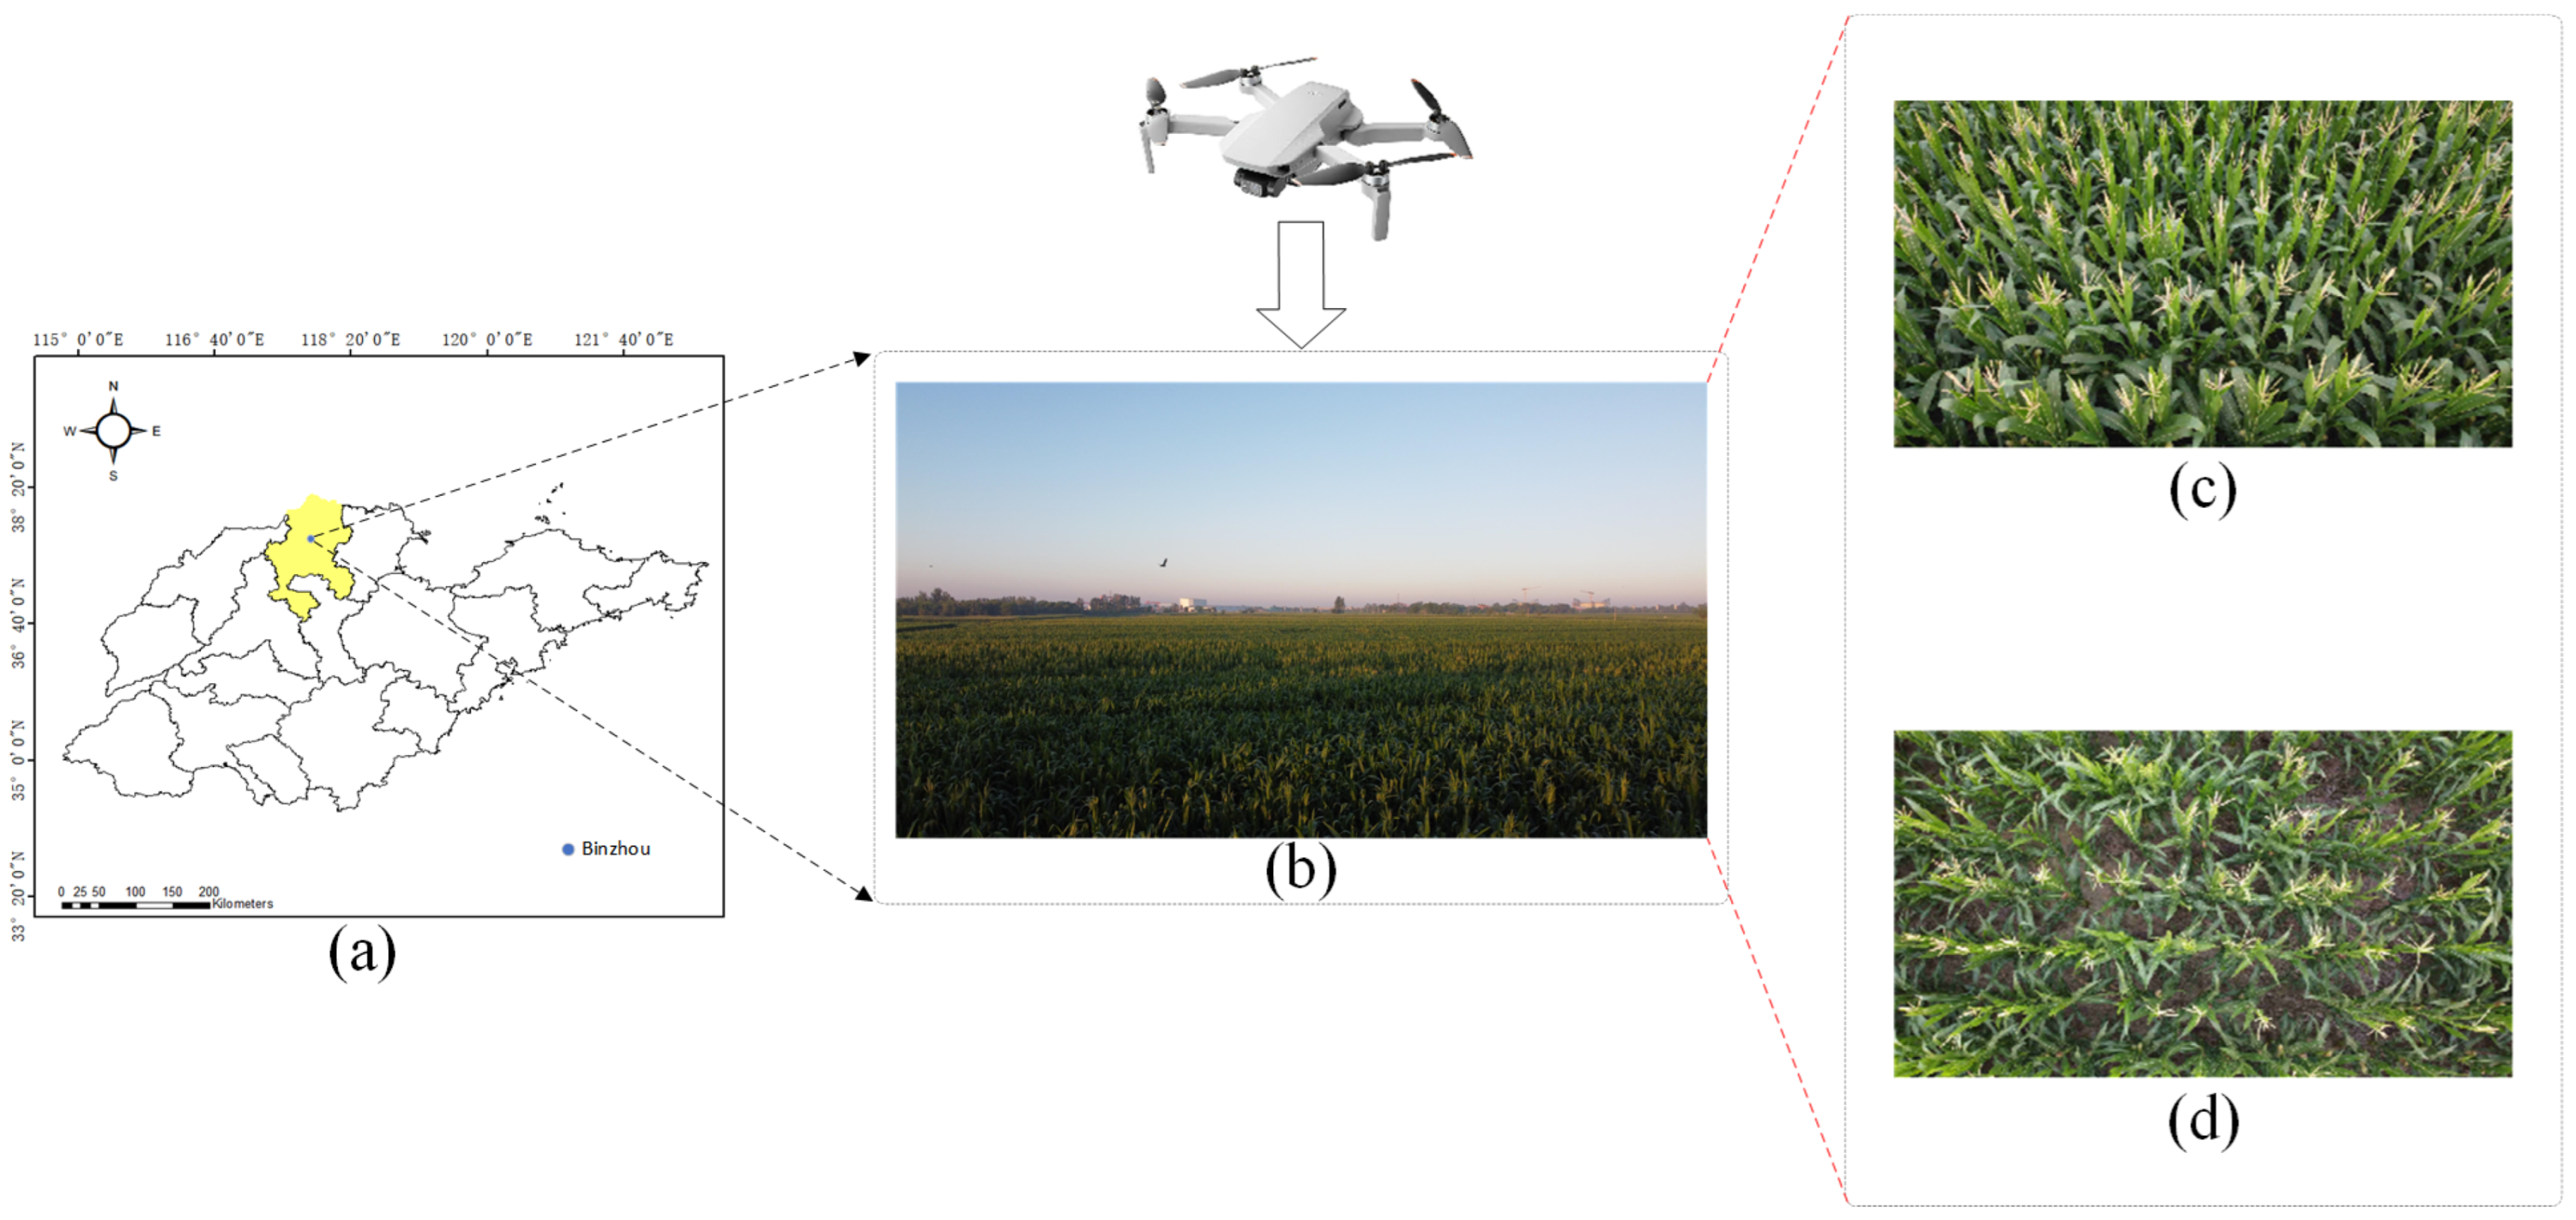
2. Study Area and Data Collection

2.1. Study Area

The maize tassel sample data were collected from farmland in Bincheng District, Binzhou City, Shandong Province (117°55′45.337″ E, 37°29′36.352″ N), a region predominantly cultivated with maize and wheat, as shown in Figure 1a,b. Data collection took place from 10 August to 16 August 2024 over 7 days under windless conditions. The purpose was to capture images of maize tassels under different lighting conditions and morphological variations. The acquisition device was a DJI Mavic Mini drone, and the detailed drone parameters are presented in Table 1. The UAV operated at altitudes of 3 m, 4 m, and 5 m, with the gimbal camera angles set between 45° and 50° as well as 90° (as illustrated in Figure 1c,d). Data was acquired using two methods: video recording, conducted in a manually controlled stable flight mode, and image capture, performed through intermittent photography. As a result, the constructed maize tassel dataset is well-suited for multi-scale maize tassel detection tasks in complex environments.
Based on the phenological information provided by the maize BBCH scale [26], the collection stages include the early, non-flowering, partially flowering, and flowering stages. The BBCH code and description for specific data collection stages are shown in Table 2. The maize tassel exhibits a slender and dense structure during its initial growth phase, which progressively undergoes expansion and starts pollen dispersal in subsequent developmental stages, as shown in Figure 2a,d. The whole collection process contains different degrees of shading, overlapping, strong-light, and dark-light interference with maize tassels, as shown in Figure 2e–h. The collection process covered different angles and heights, and the gimbal was adjusted to both tilted and vertical angles for data collection.

2.2. Dataset Creation and Data Augmentation

Collectively, 2000 images were collected for this data collection effort, of which the video format data were converted to image format by extracting one frame at 2 s intervals. 1480 images were manually selected for the construction of the maize tassel dataset. The image annotation was performed using LabelImg (version 1.8.6) software, using the YOLO format to manually frame the target location, and the target label was labeled “tassel”. The resulting data were saved in TXT format, and these files contained target category and location information. A 7:2:1 ratio was used to divide the data collection into three sets: a training set (1036 images), a validation set (296 images), and a test set (148 images).
Furthermore, data enhancement was performed on the partitioned dataset to enhance the model’s robustness and generalization capability [27]. The augmentation methods included flipping, motion blur, and random brightness adjustment. These methods increased the quantity and diversity of the dataset, as illustrated in Figure 3. The dataset, following data augmentation, consists of 1806 images, with 1259 images allocated to the training set, 363 images to the validation set, and 184 images to the test set. The total number of labels is 57,163. Additionally, the Mosaic data augmentation technique was employed during the training process to further boost the robustness of the model in real-world scenarios.

3. Methods

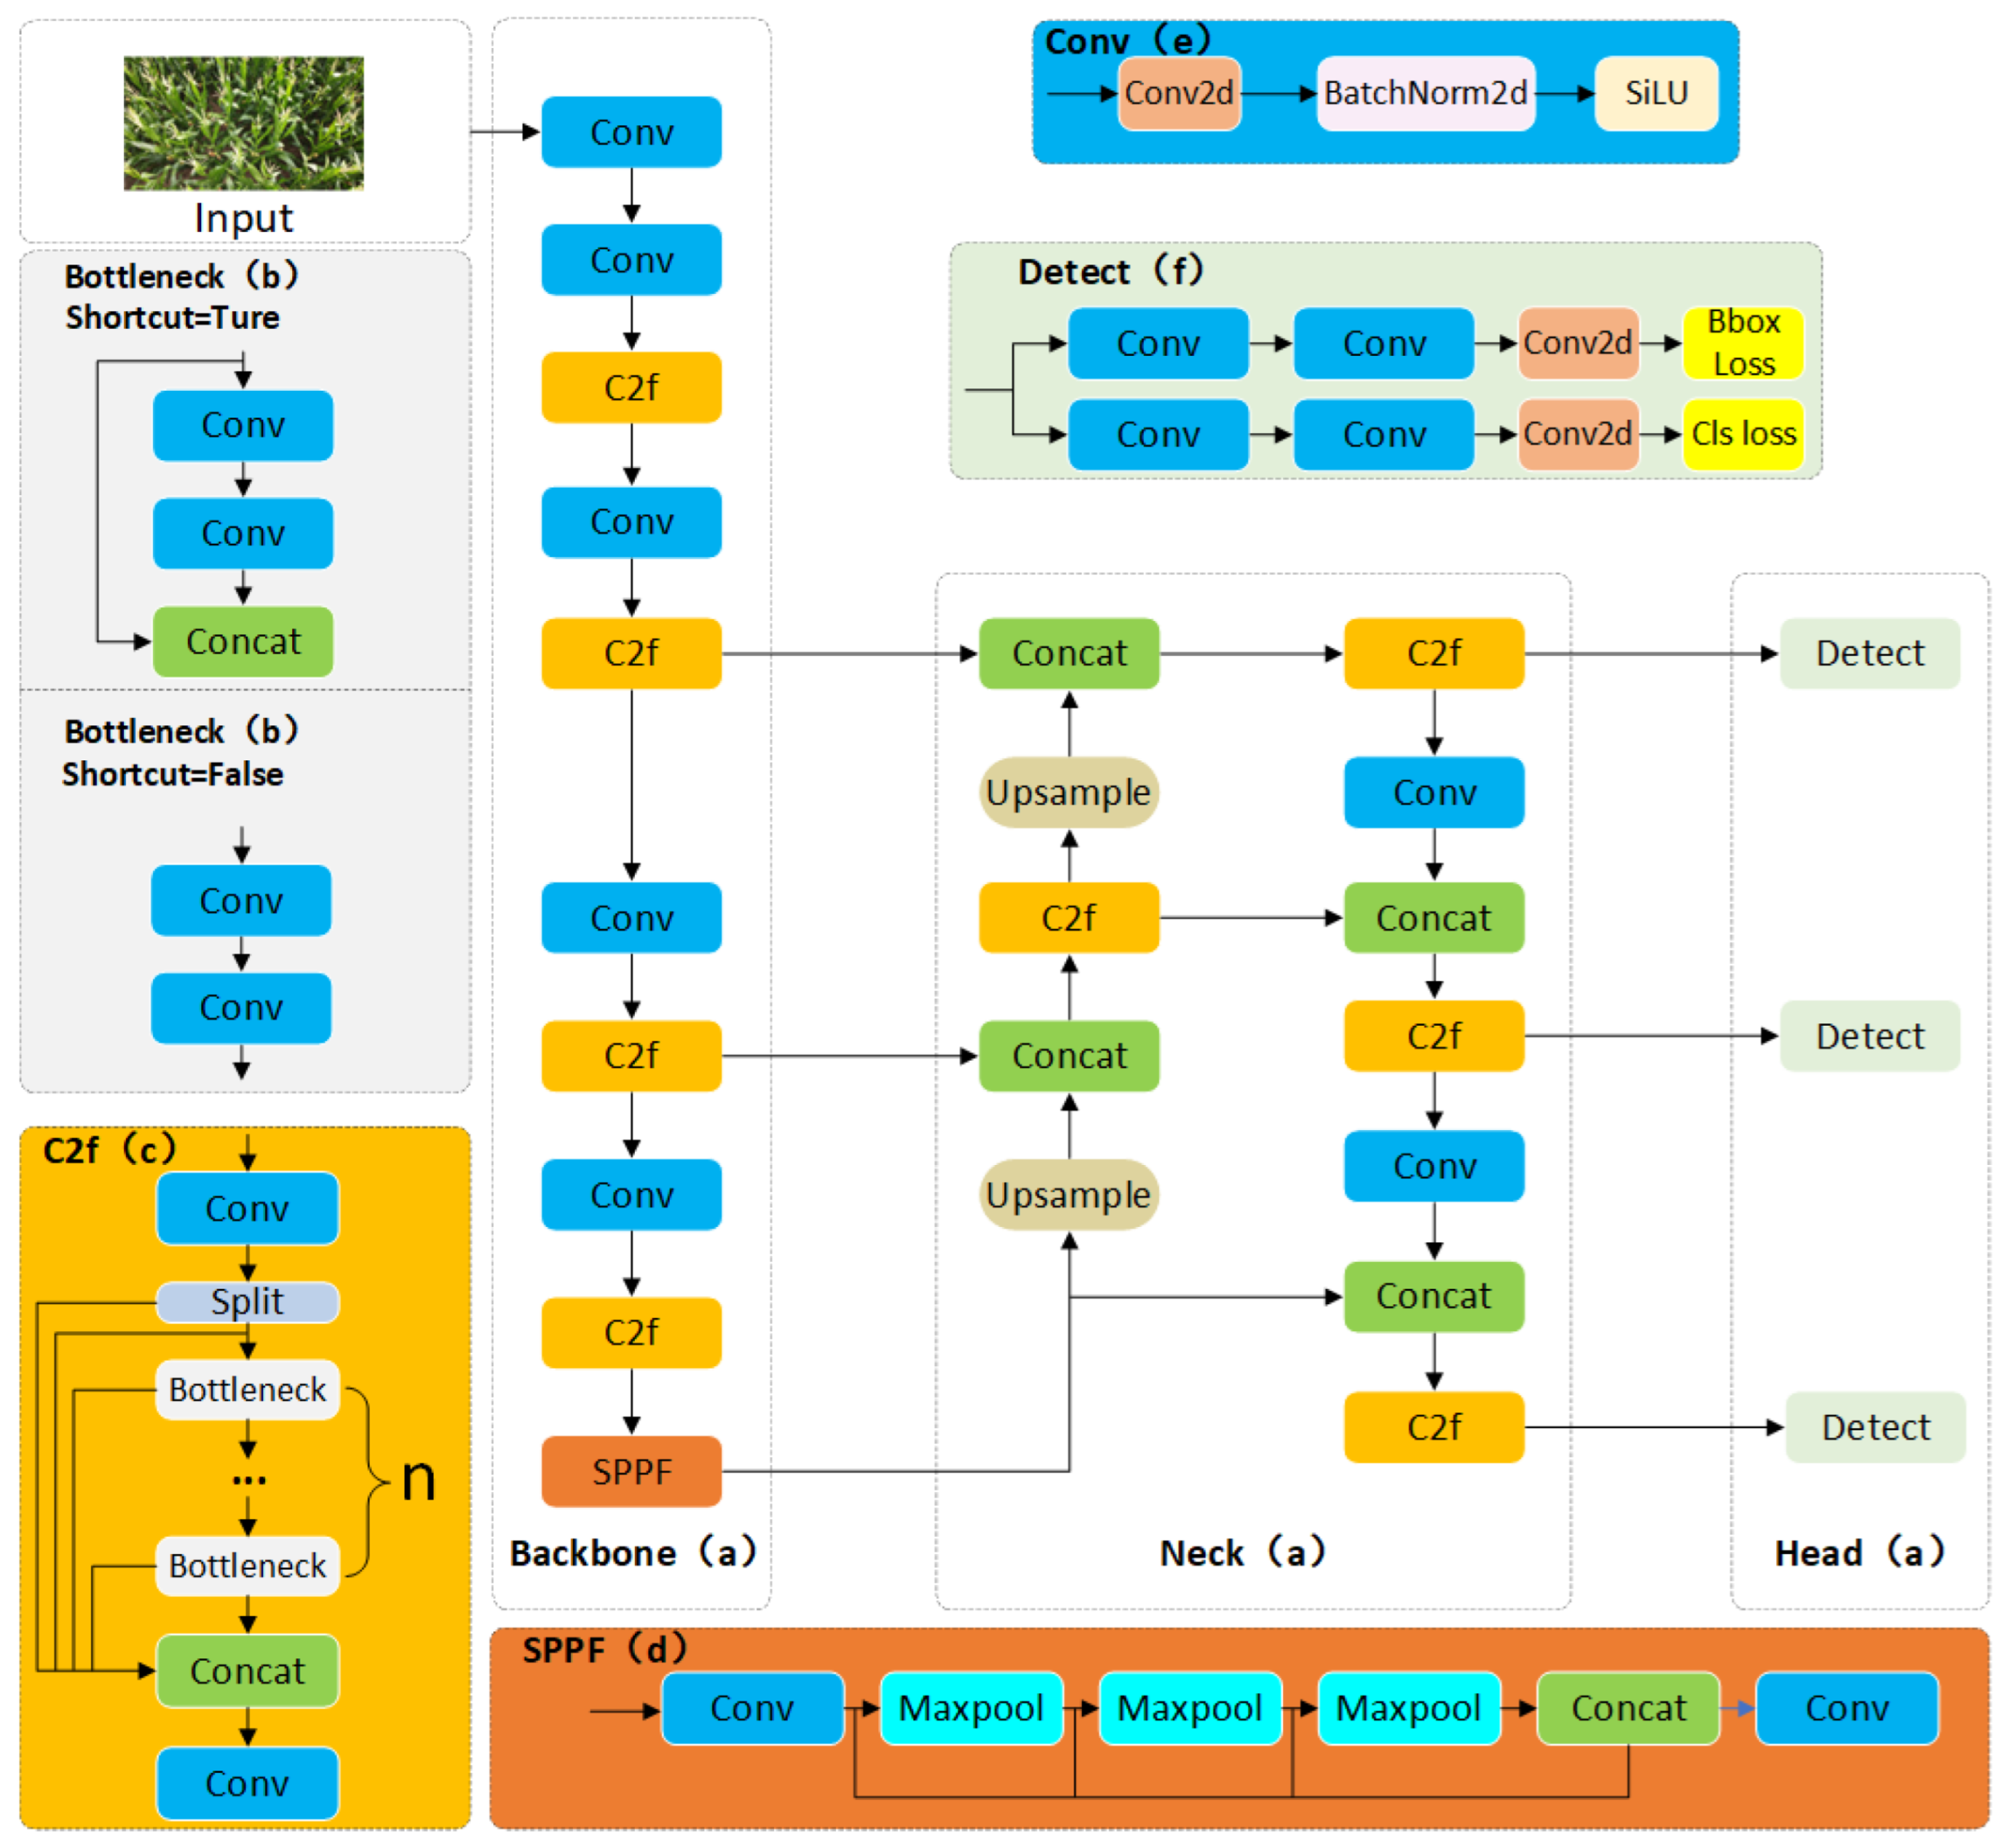
3.1. Network Framework of YOLOv8

The YOLOv8 series is an optimized and upgraded version based on the YOLOv5 algorithm, offering different model scales, including n, s, m, l, and x. While inheriting the design philosophy of YOLOv5, YOLOv8 further refines the network’s depth, width, and connectivity patterns. The YOLOv8 network architecture is shown in Figure 4. Considering the deployability of the model, the YOLOv8n version was selected for this experiment.

3.2. Maize Tassel Detection Network (DMSF-YOLO)

The DMSF-YOLO model’s structure, as proposed in this paper, is shown in Figure 5. For the complex scene of field maize, including the different morphologies of maize tassels, there are mutual occlusion and multi-scale problems. The YOLOv8n base model is improved; firstly, CondConv is introduced at the front end of the backbone network to dynamically adjust convolution kernels to improve feature representation. Second, the neck module incorporates a novel cross-scale feature fusion method along with an additional small-target detection layer, enhancing multi-scale maize tassel detection. Furthermore, Dynamic Head is integrated into the head to optimize detection head performance, particularly for early-stage maize tassel. The Wise-IoU v3 loss function is used as the last optimization step to increase the bounding box positioning accuracy.

3.3. Conditionally Parameterized Convolution (CondConv)

The convolution kernel of the Conv module in the original YOLOv8n is fixed, and in maize tassel detection, the asynchronous growth of maize tassel leads to inconsistent maize tassel size scales, which hinders its ability to effectively extract key information, particularly in the early stages of maize tassel development. To solve the limitations of static convolution, Liu et al. [28] proposed Conditional Convolution (CondConv), a parameterized dynamic convolution approach. In their method, dynamic weight generation enhances the feature representation ability of objects at different scales while effectively reducing redundant computation. CondConv strengthens the feature learning ability and solves the limitations of ordinary convolution by introducing multiple convolution kernels and dynamic routing mechanisms [29]. The convolutional network’s structure, which is based on conditional parameters, is shown in Figure 6.
W 1 , W 2 , and W 3 represent the convolutional kernels of the expert branches, with three experts employed in this study. The Route FN is a dynamic routing function that can calculate the weight coefficients of each expert convolution kernel according to the feature size of the maize tassel picture, and the dynamic routing function calculation process is shown in Equation (1).
r ( x ) = Sigmoid ( GAP ( x ) R )
In Equation (1), Sigmoid refers to the activation function of Sigmoid, GAP denotes global average pooling, and R is the routing weight matrix. The input x is compressed into a fixed-length feature vector for each channel of the feature map by global average pooling. Subsequently, the vectors are right-multiplied by the weight matrix R, which aims to map the input to n expert weights. Finally, the output weight coefficients are limited to the interval (0, 1) by normalization via Sigmoid. CondConv convolution kernel parameters are computed by linearly weighting the convolution kernels with the weight coefficients of the n experts. After obtaining the weighted expert kernels, they are combined through a combine operation, requiring only a single convolution thereafter. The calculation process is shown in Equation (2).
Output x = σ α 1 W 1 + + α n W n x
In Equation (2), x denotes the input feature derived from the previous layer, σ is the activation function, α 1 , ⋯, α n are the weight coefficients of each convolution kernel, and W 1 , ⋯, W n denote different convolution kernels. n denotes the number of experts. α n denotes the nth weight of the output of the routing function, where α n = r n . The feature maps are created by convolutionally combining the convolutional kernel parameters with the input features.
To address the scale variations of maize tassels and enhance the scope of perception and contextual understanding of the model, this study introduces the CondConv module to modify the feature extraction network and puts forward a novel dynamic feature extraction framework. The proposed network architecture reduces unnecessary calculations while simultaneously improving feature extraction capabilities [30].

3.4. DMSF-P2 Structure

In complex large-field maize tassel recognition scenarios, occlusion and scale inconsistencies often occur, resulting in high feature complexity and diversity. During scale fusion, small maize tassel targets and detailed feature information may be lost. Kang et al. [31] proposed an attention-based scale sequence fusion framework (ASF-YOLO), which utilizes the Scale Sequence Feature Fusion (SSFF) module to effectively integrate features from different hierarchical layers. This method can effectively combine shallow feature detail information and deep feature information, thereby improving the feature extraction effect. Additionally, a Triple Feature Encoding (TFE) module is introduced for combining multi-scale features, further enhancing the detection of small object details [32]. In YOLOv8, the neck network has a PAN-FPN topology, which limits its capacity to efficiently capture fine-grained feature information and overlooks contextual relationships among features at different scales. To solve these problems, this study introduces a new output layer (P2) based on the original detector head branching structure, which is specialized in extracting detailed information in high-resolution feature maps [33]. Based on the ASF-YOLO framework, a novel DMSF-P2 network structure is proposed, incorporating the SSFF-D module, the TFE module, and the P2 small object detection layer.

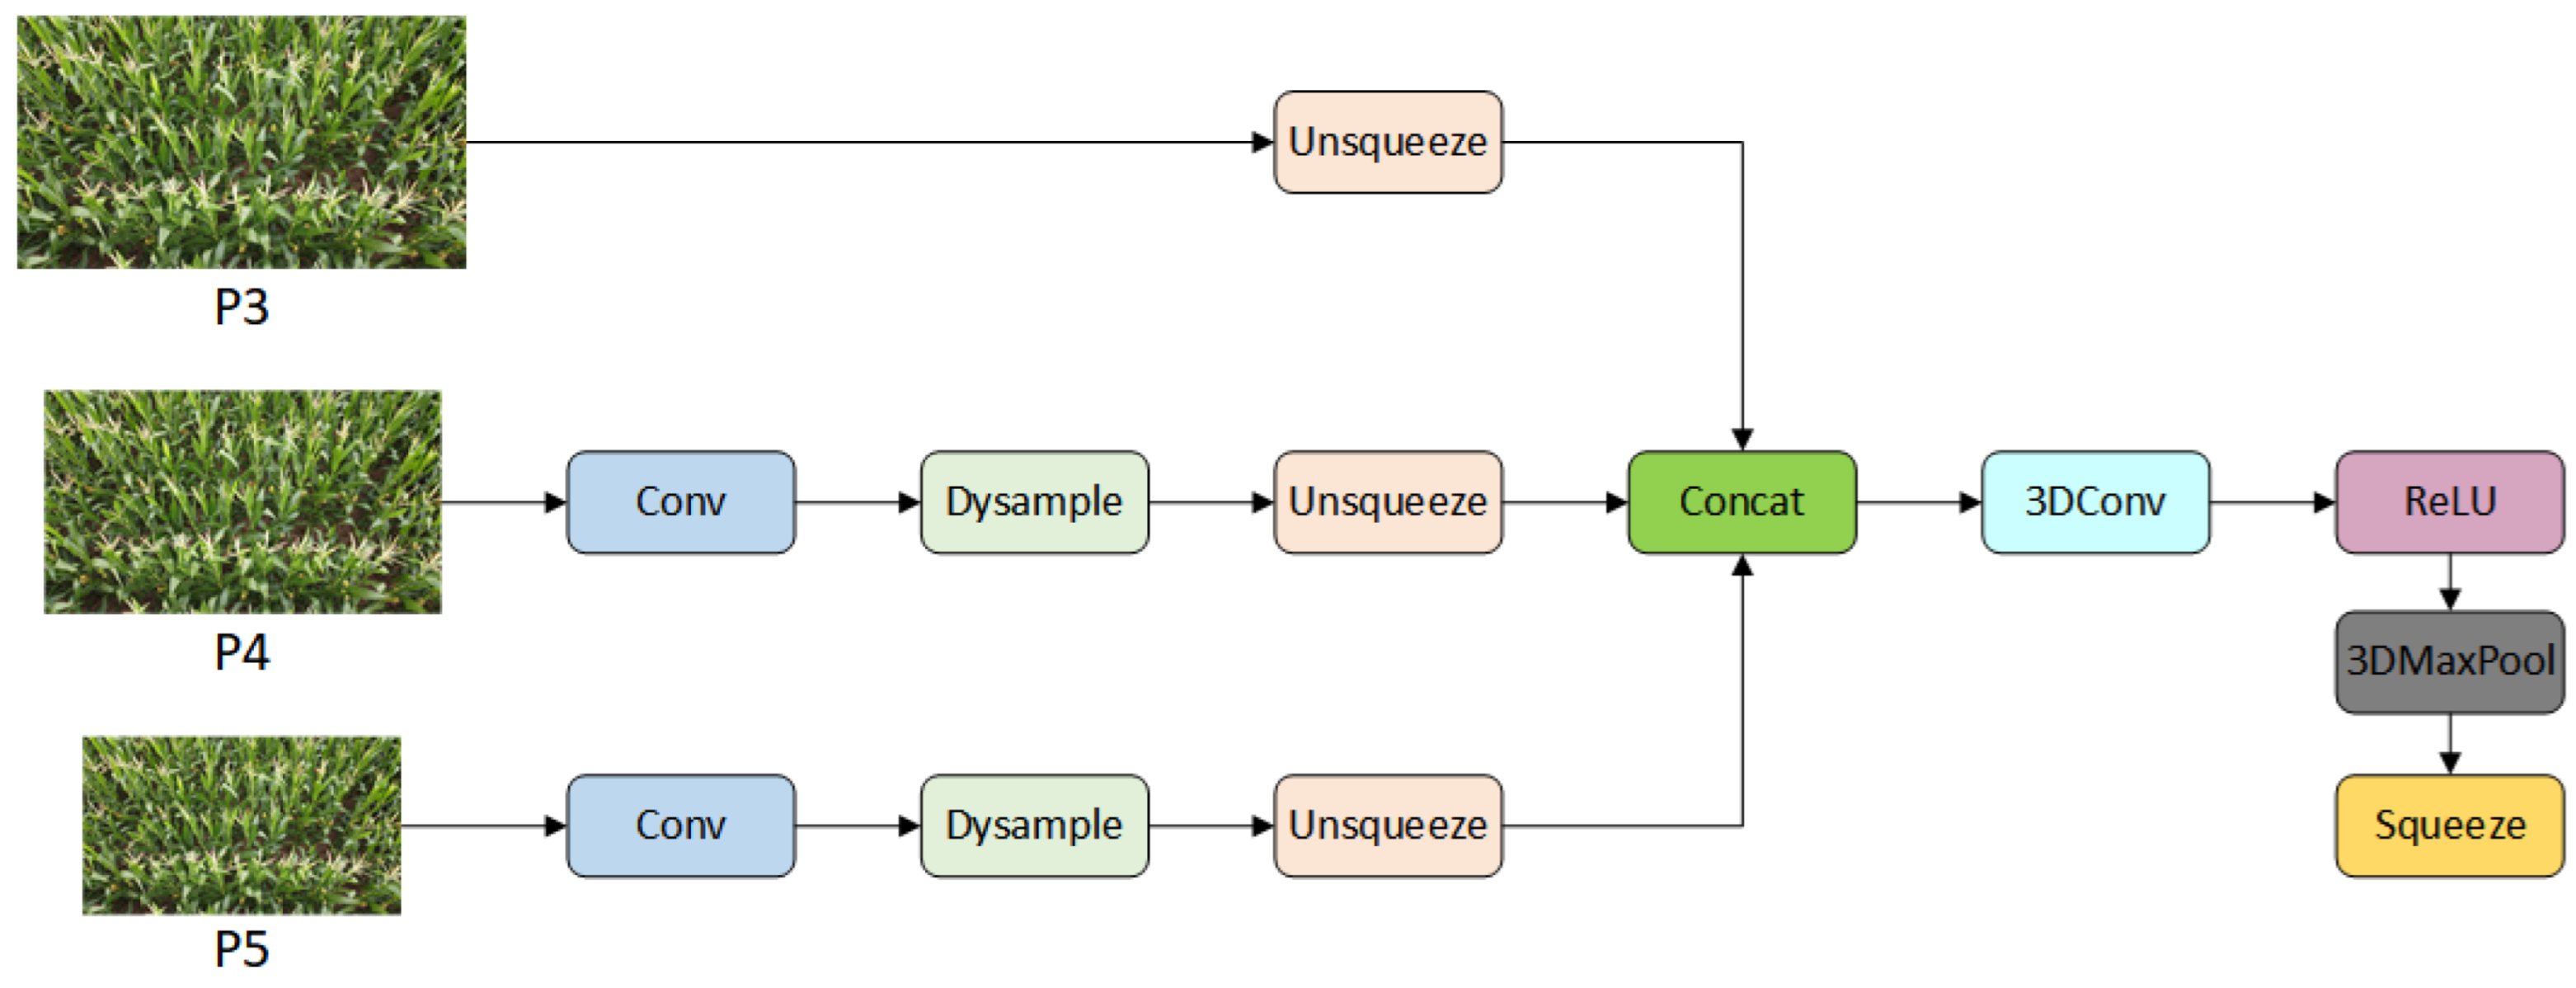
3.4.1. SSFF-D Module
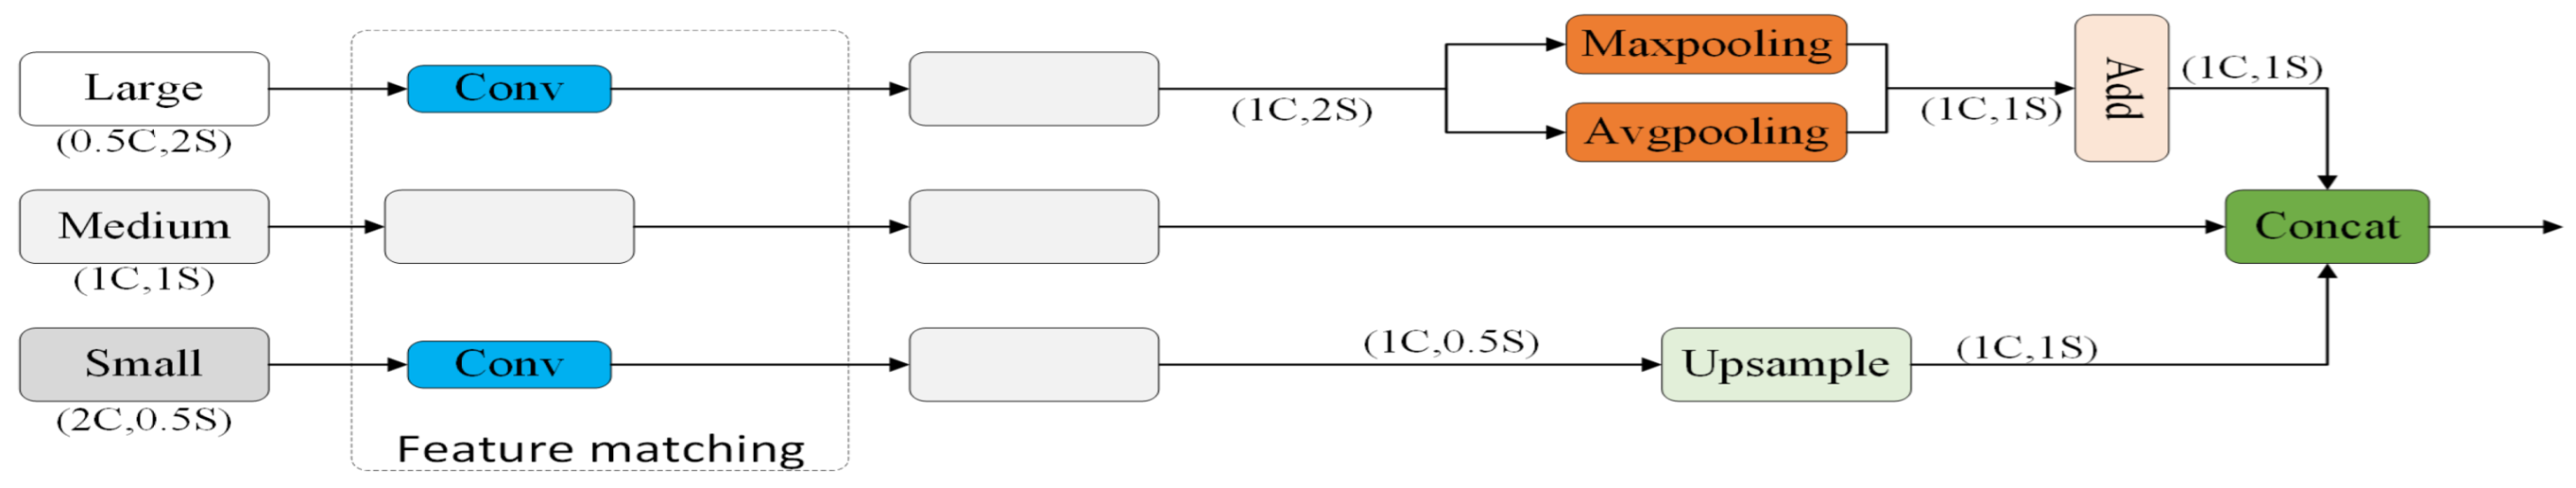
The SSFF-D module integrates the Dysample module based on the SSFF framework [34], with its network architecture illustrated in Figure 7. The SSFF-D module enhances the connection between features at multiple levels of hierarchy by merging feature maps of different sizes, thus improving the ability to capture multi-scale maize male ear features.
First, the three feature maps with different scales are resized to the same 256 channels using a convolutional operation, and the P4 and P5 hierarchies are then dynamically upsampled by the Dysample module to match the P3 hierarchy. Then, the 3D feature maps tensor is expanded to a 4D tensor by unsqueeze, the obtained 4D feature maps are spliced, and the spliced results are extracted by 3D convolution to extract rich contextual information. Finally, the BN batch normalization operation is employed to accelerate model training. The ReLU activation function is introduced for nonlinear transformation to learn more complex feature information. The feature map is downscaled while retaining important information and removing unnecessary redundant unidimensional information through 3D pooling and squeeze operations.
In the SSFF-D network, Dysample replaces the original Upsample upsampling module, which, as a traditional nearest-neighbor interpolation algorithm, is an efficient image-scaling method that refines the target pixel values by copying the values of neighboring pixels. However, upsampling based on nearest-neighbor interpolation tends to miss tiny detailed features in the feature map, which reduces the network’s detection accuracy for small-target maize tassels [35]. In past studies, dynamic kernel-based upsampling methods have achieved good performance, but dynamic convolution and generation of dynamic kernels consume a lot of time and cannot meet real-time requirements. The Dysample algorithm, on the other hand, further optimizes the computational efficiency, reduces the consumption of computational resources, and does not rely on custom CUDA packages. Figure 8 illustrates the structure of Dysample [36], which can dynamically sample maps of features of various scales, lowering model complexity while maintaining effective feature extraction. This design allows the SSFF-D module to retain more semantic information when dealing with multi-scale feature fusion and shows stronger recognition performance.
Specifically, X is used as an input feature with a feature map size of C × H × W. The input feature is generated by the sampling point generator to generate the sampling set S. Then, the upsampled feature X’ with feature map size C × sH × sW is generated by the Grid sample function as shown in Equation (3).
X = G r i d s a m p l e ( X , S )
The sampling point generator’s primary function is to create the sampling set. The input feature X generates the offset by linear operation, introducing a 0.25 static parameter, multiplying the offset by 0.25 to constrain the offset range of the sampling sites, and solving the critical condition of overlapping and non-overlapping regions. The offset O is generated by pixel shuffling, and the calculation process is shown in Equation (4). Finally, the initial sampling network G and the offset O are summed to generate the sampling set S. The calculation process is shown in Equation (5).
O = 0.25 l i n e a r ( X )
S = O + G

3.4.2. TFE Module

The principle of TFE is shown in Figure 9 [31]; Large, Medium, and Small represent different sizes of feature maps, and the two feature map channels, Large and Small, are adjusted to 1C by Feature Matching to achieve matching with the Medium feature map. Then, Large is downsampled by Maxpooling and Avgpooling to reduce it to the same feature space dimension as Medium. Small is dynamically upsampled by the Dysample module to restore the same feature dimensions as Medium. Large-size feature maps have a larger sensory field and can accurately capture global semantic information. A small-size feature map can focus on more detailed information, so it retains more spatial texture information about the early maize tassel. Medium-size feature maps achieve a balance between the two. Finally, the three feature maps with the same latitude are spliced by Concat, as shown in Equation (6).
Output = Concat L , M , S
where O u t p u t denotes the final result feature map, and L, M, and S denote three feature maps of the same dimension.

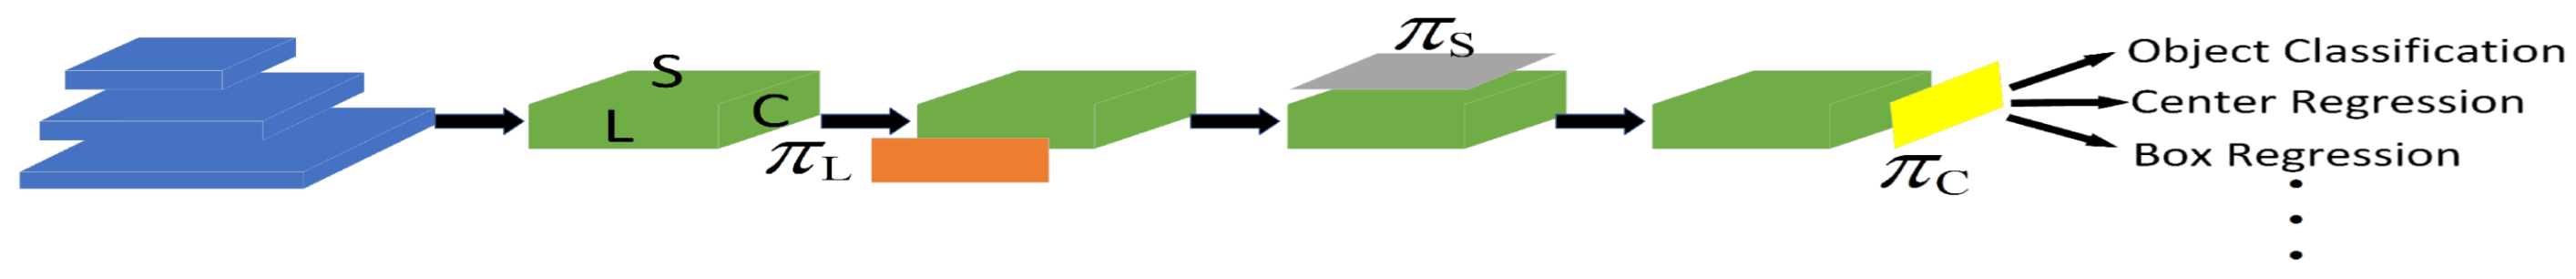
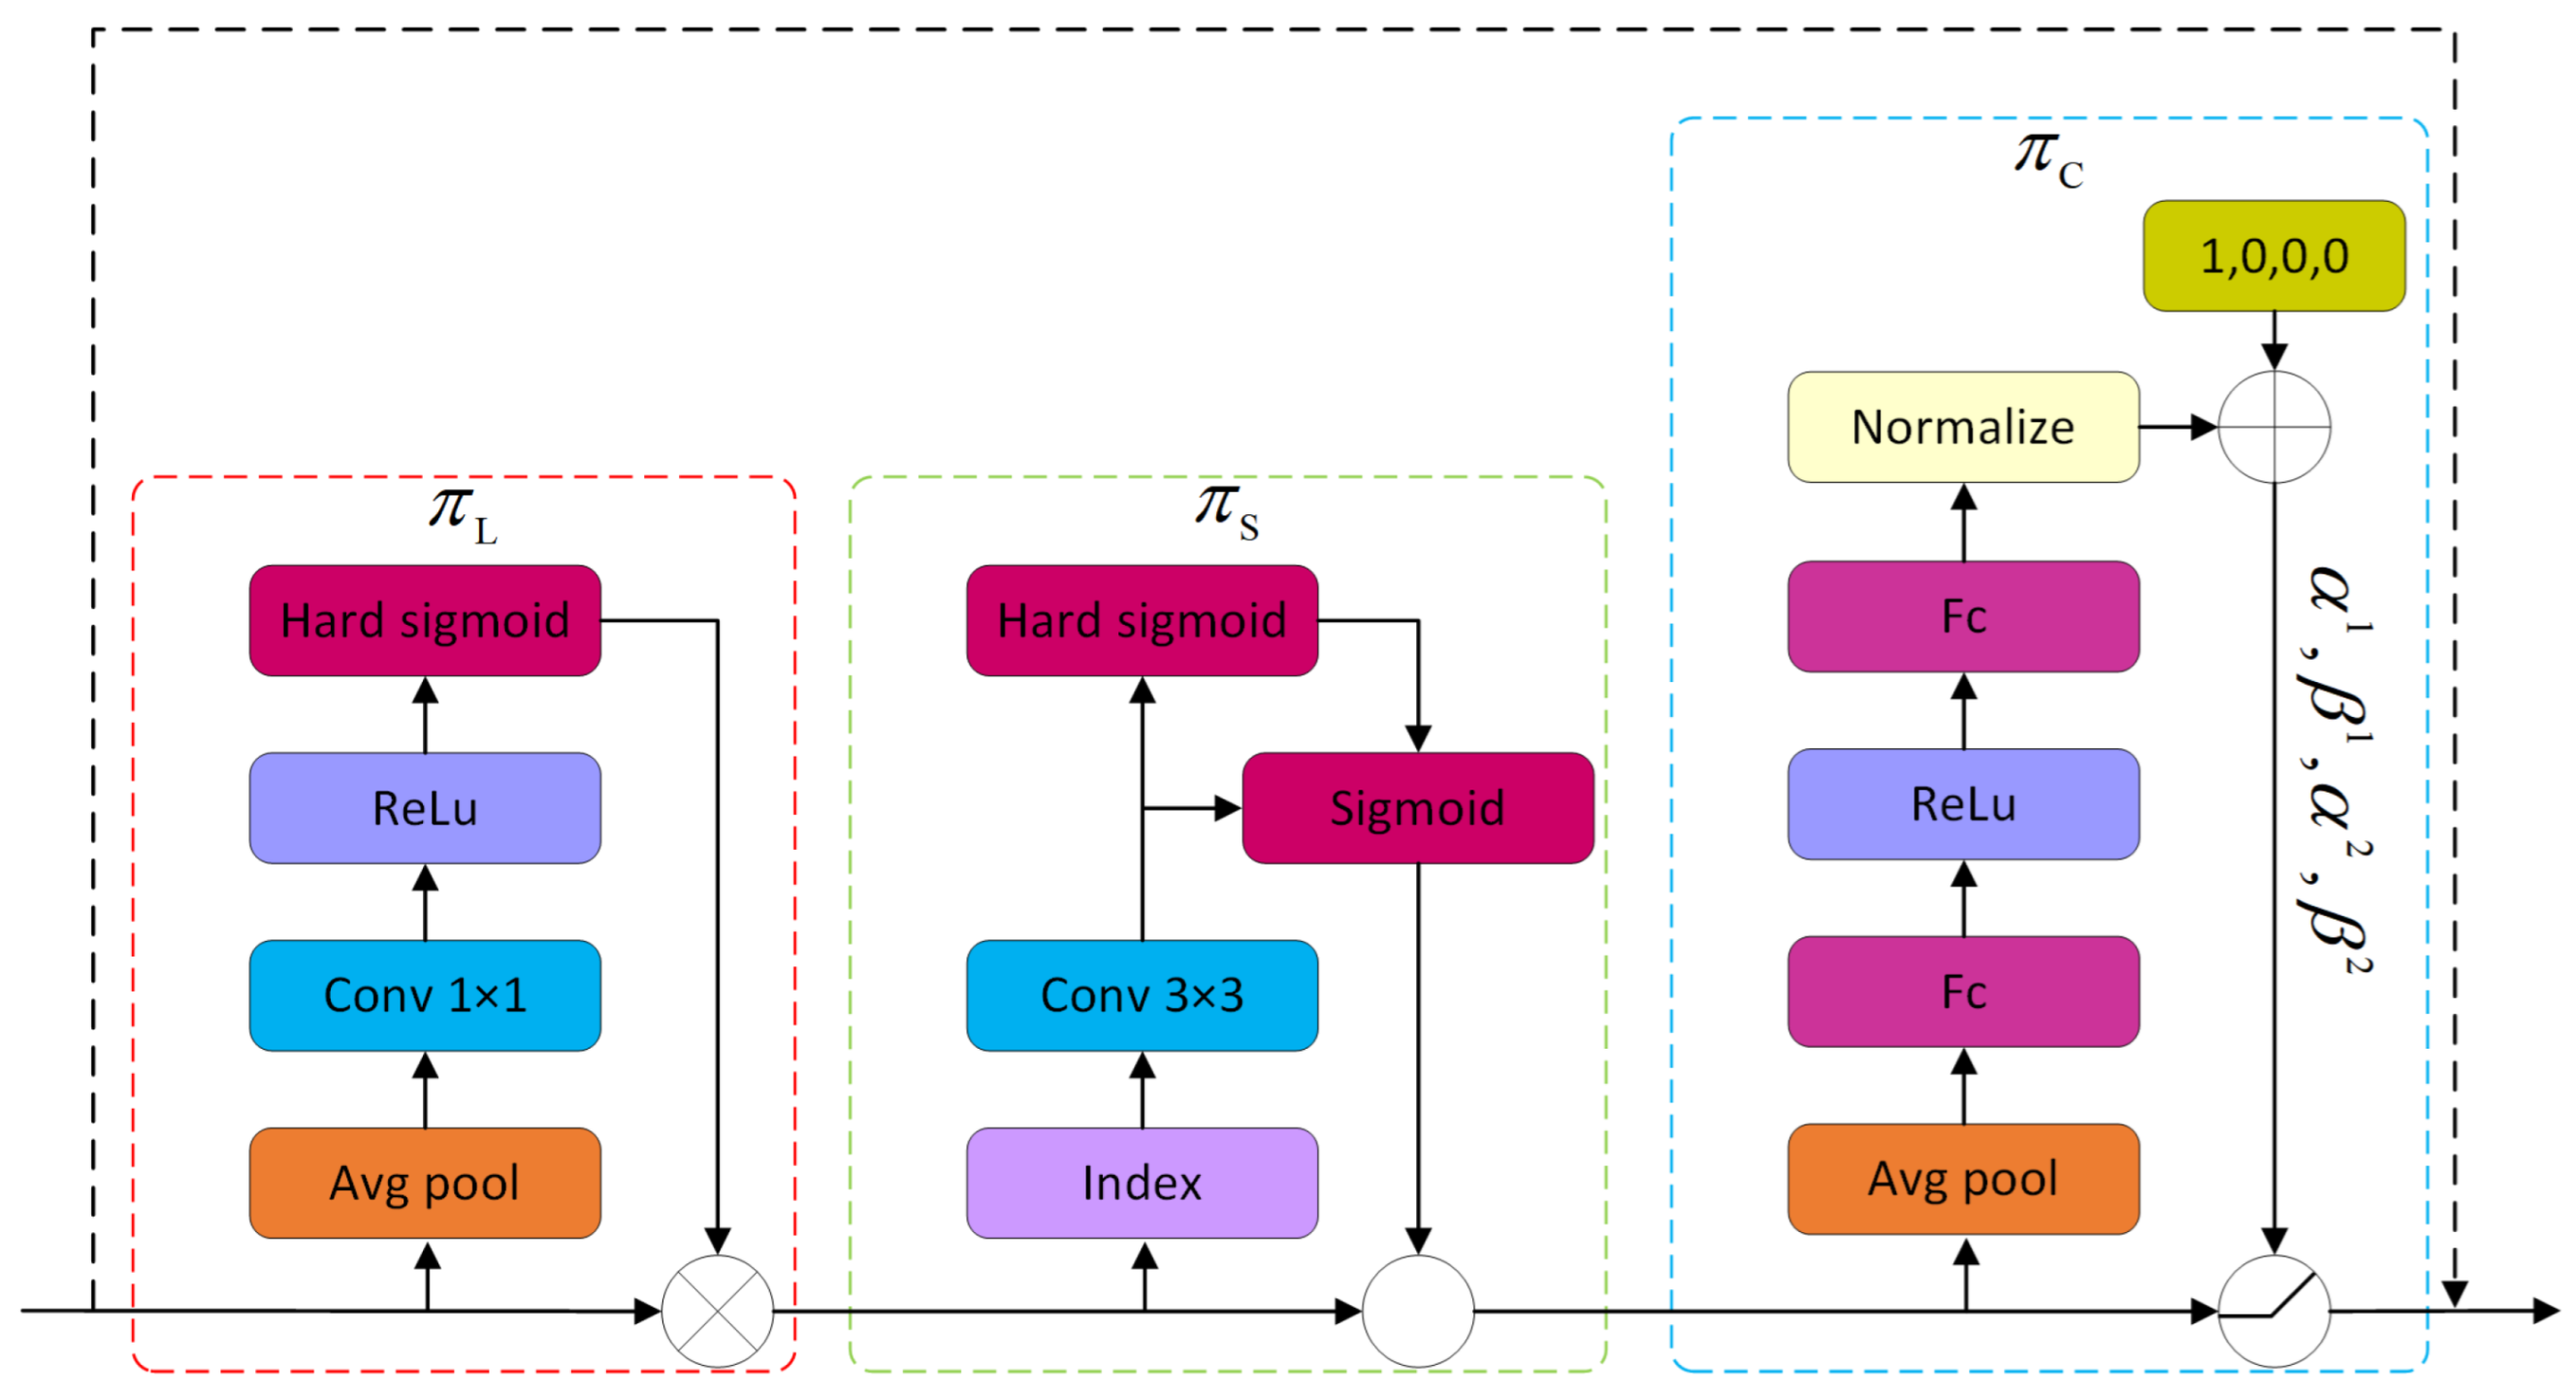
3.5. Attention Mechanism-Based Dynamic Detection Head (Dyhead)

The YOLOv8 detection head enables the prediction of target positions and the calculation of category probabilities. However, in the multi-scale characterization scenario of maize tassels in a large field, due to changes in UAV height and angle, as well as the irregular morphology of maize tassels, the traditional single-scale prediction detection head is difficult to use to effectively handle such scale changes [37]. In this research, a novel Dyhead detection head is adopted, and the Dyhead architecture is shown in Figure 10.
Dyhead introduces three different attention mechanisms, Scale-Aware Attention, Spatial-Aware Attention, and Task-Aware Attention, and the structure of each attention mechanism of Dyhead is shown in Figure 11. Scale-Aware Attention can adapt to the irregularity and scale diversity of maize tassel morphology and reduce the impact caused by the scale difference of the maize tassel. Spatial-Aware Attention weakens the interference of irrelevant regions in the context of large fields by focusing on the detailed information of each region, thereby enhancing the model’s capacity to capture critical information. Task-Aware Attention can dynamically allocate attention weights among different tasks, thereby optimizing the model’s performance in multi-task scenarios.
Dyhead employs three independent attention mechanisms, each focusing on a single dimension. Input feature F R L × S × C , where L denotes the feature level, S denotes the spatial position, and C denotes the number of feature channels. π L ( · ) , π S ( · ) , and π C ( · ) are the attention functions under the three dimensions of L, S, and C, respectively. The specific calculation process is shown in the following equation:
W F = π C π S π L F · F · F · F
In Equation (7), π L ( · ) , π S ( · ) , and π C ( · ) represent Scale-Aware Attention, Spatial-Aware Attention, and Task-Aware Attention, respectively. The computational procedures for these three attention mechanisms are delineated as follows:
(1)
The computation process of Scale-Aware Attention π L is demonstrated by the following formula.
π L F · F = σ f 1 S · C S , C F · F
(2)
The computation process of Spatial-Aware Attention π S is demonstrated by the following formula.
π S F · F = 1 L l = 1 L k = 1 K W l , k · F l ; p k + p k ; c · m k
(3)
The computation process of Task-Aware Attention π C is demonstrated by the following formula.
π C F · F = max α 1 F · F C + β 1 F , α 2 F · F C + β 2 F
In Equation (8), f ( · ) uses a linear function instead of a 1 × 1 convolution for the dimensionality reduction operation and σ ( x ) denotes the Hard-sigmoid activation function. In Equation (9), k denotes the number of sparsely sampled positions, p k + Δ p k denotes the position after the Δ p k offset in the self-learning space, and Δ m k denotes the importance scalar at position p k , both of which can be obtained by learning the input features from the middle layer of F. In Equation (10), F C denotes the feature slice of the C-th channel, and [ α 1 + α 2 + β 1 + β 2 ] T denotes the hyperfunction of the threshold control mechanism [38].

3.6. Optimization Loss Function

The original YOLOv8 network used the Complete Intersection over Union (CIOU) loss function [39]. This loss function improves on the traditional IoU by adding centroid distance and aspect ratio, which improves the accuracy of the bounding box regression.
In the complex field environment, the maize tassel presents different scales and irregular features. However, the CIoU loss function predominantly relies on the centroid distances of bounding boxes when processing feature maps with inconsistent size distributions. For small-target maize tassels, their diminutive size induces minimal deviation between the predicted anchor frames and the real frames, ultimately leading to a larger loss value. When maize tassels overlap and multiple predicted targets converge to the same real box, this phenomenon causes target detection misses.
To solve the above problems, this paper introduces the Wise-IoU (WIoU) loss function [40]. The WIoU series of loss functions contains three versions: v1, v2, and v3. WIoU v1 introduces the idea of a distance metric and designs the distance-attention-based bounding box loss. The calculation process is shown in Equations (11)–(13).
L I o U = 1 I o U
R W I o U v 1 = exp x x g t 2 + y y g t 2 W g + H g
L W I o U v 1 = R W I o U v 1 L I o U
where x and y denote the center coordinates of the predicted box, x g t and y g t denote the center coordinates of the real box, W g and H g denote the width and height of the overlapping area of the prediction and target boxes, and ∗ denotes that it will be separated from the computational map during the computation.
In this study, we use WIoU v3 version. WIoU v3 improves on WIoU v1 and realizes the dynamic adjustment of the bounding box regression process through the dynamic non-monotonic mechanism. For different scales and irregular maize tassel features, the dynamic gradient adjustment mechanism will adaptively adjust the gradient response to enhance the feature extraction capability. The calculation process is shown in Equations (14)–(16).
L W I o U v 3 = r L W I o U v 1
r = β δ α β δ
β = L I o U L I o U
where r denotes the non-monotonic focusing coefficient. β denotes the outlier degree, which is used to evaluate how well the predicted box matches the real anchor frame. α and δ denote the hyperparameters during the model training process. L I o U is the dynamic value, which is used to obtain the best quality of the anchor frames during the model training process. The WIoU loss function adaptively regulates the weight according to the matching quality between the predicted box and the real box. This enables the model to better adapt to the characteristics of small-scale maize tassels and overlapping tassel regions in complex environments, thus optimizing the precision of the regression of the bounding box.

3.7. Experimental Environment

To ensure the rigor and comparability of the experimental result, this study uses the same computer for model training. The specific hardware and software parameter configurations are shown in Table 3. Among them, both the Intel(R) Core(TM) i9-9900KF CPU and the NVIDIA GeForce RTX 2080 Ti are manufactured in Santa Clara, California, USA. The CPU is produced by Intel Corporation (Santa Clara, CA, USA), while the GPU is produced by NVIDIA Corporation (Santa Clara, CA, USA).
During the model training process, the image input size is set to 640 × 640 to ensure that the model can adequately capture the information of the tiny features of the maize tassel. The whole training process is 200 epochs, with the batch size and workers count set at 8 and 16, respectively, based on the GPU and CPU performance. In order to achieve stable convergence of the model, the default hyperparameter of the pre-trained weights provided by the official YOLOv8 is used, the optimizer is selected to be SGD, and the initial learning rate is set to be 0.01. The main parameter configurations used for training are shown in Table 4.

3.8. Model Evaluation

The model evaluation indexes are primarily based on precision (P), recall (R), mean average precision (mAP), and Parameters (params). P denotes the ratio of predicted positive samples to actual positive samples, and R denotes the ratio of all positive samples to those predicted to be positive. P and R are calculated as shown in Equations (17) and (18). The area under the precision–recall (P-R) curve, denoted as AP, is used to assess a single class’s detection performance. mAP includes two commonly used metrics: m A P 50 and m A P 50 : 95 . m A P 50 refers to the average precision (AP) calculated at an Intersection over Union (IoU) threshold of 0.5, while m A P 50 : 95 represents the average precision averaged over multiple IoU thresholds, ranging from 0.5 to 0.95. Since there is only one category in this study, mAP is equal to the average precision (AP). mAP is calculated as shown in Equation (19). Params serves as a metric for evaluating the model’s volume and complexity.
P = T P T P + F P × 100 %
R = TP TP + FN × 100 %
mAP = AP = 0 1 P R d R
where TP denotes the number that can be correctly predicted as a positive example, FP denotes the number that is incorrectly predicted as a positive example, and FN denotes the number that is not correctly recognized as a maize tassel.

4. Experiment and Analysis

4.1. Model Selection

The YOLOv8 series includes models at different scales. In this study, each model is trained end-to-end on a self-built maize tassel dataset, and its performance is evaluated on a test set, which is displayed in Table 5. YOLOv8n has lower model parameters and complexity compared to the other series. Although other versions of models have higher detection accuracy, they require higher computational resources for model deployment.

4.2. Ablation Experiments

4.2.1. The Impact of Different Modules on the Baseline Model

To further test the contribution of different improved modules to the model, in this research, ten sets of ablation experiments were designed, and the model was trained using an end-to-end approach. Subsequently, the model was evaluated on a maize tassel test set to measure its performance. Using YOLOv8n as the base model, the model improvement scheme was evaluated. The evaluation metrics used were P, R, m A P 50 , m A P 50 : 95 , and Params, and the results of the evaluation are shown in Table 6.
In Table 6, algorithms A, B, C, and D denote the integration of CondConv, DMSF-P2, Dyhead, and WIoU into the YOLOv8 model, respectively, where the check mark (✓) indicates the usage of the corresponding module.
The experimental results show that Algorithm A enhances the feature extraction performance of the YOLOv8 base model, and P, R, m A P 50 , and m A P 50 : 95 are improved by 0.7%, 0.3%, 0.5%, and 0.2%, respectively, where parameters are slightly increased. Algorithm B enhances the feature fusion efficiency of the model, and P, R, m A P 50 , and m A P 50 : 95 are, respectively, improved by 0.1%, 0.4%, 0.8%, and 0.5% and reduce the number of model parameters. Algorithm C enhances the small-target detection performance of the model by 0.8%, 1.1%, 0.9%, and 1.5% for P, R, m A P 50 , and m A P 50 : 95 , respectively, where the number of model parameters is increased by 0.98 M. Algorithm D further optimizes the bounding regression box of the model, and P, R, m A P 50 , and m A P 50 : 95 improved by 0.7%, 0.1%, 0.4%, and 0.1%, respectively. Algorithm E introduces CondConv and DMSF-P2 to optimize the feature extraction and feature fusion networks, respectively. This algorithm further optimizes the network performance with a small number of parameters. Algorithm F introduces CondConv and Dyhead to optimize the feature extraction network and detection head, respectively. Parameters increase due to the introduction of Dyhead, which is caused by the triple attention mechanism, and they reach 3.7 M. The G algorithm introduces DMSF-P2 and Dyhead. While the detection head adds more parameters to the model, it also considerably improves its performance. Algorithm H combines Algorithms A, B, and C to optimize the feature extraction network, the feature fusion network, and the detection head. The comprehensive performance of the network is improved. Algorithm I optimizes the loss function on the basis of Algorithm H, and the improved model outperforms the original model. Despite a 0.69M increase in model parameters, P, R, m A P 50 , and m A P 50 : 95 showed significant improvements of 0.5%, 3.4%, 2.4%, and 3.9%.

4.2.2. The Impact of DMSF-P2 on the Baseline Model

In this experiment, ablation experiments were carried out on various DMSF-P2 modules to validate the contribution of internal modules in the network architecture. As shown in Table 7, introducing the Dysample module and the P2 module into the MSFNeck network can improve the detection performance while reducing the model parameters. Specifically, m A P 50 increased to 94.8%, and the parameter count decreased to 2.5 M.

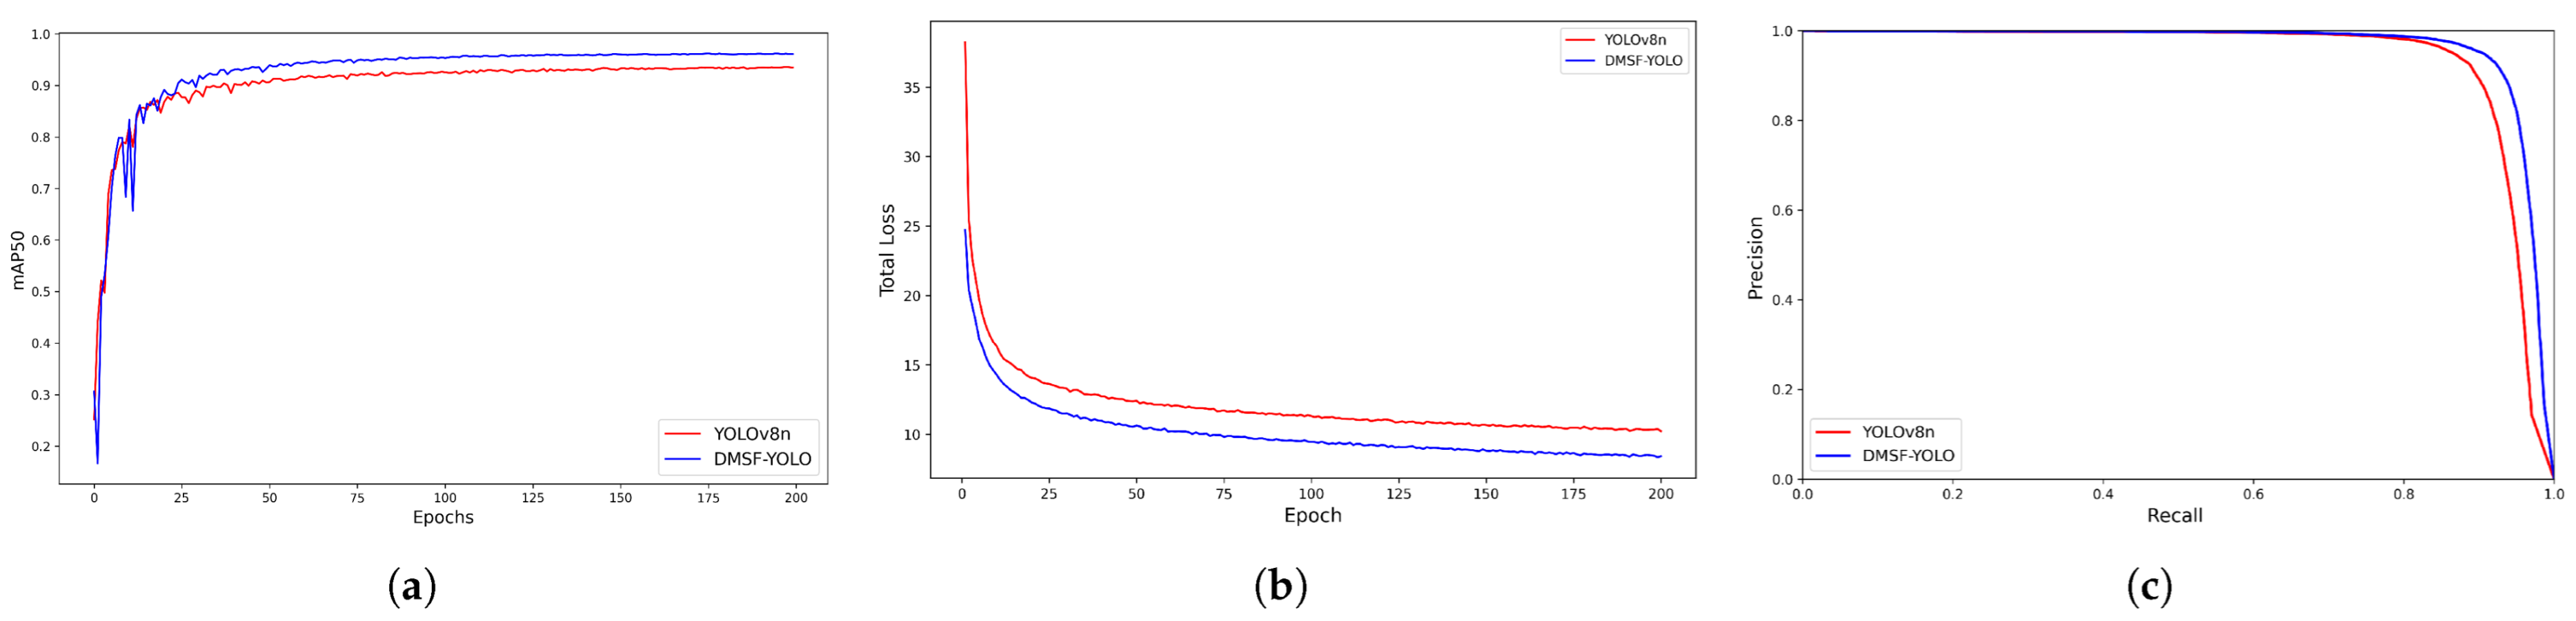
4.3. Performance Comparison Between DMSF-YOLO and YOLOv8n

This experiment performed a comparative analysis between the proposed DMSF-YOLO model and the YOLOv8n baseline model in the test set. Table 8 presents the detection accuracy metrics for different models, indicating that the m A P 50 of the proposed model improved by 2.4%. The experiment compared the model’s training and testing processes, with a primary focus on m A P 50 , loss, and the precision–recall (P-R) curve. As a key evaluation metric in object detection, m A P 50 intuitively reflects the model’s recognition capability. Loss indicates the convergence speed and optimization efficiency, while the P-R curve illustrates the balance between precision and recall across various thresholds. The comparison results are presented in Figure 12.
As illustrated in Figure 12a, the two models have the same convergence speed during the first 25 epochs. After 50 epochs, the curve stabilizes, and the DMSF-YOLO model consistently maintains a higher mAP value, demonstrating overall superior performance compared to the YOLOv8n model. As illustrated in Figure 12b, DMSF-YOLO demonstrates significant advantages, with the improved model converging faster and achieving lower loss compared to the baseline YOLOv8n model. As illustrated in Figure 12c, the DMSF-YOLO model has a larger area under the P-R curve than the YOLOv8n model, indicating that it maintains higher precision while simultaneously achieving a higher recall rate. Collectively, the DMSF-YOLO model maintains superior performance throughout both the training and testing phases.

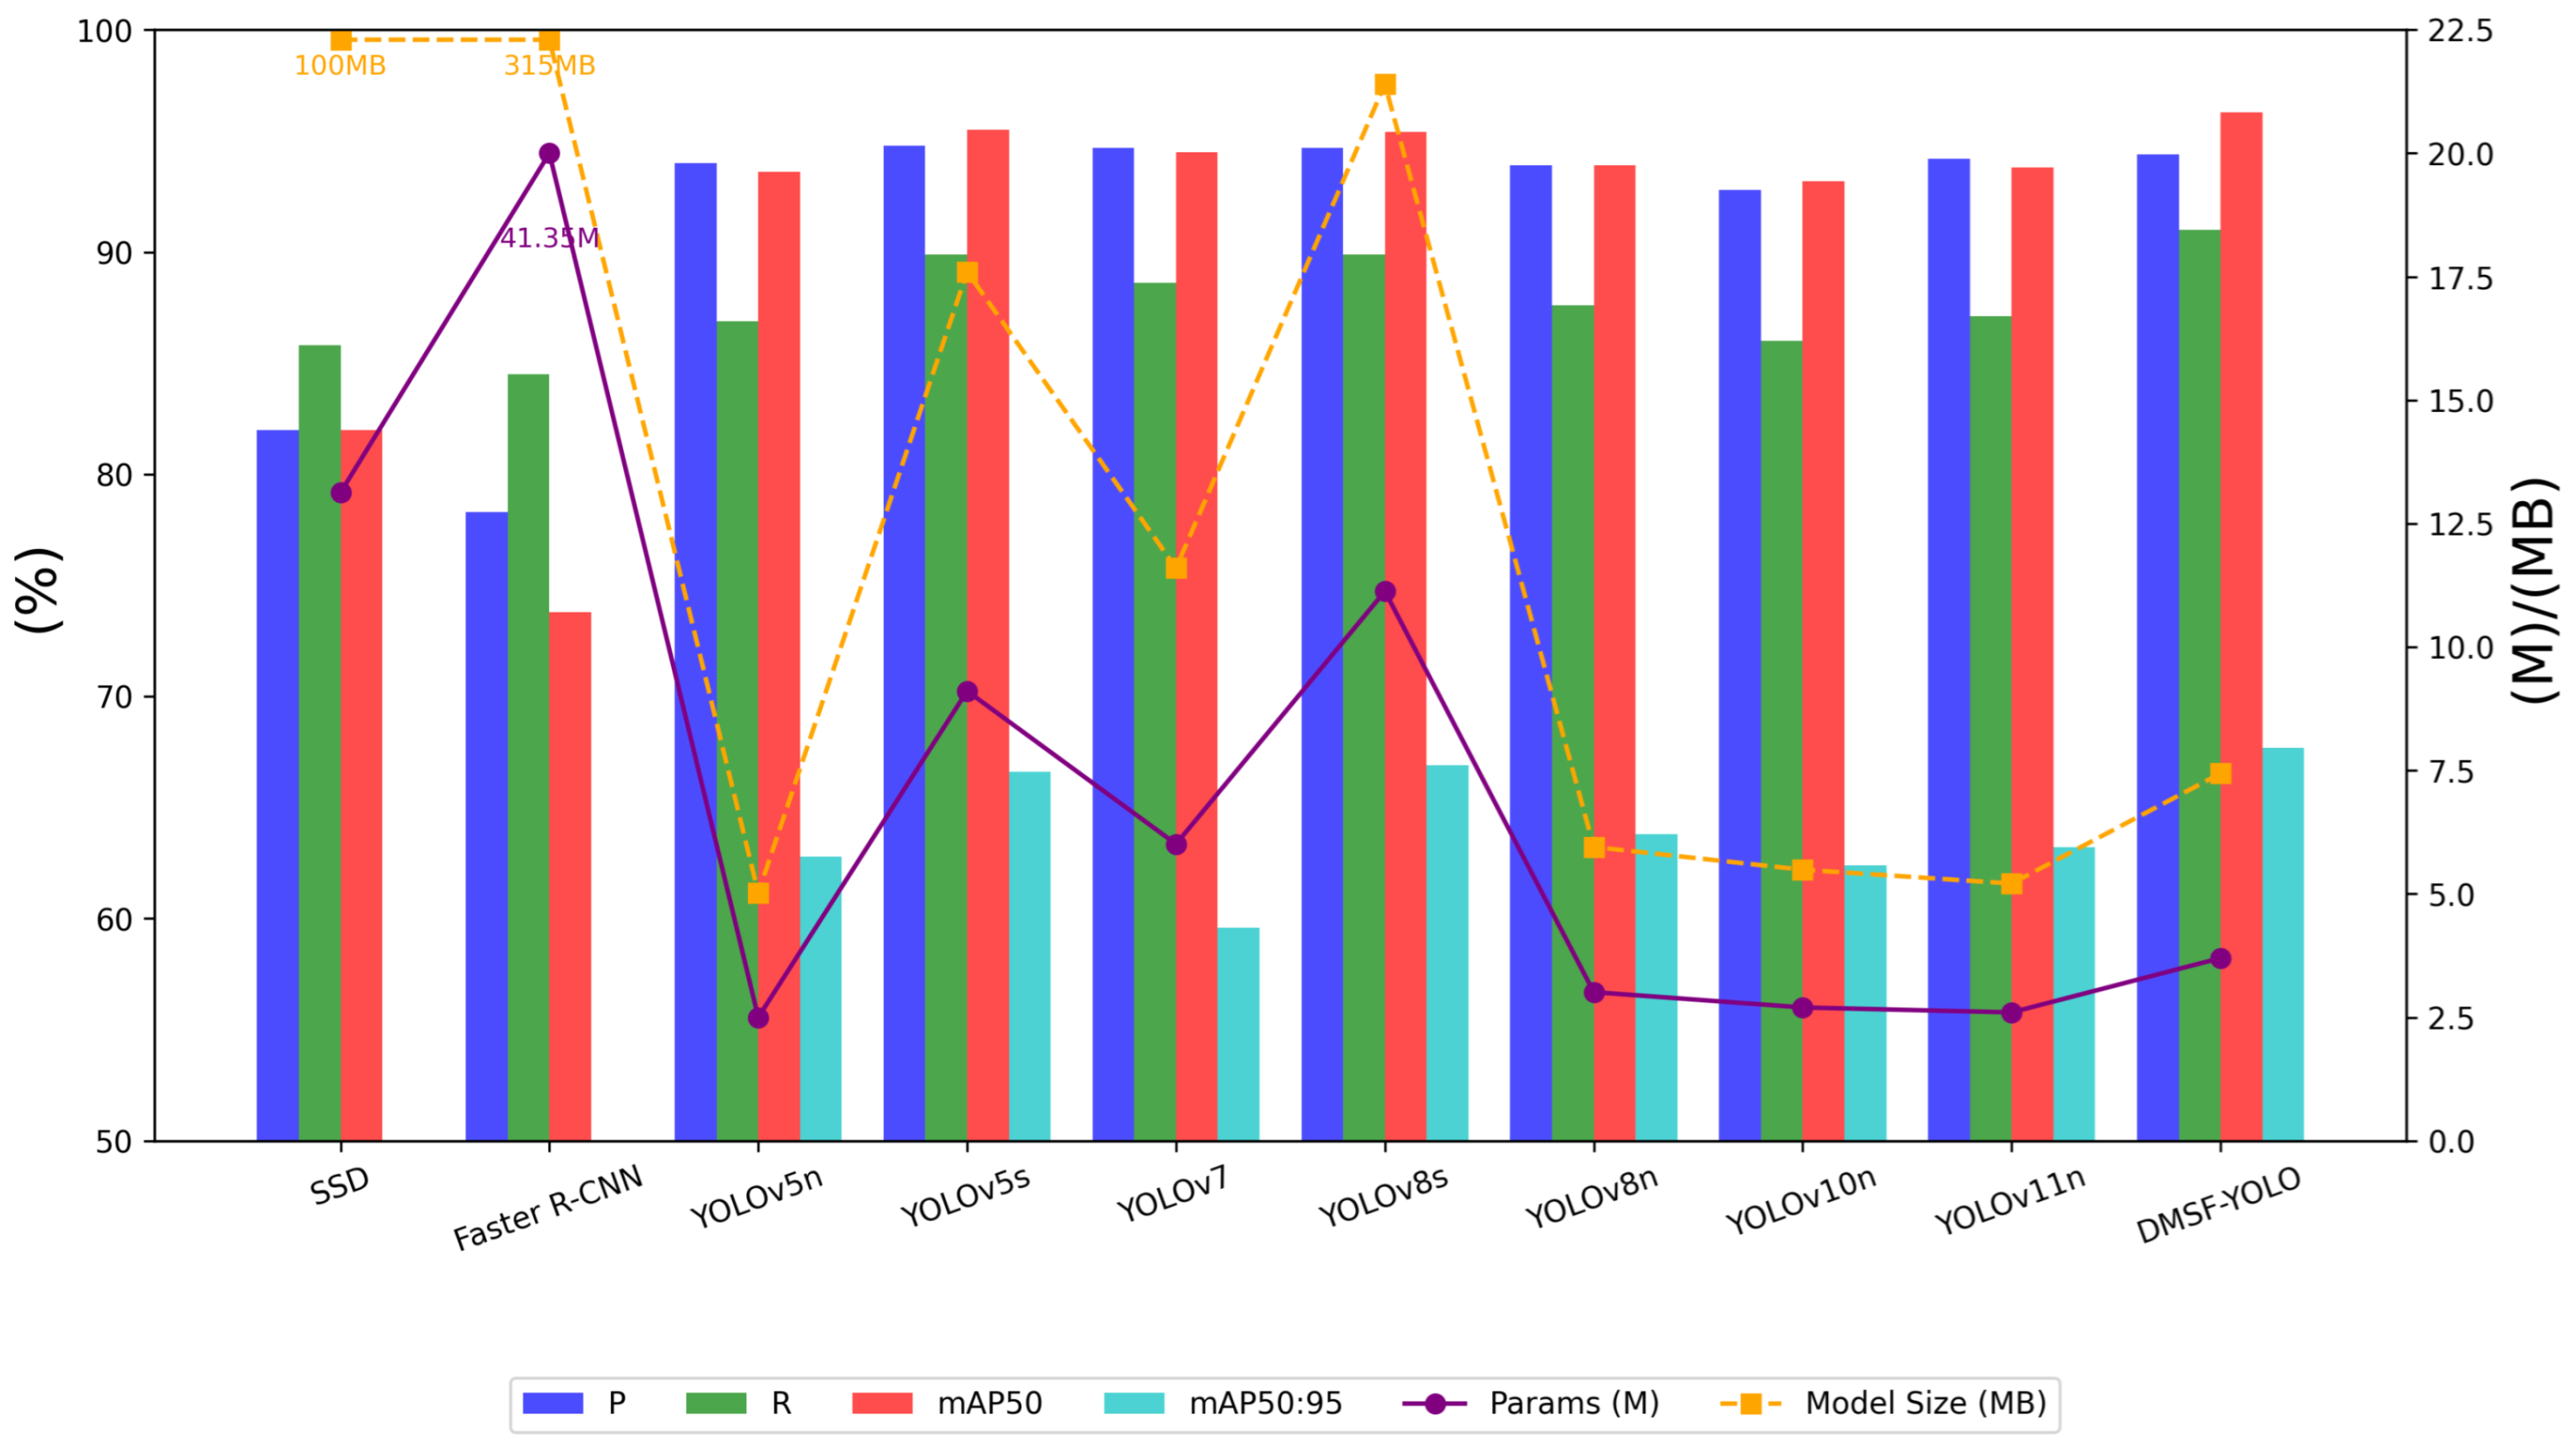
4.4. Performance Comparison of Different Object Detection Models

To further evaluate the performance of the DMSF-YOLO model, the mainstream two-stage target detection algorithms, including SSD, Faster R-CNN, and the YOLO series of single-stage target detection algorithms, including YOLOv5n, YOLOv5s, YOLOv7, YOLOv8s, YOLOv10n, and YOLOv11n, are selected for the present study. Models are trained using an end-to-end approach and performance is evaluated using test sets, and the results are shown in Table 9 and Figure 13.
The comparative experimental results demonstrate that the proposed DMSF-YOLO model exhibits optimal overall performance. While maintaining lightweight advantages (3.70 M parameters, 7.44 MB model size), it achieves an outstanding detection accuracy of 96.3% m A P 50 . Compared with other benchmark models, it improves detection accuracy by 2.7%, 0.8%, 1.8%, 0.9%, 3.1%, and 2.5%, respectively, showing significant performance superiority.
Although YOLOv5n performs well in terms of parameters and model size, which are 2.50 M and 5.02 MB, respectively, it performs poorly in terms of detection accuracy, with a m A P 50 of only 93.6%. Although the detection accuracy of YOLOv8s is high, the parameters and model size are increased by 7.43 M and 13.96 MB, respectively, compared with the DMSF-YOLO model, which is unsuitable for deployment on devices with limited hardware resources. SSD and Faster-RCNN perform poorly, with a m A P 50 of 82% and 73.8%, respectively, and in terms of model size, both are as high as 100 MB and 315 MB, respectively. In contrast, the DMSF-YOLO model offers significant performance advantages, providing a more competitive solution for practical application scenarios.

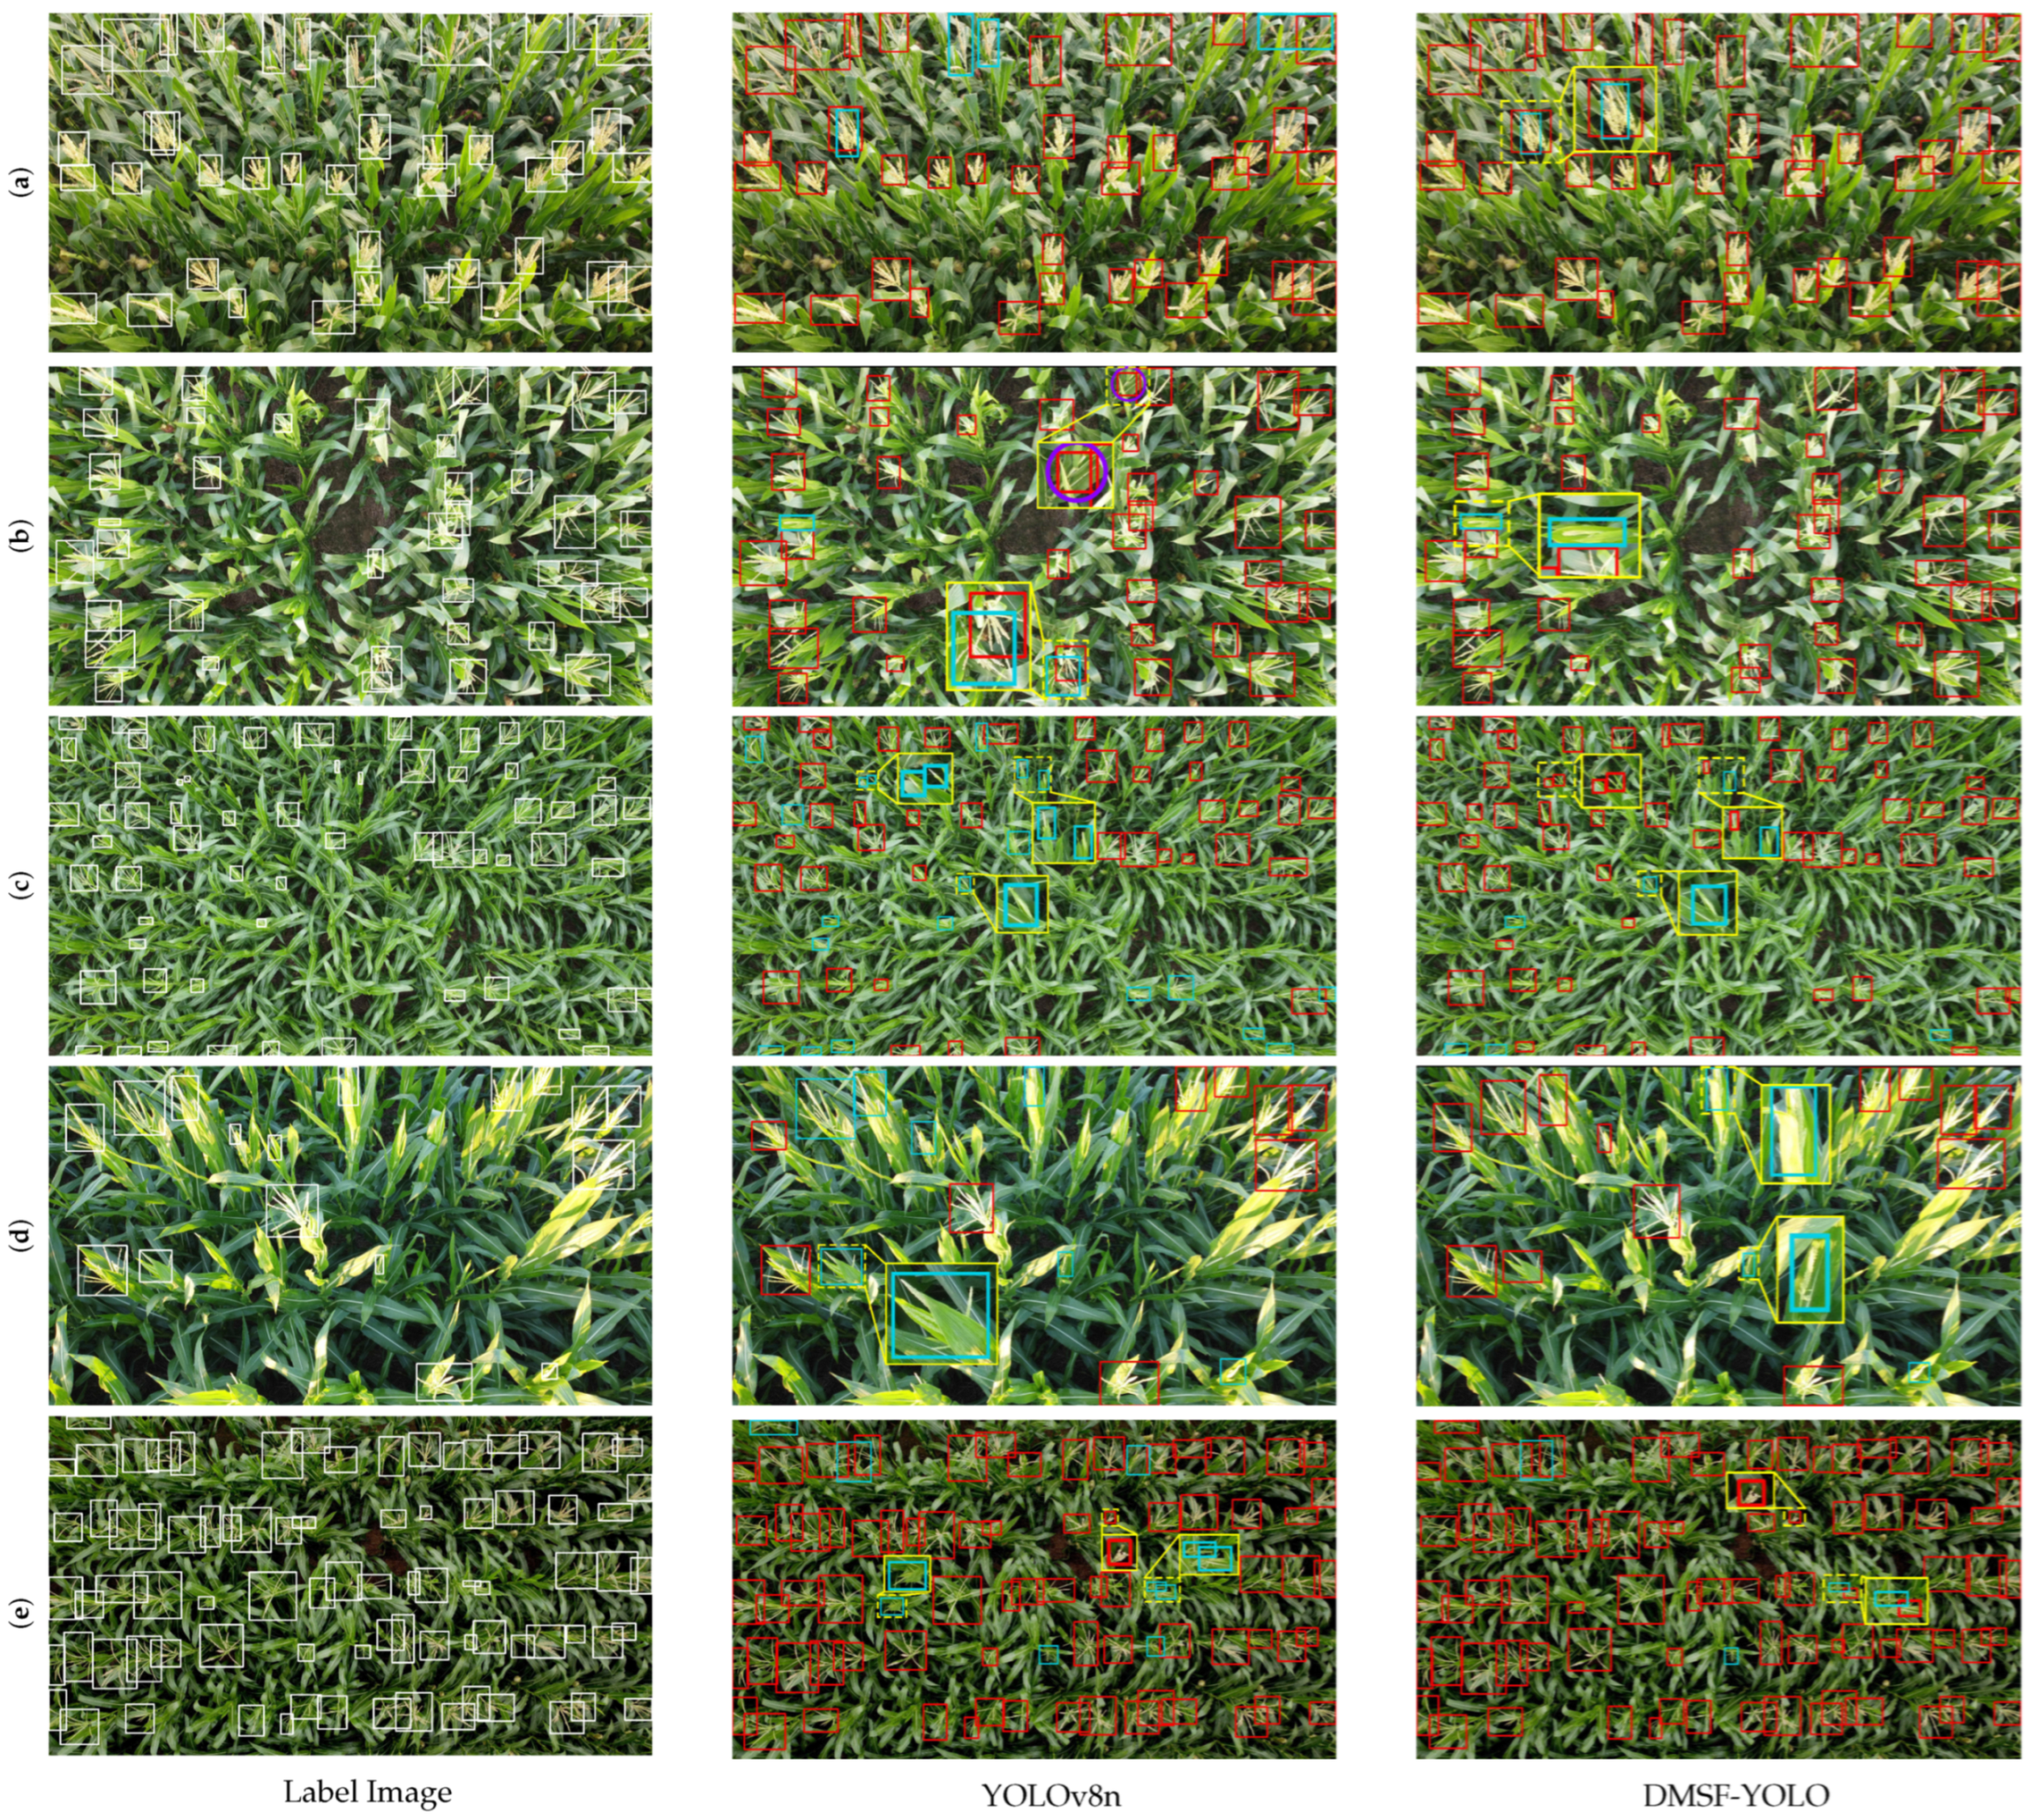
4.5. Visual Experimental Analysis

To intuitively observe the performance differences among various models, five representative images from the test set were selected for visualization and experimental analysis. The confidence threshold was set to 0.6 to reduce the false detection phenomenon. Figure 14 illustrates the model identification results of different models under various conditions. White borders denote real labels, red rectangular boxes denote a correct detection, blue rectangular boxes denote missed detections, purple circular boxes denote false detections, and yellow rectangular boxes denote zoomed-in regions. The experiments were conducted under five challenging conditions: tilted angles, vertical at 4 m, vertical at 5 m, strong-light environments, and low-light environments.
Experimental results indicate that in inclined-angle scenarios, DMSF-YOLO exhibited only one missed detection, significantly reducing the missed detection rate compared to other models. The model maintained a high level of accuracy when detecting tassels with slight overlap; however, missed detections were observed in all tested models in highly overlapping regions. In the vertical 4 m scenario, YOLOv8n not only showed false detections but also demonstrated insensitivity to small tassel features. In contrast, DMSF-YOLO achieved superior performance but still encountered missed detections when recognizing slender and fine-tassel features. In the vertical 5 m scenario, DMSF-YOLO demonstrated stronger detection capability for small tassels; however, its performance in detecting tassels at the image edges requires further optimization. Specifically, YOLOv8n showed 20 missed detections. In contrast, DMSF-YOLO exhibited only six missed detections. In high-intensity lighting conditions, DMSF-YOLO demonstrated superior accuracy and was capable of precisely identifying highly occluded tassels, whereas the YOLOv8n model failed to successfully detect these targets. Under low-light conditions, DMSF-YOLO exhibited only three missed detections, maintaining high detection stability and robustness. Overall, DMSF-YOLO demonstrated significant advantages in detecting small objects, slightly overlapping targets, and highly occluded targets, achieving superior detection efficiency.

5. Discussion

In this study, YOLOv8n was improved and selected as the base model, considering the deployability and lightweight nature of the model, as detailed in Section 4.1. Building upon this, the DMSF-YOLO maize tassel detection model was developed by optimizing the feature extraction, feature fusion, detection head, and loss function of the YOLOv8 architecture. Ablation experiments were carried out to illustrate the efficacy of every independent module, as shown in Table 6. In both the training and testing stages, the improved model performed better than the base model, and the performance of the model was demonstrated by m A P 50 , loss, and P-R plots, as shown in Figure 12. To more intuitively demonstrate the comparative effects of the DMSF-YOLO model with the YOLOv8 base model, this paper designed visualization experiments, as shown in Figure 14. The experiments show that through the multi-scale fusion algorithm, DMSF-YOLO improves the recognition ability of small targets and highly occluded male spikes and achieves higher detection accuracy in different scenarios.
Song et al. [41] collected maize tassel image data using close-range ground collection equipment and constructed a target detection model based on Faster R-CNN with ResNet34 as the backbone network. The mAP of the model is 93% and the parameters are 50.24 M. Faster R-CNN networks have a more complex structure, which causes them to consume more computational resources during model training and deployment [42]. With the development of the YOLO series, it is now widely employed in a variety of target identification tasks. Wu et al. [5] used drones to collect data at an altitude of 7 m during the flowering period of maize inflorescences and constructed a new ESG-YOLO model for the identification of maize tassels. Zhang et al. [22] constructed the Tassel-YOLO detection model with YOLOv4 as the base model, and the m A P 50 reached 95.11%. Currently, most existing research adopts the fixed-angle acquisition method [43]. Compared with the data acquisition method in this paper, the former has certain limitations, making it difficult to ensure reliable recognition ability under different angles. It is difficult to ensure reliable recognition ability under different angles. The DMSF-YOLO model proposed in this study achieves much higher detection accuracy with fewer parameters than other YOLO methods and two-stage algorithms in the experiment. Specifically, the model exhibits favorable lightweight characteristics, which reduce the difficulty for future deployment and enable it to adapt to multi-angle changes during UAV low-altitude flight.

6. Conclusions

In this study, we constructed a maize tassel dataset with different growth states, flight altitudes, and shooting angles, which enriched the maize tassel UAV low-altitude image data resources and provided data support for future crop phenotyping research and growth monitoring. Meanwhile, this paper proposes a DMSF-YOLO target detection model that significantly improves maize tassel detection performance in the field under complex conditions. First, the feature extraction part of the original YOLOv8n model was enhanced, and the CondConv module was introduced to improve the detail extraction capacity of the model. Second, the DMSF-P2 multi-scale dynamic fusion structure was created to enable the model to adapt to multi-scale feature information and improve the model’s expressive ability. The Dyhead module is integrated into the detection head to improve the detection head’s capturing ability of small-target maize tassels. Finally, the training process is optimized with the WIoU loss function, which enhances its learning ability.
The experimental results confirm that the DMSF-YOLO model achieves a m A P 50 of 96.3%, which is a 2.4% improvement over the original algorithm, and compared with the mainstream YOLO series algorithms, it improves 2.7%, 0.8%, 1.8%, 0.9%, 3.1%, and 2.5%, respectively, compared to YOLOv5n, YOLOv5s, YOLOv7, YOLOv8s, YOLOv10n, and YOLOv11n, in addition to showing higher robustness to complex scenes with different lighting conditions, scale variations, occlusion, and background interference. The proposal approach achieves a balance between model performance and computational resource efficiency while enhancing the accuracy of maize tassel detection.
Although the model achieved excellent performance, there are still some limitations, especially in the case of highly overlapping maize tassels, where the recognition accuracy will be affected to some extent. In addition, the model detection speed needs to be improved on resource-constrained hardware devices. Therefore, future work will optimize the model network structure based on the DMSF-YOLO algorithm and realize the lightweighting of the model through model pruning, distillation, and other techniques to ensure the applicability of the model in low-end hardware devices. Meanwhile, we will further enhance the model’s recognition ability for highly overlapping regions. In terms of data, the experimental dataset is further expanded. The next step will be to enrich images of maize tassels under different weather conditions, as well as to add image data of various crop phenotypes, such as sorghum tassels and wheat tassels, to improve the applicability of the model.

Author Contributions

Conceptualization, J.F., Y.Z. and D.L.; methodology, D.L.; software, D.L.; validation, J.F., D.L. and Y.Z.; formal analysis, D.L.; investigation, D.L.; writing—original draft preparation, D.L.; writing—review and editing, D.L.; visualization, D.L.; supervision, J.F. and Y.Z.; project administration, J.F. and Y.Z.; funding acquisition, J.F. All authors have read and agreed to the published version of the manuscript.

Funding

This work was supported by the Inner Mongolia Scientific and Technological Project under Grant (Grant No. 2023YFJM0002, 2025KYPT0088) and funded by the Basic Research Operating Costs of Colleges and Universities directly under the Inner Mongolia Autonomous Region (Grant No. JY20240076).

Data Availability Statement

The data presented in this study are available on request from the corresponding author. The data are not publicly available due to ongoing study.

Conflicts of Interest

The authors declare no conflicts of interest.

References

  1. Wang, Y.; Wei, J.; Long, Y.; Dong, Z.; Wan, X. Research Advances on Genetic Structure and Molecular Mechanism Underlying the Formation of Tassel Traits in Maize. Chin. Biotechnol. 2021, 41, 88–102. [Google Scholar]
  2. Li, Q.; Liu, N.; Wu, C. Novel insights into maize (Zea mays) development and organogenesis for agricultural optimization. Planta 2023, 257, 94. [Google Scholar] [CrossRef] [PubMed]
  3. Silvera, D.L.; Cargnelutti, A.; Neu, I.M.M.; Souza, J.M.; Kleinpaul, J.A.; Dumke, G.E. Genetic divergence in maize regarding grain yield and tassel traits. Rev. Cienc. Agron. 2021, 52, e20207509. [Google Scholar] [CrossRef]
  4. Xu, B.; Zhao, C.; Yang, G.; Zhang, Y.; Liu, C.; Feng, H.; Yang, X.; Yang, H. Genotyping Identification of Maize Based on Three-Dimensional Structural Phenotyping and Gaussian Fuzzy Clustering. Agriculture 2025, 15, 85. [Google Scholar] [CrossRef]
  5. Wu, W.; Zhang, J.; Zhou, G.; Zhang, Y.; Wang, J.; Hu, L. ESG-YOLO: A Method for Detecting Male Tassels and Assessing Density of Maize in the Field. Agronomy 2024, 14, 241. [Google Scholar] [CrossRef]
  6. Rodene, E.; Fernando, G.D.; Piyush, V.; Ge, Y.F.; Schnable, J.C.; Ghosh, S.; Yang, J.L. Image Filtering to Improve Maize Tassel Detection Accuracy Using Machine Learning Algorithms. Sensors 2024, 24, 2172. [Google Scholar] [CrossRef]
  7. Kurtulmus, F.; Kavdir, I. Detecting maize tassels using computer vision and support vector machines. Expert Syst. Appl. 2014, 41, 7390–7397. [Google Scholar] [CrossRef]
  8. Kumar, A.; Desai, S.V.; Balasubramanian, V.N.; Rajalakshmi, P.; Guo, W.; Naik, B.B.; Balram, M.; Desai, U.B. Efficient Maize Tassel-Detection Method using UAV based remote sensing. Remote Sens. Appl. Soc. Environ. 2021, 23, 100549. [Google Scholar] [CrossRef]
  9. Zan, X.; Zhang, X.; Xing, Z.; Liu, W.; Zhang, X.; Su, W.; Liu, Z.; Zhao, Y.; Li, S. Automatic Detection of Maize Tassels from UAV Images by Combining Random Forest Classifier and VGG16. Remote Sens. 2020, 12, 3049. [Google Scholar] [CrossRef]
  10. Martins, J.A.C.; Hisano Higuti, A.Y.; Pellegrin, A.O.; Juliano, R.S.; de Araujo, A.M.; Pellegrin, L.A.; Liesenberg, V.; Ramos, A.P.M.; Goncalves, W.N.; Sant’Ana, D.A.; et al. Assessment of UAV-Based Deep Learning for Corn Crop Analysis in Midwest Brazil. Agriculture 2020, 14, 2029. [Google Scholar] [CrossRef]
  11. Mao, L.; Wang, P.; Cao, H.; Zhao, Z.; Hu, Z.; Chen, Q.; Xin, D.; Zhu, R. A high-precision automatic diagnosis method of maize developmental stage based on ensemble deep learning with IoT devices. Comput. Electron. Agric. 2024, 227, 109608. [Google Scholar] [CrossRef]
  12. Ishedgoma, F.S.; Rai, I.A.; Said, R.N. Identification of maize leaves infected by fall armyworms using UAV-based imagery and convolutional neural networks. Comput. Electron. Agric. 2021, 184, 106124. [Google Scholar] [CrossRef]
  13. Liu, Y.; Feng, H.; Fan, Y.; Yue, J.; Yang, F.; Fan, J.; Ma, Y.; Chen, R.; Bian, M.; Yang, G. Utilizing UAV-based hyperspectral remote sensing combined with various agronomic traits to monitor potato growth and estimate yield. Comput. Electron. Agric. 2025, 231, 109984. [Google Scholar] [CrossRef]
  14. Leite, D.; Brito, A.; Faccioli, G. Advancements and outlooks in utilizing Convolutional Neural Networks for plant disease severity assessment: A comprehensive review. Smart Agric. Technol. 2024, 9, 100573. [Google Scholar] [CrossRef]
  15. Zhang, C.; Marzougui, A.; Sankaran, S. Application of UAV Multisensor Data and Ensemble Approach for High-Throughput Estimation of Maize Phenotyping Traits. Plant Phenomics 2022, 2022, 9802585. [Google Scholar]
  16. Zhang, C.; Marzougui, A.; Sankaran, S. High-resolution satellite imagery applications in crop phenotyping: An overview. Comput. Electron. Agric. 2020, 175, 105584. [Google Scholar] [CrossRef]
  17. Sheng, Q.; Ma, H.; Zhang, J.; Gui, Z.; Huang, W.; Chen, D.; Wang, B. Coupling Multi-Source Satellite Remote Sensing and Meteorological Data to Discriminate Yellow Rust and Fusarium Head Blight in Winter Wheat. Phyton-Int. J. Exp. Bot. 2025, 94, 421–440. [Google Scholar] [CrossRef]
  18. Sanaeifar, A.; Yang, C.; de la Guardia, M.; Zhang, W.; Li, X.; He, Y. Proximal hyperspectral sensing of abiotic stresses in plants. Sci. Total Environ. 2023, 861, 160652. [Google Scholar] [CrossRef]
  19. Du, X.; Zhou, Z.; Huang, D. Influence of Spatial Scale Effect on UAV Remote Sensing Accuracy in Identifying Chinese Cabbage (Brassica rapa subsp. Pekinensis) Plants. Agriculture 2024, 14, 1871. [Google Scholar] [CrossRef]
  20. Gao, R.; Violino, S.; Pallottino, F.; Figorilli, S.; Vasta, S.; Tocci, F.; Antonucci, F.; Jin, Y.; Tian, X.; Ma, Z.; et al. YOLOv5-T: A precise real-time detection method for maize tassels based on UAV low altitude remote sensing images. Comput. Electron. Agric. 2024, 221, 108991. [Google Scholar] [CrossRef]
  21. Zhang, X.; Zhu, D.; Wen, R. SwinT-YOLO: Detection of densely distributed maize tassels in remote sensing images. Comput. Electron. Agric. 2023, 210, 107905. [Google Scholar] [CrossRef]
  22. Xun, Y.; Yin, D.; Wen, R. Maize tassel area dynamic monitoring based on near-ground and UAV RGB images by U-Net model. Comput. Electron. Agric. 2022, 203, 107477. [Google Scholar]
  23. Pu, H.; Chen, X.; Yang, Y.; Tang, R.; Luo, J.; Wang, Y.; Mu, J. Tassel-YOLO: A New High-Precision and Real-Time Method for Maize Tassel Detection and Counting Based on UAV Aerial Images. Drones 2023, 7, 492. [Google Scholar] [CrossRef]
  24. Niu, S.; Nie, Z.; Li, G.; Zhu, W. Multi-Altitude Maize Tassel Detection and Counting Based on UAV RGB Imagery and Deep Learning. Drones 2024, 8, 198. [Google Scholar] [CrossRef]
  25. Li, Z.; Zhu, Y.; Sui, S.; Zhao, Y.; Li, P.; Li, X. Real-time detection and counting of wheat ears based on improved YOLOv7. Comput. Electron. Agric. 2024, 218, 108670. [Google Scholar] [CrossRef]
  26. Feng, Z.; Cheng, Z.; Ren, L.; Liu, B.; Zhang, C.; Zhao, D.; Sun, H.; Feng, H.; Long, H.; Xu, B.; et al. Real-time monitoring of maize phenology with the VI-RGS composite index using time-series UAV remote sensing images and meteorological data. Comput. Electron. Agric. 2024, 224, 109212. [Google Scholar] [CrossRef]
  27. Yang, B.; Bender, G.; Le, Q.V.; Ngiquan, G. A Comparative Study for Wheat Head Detection Through Testing the Robustness of Two Global Dataset Trained YOLO Models on a Tunisian Wheat Dataset. In Proceedings of the IEEE International Conference on Artificial Intelligence & Green Energy(ICAIGE), Yasmine Hammamet, Tunisia, 10–12 October 2024; pp. 1–6. [Google Scholar]
  28. Yang, B.; Bender, G.; Le, Q.V.; Ngiquan, G. CondConv: Conditionally Parameterized Convolutions for Efficient Inference. arXiv 2014, arXiv:1904.04971. [Google Scholar]
  29. Seki, S.; Li, L. Inference Efficient Source Separation Using Input-dependent Convolutions. In Proceedings of the 2024 Asia Pacific Signal and Information Processing Association Annual Summit and Conference (APSIPA ASC), Macao, China, 3–6 December 2024; pp. 1–5. [Google Scholar]
  30. Hao, A.; Liang, Z.; Qin, M.; Huang, Y.; Xiong, F.; Zeng, G. Wood defect detection based on the CWB-YOLOv8 algorithm. J. Wood Sci. 2024, 70, 26. [Google Scholar]
  31. Kang, M.; Ting, C.-M.; Ting, F.F.; Phan, R.C.-W. ASF-YOLO: A novel YOLO model with attentional scale sequence fusion for cell instance segmentation. Image Vis. Comput. 2024, 147, 105057. [Google Scholar] [CrossRef]
  32. Heng, Z.; Tian, Z.; Liu, L.; Liang, H.; feng, J.; Zeng, L. Real-time detection of dead fish for unmanned aquaculture by yolov8-based UAV. Aquaculture 2025, 595, 741551. [Google Scholar]
  33. Huang, Z.; Shang, L. DSP-YOLO: A SAR Ship Detection Algorithm for Multiscale Sequence Fusion Based on Fusion Attention. In Proceedings of the 2024 7th International Conference on Computational Intelligence and Intelligent Systems, Nagoya, Japan, 22–24 November 2024; pp. 45–52. [Google Scholar]
  34. Liu, W.; Lu, H.; Fu, H.; Cao, Z. Learning to Upsample by Learning to Sample. In Proceedings of the IEEE/CVF International Conference on Computer Vision, Paris, France, 2–6 October 2023; pp. 6027–6037. [Google Scholar]
  35. Zhao, X.; Chen, Y. YOLO-DroneMS: Multi-Scale Object Detection Network for Unmanned Aerial Vehicle (UAV) Images. Drones 2024, 8, 609. [Google Scholar] [CrossRef]
  36. Zhao, Z.; Ma, X.; Shi, Y.; Yang, X. Multi-scale defect detection for plaid fabrics using scale sequence feature fusion and triple encoding. Vis. Comput. 2025, 41, 5205–5221. [Google Scholar] [CrossRef]
  37. Jia, Y.; Fu, K.; Lan, H.; Wang, X.; Su, Z. Maize tassel detection with CA-YOLO for UAV images in complex field environments. Comput. Electron. Agric. 2024, 217, 108562. [Google Scholar] [CrossRef]
  38. Dai, X.; Chen, Y.; Xiao, B.; Chen, D.; Liu, M.; Yuan, L. Dynamic Head: Unifying Object Detection Heads with Attentions. In Proceedings of the IEEE/CVF International Conference on Computer Vision, Nashville, TN, USA, 20–25 June 2021; pp. 7369–7378. [Google Scholar]
  39. Zheng, Z.; Wang, P.; Liu, W.; Li, J.; Ye, R.; Ren, D. Distance-IoU loss: Faster and better learning for bounding box regression. In Proceedings of the 2020 34th AAAI Conference on Artificial Intelligence, New York, NY, USA, 7–12 February 2020; pp. 12993–13000. [Google Scholar]
  40. Dai, X.; Chen, Y.; Xiao, B.; Chen, D.; Liu, M.; Yuan, L. Wise-IoU: Bounding Box Regression Loss with Dynamic Focusing Mechanism. arXiv 2023, arXiv:2301.10051. [Google Scholar]
  41. Song, C.; Zhang, F.; Li, J.; Zhang, J. Precise maize detasseling base on oriented object detection for tassels. Comput. Electron. Agric. 2022, 202, 107382. [Google Scholar] [CrossRef]
  42. Liu, Y.; Cen, C.; Chen, Y.; Ke, R.; Ma, Y. Detection of Maize Tassels from UAV RGB Imagery with Faster R-CNN. Remote Sens. 2020, 12, 338. [Google Scholar] [CrossRef]
  43. Chen, J.; Fu, Y.; Guo, Y.; Xu, Y.; Zhang, X.; Hao, F. An improved deep learning approach for detection of maize tassels using UAV-based RGB images. Int. J. Appl. Earth Obs. Geoinf. 2024, 130, 103922. [Google Scholar] [CrossRef]
Figure 1. Location and angle of image collection. (a) Experimental data collection area. (b) Work scenario. (c) Tilt-angle images. (d) Vertical-angle images.
Agriculture 15 01259 g001
Figure 2. Detailed characteristics of tassels. (a) Early-stage tassel. (b) Non-flowering tassel. (c) Partially flowering tassel. (d) Flowering tassel. (e) Occluded tassel. (f) Overlapping tassels. (g) Tassel under strong-lighting conditions. (h) Tassel under dark-light conditions.
Agriculture 15 01259 g002
Figure 3. Image enhancement. (ad) are original images. (e) is a mirrored image. (f) is a motion-blurred image. (g,h) are images with randomly adjusted brightness.
Agriculture 15 01259 g003
Figure 4. (a) The network structure of YOLOv8. (b) Bottleneck module structure. (c) C2f module structure. (d) SPPF module structure. (e) Conv module structure. (f) Detect module structure.
Agriculture 15 01259 g004
Figure 5. The DMSF-YOLO network architecture.
Agriculture 15 01259 g005
Figure 6. Lightweight CondConv network structure based on adaptive convolution mechanism.
Agriculture 15 01259 g006
Figure 7. SSFF-D network architecture. The structure takes as input three feature maps of different sizes, P3, P4, and P5, which represent feature maps of varying sizes on the backbone.
Agriculture 15 01259 g007
Figure 8. Dysample network architecture. X denotes the input feature, S denotes the sampling set, X signifies the upsampled feature, O is the offset, and G denotes the original sampling network.
Agriculture 15 01259 g008
Figure 9. TFE network architecture. Large, Medium, and Small denote different feature map sizes; C denotes the number of channels, and S denotes the feature map size.
Agriculture 15 01259 g009
Figure 10. Dyhead architecture diagram.
Agriculture 15 01259 g010
Figure 11. Dyhead block architecture diagram.
Agriculture 15 01259 g011
Figure 12. Model performance changes. (a) The m A P 50 curve during the training process. (b) Loss during the training process. (c) The P-R curve of the testing results.
Agriculture 15 01259 g012
Figure 13. Bar charts and line graphs comparing the performance of different target detection models.
Agriculture 15 01259 g013
Figure 14. Detection results of different models. (a) denotes the tilt angle. (b) denotes the 4 m vertical angle. (c) denotes the 5 m vertical angle. (d) denotes a strong-light environment. (e) denotes a low-light environment.
Agriculture 15 01259 g014
Table 1. UAV Parameters.
Image SensorPixelsMonitoring RangeImage ResolutionVideo Resolution
1/2.312 million24 mm4000 × 22502720 × 1530
Table 2. Maize tassel data collection stage and BBCH.
Principal Growth Stage BBCHBBCH CodeDescription
Principal growth stage 5: tasseling stage51Tassel emergence begins: tassel visible at top of stem
53Tip of tassel visible
55Middle of tassel emergence: middle of tassel begins to separate
59End of tassel emergence: tassel fully emerged and separated
Principal growth stage 6: Flowering, anthesis61Male: stamens in middle of tassel visible
63Male: beginning of pollen shedding
Table 3. Experimental environment.
Hardware EnvironmentEquipmentSoftware EnvironmentVersion
CPUIntel(R) Core(TM) i9-9900KF CPUPython3.9.0
GPUNVIDIA GeForce RTX 2080TiPytoch2.1.0
GPU memory11 GBCUDA12.1
RAM64 GBOperating systemWindows 10
Table 4. Key parameter settings.
ParametersSetup
Epochs200
Batch size8
Learning rate0.01
Image size640 × 640
OptimizerSGD
Number of workers16
Table 5. Model selection.
MethodP
(%)
R
(%)
mAP50
(%)
mAP50:95
(%)
Params
(M)
GFLOPs
(G)
YOLOv8n93.987.693.963.83.018.1
YOLOv8s94.789.995.466.911.128.4
YOLOv8m95.590.996.169.025.978.7
YOLOv8l95.092.196.269.243.6164.8
YOLOv8x95.691.696.469.768.1257.4
Table 6. Ablation results of different methods.
MethodCondConvMDSF-P2DyheadWIOUP
(%)
R
(%)
mAP50
(%)
mAP50:95
(%)
Params
(M)
Base 93.987.693.963.83.01
A 94.687.994.4646.02
B 94.088.094.764.32.50
C 94.788.794.865.33.99
D 94.687.794.363.93.01
E 94.188.99564.62.52
F 94.789.595.366.23.99
G 93.990.095.767.13.70
H 94.590.395.967.63.70
I94.491.096.367.73.70
Note: Bold indicates the best performance for each metric.
Table 7. Ablation results of the DMSF-P2 network architecture.
MethodP
(%)
R
(%)
mAP50
(%)
mAP50:95
(%)
Params
(M)
MSFNeck94.387.694.163.52.96
+P293.687.594.463.92.49
+Dysample94.188.494.3642.96
+Dysample+P29488.594.864.42.5
Note: Bold indicates the best performance for each metric.
Table 8. Comparison of detection accuracy between DMSF-YOLO and YOLOv8n.
MethodP
(%)
R
(%)
mAP50
(%)
mAP50:95
(%)
YOLOv8n93.987.693.963.8
DMSF_YOLO94.49196.367.7
Note: Bold indicates the best performance for each metric.
Table 9. Comparative experimental results of different target detection models.
MethodP
(%)
R
(%)
mAP50
(%)
mAP50:95
(%)
Params
(M)
Size
(MB)
SSD82.085.882.041.213.13100
Faster R-CNN78.384.573.840.241.35315
YOLOv5n94.086.993.662.82.505.02
YOLOv5s94.889.995.566.69.1117.6
YOLOv794.788.694.559.66.0111.6
YOLOv8s94.789.995.466.911.1321.4
YOLOv10n92.886.093.262.42.705.49
YOLOv11n94.287.193.863.22.585.21
DMSF-YOLO94.491.096.367.73.707.44
Note: Bold indicates the best performance for each metric.
Disclaimer/Publisher’s Note: The statements, opinions and data contained in all publications are solely those of the individual author(s) and contributor(s) and not of MDPI and/or the editor(s). MDPI and/or the editor(s) disclaim responsibility for any injury to people or property resulting from any ideas, methods, instructions or products referred to in the content.

