Article

Response of Soil Organic Carbon and Its Components to Mixed Sowing of Green Manure

1
Key Laboratory of Crop Physiology, Ecology and Genetic Breeding, Jiangxi Agricultural University, Nanchang 330045, China
2
Key Laboratory of Crop Ecophysiology and Farming System for the Middle and Lower Reaches of the Yangtze River, Ministry of Agriculture and Rural Affairs, Nanchang 330200, China
3
National Engineering and Technology Research Center for Red Soil Improvement, Nanchang 330200, China
4
Institute of Soil, Fertilizer and Resource Environment, Jiangxi Academy of Agricultural Sciences, Nanchang 330200, China
*
Author to whom correspondence should be addressed.
Agriculture 2025, 15(12), 1260; https://doi.org/10.3390/agriculture15121260
Submission received: 17 April 2025 / Revised: 5 June 2025 / Accepted: 8 June 2025 / Published: 11 June 2025
(This article belongs to the Special Issue Innovative Conservation Cropping Systems and Practices—2nd Edition)

Abstract

:
Mixed sowing of green manure in winter is a unique farming mode in southern China, which has the potential to replace or partially replace nitrogen fertilizer. To investigate how mixed sowing of green manure combined with nitrogen reduction regulates soil organic carbon and its fractions, this study was conducted in the 3/4 Chinese milk vetch × 1/4 rapeseed farming mode, without nitrogen fertilizer (CK), 100% N fertilizer (150 kg ha−1, N1MR), 20% N fertilizer reduction (120 kg ha−1, N2MR), 40% N fertilizer reduction (90 kg ha−1, N3MR), and 60% N fertilizer reduction (60 kg ha−1, N4MR). The main results were the N2MR treatment could guarantee stable and increased rice yield. The N1MR and N2MR treatments were more conducive to the accumulation of TOC. The N4MR and N2MR treatments were more conducive to the increase and accumulation of AOC and DOC. The effective spikes were positively correlated with TOC and ROC. The grain number per panicle was positively correlated with DOC. The seed-setting rate was positively correlated with ROC. Overall, mixed sowing of Chinese milk vetch and rapeseed combined with 20% nitrogen reduction ensures a stable yield and increase in rice. Nitrogen reduction by 60% and 20% is beneficial to the increase and accumulation of TOC, AOC, and DOC in soil.

1. Introduction

Green manure-double cropping rice is a prevalent farming system in southern China for replenishing soil nutrients and enhancing fertility [1]. Chinese milk vetch serves as a high-quality, nutrient-rich, and environmentally friendly source of biological fertilizer, playing a crucial role in reducing the use of chemical fertilizers and pesticides [2,3]. Rapeseed stimulates nitrogen fixation by rhizobia [4]. The intercropping of these two green manures not only meets the diverse nutritional demands of rice at different growth stages but also enhances light energy and land use efficiency through the temporal and spatial differences in their growth cycles [5,6]. This lays a solid foundation for high yields of green manure and subsequent crops, contributing to the overall benefits of the agricultural ecosystem. Excessive nitrogen application leads to substantial nitrogen loss, soil fertility decline, severe agricultural non-point source pollution, and increased greenhouse gas emissions [7,8], thereby hindering the green and sustainable development of agriculture. An appropriate reduction in nitrogen fertilizer application is a critical approach to addressing issues such as high nitrogen losses, low nitrogen use efficiency, and elevated greenhouse gas emissions in current paddy ecosystems in China [9].
Studies have shown that incorporating green manure combined with nitrogen reduction can maintain rice yields [10] and enhance soil fertility. It can also improve soil microbiological properties [11] and reduce the potential for global warming [12]. Soil organic carbon, especially dissolved organic carbon, is a key indicator for evaluating soil fertility [13]. Soil active organic carbon, microbiological carbon, dissolved organic carbon, and readily oxidized organic carbon are commonly used to assess changes in soil quality [14]. Dissolved organic carbon is influenced by soil physicochemical properties, cropping patterns, field management practices, and climate [15]. The combined application of organic and chemical fertilizers can significantly increase soil microbiological carbon content [16]. After the double cropping rice cycle, reseeding green manure provides abundant exogenous carbon sources to the soil, thereby substantially enhancing the carbon sequestration capacity of the organic carbon pool [16]. Gao et al. [17] found that incorporating Chinese milk vetch and rapeseed increased soil dissolved organic carbon content. Chen et al. [18] demonstrated that the combined application of green manure and nitrogen fertilizer increased dissolved organic carbon content, with significant increases of 8.13% and 1.42% compared to conventional fertilization when green manure was applied with 70% (191 kg ha−1) and 50% (136 kg ha−1) of chemical nitrogen fertilizers, respectively. Yang et al. [19] showed that incorporating green manure combined with nitrogen reduction significantly increased dissolved organic carbon content, with the best soil fertility effect achieved by incorporating 30 t ha−1 of green manure and reducing nitrogen application by 15% (153 kg ha−1). Another study [20] found that in red soil paddy fields planted with double cropping rice, the aggregate organic carbon content was higher under winter fallow than under Chinese milk vetch treatment. When Chinese milk vetch was incorporated into the soil during the winter, soil organic carbon content in different aggregates was directly proportional to the nitrogen fertilizer application rate, showing a decreasing trend with reduced nitrogen application. Regardless of whether nitrogen fertilizer application is reduced, it is necessary to control the appropriate exogenous carbon-to-nitrogen ratio to enhance soil carbon sequestration function while ensuring an adequate supply of exogenous carbon sources, thereby stabilizing soil structure and improving soil fertility. Previous research by our team has shown that the cropping pattern of “3/4 Chinese milk vetch (seed rate of 17.5 kg ha−1) × 1/4 rapeseed (seed rate of 2.5 kg ha−1)—early rice—late rice” maintains high yields and fertility while reducing N2O emissions, making it an ideal cropping pattern [21,22,23]. Numerous studies have been conducted on the combination of green manure incorporation and nitrogen reduction, but there is a lack of research on dissolved organic carbon and its fractions under mixed sowing of Chinese milk vetch and rapeseed combined with nitrogen reduction.
Therefore, based on the incorporation of intercropped Chinese milk vetch and rapeseed, this study analyzes the effects of different nitrogen reduction levels on rice yield, soil organic carbon, and its fractions, exploring how different nitrogen reduction levels regulate changes in soil organic carbon and its fractions under the premise of stable or increased rice yields. This research provides theoretical and practical insights into the promotion and application of Chinese milk vetch and rapeseed mixed sowing technology and the sustainable development of ecosystems in southern rice-growing regions.

2. Materials and Methods

2.1. Experimental Site

The experiment was conducted from October 2021 to November 2023 in the rice experimental field of the Science and Technology Park of Jiangxi Agricultural University (28°46′ N, 115°55′ E). This readily oxidized organic carbonation is characterized by a subtropical monsoon humid climate with mild and moist conditions and abundant sunshine. The average temperature during the experimental period was 18.83 °C, and the annual precipitation was 1600 mm. The experimental site is located in a typical subtropical red soil area. The soil is Quaternary red clay, classified as Acrisols in the FAO system (commonly known as red soil in China). Prior to the experiment, the chemical properties of the top 0–15 cm soil layer were as follows: pH value of 4.91 ± 0.28, organic matter content of 31.24 ± 1.81 g kg−1, total nitrogen content of 1.89 ± 0.14 g kg−1, available nitrogen content of 129.06 ± 11.99 mg kg−1, available phosphorus content of 12.12 ± 1.17 mg kg−1, and available potassium content of 21.13 ± 0.99 mg kg−1.

2.2. Experimental Design

According to the experimental requirements, five nitrogen reduction treatments were established under the mixed seeding and incorporation mode of 3/4 Chinese milk vetch (seeding rate of 17.5 kg ha−1) × 1/4 rape (seeding rate of 2.5 kg ha−1). These are no nitrogen fertilizer application for double-cropping rice (CK), conventional nitrogen fertilizer application (N1MR), 20% reduced nitrogen fertilizer application (N2MR), 40% reduced nitrogen fertilizer application (N3MR) and 60% reduced nitrogen fertilizer application (N4MR) (Table 1). Each treatment was replicated three times, resulting in a total of 15 plots. Each plot had an area of 16.5 m2 (5.5 × 3 m) and was arranged in a randomized block design, separated by cement ridges with a height of 30 cm.
Rice seedlings were raised 25 to 30 days prior to transplantation. At transplantation, the rice plants were arranged with a row spacing of 0.2 m and a plant spacing of 0.2 m. Fifteen days before rice transplantation, all the Chinese milk vetch and rapeseed straw were incorporated into the soil. The amount of winter crop straw incorporated is shown in Table 2. Local conventional field management practices were adopted. During the rice cultivation process, the application schedule of nitrogen fertilizer was as follows: basal fertilizer was applied on 1 May and 27 June in 2022 and on 26 April and 27 July in 2023; tillering fertilizer was applied on 9 May and 7 August in 2022 and on 6 May and 5 August in 2023; panicle fertilizer was applied on 3 June and 1 September in 2022 and on 1 June and 4 September in 2023. Other field management practices are shown in Table 3.

2.3. Measurement Items and Methods

2.3.1. Crop Examination and Yield Measurement

Chinese milk vetch and rapeseed: The “five-point sampling method” was used 15 days before the transplanting of early rice every year. A 1 m2 area was sampled at each point, and the fresh weight was measured. The average value was calculated to estimate the actual yield.
Rice: At the maturity stage of both early and late rice, a random sampling method was employed. Twenty rice plants were selected from each plot as samples for the calculation of effective panicles. Using the averaging method, five rice plants were selected from each plot, air-dried, and then subjected to crop examination. The examination indicators included the number of effective panicles, grains per panicle, seed-setting rate, and 1000-grain weight. Upon harvesting of both early and late rice, the rice from each plot was separately threshed and weighed to determine the actual yield.
For all crops at maturity, the straw and grains within each plot were weighed in their entirety. Additionally, some fresh samples were weighed, killed at 105 °C in an oven for 30 min, then dried to constant weight at 80 °C, and weighed again to calculate the moisture content.

2.3.2. Determination of Soil Organic Carbon and Its Fractions

During the maturity stage of winter crops (10 April 2022 and 10 April 2023) and at the harvest time of both early rice (25 July 2022 and 26 July 2023) and late rice (1 November 2022 and 2 November 2023), the “five-point sampling method” was used to collect soil samples from the 0 to 15 cm plow layer from each plot for the determination of various indicators.
The specific determination methods and steps [24] are as follows.
Soil organic carbon was determined using the potassium dichromate external heating method. The soil organic carbon density (SOCd) was calculated using the formula SOCd = C × BD × T × 0.1, where SOCd is the soil organic carbon density (g m−2), C is the soil organic carbon content (g kg−1), BD is the bulk density of the soil (g cm−3), and T is the thickness of the soil layer (cm).
Soil active organic carbon and soil readily oxidized organic carbon were measured using the 333 mmol L−1 potassium permanganate oxidation method. A 15 mg air-dried soil sample, passed through a 0.15 mm sieve, was mixed with 25 mL of 333 mmol L−1 KMnO4 solution and shaken for 1 h. The mixture was then centrifuged at 4000 rpm for 5 min. The supernatant was collected and diluted 250 times with deionized water. The absorbance of the diluted solution was measured at 565 nm. A series of standard KMnO4 solutions of different concentrations were also measured at 565 nm to create a calibration curve. The AOC content was calculated based on the change in KMnO4 concentration, with the unit being mg C g−1, representing the amount of active organic carbon per gram of dry soil (during the oxidation process, 1 mmol L−1 KMnO4 consumes 9 mg of carbon).
For soil dissolved organic carbon, 2 g of fresh soil was placed in 50 mL of distilled water and shaken for 1 h. The mixture was then filtered, and the filtrate was centrifuged for 15 min at 1000 rpm. The material floating on the surface was filtered through a membrane with a pore size of 0.45 μm using a vacuum filtration device. The filtrate was then digested with 5 mL of 0.8 mol L−1 K2Cr2O7 and 5 mL of concentrated H2SO4 at 185 °C for 5 min, followed by titration with 0.2 mol L−1 Fe2SO4.
Soil microbial biomass carbon was determined using the chloroform fumigation-K2SO4 extraction method. A fresh soil sample equivalent to 10 g of oven-dried soil was fumigated with chloroform for 24 h in a vacuum desiccator. The residual chloroform was removed by repeated vacuum extraction. The soil was then extracted with 30 mL of 0.5 mol L−1 K2SO4 solution by shaking for 30 min. The carbon content in the filtered extract was determined using the potassium dichromate volumetric method. An unfumigated soil sample served as a control. The difference in organic carbon extracted from the fumigated and unfumigated soil samples was multiplied by the conversion factor Kc (2.22) to calculate the soil microbial biomass carbon. The microbial entropy was calculated as MBC/TOC × 100%.

2.4. Data Analysis

Data entry and processing were conducted using Microsoft Excel 2019 (Microsoft Corporation, Redmond, WA, USA), while statistical analysis and variance analysis were performed using SPSS 26.0 (IBM Inc., Armonk, NY, USA). One-way ANOVA and multiple t-tests were employed for variance analysis and multiple comparisons, respectively. The Least Significant Difference (LSD) test was used to compare the significance of differences in sample averages, and multiple t-tests were utilized to analyze the significance of inter-annual differences. Graphs were created using Origin 2022 (OriginLab Corporation, Northampton, MA, USA) and GraphPad Prism 9 (GraphPad Software, San Diego, CA, USA).

3. Results

3.1. Effects of Mixed Sowing of Green Manure Combined with Nitrogen Reduction on Rice Yield and Yield Components

As shown in Table 4, compared with the control treatment (CK), all treatments significantly increased early and late rice yields in 2022 (p < 0.05). In 2023, the N2MR treatment significantly increased both early and late rice yields (p < 0.05). During the early rice season in both 2022 and 2023, the rice yields of the N2MR treatment were the highest, at 5.55 t ha−1 and 6.35 t ha−1, respectively, significantly higher than those of the CK treatment by 36.0% and 34.8% (p < 0.05). However, there were no significant differences among the nitrogen reduction treatments. During the late rice season in 2022 and 2023, the highest rice yields were observed in the N3MR (8.72 t ha−1) and N1MR (8.48 t ha−1) treatments, respectively, significantly higher than those of the CK treatment by 18.9% and 76.1% (p < 0.05). In terms of total yields over the two seasons, the N1MR, N2MR, and N3MR treatments had the highest yields in both years, with nitrogen reduction treatments yielding significantly more than the CK treatment by 16.1–24.2% and 32.0–50.2% (p < 0.05). Overall, mixed green manure incorporation combined with a 20% nitrogen reduction could ensure stable and increased rice yields.
As indicated in Table 5, during the early rice season in 2022, the N1MR treatment had the highest number of effective spikes and seed-setting rates. Specifically, the number of effective spikes was significantly higher than that of the N4MR treatment by 25.1% (p < 0.05), and the seed-setting rate was significantly higher than those of the CK and N2MR treatments by 23.6% and 29.4%, respectively (p < 0.05). In 2023, the N1MR treatment had the highest seed-setting rate during the early rice season and the highest number of effective spikes during the late rice season, significantly higher than those of the CK treatment by 28.0% and 42.4%, respectively (p < 0.05). During the early rice season in 2022, the N3MR treatment had significantly more grain number per panicle than the N2MR treatment by 40.6% (p < 0.05). Similarly, in 2023, the N4MR treatment had significantly more grain number per panicle than the N1MR treatment by 31.8% (p < 0.05). However, there were no significant differences among treatments during the late rice season in both years. During the early rice season in both years, the N3MR treatment had the highest 1000-grain weight, significantly higher than that of the N1MR treatment by 7.4% and 8.6%, respectively (p < 0.05). During the late rice season, the N1MR treatment had the highest value, significantly 5.6% higher than the CK treatment and 12.5% higher than the N1MR treatment. In summary, the yield components under different nitrogen application levels exhibited different patterns during the early and late rice seasons, and green manure mixed sowing combined with nitrogen reduction had a greater impact on yield components during the early rice season than during the late rice season.

3.2. Effects of Mixed Sowing of Green Manure Combined with Nitrogen Reduction on Soil Organic Carbon and Its Fractions

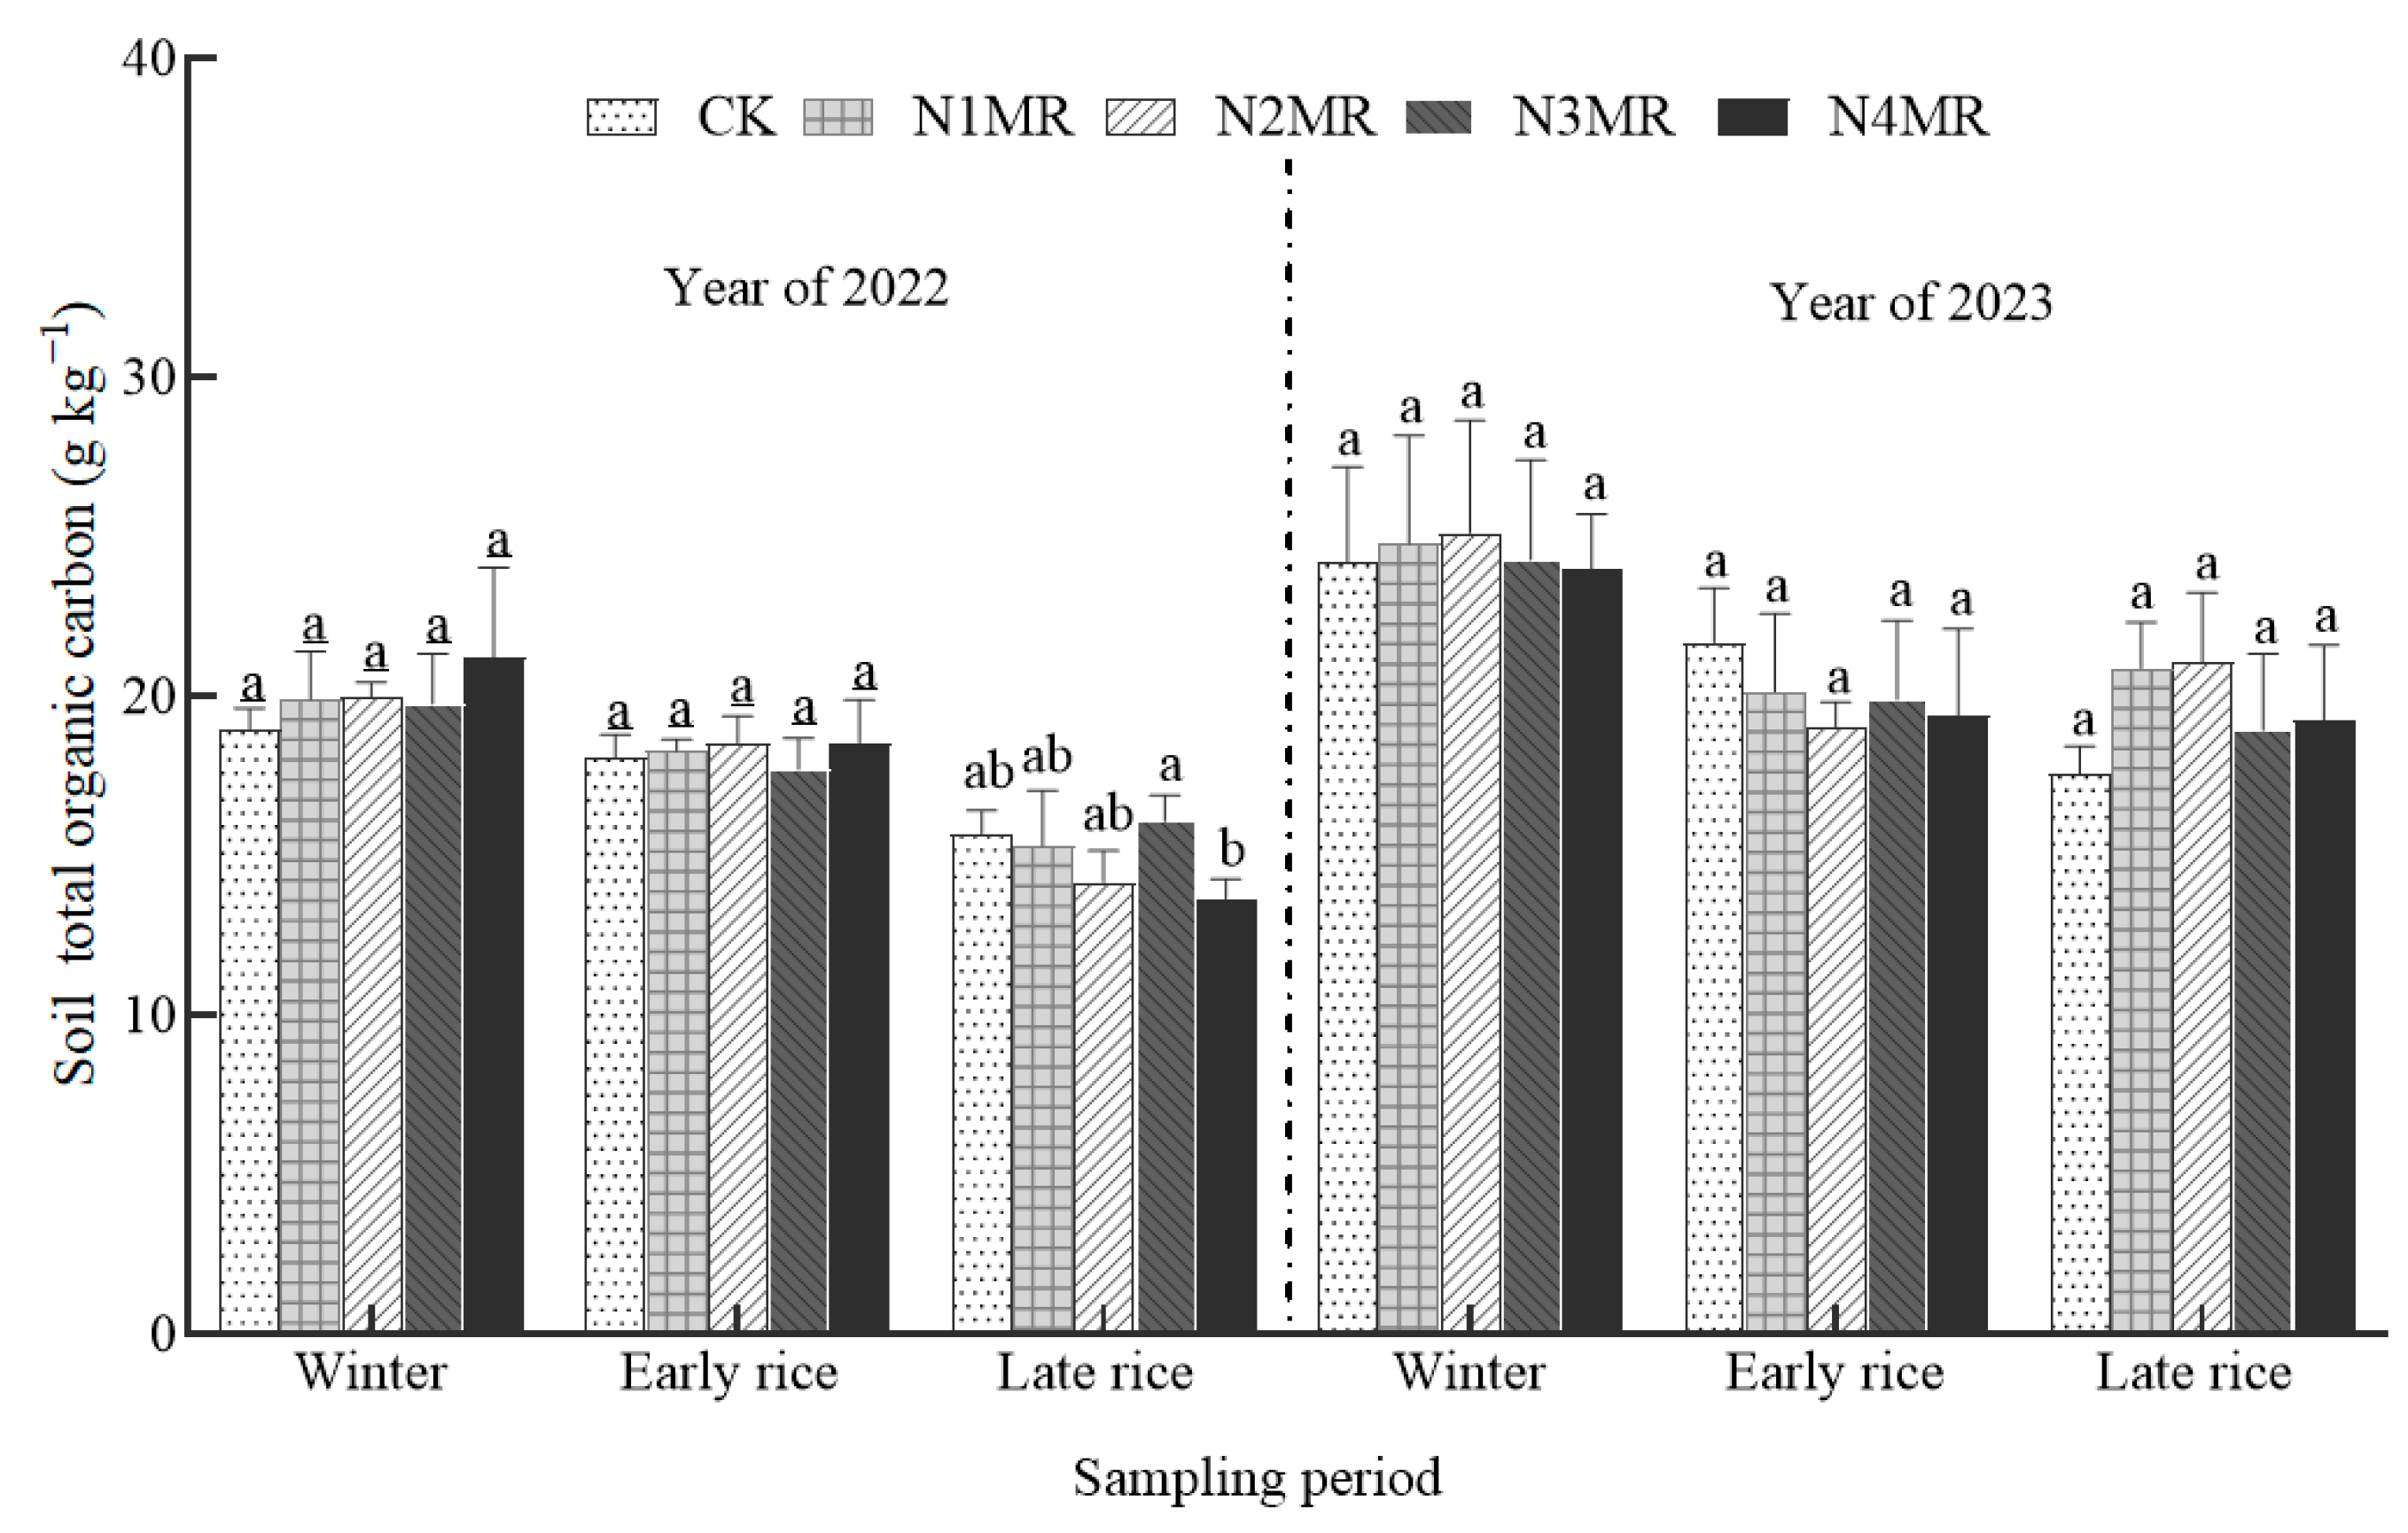
3.2.1. Soil Total Organic Carbon

As illustrated in Figure 1, the trend in soil total organic carbon content remained consistent over two consecutive years, with the highest levels observed during the winter crop season, followed by the early rice season, and the lowest in the late rice season. However, there were no significant differences in soil total organic carbon content among treatments during the winter and early rice seasons of 2022 or throughout 2023. The soil total organic carbon content in 2023 was higher than that in 2022, suggesting that green manure mixed cropping and incorporation can improve soil total organic carbon content. Additionally, compared with conventional nitrogen application treatments, there was no significant decrease in soil organic carbon content in nitrogen reduction treatments. Therefore, conventional nitrogen application and a 20% nitrogen reduction combined with green manure mixed cropping and incorporation are more conducive to the accumulation of soil total organic carbon.

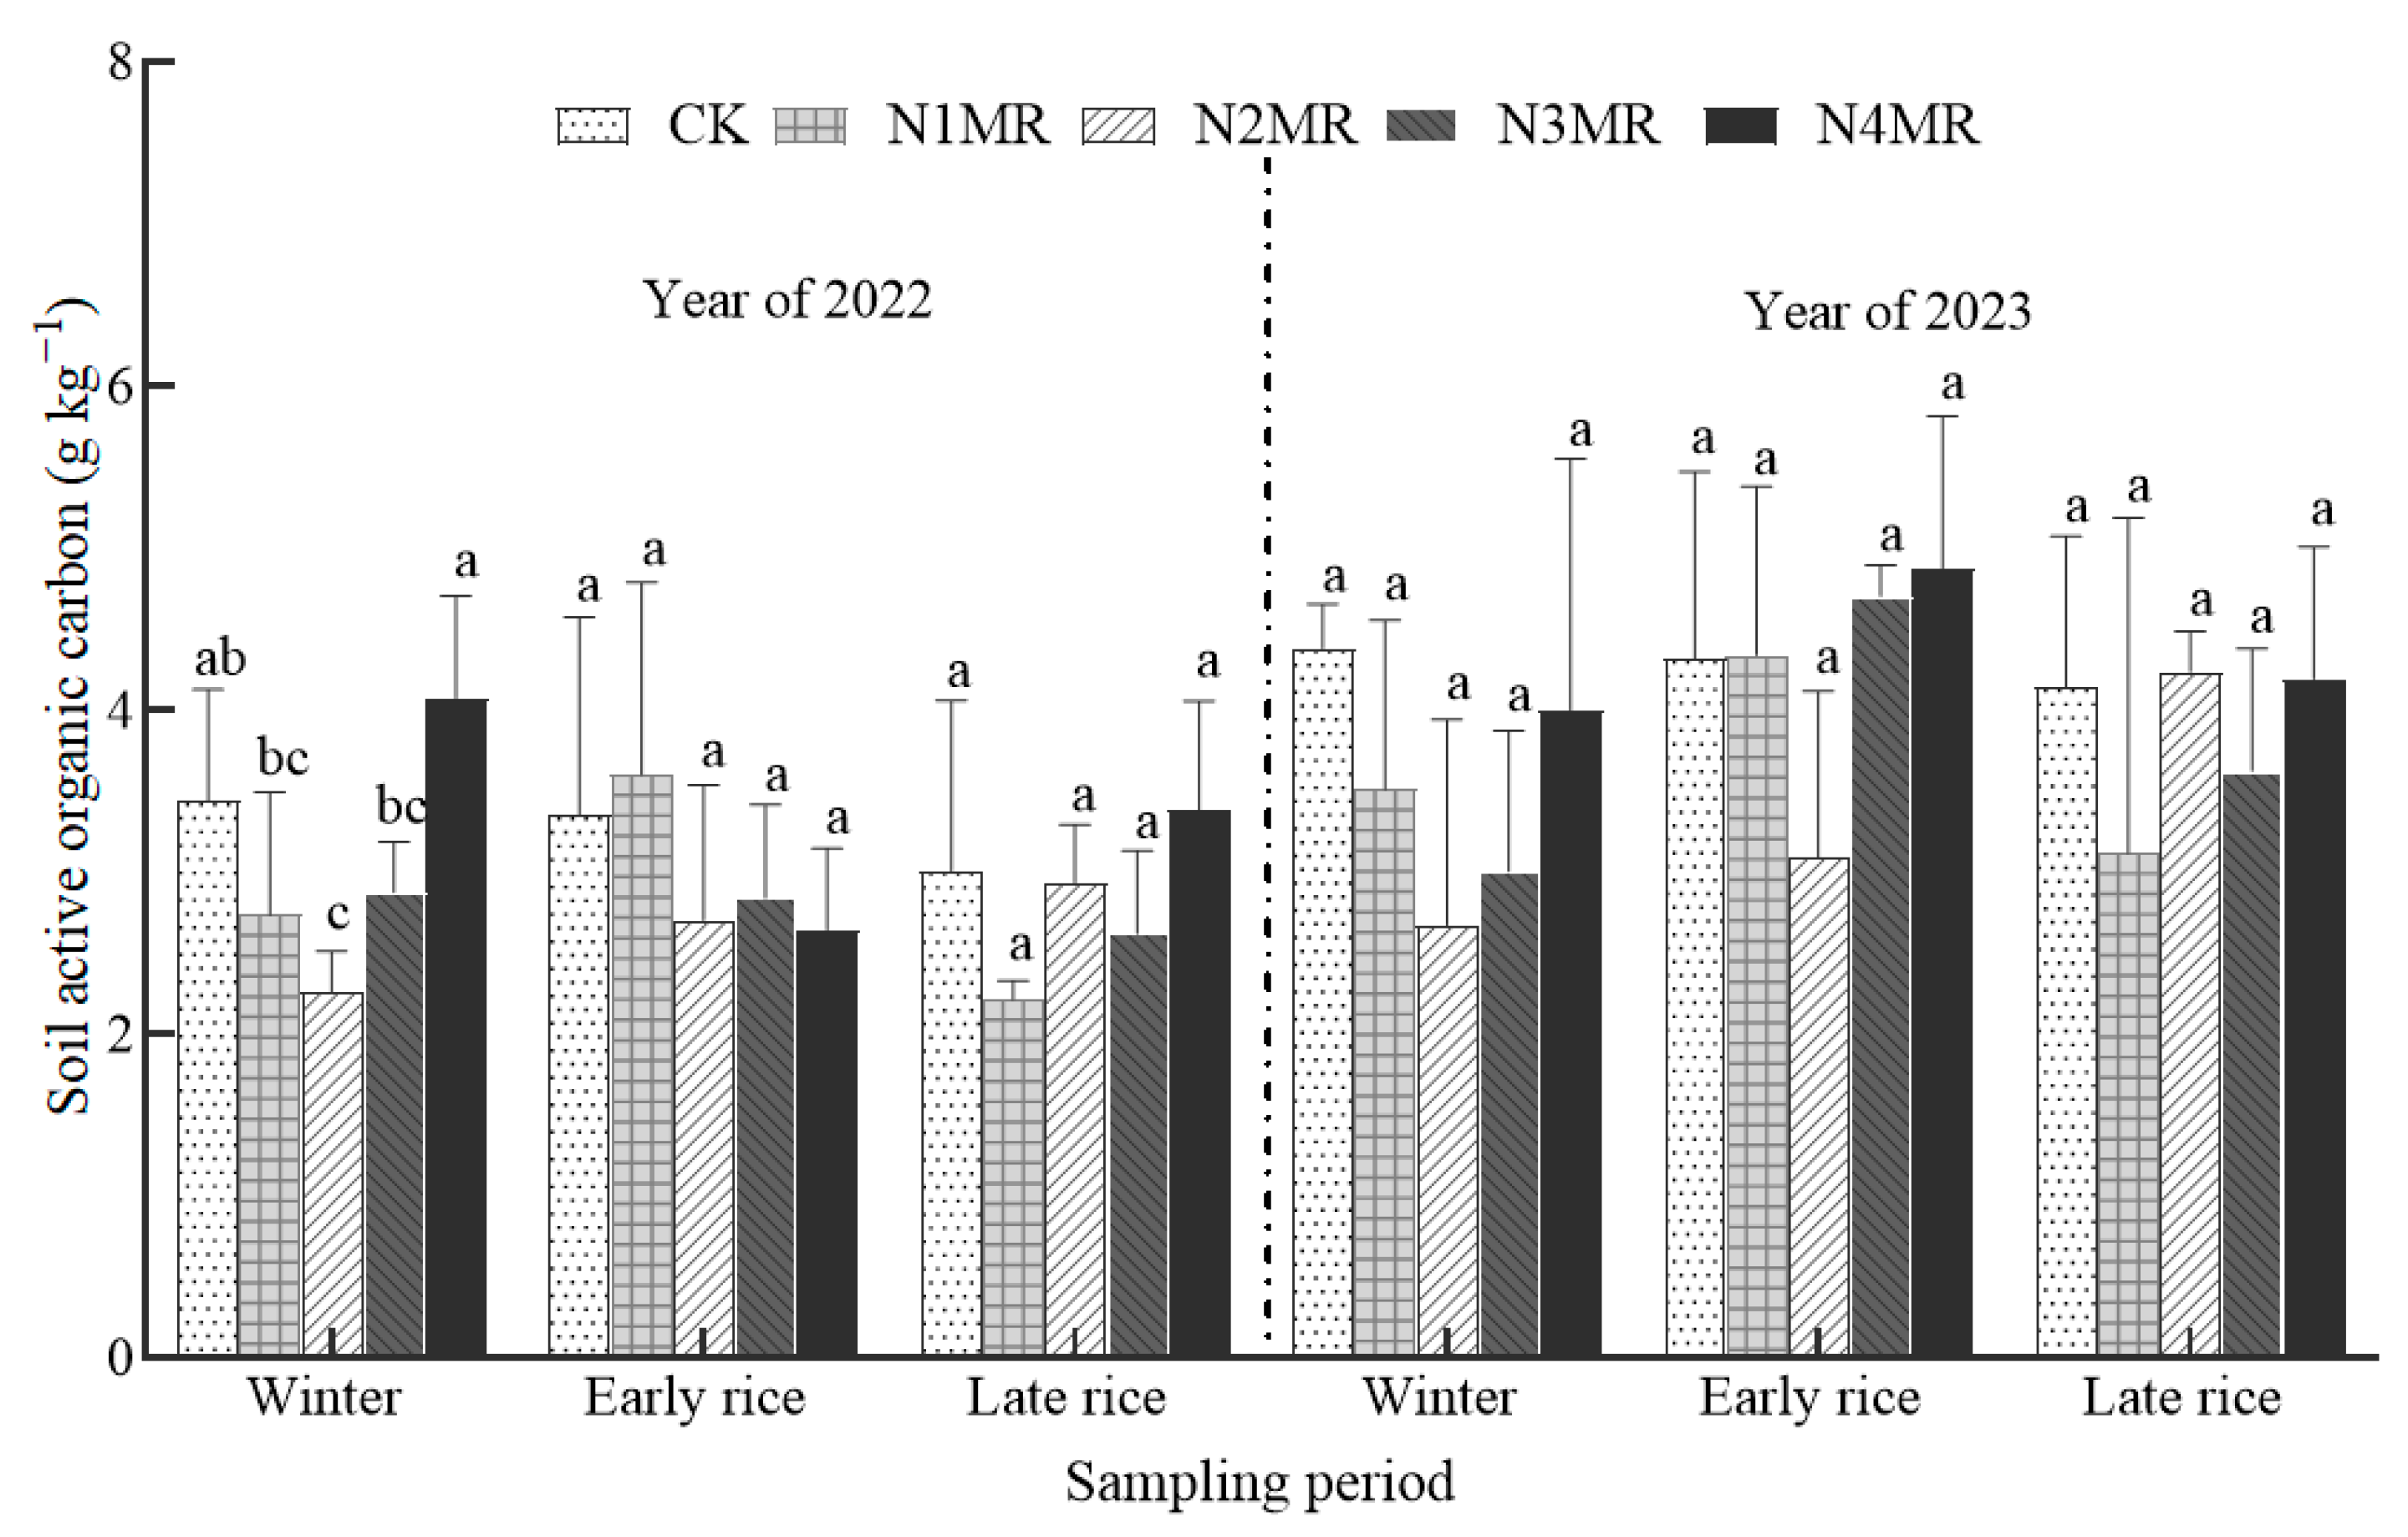
3.2.2. Soil Active Organic Carbon

As shown in Figure 2, during the winter crop season of 2022, the active organic carbon content of treatment N4MR was significantly higher than that of the other treatments by 41.3% to 88.9% (p < 0.05), except for the control treatment. There were no significant differences in active organic carbon content among the treatments during the early rice season, late rice season, or throughout the year 2023. However, from the perspective of annual variation, the active organic carbon content in 2023 was higher than that in 2022. Additionally, compared with conventional nitrogen application treatments, the soil organic carbon content could be maintained in nitrogen reduction treatments. Notably, treatment N2MR exhibited a higher soil organic carbon content during the late rice season of 2023 compared to other nitrogen reduction treatments. Although there is no significant difference statistically, it shows, to some extent, that a 20% nitrogen reduction has a relative advantage in promoting soil active organic carbon accumulation. Therefore, a 60% nitrogen reduction combined with green manure mixed cropping and incorporation may be more beneficial for enhancing soil active organic carbon, while a 20% nitrogen reduction may be more conducive to its accumulation, although further research is needed to confirm this.

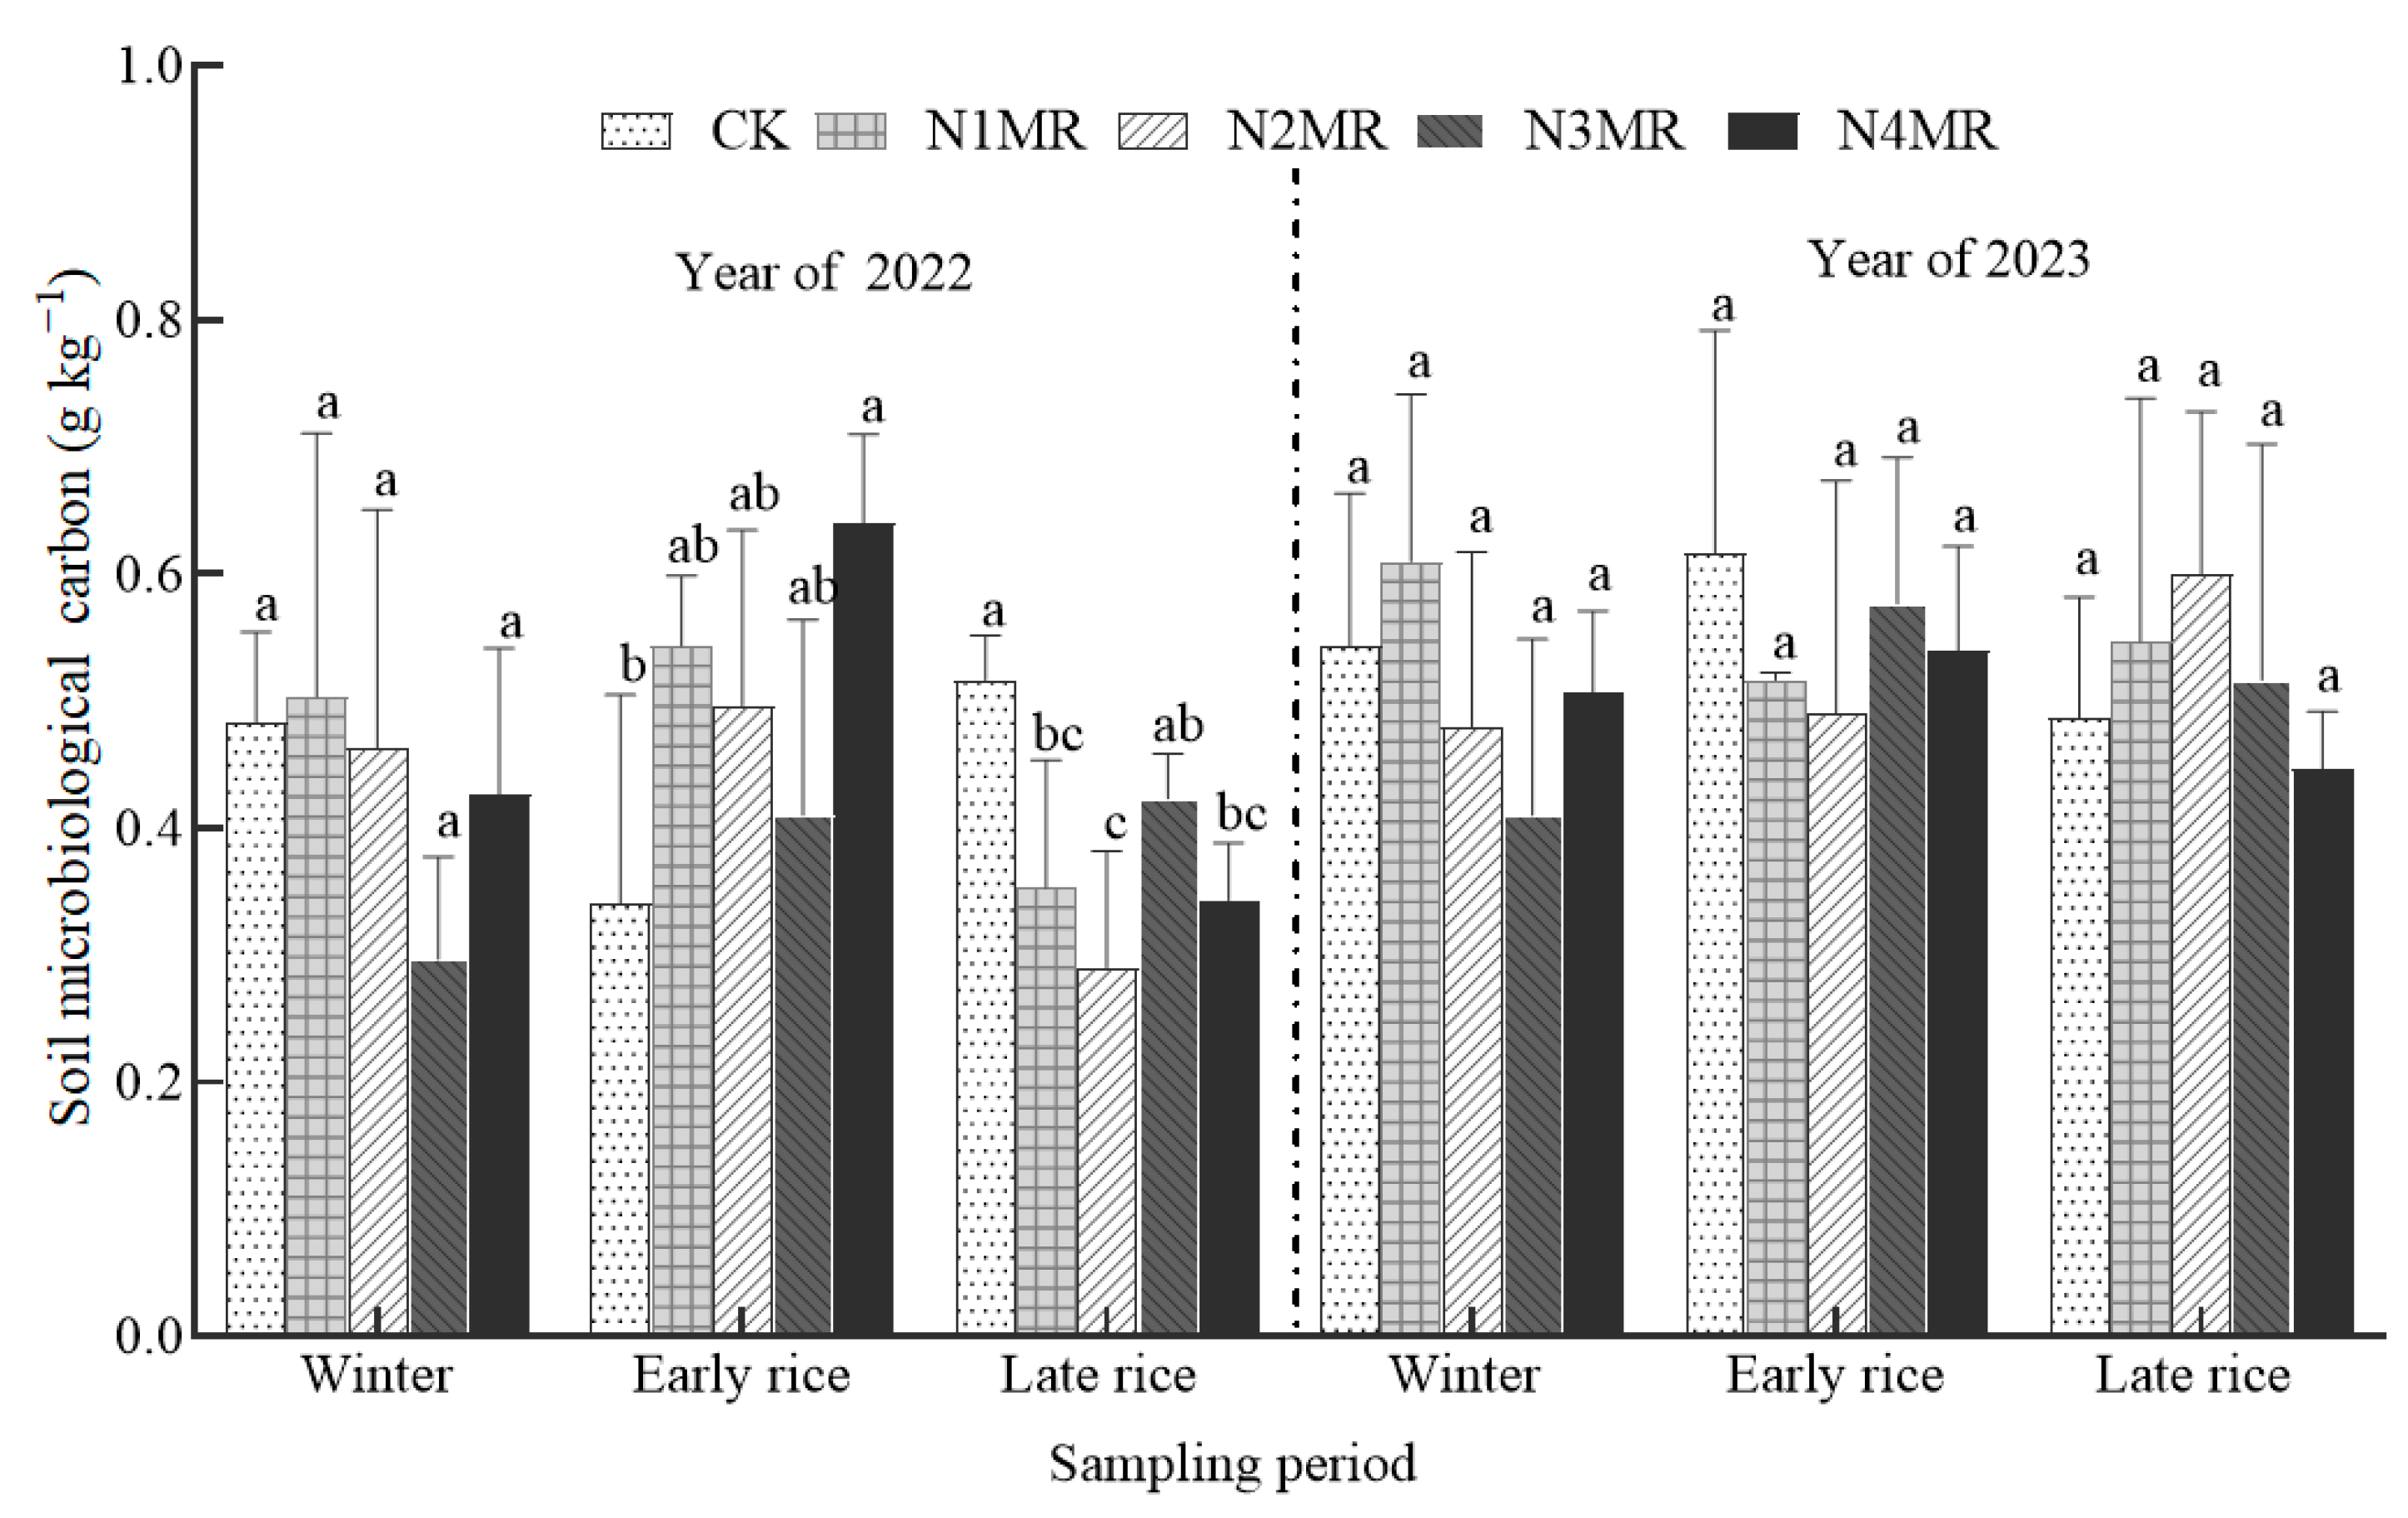
3.2.3. Soil Microbiological Carbon

As illustrated in Figure 3, during the early rice season of 2022, the microbiological carbon content of treatment N4MR was significantly higher than that of the control treatment (CK) by 88.2% (p < 0.05). During the late rice season, however, all treatments except N3MR had microbiological carbon contents significantly lower than CK by 32.7% to 44.2% (p < 0.05). In the winter crop season of 2022 and throughout the year 2023, there were no significant differences in microbiological carbon content among the treatments. However, from the perspective of annual variation, the microbiological carbon content in 2023 was generally higher than that in 2022. Additionally, treatment N2MR had the lowest microbiological carbon content after the late rice harvest in 2022 but reached the highest level after the late rice harvest in 2023. Therefore, the trends in microbiological carbon among the treatments were not apparent, and further investigation is needed to explore the effects of nitrogen reduction patterns combined with green manure mixed cropping and incorporation on the enhancement and accumulation of soil microbiological carbon.

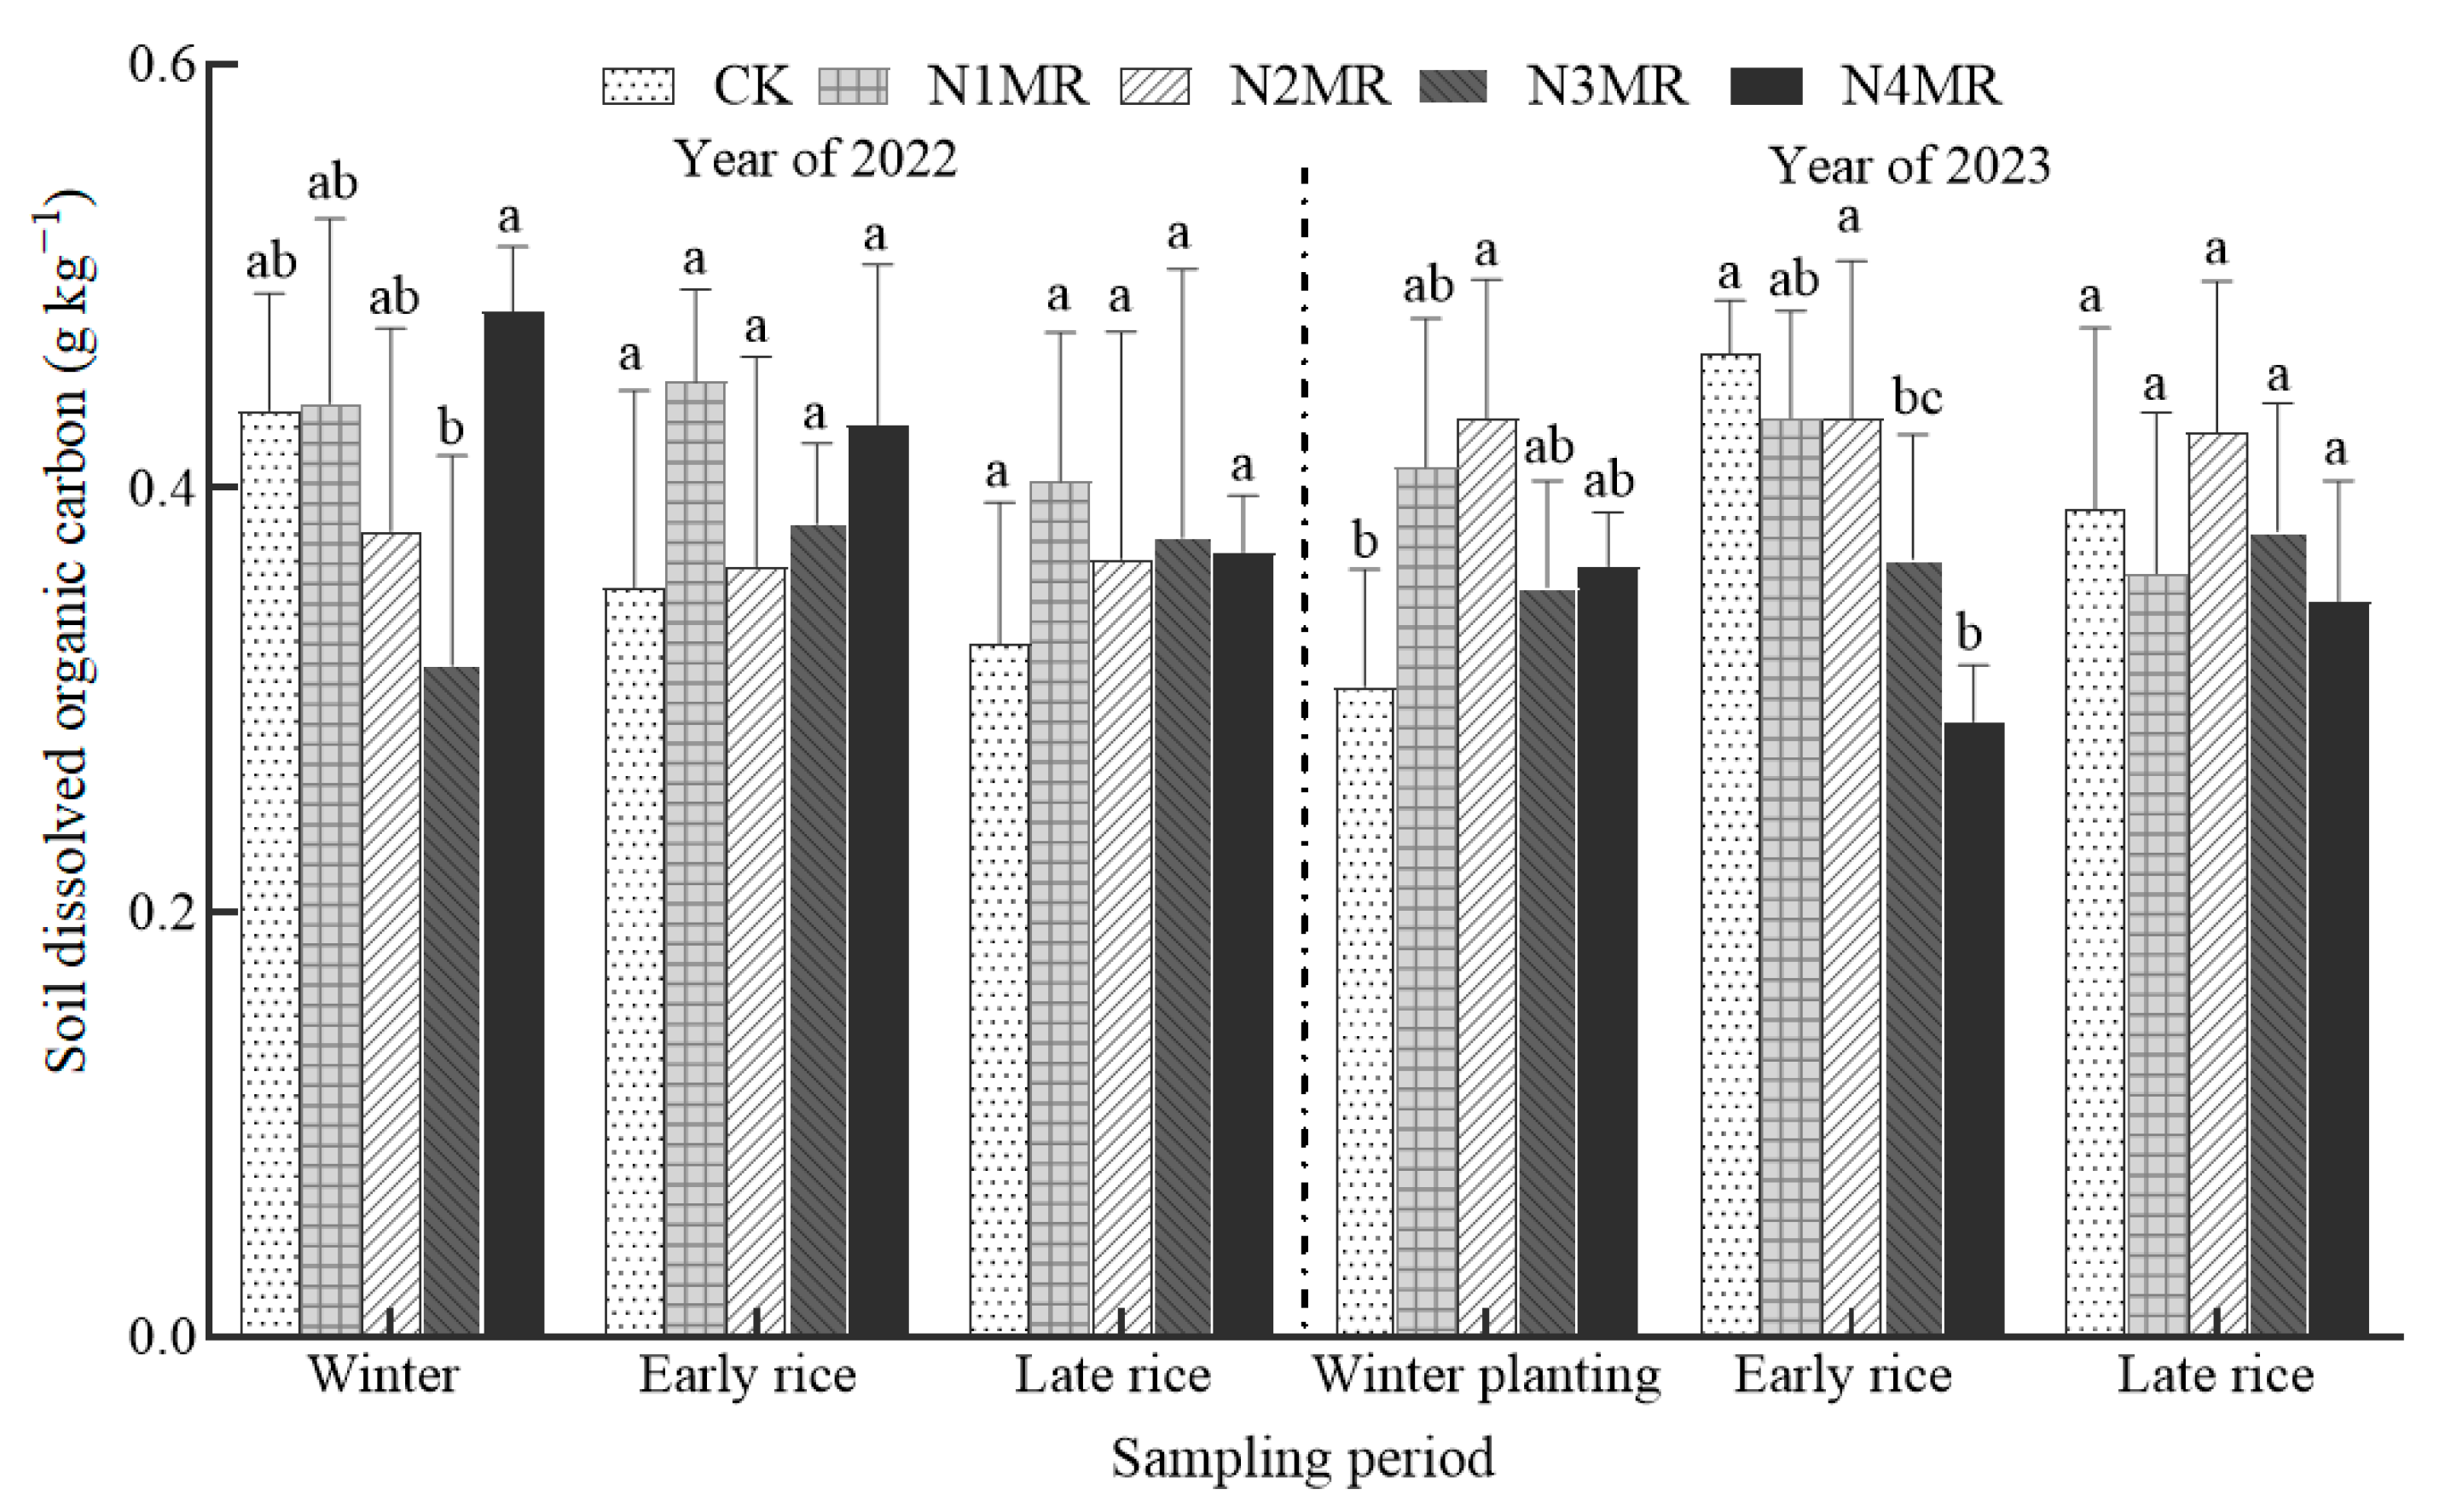
3.2.4. Soil Dissolved Organic Carbon

As shown in Figure 4, there were no significant differences among the treatments during the early rice season and late rice season of 2022. In the winter crop season of 2023, the dissolved organic carbon content of treatment N2MR was significantly higher than that of the control treatment (CK) by 38.7% (p < 0.05). During the early rice season, the dissolved organic carbon content of treatment N4MR was significantly lower than that of CK and N2MR by 32.6% and 36.9%, respectively (p < 0.05). In the late rice season, there were no significant differences in dissolved organic carbon content among the treatments. Therefore, nitrogen reduction by 20% and 60% combined with green manure mixed cropping and incorporation is beneficial for the accumulation of dissolved organic carbon content.

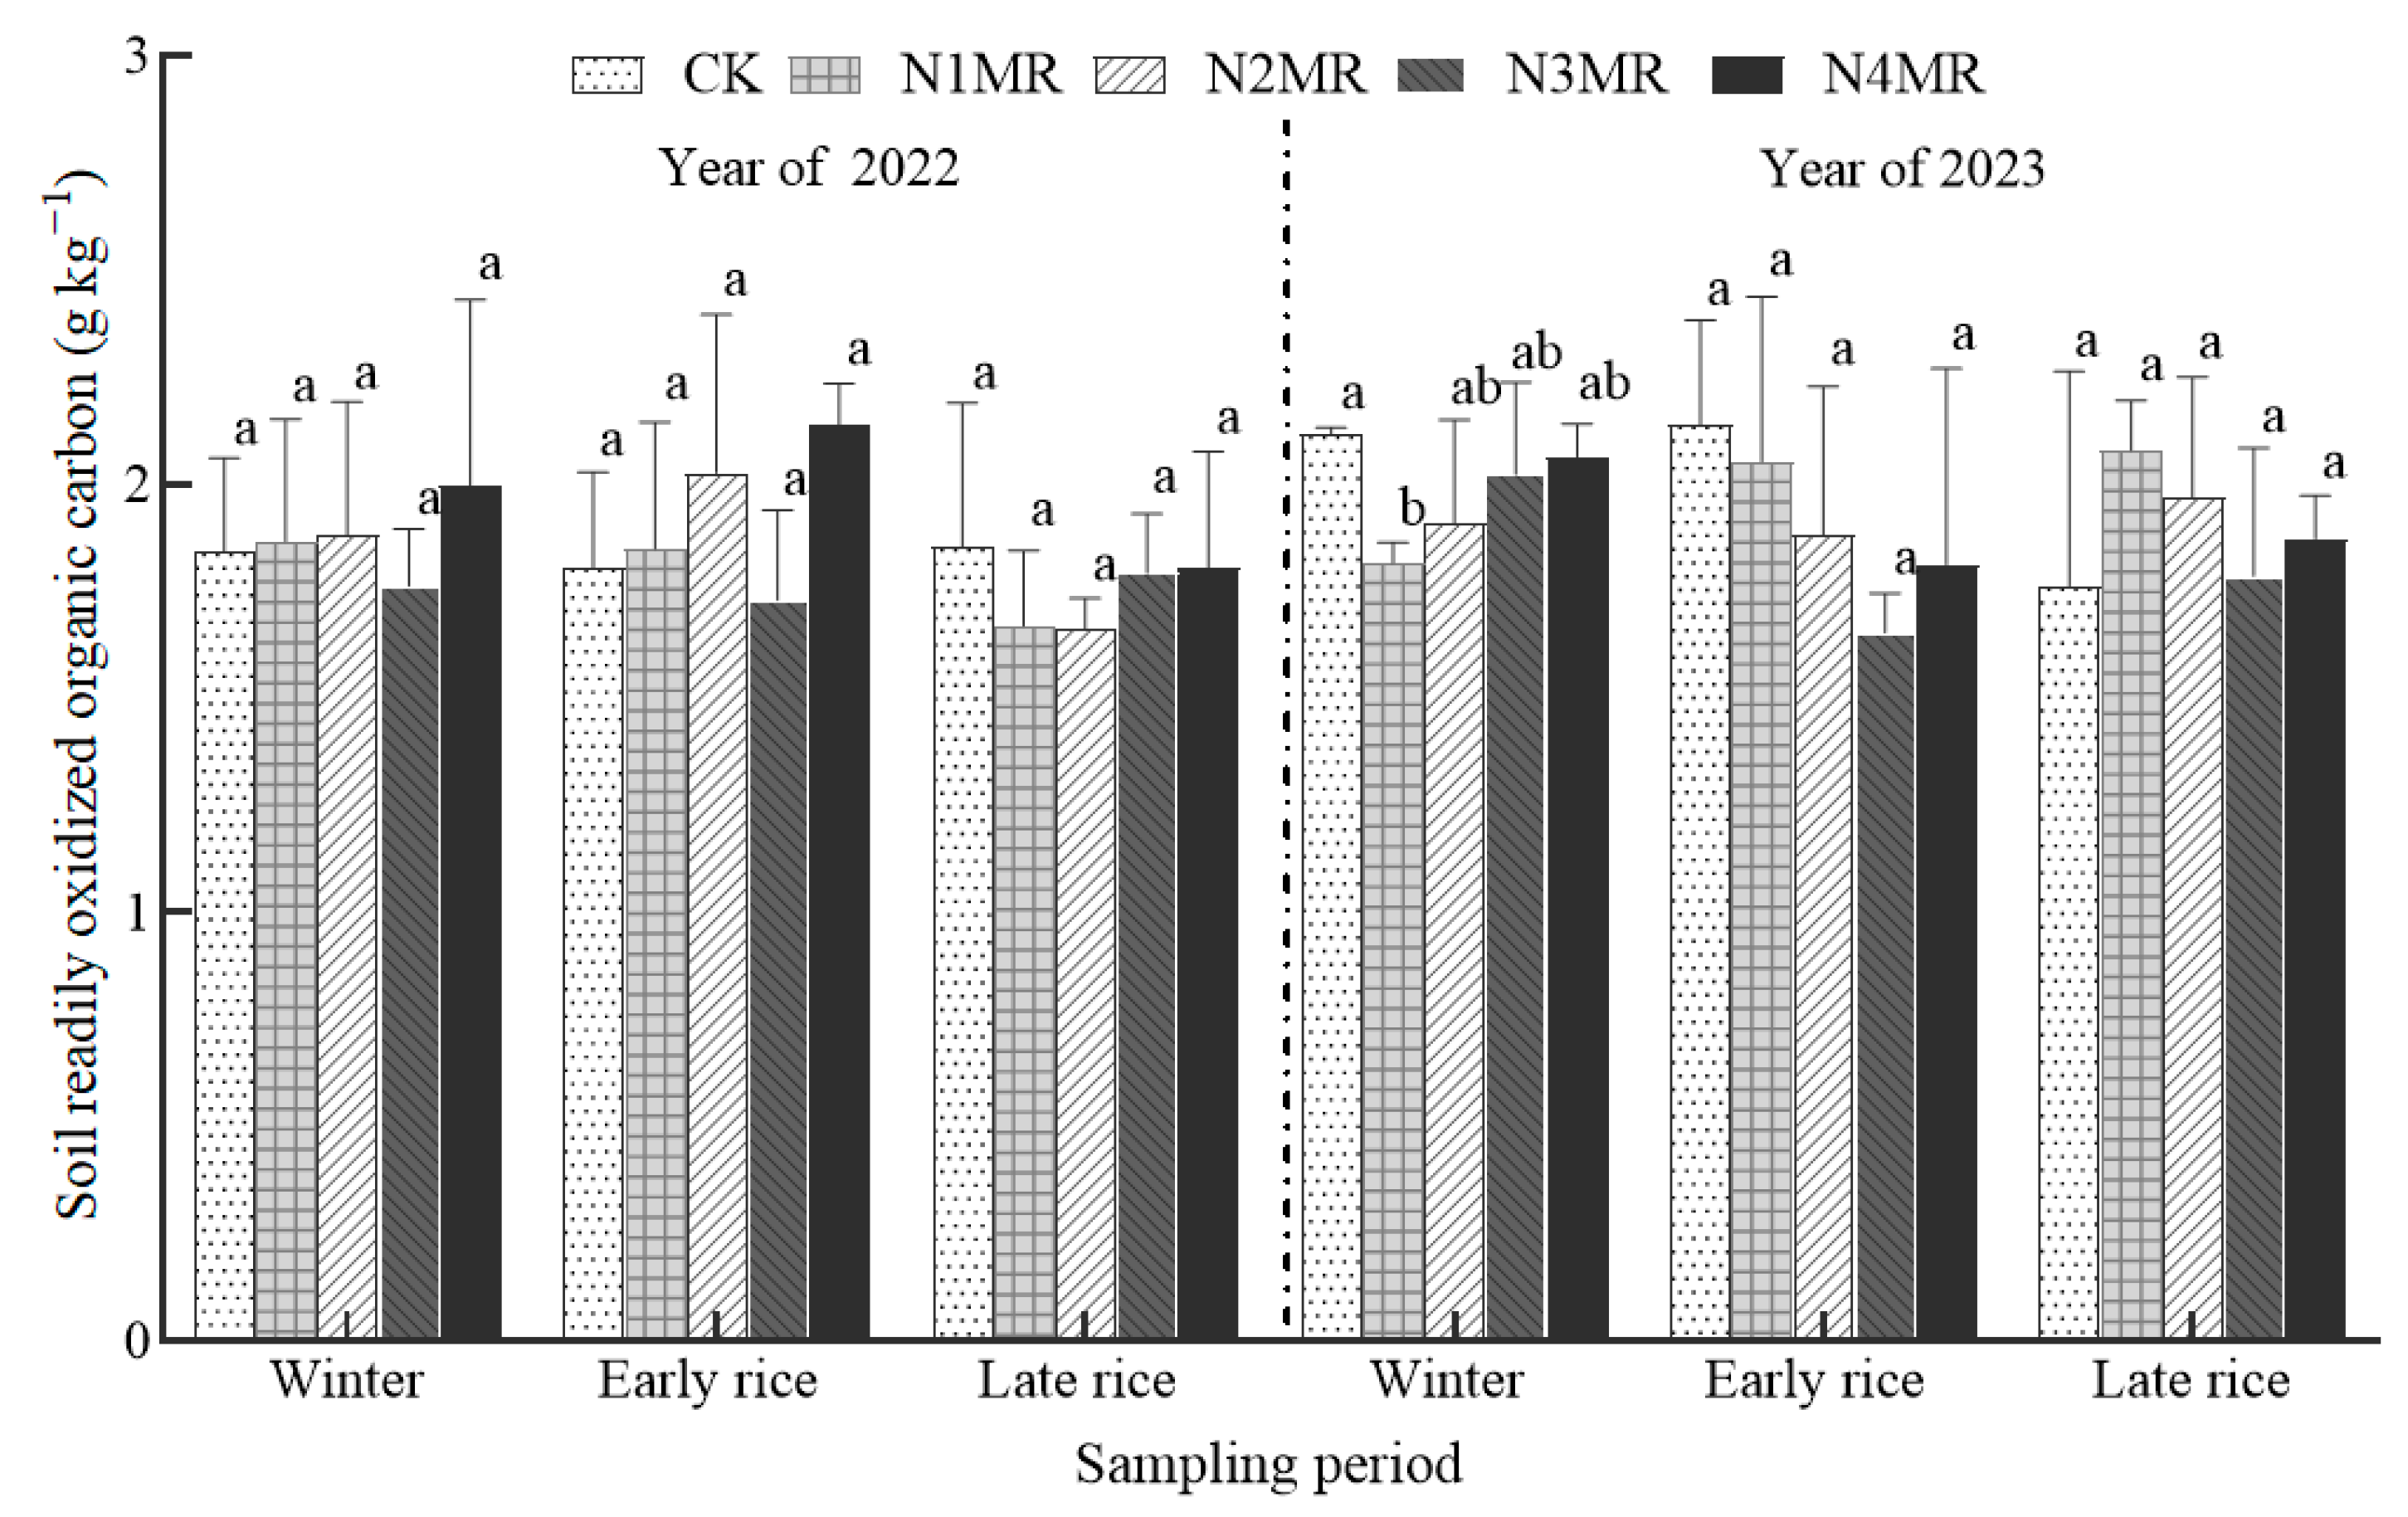
3.2.5. Soil Readily Oxidized Organic Carbon

As shown in Figure 5, there were no significant differences in soil readily oxidized organic carbon content among the treatments throughout the year 2022, and there was no noticeable decrease in organic carbon content within the annual cycle for any of the treatments. During the winter crop season of 2023, the readily oxidized organic carbon content of treatment N1MR was significantly lower than that of the control treatment (CK) by 14.2% (p < 0.05). There were no significant differences in readily oxidized organic carbon content among the treatments during the early rice season and late rice season. When comparing 2023 with 2022, there was no marked decrease in readily oxidized organic carbon content for any of the treatments, and the trends were relatively consistent. Overall, the readily oxidized organic carbon content remained stable across different nitrogen reduction levels when green manure was mixed and incorporated into the soil.

3.3. Correlation Analysis Between Rice Yield, Yield Components, and Soil Organic Carbon and Its Fractions

As shown in Table 6, the correlation analysis between rice yield, yield components, and soil organic carbon and its fractions reveals several significant relationships. Rice yield was positively and significantly correlated with 1000-grain weight (p < 0.05). The effective spikes were extremely significantly positively correlated with total organic carbon (p < 0.01) and significantly positively correlated with readily oxidized organic carbon (p < 0.05). The grain number per panicle was significantly positively correlated with dissolved organic carbon (p < 0.05). The seed-setting rate was extremely significantly positively correlated with readily oxidized organic carbon (p < 0.01). Additionally, total organic carbon was significantly positively correlated with readily oxidized organic carbon (p < 0.05).

4. Discussion

4.1. Study on Rice Yield and Yield Components Under Mixed Sowing of Green Manure Combined with Reduced Nitrogen Fertilization

In this study, we observed a trend of increased rice yield when nitrogen fertilization was reduced by 20% in double-cropping rice systems under the mixed cropping and incorporation mode of Chinese milk vetch and rapeseed. Previous studies have shown that reducing nitrogen application by 20–40% in green manure incorporation systems can maintain stable rice yields [11,25], which aligns with our findings. The incorporation of mixed Chinese milk vetch and rapeseed releases significant nutrients, facilitating nutrient uptake and utilization by rice. This helps to coordinate the dynamic nutrient demands between plants and soil, meeting the nutrient requirements of rice at different growth stages and enhancing subsequent crop yields [26]. Numerous studies [11,27] have indicated that Chinese milk vetch incorporation can replace partial nitrogen fertilizer, reducing nitrogen application rates without compromising rice yields. Yang et al. [28] and Wang et al. [29] found that mixed cropping and incorporation of green manures can effectively reduce nitrogen fertilizer application during the rice season without affecting yields. This is because the combination of Chinese milk vetch and nitrogen fertilizer stimulates soil microbial reproduction, accelerating decomposition and nutrient release. This increases soil available nutrient content and coordinates rice growth at both individual and population levels. Huang et al. [25] suggested that combining green manure with reduced nitrogen favors the formation of yield components such as effective panicles, grains per panicle, and filled grains, ensuring stable yields. This may be due to the symbiotic nitrogen fixation of green manure with rhizobia, which increases exogenous nitrogen input. Additionally, the incorporation of green manure as fresh organic material enhances soil microbial activity, promoting rice uptake and utilization of soil nutrients. However, rice yields and aboveground biomass were significantly higher with nitrogen fertilization than without, indicating that mixed cropping and incorporation of Chinese milk vetch and rapeseed cannot completely replace the role of nitrogen fertilizer in maintaining and increasing crop yields. Nitrogen reduction needs to ensure the nitrogen supply required by plants without compromising rice yields. Excessive nitrogen reduction may lead to nitrogen deficiency in plants, affecting photosynthesis and nutrient absorption, thereby reducing rice yield and quality. In this study, the mixed cropping and incorporation mode of Chinese milk vetch and rapeseed combined with a 20% reduction in nitrogen fertilization ensured stable rice yields with a slight yield increase trend.

4.2. Study on Soil Organic Carbon and Its Fractions Under Mixed Sowing of Green Manure Combined with Reduced Nitrogen Fertilization

The soil organic carbon pool is the largest carbon pool on Earth’s surface [13]. Soil organic carbon content is a key indicator for measuring soil fertility and quality. Different proportions of green manure and nitrogen fertilizer application, as well as the type of green manure, have varying effects on soil organic carbon sequestration. Xie et al. [30] found that incorporating Chinese milk vetch into the soil can effectively increase soil organic carbon content and is beneficial for increasing soil active organic carbon content. Wang et al. [31] showed that compared to winter fallow, winter-planted green manure rapeseed increased soil organic carbon content in all soil layers. This is mainly due to the high soil coverage provided by green manure rapeseed and Chinese milk vetch after regreening in winter. This coverage not only promotes the formation of soil aggregates and protects organic matter but also significantly reduces soil wind erosion in winter and spring. This, in turn, protects the organic matter-rich surface soil and increases the stability of soil organic carbon. Quan et al. [32] reported that applying a certain amount of green manure combined with reduced nitrogen fertilizer can effectively increase the total organic carbon, active organic carbon, dissolved organic carbon, and microbiological carbon content in paddy fields. When the green manure incorporation rate reached 37,500 kg· ha−2, the soil carbon pool activity index increased under nitrogen reduction conditions of 20–40% compared to conventional fertilization. In this study, we also found that compared to conventional nitrogen application, the mixed cropping and incorporation of green manures combined with a 20% reduction in nitrogen effectively promoted organic carbon accumulation. Furthermore, the effects on soil organic carbon pools and fractions varied with different proportions of green manure and nitrogen fertilizer application, and it can be observed from winter crops in 2023 that the application of green manure can significantly increase dissolved organic carbon content, consistent with the findings of Li et al. [33]. The incorporation of Chinese milk vetch and rapeseed effectively increased exogenous organic matter input, enhanced microbial activity, and promoted the decomposition of organic matter and green manure decomposition products. These decomposition products provided the main source of organic carbon production. In summary, not all green manure treatments combined with nitrogen reduction effectively promote organic carbon accumulation. This may be due to the organic carbon provided by exogenous organic matter decomposition not being fully able to replace the organic carbon converted from the reduced nitrogen fertilizer in treatments with lower green manure incorporation rates [30]. Therefore, to achieve nitrogen reduction effects, it is necessary to further clarify the optimal proportional relationship between green manure incorporation rates and nitrogen fertilizer addition amounts.

4.3. Study on Correlation Analysis Between Rice Yield, Yield Components, and Soil Organic Carbon and Its Fractions

In this study, a significant positive correlation is observed between rice yield and 1000-grain weight. Effective panicle number exhibits a highly significant positive correlation with total organic carbon and a significant positive correlation with readily oxidized organic carbon. Grains per panicle show a significant positive correlation with dissolved organic carbon. Seed setting rate is highly positively correlated with readily oxidized organic carbon. Additionally, total organic carbon is significantly positively correlated with readily oxidized organic carbon. These negative correlations are likely due to the strong stimulation of soil microbial activity by highly active organic carbon (such as readily oxidizable organic carbon and dissolved organic carbon) during critical growth stages [34]. This leads to intense competition between microorganisms and rice plants for mineral nutrients (especially nitrogen), thereby inhibiting tiller development, panicle formation, and grain filling [35]. Additionally, the significant negative correlation between total organic carbon and readily oxidizable organic carbon may be attributed to the preferential utilization and rapid consumption of readily oxidizable organic carbon by microorganisms [36]. During the critical growth stages, when the input of highly active organic carbon surges, the soil microbial community is strongly stimulated, resulting in a significant increase in microbial activity.
This green manure cropping pattern is suitable for promotion in southern rice-growing regions. This model offers both ecological and agronomic benefits, aligns with national policies on reducing and optimizing chemical fertilizer use, and has strong potential for application in rice-growing areas of southern China. However, this study was conducted at a specific site and within a limited time frame, without covering diverse soil types, climatic conditions, and cropping practices across different regions. Therefore, the broader applicability of the results still needs to be validated. Future research should further evaluate the adaptability and long-term effects of this management practice across different regions and years, providing theoretical and practical support for the green transformation of regional agriculture.

5. Conclusions

The mixed sowing of Chinese milk vetch and rapeseed combined with 20% nitrogen reduction can ensure stable and increased rice yields. This mixed incorporation, along with nitrogen reduction, exerts different impacts on soil organic carbon and its fractions. Conventional nitrogen application and 20% nitrogen reduction are more conducive to the accumulation of total soil organic carbon, and 60% and 20% nitrogen reduction are more conducive to the enhancement and accumulation of soil active organic carbon and dissolved organic carbon. Therefore, the mixed sowing of 3/4 Chinese milk vetch (seeding rate of 17.5 kg ha−1) × 1/4 rapeseed (seeding rate of 2.5 kg ha−1) residue into the soil, combined with a 20% nitrogen reduction (120 kg ha−1) for double-cropping rice, can ensure stable and increased rice yields. Reducing nitrogen by 60% or 20% is beneficial for enhancing and accumulating soil total organic carbon, active organic carbon, and dissolved organic carbon.

Author Contributions

Conceptualization, G.-Q.H.; data curation, Q.L.; formal analysis, Z.-H.F.; funding acquisition, G.-Q.H.; methodology, G.-Q.H.; supervision, G.-Q.H.; visualization, J.-R.C.; writing—original draft, B.-J.Y.; writing—review and editing, B.-J.Y. and Q.L. All authors have read and agreed to the published version of the manuscript.

Funding

This work was supported and funded by the National Natural Science Foundation of China (32160528), and the Open Fund of Key Laboratory of Crop Physiology, Ecology and Cultivation in the Middle and Lower Reaches of the Yangtze River, Ministry of Agriculture (2025KLCEFSMLRYRMARA-2).

Institutional Review Board Statement

Not applicable.

Data Availability Statement

Data are contained within the article.

Conflicts of Interest

The authors declare no conflicts of interest.

References

  1. Cao, W.D.; Gao, S.J. Chinese green manure development strategy by 2025. Chin. J. Agric. Resour. Reg. Plan. 2023, 44, 1–9. [Google Scholar]
  2. Wang, H.; Tang, S.; Wu, J.; Hu, R.; Han, S.; Liu, Y.; Zhu, Q.; Li, M.; Wang, Y.Q.; Shi, Z.L. Effects of nitrogen managements with incorporation of Chinese milk vetch on the yield of double cropping rice and fertilizer use efficiency. J. Agric. Resour. Environ. 2018, 35, 327–333. [Google Scholar]
  3. Zhou, G.P.; Xie, Z.J.; Cao, W.D.; Xu, C.X.; Bai, J.S.; Zeng, N.H.; Gao, S.J.; Yang, L. Co-incorporation of high rice stubble and Chinese milk vetch improving soil fertility and yield of rice. Trans. Chin. Soc. Agric. Eng. (Trans. CSAE) 2017, 33, 157–163. [Google Scholar]
  4. Wang, J.L.; Sun, C.F.; Cheng, Y.G.; Zheng, P.S.; Hong, J.P. Effects of different green manures on chemical properties and enzyme activities of reclaimed soil. Soils Fertil. Sci. China 2022, 305, 85–93. [Google Scholar]
  5. Blesh, J. Functional traits in cover crop mixtures: Biological nitrogen fixation and multifunctionality. J. Appl. Ecol. 2018, 55, 38–48. [Google Scholar] [CrossRef]
  6. White, C.M.; Dupont, S.T.; Hautau, M.; Hartman, D.; Finney, D.M.; Bradley, B.; La Chance, J.C.; Kaye, J.P. Managing the trade-off between nitrogen supply and retention with cover crop mixtures. Agric. Ecosyst. Environ. 2017, 237, 121–133. [Google Scholar] [CrossRef]
  7. Ju, X.T.; Xing, G.X.; Chen, X.P.; Zhang, S.L.; Zhang, L.J.; Liu, X.J.; Cui, Z.L.; Yin, B.; Christie, P.; Zhu, Z.L.; et al. Reducing environmental risk by improving N management in intensive Chinese agricultural systems. Proc. Natl. Acad. Sci. USA 2009, 106, 3041–3046. [Google Scholar] [CrossRef] [PubMed]
  8. Cao, Y.S.; Tian, Y.H.; Yin, B.; Zhu, Z.L. Assessment of ammonia volatilization from paddy fields under crop management practices aimed to increase grain yield and N efficiency. Field Crops Res. 2013, 147, 23–31. [Google Scholar] [CrossRef]
  9. Peng, S.; Wang, H.; Zhang, W.Z.; Hou, H.J.; Chen, A.L.; Wei, W.X.; Wan, Y.J.; Yuan, H.Z. Effect of long-term reduction and deep placement of nitrogen fertilizer on rice yield and soil fertility in a double rice cropping system. J. Plant Nutr. Fertil. 2020, 26, 999–1007. [Google Scholar]
  10. Pu, J.; Li, Z.; Tang, H.; Zhou, G.; Wei, C.; Dong, W.; Jin, Z.; He, T. Response of soil microbial communities and rice yield to nitrogen reduction with green manure application in karst paddy areas. Front. Microbiol. 2023, 13, 1070876. [Google Scholar] [CrossRef]
  11. Zhang, L.; Huang, J.; Gao, J.S.; Cao, W.D.; Gao, P.; Yang, Z.C. Effects of long-term green manure and reducing nitrogen applications on rice yield and soil nutrient content. Trans. Chin. Soc. Agric. Eng. (Trans. CSAE) 2020, 36, 106–112. [Google Scholar]
  12. Yang, W.; Yao, L.; Zhu, M.Z.; Li, C.W.; Li, S.Q.; Wang, B.; Dijkstra, P.; Liu, Z.Y.; Zhu, B. Replacing urea-N with Chinese milk vetch (Astragalus sinicus L.) mitigates CH4 and N2O emissions in rice paddy. Agric. Ecosyst. Environ. 2022, 336, 108033. [Google Scholar] [CrossRef]
  13. Li, F.D.; Li, Z.X.; Qiao, Y.F.; Liu, S.B.; Tian, C.; Zhu, N.; Hirwa, H.; Measho, S. Using soil organic carbon isotope composition analysis to elucidate the carbon cycle of agroecosystems. Chin. J. Eco-Agric. 2023, 31, 194–205. [Google Scholar]
  14. Xiao, X.J.; Xia, J.G.; Ma, D.Y.; Yu, Z.Y.; Zhou, Y.X. Effect of tea residue biochar on soil organic carbon and its active components in tea garden soil. J. Soil Water Conserv. 2020, 34, 294–300. [Google Scholar]
  15. Chang, L.X.; Liang, X.R.; Wang, L.; Li, Z.R.; Zhan, F.D.; He, Y.M. Characteristics and influencing factors of soil organic carbon sink in paddy fields in China: A review. Soils 2023, 55, 487–493. [Google Scholar]
  16. Guo, Q.K.; Liang, G.Q.; Zhou, W.; Chen, J.; Sun, J.W.; Wang, X.B.; Yu, X.C.; Li, D.M. Microbiological mechanism of long-term organic fertilization on improving soil biological properties and double rice yields in red paddy soil. J. Plant Nutr. Fertil. 2020, 26, 492–501. [Google Scholar]
  17. Gao, S.J.; Gao, J.S.; Cao, W.D.; Zou, C.Q.; Huang, J.; Bai, J.S.; Dou, F.G. Effects of long-term green manure application on the content and structure of dissolved organic matter in red paddy soil. J. Integr. Agric. 2018, 17, 1852–1860. [Google Scholar] [CrossRef]
  18. Chen, Y.; Yang, S.M.; Zhang, T.; He, Y.; Zhao, Q.M.; Chen, Q.; Gao, X.Y. Effects of alfalfa green fertilizer return and fertilizer reduction on greenhouse gas emissions and maize yield in Guizhou yellow soil. Jiangsu Agric. Sci. 2023, 51, 238–244. [Google Scholar]
  19. Yang, X.H.; Yu, A.Z.; Chai, J.; Li, Y.; Wang, F.; Wang, P.F.; Lv, H.Q.; Wang, Y.L.; Shang, Y.P. Effects of green manure incorporation combined with nitrogen fertilizer reduction on soil respiration and its temperature sensitivity in regard to wheat fields. Chin. J. Eco-Agric. 2024, 32, 61–70. [Google Scholar]
  20. Liu, S.J.; Zhou, L.H.; Tang, L.Z.; Li, G.; Gao, X.C.; Huang, J.; Gao, J.S. Effects of chemical fertilizer substitution of milk vetch on aggregate composition and organic carbon distribution in red paddy soil. Soils Crops 2023, 12, 25–33. [Google Scholar]
  21. Chen, H.J. Research on Productivity, Ecological Environmental Effect and Sustainability Evaluation Under Paddy-Upland Rotation Systems. Master’s Thesis, Jiangxi Agricultural University, Nanchang, China, 2015. [Google Scholar]
  22. Yang, B.J.; Sun, S.; Chen, H.J.; Huang, G.Q. Research on energy analysis and sustainability evaluation under paddy-upland rotation systems. Ecol. Sci. 2017, 36, 123–131. [Google Scholar]
  23. Li, P. Effects of the Mixture of Chinese Milk Vetch and Rape on Soil Fertility, N2O Emission and Abundance of Related Functional Genes in Paddy Fields. Master’s Thesis, Jiangxi Agricultural University, Nanchang, China, 2020. [Google Scholar]
  24. Bao, S.D. Analysis Methods for Soil Chemistry of Agriculture; China Agricultural Press: Beijing, China, 2000. [Google Scholar]
  25. Huang, J.; Gao, J.S.; Liu, S.J.; Cao, W.D.; Zhang, Y.Z. Effect of Chinese milk vetch in winter on rice yield and its nutrient uptake. Soil Fertil. Sci. China 2013, 1, 88–92. [Google Scholar]
  26. Li, P.; Yang, B.J.; Zhang, P.; Li, X.M.; Huang, G.Q. Effects of the mixture of Chinese milk vetch and rape on the yield, dry matter and nitrogen uptake and utilization of double cropping rice. Acta Agric. Univ. Jiangxiensis 2020, 42, 219–228. [Google Scholar]
  27. Yang, L. Effects of Chinese Milk Vetch Planting and Co-Incorporation with Rice Straw on Fertilizer Reduction and Their Regulating Mechanisms of Biological Nitrogen Fixation. Ph.D. Thesis, Chinese Academy of Agricultural Sciences, Beijing, China, 2019. [Google Scholar]
  28. Yang, J.; Bo, R.Y.; Han, S.; Li, M.; Wang, H.; Cheng, W.L.; Tang, S.; Wu, J.; Zhu, L. Optimized configuration of green manure and the effect of nitrogen fertilizer reduction on single cropping paddy field in Anhui. J. Anhui Agric. Univ. 2023, 50, 1030–1035. [Google Scholar]
  29. Wang, H.; Zhou, G.P.; Chang, D.N.; Gao, S.J.; Liu, R.; Liao, Y.L.; Lu, Y.H.; Zeng, N.H.; Nie, J.; Cao, W.D. Nitrogen reduction effects in double rice by planting and returning Chinese milk vetch to the field in Northern Hunan Province. J. Plant Nutr. Fertil. 2022, 28, 33–44. [Google Scholar]
  30. Xie, X.; Lu, Y.H.; Liao, Y.L.; Nie, J.; Zhang, J.L.; Sun, Y.T.; Cao, W.D.; Gao, Y.J. Effects of returning Chinese milk vetch and rice straw to replace partial fertilizers on double season rice yield and soil active organic carbon. Sci. Agric. Sin. 2023, 56, 3585–3598. [Google Scholar]
  31. Wang, Y.H.; Wang, J.K.; Du, H.Y.; Ji, X.H.; Liu, X.W. The Impact of green manure planting on carbon and nitrogen content of freshwater salinized soil and leaching solution in saline-alkali winter fallow farmland. Acta Agric. Boreali-Simica 2024, 39, 143–149. [Google Scholar]
  32. Quan, Z.M.; Qi, Y.; Zhou, Z.H.; Mo, K.; Han, W.B.; Liang, Q. Effects of Lathyrus sativus return to the field and nitrogen rate reduction on paddy soil labile organic carbon and soil enzyme activities. Pratacult. Sci. 2024, 41, 1057–1067. [Google Scholar]
  33. Li, Z.Q.; Zhang, X.; Wang, J.H.; Cao, K.; Xu, C.X.; Cao, W.D. Effect of chemical fertilizer reduction with return of Chinese milk vetch (Astragalus sinicus L.) on soil active organic carbon and carbon conversion enzyme activities. J. Plant Nutr. Fertil. 2019, 25, 525–534. [Google Scholar]
  34. Jue, C.; Yang, N.J.; Wang, S.R. Effects of Chemical Fertilizer Combined with Microbial Inoculant and Improved Substrate on Soil Aggregate Organic Carbon and Microbial Community Structure. Jiangsu Agric. Sci. 2023, 51, 237–244. [Google Scholar]
  35. Liu, H.; Jiao, Y.; Li, Y.T.; Dou, W.Y.; Long, X.Y.; Pei, W. Effects of Combined Application of Biochar and Nitrogen Fertilizer on Soil Bacterial Community in Rice Production. Soils Fertil. Sci. China 2024, 7, 88–100. [Google Scholar]
  36. Song, G.; Wang, Q.C.; Zheng, Y.; He, J.Z. Responses of Arbuscular Mycorrhizal Fungi to Elevated Atmospheric CO2 Concentration and Warming: A Review. Chin. J. Appl. Ecol. 2022, 33, 1709–1718. [Google Scholar]
Figure 1. Changes in soil total organic carbon content under different levels of nitrogen reduction. Note: Different lowercase letters indicate significant differences between treatments at the 5% level in the same season (p < 0.05). CK is without nitrogen fertilizer, N1MR is 100% N fertilizer, N2MR is 20% N fertilizer re-duction, N3MR is 40% N fertilizer reduction, and N4MR is 60% N fertilizer reduction.
Agriculture 15 01260 g001
Figure 2. Changes in soil active organic carbon content under different levels of nitrogen reduction. Note: Different lowercase letters indicate significant differences between treatments at the 5% level in the same season (p < 0.05). CK is without nitrogen fertilizer, N1MR is 100% N fertilizer, N2MR is 20% N fertilizer re-duction, N3MR is 40% N fertilizer reduction, and N4MR is 60% N fertilizer reduction.
Agriculture 15 01260 g002
Figure 3. Changes in soil microbiological carbon content under different levels of nitrogen reduction. Note: Different lowercase letters indicate significant differences between treatments at the 5% level in the same season (p < 0.05). CK is without nitrogen fertilizer, N1MR is 100% N fertilizer, N2MR is 20% N fertilizer re-duction, N3MR is 40% N fertilizer reduction, and N4MR is 60% N fertilizer reduction.
Agriculture 15 01260 g003
Figure 4. Changes in soil dissolved organic carbon content under different nitrogen reduction levels. Note: The data presented are the average values and standard deviation of three repetitions. Different lowercase letters indicate significant differences between treatments at the 5% level in the same season (p < 0.05). CK is without nitrogen fertilizer, N1MR is 100% N fertilizer, N2MR is 20% N fertilizer re-duction, N3MR is 40% N fertilizer reduction, and N4MR is 60% N fertilizer reduction.
Agriculture 15 01260 g004
Figure 5. Changes in soil readily oxidized organic carbon content under different levels of nitrogen reduction. Note: The data presented are the average values and standard deviation of three repetitions. Different lowercase letters indicate significant differences between treatments at the 5% level in the same season (p < 0.05). CK is without nitrogen fertilizer, N1MR is 100% N fertilizer, N2MR is 20% N fertilizer re-duction, N3MR is 40% N fertilizer reduction, and N4MR is 60% N fertilizer reduction.
Agriculture 15 01260 g005
Table 1. Experimental design.
TreatmentCropping PatternFertilizer Application
in Early Rice Season (kg ha−1)
Fertilizer Application
in Late Rice Season (kg ha−1)
NK2OP2O5NK2OP2O5
CKNo nitrogen fertilizer under the Chinese milk vetch × rapeseed - double cropping rice system012090012090
N1MRConventional nitrogen fertilizer under the Chinese milk vetch × rapeseed - double cropping rice system1501209015012090
N2MR20% nitrogen fertilizer reduction under the Chinese milk vetch × rapeseed - double cropping rice system1201209012012090
N3MR40% nitrogen fertilizer reduction under the Chinese milk vetch × rapeseed - double cropping rice system90120909012090
N4MR60% nitrogen fertilizer reduction under the Chinese milk vetch × rapeseed - double cropping rice system60120906012090
Note: “×” represents mixed sowing. “-” represents continuous planting.
Table 2. Quantity of green manure returned to the field in winter (t ha−1).
TreatmentCrops20222023
Fresh WeightFresh Weight
CKChinese milk vetch × rapeseed30.80 ± 0.87 a22.53 ± 1.16 a
N1MRChinese milk vetch × rapeseed34.33 ± 2.00 a25.93 ± 5.37 a
N2MRChinese milk vetch × rapeseed32.67 ± 2.20 a31.30 ± 6.44 a
N3MRChinese milk vetch × rapeseed30.93 ± 1.15 a27.57 ± 4.72 a
N4MRChinese milk vetch × rapeseed33.93 ± 3.01 a24.37 ± 2.70 a
Note: The data in the table are calculated based on the mean and the corresponding standard deviation of the three replicate treatments. Different lowercase letters after the data in the same column indicate significant differences between treatments in the same year at the 5% level (p < 0.05), as below.
Table 3. Crop varieties and fertilization methods.
CropVariety NameSeeding MethodSeeding and Harvest TimeFertilizing Amount
Chinese milk vetchYujiang dayeziSowing10 October 2021—10 April 2022
16 October 2022—7 April 2023
Not fertilizing
RapeseedZhongyou No.5Sowing9 November 2021—10 April 2022
8 November 2022—7 April 2023
Not fertilizing
Early riceZhongjiazao17Transplant2 May 2022—23 July 2022
28 April 2023—26 July 2023
N 180 kg ha−1
P2O5 90 kg ha−1
K2O 120 kg ha−1
Late riceTianyouhuazhanTransplant30 July 2022—30 October 2022
29 July 2023—6 November 2023
N 180 kg ha−1
P2O5 90 kg ha−1
K2O 120 kg ha−1
Note: Types of fertilizers are urea (N 46%), calcium–magnesium phosphorus fertilizer (P2O5 12%), and potassium chloride (K2O 60%).
Table 4. Rice yield at different levels of nitrogen reduction (t ha−1).
YearTreatmentEarly RiceLate RiceTotal Yield
YieldYieldYield
2022CK4.08 ± 0.30 b7.34 ± 0.27 c11.42 ± 0.153 c
N1MR5.40 ± 0.12 a8.60 ± 0.80 a14.00 ± 0.20 a
N2MR5.55 ± 0.18 a8.63 ± 0.24 a14.18 ± 0.31 a
N3MR5.42 ± 0.26 a8.72 ± 0.31 a14.14 ± 0.14 a
N4MR5.33 ± 0.12 a7.94 ± 0.37 b13.28 ± 0.43 b
2023CK4.71 ± 0.18 b4.81 ± 0.24 b9.53 ± 0.36 b
N1MR5.56 ± 0.60 ab8.48 ± 0.44 a14.04 ± 0.95 a
N2MR6.35 ± 0.70 a7.96 ± 0.24 ab14.31 ± 0.63 a
N3MR6.05 ± 0.73 a7.31 ± 0.21 ab13.36 ± 0.28 a
N4MR5.75 ± 0.50 ab6.83 ± 0.72 ab12.57 ± 0.89 a
Note: The tabulated data are calculated based on the mean and corresponding standard deviation of the three replicate treatments. Different lowercase letters after the data in the same column indicate significant differences between treatments at the 5% level (p < 0.05) for the same period. CK is without nitrogen fertilizer, N1MR is 100% N fertilizer, N2MR is 20% N fertilizer reduction, N3MR is 40% N fertilizer reduction, and N4MR is 60% N fertilizer reduction.
Table 5. Yield components of rice at different levels of nitrogen reduction.
YearPlanting SeasonTreatmentEffective Spikes (104 ha−1)Grain Number Per PanicleSeed-Setting Rate (%)1000-Grain Weight (g)
2022Early riceCK243.10 ± 22.15 ab88.09 ± 10.19 ab55.85 ± 7.30 bc27.90 ± 0.80 a
N1MR297.37 ± 44.24 a74.75 ± 1.083 ab69.01 ± 5.70 a26.12 ± 0.73 b
N2MR280.49 ± 38.67 ab68.43 ± 18.83 b54.34 ± 2.19 c27.63 ± 0.33 a
N3MR245.76 ± 10.97 ab96.19 ± 18.18 a64.56 ± 3.34 ab28.04 ± 0.55 a
N4MR237.70 ± 11.90 b88.35 ± 11.79 ab64.33 ± 5.12 ab27.83 ± 0.59 a
Late riceCK296.16 ± 17.58 a158.67 ± 16.50 a49.33 ± 11.09 a23.60 ± 0.26 b
N1MR334.84 ± 9.55 a149.00 ± 9.54 a61.33 ± 7.71 a24.93 ± 1.07 a
N2MR326.04 ± 14.06 a150.33 ± 21.08 a49.67 ± 6.91 a23.71 ± 0.14 b
N3MR336.15 ± 28.52 a168.00 ± 6.56 a49.67 ± 10.69 a24.20 ± 0.36 ab
N4MR306.15 ± 30.61 a166.00 ± 8.54 a55.67 ± 8.34 a24.23 ± 0.70 ab
2023Early riceCK215.83 ± 17.81 a122.68 ± 19.36 a55.45 ± 0.82 c27.29 ± 0.71 ab
N1MR236.26 ± 24.09 a97.47 ± 7.85 b71.00 ± 1.90 a25.64 ± 1.07 b
N2MR202.09 ± 6.55 a127.49 ± 11.21 a65.56 ± 5.18 ab27.43 ± 1.15 ab
N3MR207.74 ± 6.27 a125.82 ± 3.06 a65.24 ± 5.45 ab27.84 ± 1.08 a
N4MR200.28 ± 29.68 a128.46 ± 13.71 a61.76 ± 2.38 bc27.79 ± 0.84 a
Late riceCK240.52 ± 42.62 b172.00 ± 22.11 a76.33 ± 44.16 a21.99 ± 0.81 b
N1MR342.43 ± 25.14 a171.33 ± 12.58 a71.33 ± .6.03 a24.74 ± 1.82 a
N2MR311.25 ± 12.94 ab178.00 ± 26.46 a69.66 ± 3.06 a24.23 ± 0.94 a
N3MR295.14 ± 38.33 ab189.67 ± 13.01 a77.33 ± 10.21 a24.00 ± 0.49 a
N4MR280.26 ± 76.31 ab180.33 ± 10.60 a78.00 ± 16.52 a23.54 ± 0.60 ab
Note: The tabulated data are calculated based on the mean and corresponding standard deviation of the three replicate treatments. Different lowercase letters after the data in the same column indicate significant differences between treatments at the 5% level (p < 0.05) for the same period. CK is without nitrogen fertilizer, N1MR is 100% N fertilizer, N2MR is 20% N fertilizer reduction, N3MR is 40% N fertilizer reduction, and N4MR is 60% N fertilizer reduction.
Table 6. Correlation analysis between rice yield, various yield components, and soil organic carbon and its fractions.
ProjectRice YieldEffective SpikesGrain Number Per PanicleSeed-Setting Rate1000-Grain WeightTotal Organic CarbonMicrobiological CarbonDissolved Organic CarbonActive Organic CarbonReadily Oxidized Organic Carbon
Rice yield 0.43−0.04−0.070.62 *0.310.46−0.25−0.080.04
Effective spikes 0.040.220.360.77 **0.21−0.27−0.390.53 *
Grain number per panicle −0.460.050.06−0.20 0.52 *−0.04−0.48
Seed-setting rate −0.150.110.06 −0.03−0.050.66 **
1000-grain weight 0.400.10−0.020.170.31
Total organic carbon 0.36−0.320.080.54 *
Microbiological carbon −0.430.020.03
Dissolved organic carbon −0.01−0.11
Active organic carbon −0.08
Note: * indicate significant correlation at 0.05 level; ** indicate significant correlation at 0.01 level. The same applies to the following tables.
Disclaimer/Publisher’s Note: The statements, opinions and data contained in all publications are solely those of the individual author(s) and contributor(s) and not of MDPI and/or the editor(s). MDPI and/or the editor(s) disclaim responsibility for any injury to people or property resulting from any ideas, methods, instructions or products referred to in the content.

