Abstract
The high moisture content of wheat grains in extreme weather, such as continuous rain, can easily cause mildew, and we lack accurate discrete element parameters when conducting a simulation analysis of the rapid dehumidification of high-moisture grains. Based on the material characteristics of wheat grains with a moisture content ranging from 10.41% to 32.51%, the key parameters of discrete element simulation were calibrated. Firstly, the stacking angle under different moisture contents was determined by a physical experiment, and the regression equation was established as R2 = 0.9981. Subsequently, three significant parameters, namely, the static friction coefficient between the grains and steel plates, the static friction coefficient between grains, and the rolling friction coefficient, were selected from nine parameters using the Plackett–Burman test and the steepest climbing test. Furthermore, the stacking angle–discrete element parameter model was established using the Box–Behnken test as R2 = 0.98, with a relative error of less than or equal to 3.28%. Finally, the moisture content–discrete element parameter model was derived and constructed based on the moisture content–stacking angle model and the stacking angle–discrete element parameter model, with a relative error of less than or equal to 3.92%. The results indicate that the discrete element simulation parameters of wheat grains can be directly predicted by the moisture content and used for the discrete element simulation testing of high-moisture wheat grains. This universal calibration method not only provides convenient and reliable technical support for optimizing the emergency rapid dehumidification process for high-moisture wheat grains but also provides a reference method for the calibration of other grains.
1. Introduction
As global warming continues, extreme weather conditions such as “continuous rain” will occur more frequently, which will seriously affect global food supply security [1,2,3]. According to the FAO report, in 2021, agricultural losses directly caused by natural disasters such as extreme weather events reached USD 19.3 billion, and the frequency and intensity of these disasters are increasing [4]. As a major world food crop, wheat can be soaked by rainwater after harvesting owing to “continuous rain” and other extreme weather conditions, which affects its quality and storage. Emergency rapid dehumidification equipment for wheat grains must be developed to quickly remove free water from their surface to avoid fungal contamination and mildew. A discrete element parameter calibration and simulation analysis can optimize the structure of this equipment, which can save research and development costs, shorten the cycle, and improve fluid mechanics and mass and heat transfer mechanisms [5,6].
To date, scholars have conducted extensive research on the parameter calibration of granular materials through simulation methods, such as the discrete element method (DEM); such granular materials include Panax notoginseng seeds [7], alfalfa seeds [8], peanut seeds [9], corn kernels [10], mung bean seeds [11], wheat [12], etc. In the field of wheat research, Liu et al. [13] established a second-order regression model to estimate the relationship between the angle of repose and the significant parameters using the Box–Behnken test; they optimized the wheat contact parameters and improved the accuracy and reliability of the discrete element model. Wang et al. [14] applied the Hertz–Mindlin model and used the critical load of the wheat grain bonding model as the response value to calibrate the contact parameters during the wheat crushing process. Sugirbay et al. [15] used a rotating drum to calibrate the particle–particle and particle–material interaction characteristics for the wheat seed using a DEM simulation, providing a simple and accurate calibration method for seed behavior simulation. Horabik et al. [16] calibrated the discrete element parameters of wheat for the modeling of a grain storage system. Based on the multi-sphere model (spherical particle 1 ball, equal width 3 ball, equal width 4 ball and 6 ball), the measurement, compaction, and unloading processes of bulk wheat were simulated by the dual-stiffness Hertz contact model and single-grain test, and the consistency between the discrete element simulation results and experimental results was verified. Sun et al. [17] proposed a general method for modeling wheat seeds: a multi-sphere model based on double ellipsoids and single ellipsoids. The verification results indicated that the double ellipsoid model has a higher accuracy, and the 33-sphere model is suitable for seeds with a length-to-thickness ratio of 2.05. The five-sphere model based on a single ellipsoid is suitable for seeds with a length–thickness ratio greater than 2.38, and the performance of the multi-sphere model is better than that of the ellipsoid model. Lu et al. [18] proposed a method to establish the discrete element model for wheat seeds based on ellipsoids, which performed better in accuracy and robustness than the nine-sphere and three-sphere models. The calculation time was comparable to that of the three-sphere model but much less than that of the nine-sphere model. This method effectively solved the problem of balancing the simulation accuracy and calculation time. Chen et al. [19] found quantifying discrete element parameters to be complicated due to the shape and heterogeneity of particles. The simulation parameters of wheat were determined by direct measurement and calibration test methods. The simulation results revealed that the bulk density error and the angle of repose error were small.
Although a relatively complete wheat grain model has been constructed for different varieties and application scenarios, the physical properties and contact parameters of wheat grains with high moisture contents are significantly different from those of ordinary wheat grains. There are few reports on the determination of the geometric parameters and the calibration of the contact parameters of wheat grains with high moisture contents.
Therefore, in view of the differences in the discrete element parameters of wheat grains under different moisture content levels, this study combined a physical test and a simulation test. Wheat grains with five different moisture contents were taken as the research objects, and a moisture content–stacking angle model of wheat grains was established using the cylinder lifting method. Subsequently, the Plackett–Burman experimental design, the steepest climbing experimental design, and the Box–Behnken experimental design were used to establish the mathematical model to estimate the relationship between the stacking angle and the discrete element simulation parameters. Based on the above two tests, the moisture content–discrete element parameter model was derived. By combining the plate-pumping physical test and the simulation test, both results were compared and analyzed to verify the accuracy of the established model. This research aims to provide a theoretical basis for a universal discrete element calibration method for high-moisture wheat and other cereal grains and the optimal design of emergency rapid dehumidification equipment for wheat grains.
2. Materials and Methods
2.1. Experimental Materials
The main wheat variety “Fengdechunmai No. 20” in Henan Province (31°23′ to 36°22′ north latitude, 110°21′ to 116°39′ east longitude) was selected for this research, and the samples were purchased from Henan Qiule Seed Technology Co., Ltd (Zhengzhou, China). The initial moisture content was 10.41%. The experiment was conducted at the School of Mechanical and Electrical Engineering of Henan Agricultural University in July 2024. The production process for the wheat grain samples with 5 different moisture content gradients was as follows: First, the wheat grains were strictly cleaned and screened to remove impurities and ensure the consistency of sample specifications. Then, the samples were evenly placed in the culture dish, and the amount of tap water was precisely controlled to completely cover the grain top; the samples were then placed in an incubator (Changzhou Jintan Jingda Instrument Manufacturing Co., Ltd. (Changzhou, China), model: DHP-260, temperature range: 5~65 °C, temperature fluctuation: ±1 °C) for soaking. Based on the results of the preliminary test of wheat grain moisture content and the field investigation, the incubator temperature was set to 25 °C to obtain more accurate samples, and the moisture content of wheat grains without germination could reach up to approximately 33%. In addition, the wheat grains were flipped regularly during the soaking period to prevent local heating and uneven water diffusion. Combining the maximum and minimum values of the moisture content of this wheat grain variety, wheat samples of 5 different levels of moisture content were prepared in equal gradients, and their moisture contents were regularly sampled and tested. The moisture contents of the samples were finally obtained as follows: 10.41%, 16.56%, 22.67%, 28.43%, and 32.51%. Finally, the samples with the required moisture contents were sealed in plastic bags and stored in a 5 °C refrigerator (Qingdao Haier Co., Ltd., Qingdao, China, model: BCD-458WDSD, range: refrigerated 1~9 °C, frozen −15~−23 °C) for the subsequent related experiments.
2.2. The Measurement of the Intrinsic Parameters of Wheat Grains
2.2.1. Basic Physical Parameters
Among the wheat grains of each moisture content, 100 wheat grain samples were randomly selected to measure their average triaxial dimensions. The length (L), width (W), and thickness (T) of each sample were measured with a digital display vernier caliper (Azovanger (Shanghai) Trading Co., Ltd., Shanghai, China, range: 0–150 mm, accuracy: 0.01 mm). The measurement diagram is shown in Figure 1. Based on the three-axis dimension data, the geometric mean diameter Dg and spherical surface Sp of the wheat grains were calculated as follows:
where L is the length of the wheat grains, measured in mm; W is the width of the wheat grains, in mm; T is the thickness of the wheat grains, in mm; Dg is the geometric mean diameter of the wheat grains, in mm; and Sp is the sphericity of the wheat grains, in %.
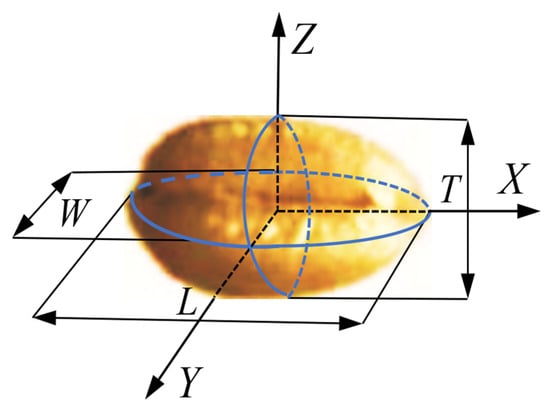
Figure 1.
A schematic diagram of the three-axis dimensions of wheat grains.
Subsequently, the thousand-grain weight of the samples with five different moisture contents was measured with a high-precision electronic balance (Shenzhen Mumei Technology Co., Ltd., Shenzhen, China, model: MTB300D, accuracy: 0.01 g, range: 300 g), and each test was repeated five times. The density was measured using the improved drainage method of Archimedes’ principle [20], and five repetitions of each test were conducted. The moisture content of the wheat grains was measured using a moisture meter (Ohaus Instruments (Shanghai) Co., Ltd., Shanghai, China, model: MB27, accuracy: 0.001 g, 0.01%).
2.2.2. Poisson’s Ratio and Elastic Modulus
Thirty samples were randomly selected from wheat grains of different moisture contents. The wheat grains were subjected to pressure deformation tests using an SMS/TA.XT physical property tester (Stable Micro Systems (Godalming, UK), force resolution: 0.1 g, speed range: 0.01~45 mm/s, data acquisition rate: 2000 pps) [21,22], as shown in Figure 2. Before the start of the test, the length and thickness of the grain were measured, and then the grain ventral groove was placed on the compression test bench. A circular P50 probe was used for the compression test at a loading speed of 0.5 mm/s and a loading duration of 2 s. The maximum positive force and corresponding contact area were determined using post-processing software during compression. Poisson’s ratio was then computed as follows:
where μ is the Poisson’s ratio of wheat grains; is the lateral strain of wheat grains, in mm; is the longitudinal strain of wheat grains, in mm; is the absolute deformation of wheat grains in the length direction, in mm; is the original length of wheat grains, in mm; is the absolute deformation of wheat grains in the thickness direction, in mm; and is the original length of wheat grains in the thickness direction, in mm.
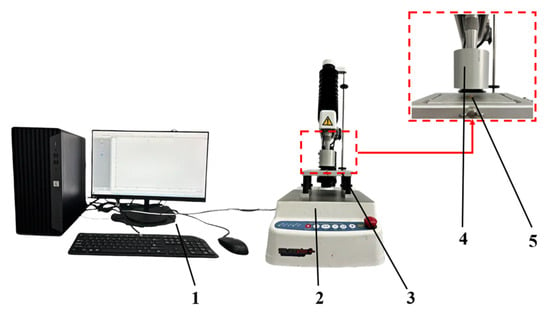
Figure 2.
Wheat grain pressure deformation test. 1. Control computer; 2. SMS/TA.XT physical property tester; 3. compression test bench; 4. P50 probe; 5. wheat grain.
The elastic modulus and shear modulus are calculated as follows:
where E is the elastic modulus of wheat grains, in MPa; f is the maximum positive force, in N; S is the contact area, in mm2; ε is the linear strain; and G is the shear modulus of wheat grains, in MPa.
2.3. Contact Parameters
2.3.1. Static Friction Coefficient
Thirty wheat grain samples were randomly selected from wheat grains of different moisture contents, and the static friction coefficient between the samples and the steel plate was measured using the inclined plane sliding method [23,24]. The experimental device consists of the following components: a rotating tilting plate and a rotating handle are used to adjust the angle of the inclined plane; a steel plate is fixed on the inclined plane platform to simulate the working conditions of wheat grains under the friction conditions of the steel plate; there is also a base for fixing the inclined plane platform to ensure stability and repeatability during the experiment; and an angle measuring instrument measures the inclination angle between the inclined plate and the horizontal fixed plate. The device is easy to operate and can effectively measure the static friction coefficient of wheat grains at different inclination angles. Its operation process is shown in Figure 3. Prior to the test, an angle measuring instrument (De qing Sheng tai xin Electronic Technology Co., Ltd., (Huzhou, China) range: 4 × 90°, accuracy: 0.05°) was securely attached to the static friction coefficient measuring device, and the rotating inclined plate was adjusted to a horizontal position. Subsequently, the grains were placed on the rotating inclined plate, and the handle was turned gradually and uniformly until the grains began to exhibit a downward movement trend. The entire process was recorded with a high-speed camera (model: FR-1000PCI, resolution: 1280 pixels × 864 pixels, maximum shooting rate: 3650 fps) to capture the angle measurement at the instant of grain descent, and this angle is the static friction angle α between the grains and the steel plate. The static friction coefficient is calculated as follows:
where is the static friction coefficient of the wheat grains; is the angle of the tilting plate, i.e., the static friction angle of the wheat grains, °; is the static friction, in N; G is the wheat grain gravity, in N; and is the support force of the rotating tilting plate on the wheat grains, in N.
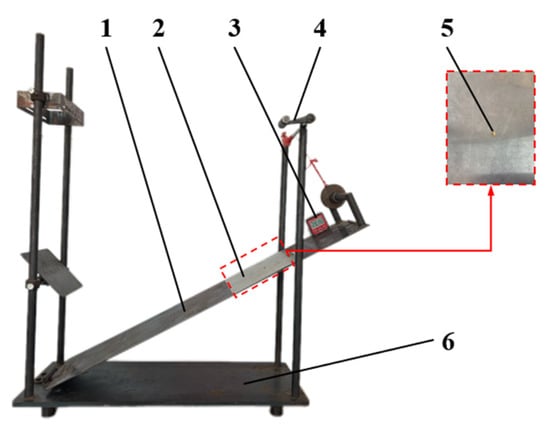
Figure 3.
Device for measuring static friction coefficient between wheat grains and steel plate: 1. rotating tilt plate; 2. steel plate; 3. angle measuring instrument; 4. rotating handle; 5. wheat grains; 6. fixed base.
The inclined sliding method was applied to determine the static friction coefficient of the wheat grains. To ensure the smooth surface of the wheat grain board, wheat grains of similar size and shape were selected as much as possible. The wheat grains were systematically organized based on their shapes and adhered to the surface of A4 paper to create a grain board, which was subsequently secured onto a rotating inclined board, as illustrated in Figure 4. During the test, the wheat grains were positioned within the gaps on the grain board, aligned along the long-axis direction, and a protractor was securely attached to the rotating inclined platform. Controlled by the turning handle, the inclined board was gradually and uniformly rotated to increase the inclination angle until the grains began to slide down. The entire process was recorded by the high-speed camera for the subsequent analysis. The static friction coefficient of the wheat grains was calculated using Formula (6).
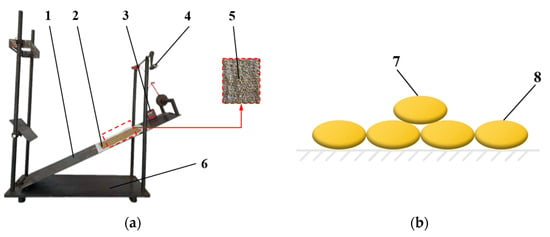
Figure 4.
Device for measuring static friction coefficient between wheat grains. (a) Test equipment; (b) schematic diagram of seed placement. 1. Rotating tilting plate; 2. wheat grain plate; 3. angle measuring instrument; 4. rotating handle; 5. wheat grains; 6. fixed base; 7. seeds to be tested; 8. slab made of seeds.
2.3.2. Rolling Friction Coefficient
Thirty wheat grain samples were randomly selected from wheat grains of each moisture content. The rolling friction coefficient between the wheat grains and the steel plate was measured using the inclined plane rolling method [25,26]. The experimental device consists of the following components: the inclined steel plate and the support seat are used to adjust the angle of the inclined surface to simulate different inclination conditions; the horizontal steel plate provides a stable and horizontal reference surface to ensure that wheat grains roll normally on the steel plate; and the angle measuring instrument measures the inclination angle between the inclined steel plate and the horizontal steel plate. The device has a simple structure and intuitive operation and can effectively measure the rolling friction coefficient of wheat grains at different inclination angles. Its operation process is shown in Figure 5. The grains were set in motion from rest on an inclined plate with an inclination angle β. The grains rolled downward along the inclined plate for a certain distance. Owing to the effect of the rolling friction, the grains rolled a certain distance across the horizontal panel before stopping. The horizontal rolling distance L was recorded. Wheat grains, being non-spherical, exhibited bouncing behavior during rolling when the inclination angle β and slope rolling distance S were large, ultimately affecting the test results. When β and S were small, the limited rolling distance reduced the measurement accuracy. Based on extensive preliminary tests, the inclination angle β was set to 25°, and the slope rolling distance S was determined as 35 mm. The rolling friction coefficient was calculated as follows:
where is the rolling friction coefficient of the wheat grains; m is the wheat grain mass, in g; is the acceleration due to gravity, set at 9.8 m/s2; S is the slope rolling distance, in mm; is the steel plate inclination angle, in °; and L is the horizontal rolling distance of the wheat grains, in mm.
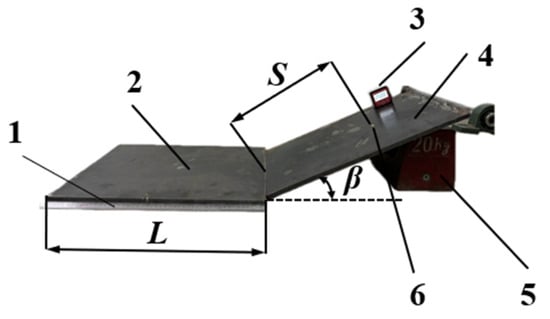
Figure 5.
Device for measuring rolling friction coefficient of wheat grains: 1. scale; 2. horizontal steel plate; 3. angle measuring instrument; 4. inclined steel plate; 5. support base; 6. wheat grains.
2.3.3. Collision Restitution Coefficient
The collision restitution coefficient is defined as the ratio between the separation speed and the approach speed of two objects along the normal direction at the contact point before and after collision [27]. Thirty wheat grain samples were randomly selected from wheat grains of each moisture content, and their collision restitution coefficients against the steel plates were measured using the free fall collision method [28,29]. The experimental device consists of the following components: a computer to control the experimental process and processing data; a high-speed camera mounted on a tripod to capture images of the wheat collision moment; coordinate paper to provide a reference background for the fall and collision of wheat grains so that the images captured by the high-speed camera can clearly represent the movement trajectory of wheat grains and the changes in collision height position; and a steel plate to simulate the collision condition of wheat grains. In this study, wheat grains were released from a height of H = 150 mm above the steel plate, and their bouncing motion was recorded by a high-speed camera, as shown in Figure 6. The maximum rebound height h was subsequently measured. The collision restitution coefficient is determined by the ratio of the maximum rebound height h to the initial drop height H, and it is equivalent to the ratio of the normal instantaneous separation velocity to the normal instantaneous approach velocity at the collision contact point. The calculation formula is
where is the collision restitution coefficient of the wheat grains; is the instantaneous contact velocity of the wheat grains at the collision contact point, in m/s; is the instantaneous separation speed of wheat grains at the collision contact point, in m/s; g is the acceleration due to gravity, set at 9.8 m/s2; is the initial height of free fall of wheat grains, in mm; and is the rebound height of wheat grains after touching, in mm.
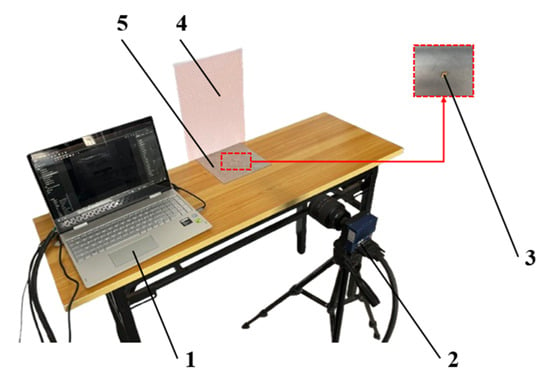
Figure 6.
Device for measuring collision restitution coefficient of wheat grains: 1. control computer; 2. high-speed camera; 3. wheat grains; 4. coordinate paper; 5. steel plate.
2.3.4. Actual Stacking Test
The angle of repose is a fundamental parameter reflecting the flow properties, scattering characteristics, and frictional behavior of granular materials, influenced by both the intrinsic features of the particles and the properties of the contact materials [30,31]. For the practical measurement of the angle of repose in wheat grains, a steel cylinder lifting method was employed. The cylinder is made of 304 steel, with a height of 120 mm and an inner diameter of 40 mm, and is upright on the platform. When conducting the test, the cylinder was vertically positioned on a horizontal steel plate and filled with wheat grains. After removing the excess scattered grains to ensure the formation of an unconstrained pile, the cylinder was slowly lifted upward, as shown in Figure 7. As the grains naturally slid and accumulated, the stable angle formed between the slope of the resulting grain pile and the horizontal steel plate surface was defined as the angle of repose.
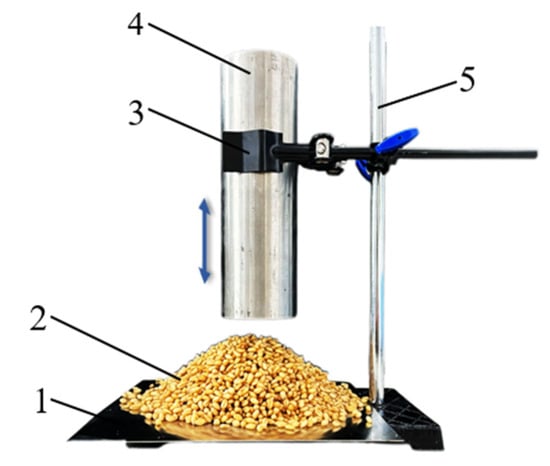
Figure 7.
Wheat grain stacking test. 1. Steel plate; 2. wheat grain pile; 3. universal gripper; 4. cylinder; 5. iron frame.
The images of grain stacking were obtained with a camera (model: EOS-70D, resolution: 5472 × 3648, pixels: 20.2 million), and these images were processed to obtain the stacking angle with MATLAB software (2023) (Figure 8a) [32,33,34]. First, the rgb2gray function was used to convert the original RGB image (Figure 8a) into a grayscale image (Figure 8b) using the weighted average method, and then the grayscale image was binarized using the threshold that was automatically calculated by graythresh (Figure 8c). Then, the imfill function was used to fill the holes inside the closed area to eliminate noise interference (Figure 8d). The bwboundaries function was used to extract the boundaries of high-moisture wheat accumulation in the hole-filled image to obtain the wheat grain accumulation contour curve (Figure 8e). As shown in Figure 8f, the contour curve was plotted and linearly fitted after the acquired contour point coordinates were loaded into the Origin2024 program. The slope of the fitted line is the tangent value of the repose angle, which is converted into the repose angle. The stacking angle test was conducted on wheat grains with five different moisture contents. Each test was repeated 10 times, and the measurement results were averaged.
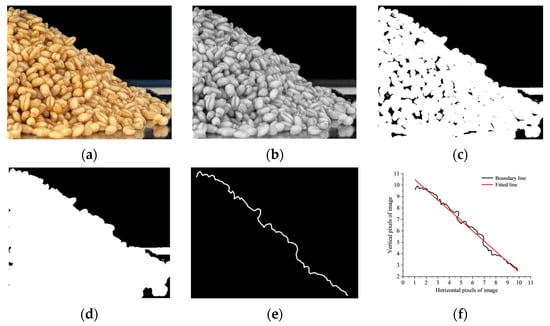
Figure 8.
Image processing of stacking angle experiment. (a) Original image; (b) grayscale image; (c) binary image; (d) hole filling image; (e) boundary extraction image; and (f) linear fitting image.
2.4. Simulation Stacking Test
2.4.1. The Establishment of the Discrete Element Model for the Wheat Grains
Discrete element simulation parameters usually refer to a series of parameters used to describe and simulate the properties and behaviors of discrete entities (such as particles or blocks) [5]. This study took the stacking angle of wheat grains with different moisture contents as the research target and utilized EDEM software for simulation. All the simulations were implemented with EDEM software, and the objective was to estimate the stacking angle of wheat grains with different moisture contents. In view of their irregular shape, we used a 5-sphere model to construct a discrete element simulation model of wheat grains. While effectively reducing the calculation cost, this method can ensure the accuracy of modeling and meet the requirements of simulation stacking tests [13,35,36]. Figure 9 shows the discrete element simulation model and the actual wheat grain image.
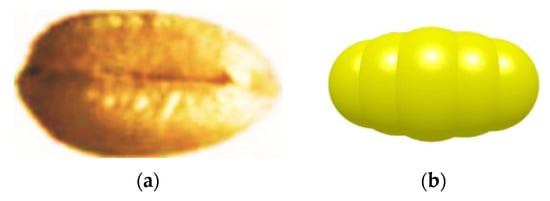
Figure 9.
The actual object and simulation model of the wheat grain. (a) The photograph and (b) the discrete element simulation model.
Normal distribution was applied to represent the particle size distribution of the wheat grains, with particle radii set to 0.55~1.16 times their initial values based on actual measured wheat grain sizes. Combined with the characteristics of the small adhesion between wheat grains, the Hertz–Mindlin model in EDEM 2020 software was used in this stacking simulation experiment, which effectively simulated the stacking characteristics of wheat grains [13,37,38]. The detailed parameters used in the discrete element simulation are shown in Table 1. Additionally, as simulation parameters affect the stress wave propagation between particles, each simulation may have a different rayleigh time step. Therefore, the fixed time step of the simulation was 20% of the rayleigh time step. The mesh size was set to twice the minimum particle radius.

Table 1.
Discrete element simulation parameters.
2.4.2. EDEM Simulation Stacking Test
Using the experimental cylinder as a reference, a 3D cylindrical model with identical dimensions was created using SolidWorks software (2020). After configuring the object and equipment materials, the 3D model was imported into EDEM software using the Geometries command. A virtual plane was established above the imported cylindrical model as a particle factory. The wheat particles were filled into the cylinder by dynamic generation. The generation rate of wheat grain was 5000 grains/s, and the total generation time was 2 s. In order to ensure the stable distribution of the grains in the cylinder, the simulation continued to run for 1 s after the grains were generated, and then the cylinder was lifted. The cylinder moved vertically upward at a speed of 0.05 m/s, and the grains gradually flowed out from the bottom and accumulated stably on the bottom plate, as shown in Figure 10. The image processing of this simulation test was consistent with the actual stacking test in Section 2.3.4, and the processing flow is shown in Figure 11.
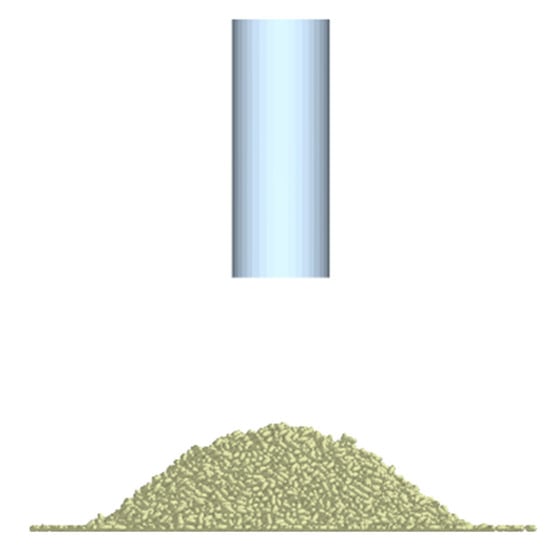
Figure 10.
Stacking angle simulation test.
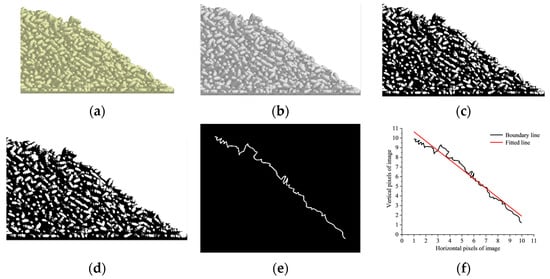
Figure 11.
Image processing of EDEM stacking angle simulation. (a) Original image; (b) grayscale image; (c) binary image; (d) hole filling image; (e) boundary extraction image; and (f) linear fitting image.
2.5. Design of Test Method
The Plackett–Burman experimental design was implemented using Design-Expert 13 software to identify significant factors affecting the stacking angle. According to the screening results, the steepest climbing test was conducted to narrow down the key influencing factors. Based on the outcomes of this test, the Box–Behnken experimental design was further refined, and a numerical analysis was carried out. The optimal parameter combination was determined through variance analysis. Finally, compared with the actual test, we verified whether the significant parameters were qualified.
2.5.1. Plackett–Burman Test
To screen out the parameters that have a significant impact on the response value from the simulation parameters used, this experiment adopted the Plackett–Burman design. This method can quickly screen out significant factors, reduce the number of unnecessary experiments, and improve experimental efficiency [39,40]. The stacking angle was used as the key response variable to accurately identify the discrete element parameters having a significant effect on the stacking angle from nine factors: the wheat grain Poisson’s ratio, the wheat grain density, the shear modulus of wheat grains, the static friction coefficient between wheat grains, the rolling friction coefficient between wheat grains, the static friction coefficient between wheat grains and the steel plate, the rolling friction coefficient between wheat grains and the steel plate, the coefficient of restitution between wheat grains and the steel plate, and the coefficient of restitution between wheat grains. These were selected for the Plackett–Burman test [12,13]. To ensure the comprehensiveness and representativeness of the test, the nine parameters were set at three levels, namely, low, medium, and high, and quantified by coding as −1, 0, and 1, respectively [39,40]. The parameter range was determined by the measurement results of the intrinsic parameters (Section 2.2) and contact parameters (Section 2.3). The experimental design is shown in Table 2.

Table 2.
Plackett–Burman experimental factor coding.
2.5.2. Steepest Climbing Design
After identifying the significant parameters affecting the wheat grain stacking angle using the Plackett–Burman test, a steepest climbing test was conducted to rapidly locate the neighborhood of the optimal value [39,40]. The step size for each significant parameter was determined based on its parameter interval, and the mean values were maintained for the non-significant parameters. By comparing the relative error between the simulated stacking angle and the stacking angle (= 36.86°) of the wheat grain physical test for the intermediate horizontal moisture content (22.67%), the parameter with the smallest error was determined to be the intermediate-level value of the optimal interval of the significant parameters. This method effectively reduced the range of the parameter search and provided important basic data for subsequent optimization research. This approach established the optimal value range for the discrete element parameters. The relative error between and is calculated with Equation (9).
where is the simulated value of the stacking angle of wheat grains; and is the actual accumulation angle of wheat grains.
2.5.3. Box–Behnken Test
Based on the optimal parameter range determined by the steepest climbing test, the Box–Behnken experimental design was used to perform response surface analysis. This method is particularly suitable for dealing with multiple significant factors as it provides detailed interaction information and finds the optimal parameter combination [39,40]. The experimental design incorporated three levels for each significant parameter—high (+1), medium (0), and low (−1)—while mean values were maintained for the non-significant parameters. Based on the established regression equation between significant factors and the response variable, the optimal parameter combination that most closely approximated the actual angle of repose was determined. The coded values of the significant parameters are presented in Table 3.

Table 3.
Box–Behnken test parameter coding.
3. Results and Discussion
3.1. Intrinsic Parameters of Wheat Grains with Different Moisture Contents
The measured intrinsic parameters of wheat grains with different moisture contents are shown in Figure 12 and Figure 13. When the moisture content increased from 10.41% to 32.51%, the three-axis dimensions of the grains showed significant changes: the length increased from 6.18 to 6.61 mm, the width from 3.35 to 3.68 mm, and the thickness from 2.95 to 3.16 mm. With an increase in moisture content, the geometric mean diameter increased from 3.94 to 4.25 mm and the sphericity index from 63.72% to 64.32%. The thousand-grain weight of the wheat grains increased from 46.03 to 57.56 g, but its density tended to decrease from 1350 to 1235 kg/m3.
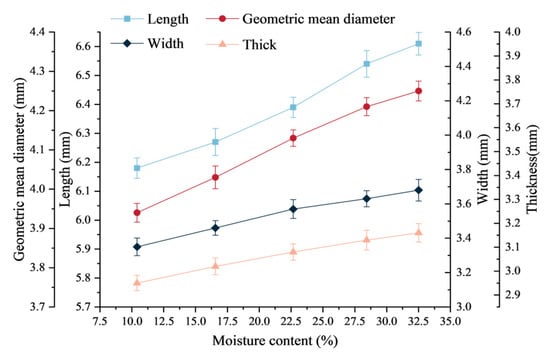
Figure 12.
Variation curves of the length, width, thickness, and geometric mean of wheat grains with different moisture contents.
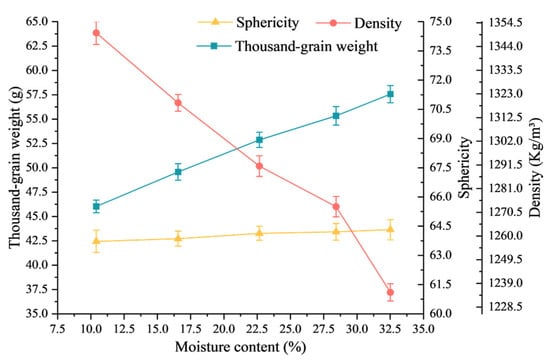
Figure 13.
Variation curves of the sphericity, thousand-grain weight, and density of wheat grains with different moisture contents.
Figure 12 and Figure 13 illustrate that an increasing moisture content leads to growth in all the morphological parameters (length, width, and thickness), geometric mean diameter, sphericity, and mass parameters of wheat grains while causing a reduction in density. These findings align with Al-Mahasneh et al.’s [41] observations. The increase in width and thickness may be due to the combined effect of starch swelling in the aleurone layer of the wheat grains and protein swelling in the endosperm, while the increase in length may promote the germination of wheat germs with higher moisture contents. This finding is similar to the research conclusion of Yao et al. [42]. The sphericity exhibited a gradual enhancement, indicating that the grains assumed a more spherical, fully developed form with the rising moisture content. The density reduction suggests that a volume expansion caused by moisture absorption outweighs the mass increase. The increase in the thousand-grain weight appears to be directly correlated with moisture-induced grain swelling, which confirms previous research findings [41].
As shown in Figure 14, the three-axis dimensions of wheat grains with five different moisture contents all obey a normal distribution (K-S test, p > 0.05).
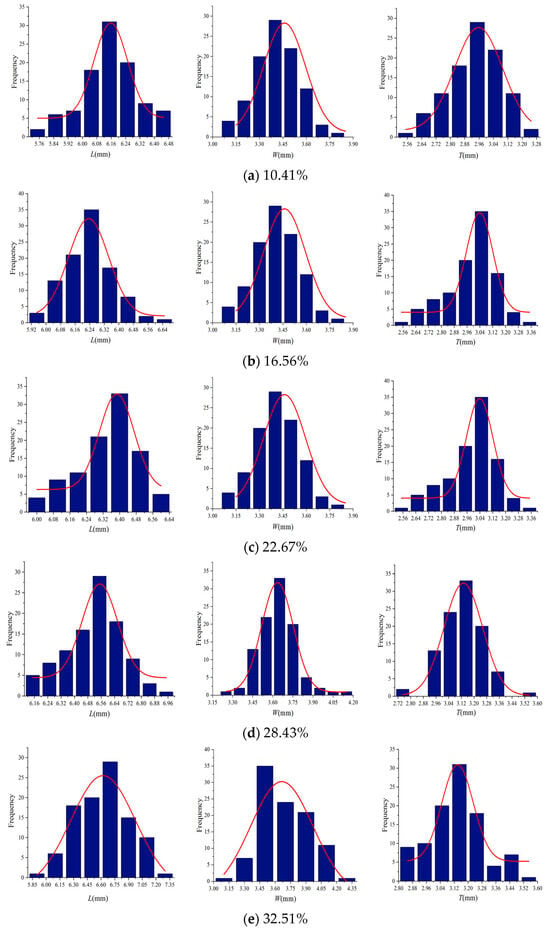
Figure 14.
Three-axis size distribution of wheat grains with five different moisture contents: (a) 10.41%; (b) 16.56%; (c) 22.67%; (d) 28.43%; and (e) 32.51%.
3.2. Contact Parameter Measurement
The measured contact parameters of wheat grains with five different moisture contents are shown in Figure 15 and Figure 16. When the moisture content increased from 10.41% to 32.51%, the contact parameters of the wheat grains changed significantly. Among them, Poisson’s ratio increased from 0.37 to 0.45, while the elastic modulus decreased from 49.73 to 22.72 MPa. The static friction coefficient between wheat grains and the steel plate increased from 0.528 to 0.605, and the static friction coefficient between wheat grains increased from 0.477 to 0.517. The rolling friction coefficient between wheat grains and the steel plate increased from 0.055 to 0.075, and the rolling friction coefficient between wheat grains increased from 0.047 to 0.067. The collision restitution coefficient between wheat grains and the steel plate decreased from 0.527 to 0.423, while the collision restitution coefficient between wheat grains decreased from 0.436 to 0.359.
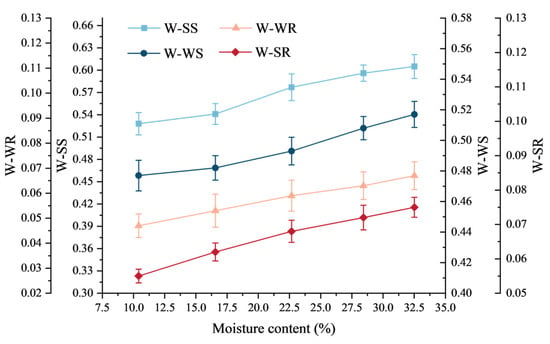
Figure 15.
Variation curves of the static friction coefficient and the rolling friction coefficient of wheat grains with different moisture contents. Note: W-SS is the static friction coefficient between wheat grains and the steel plate; W-WS is the static friction coefficient between wheat grains; W-WR is the rolling friction coefficient between wheat grains; and W-SR is the rolling friction coefficient between wheat grains and the steel plate.
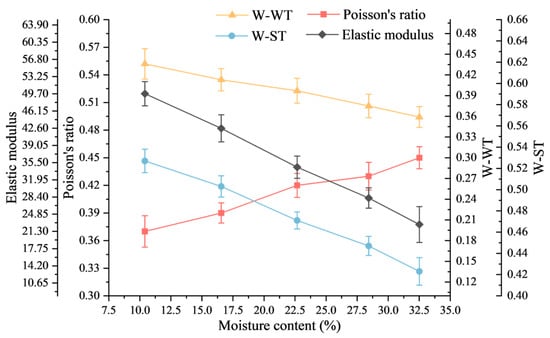
Figure 16.
Variation curves of Poisson’s ratio, the collision restitution coefficient, and the elastic modulus of wheat grains with different moisture contents. Note: W-WT is the collision restitution friction coefficient between wheat grains; W-ST is the friction coefficient of wheat grains against the steel plate.
As shown in Figure 15 and Figure 16, as the moisture content increased, most of the measured parameters, such as the Poisson’s ratio, static friction coefficient, and rolling friction coefficient of wheat grains, increased, while the elastic modulus and collision restitution coefficient decreased. As the moisture content increased, Poisson’s ratio of wheat grains increased. The increase in the moisture content improved the plastic deformation ability of wheat grains, resulting in an increase in lateral strain, thereby increasing Poisson’s ratio, which is similar to the findings of Qiu et al. [43]. With the increase in the moisture content, the static friction coefficient and rolling friction coefficient of wheat grains increased. The increase in moisture led to an increase in the adhesion of the wheat grain surface, which increased the static friction between the grains, and consequently, a greater resistance must be overcome when the wheat grains roll. In addition, the presence of moisture made the grain surface more moist and increased the surface roughness, thereby increasing the static friction coefficient and rolling friction coefficient. As the moisture content increased, the collision restitution coefficient and elastic modulus of the wheat grains decreased. The increase in moisture caused changes in the internal structure of the wheat grains, making them more susceptible to plastic deformation during the collision process. The presence of moisture increased the internal friction of the grains, resulting in more energy consumed during the collision process, thereby reducing the collision restitution coefficient and elastic modulus. This is consistent with previous research [44,45].
The measured stacking angles of wheat grains with different moisture contents are shown in Table 4.

Table 4.
The stacking angles of wheat grains with five different moisture contents.
According to Table 4, the stacking angle of the wheat grain increased with the increase in the moisture content. By using the origin nonlinear curve to fit the polynomial of the wheat grain moisture content and stacking angle, the moisture content–stacking angle model was obtained.
In the formula, R1 is the stacking angle of wheat grains, in °; x is the moisture content of the wheat grains, in %.
The model correlation coefficient is 0.9981, and the fitting curve is shown in Figure 17. With an increase in the moisture content, the surface adhesion of wheat grains increased and the fluidity weakened, so the stacking angle became larger. This observed trend aligns with the discrete element simulation study of the accumulation characteristics for rice seeds with different moisture contents [46].
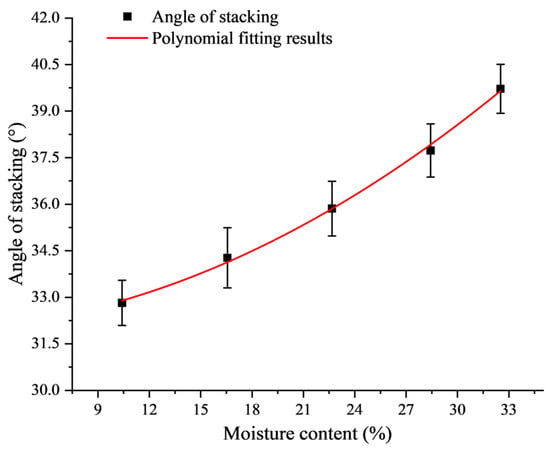
Figure 17.
Fitting curve of wheat grain moisture content and stacking angle.
3.3. Results of the Plackett–Burman Test
The Plackett–Burman test scheme and results are shown in Table 5. A variance analysis was conducted on the data using Design-Expert 13.0 software to evaluate the significance of each simulation parameter. As shown in Table 6, the coefficient of determination R2 was 0.9939, indicating that the regression model has statistical significance and can predict the trend of parameter changes. The static friction coefficient between wheat grains, the rolling friction coefficient between the wheat grains and steel plates, and the rolling friction coefficient between wheat grains were extremely statistically significant (p-value < 0.01), indicating that they greatly influence the simulated stacking angle. In contrast, the p values of the other simulation parameters all exceeded 0.05, indicating that they have no significant effect on the stacking angle. The static friction coefficient between wheat grains, the static friction coefficient between the wheat grains and steel plates, and the rolling friction coefficient between wheat grains were all positive. That is, the influencing factors of these three coefficients are the ascending path. Therefore, the three contact parameters that significantly influenced the simulation results were optimized using the steepest climbing test and the Box–Behnken test.

Table 5.
The Plackett–Burman test design and the corresponding results.

Table 6.
The significance analysis of the Plackett–Burman test parameters.
3.4. Results of the Steepest Climbing Test
As shown in Table 7, with the increase in the three test parameters, the relative error between the simulated wheat grain stacking angle and the actual angle first decreased and then increased. The parameter gradient was reduced from No. 1 to No. 3, the relative error was reduced to the minimum, and the absolute value of the relative error of the No. 3 test was the smallest. Hence, it can be inferred that the parameter region adjacent to No. 3 is optimal, so the parameters of this group were determined to be intermediate horizontal values. Consequently, No. 4 and No. 2 were designated as the positive and negative levels, respectively, to conduct the response surface simulation for the stacking angle.

Table 7.
The steepest climbing test design and the corresponding results.
3.5. Results of the Box–Behnken Test
Based on the results of the steepest climbing test, to obtain the optimal combination of different parameters, the relative error between the actual stacking angle and the simulated angle was used as the evaluation index. The design scheme and the corresponding results are shown in Table 8, and the factors X1, X2, and X3 are the static friction coefficient between wheat grains, the static friction coefficient between the wheat grain and steel plate, and the rolling friction coefficient between wheat grains, respectively.

Table 8.
The Box–Behnken test design and the corresponding results.
A diverse regression analysis of the Box–Behnken test parameters was conducted to derive the quadratic polynomial fitting equation for the correlation model between the stacking angle of the wheat grains and the discrete element parameters, given by
As exhibited in Table 9, the significance level of the regression model was less than 0.0001, and the coefficient of determination (R2) was 0.98, indicating that the model is highly significant. In addition, the insignificance of the lack of fit term further confirmed the accuracy of the model fitting. The model coefficient of variation (CV = 2.31%) indicates high experimental reliability, as lower CV values correspond to greater precision. Precision Adeq Precisior = 21.2519 > 4 indicates the reasonableness of the model.

Table 9.
The analysis of variance of the Box–Behnken experimental model.
By verifying the significance of the model (p < 0.05) and the insignificance of the lack of fit term (p > 0.05) and eliminating the non-significant influencing factors, an optimized mathematical model of the wheat grain stacking angle and discrete element parameters was established:
3.6. The Validation of the Stacking Angle and Discrete Element Parameter Model
The optimal combination of five sets of discrete element parameters was obtained by solving and optimizing the stacking angle of the five groups of wheat grains with different moisture contents. The optimal parameter combinations of the static friction coefficient between wheat grains, the static friction coefficient between the wheat grains and steel plates, and the rolling friction coefficient between wheat grains were calibrated with the Design-Expert software, as shown in Table 10.

Table 10.
Optimal values of the discrete element parameters of wheat grains with different moisture contents and verification test results.
Under the 22.67% moisture content condition, the comparison between the actual stacking angle of the wheat grains and the simulated angle is shown in Figure 18. It can be seen from the data in Table 10 that, after determining the optimal combination of the three significant discrete element parameters, the simulation was conducted based on the discrete element parameter model of the stacking angle. The relative error between the simulated stacking angle of the wheat grains and the physical test stacking angle under each moisture content was no more than 3.28%. This result proves that the established wheat grains stacking angle–discrete element parameter model has applicability and reliability, and that it can effectively determine the discrete element parameters.

Figure 18.
A comparison of the stacking angles between the wheat grain simulation test and physical test. (a) The simulation test stacking angle and (b) the physical test stacking angle.
3.7. Moisture Content–Discrete Element Parameter Model Construction and Verification
Based on the moisture content–stacking angle model and the stacking angle–discrete element parameter model, the moisture content and discrete element parameter model is derived from Equations (10) and (12). The moisture content–discrete element parameter model is as follows:
According to Formula (13), the wheat grain moisture content can be directly used to derive the target value of the discrete element parameter combination. This derivation process uses the model target value optimization solution function in Design-Expert software to effectively determine the optimal combination of discrete element parameters.
Based on the wheat grain moisture content–discrete element parameter model, the optimal combination of wheat grain discrete element parameters under the three groups of moisture contents was randomly selected. As shown in Figure 19, physical tests and simulation tests were carried out using the plate-pulling method to obtain the physical stacking angle and simulation stacking angle of the wheat grains [13,47]. Each group of tests was repeated five times, and the results are shown in Table 11.
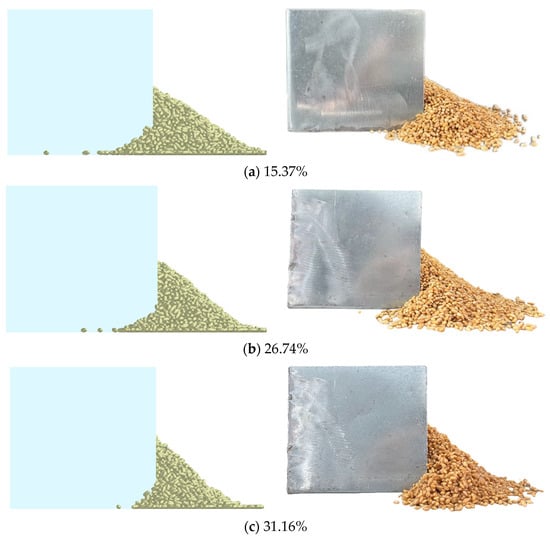
Figure 19.
The physical test and simulation test using the plate-pulling method. (a) 15.37%; (b) 26.74%; and (c) 31.16%.

Table 11.
Results of the simulation test and physical test using the extraction plate-pulling method.
As displayed in Table 11, the relative errors between the actual values and the simulated values in the three groups were all within 3.92%. This indicates that the established moisture content–discrete element parameter model is reliable.
The relative error between the wheat grain moisture content–discrete element parameter model and the stacking angle–discrete element parameter model was very close and small, thus proving the reliability of the model and indicating that the two models can be used for determining discrete element parameters. As another verification, the plate-pulling method can further determine the reliability of the model. Overall, the relative errors of the two models were small, indicating that the established wheat grain moisture content–discrete element parameter model and the stacking angle–discrete element parameter model can be used to predict discrete element parameters. However, the model is based on experimental data of only wheat grains, and its parameters and regression equations are derived from their physical and mechanical properties. For other types of cereals (such as corn, rice, etc.), the grain shape, size, and surface properties may be significantly different [10,22], so the model cannot be directly applied. This study targeted the wheat grain variety “Fengdechunmai No. 20”, and the model performed well with a high correlation coefficient. However, for other wheat grain varieties, the predictive ability of the model may decrease [13]. In this experiment, the moisture content of wheat grains was adjusted by soaking. Although this method can control the range of the moisture content, it may not fully simulate the moisture distribution of wheat grains under actual rainy weather conditions. In these conditions, each wheat grain may have a different moisture content, and this unevenness may affect the stacking behavior of the grains.
Combined with the research results of this study, the discrete element model can be coupled with computational fluid dynamics (CFD) [48,49] to simulate the interaction between materials and the airflow during dehumidification and optimize the structural parameters and the dehumidification process of the equipment. Although the model established in this paper applies to wheat grains with different moisture contents, its methods and ideas are universal and extensible to other types of grains. By measuring the physical properties of other grains, selecting appropriate contact models, and using similar experimental design methods for the parameter calibration, discrete element models of other grains can be established [50]. However, it should be noted that the physical properties and stacking characteristics of different grains vary, so when applying this model, it may be necessary to adjust and optimize it according to the specific situation [10,22,50].
4. Conclusions
- (1)
- Through physical experiments, the intrinsic parameters of wheat grains with five different moisture contents (10.41%, 16.56%, 22.67%, 28.43%, and 32.51%) as well as the static friction coefficient, rolling friction coefficient, and collision restitution coefficient between wheat grains and the steel plate and between grains were measured, and the relationship between the stacking angle and the moisture content of wheat grains was obtained. Based on the experimental data, a model of the stacking angle–moisture content at different moisture levels was established, and the model’s correlation coefficient R2 was 0.9981.
- (2)
- By combining the Plackett–Burman test and the steepest climbing test, the significant discrete element parameters of wheat grains with moisture contents in the range of 10.41~32.51% and their optimal intervals were determined: the static friction coefficient between wheat grains was 0.35~0.65, the static friction coefficient between wheat grains and the steel plate was 0.45~0.75, and the rolling friction coefficient between wheat grains was 0.03~0.09. The Box–Behnken test was used to establish a quadratic regression model between the moisture content of wheat grains and the discrete element parameters. The results of the variance analysis indicated that the model’s p < 0.0001 and the lack of fit term were not significant. The relative errors of the physical stacking angle and the simulated stacking angle of wheat grains were verified by the cylinder lifting method and were less than or equal to 3.28%.
- (3)
- Based on the moisture content–stack angle model and the stack angle–discrete element parameter model, a moisture content–discrete element parameter model was constructed. The relative error between the physical stack angle and the simulated stack angle of wheat grains was verified with the plate-pulling method and was less than or equal to 3.92%. This method has high versatility in calibrating the discrete element parameters of wheat grains under different moisture contents.
In summary, this study determined the DEM parameters required for the mechanized dehumidification process of high-moisture wheat grains and conducted the discrete element simulation modeling of these grains. The findings of this study fill the current research gap on DEM parameters and models of high-moisture wheat grains and provide an important reference for applying the discrete element calibration method to high-moisture wheat and other crop grains and for the optimal design of emergency rapid dehumidification equipment for high-moisture wheat grains.
Author Contributions
Conceptualization, H.L. and G.G.; methodology, H.L. and G.G.; validation, G.G., J.L. and H.C.; formal analysis, G.G., L.X. and H.C.; resources, H.L.; data curation, G.G.; writing—original draft preparation G.G.; writing—review and editing, L.X. and G.C.; supervision, H.L. and G.C.; project administration, H.L. and G.C.; funding acquisition, H.L. and G.C. All authors have read and agreed to the published version of the manuscript.
Funding
Major Scientific and Technological Projects in Henan Province (241100110300), the National Modern Agricultural Industrial Technology System Project (CARS-04-PS28), and the Henan Province Science and Technology Research Project (242102111175).
Institutional Review Board Statement
Not applicable.
Data Availability Statement
The data used to support the results of this study are available from the corresponding authors upon request.
Acknowledgments
The authors would like to express their sincere gratitude to their colleges and laboratories and to the reviewers who provided helpful suggestions for this manuscript.
Conflicts of Interest
The authors declare no conflicts of interest.
References
- Yang, Y.; Yao, C.; Liu, W. Spatio-temporal evolution characteristics and driving factors of food security system transformation in China. Acta Geogr. Sin. 2024, 79, 2372–2388. [Google Scholar] [CrossRef]
- Kim, Y.U.; Webber, H.; Adiku, S.G.K. Mechanisms and modelling approaches for excessive rainfall stress on cereals: Waterlogging, submergence, lodging, pests and diseases. Agric. For. Meteorol. 2023, 344, 109819. [Google Scholar] [CrossRef]
- Yang, S.; Chen, Z.; Huang, X. The impact of global warming on hydrological cycle: Retrospect and prospect. Quat. Sci. 2024, 44, 1079–1092. [Google Scholar] [CrossRef]
- FAO. Tracking Progress on Food and Agriculture-Related SDG Indicators; FAO: Rome, Italy, 2023. [Google Scholar] [CrossRef]
- Zeng, Z.; Ma, X.; Cao, X. Critical Review of Applications of Discrete Element Method in Agricultural Engineering. Trans. Chin. Soc. Agric. Mach. 2021, 52, 1–20. [Google Scholar] [CrossRef]
- Li, L. Research progress and prospects of DEM in agricultural engineering application. J. Chin. Agric. Mech. 2015, 36, 345–348. [Google Scholar] [CrossRef]
- Yu, Q.; Liu, Y.; Chen, X. Calibration and Experiment of Simulation Parameters for Panax notoginseng Seeds Based on DEM. Trans. Chin. Soc. Agric. Mach. 2020, 51, 123–132. [Google Scholar] [CrossRef]
- Ma, W.; You, Y.; Wang, D. Parameter Calibration of Alfalfa Seed Discrete Element Model Based on RSM and NSGA-Ⅱ. Trans. Chin. Soc. Agric. Mach. 2020, 51, 136–144. [Google Scholar] [CrossRef]
- Wu, M.; Cong, J.; Yan, Q. Calibration and experiments for discrete element simulation parameters of peanut seed particles. Trans. Chin. Soc. Agric. Eng. 2020, 36, 30–38. [Google Scholar] [CrossRef]
- Wang, M.; Wang, Z.; Yang, L. Calibration of discrete element model parameters for maize kernel based on response surface methodology. J. South China Agric. Univ. 2018, 39, 111–117. [Google Scholar] [CrossRef]
- Zhang, S.; Zhang, R.; Chen, T. Calibration of Simulation Parameters of Mung Bean Seeds Using Discrete Element Method and Verification of Seed-metering Test. Trans. Chin. Soc. Agric. Mach. 2022, 53, 71–79. [Google Scholar] [CrossRef]
- Zhu, K.; Hui, Y.; Zhou, Y. Construction of Wheat Grain Model and Calibration of Discrete Element Parameters Based on X-Ray Tomography. J. Chin. Cereals Oils 2022, 37, 218–223. [Google Scholar]
- Liu, F.; Zhang, J.; Li, B. Calibration of parameters of wheat required in discrete element method simulation based on repose angle of particle heap. Trans. Chin. Soc. Agric. Eng. 2016, 32, 247–253. [Google Scholar] [CrossRef]
- Wang, X.; Wu, W.; Jia, H. Calibration of discrete element parameters for simulating wheat crushing. Food Sci. Nutr. 2023, 11, 7751–7764. [Google Scholar] [CrossRef] [PubMed]
- Sugirbay, A.; Hu, G.; Chen, J. A study on the calibration of wheat seed interaction properties based on the discrete element method. Agriculture 2022, 12, 1497. [Google Scholar] [CrossRef]
- Horabik, J.; Wiącek, J.; Parafiniuk, P. Calibration of discrete-element-method model parameters of bulk wheat for storage. Biosyst. Eng. 2020, 200, 298–314. [Google Scholar] [CrossRef]
- Sun, K.; Yu, J.; Liang, L. A DEM-based general modelling method and experimental verification for wheat seeds. Powder Technol. 2022, 401, 117353. [Google Scholar] [CrossRef]
- Lu, C.; Gao, Z.; Li, H. An ellipsoid modelling method for discrete element simulation of wheat seeds. Biosyst. Eng. 2023, 226, 1–15. [Google Scholar] [CrossRef]
- Chen, Z.; Wassgren, C.; Veikle, E. Determination of material and interaction properties of maize and wheat kernels for DEM simulation. Biosyst. Eng. 2020, 195, 208–226. [Google Scholar] [CrossRef]
- Liu, Y. Simulation of Hot Air Drying Characteristics and Heat Mass Transfer in High Moisture Wheat. Master’s Thesis, Henan University of Technology, Zhengzhou, China, 2023. [Google Scholar]
- Zhang, G.; Chen, L.; Liu, H. Calibration and experiments of the discrete element simulation parameters for water chestnut. Trans. Chin. Soc. Agric. Eng. 2022, 38, 41–50. [Google Scholar] [CrossRef]
- Zhang, R.; Jiao, W.; Zhou, J. Parameter Calibration and Experiment of Rice Seeds Discrete Element Model with Different Filling Particle Radius. Trans. Chin. Soc. Agric. Mach. 2020, 51, 227–235. [Google Scholar] [CrossRef]
- Liu, R.; Li, Y.; Liu, Z. Analysis and Calibration of Discrete Element Parameters of Coated Maize Seed. Trans. Chin. Soc. Agric. Mach. 2021, 52, 1–8. [Google Scholar] [CrossRef]
- Yang, Z.; Li, G.; Shi, L. Determination of the coefficient of static friction of maize seeds and validation of the discrete element method. J. Chin. Agric. Mech. 2023, 44, 12–16. [Google Scholar] [CrossRef]
- Chen, X.; Bai, J.; Wang, X. Calibration and Testing of Discrete Elemental Simulation Parameters for Pod Pepper Seeds. Agriculture 2024, 14, 831. [Google Scholar] [CrossRef]
- Fan, J.; Wang, H.; Sun, K. Experimental verification and simulation analysis of a multi-sphere modelling approach for wheat seed particles based on the discrete element method. Biosyst. Eng. 2024, 245, 135–151. [Google Scholar] [CrossRef]
- Wang, L.; Wu, B.; Wu, Z. Experimental determination of the coefficient of restitution of particle-particle collision for frozen maize grains. Powder Technol. 2018, 338, 263–273. [Google Scholar] [CrossRef]
- Li, X.; Zhang, W.; Xu, S. Calibration of Collision Recovery Coefficient of Corn Seeds Based on High-Speed Photography and Sound Waveform Analysis. Agriculture 2023, 13, 1677. [Google Scholar] [CrossRef]
- Marinack, M.; Musgrave, R.; Higgs, C. Experimental investigations on the coefficient of restitution of single particles. Tribol. Trans. 2013, 56, 572–580. [Google Scholar] [CrossRef]
- Hamzah, M.; Beakawi, A.; Omar, S. A review on the angle of repose of granular materials. Powder Technol. 2018, 330, 397–417. [Google Scholar] [CrossRef]
- Müller, D.; Fimbinger, E.; Brand, C. Algorithm for the determination of the angle of repose in bulk material analysis. Powder Technol. 2021, 383, 598–605. [Google Scholar] [CrossRef]
- Wang, S.; Yu, Z.; Zhang, W. Study on the modeling method of sunflower seed particles based on the discrete element method. Comput. Electron. Agric. 2022, 198, 107012. [Google Scholar] [CrossRef]
- Fraczek, J.; Zlobecki, A.; Zemanek, J. Assessment of angle of repose of granular plant material using computer image analysis. J. Food Eng. 2007, 83, 17–22. [Google Scholar] [CrossRef]
- Jia, F.; Han, Y.; Liu, Y. Simulation prediction method of repose angle for rice particle materials. Trans. Chin. Soc. Agric. Eng. 2014, 30, 254–260. [Google Scholar] [CrossRef]
- Li, X.; Wang, Y.; Yang, K. Numerical study of heat and mass transfer during drying process of barley grain piles based on the pore scale. J. Food Process Eng. 2023, 46, 11. [Google Scholar] [CrossRef]
- Petingco, M.; Married, M.; Maghirang, R. Discrete element method simulation of wheat bulk density as affected by grain drop height and kernel size distribution. J. ASABE 2022, 65, 555–566. [Google Scholar] [CrossRef]
- Liao, Y.; You, Y.; Wang, D. Parameter Calibration and Experiment of Discrete Element Model for Mixed Seeds of Oat and Arrow Pea. Trans. Chin. Soc. Agric. Mach. 2022, 53, 14–22. [Google Scholar] [CrossRef]
- Zhou, H.; Li, K.; Qin, Z. Discrete Element Model of Oil Peony Seeds and the Calibration of Its Parameters. Agriculture 2024, 14, 1092. [Google Scholar] [CrossRef]
- Zhong, J.; Tao, L.; Li, S. Determination and interpretation of parameters of double-bud sugarcane model based on discrete element. Comput. Electron. Agric. 2022, 203, 107428. [Google Scholar] [CrossRef]
- Zhou, B.; Zuo, Y.; Hou, L. Parameter Calibration of Xinjiang Paperbark Walnut Kernels by Discrete Element Simulation. Agriculture 2023, 13, 353. [Google Scholar] [CrossRef]
- Al-Mahasneh, M.; Rababah, T. Effect of moisture content on some physical properties of green wheat. J. Food Eng. 2007, 79, 1467–1473. [Google Scholar] [CrossRef]
- Yao, S.; Mou, H.; Du, G. Water Imbibition and Germination of Wheat Seed with Nuclear Magnetic Resonance. Trans. Chin. Soc. Agric. Mach. 2015, 46, 266–274. [Google Scholar] [CrossRef]
- Qiu, S.; Yuan, X.; Guo, Y. Effects of variety and moisture content on mechanical properties of millet grain group. Trans. Chin. Soc. Agric. Eng. 2019, 35, 322–326. [Google Scholar] [CrossRef]
- Wang, J.; Xu, C.; Xu, Y. Influencing Factors Analysis and Simulation Calibration of Restitution Coefficient of Rice Grain. Appl. Sci. 2021, 11, 5884. [Google Scholar] [CrossRef]
- Jiang, M.; Chen, G.; Liu, C. Effects of moisture content on elastic-plastic properties of bulk wheat. Trans. Chin. Soc. Agric. Eng. 2020, 36, 245–251. [Google Scholar] [CrossRef]
- Wang, J.; Xu, C.; Qi, X. Discrete element simulation study of the accumulation characteristics for rice seeds with different moisture content. Foods 2022, 11, 295. [Google Scholar] [CrossRef]
- Coetzee, C.J. Calibration of the discrete element method and the effect of particle shape. Powder Technol. 2016, 297, 50–70. [Google Scholar] [CrossRef]
- Chen, P.; Wang, X.; Fan, M. Simulation study of moisture and heat migration during hot air drying of corn with stacked structures based on CFD-DEM. J. Stored Prod. Res. 2025, 112, 102627. [Google Scholar] [CrossRef]
- Yang, K.; Li, X.; Wang, Y. CFD-DEM Simulation Study on Heat and Mass Transfer of Wheat Particles in Gas–Solid Fluidized Bed. J. Food Process Eng. 2025, 45, 70036. [Google Scholar] [CrossRef]
- Bai, J.; Xie, B.; Yan, J. Moisture content characterization method of wet particles of brown rice based on discrete element simulation. Powder Technol. 2023, 428, 118775. [Google Scholar] [CrossRef]
Disclaimer/Publisher’s Note: The statements, opinions and data contained in all publications are solely those of the individual author(s) and contributor(s) and not of MDPI and/or the editor(s). MDPI and/or the editor(s) disclaim responsibility for any injury to people or property resulting from any ideas, methods, instructions or products referred to in the content. |
© 2025 by the authors. Licensee MDPI, Basel, Switzerland. This article is an open access article distributed under the terms and conditions of the Creative Commons Attribution (CC BY) license (https://creativecommons.org/licenses/by/4.0/).