Article

The Effect of Agricultural Mechanization Services on the Technical Efficiency of Cotton Production

1
College of Science, Shihezi University, Shihezi 832000, China
2
College of Marxism, Shihezi University, Shihezi 832000, China
3
Border Development and Security Governance Research Institute, Shihezi University, Shihezi 832000, China
4
National Ethnic Affairs Commission Shihezi University Research Base for the Chinese National Community, Shihezi University, Shihezi 832000, China
5
College of Economics and Management, Xinjiang Agricultural University, Urumchi 830000, China
*
Author to whom correspondence should be addressed.
Agriculture 2025, 15(11), 1233; https://doi.org/10.3390/agriculture15111233
Submission received: 27 April 2025 / Revised: 4 June 2025 / Accepted: 4 June 2025 / Published: 5 June 2025
(This article belongs to the Section Agricultural Economics, Policies and Rural Management)

Abstract

As the process of agricultural modernization accelerates, exploring the impact of agricultural mechanization services on production technology efficiency has become a key issue for enhancing agricultural productivity and promoting sustainable agricultural development. The study focuses on cotton growers in the Tarim River Basin and systematically explores the impact and driving mechanisms of agricultural mechanization services (AMSs) on cotton production’s technical efficiency within the framework of the social–ecological system (SES). By employing a combination of stochastic frontier analysis (SFA) and propensity score matching (PSM), the research indicates that the adoption of AMSs significantly enhances the production technical efficiency of cotton farmers. Among the sample that adopted this service, as much as 53.04% of the farmers have their production efficiency within the range of [0.8, 0.9], demonstrating a high production capability. In contrast, the production efficiency values of the farmers who did not adopt such services are more dispersed, with inefficient samples accounting for 11.48%. Furthermore, while the technical efficiency levels across different regions are similar, there are significant efficiency differences within regions. A further analysis indicates that the age of the household head, their education level, the number of agricultural laborers in the family, the proportion of income from planting, and irrigation convenience have a positive impact on farmers’ adoption of AMSs, while the degree of land fragmentation has a negative impact. Therefore, AMSs are not only a core pathway to enhance cotton production’s technical efficiency but also an important support for promoting agricultural modernization in arid areas and strengthening farmers’ risk-resistance capabilities. Future policies should focus on optimizing service delivery, enhancing technical adaptability, and promoting regional collaboration to drive the high-quality development of the cotton industry and support sustainable rural revitalization.

1. Introduction

Against the backdrop of continuous global population growth and the rising demand for agricultural products, improving agricultural production efficiency has become a key issue related to food security, economic development, and social stability. As a fundamental industry for human survival and development, the enhancement of agricultural production efficiency not only concerns the stable supply of agricultural products but also has far-reaching implications for the sustainable development of the global economy. In a significant agricultural nation like China, cotton is a vital economic crop that has a direct impact on farmers’ incomes and the overall national economy. The Tarim River Basin, being the largest inland river basin in China, serves as a primary cotton production area in Xinjiang and is also a crucial cotton supply source for both the country and the world [1]. However, with the development of the socio-economic landscape and changes in the population structure, the Tarim River Basin is facing issues such as labor shortages, the expansion of agricultural scale, and rising production costs. These problems severely restrict the sustainable development of the local cotton industry [2]. AMSs, as a new type of agricultural service mechanism, demonstrate significant advantages in unleashing agricultural production’s potential, alleviating labor pressure, and promoting the intensive allocation of production factors [3,4,5]. By providing professional agricultural machinery and technical services, AMSs can not only effectively address the issue of labor shortages but also promote the mechanization and intelligence of agricultural production, thereby enhancing the yield and quality of crops [6,7,8].

1.1. Literature Review

Currently, there has been considerable research in academia on a AMSs and the efficiency of agricultural production technology. In the early 21st century, researchers, such as Xu and Lu [9], posited that AMSs represent a significant practical avenue for enhancing the internal division of labor and specialization within agricultural production. The fundamental value of these services lies in their ability to stabilize the household contracting management system, thereby facilitating increased production and income for farmers, while simultaneously expediting the advancement and modernization of agricultural technologies. Furthermore, AMSs offer farmers alternative solutions for mechanization upgrades, beyond the self-purchase of agricultural machinery, thereby broadening the viable pathways for small-scale operators to engage with modern agricultural development [10,11]. Technical efficiency in agricultural production refers to the capacity of agricultural producers to transform diverse production inputs into tangible outputs of specific crops by utilizing technology. It serves as an indicator of the disparity between the actual level of output achieved and the target output established within the theoretical context of the production function [12]. Current methodologies for evaluating agricultural production efficiency can be classified into two primary categories: parametric models and non-parametric models. The parametric models predominantly utilize stochastic frontier analysis (SFA) as a fundamental instrument. Researchers, including Yangchen et al., Muhamad et al., and Zhong et al., have engaged in empirical investigations concerning production technology efficiency utilizing this framework [13,14,15]. Non-parametric models rely on Data Envelopment Analysis (DEA) to construct evaluation systems. Scholars, such as Fuksová et al., Boakye et al., and Aslam et al., have used Data Envelopment Analyses to calculate the production technical efficiency of farmers [16,17,18].
The prevailing perspective in contemporary research regarding the influence of AMSs on the efficiency of agricultural production posits that such services contribute positively to enhancing production efficiency. Research in China mainly focuses on the direct enhancement of production efficiency through agricultural mechanization services via pathways such as technological advancement, resource allocation optimization, and cost reduction [19,20,21]. This effect is particularly pronounced when combined with moderate-scale operations [22,23]. Research has also shown that mechanized services significantly improve productivity on farms in northern China through the labor substitution effect. However, this positive impact exhibits diminishing returns among operators lacking their own capital equipment, revealing the dependence of mechanized service effectiveness on supporting resources [24]. Further studies have found that the level of the agricultural machinery service supply and its utilization efficiency are key variables affecting the effectiveness of technology adoption. Liu and Li [25] confirmed, through a dual-perspective model of production capacity and production efficiency, that both the expansion of the agricultural machinery service supply and the increase in the service utilization per acre have a significant positive effect on grain production efficiency. This provides a theoretical basis for addressing the challenges of mechanization under the constraints of fragmented land. Overall, Chinese research generally agrees on the positive impact of agricultural mechanization services on agricultural production efficiency and emphasizes its important role in promoting high-quality agricultural development. This finding is inherently consistent with conclusions from international research. In developing countries, empirical evidence from Ethiopia shows that mechanization can improve the economic efficiency of wheat producers by 37–49% [8]; research in Myanmar reveals the multiple benefits of mechanization in labor substitution, risk management, and reducing harvest losses [11]. Cases from countries in Southeast Asia, such as Vietnam, indicate that the synergy between land consolidation and mechanization not only enhances agricultural productivity but also facilitates the transfer of labor to non-agricultural sectors [26]. Studies in African countries, like Nepal and Tanzania, further confirm that innovations in mechanization service models have a positive impact on farm income growth [27,28]. Research in developed countries, like the United States, focuses on the complex impact mechanisms of mechanization on the labor market, revealing that mechanization can both substitute for and complement labor [29]. However, some scholars hold differing views on the impact of agricultural mechanization service levels on production efficiency, suggesting that agricultural mechanization services may hinder the improvement of production efficiency. Tingley et al. [30] conducted an empirical analysis using a random frontier production function model with panel data and found that as the level of agricultural mechanization services increases, production efficiency actually decreases. Yang et al. [31] believe that land fragmentation increases the costs of grain production and management, which is not conducive to large-scale farming. Under the condition of land fragmentation, agricultural mechanization services face challenges, such as difficulty in implementing machinery operations and inconvenience in operations, which suppresses the efficiency of grain production. These cross-national pieces of evidence collectively indicate that the economic benefits of agricultural mechanization are not only reflected in the improvement of productivity but also promote rural transformation and development through optimized resource allocation, adjustments in labor structure, and the extension of industrial chains. This provides an important international comparative perspective for this study.

1.2. Research Hypothesis

There has been a continuous discourse surrounding AMSs and the efficiency of production technology, which offers significant theoretical support and a practical foundation for research advancement. However, previous research has only examined the relationship between the two from a single dimension or simple system, failing to place them within a broader socio-economic system for investigation. The theoretical framework still needs further expansion. The SES framework serves as a holistic analytical tool that can encompass resource units and systems (including farmland and agricultural machinery), governance structures (such as policies and market regulations), users (such as farmers and service organizations), and their interactions. This approach facilitates the elucidation of multi-level feedback mechanisms inherent in complex systems [32,33]. AMSs serve as a crucial intermediary between resource systems and users, significantly impacting the efficiency of production technologies [20,34]. Through the SES framework, it becomes clearer how agricultural machinery services influence production efficiency under different governance structures and social contexts and how these factors, in turn, affect the services. This makes it possible to identify key factors for improving efficiency and potential obstacles. Examining AMSs and production technology efficiency within the SES framework not only helps deepen the understanding of agricultural production but also promotes the optimal allocation of resources and the sustainable development of the socio-economic environment, thereby enabling the formulation of more precise and effective policies and measures.
In light of this context, the article posits the following research hypothesis: The adoption of agricultural mechanization services is not a random occurrence; rather, it is shaped by a variety of factors, including the individual characteristics of farmers, the resource endowments of their families, and the institutional environments of their respective regions. Furthermore, this adoption behavior exerts a significant positive influence on the actual technical efficiency of cotton production. However, given that the individuals utilizing agricultural mechanization services do not constitute a random sample, the decision of farmers to engage with these services is often closely linked to their specific operational circumstances, land size, educational attainment, and other relevant factors, all of which may also impact the technical efficiency of cotton production. This bidirectional relationship may give rise to an endogeneity issue stemming from “self-selection”, indicating that farmers’ decisions regarding agricultural machinery services are interconnected with both technical efficiency and the error term of the model. Consequently, traditional linear regression methodologies may struggle to accurately estimate the true effects of these variables.
Therefore, this study aims to construct a comprehensive analytical system that includes farmer characteristics, resource conditions, and institutional environments, based on field survey data from cotton growers in the Tarim River Basin, by introducing the social–ecological systems (SES) framework. It will use a stochastic frontier analysis (SFA) to measure the production technical efficiency of cotton farmers and combine it with Propensity Score Matching (PSM) to mitigate any endogeneity bias caused by non-random selection. Through a scientifically designed methodology, this study seeks to accurately identify the actual impact pathways and the effect intensity of agricultural mechanization services on cotton production’s technical efficiency, thereby providing empirical evidence and policy recommendations for optimizing the agricultural mechanization service system and enhancing agricultural production efficiency.

2. Materials and Methods

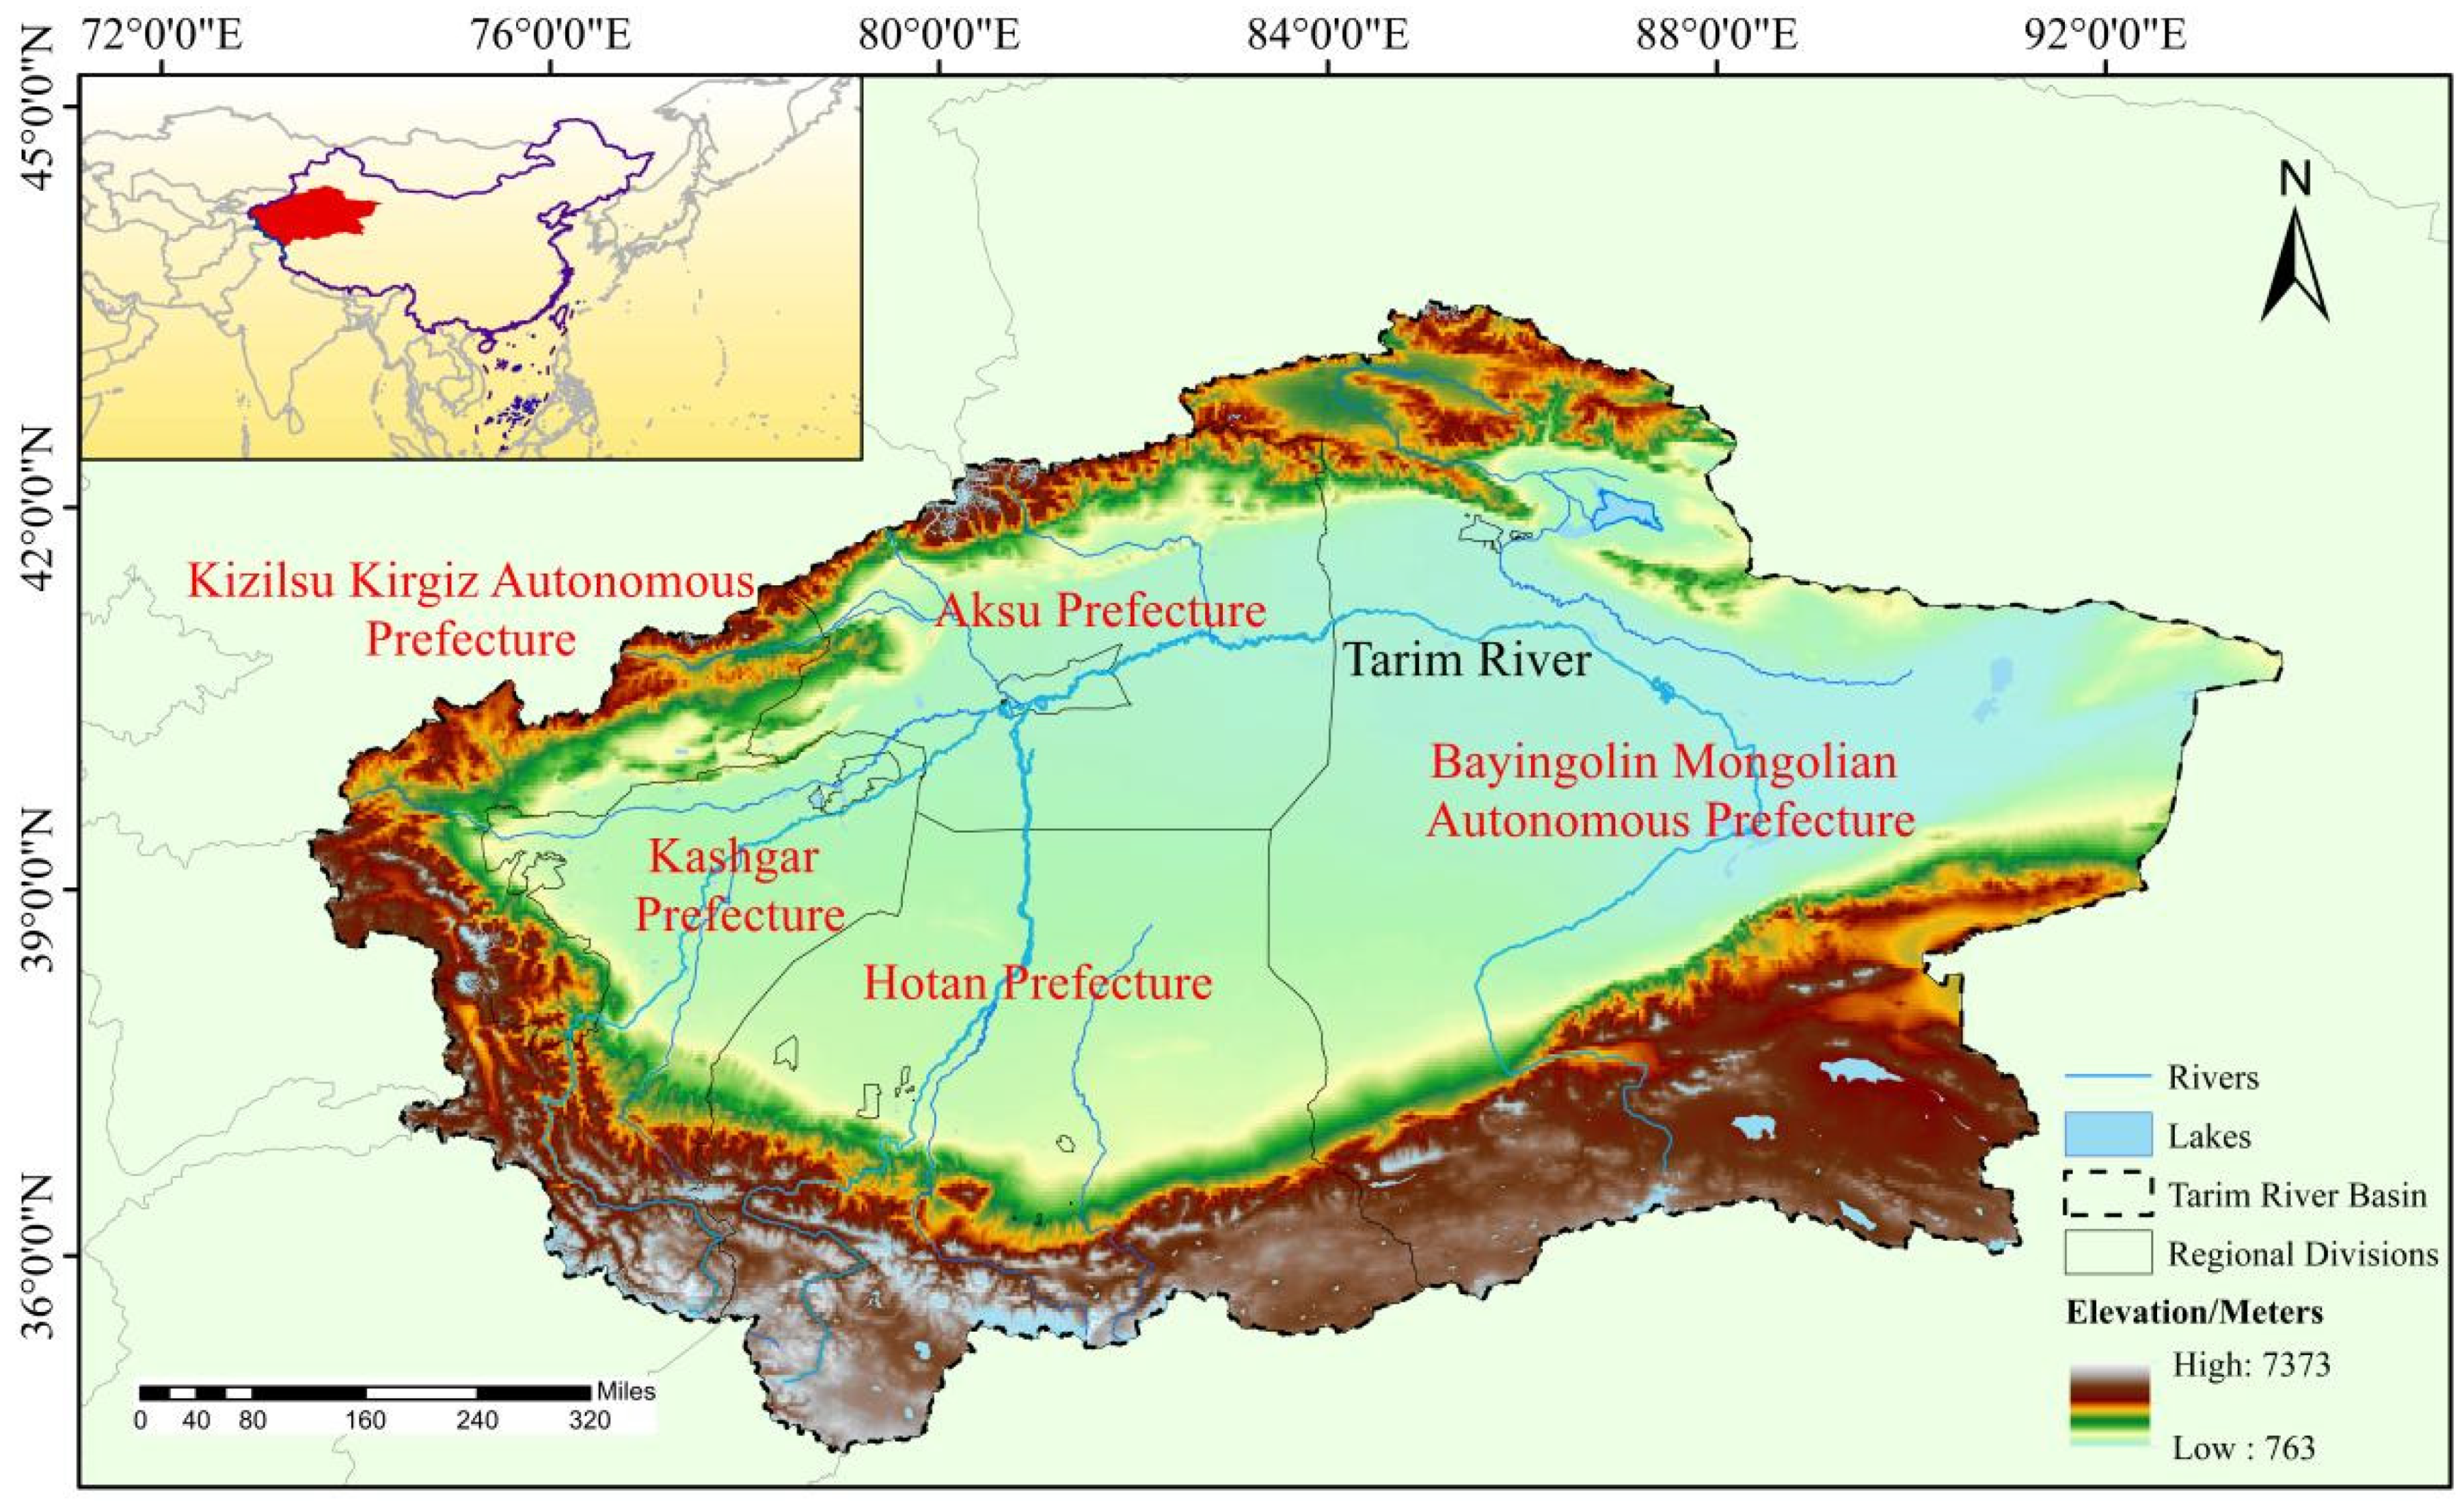
2.1. Description of the Study Area

The Tarim River Basin is located in the southern part of Xinjiang and is the largest inland river basin in China, covering an area of approximately 1.07 × 10⁶ km2 [35]. It spans across administrative regions such as the Bayingolin Mongolian Autonomous Prefecture, Aksu Prefecture, and Kashgar Prefecture [36]. This basin is deep within the Eurasian continent, making it difficult for oceanic moisture to reach, resulting in a typical temperate arid and semi-arid climate with an average annual precipitation of about 120 mm [37]. However, by relying on the meltwater from the snow and ice of the Tianshan and Kunlun mountain ranges, it has formed a unique oasis irrigation agricultural system, earning it the titles of “China’s Cotton Warehouse” and the “Pearl of the Silk Road” [1,38]. As an important national base for high-quality cotton production, the cotton planting area in the Tarim River Basin remains stable at over 15 million acres annually, accounting for more than 30% of the country’s total cotton output [39]. Its long-staple cotton is renowned worldwide and is a core pillar of Xinjiang’s agricultural economy [40].
In recent years, the Tarim River Basin has experienced significant advancements in AMSs, driven by national policy support and strategies aimed at agricultural modernization. The establishment of various agricultural machinery cooperatives within the basin has led to the creation of a comprehensive service system that encompasses the entire agricultural process, including plowing, planting, management, and harvesting. These services extend beyond the provision of advanced agricultural machinery; they also encompass technical training, market information, and additional resources, thereby effectively assisting farmers in optimizing their resource allocation. The promotion of AMSs has not only facilitated the rapid development of the cotton industry in the basin but also provided core support for building a modern agricultural production system and achieving sustainable development goals (Figure 1).

2.2. Data Sources

The study aims to measure the efficiency of farmers in production technology from a micro perspective. Given the availability and the ease-of-processing of the data, cotton production’s technical efficiency has been selected as the research subject. The data for this study comes from an in-depth field survey conducted in May 2023 in the Tarim River Basin, covering several major cotton-producing areas, such as Aksu, Kashgar, and Hotan. It also includes representative cities, such as the Bayingolin Mongolian Autonomous Prefecture and Kizilsu Kirgiz Autonomous Prefecture, as well as several representative cities, such as Alaer, Tumushuke, and Kunyu, to ensure the comprehensiveness and regional diversity of the data. This research is not conducted in isolation but is based on thorough preparatory work done in advance. In fact, since 2021, the research team has been continuously monitoring the agricultural production situation in the Tarim River Basin. Each year, they conduct various scales of research activities in the region, continuously accumulating experience and optimizing the research methodology and content. The survey questionnaire has undergone three rounds of iterative optimization, laying a solid foundation for this in-depth and comprehensive field research.
The study utilized a structured-questionnaire-guided field interview approach for data collection, with the questionnaires being completed exclusively by researchers who had received systematic training. The design of the questionnaire adhered to rigorous standards: firstly, it ensured that the questions were closely aligned with the research objectives and could directly or indirectly capture the agricultural production conditions of the village and its farmers; secondly, it aimed to employ objective indicators to the greatest extent possible in order to minimize the impact of subjective factors; and thirdly, the questions were articulated clearly and unambiguously to enhance comprehension and facilitate accurate responses from the farmers.
Given the disparities in economic characteristics among farmers and the variations in land resource endowments across different administrative levels, we employed a methodology that integrates both simple random sampling and stratified random sampling to enhance the representativeness of our sample and mitigate regional biases. Considering that the subjects of this survey are mainly family farms, and there is currently no complete statistical data on the number, operating scale, and level of the agricultural modernization of family farms in various regions within the area, we divided the watershed into three typical regions based on existing agricultural development characteristics and field research experience: the upstream mountainous runoff area, the midstream alluvial fan oasis, and the downstream desert edge. Each region has certain typical characteristics and differences in terms of natural conditions, water resource utilization efficiency, and cotton planting patterns. On this basis, we randomly selected a total of 10 counties across the entire watershed, covering the main cotton-producing areas in the upstream, midstream, and downstream regions. Subsequently, in each selected county, we further randomly selected 2 to 4 townships based on the cotton planting area and the concentration of farmers in the townships. Finally, within the selected townships, we randomly selected 1 to 3 villages to conduct the questionnaire survey.
The questionnaire was designed to gather data on various aspects, including the individual characteristics of farmers, basic family demographics, land utilization and agricultural production conditions, and daily consumption expenditures, as well as fundamental information regarding behavioral decision-making and participation in social governance. A total of 534 questionnaires were distributed in this survey, and all 534 were returned, resulting in a response rate of 100%. After screening based on relevant indicators, samples from households that had completely transferred their land or were unclear about their cotton production situation were excluded. The final number of questionnaires included in this study is 496. To ensure the scientific validity of the measurement tools, the study verified the quality of the questionnaire through a two-stage test: (1) In terms of validity, an exploratory factor analysis was conducted on the questionnaire, showing a KMO value of 0.789, which is between 0.7 and 0.9, and the Bartlett’s test of sphericity was significant at 0, indicating that the validity of the questionnaire is good. (2) In terms of reliability, the Cronbach’s α coefficient of the questionnaire was 0.812, with each dimension’s α value being above 0.7, indicating that the reliability of the questionnaire is relatively dependable.

2.3. Research Methods

2.3.1. Stochastic Frontier Analysis

In the context of scholarly research on technical efficiency, production technical efficiency is characterized as the ratio of the actual output to the theoretical optimal output boundary, given the constraints of established production factor inputs utilized by farmers [41,42]. To examine the input–output relationship of the cotton yield per unit area, this study conceptualizes technical efficiency from an output-oriented perspective and identifies the following variables: the output variable is defined as the cotton yield (Y, kg/hm2), while the input variables encompass the seed input (S, CNY/hm2), chemical input (C, CNY/hm2), mechanical input (M, CNY/hm2), irrigation water input (W, yuan/hm2), and labor input (L, person·d/hm2).
The production function for the i-th farmer is represented as follows:
Y i = f ( S i , C i , M i , W i , L i , β ) e v i u i ( i = 1 , 2 , 3 , , N )
In the equation, f() represents the production function; β is the parameter to be estimated; vi is regarded as a random error term used to capture external factors that farmers cannot directly control, as well as potential measurement errors; ui represents the loss in production technical efficiency, with ui ≥ 0 used to measure the gap between the actual production efficiency and the ideal state; and N is the total sample size.
When ui = 0, it indicates that the production technology is at an effective level. The output level at this time is represented by Y i * ; that is,
Y i * = f ( S i , C i , M i , W i , L i , β ) e v i ( i = 1 , 2 , 3 , , N )
According to the definition of technical efficiency, production technical efficiency refers to
T E i = Y i Y i * = e u i
The setting of the production function typically includes the Cobb–Douglas (C-D) function and the transcendental logarithmic (Translog) function. The C-D function is characterized by its simple exponential structure, while the Translog function achieves a more flexible capture of factor interaction effects through quadratic terms [43]. Considering the key issues studied in this paper and in conjunction with the research conclusions by Taylor et al. [44] and Kopp et al. [45], which suggest that the C-D function can represent a general production function and that the form of the production function setting has almost no impact on the accuracy of technical efficiency results, this paper chooses the C-D production function to construct the stochastic production frontier. The specific form of the frontier production function for the i-th farmer is as follows:
Y i = e θ 0 · W i θ w · S i θ 1 · C i θ 2 · M i θ 3 · L i θ 4 · e v i u i
In the formula,   θ 0 ,   θ 1 , θ 2 , θ 3 , θ 4 , θ w are parameters to be estimated.

2.3.2. Propensity Score Matching Method

PSM is based on a counterfactual inference model and is primarily used to assess treatment effects. It simulates the effects of a randomized controlled trial by matching individuals in the treatment group and the control group who have similar propensity scores, thereby reducing any selection bias and estimating causal effects [46]. When studying the impact of AMSs on the technical efficiency of cotton production, there may be a “selection bias” due to the different initial endowments of farmers in the experimental group (those who adopted the services) and the control group (those who did not adopt the services). The application of PSM can more effectively analyze whether the technical efficiency of cotton production among farmers in the experimental group is consistent with that of farmers who did not adopt AMSs, thereby minimizing the estimation bias caused by the non-random allocation of samples.
The expression for the PSM model is as follows:
P ( X i ) = P r ( W i = 1 / X i ) = e x p ( Z i ) 1 + e x p ( Z i )
In Equation (5), W i represents the intervention status of the i-th sample data (W = 1 indicates experimental status, W = 0 indicates control status); e x p ( · ) /[ 1 + e x p ( · ) ] represents the logit cumulative distribution function, Z i = β 1 + β 2 X i , where X i denotes the matching vector variable, and β 1 β 2 represents the vector regression parameters. By taking the logarithm of Equation (2), we can obtain the following logit model:
L i = ln ( P i 1 P i ) = Z i = β 1 + β 2 X i
By using the logit regression method, the parameter estimates for β 1 and β 2 in Equation (6) can be calculated. These estimates can then be substituted into Equation (5) to estimate the propensity score for each cotton farmer i (the predicted probability of accepting the intervention). To ensure the reliability of the conclusions, four matching methods are employed. By matching the propensity scores, the balance of the matching quality can be ensured, which in turn allows for the calculation of the average treatment effect of the treatment group (ATT). The specific model is as follows:
A T T = E ( Y 1 i Y 0 i ) = E ( Y 1 i Y 0 i / W = 1 ) = E ( Y 1 i / W = 1 ) E ( Y 0 i / W = 0 )
In Equation (7), Y 1 i represents the production efficiency of cotton farmers participating in AMSs, while Y 0 i represents the production efficiency of cotton farmers not participating in AMSs; E( Y 1 i /W = 1) represents the expected value of cotton production’s technical efficiency for the experimental group, and E( Y 0 i /W = 0) represents the expected value of cotton production’s technical efficiency for the control group, replaced by the index value constructed by PSM.

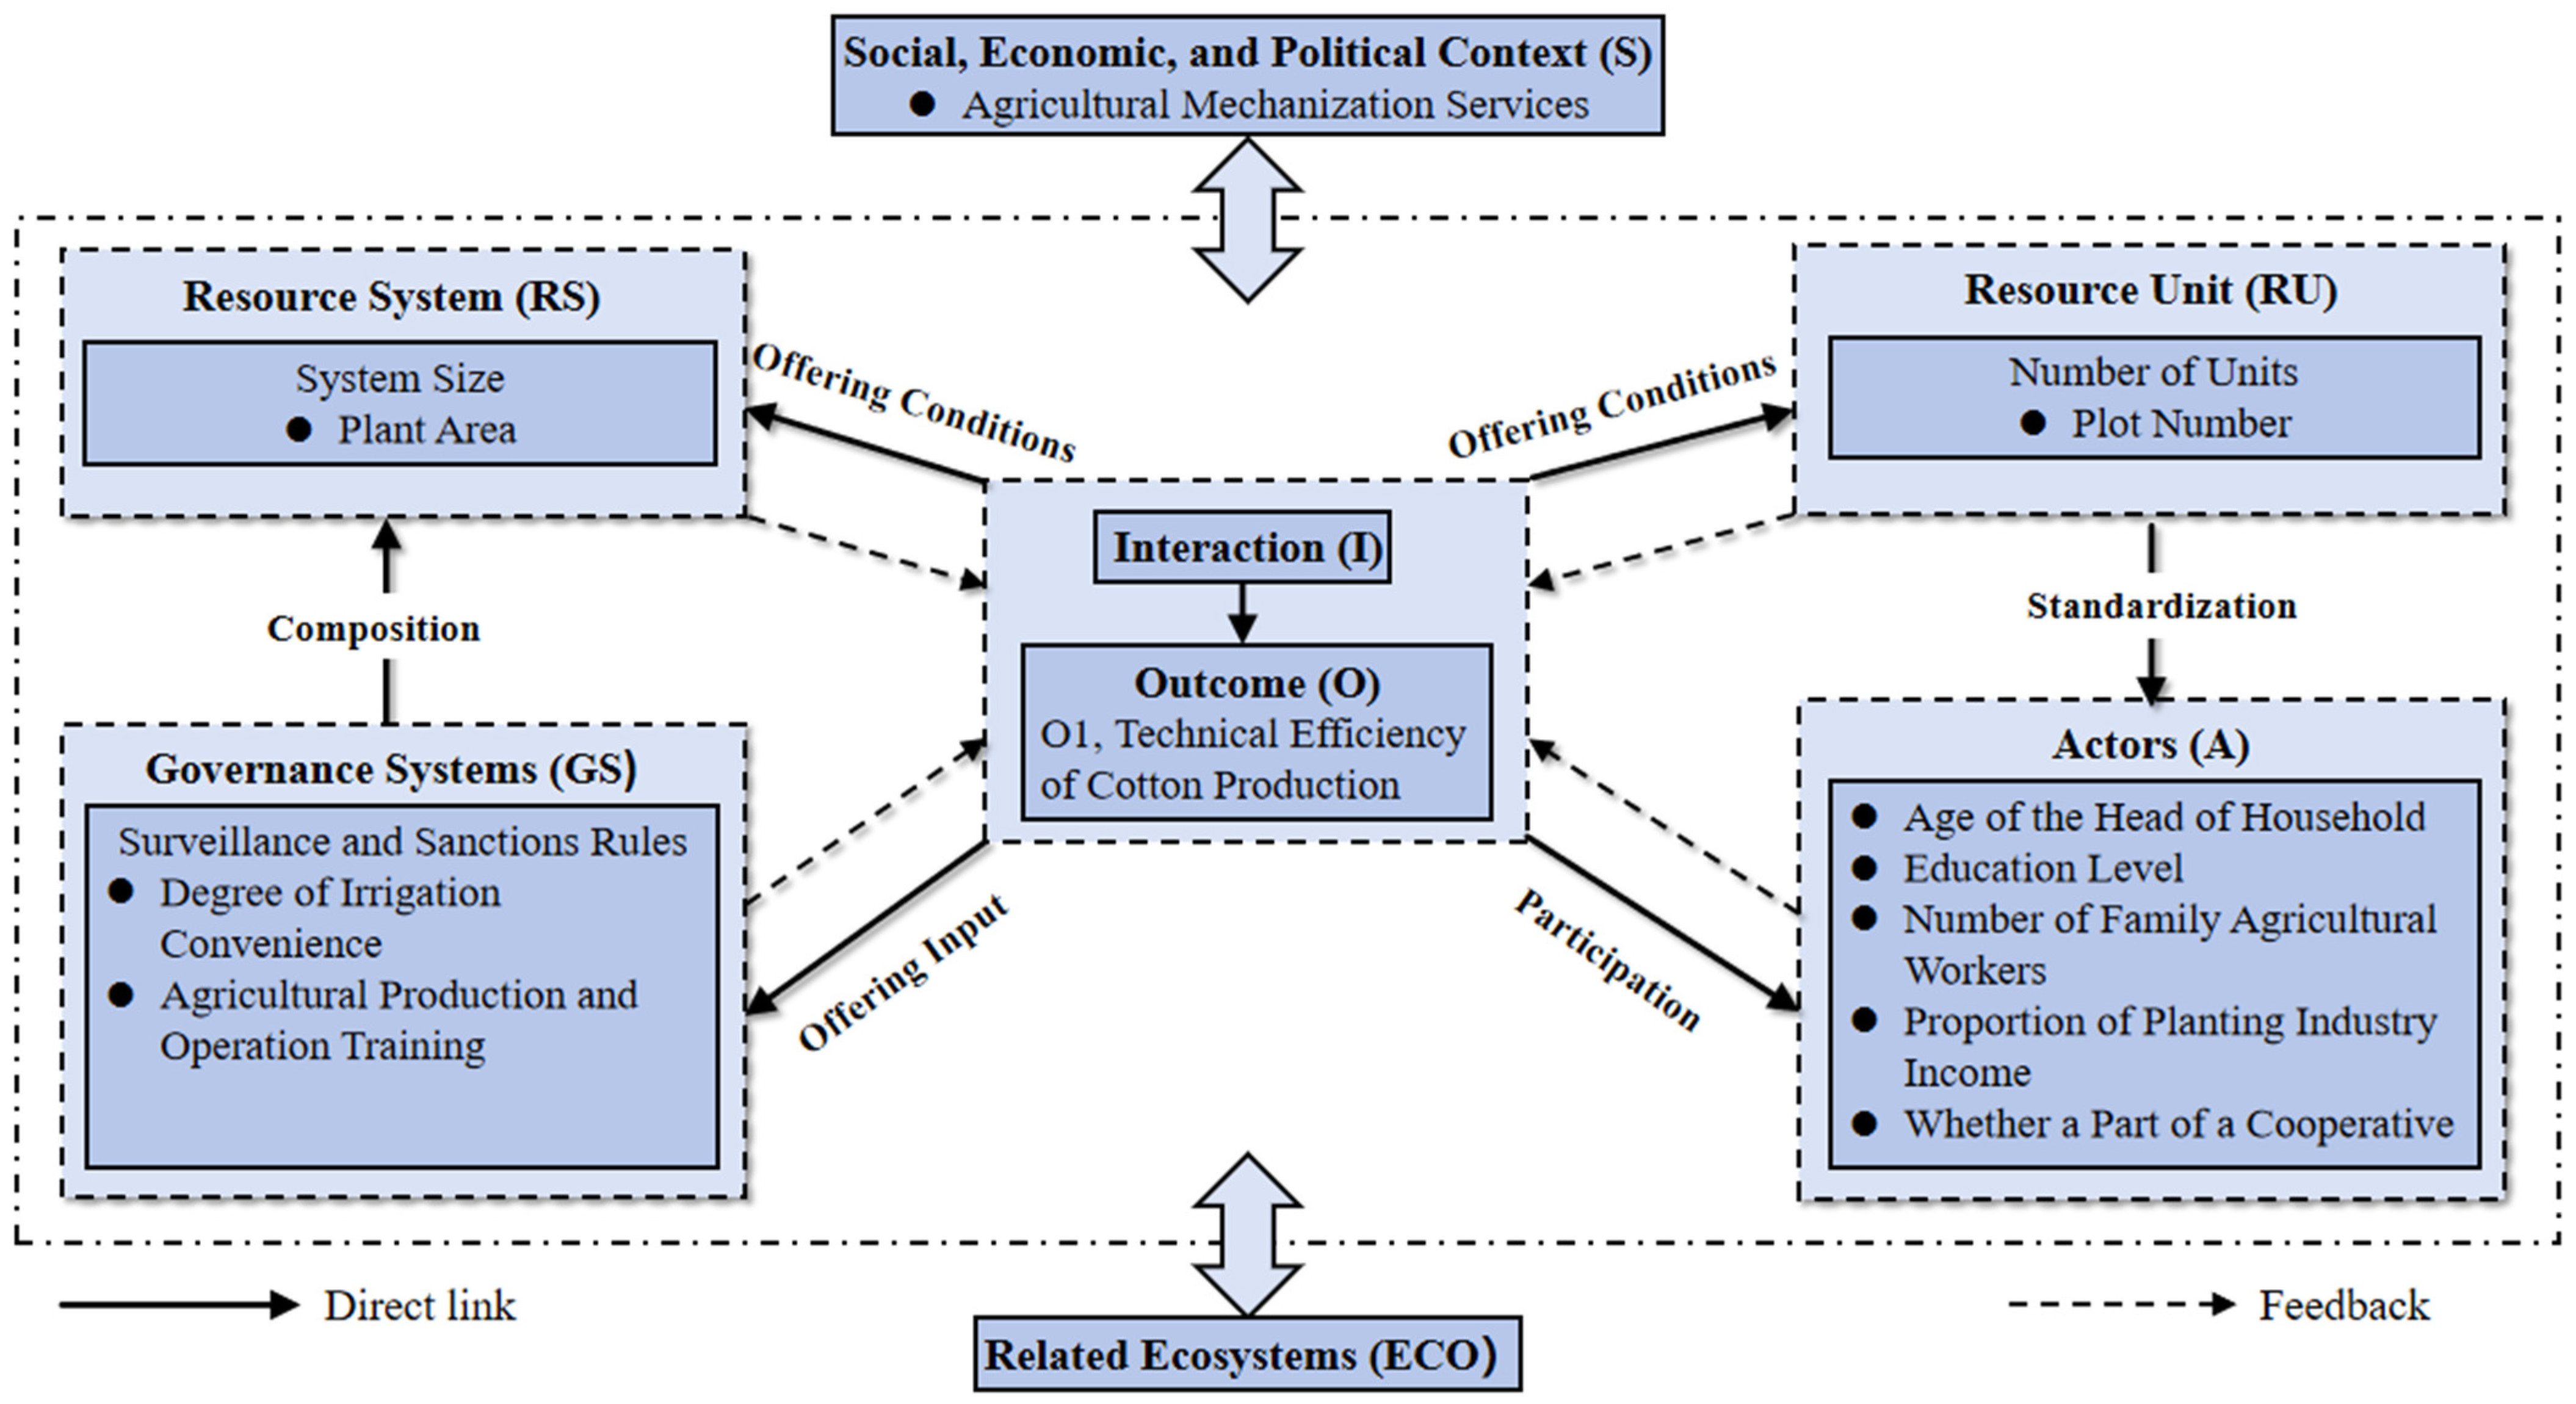
2.4. Research Framework and Variable Selection

As human cognitive capabilities advance, particularly in light of an enhanced comprehension of the interactions between humans and their environment, it becomes increasingly imperative for research on the efficiency of agricultural production technologies to integrate analyses of both social and natural ecological environments. The SES framework, as proposed by Ostrom, encompasses multi-level concepts that facilitate the diagnosis of issues within complex social–ecological systems and has been extensively utilized in the examination of human activities [47].
The SES framework is a multi-level analytical framework that includes three different levels of variables [32,48]. At the first level of this framework, there are four subsystems: the resource system, resource unit, governance system, and actors. These four subsystems interact collectively in the interaction processes and outcomes within the action context. Additionally, the interactions among these variables and the final outcomes are also influenced by two subsystems that represent the overall environment: the social, economic, and political context, and the associated ecological systems. In this complex nested structure, each subsystem can be further decomposed into multiple secondary or even tertiary variables, thus forming a detailed and multidimensional analytical system. (See Appendix A).
This study constructs a rural SES framework for cotton production’s technical efficiency based on the SES second-level framework (TE-SES), which is broken down to the third level according to specific contexts (see Figure 2). Within this framework, the technical efficiency of cotton production is conceptualized as a product of the interplay among various variables, which are evaluated through the stochastic frontier analysis methodology. This efficiency is categorized under the social performance (O1) layer, situated within the interaction (I) and outcome (O) variables, and serves as the dependent variable for this investigation. The study identifies AMSs as the primary explanatory variable, emphasizing their role in the agricultural production process. These services encompass a range of mechanized operations, including tillage, sowing, harvesting, irrigation and drainage, and pest management. The provision of these services is subject to a variety of influences, including socio-economic policies, the market demand, and technological innovations, thereby situating AMSs within a broader economic, social, and political context (S). This variable is central to the analysis conducted in this study.
In terms of control variables, this study selects the planting area as a tertiary variable in the resource system (RS); the convenience of irrigation and agricultural production and management training as tertiary variables in the governance system (GS); and the number of plots as a tertiary variable in the resource unit (RU). At the actor level, the number of family agricultural laborers is chosen to represent the number of relevant actors, while the age of the household head, the education level of the household head, and the proportion of income from planting are selected as the socio-economic attributes of the actors (A). Additionally, whether or not to join a cooperative is used to represent the social capital of the actors. The relevant statistical characteristics of the above variables can be found in Table 1.

3. Results

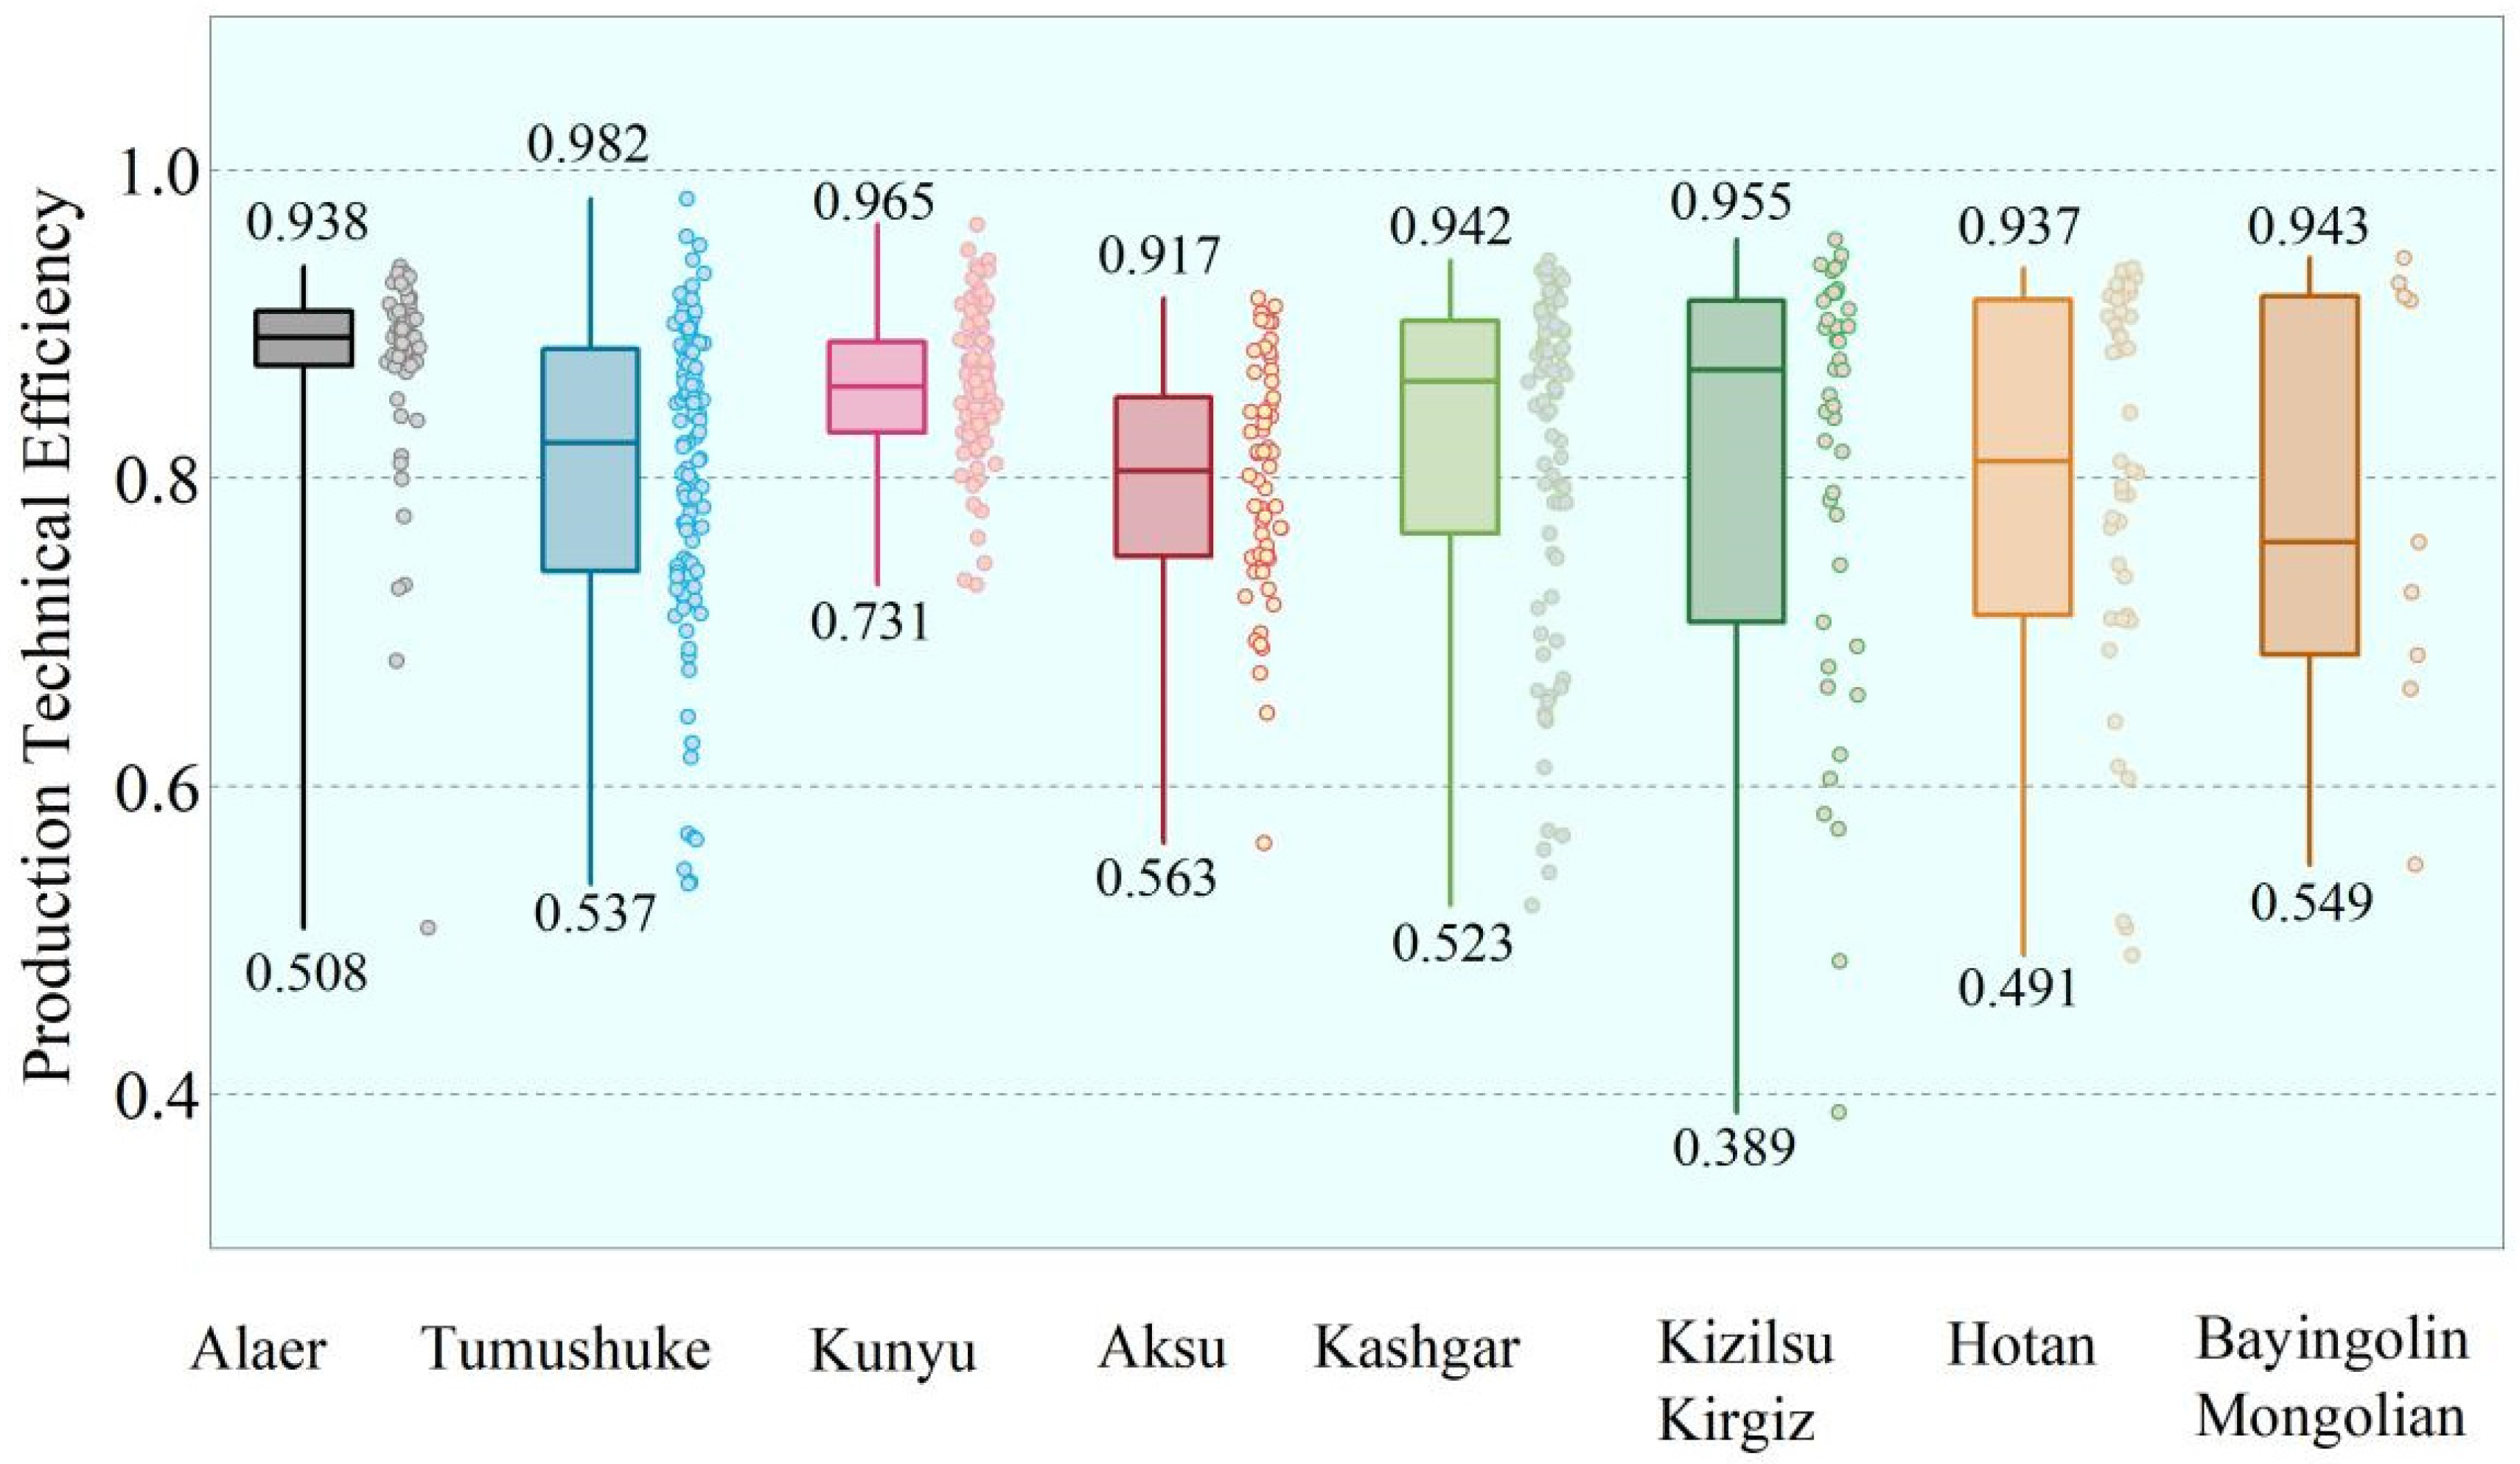
3.1. Estimation Results of Cotton Production’s Technical Efficiency

Based on various considerations, such as the specificity, data availability, and operability of the assessment of cotton production’s technical efficiency, the article selects the cotton yield, Y; seed input, S; chemical input, C; machinery input, M; irrigation water input, W; and the labor input, L, as variables to measure the efficiency of agricultural irrigation water use. The statistical description of the input–output variables is shown in Table 2. To ensure the accuracy and reliability of the model estimation results, the study conducted multicollinearity tests and heteroscedasticity tests on five input variables. The results of the multicollinearity test showed that the variance inflation factor (VIF) values for all the variables were less than five (maximum VIF = 1.10, minimum VIF = 1.02), and the tolerance for all the variables was greater than 0.5, indicating that there is no significant multicollinearity among the input variables, and the model parameter estimates are reliable. To test for heteroscedasticity in the regression model, this study employed the Breusch–Pagan test, which yielded a chi-square statistic of 21.82 (degrees of freedom = 1) with a corresponding p-value of 0.0000 (p < 0.01). Since the p-value is significantly less than 0.05, we reject the null hypothesis of homoscedasticity, indicating that there is significant heteroscedasticity in the model residuals. To address this issue, this paper uses robust standard errors for estimation to ensure the validity of the parameter inference.
The estimation results of the stochastic frontier model using Stata 17.0 software are shown in Table 3. Most of the parameters in the model are statistically significant, with both the lnsig2v and lnsig2u values passing the significance test at the 1% level. The significance of the lnsig2v value indicates that the model can effectively capture the random variation caused by uncontrollable factors, measurement errors, and so on, while the significance of the lnsig2u value indicates that the model successfully identifies and quantifies the technical inefficiency component, which refers to the portion where the actual output is below the potential maximum output [43,49]. The significance of these two parameters not only validates the rationality of the model specification but also demonstrates that the model can accurately distinguish between the effects of random errors and technical inefficiency. The model fits well, and the application of the stochastic frontier analysis method is effective.
Among the various input indicators in agricultural production, the coefficients for the irrigation water input, seed input, and labor input are positive, indicating that increasing these inputs can significantly enhance the cotton yield. In contrast, the coefficients for the chemical inputs and the mechanical inputs are negative, with the mechanical input passing the 5% significance level, while the chemical input did not pass the significance test. The negative coefficient for the mechanical input may be due to the excessive use of machinery in the surveyed area, leading to soil compaction and crop damage, which in turn reduces the cotton yield. The chemical inputs (such as fertilizers and pesticides) did not significantly affect the yield, possibly because there are fewer types of pests in the area, and the affected area is small, and the severity is light and has been effectively controlled.
The calculation of cotton production’s technical efficiency for farmers in the Tarim River Basin is shown in Table 4. From the table, it can be seen that the largest number of samples falls within the production efficiency range of [0.8, 0.9], accounting for 45.36% of the total samples. Similarly, in the subsample (adoption group), the proportion of samples in this range is as high as 53.04%, and the production technical efficiency of the subsample (adoption group) is concentrated in the high-efficiency stage, indicating that samples utilizing AMSs have relatively higher efficiency. This suggests that farmers who adopt AMSs are not only more efficient in resource utilization but also able to effectively enhance their crop’s yield and quality through the application of modern machinery and technology when facing natural challenges, such as drought and soil salinization.
In contrast, the group of farmers who did not adopt AMSs shows a significant dispersion in production efficiency, with values ranging from low to high efficiency, and 11.48% of the samples have a production technical efficiency value of below 0.6. This situation may reflect the limitations of traditional agricultural production methods in optimizing resource allocation, especially in contexts of water scarcity, complex land conditions, and increasing labor costs, where traditional farming methods lacking modern technological support struggle to achieve an efficient output. Additionally, farmers in the non-adopting group may be limited by factors such as their education level, the number of family agricultural laborers, and the degree of land fragmentation, preventing them from fully utilizing existing agricultural resources, leading to low production efficiency.
As a result, cotton growers who utilize AMSs have higher production technical efficiency compared to those who do not. This further highlights the advantages of AMSs in optimizing resource allocation and improving production efficiency. This is likely mainly due to mechanized operations significantly enhancing water and fertilizer utilization efficiency and labor productivity through precise sowing, intelligent irrigation, and efficient harvesting. In the drought-prone and ecologically fragile Tarim River Basin, this precise production method is particularly important, as it effectively overcomes natural constraints, such as water resource shortages and soil salinization, maintaining production efficiency at a high level. At the same time, this indicates that the efforts of AMSs and the promotion of other modern agricultural technologies need to be strengthened, especially for farmers who have not yet adopted these services. Providing necessary training and technical guidance will help them understand and master the application methods of the latest agricultural technologies, thereby improving the overall production efficiency.
In order to reveal whether there are significant differences in cotton production’s technical efficiency across different regions, an analysis was conducted on cotton production’s technical efficiency in various areas within the Tarim River Basin, based on the overall measurement of production technical efficiency in the basin. The results are shown in Figure 3. The average production technology efficiency across different regions fluctuates between 0.788 and 0.872, indicating a relatively small overall difference. To further verify the statistical significance of the differences between regions, the study employed a one-way ANOVA for testing. The results showed an F value of 1.876 (p = 0.073), which did not pass the significance level (α = 0.05) test, indicating that the differences between the groups in various regions are not statistically significant. This suggests that there is a high level of consistency in cotton production’s technical efficiency across the regions. This indicates that the agricultural infrastructure and policy support within the basin have reached a certain level of balanced development. This balance may stem from the unified implementation of a modern agricultural promotion system across the basin, as well as the overall environmental improvements brought about by the comprehensive management of the basin. In particular, the popularization of water-saving irrigation technology and the implementation of agricultural machinery purchase subsidy policies in recent years have led to a convergence of basic production conditions across regions, resulting in a trend of homogenized efficiency development.
However, there are significant differences between the maximum and minimum efficiency values within various regions. For example, in Alaer, the minimum value is 0.508, while the maximum value is 0.938, resulting in a difference of 0.43. In Tumushuke, the minimum value is 0.537 and the maximum value is 0.982, with an even greater difference of 0.445. This notable internal efficiency disparity within regions reflects the significant gaps in production technology levels and management capabilities among farmers. The reasons for these internal efficiency differences may be multifaceted. On the one hand, factors related to the farmers themselves play an important role. Different farmers have varying levels of education, planting experience, and abilities to learn and adopt new technologies. Farmers with higher education levels may find it easier to understand and master advanced production techniques, while those with rich planting experience can arrange production factors more rationally during the production process, thus achieving higher production technical efficiency. On the other hand, external environmental and policy factors can also impact farmers’ production technical efficiency. For instance, the natural environmental factors, such as soil fertility and the irrigation conditions of the plots where different farmers are located, may vary, potentially leading to differences in production technical efficiency. Additionally, government support policies for agriculture and the coverage and effectiveness of agricultural technology promotion services within the region may also affect farmers’ production technical efficiency. Therefore, the imbalance of agricultural production factors within the region needs further attention, and corresponding measures should be taken to reduce the efficiency disparities caused by uneven resource allocation.

3.2. The Impact of AMSs on Production Technology Efficiency

Before conducting sample matching, this paper uses the logit model to analyze the factors influencing farmers’ adoption of AMSs, with the results shown in Table 5. The adoption of AMSs by farmers is significantly related to the age of the household head, their education level, the number of family agricultural works, the proportion of planting industry income, the number of plots, agricultural production and operation training, and the degree of irrigation convenience. This supports the research hypothesis. As the age of the household head increases and the number of family agricultural laborers grows, the tendency to adopt AMSs also increases. This may be because, with age and an increase in family agricultural labor, farmers become more aware of the importance of improving production efficiency, reducing costs, and increasing income. Additionally, older household heads may be more inclined to adopt mechanized and automated production methods due to declining physical strength, in order to reduce the labor intensity. The higher the education level of the household head, the more likely they are to accept new things, new technologies, and new concepts, leading to a deeper understanding and recognition of AMSs, thus making them more inclined to adopt these services. When the proportion of planting industry income is higher and irrigation for arable land is more convenient, farmers are more likely to adopt AMSs to enhance their agricultural production efficiency and competitiveness, achieving better economic and social benefits. Conversely, having more plots can lead to the greater fragmentation of arable land, increased management costs, and greater coordination difficulties, which may make farmers less willing to adopt AMSs.
Prior to implementing PSM, it is essential to conduct a common support test to verify the availability of a sufficient number of samples for effective matching. Subsequently, a balance test is performed to ascertain that the matched samples exhibit balance across the covariates [46]. The results of the common support hypothesis test for PSM (Figure 4) show a significant increase in the common support area, with fewer samples lost through the common support test. The results of the balance test are shown in Table 6, indicating that the pseudo R2 value significantly decreased after matching (from 0.399 to 0.017–0.028); the LR statistic also significantly decreased (from 260.32 to 11.54–19.77). The significance test for the control variables before matching was highly significant, while after matching, the control variables could not pass the test at the 1% significance level, indicating that the control variables could not determine whether the farmers adopted AMSs after matching. Furthermore, the mean and median biases of the control variables significantly decreased before and after matching, and the total bias was greatly reduced, thus proving the success of the matching.
To ensure the reliability of the matching results and considering the differences in various matching methods, this study selected four methods—nearest neighbor matching (with n set to 4), caliper nearest neighbor matching (with the caliper and n set to 0.05 and 4, respectively), caliper matching (with the caliper set to 0.02), and kernel matching (with the bandwidth set to 0.06)—to fully utilize the sample of agricultural mechanization service participants. The average treatment effect (ATT) of AMSs on the technical efficiency of cotton production is shown in Table 7. The results indicate that the mean of the treatment group is higher than that of the control group across all four matching methods, suggesting that farmers who adopt AMSs generally have higher technical efficiency than those who do not. The ATT values passed significance tests at the 1% level, and the differences are not large, indicating that AMSs can significantly enhance farmers’ technical efficiency in cotton production. Thus, this paper further confirms that by providing advanced agricultural machinery, technical training, and market information, the socialization of agricultural machinery not only helps farmers optimize resource allocation, reduce production costs, and improve their crops’ yield and quality, but also promotes the modernization and sustainable development of agricultural production, emphasizing its importance in enhancing agricultural production technical efficiency. In the future, further efforts are needed to promote and deepen the dissemination of AMSs.

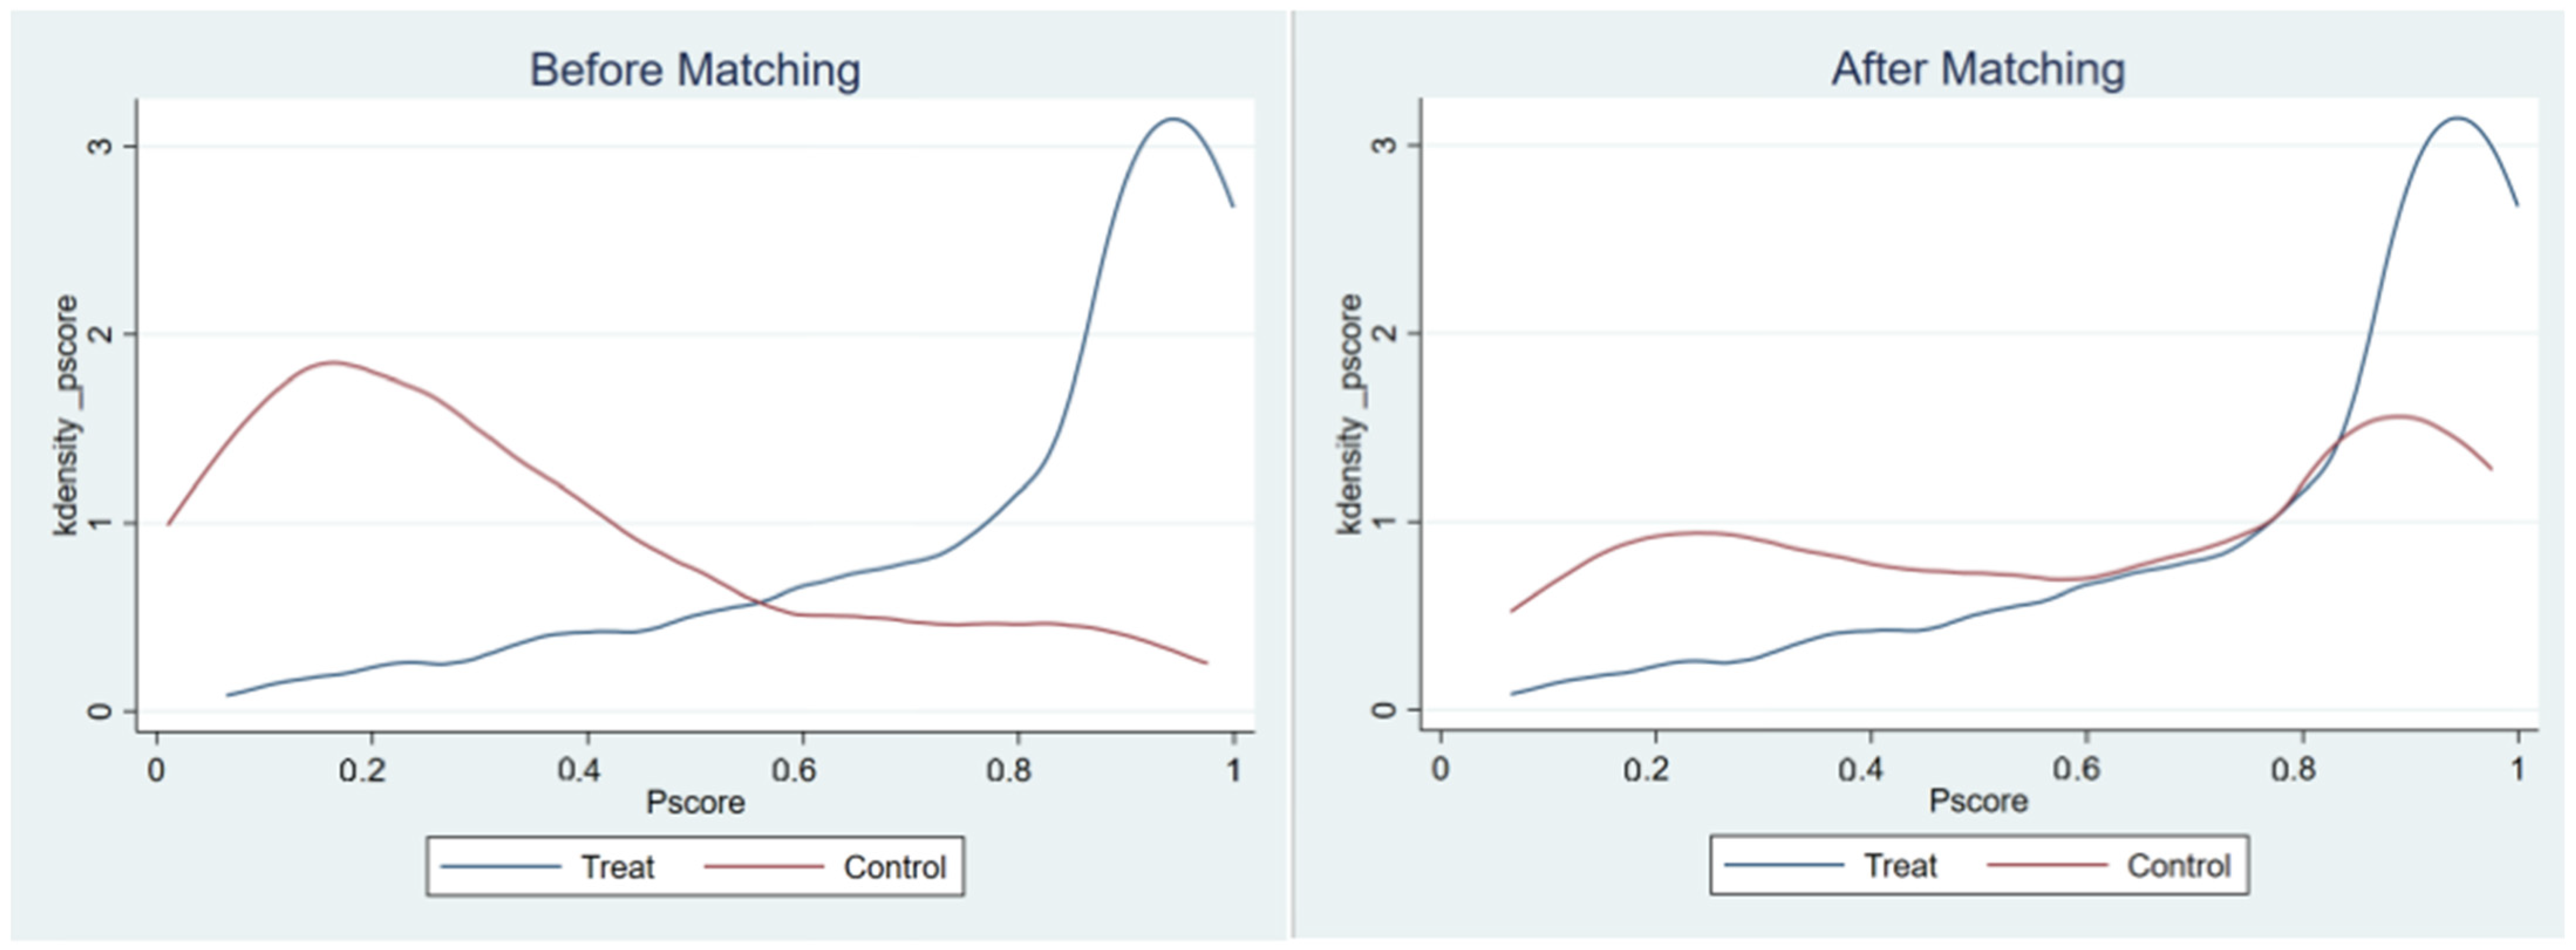
3.3. Robustness Test

To ensure the rationality of the model specification, this paper further re-estimates the stochastic frontier model using the Translog production function to test the robustness of the C-D function results, as shown in Table 8. The Translog function introduces the quadratic terms and interaction terms of the input factors, relaxing the strong assumptions of fixed substitution elasticity and constant returns to scale in the C-D function, allowing for a more flexible representation of the nonlinear characteristics of production technology [50]. Since the quadratic and interaction terms have been added to the input–output model, the elasticity of the input with respect to the output cannot be directly observed; its calculation formula is as follows:
e i = ln Y i ln X i
According to the above formula, by taking the average values of each input variable, the output elasticities for the seed input, chemical input, machinery input, irrigation water input, and labor input are calculated to be 0.0224, −0.0108, −0.0027, 0.0019, and 0.0419, respectively. This indicates that the main contributions to increasing the cotton yield come from the seed input, irrigation water input, and labor input.
The results of the transcendental logarithmic function estimation are compared and analyzed with the previous C-D function estimation results. From the significance of the coefficients, the significance of the production factor coefficients in the transcendental logarithmic function estimation is consistent with the C-D function estimation results. At the same time, both the lnsig2v and lnsig2u values passed the significance test at the 1% level. This indicates that the C-D stochastic frontier production function model constructed in this paper has good robustness and can accurately reflect the impact of production factors on the output, as well as distinguish between random errors and technical inefficiency. Therefore, both in terms of the model specification and the empirical results, the analysis in this study demonstrates a high level of effectiveness and reliability.

4. Discussion

This study is based on data from cotton farmers in the Tarim River Basin and employs SFA and PSM methods to confirm that agricultural mechanization services (AMSs) can significantly enhance the technical efficiency of cotton production. This conclusion is consistent with findings from various regions; however, due to differences in regional conditions, the mechanisms and degrees of the effect vary. Compared to some areas in developing countries, such as the Oromia region of Ethiopia, where agricultural mechanization significantly improves the economic efficiency of wheat and barley producers [8], this study focuses on the technical efficiency of cotton production in arid regions, which faces more severe constraints on water resources. Similarly, research in Vietnam indicates that agricultural mechanization, along with livestock farming, drives improvements in rice production’s efficiency [51], while this study emphasizes the independent role of AMSs in cotton production in arid areas, which may be related to the higher adaptability of mechanization in cotton production.
Compared to the African region, farmers in Sub-Saharan Africa have optimized fertilization and labor input through the use of tractors for land preparation [52]. Small farmers in Ghana have also improved their land preparation efficiency through tractor-based mechanization [53]. However, the widespread adoption of mechanization in these areas is limited by inadequate infrastructure and poor technological adaptability. In contrast, the Tarim River Basin has benefited from China’s comprehensive agricultural machinery service system, overcoming challenges posed by arid environments. This supports the view in African studies that mechanization relies on research and development investment and supporting policies to enhance the total factor productivity [54], highlighting China’s advantages in agricultural machinery research and land transfer policies. In comparison to developed economies, studies from EU countries and Portugal indicate that mechanization works synergistically with factors such as the production intensity, farm size, and irrigation to improve efficiency [55,56]. However, the efficiency improvement in the Tarim River Basin is still in the “scale-driven” stage, showing a gap with the “refined synergy” model of developed countries, which reflects the typical path of agricultural mechanization development in developing countries. In addition, this outcome contrasts with studies on cereal crop cultivation in Bihar, India [57]. The latter found that even small farmers, despite using agricultural machinery services, still face limitations in efficiency due to fragmented land parcels and insufficient compatibility with mechanization. This highlights the importance of matching the land scale with agricultural technology. A complete agricultural machinery service system needs to be integrated with land consolidation policies and adaptive technology research and development. This is also a unique advantage of the Tarim River Basin compared to other arid regions.
This study introduces the SES framework into AMS research, providing a multi-level, interdisciplinary perspective for understanding the impacts of AMSs. It emphasizes the complex interactions between natural systems, governance structures [58], and social environments, expanding the application boundaries of this theory in the modernization of agriculture in arid regions. Traditional research has often focused on economic incentives (such as subsidy policies) or the technology itself (such as smart agricultural machinery) [59,60], while the SES framework highlights the interactions between social networks, ecological constraints, and economic behavior. In this study, after the farmers adopted AMSs, the distribution of technical efficiency shifted from “dispersed” to “concentrated”, reflecting the synergy between the social system (policy guidance) and the ecological system (resource improvement). This dynamic process is corroborated by research in Haryana, India, that utilized a quantitative method to establish social–ecological connections and identify opportunities for management changes through extension services, thereby enhancing productivity [61]. This indicates that the SES framework needs to adjust its analytical focus based on the regional socio-ecological environment. For example, in areas with stable policies, the focus can be on the interaction between resource systems and actors, whereas in areas with significant policy fluctuations, the analysis should strengthen the governance system (such as policy continuity). Furthermore, the SES framework reveals the root causes of extremely poor efficiency within regions: although the average values between regions are similar, differences in ecological and social capital, such as land fragmentation and the heterogeneity of irrigation facilities, lead to a dispersed distribution of efficiency. This suggests that agricultural policies in arid regions should pay attention to the fairness of local resource allocation, rather than merely pursuing an increase in regional averages.
Although this study provides valuable insights into the impact of AMSs on the technical efficiency of cotton production, there are certain limitations. The research focuses on cotton growers in the Tarim River Basin, and the geographic concentration of the study sample may lead to limitations when generalizing the conclusions to other geographic areas or cotton-growing regions with different climates and soil conditions. The significant differences in the natural environments, socio-economic backgrounds, and stages of agricultural development in different regions may affect the effectiveness of AMSs on the technical efficiency of cotton production, necessitating an expansion of the research scope to verify the universality of the conclusions. In the future, the research area could be expanded to other arid and semi-arid regions or different crop planting systems, combined with spatial heterogeneity analyses, to reveal the applicable boundaries and regional adaptation strategies for AMS technology promotion. Additionally, the study uses cross-sectional data, which can only reflect efficiency differences at a specific point in time, while the long-term dynamic effects of AMSs (such as technology-learning effects and economies-of-scale accumulation) have not been adequately represented. Future research could be based on long-term tracking surveys to construct a dynamic panel model of AMS adoption and production efficiency, revealing its time lagged effects and cumulative impacts. Machine learning algorithms could also be employed to predict future trends in AMS adoption and changes in production efficiency, providing forward-looking references for policy-making.

5. Conclusions and Recommendations

This study focuses on cotton farmers in the Tarim River Basin and, under the framework of the SES, employs a combination of SFA and PSM to explore the impact of AMSs on the technical efficiency of cotton production and its driving mechanisms. The research has significant theoretical and methodological innovations. On the theoretical level, it breaks through the limitations of previous studies that only examined the relationship between agricultural mechanization services and production efficiency from a single dimension. It innovatively introduces the SES framework, systematically revealing the multidimensional driving mechanisms through which AMSs affect production efficiency. This provides a new theoretical perspective and analytical framework for research in this field, enriching the theoretical connotation of agricultural economics and rural development. On the methodological level, by combining SFA with PSM, it effectively overcomes the issue of sample selection bias, enhancing the robustness of the estimation results and their policy reference value, thus providing a more scientific and reliable analytical tool for research on agricultural technology adoption.
Based on the above theories and methodological innovations, this study draws the following conclusions: Through the combined use of SFA and PSM, it was found that the adoption of agricultural mechanization services significantly improved the production technical efficiency of cotton growers. Among the samples that adopted the services, 53.04% had production efficiency in the range of [0.8, 0.9], indicating that they have entered a high-efficiency production stage; in contrast, the efficiency values of the non-adopting group were more dispersed, with low-efficiency samples accounting for 11.48%. Additionally, a one-way ANOVA test revealed that the technical efficiency of cotton production was similar across different regions, but there was a significant disparity in efficiency within regions. A further logit regression analysis found that factors such as the age of the household head, their education level, the number of family agricultural laborers, the proportion of income from agriculture, and irrigation convenience had a positive impact on farmers’ adoption of agricultural mechanization services (AMSs), while the degree of land fragmentation had a negative impact. In cotton cultivation, AMSs are not only a key pathway to improving technical efficiency but also an important means to promote agricultural modernization in arid areas and enhance farmers’ resilience to risks.
At the practical level, this study focuses on the production of characteristic economic crops in arid regions, providing precise policy support for the promotion of agricultural mechanization in ecologically fragile areas, which has significant practical implications for advancing regional agricultural modernization. Based on the research conclusions, in order to fully leverage the role of agricultural mechanization services in enhancing the technical efficiency of cotton production and to promote the sustainable development of agricultural modernization and rural revitalization in the watershed, the following policy recommendations are proposed:
(1)
Strengthening the construction and decentralization of the AMS. At the resource system level, the extension of the agricultural machinery service network to grassroots levels essentially optimizes the allocation of material capital, forming a complementarity through government-led institutional design (governance system) and participation from social organizations (actors). Financial subsidies and tax incentives can be seen as positive incentives for social capital, promoting the establishment of trust between agricultural machinery service organizations and cotton farmers by reducing the transaction costs of service provision. Especially during critical farming periods, such as sowing and harvesting, ensuring efficient and timely agricultural machinery operation services is crucial for safeguarding agricultural production. These policy measures not only help enhance the enthusiasm of agricultural machinery service organizations but also effectively reduce the production costs for cotton farmers, improving the overall efficiency of agricultural production.
(2)
Optimizing resource allocation and enhancing the efficiency balance within regions. The differences in agricultural production efficiency reflect the spatial heterogeneity of resource systems and resource units. Inefficient areas often experience low resource utilization efficiency due to land fragmentation, outdated technology, or insufficient infrastructure. The government can adjust resource distribution through differentiated policies, such as specialized technical guidance and financial support, to improve the resource conditions in inefficient areas. At the same time, promoting land transfer and moderate-scale operations can optimize the organizational methods of resource units, create economies of scale, reduce production costs, and enhance the overall productivity of the system. This process also involves adjustments in the behavior of actors, such as farmers’ willingness to participate in land transfers, which needs to be guided through reasonable institutional designs.
(3)
Enhancing the intrinsic motivation of farmers to adopt agricultural machinery services. Farmers’ decision-making behaviors are influenced by social norms, cognitive levels, and external incentives [62]. Publicity and education, along with the sharing of successful cases, can change farmers’ perceptions of agricultural machinery services, while incentive mechanisms (such as subsidies and insurance linkages) can reduce adoption risks through the rules within the governance system. Additionally, rural education and human resource development can improve farmers’ technical acceptance capacity, thereby enhancing their adaptability to agricultural machinery services. This process reflects the interaction between social subsystems and governance subsystems, with the ultimate goal of optimizing the interaction between farmers and resource systems to achieve sustainability in agricultural production.

Author Contributions

Conceptualization, Y.Z. and G.W.; methodology, Y.Z.; software, Y.Z. and H.D.; validation, G.W., J.L. and Q.Y.; formal analysis, Y.Z.; investigation, Y.Z., J.L. and Q.Y.; resources, G.W.; data curation, G.W.; writing—original draft preparation, Y.Z., H.D., J.L. and Q.Y.; writing—review and editing, Y.Z. and G.W.; visualization, H.D., J.L. and Q.Y.; supervision, G.W.; project administration, G.W.; funding acquisition, G.W. All authors have read and agreed to the published version of the manuscript.

Funding

This research was funded by the Major Program of the National Social Science Foundation of China (22&ZD215) and the Key Program of the National Social Science Foundation of China (21AZZ004).

Institutional Review Board Statement

This study complies with the ethical exemption requirements outlined in the “Notice on the Issuance of Methods for Ethical Review of Life Sciences and Medical Research Involving Humans” issued by China and can be exempted from ethical review.

Data Availability Statement

The data that support the findings of this study are available from the corresponding author upon reasonable request.

Acknowledgments

We would like to thank the farmers in the Tarim River Basin for their generous contribution of time and their participation in this study.

Conflicts of Interest

The authors declare no conflicts of interest.

Abbreviations

The following abbreviations are used in this manuscript:
AMSsagricultural mechanization services
SESsocial–ecological system
SFAstochastic frontier analysis
PSMPropensity Score Matching

Appendix A

Table A1. The second-level variables of the SES framework.
Social, economic, and political contexts (S)
S1, Economic development; S2, Demographic trends; S3, Policy stability; S4, Government policy; S5, Marketization; S6, Expert Team; S7, Techniques
Resource system (RS) Governance system (GS)Resource unit (RU)User (U)
RS1, Resource sectorGS1, Government organizations U1, Number of users
RS2, Whether the system boundaries are clearGS2, Non-governmental organizationsRU1, Liquidity of resource unit U2, Socio-economic attributes of users
RS3, System sizeGS3, Network structureRU2, Increase, decrease, and turnover rateU3, Use history and experience
RS4, Man-made facilitiesGS4, Property rights systemRU3, Interactivity of resource units U4, Geographical location
RS5, System productivityGS5, Operational rulesRU4, Economic value of resource unitsU5, Leadership
RS6, Ability to maintain self balanceGS6, Rules of collective choiceRU5, Number of unitsU6, Social norms/social capital
RS7, Predictability of facility provisionGS7, Constitutional rulesRU6, Distinguishable featuresU7, Perception of socio-ecological systems
RS8, Resource storage featureGS8, Surveillance and sanctions rulesRU7, Spatiotemporal allocation of resourcesU8, Dependence on resources
RS9, Locations U9, Techniques used
Interaction (I) → Outcomes (O)
I1, Level of resources obtained
I2, Information sharing between users
I3, Negotiation
I4, Conflicts between users
I5, Investment in equipment maintenance
I6, Lobbying behavior
I7, Self-organizing actions
I8, Networked action
I9, Supervision activities
I10, Evaluation activities
O1, Social performance measurement
O2, Ecological performance measurement
O3, Externalities (impact on other systems)
Associated ecosystem (ECO)
ECO1, Climatic conditions; ECO2, Pollution patterns; ECO3, Focused inflow and outflow of SES

References

  1. Xu, Z.X.; Liu, Z.F.; Fu, G.B.; Chen, Y.N. Trends of major hydroclimatic variables in the Tarim River basin during the past 50 years. J. Arid Environ. 2010, 74, 256–267. [Google Scholar] [CrossRef]
  2. Feng, M.Q.; Chen, Y.N.; Duan, W.L.; Fang, G.H.; Li, Z.; Jiao, L.; Sun, F.; Li, Y.P.; Hou, Y.F. Comprehensive evaluation of the water-energy-food nexus in the agricultural management of the Tarim River Basin, Northwest China. Agric. Water Manag. 2022, 271, 107811. [Google Scholar] [CrossRef]
  3. Qian, L.; Lu, H.; Gao, Q.; Lu, H.L. Household-owned farm machinery vs. outsourced machinery services: The impact of agricultural mechanization on the land leasing behavior of relatively large-scale farmers in China. Land Use Policy 2022, 115, 106008. [Google Scholar] [CrossRef]
  4. Zhou, X.; Ma, W. Agricultural mechanization and land productivity in China. Int. J. Sustain. Dev. World Ecol. 2022, 29, 530–542. [Google Scholar] [CrossRef]
  5. Belton, B.; Fang, P.X.; Thomas, R. Combine Harvester Outsourcing Services and Seasonal Rural Non-Farm Employment in Myanmar. Appl. Econ. Perspect. Policy 2025, 47, 97–124. [Google Scholar] [CrossRef]
  6. Qiu, H.L.; Feng, M.R.; Tang, W.Y.; Luo, M.Z.; Wang, J.W.; Ye, F. Analysis of the impact of farm machinery outsourcing services on farmers’ cropping structure and grain production: An empirical evidence from Henan Province, China. Front. Sustain. Food Syst. 2024, 8, 1365576. [Google Scholar] [CrossRef]
  7. Lu, Q.; Du, X.; Qiu, H. Adoption patterns and productivity impacts of agricultural mechanization services. Agric. Econ. 2022, 53, 826–845. [Google Scholar] [CrossRef]
  8. Tamrat, G.; Mengistu, K.; Arega, S.; Getachew, L.F. Impact of farm mechanization on crop productivity and economic efficiency in central and southern Oromia, Ethiopia. Front. Sustain. Food Syst. 2024, 8, 1414912. [Google Scholar] [CrossRef]
  9. Xu, J.Y.; Lu, J. The Industrialization of Agricultural Machinery Services and the Transformation of Agricultural Production Methods in China. Agric. Technol. Econ. 2000, 2, 60–64. [Google Scholar] [CrossRef]
  10. Zou, B.L.; Ashok, K.M. Modernizing Smallholder Agriculture and Achieving Food Security: An Exploration in Machinery Services and Labor Reallocation in China. Appl. Econ. Perspect. Policy 2024, 46, 1662–1691. [Google Scholar] [CrossRef]
  11. Belton, B.; Win, M.T.; Zhang, X.; Filipski, M. The rapid rise of agricultural mechanization in Myanmar. Food Policy 2021, 101, 102095. [Google Scholar] [CrossRef]
  12. Luo, X.W.; Liao, J.; Zang, Y.; Qu, Y.G.; Wang, P. The Development Direction of Agricultural Production in Our Country: From Mechanization to Intelligence. China Eng. Sci. 2022, 24, 46–54. [Google Scholar] [CrossRef]
  13. Yangchen, D.C.; Hong, M.; Yang, Q. The Effect of Farmland Transfer on the Technical Efficiency of Farm Households in China: An Empirical Result of External Environmental Factors. Land 2023, 12, 64. [Google Scholar] [CrossRef]
  14. Muhamad, M.Z.; Kamarulzaman, N.H.; Nawi, N.M.; Shamsudin, M.N.; Laham, J. Assessing Technical Efficiency in Malaysian Pineapple Farms: A Stochastic Frontier Analysis Approach. Emir. J. Food Agric. 2023, 35, 1–9. [Google Scholar] [CrossRef]
  15. Zhong, Z.; Jiang, W.Y.; Yang, S.S. Does agricultural outsourcing improve technical efficiency? Evidence from farms of various scales in China. J. Rural Stud. 2025, 117, 103650. [Google Scholar] [CrossRef]
  16. Fuksová, Z.; Mareš, D.; Křápek, M. The impact of efficiency on the profitability of large farms in the Visegrad Four. Agric. Econ.-Czech. 2024, 70, 457–464. [Google Scholar] [CrossRef]
  17. Boakye, K.; Lee, Y.F.; Annor, F.F.; Dadzie, S.K.N.; Salifu, I. Data Envelopment Analysis (DEA) to Estimate Technical and Scale Efficiencies of Smallholder Pineapple Farmers in Ghana. Agriculture 2024, 14, 1032. [Google Scholar] [CrossRef]
  18. Aslam, M.; Li, Z.; Golubinova, I.; Alamer, K.; Ahmad, S. Determinants of Agricultural Productivity in Rice-Wheat Crop Rotation and Its Impact on Agricultural Cohesion: Lessons Learned from Pakistan. C. R. Acad. Bulg. Sci. 2024, 77, 936–943. [Google Scholar] [CrossRef]
  19. Liu, Y.; Hu, W.; Jetté-Nantel, S.; Tian, Z.H. The influence of labor price change on agricultural machinery usage in Chinese agriculture. Can. J. Agric. Econ. 2014, 62, 219–243. [Google Scholar] [CrossRef]
  20. Zhang, X.; Yang, J.; Thomas, R. Mechanization outsourcing clusters and division of labor in Chinese agriculture. China Econ. Rev. 2017, 43, 184–195. [Google Scholar] [CrossRef]
  21. Long, Y.J.; Liang, Y.; Liang, J.; Zhang, Y.J. Research on the Impact of Agricultural Machinery Socialized Services on Corn Production Efficiency—Based on Survey Data from Corn Growers in Jilin Province. Maize Sci. 2024, 32, 119–126. [Google Scholar] [CrossRef]
  22. Yang, S.; Li, W. The Impact of Socialized Agricultural Machinery Services on Land Productivity: Evidence from China. Agriculture 2022, 12, 2072. [Google Scholar] [CrossRef]
  23. Wu, A.; Elahi, E.; Cao, F.; Yusuf, M.; Abro, M.I. Sustainable grain production growth of farmland–A role of agricultural socialized services. Heliyon 2024, 73, 68–75. [Google Scholar] [CrossRef] [PubMed]
  24. Qing, Y.; Chen, M.; Sheng, Y.; Huang, J. Mechanization services, farm productivity and institutional innovation in China. China Agric. Econ. Rev. 2019, 11, 536–554. [Google Scholar] [CrossRef]
  25. Liu, X.; Li, X. The Influence of Agricultural Production Mechanization on Grain Production Capacity and Efficiency. Processes 2023, 11, 487. [Google Scholar] [CrossRef]
  26. Nguyen, H.Q.; Warr, P. Land consolidation as technical change: Economic impacts in rural. World Dev. 2020, 127, 104750. [Google Scholar] [CrossRef]
  27. Takeshima, H. Mechanize or exit farming? Multiple-treatment-effects model and external validity of adoption impacts of mechanization among Nepalese smallholders. Rev. Dev. Econ. 2018, 22, 1620–1641. [Google Scholar] [CrossRef]
  28. Kotu, B.H.; Manda, J.; Mutungi, C.; Fischer, G.; Gaspar, A. Farmers’ willingness to invest in mechanized maize shelling and potential financial benefits: Evidence from Tanzania. Agribusiness 2023, 39, 854–874. [Google Scholar] [CrossRef]
  29. Hamilton, S.F.; Richards, T.J.; Shafran, A.P.; Vasilaky, K.N. Farm labor productivity and the impact of mechanization. Am. J. Agric. Econ. 2022, 104, 1435–1459. [Google Scholar] [CrossRef]
  30. Tingley, D.; Pascoe, S.; Coglan, L. Factors affecting technical efficiency in fisheries: Stochastic production frontier versus data envelopment analysis approaches. Fish. Res. 2005, 73, 363–376. [Google Scholar] [CrossRef]
  31. Yang, H.L.; Li, Y.; Han, X.D.; Zheng, F.T. Does land fragmentation increase the agricultural production costs of “large-scale farmers”?—Based on a micro survey of 776 family farms and 1166 specialized large households nationwide. China Land Sci. 2019, 33, 76–83. [Google Scholar] [CrossRef]
  32. McGinnis, M.D.; Ostrom, E. Social-ecological system framework: Initial changes and continuing challenges. Ecol. Soc. 2014, 19, 30. [Google Scholar] [CrossRef]
  33. Poteete, A.R.; Ostrom, E. In pursuit of comparable concepts and data about collective action. Agric. Syst. 2004, 82, 215–232. [Google Scholar] [CrossRef]
  34. Huan, M.; Dong, F.; Chi, L. Mechanization services, factor allocation, and farm efficiency: Evidence from China. Rev. Dev. Econ. 2022, 26, 1618–1639. [Google Scholar] [CrossRef]
  35. National Bureau of Statistics of China. China Statistical Yearbook 2024. 2024. Available online: http://www.stats.gov.cn/ (accessed on 10 October 2024).
  36. Liu, X.H.; Xu, H.L.; Ling, H.B.; Bai, Y.; Fu, J.Y.; Dai, Y. Research on the Ecological Water Demand of the Main Stream of the Tarim River. Arid Zone Res. 2012, 29, 984–991. [Google Scholar] [CrossRef]
  37. Chen, Y.N.; Hao, X.M.; Chen, Y.P.; Zhu, C.G. Research on the Connectivity of Water Systems and Ecological Protection Strategies in the Tarim River Basin, Xinjiang. Bull. Chin. Acad. Sci. 2019, 34, 1156–1164. [Google Scholar] [CrossRef]
  38. Wu, H.; Xu, M.; Peng, Z.Y.; Chen, X.P. Quantifying the potential impacts of meltwater on cotton yields in the Tarim River Basin, Central Asia. Agric. Water Manag. 2022, 269, 107639. [Google Scholar] [CrossRef]
  39. Lu, Q.; Yang, Y.; Li, B.; Li, Y.; Wang, D. Coupling Relationship and Influencing Factors of the Water–Energy–Cotton System in Tarim River Basin. Agronomy 2022, 12, 2333. [Google Scholar] [CrossRef]
  40. Xinjiang Uygur Autonomous Region Department of Agriculture and Rural Affairs. Xinjiang Cotton Industry Development Report; Xinjiang Uygur Autonomous Region Department of Agriculture and Rural Affairs: Urumqi, China, 2022. [Google Scholar]
  41. Kopp, R.J. The Measurement of Productive Efficiency; Oxford University Press: Oxford, UK, 1981. [Google Scholar]
  42. Farrell, M.J. The Measurement of Productive Efficiency. J. R. Stat. Soc. 1957, 120, 253–290. [Google Scholar] [CrossRef]
  43. Battese, G.E.; Coelli, T.J. Frontier production functions, technical efficiency and panel data: With application to paddy farmers in India. J. Product. Anal. 1992, 3, 153–169. [Google Scholar] [CrossRef]
  44. Taylor, T.G.; Shonkwiler, S.J. Alternative stochastic specifications of the frontier production function in the analysis of agricultural credit programs and technical efficiency. J. Dev. Econ. 1986, 21, 149–160. [Google Scholar] [CrossRef]
  45. Kopp, R.J.; Smith, V.K. Frontier production function estimates for steam electric generation: A comparative analysis. Econom. J. 1980, 47, 1049–1059. [Google Scholar] [CrossRef]
  46. Abadie, A.; Imbens, G.W. Matching on the Estimated Propensity Score. Econometrica 2016, 84, 781–807. [Google Scholar] [CrossRef]
  47. Ostrom, E. A diagnostic approach for going beyond panaceas. Proc. Natl. Acad. Sci. USA 2007, 104, 15181–15187. [Google Scholar] [CrossRef]
  48. Ostrom, E. A general framework for analyzing sustainability of social-ecological systems. Science 2009, 325, 419–422. [Google Scholar] [CrossRef]
  49. Kumbhakar, S.C. Stochastic Frontier Analysis; Cambridge University Press: Cambridge, UK, 2005. [Google Scholar] [CrossRef]
  50. Chiristensen, L.; Jorgenson, D.W.; Lau, L.J. Transcendental logarithmic production function. Rev. Econ. Stat. 1973, 55, 28–45. [Google Scholar] [CrossRef]
  51. Nguyen, T.; Nguyen, T.T.; Grote, U. Credit, shocks and production efficiency of rice farmers in Vietnam. Econ. Anal. Policy 2023, 77, 780–791. [Google Scholar] [CrossRef]
  52. Mano, Y.; Takahashi, K.; Otsuka, K. Mechanization in land preparation and agricultural intensification: The case of rice farming in the Cote d’Ivoire. Agric. Econ. 2020, 51, 899–908. [Google Scholar] [CrossRef]
  53. Kansanga, M.M.; Mkandawire, P.; Kuuire, V.; Luginaah, I. Agricultural mechanization, environmental degradation, and gendered livelihood implications in northern Ghana. Land Degrad. Dev. 2020, 31, 1422–1440. [Google Scholar] [CrossRef]
  54. Kirui, O.K.; Kornher, L.; Bekchanov, M. Productivity growth and the role of mechanisation in African agriculture. Agrekon 2023, 62, 80–97. [Google Scholar] [CrossRef]
  55. Wicki, L.; Dudek, H.; Parzonko, A.; Kusz, D.; Naglis-Liepa, K. Factors Influencing the Productivity of Direct Energy Inputs in EU Agriculture. Sustainability 2025, 17, 1217. [Google Scholar] [CrossRef]
  56. Dinis, I. Exploring the Drivers of Microregional Agricultural Labor Productivity: Empirical Insights from Portugal. Agriculture 2023, 13, 2150. [Google Scholar] [CrossRef]
  57. Singh, K.M.; Ahmad, N.; Sinha, D.K.; Kumar, A.; Singh, R.K.P. Cost efficiency of principal crops in Bihar (India)—A stochastic frontier approach. Indian J. Agric. Sci. 2020, 90, 1445–1452. [Google Scholar] [CrossRef]
  58. Hinkel, J.; Cox, M.E.; Schlüter, M.; Binder, C.R.; Falk, T. A diagnostic procedure for applying the social-ecological systems framework in diverse cases. Ecol. Soc. 2015, 20, 32. [Google Scholar] [CrossRef]
  59. Patil, V.; Veettil, P.C. Farmers’ risk attitude, agricultural technology adoption and impacts in Eastern India. Agric Food Secur. 2024, 13, 50. [Google Scholar] [CrossRef]
  60. Wu, F.; Guo, X.; Guo, X. Cooperative membership and new technology adoption of family farms: Evidence from China. Ann. Public Coop. Econ. 2023, 94, 719–739. [Google Scholar] [CrossRef]
  61. Coventry, D.R.; Poswal, R.S.; Yadav, A.; Zhou, Y.; Riar, A.; Kumar, A.; Cummins, J.A. A novel framework for identifying the interactions between biophysical and social components of an agricultural system: A guide for improving wheat production in Haryana, NW India. J. Agric. Educ. Ext. 2018, 24, 263–284. [Google Scholar] [CrossRef]
  62. Savari, M.; Damaneh, H.E.; Damaneh, H.E.; Cotton, M. Integrating the norm activation model and theory of planned behaviour to investigate farmer pro-environmental behavioural intention. Sci. Rep. 2023, 13, 5584. [Google Scholar] [CrossRef]
Figure 1. The location map of the research area.
Agriculture 15 01233 g001
Figure 2. Schematic diagram of the TE-SES.
Agriculture 15 01233 g002
Figure 3. Regional distribution of farmers’ production technical efficiency.
Agriculture 15 01233 g003
Figure 4. Kernel density before and after matching.
Agriculture 15 01233 g004
Table 1. Statistical description of the relevant variables of TE-SES.
SES AttributesVariable TypesVariableDefinitionMeanStd. DevMinMax
Contextual variables (I→O)Dependent variableTechnical efficiency of cotton production Stochastic frontier measurement0.8240.1000.3890.982
Social, economic, and political contexts (S)Core explanatory variablesAMSsAdoption of any agricultural mechanization service (tillage, sowing, plant protection, irrigation and drainage, and harvesting) = 1, not adopted = 00.6310.48301
Resource system (RS)Control variablesPlanting areaContinuous variable30.86341.4900.45600
Resource unit (RU)Plots NumberContinuous variable2.6111.69619
Governance system (GS)Degree of irrigation convenience1, Very inconvenient; 2, inconvenient;
3, Mostly convenient; 4, Convenient; 5, Very convenient
4.3100.81215
Whether received agricultural production and operation training0, No
1, Yes
0.6790.46701
Actors (A)Age of the household headContinuous variable46.92111.0452190
Education level1, Low level; 2, Lower middle level; 3, Medium level; 4, Upper middle level; 5, High level1.8490.87315
Number of family agricultural worksContinuous variable2.1990.72116
Proportion of planting industry income (%)Continuous variable46.87533.1610.088100
Whether a part of a cooperative0, No
1, Yes
0.4150.49301
Table 2. Descriptive statistics of input–output variables in cotton planting.
VariableUnitMeanStd. DevMinMax
Cotton Yieldkg/hm2339.41273.71830.000524.000
Seed InputCNY/hm268.64942.8992.000300.000
Chemical InputCNY/hm2168.278137.4412.114960.000
Machinery InputCNY/hm2159.862188.3242.1051590.909
Irrigation Water InputCNY/hm2145.28298.4085.313500.000
Labor Inputperson·d/hm215.19618.2350.225150.000
Table 3. Parameter estimation of C-D stochastic frontier production function model.
ProjectCoefficient EstimateStandard ErrorZ Value
Constant5.7010 ***0.067087.40
In S0.0543 ***0.01611.87
In C−0.00740.0102−0.68
In M−0.0208 **0.0079−1.49
In W0.0302 ***0.01032.37
In L0.0460 ***0.00665.78
lnsig2v−4.3050 ***0.2240−23.99
lnsig2u−2.6760 ***0.1660−11.25
Note: *** p < 0.01, ** p < 0.05; the relevant index data in this paper have been logarithmically processed.
Table 4. Distribution of technical efficiency across different samples.
Production Technology Efficiency RangeAll SamplesSubsample
(Adopted Group)
Subsample
(Non-Adopted Group)
Sample SizeProportion (%)Sample SizeProportion (%)Sample SizeProportion (%)
Below 0.6214.23002111.48
[0.6, 0.7)387.66003820.77
[0.7, 0.8)9919.965316.934625.14
[0.8, 0.9)22545.3616653.045932.24
[0.9, 1.0)11322.789430.031910.38
Table 5. Estimation of farmers’ adoption of AMSs based on the logit model.
VariableCoefficient EstimateStandard ErrorZ Value
Age of the household head0.037 *0.0142.56
Education level 0.488 **0.1832.67
Number of family agricultural works0.850 ***0.1904.46
Planting area0.0010.0030.31
Proportion of planting industry income 0.053 ***0.0068.90
Number of Plots−0.288 ***0.077−3.72
Whether they received agricultural production and operation training0.680 *0.2652.57
Whether they joined a cooperative0.1060.2580.41
Degree of irrigation convenience0.794 ***0.1704.66
Constant−9.139 ***1.470−6.22
LR statistic260.86
Pseudo R20.399
Sample size496
Note: *** p < 0.01, ** p < 0.05, * p < 0.1.
Table 6. Balance test of control variables before and after matching.
Matching MethodsPseudo R2LR chi2p > chi2Mean BiasMed Bias
Before matching0.399260.320.00046.630.6
Nearest neighbor matching0.01711.540.2418.87.2
Caliper nearest neighbor matching0.01711.540.2418.87.2
Caliper matching0.02114.690.10010.97.1
Kernel matching0.02819.770.01910.29.6
Table 7. Average treatment effect of AMSs on technical efficiency.
Matching MethodsTreatment Group MeanControl Group MeanATTATUt ValueStandard Error
Nearest neighbor matching0.8540.7630.85770.7610.136 ***0.020
Caliper nearest neighbor matching0.8540.7630.85770.7610.136 ***0. 019
Caliper matching0.8620.7560.85780.7620.126 ***0.021
Kernel matching0.8580.7610.85770.7610.137 ***0.019
Note: *** indicates significance at the 1% statistical level.
Table 8. Parameter estimation of the Translog stochastic frontier production function model.
ProjectCoefficient EstimateStandard ErrorProjectCoefficient EstimateStandard Error
In S0.170 ***0.1697In S × In C−0.0310.0307
In C−0.0160.0159In S × In M−0.031 *0.0309
In M−0.145 ***0.1452In S × In W0.011 **0.0114
In W0.283 ***0.2830In S × In L0.020 ***0.0197
In L0.054 ***0.0537In C × In M0.0200.0203
In S20.000 ***0.0004In C × In W0.0010.0006
In C20.0030.0034In C × In L−0.0050.0053
In M2−0.002 *0.0017In M × In W−0.022 *0.0224
In W20.2830.0226In M × In L−0.000 **0.0010
In L2−0.007 **0.0074In W × In L−0.007 ***0.0070
lnsig2v−4.870 ***0.3965lnsig2u−1.602 ***0.0640
Note: *** p < 0.01, ** p < 0.05, * p < 0.1.
Disclaimer/Publisher’s Note: The statements, opinions and data contained in all publications are solely those of the individual author(s) and contributor(s) and not of MDPI and/or the editor(s). MDPI and/or the editor(s) disclaim responsibility for any injury to people or property resulting from any ideas, methods, instructions or products referred to in the content.

