Article

Physicochemical and Compositional Characterization of a Wild Fruit from the Angolan Miombo: Anisophyllea boehmii Engl.

1
Instituto de Tecnologia Agro-Alimentar, Rainha Njinga a Mbande University, Malanje, Angola
2
QualiSud, Université de Montpellier, Avignon Université, CIRAD, Institut Agro Montpellier, IRD, Université de La Réunion, Montpellier, France
3
CIRAD, UMR QualiSud, F-34398 Montpellier, France
*
Author to whom correspondence should be addressed.
Agriculture 2025, 15(11), 1175; https://doi.org/10.3390/agriculture15111175
Submission received: 11 April 2025 / Revised: 24 May 2025 / Accepted: 26 May 2025 / Published: 29 May 2025

Abstract

:
The loengo (Anisophyllea boehmii Engl.) is a wild fruit originating from the Miombo forest. It is very popular in Angola and has great potential for local development. However, as it has received little attention from researchers, its composition is not well known. Against this backdrop, the proposed study aimed to characterize different samples of the fruit in order to better assess its nutritional and organoleptic value. First, a field survey was conducted to gather information on the harvesting period, prices, and consumption patterns. Then, four samples of several kilograms of fruit each were collected from three different areas in 2 consecutive years. The proximate composition and the polyphenolic, carotenoid, and aroma compound profiles of their pulp were compared. The study showed that the fruit is widely consumed for 8 months of the year. It is difficult to keep fresh and is often processed into drinks. The pulp was found to be rich in sugars, with a pH of around 3.2. Loengo is a good source of fiber, minerals, polyphenols (such as cyanidin 3-O-glucoside and flavonol glycosides), and carotenoids (such as β-cryptoxanthin and β-carotene). Its aroma is associated with around 50 aroma compounds, primarily esters. This fruit therefore has interesting nutritional quality and technological potential. Certain compositional elements correlated with the area and the year of harvest. Further study of the processing of the fruit into pasteurized beverages is warranted for local added value.

Graphical Abstract

1. Introduction

The African continent has a wide variety of wild plants and cultivated native species with significant agronomic, commercial, and nutritional potential. It is estimated that more than two-thirds of the continent’s population of 600 million depend directly or indirectly on forest resources, either for subsistence or as a source of income [1].
The Miombo woodlands are the most extensive forest in southern and eastern Africa, covering about 2.7 million km2, characterized by a hot and dry climate that allows for the formation of seasonal tropical forests [2,3]. The area substantially extends into seven southern African countries: Angola, Zimbabwe, Zambia, Malawi, Mozambique, Tanzania, and the largest part in the south of the Democratic Republic of the Congo [2,3,4,5]. This region is characterized by areas where the average annual rainfall is around 700 mm, that have low nutrient soils, and in which the genera Brachystegia, Julbernardia, and Isoberlinia predominate [3,5,6].
This particular ecosystem includes many species of wild fruit trees and shrubs that produce edible fruits that are widely consumed by local populations and also largely harvested for sale in large city markets. Among these local resources, the fruits of Anisophyllea boehmii Engl., called loengo in Angola, are particularly appreciated by both the rural and urban populations [7].
As for the morphological characteristics of the plant, it is a tree that reaches 10 to 15 m in height. The leaves are alternate, simple, oval, or elliptical, and shiny dark green on the upper surface. The fruit is a drupe of an ellipsoidal shape and a dark purple color [8,9,10]. These plum-like fruits appear during the rainy season and are eaten fresh and also prepared as juices, jellies, or added to porridge [11,12]. Some studies have shown that the pulp of the fruit contains several compounds of interest, such as beneficial minerals and bioactive antioxidants (phenolics and carotenoids), and that its kernel contains around 30% oil, rich in unsaturated fatty acids, such as oleic, palmitoleic, and linoleic acids [9,11,13].
Kalaba [12] conducted a population survey in Copperbelt, Zambia on the uses of the A. boehmii Engl. plant that revealed that it is also exploited for its medicinal properties, where an infusion of the roots is used to treat dysentery and diarrhea, while bark decoctions are used to treat syphilis, stomach aches, and as a mouthwash to treat toothache and bleeding gums.
Scientific knowledge of this fruit, which is therefore common in the eating habits of the Miombo region, nevertheless remains poor; it is barely characterized. In the Angolan context, the proposed work aims to provide elements for a better assessment of the commercial, nutritional, and organoleptic potential of the fruit. To begin with, a field survey was carried out to gain an insight into consumers’ eating habits regarding this fruit. Then, in order to complete the only work carried out on the fruit pulp by Lofa et al., 2024 [13], who determined the proximate composition, this study presents for the first time an original detailed study of the characteristics and composition of loengo and its variability, through a comparison of different samples collected in Angola.

2. Materials and Methods

2.1. Survey Methodology

This study was initiated by collecting information through a semi-structured survey of a sample of people who usually consume the fruit.
The survey was conducted between July and August 2021. It included 57 open-ended and 12 closed-ended questions on the harvesting period, the quantity of fruit harvested per day, selling price, storage time, monthly consumption, and processed products (full questionnaire given in the Supplementary File). Twelve persons were interviewed in each of the locations chosen, totaling 48 people, randomly selected from the markets, where they had to answer the survey questions orally. These respondents were collectors, sellers, and/or consumers. The locations chosen were Malanje (Chawande market), Huambo (Luvili market), Huíla (Mutundo market), and Benguela (Babaera market) (Figure 1).

2.2. Plant Material

The plant material consisted of two groups of samples. Firstly, the fruits were purchased from markets in three locations studied in 2021 (Malanje, Huambo, and Huíla). The fruits were blended to create the sample Ab21. Three other samples were then collected between July and August 2022: AbM22 from the Malanje area, AbHb22 from the Huambo area, and AbHa22 from the Huíla area, as shown in Figure 1. In the Huíla location, the insufficient quantity of fruits obtained from the market required completing the sample with fruits directly collected from the trees operated by the vendor, and then the fruits were mixed together. In the case of Malanje and Huambo, the fruits were only sampled in the market. In order to ensure their origin, the team members traveled with the vendors to the collection locations, confirming that the fruits had been harvested in the same area.
In all cases, the fruits were chosen for their uniform ripening, without visual defects, disease, pest attacks, or mechanical injuries (Figure 2). Three kg of fruit was collected for each sample, washed, and disinfected with 100 ppm sodium hypochlorite solution and then frozen at −20 °C. Fruits collected in 2021 were frozen whole directly and depulped after 60 days of storage, whereas fruits collected in 2022 were depulped before freezing using a PH3 refiner (Auriol, Marmande, France). One part of the pulp was freeze-dried for subsequent analyses using a Benchtop freeze dryer (Cryonext, Montpellier, France).

2.3. Morphological Characterization

A digital caliper was used to measure the longitudinal and transversal diameters of 30 fruits taken at random from each loengo sample under room temperature conditions. The whole fresh fruit and the pulp mass of each fruit after separation from the stone were weighed using a balance Pioneer PX electronic scale (Ohaus, Parsippany, NJ, USA).

2.4. Proximate Composition of Fruits

The overall characterization of the fruits was carried out in triplicate. The dry matter (DM) was produced via desiccation at 70 °C at 0.13 bar (RVT 360, Heraeus GmbH, Hanau, Germany), the total soluble solids (TSSs) using a refractometer type PAL-3 Pocket (Atago, Tokyo, Japan), and the pH and titratable acidity (TA) using an automatic titrator TitroLine (Schott, Mayence, Germany) with 0.1 N NaOH up to reach pH 8.2. The determination of the total nitrogen was carried out via the Dumas method and a factor of 6.25 kgprot · kgNitrogen−1 to estimate the protein content [14]. Lipids were evaluated using the Folch method [15].
Dietary fibers were determined through different hydrolysis steps and were expressed as insoluble Neutral Detergent Fibers (NDFs, which is the sum of hemicellulose, cellulose, and lignin mass), Acid Detergent Fibers (ADFs, cellulose and lignin), and Acid Detergent Lignin (ADL). These were carried out using an Ankom 200 fiber analyzer (Ankom Technology, Macedon, NY, USA) according to the Van Soest method [16].
The profiles of simple sugars (glucose, fructose, and sucrose) and organic acids were determined via a 1290 Infinity II HPLC system (Agilent Technology, Santa Clara, CA, USA) according to the method proposed by Chin et al. [17]. The mineral profile was determined using inductively coupled plasma atomic emission spectrophotometry ICP-AES according to the method reported by Thanh et al. [18].

2.5. Polyphenol Analysis

2.5.1. Polyphenol Extraction

Polyphenol extraction was performed with a ratio of loengo powder/solvent (acetone/water/formic acid—70/28/2, v/v/v) of 1/10 w/v stirred for 10 min. After recovering the supernatant, 5 mL of solvent was added to the residue and stirred for 10 min. The two liquid fractions were combined and centrifuged at 10,000× g at 4 °C for 10 min. The supernatant was then recovered and evaporated to dryness under vacuum at 45 °C. The dry residue was taken up with 4 mL of methanol/water/formic acid 50/48/2 (v/v/v) and filtered through a 0.45 μm syringe filter. For HPLC, the dry extract was recovered with 1 mL of the same solvent before filtration at 0.45 µm.

2.5.2. Total Phenolic Content (TPC)

The TPC was determined using the Folin–Ciocalteu colorimetric method described by Servent et al. [19], and the analyses were carried out in triplicate. To do this, 10% Folin–Ciocalteu and 7.5% Na2CO3 were added to the hydroalcoholic extract to initiate the reaction. The absorbance was measured at 760 nm using a UV/visible Jenway 7205 spectrophotometer (Jenway, London, UK). A calibration curve was created from 3.90 to 250 mg of gallic acid·L−1. The results were expressed in mg eq. GA·100 g−1 DM.

2.5.3. Phenolic Compound Analysis

The polyphenol profile analysis was performed via HPLC-DAD and MSn by adapting the method described by Mertz et al. [20].
The HPLC system used was an Agilent 1200 Series (Agilent Technologies, Santa Clara, CA, USA) that was equipped with a diode array detector (DAD). The separation was carried out using an ACE 5 C18 column (250 mm × 4.6 mm, 5 μm, Avantor, Radnor, PA, USA) at 30 °C. The mobile phase consisted of the solvents A, water Milli-Q/HCO2H (99/1, v/v), and B, acetonitrile (Table S1). The injection volume was 20 μL and the mobile phase flow rate was set at 0.7 mL·min−1. Detection was performed at 360 and 510 nm. Concentrations were determined using standard solutions between 0.004 and 0.2 g·L−1 for quercetin and between 0.2 and 0.67 g·L−1 for cyanidin 3-O-glucoside (C3G).
The HPLC-MSn was carried out with an Acquity UPLC chromatograph (Waters, Milford, MA, USA) equipped with an UV-vis diode array detector (DAD) coupled with a HCT ultra ion trap mass spectrometer with an electrospray ionization (ESI) mode (Bruker Daltonics, Bremen, Germany). Using the same column at 30 °C, the binary gradient used was as follows: A: 1% formic acid and B: acetonitrile. The initial conditions were 5% B, t = 20 min 14% B, t = 55 min 35% B, with the flow rate set at 0.7 mL·min−1.

2.6. Carotenoid Analysis

2.6.1. Carotenoid Extraction

For the extraction of carotenoids, 3 g of pulp was added to 15 mL of the solvent ethanol/hexane 4/3 (v/v) and 0.1% BHT, mixed with 100 mg of MgCO3 followed by homogenization for 1 min using an Ultra-Turrax T10 homogenizer (IKA, Delft, The Netherlands). The supernatant was separated from the residue via filtration with a filter funnel (porosity no. 2), then 15 mL of the same solvent was added to the residue and the second supernatant was also recovered. Afterwards, the residue was washed with 10 mL of hexane and filtered. Finally, the organic phases were transferred to a separatory funnel and washed successively with 40 mL of 10% NaCl and 2 × 40 mL of distilled water. The aqueous phase was removed and the organic phase was recovered, dried with anhydrous Na2SO4, and filtered before evaporation to dryness using a rotary vacuum evaporator at 30 °C.

2.6.2. Saponification

For saponification, the extract was dissolved in 10 mL of pure hexane and mixed with 10 mL of 10% (v/v) MeOH/KOH. The mixture was stirred under nitrogen for 16–17 h in the dark at room temperature. Subsequently, the organic extract was transferred to a separatory funnel, to which 50 mL of distilled water was added. The hexanic phase was rinsed until it was free of alkali (KOH) and recovered. Then, the methanolic phase (KOH) was extracted with 3 × 20 mL of pure hexane. The extracts were combined and washed again with 2 × 50 mL of distilled water. The organic phase was dried with anhydrous Na2SO4, filtered, and evaporated to dryness in a rotary evaporator. The residue was recovered by dissolving it in 1 mL of methanol/methyl-tert-butyl ether (MeOH/MTBE) 20/80 v/v.

2.6.3. Total Carotenoid Quantification

The total carotenoids were quantified before saponification using spectrophotometry at 451 nm using the method described by Peng et al. [21]. The value of the molar extinction coefficient (εmol) of β-carotene used was 139,500 L·mol−1·cm−1 [22].

2.6.4. Determination of Carotenoid Profiles

The carotenoid profiles before and after saponification were determined using the HPLC-DAD method, adapted from that described by Mertz et al. [23]. The carotenoids were separated using a 250 × 4.6 mm and 5 μm C30 column (YMC, Kyoto, Japan) connected to a guard column. The system used for separation was an Agilent 1100 series liquid chromatograph (Agilent, USA) equipped with a cooled automatic injector. The column temperature was maintained at 25 °C. The mobile phase flow rate was 1 mL·min−1 and the injection volume was 20 μL. The mobile phase was a mixture of eluent A—H2O Milli-Q, eluent B—methanol, and eluent C—MTBE. The solvent gradient was set as follows: 0–2 min, 40% A and 60% B (initial conditions); 2–5 min, 20% A and 80% B; 5–10 min, 4% A, 81% B, and 15% C; 10–60 min, 4% A, 11% B, and 85% C; 60–70 min, 4% A, 11% B, and 85% C; 70–71 min, 100% C; 71–72 min, return to initial re-equilibration conditions. The DAD was set at 450 and 470 nm, with full spectrum acquisition between 190 and 600 nm.
To identify the carotenoids, specific retention times and spectral absorption characteristics (% III/II) were used. These parameters were compared with known carotenoid molecules reported in the literature to ensure accurate identification, and expressed in β-carotene.

2.7. Aroma Compound Analysis

To extract volatile compounds, 1 g of homogenized loengo pulp was placed in a Teflon-stoppered vial and extracted via Headspace Solid-Phase Micro Extraction (HS-SPME). The aromas were analyzed using an Agilent 6890 series GC coupled with an Agilent 5973 MS (Agilent, USA) and with a Gerstel MPS-2 sampler. Trapping was carried out under orbital agitation for 45 min with a 65 µm DVB (divinylbenzene), CAR (carboxen), and PDMS (polydimethylsiloxane) fiber (Supelco, Bellefonte, PA, USA) at 50 °C after 10 min incubation. A DB-WAX capillary polar column of 60 m, 0.25 mm, and phase film thickness of 0.25 µm (J&W Scientific, Folsom, CA, USA) was used with H2 as the carrier gas, set at a flow rate of 1.5 mL·min−1. The fiber was desorbed at 250 °C and the compounds were separated using the following temperature program: the initial oven temperature was 40 °C (5 min isotherm), then increased by 2 °C·min−1 to 140 °C, then by 10 °C·min−1 to 250 °C, and maintained for 10 min. The analyzer and source temperatures were 150 °C and 250 °C, respectively. The data were analyzed with MassHunter version B.06.00 (Agilent Technologies, USA). The NIST 2011 (National Institute of Standard Technology) database was chosen to tentatively identify peaks through comparison with their mass spectra [24].
To identify the aromatic compounds, the retention time and Kovats retention index of each molecule were compared with the library mentioned above, considering the match factor equal to or greater than 80%. The quantified aroma compounds selected for this study were the peaks presenting more than 0.5% of the total relative area. The results were expressed in µg eq. 3-heptanol internal standard·kg−1 of Fresh Matter (FM). The limit of detection and quantification (LOD and LOQ) were calculated using the signal/noise ratio method and were estimated at 0.87 µg·kg−1 and 2.90 µg·kg−1 for LOD and LOQ, respectively.

2.8. Statistical Analysis

The survey data were processed using Google Forms, and the results of the physicochemical, bioactive compound, PCA, and statistical analyses were realized using XLSTAT 2024 software (Addinsoft, Bordeaux, France). Comparisons between mean values were carried out using the Tukey HSD test (p < 0.05). Venn diagram analyses were carried out using R Studio version 4.3.2 software.

3. Results and Discussion

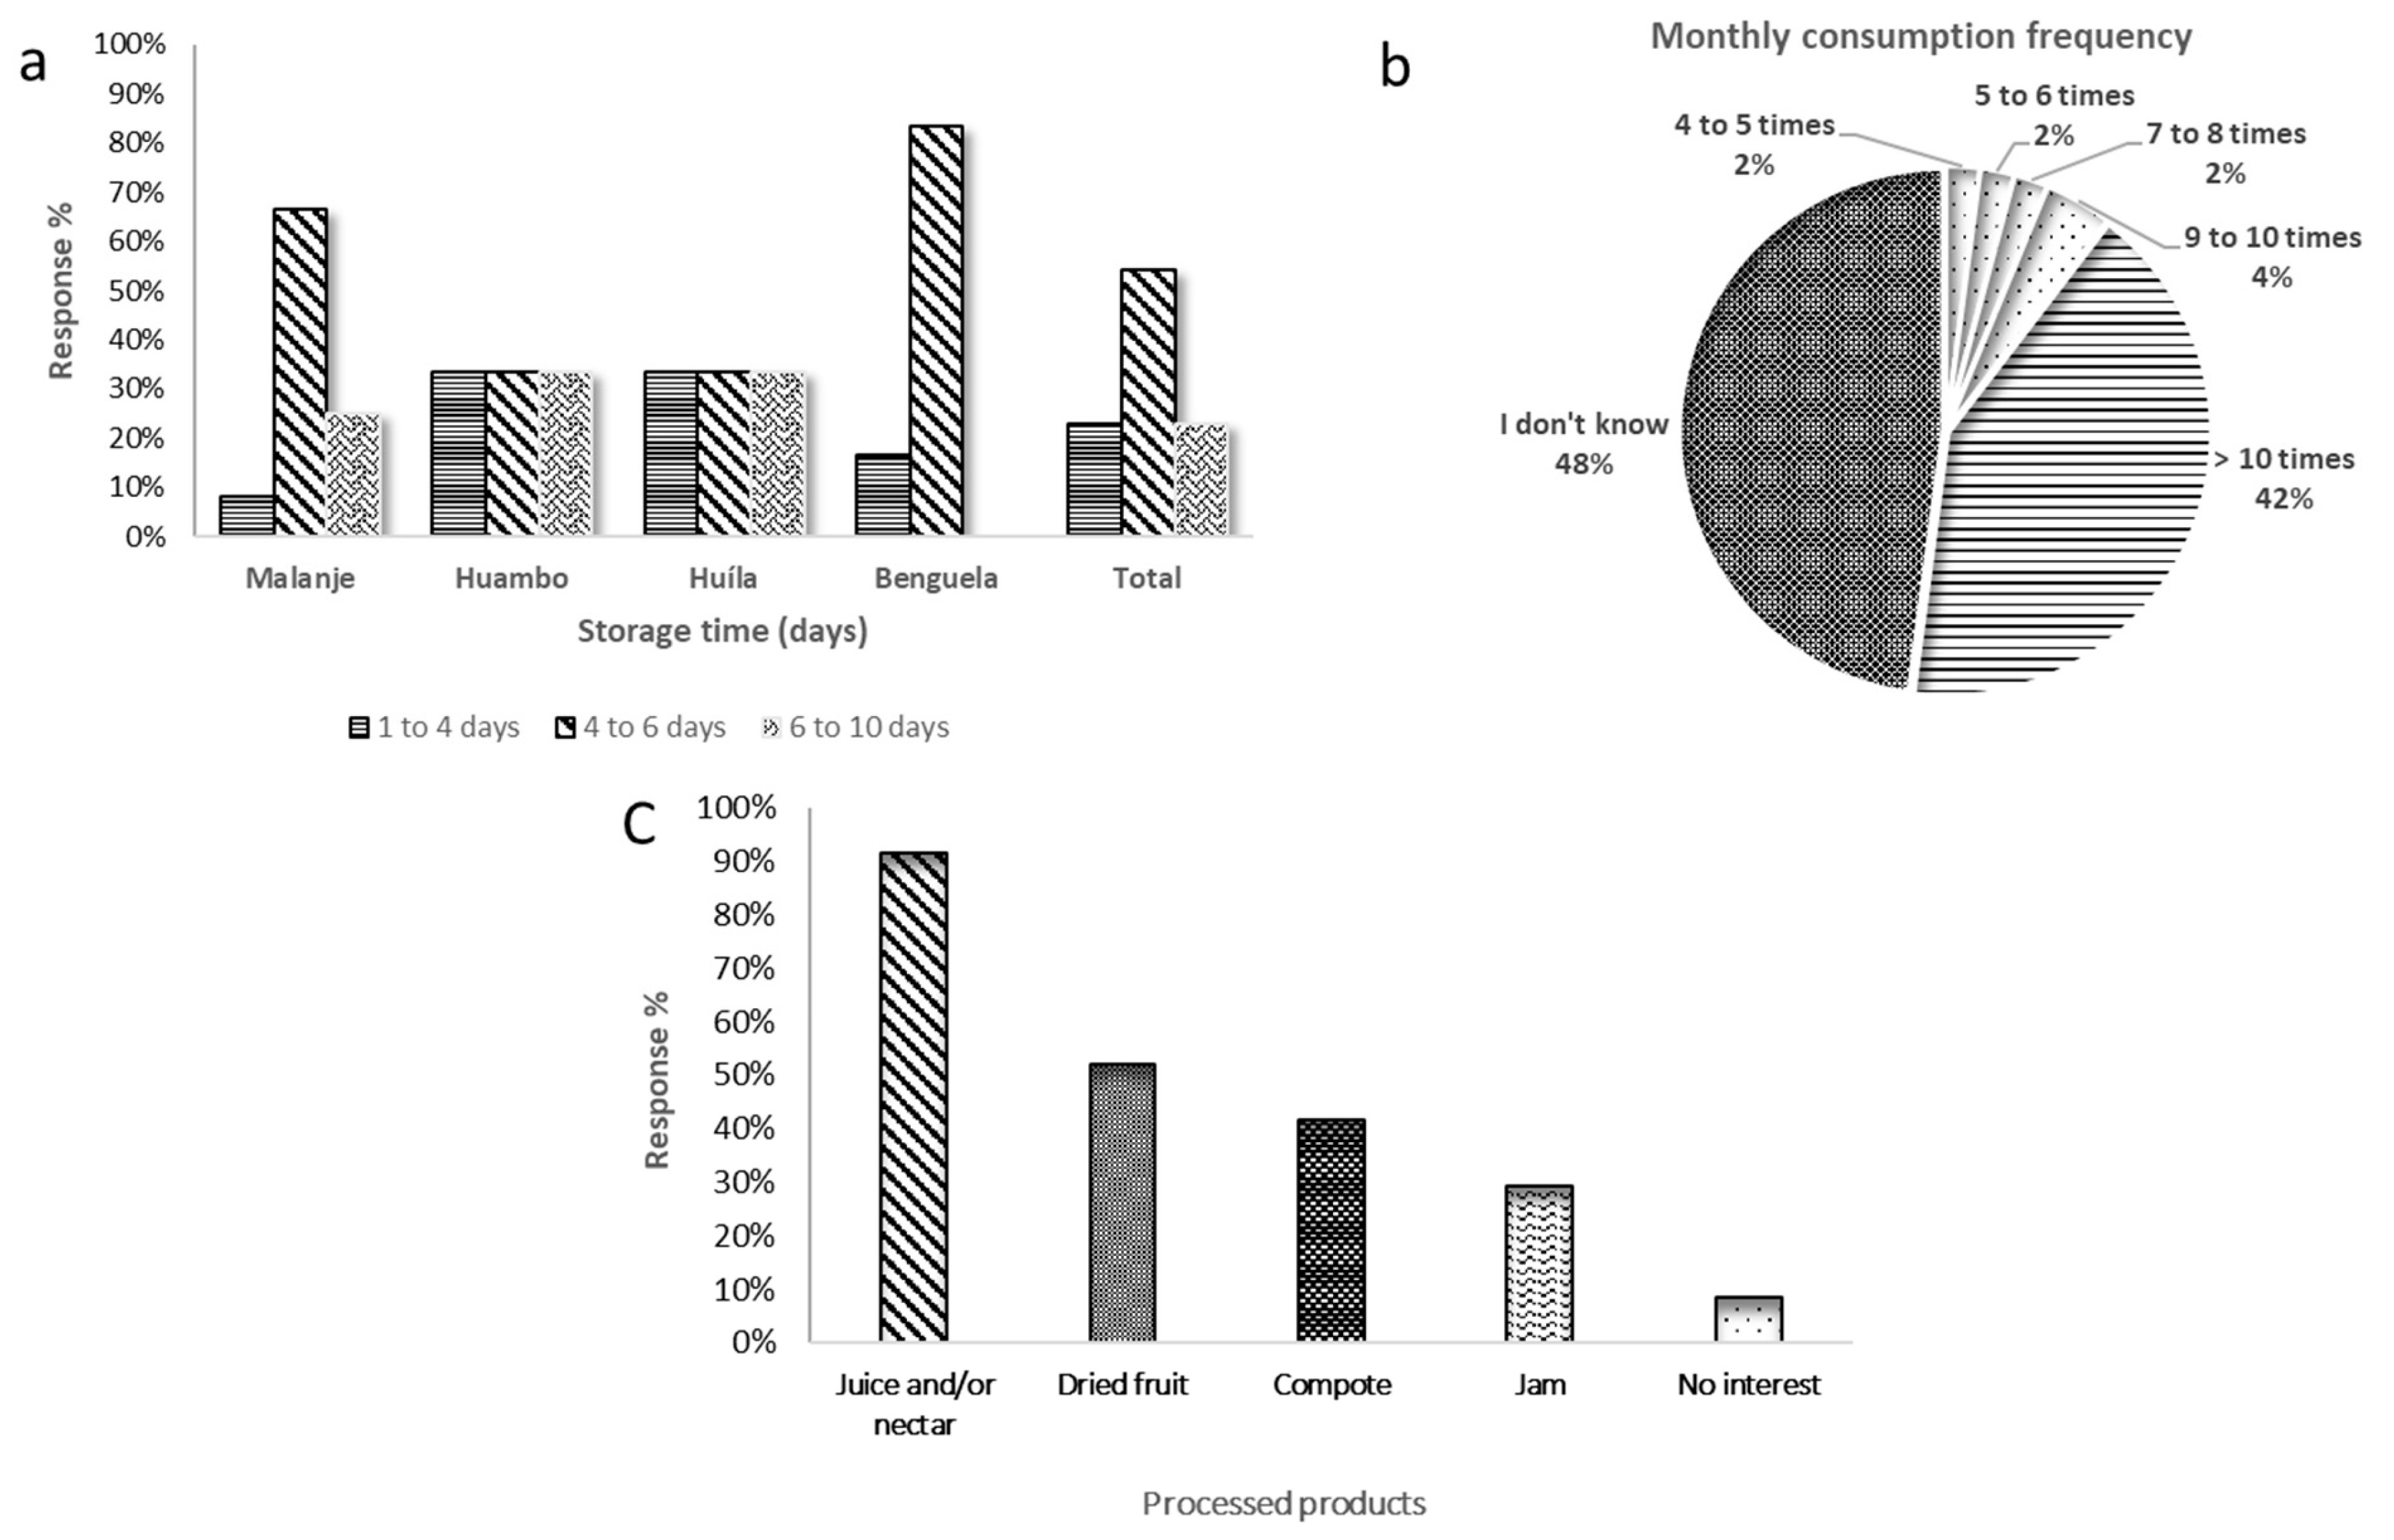
3.1. Main Results of the Survey

The profiles of the respondents are presented in Figure S1.
Regardless of the study area, the respondents were predominantly women (Figure S1a), with an average of 79%, of whom 47% were between 15 and 25 years (the age distribution was very similar in the four survey areas), and all the men were between 15 and 25 years old (Figure S1b). Indeed, in these regions, the harvesting of wild fruits is generally carried out by young female adults. This prominent role of women is reported in the numerous studies on this subject [25,26].
Only the elements that seem to us to be the most relevant and significant are presented below for each of the different sections of the survey. According to 50 to 70% of respondents, the harvest period spanned from August to March (Figure 3a). The peak in production began in October. Altitude and latitude had little influence on the ripening process and fruit harvest, as the production season coincided across all areas. These results were consistent with those reported by Mendelsohn and Weber [27] in the Huambo area, and also by Nkengurutse et al. [9] in Burundi, who observed that loengo generally ripens from mid-November to the end of December and sometimes until January. It was noticed that in all the locations studied, the respondents only knew one variety. For 69% of them, the loengo is a non-climacteric fruit. Activities such as the felling of trees and anarchic fires were the reasons that led 60% of the respondents to state that this fruit could be in danger of extinction.
Figure 3b showed that the quantity of fruit harvested was on average higher in the Huíla and Benguela areas, with about 2 kg per day per tree, while in the other two areas (Malanje and Huambo), it was around 1 kg per day per tree. The selling price of this underexploited fruit fluctuated at the time of the study (Figure 3c). This fluctuation depends on the time of year, access to the production area, and demand. Indeed, prices fluctuated by a factor of 10, most often ranging from EUR 0.16 to 1.00 ·kg−1 in 2015. According to Nkengurutse et al. [9], the price of one kilogram of A. boehmii fruit in Burundi was close to EUR 1, which was similar to the prices observed in this study.
Figure 4a shows that 54% of respondents kept the fruit for between 4 and 6 days. It could only be stored for a few days, meaning that without any specific preservation method, loengo was a highly perishable fruit. None of the respondents used preservatives. The fast dehydration of the fruit and changes in color were the main defects mentioned. In the Huíla and Huambo areas, respondents reported that this fruit could be stored for a longer time (around 3 days more) compared to in Malanje and Benguela. This was probably explained by the average temperatures during the harvest season, which were lower in Huíla and Huambo (19–20 °C) and higher in Malanje and Benguela (22–26 °C).
In terms of consumption frequency, about half of the respondents did not know exactly how often they consume the fruit (Figure 4b). Among those who answered quantitatively, more than four out of five consumed the fruit frequently, with a frequency of over 10 times per month during the production season. However, respondents were unable to provide precise details about portion sizes. One hundred per cent of the respondents stated that they consume the fruit at all times, without knowing the exact quantity consumed. However, it was observed that there are no age restrictions on consuming the fruit in Malanje and Huambo, while 58.3% of respondents in Huíla and 8.3% in Benguela said that restrictions apply to children under 5 years old.
Finally, Figure 4c shows the significant interest in various processed loengo products, ranked by priority: drinks such as juice or nectar > dried fruit > sweet, cooked products like compotes and jams. According to [25], in Zambia, rural families traditionally process nearly 46% of the wild fruits into juice and/or porridge after mixing with cereals. It is worth noting that, during the survey conducted in Angola, no commercial processed products from loengo were encountered or mentioned. Fifty-eight per cent of the respondents cited transportation difficulties and a lack of conservation systems as the main reasons for not selling processed loengo products.

3.2. Main Characteristics of the Fruits and Overall Composition

The results of the overall analyses are presented in Table 1.
The results observed in Table 1 indicate that the loengo fruit had an average mass of approximately 14 g, with the pulp mass fraction ranging from 7 to 8 g. The fractional yield of the pulp after depulping averaged 55%, which was explained by the large seed size and the strong attachment of the pulp to the seed, making separation challenging regardless of the method used. The fruit was characterized as a red drupe, with an ellipsoid shape, an average longitudinal diameter ranging between 28 mm and 31 mm, and an average transverse diameter of 24 mm, with minimal variation observed between the samples. The physical parameters of the 2021 sample could not be measured due to a lack of measurement conditions at the time of acquiring these samples and subsequently freezing the fruits for 60 days. This period led to modifications in the fruits’ physical characteristics, preventing measurement. The analyzed samples showed high homogeneity in terms of size, with standard deviations of less than 10% of the average values obtained from 30 randomly selected fruits.
These results were lower than those obtained by Nkengurutse et al. [9] for the same fruit species in Burundi, where the average fruit mass ranged from 16 to 25 g, with a longitudinal diameter varying between 33 and 40 mm and a transverse diameter between 29 and 34 mm. Similarly, for the same fruits that were collected in Huambo, Lofa et al. [13] reported an average fruit mass of 9.4 g, a longitudinal diameter of 34.8 mm, and a transverse diameter of 20 mm. These variations in physical characteristics could be influenced by the variety, but also by several other factors, including geographical location, climatic conditions, harvest year, and maturity stage.
The DM content of the samples ranged from 20 to 25 g·100 g−1, which was relatively high for a fleshy fruit. The highest DM content was found in the Ab21 sample. Statistically, significant differences were observed at p < 0.05 between the samples. The soil and climatic conditions, such as the average temperature, likely explained these variations. The measured DM contents were similar to those reported by Lofa et al. [13] and Malaisse [28] for the same fruit, with an average value of around 26 g·100 g−1. However, these contents were higher than those reported by Onivogui et al. [29] for fruits of the same genus, A. laurina R.Br. ex Sabine, with a content of 18 g·100 g−1, and by Binaki et al. [8] for A. quangensis, which had an average content of 17 g·100 g−1.
The average TSSs concentration of the samples ranged from 16 to 20 g·100 g−1 FM. Statistically, no significant difference was observed between the AbM22 and AbHb22 samples at p > 0.05. When comparing the TSSs and DM values, we observed that approximately 80% of the DM consists of soluble components. It was noteworthy that the TSSs content was quite high compared to that of other wild fruits, such as Umbu-caja (Spondias tuberosa × S. mombin), with an average of 10% [30], and jaboticaba (Myrciaria jabuticaba) fruit, with average of 13–16% [31], but comparable to banana, with TSSs values ranging from 20 to 25 g·100 g−1 FM [32], and soursop (Annona muricata), with an average of around 23% [33].
The measured pH values were similar, ranging from 3.1 to 3.3. The highest pH values were obtained in the Ab21 and AbHa22 samples. The TA contents ranged between 1.86 and 2.62 g eq. cit·100 g−1 FM. Statistically, the Ab21 samples were significantly different from the other samples at p < 0.05. These results were slightly higher than those found by Lofa et al. [13] for the same fruit (1.2 g eq. cit·100 g−1 FM). For comparison with a fruit of the same genus A. laurina, Onivogui et al. [29] reported a pH value of 3.09, which was similar to the results obtained in this study, as well as those reported by Lofa et al. [13] for the same species (A. boehmii), which had a pH value of 3.1. The analysis of the organic acid profile revealed two major compounds: citric acid and malic acid. Citric acid was predominant, accounting for 70% w/w of organic acids. The acid contents were highest in AbHa22, followed by AbM22, then Ab21, and lowest in AbHb22. As with sugars, these variations from one sample to another can be explained by a multitude of factors. The measured acid contents were much higher than those reported by Onivogui et al. [29] in the A. laurina fruit, with averages of 9.64 and 0.93 g·100 g−1 of DM for citric and malic acids, respectively, or by Lofa et al. [13] in loengo fruit, with 5.26 and 0.44 g·100 g−1 of DM, respectively.
The sugar/acid ratio (TSSs/TA) is an important quality factor. It is often used to determine the stage of ripeness of fruits. Furthermore, it accurately represents their taste quality, with a higher ratio generally being a guarantee of better organoleptic quality. In our case, the fruits from Malanje and Huambo showed the highest TSSs/TA ratios. The values obtained showed that the high acidity of the pulp was compensated by its high sugar content. These values were of the same order of magnitude as the 6 to 17 gsugar·gacid−1 obtained on plum cultivars (Prunus domestica L.) by Dimkova et al. [34], but considerably lower than those reported on several mango varieties by Kante-Traore et al. [35], which oscillated between 23 and 133 gsugar·gacid−1.
In terms of protein, the AbHb22 and AbHa22 fruits showed significantly higher contents, with around 8.1 g·100 g−1 of DM compared to the other two samples. These values were of the same order of magnitude as those reported by Lofa et al. [13] in loengo fruit, with 7.4 g·100 g−1 of DM, but higher than those reported by Onivogui et al. [29] in A. laurina, with an average total protein content of 1.56 g·100 g−1 of DM.
For lipids, all samples were equivalent, with an average content of 3.63 g·100 g−1 DM. This value was similar to that obtained by Binaki et al. [8] in A. quangensis fruits (3.98 g·100 g−1 of DM), but higher than those reported by Onivogui et al. [29] in A. laurina fruits (1.31 g·100 g−1 of DM) and by Lofa et al. [13] in loengo fruit (0.12 g·100 g−1 of DM).
Regarding the insoluble dietary fiber concentration, the four fruit samples were significantly different—in decreasing order Ab21, AbHa22, AbHb22, and finally AbM22. However, our results were lower than those obtained by Kendrick et al. [36] in wild African figs (Ficus spp.), with 33 to 57% DM for NDFs, 25 to 46% DM for ADFs, and 10 to 27% DM for ADL, and also lower than those obtained by Samuel [37] in mangoes with 40, 20, and 18% DM, for NDFs, ADFs, and ADL, respectively. The higher the ADFs (cellulose and lignin) content, the greater the negative influence on digestibility. However, these fibers constitute a source of non-digestible complex carbohydrates that, by absorbing a lot of water, play a major role in intestinal transit. The loengo is therefore a fiber-rich fruit, with contents of between 3 and 4% FM.
Sucrose was the most concentrated sugar, followed by fructose and glucose. Sucrose represented between 40 and 55% of the total sugars, with contents ranging from 18.1 to 35.1 g·100 g−1 of DM. Both reducing sugars were present at similar concentrations. The fructose content was, however, slightly higher than that of glucose. The samples were significantly different in terms of the sucrose concentration. Compared to the TSSs results, sugars accounted for 60 and 80% of the soluble compounds present in the pulp, which is the case in most fruits. Furthermore, Lofa et al. [13] obtained much higher fructose and glucose contents for loengo fruit of 18.1 and 19.9 g·100 g−1 of DM, respectively.
This fruit was rich in minerals, representing between 4.3 and 5.5 g·100 g−1 of DM. Statistically, there was a significant difference between the Ab21 sample and the other three 2022 samples. The ash content obtained was similar to that reported by Lofa et al. [13] in the loengo fruit and by Onivogui et al. [29] in the A. laurina fruit, with 4.8 and 5.7 g·100 g−1 of DM, respectively. In contrast, a considerably lower content was obtained by Malaisse [28] in the loengo fruit (2.8 g·100 g−1 of DM). The macroelements with the highest contents were K, Ca, and Mg. The most represented trace elements were Mn, Fe, B, and Cu. These oligoelements have positive effects on the maintenance of human health and are essential for cellular function. The results were similar to those of [13], except for the Na content, which was much higher (0.13 g·100 g−1 of DM). The same applied to [29], who obtained K, Ca, Mg, and Zn contents of the same order of magnitude in A. laurina fruits, but higher Na (0.017% DM) and Fe (141 mg·kg−1 of DM) contents. Our results showed Mn, Fe, and Cu contents significantly higher than those obtained by Aurore et al. [38] on bananas, with respective values of 7.7, 16.2, and 4 mg·kg−1 DM. Our values were also higher than those of Forster et al. [39] on bananas, with averages of 1.8, 8.7, and 1.3 mg·100 g−1 of DM for Mn, Fe, and Cu, respectively. The research by Shi et al. [40] on 28 mango genotypes revealed lower Mn (12.69 to 103.48 mg·kg−1 of DM) and Fe (8.84 to 16.49 mg·kg−1 of DM) contents, but the Cu (3.84 to 7.18 mg·kg−1 of DM) contents were comparable to our results.
The energy values of A. boehmii fruits ranged between 1008 and 1317 kJ·100 g−1 of DM, a high value linked to the high concentration of sugars. These values were slightly lower than those found by Malaisse [28] and Onivogui et al. [29] on Anisophyllea fruits (1345 and 1565 kJ·100 g−1 of DM, respectively) and those reported by Ding and Tee [41] in Canarium odontophyllum Miq, with 1418 kJ·100 g−1 of DM. The research by Maldonado-Celis et al. [42] on mangoes revealed energy values of between 260 and 795 kJ·100 g−1 of DM, considerably lower than our results.
In summary, the analyses carried out showed a certain homogeneity in the composition of the four batches of fruits tested. However, a more comprehensive study should be carried out by increasing the number of samples to better appreciate the diversity of the fruit composition in each area. Indeed, this composition was affected by a large number of different factors, including genotype, ecotype, age of the plant, climate, soil, harvest season, the stage of fruit ripeness, and storage conditions.

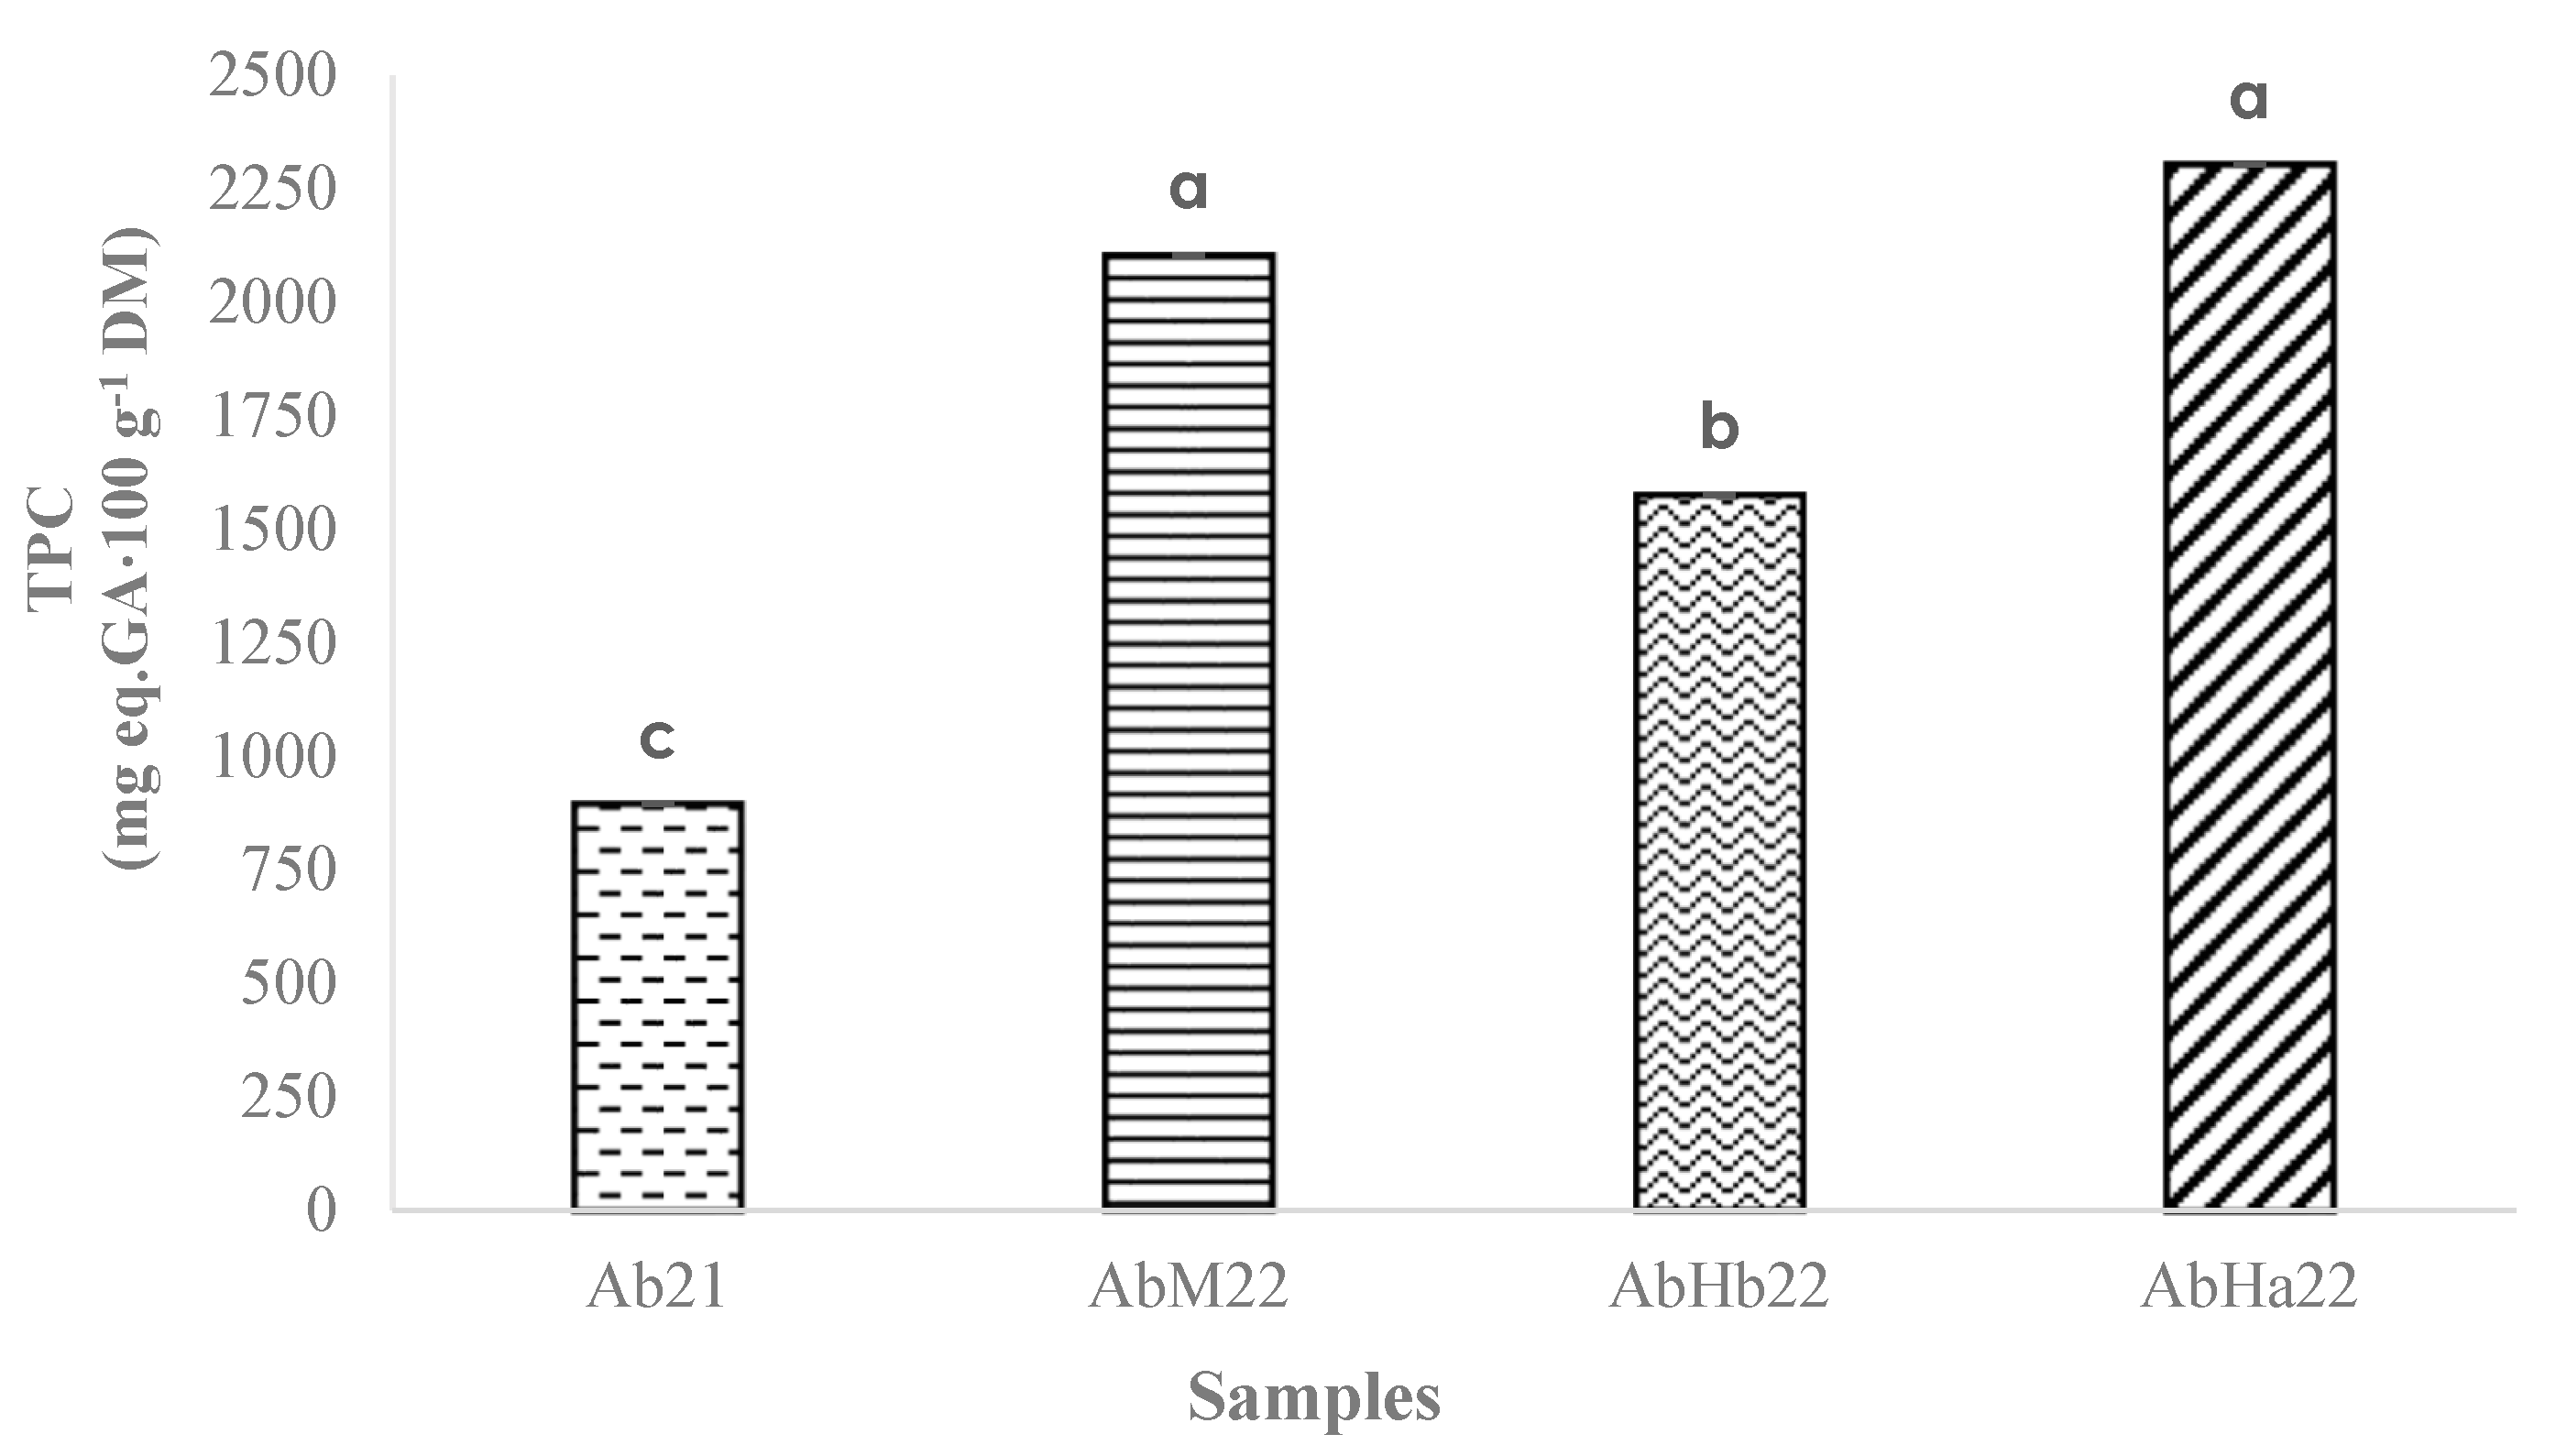
3.3. Polyphenolic Compounds
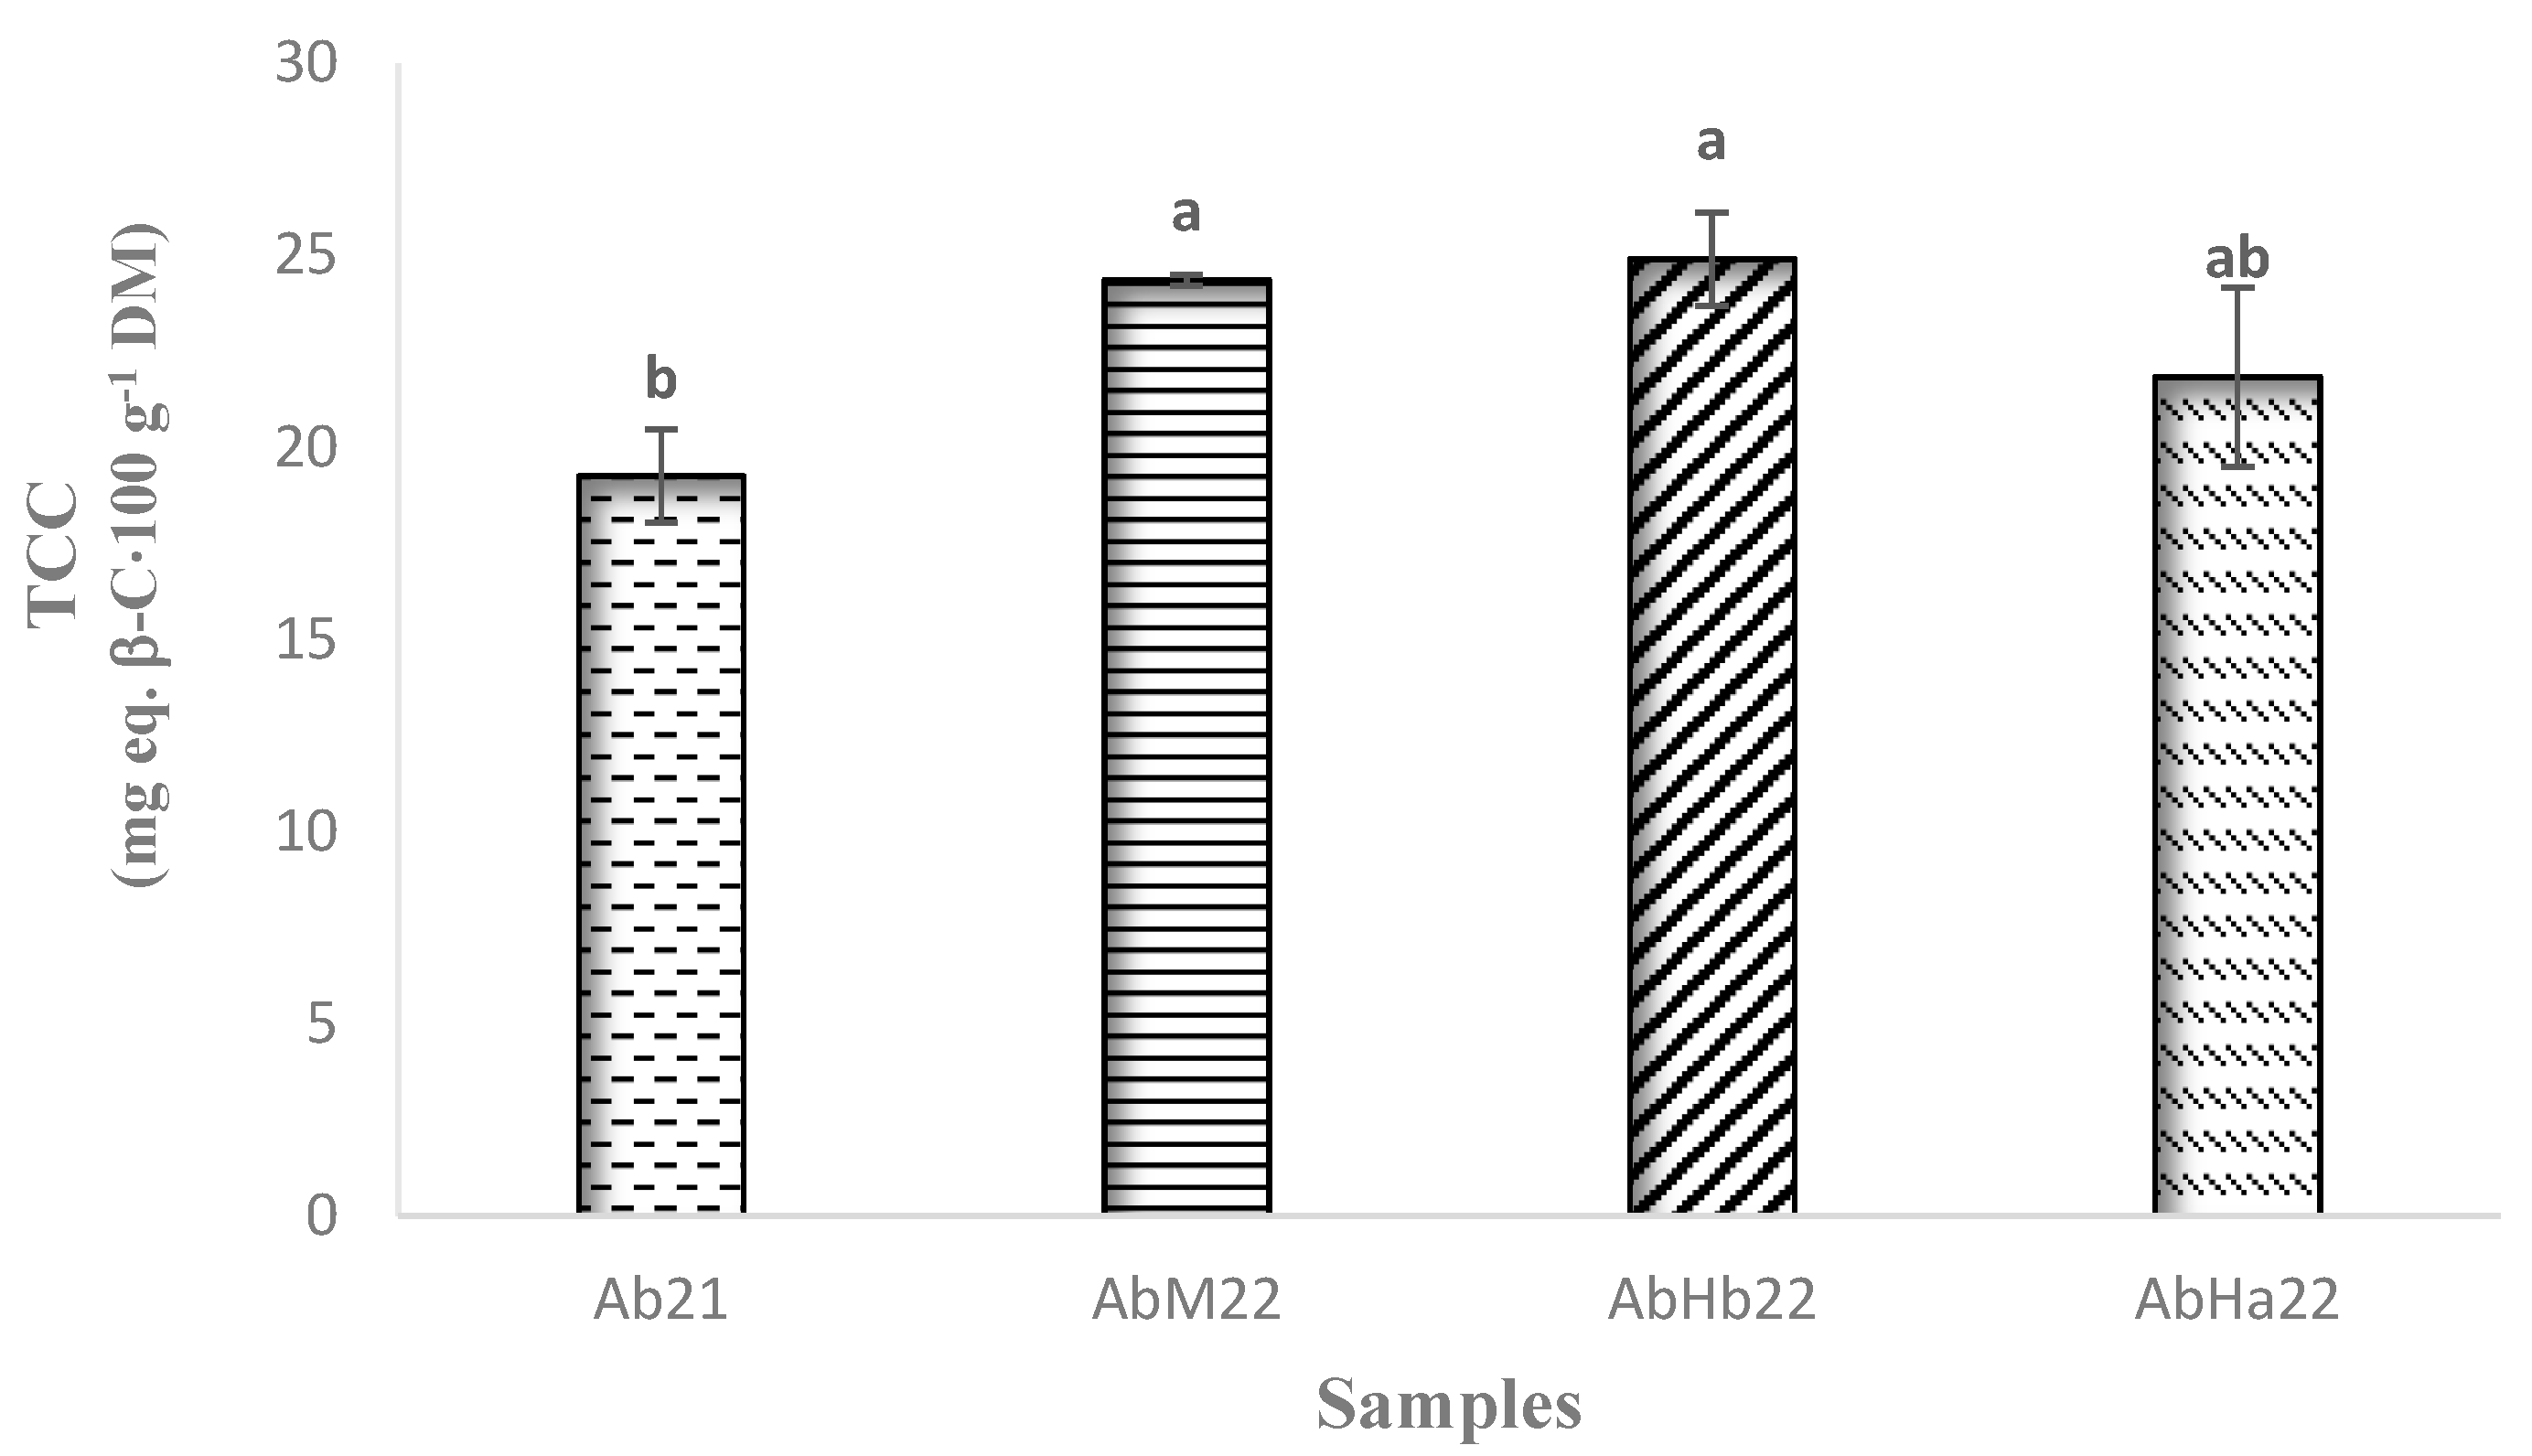
The results presented in Figure 5 enable the visualization of the variations in the total polyphenol content of fruit samples from the areas studied.
The total polyphenol content was the highest for AbHa22 and AbM22, approaching 2200 mg eq.GA·100 g−1 of DM. The AbHb22 fruits showed an intermediate content (1576 mg eq.GA·100 g−1 of DM), while Ab21 fruits had a significantly lower content, around 900 mg eq.GA·100 g−1 of DM. The highest values obtained corresponded to those reported by Onivogui et al. [29] for fruits of the same genus, A. laurina (2305 mg eq.GA·100 g−1 of DM). In contrast, the content obtained by Lofa et al. [13] in the loengo fruit was 66 times lower (26 mg eq.GA·100 g−1 of DM). As with other compounds, numerous factors can influence the polyphenol content of fruits [43].
For comparison with other fruits, our highest contents were of the same order of magnitude as the contents reported by Aaby et al. [44] in strawberry cultivars (Fragaria ananassa Duch.), containing between 2000 and 2800 mg eq.GA·100 g−1 of DM.
According to research conducted by Sanou et al. [45], the total polyphenol content in mango pulp ranged from 292 et 669 mg eq.GA·100 g−1 of DM, which was lower than our results. Singh et al. [46] reviewed various studies on 40 banana cultivars, and found contents ranging from 3 to 990 mg eq. GA·100 g−1 of DM.
The spectrometric analysis of polyphenols, a colorimetric method, can overestimate total values due to interactions with other compounds. In contrast, HPLC may fail to detect certain compounds, since only wavelengths of 360 and 510 nm were taken into account, excluding compounds that absorb at 280 nm.
The HPLC analyses carried out allowed for the detection of ten flavonoids, of which eight were identified based on their UV-visible absorption spectrum (HPLC-DAD) and the data obtained via HPLC-MS (Table 2 and Figure S2).
Qualitatively, all the fruit samples were similar. Two classes of flavonoids were identified—anthocyanins and flavonols—mainly in the form of glycosides. Concerning anthocyanins, only one molecule was detected and identified. Co-injection conducted with an HPLC standard (Extrasynthèse, Genay, France) confirmed that it was indeed cyanidin 3-O-glucoside (C3G). The peaks 1 and 9, which exhibited absorption maxima at 344 and 356 nm, respectively, were not detected via mass spectrometry, and therefore could not be identified. Based on their UV spectrum and fragmentation behavior, two compounds (peaks 3 and 4) were identified as myricetin O-glycosides, and peaks 5, 6, 7, and 8 were identified as quercetin O-glycosides.
Figure 6 showed that for three out of four samples, the anthocyanin contents were similar—between 45 and 52 mg eq. cyanidin·100 g−1 of DM. However, the AbHa22 fruits were approximately 1.5 times richer in anthocyanins. These contents were lower than those obtained by De Souza et al. [47] in strawberry (Fragaria ananassa Duch.) (219 mg eq. C3G·100 g−1 of DM) and higher than those reported by Onivogui et al. [29] in A. laurina fruit (5 mg·100 g−1 of DM). Our results were also higher than those obtained by Zitouni et al. [48] for strawberry fruits (Arbutus unedo L.), whose contents ranged between 0.15 and 0.64 mg eq. C3G·100 g−1 of DM.
The sample richest in flavonols was Ab21, with 30 mg eq. quercetin·100 g−1 of DM. The fruits with the lowest contents were AbHb22 and AbM22, with contents of around 14 mg eq. quercetin·100 g−1 of DM. In comparison with 17 plum cultivars reported by Liaudanskas et al. [49], with contents ranging from 16.04 to 77.6 mg·100 g−1 of DM, our results were in a similar range. Higher values were found by Mahmood et al. [50] in strawberry cultivars, with concentrations between 112.6 and 128.5 mg·100 g−1 of DM. Although these compounds are only slightly bioavailable [51], they exhibit a variety of biological activities that contribute to the overall health benefits of fruits and vegetables. Polyphenolic compounds act as potent antioxidants and anti-inflammatory agents, contributing to the prevention of chronic diseases such as cardiovascular disease, type 2 diabetes, and certain cancers.

3.4. Carotenoids

HPLC analysis revealed that carotenoids were predominantly esterified, as shown in Figure S3. After saponification, seven carotenoids were detected in all the samples, and five were identified, of which four belong to the xanthophyll group (Table 3). Their identification was based on the specific retention time and spectral absorption characteristics, followed by a comparison with the literature. The presence of lutein and zeaxanthin in the fruits is interesting from a health point of view, as these two compounds are known for their protective properties against eye and brain diseases [52].
Due to the wide variety of esters present, it was not possible to provide precise individual quantifications of all the carotenoids detected using HPLC. The carotenoids listed in Table 3 were identified after saponification. As this reaction may result in losses, we opted to consider only the total carotenoid content for the quantitative determination, rather than each compound individually (Figure 7).
The fruits from the samples AbM22, AbHb22, and AbHa22 exhibited total carotenoid contents close to 24 mg eq. β-carotene·100 g−1 of DM. The fruits from Ab21 contained approximately 20% less. It was possible that this difference was linked to a longer storage period for the fruits harvested in 2021. The levels reported by Assanvo et al. [53] in the pulp of papaya varieties from the Abidjan markets, ranging from 0.19 to 0.24 mg·100 g−1 of DM, were significantly lower than in the present study. Again, studies conducted by Silvino et al. [54] resulted in a significantly lower content of 1.5 mg·100 g−1 of DM in the yellow mombin fruit (Spondias mombin L.). However, the work by Sabuz et al. [55] on three mango varieties and one cultivar revealed slightly similar levels, ranging from 13.2 to 23.1 mg·100 g−1 of DM. As a result, the fruit’s carotenoid content is interesting from a nutritional point of view. However, it would be necessary to complete this work by studying the bioavailability of these compounds, which can vary greatly depending on the pulp composition and the processing method chosen [56]. Carotenoids play an essential role in human health and nutrition. They can reduce the risk of cancer and coronary heart diseases. Moreover, some of them exhibited provitamin A activity (specifically β-carotene and β-cryptoxanthin).

3.5. Aromatic Profile

It is important to note that, to our knowledge, there is no information or study in the literature on the aromatic profile of this fruit. The HS-SPME-GC/MS analyses carried out on the fruit samples allowed for the detection of a total of 80 aroma compounds, of which 57 were identified (match factor > 80%) (Table 4). An example of chromatogram obtained is given in Figure S4. Among these compounds, 14 of them presented peak areas greater than 0.5% of the total relative peak area, and so they were selected for quantification (Table 5).
The Venn diagram in Figure 8 provides a synthetic visualization of how the aromatic compounds identified were represented in fruits from the different regions/years of this study.
Among the 57 aroma compounds, only 25% (marked with an asterisk in Table 4) were identified in all the samples, regardless of the region or year of harvest.
This diagram showed the effect of the harvest area on the aroma profile. In fact, it was found that in addition to the 14 aroma compounds common to all samples, 25 compounds were common to the 3 samples collected in 2022. Together, these two classes represented 70% of the total number of compounds.
In the 30% of compounds found exclusively in certain areas, 3-Methylbut-2-enyl acetate, 1-Methyl-3-propan-2-ylbenzene and Nonanal were found in the Malanje area. The AbHb22 samples showed four specific compounds (2-methylpent-1-en-3-one; Pentane-2,3-dione; Ethyl octanoate and Ethyl (methylthio) acetate) and the AbH22 samples contained four specific compounds (Propyl acetate; Isobutyl acetate; Ethylbenzene and 1,3-xylene).
The year effect seemed less important on the aromatic profile, since only one compound was specific to 2021: acetoin. This compound is not characteristic of fruits. It is a compound that is more often found in dairy products with a buttery odor. Its presence in our sample could indicate the start of lactic fermentation during fruit storage or transport.
In terms of chemical families, around half the compounds identified were esters, a quarter were carbonyl compounds (aldehydes and ketones), a tenth were aromatic hydrocarbons, and another tenth were alcohols. This fruit therefore falls into the category of fruits with dominant esters. The studies carried out by Lasekan and Abbas [74] on several exotic tropical fruits indicate that, in general, esters and terpenes are the most abundant chemical groups in aroma compounds.
As can be seen in Table 5, among the 14 aroma compounds quantified, 11 compounds were detected and quantified in the three areas. However, regarding the three compounds 3-methylbutyl acetate (found only in the Huíla area), Heptan-4-ol (found only in the Malanje-AbM area), and 1-methoxy-4-propylbenzene (found only in the Huambo-AbHb22 and Huíla-AbHa22 areas), they were present throughout the areas, but below the limit of quantification in some cases. However, when we looked at their Odor Activity Value (OAV), we could see that they did not make a major contribution to the fruit aroma. In contrast, the ethyl 2-methylbutanoate and ethyl butyrate, responsible for green, fruity, apple, strawberry, and pineapple pleasant notes, and found in all the loengo fruits, seemed to have a greater contribution to the fruit aroma given their higher OAV. Niu et al. [75] argued that aroma compounds with OAVs greater than 1 can be considered to contribute significantly to the aroma of the product.
Aroma compounds are of course essential for the organoleptic quality of foods (odor and flavor). In the case of fruits, they can also contribute to resistance against microbial attacks. Some are considered bioactive, although their nutritional role is still quite controversial.

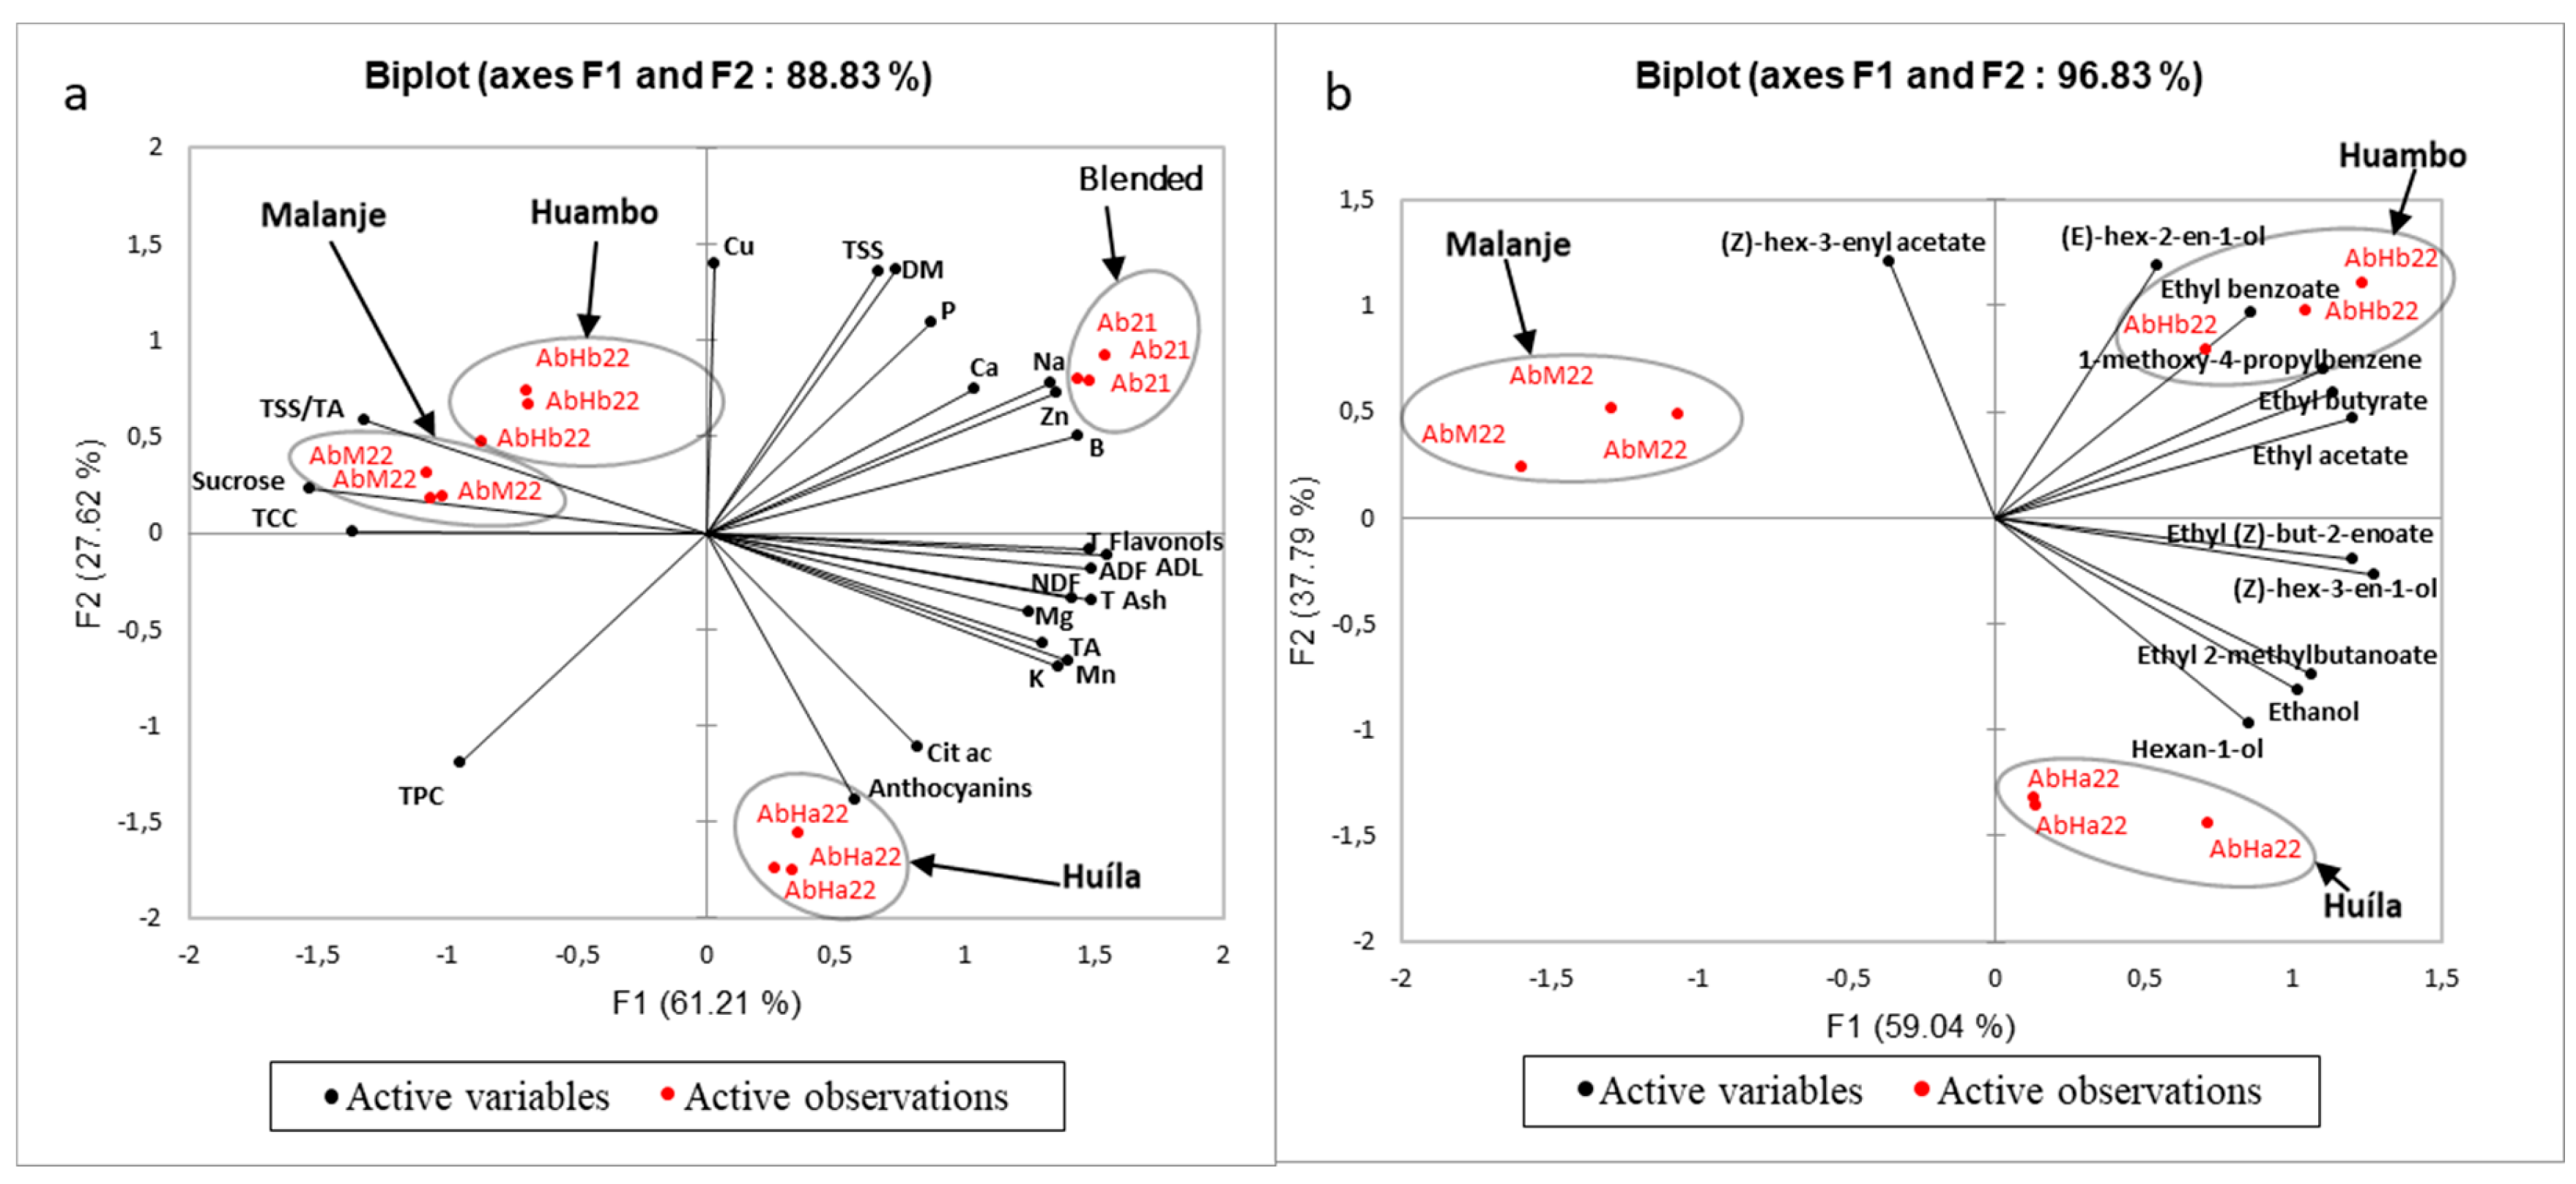
3.6. Relationship Between Composition and Collection Area

The first step of variable selection was undertaken. Only variables statistically correlated with location (p < 0.05) were retained using an ANOVA test. Aroma compounds were treated in another single ANOVA with the same condition. In addition, 3-methylbutyl acetate and Heptan-4-ol were not considered for statistical analysis, as they were present in only one out of three samples.
Figure 9 shows the PCA results. The two principal components represent 89% of the total variance of the overall composition and 97% of the total variance for the aroma compounds.
It was possible to see that the projection of the individuals showed clusters composed of fruits from the same area, whether for the PCA carried out with global composition data (Figure 9a) or aromatic composition data (Figure 9b). Therefore, there was indeed significant regional variability. However, regarding the overall composition, there was a distinction between the Huíla area, but little difference between the Malanje and Huambo areas. It is noteworthy that the aromatic profile showed a finer chemical imprint of the “terroir” differences.
Figure 9a showed how the composition was influenced by the year of harvest. We can also note a difference between the year 2021 and 2022, which showed variability in the composition depending on various factors linked to the harvest year: ripeness, weather conditions, transport, and storage. The combined effects of edaphic and climatic conditions on the biosynthesis and accumulation of aromatic compounds in fruits are well documented, particularly in grapes, with a significant impact on wine quality [76,77].
Regarding the projected variables, it can be noticed in Figure 9a that the principal component 1 was highly positively correlated with the variables—flavonols, NDFs, ADFs, ADL, Total Ash, Mg, K, Mn, B, Zn, Na, Ca, and TA. The 2021 fruits were distinguished by higher contents of these compounds. On the contrary, the 2022 fruits from the Malanje and Huambo areas were anti-correlated with the 2021 fruits, with higher sugar and TCC and lower acids. The increase in sugar and pigments may be indicative of a slightly warmer 2022 or a minimal difference in the ripeness. As mentioned by Mignard et al. [78], altitude plays a crucial role in controlling plant metabolism through changes in temperature, light intensity, and the photoperiod, and therefore affects the final content of many metabolites in fruits.
The principal component 2 was positively correlated with Cu, TSSs, dry matter (DM), and P. However, it was anti-correlated with anthocyanin and TPC. Factors such as high altitudes and low temperatures were directly related to anthocyanin synthesis in fruits, which may explain the difference between the Huíla sample and the others. According to Coklar [79], areas located at high altitudes and with low temperatures allow for the accumulation of higher concentrations of monomeric anthocyanins in grapes, while in low-altitude areas, the effect is the opposite. However, Mansour et al. [80] presented a contrary thought when they reported that grapes grown in lower-altitude areas near the sea had higher concentrations of acylated anthocyanins and dihydroxylated flavonols, due to higher minimum temperatures and reduced thermal amplitudes between day and night.
Anthocyanins were anti-correlated with copper ions, as these were oxidizing ions that can react with these pigments and cause their degradation. This reaction was highlighted by Sinela et al. [81], who proved that anthocyanins are highly reactive to metals and can be oxidized by copper and iron in hibiscus extracts.
The first principal component analysis (PCA 1) in Figure 9b was positively correlated with five aromatic compounds: three esters, one alcohol, and one aromatic hydrocarbon. These include ethyl 2-methylbutanoate and ethyl butyrate, which are the aroma compounds that contribute most to the fruit’s odor, according to Table 5. In the same figure, the AbHb22 and AbHa22 samples were different from the AbM22 sample, showed higher levels of aroma compounds, and therefore may have a more powerful flavor. This may be due to the higher altitude and cooler climate of these two areas, as already noted for grapes [80] and cherries [82].
The second principal component analysis (PCA 2) was mainly linked to one ester and one alcohol too, with fruit from the Malanje and Huambo areas containing higher levels of (Z)-hex-3-enyl acetate and (E)-hex-2-en-1-ol, while fruit from the Huíla area correlated better with one alcohol (hexan-1-ol). However, as the latter had a rather low OAV, it is likely that the aromatic differences were subtle between the Huíla and Huambo areas.
In conclusion, the PCA indicated regional variation in the composition. Nevertheless, multi-year sampling and controlled agronomic trials would help to distinguish between environmental and genetic influences on fruit quality more effectively.

4. Conclusions

The survey confirmed that A. boehmii (loengo) is a highly valued wild fruit in Angola. It is harvested from August to March, with peak production in October. Despite its perishability, it plays an important local economic role. The consumption of fresh fruit is high in all the studied areas, with growing interest in processed products such as beverages and dehydrated fruits.
Loengo is a fruit with good nutritional potential, as it contains significant amounts of various essential compounds for health (Table S2) [83]. It is an excellent source of dietary fiber, which keeps the digestive system healthy. It is rich in minerals (Mg, Cu, Fe, Mn, and Zn) and bioactive compounds, notably polyphenols and carotenoids, which are recognized as antioxidant with multiple health benefits. From an energy point of view, loengo is an interesting nutritional option to include in the diet. However, this study showed that there are significant differences in the composition of the fruit depending on its provenance and year of harvest. Nevertheless, this conclusion, which is based on a single fruit sample per region, needs to be refined and confirmed by including more samples from each area.
From an organoleptic point of view, loengo is a fruit with a pronounced and attractive red color due to its high anthocyanin content. Additionally, this study characterized the aromatic profile of the fruit for the first time. Its complex aroma is made up of a large number of aroma compounds, including esters, carbonyl compounds, aromatic hydrocarbons, and secondary alcohols, which give the fruit a powerful fruity flavor that is appreciated by consumers.
The interest shown by local populations in loengo-based processed products opens up promising prospects for its commercial development and local valorization. Further research is now needed to better assess its health potential, in particular by further detailing the polyphenolic profile of the fruit, as well as its organoleptic potential via sensory analysis. It will also be interesting to understand the effect of stabilization processes, such as drying or pasteurization, on the quality (pigments and aroma compounds) of loengo-based products in order to extend its shelf life and optimize its large-scale production for the Angolan industry. Finally, an agronomic study to domesticate the plant could also be conducted. In this case, it would of course be essential to consider the agro-ecological and socio-economic impacts of large-scale crop production and integrate system sustainability issues into the thinking process.

Supplementary Materials

The following supporting information can be downloaded at https://www.mdpi.com/article/10.3390/agriculture15111175/s1: Full questionnaire used for the semi-structured survey; Table S1: Elution gradient used for HPLC polyphenol analysis (A: water Milli-Q/HCOOH 99/1 v/v; B: CH3CN); Table S2: Comparison of loengo with other very well-known fruits that are produced in Angola, through some nutritional indicators; Figure S1: Some characteristics of the respondents: (a) distribution by gender in each area; (b) age pyramid by gender in all the areas; Figure S2: Chromatogram of the phenolic compounds (360 nm) obtained with the fruits from sample AbM22 (the peak numbers refer to Table 2); Figure S3: HPLC carotenoid chromatograms obtained with the fruits from AbHb22 sample (a) without saponification, (b) with saponification; Figure S4: Chromatograms obtained when characterizing the aroma profile of the fruits from samples (a) AbM22, (b) AbHb22 and c) AbHa22.

Author Contributions

Conceptualization, F.J.d.C., B.M. and M.D.; methodology, F.J.d.C., C.M., A.S., N.A. and M.D.; software, F.J.d.C., A.S. and N.A.; validation, F.J.d.C., C.M., N.A., B.M. and M.D.; formal analysis, F.J.d.C., C.M., A.S., N.A. and M.D.; investigation, F.J.d.C.; resources, C.M. and A.S.; data curation, F.J.d.C., C.M., A.S., N.A. and M.D.; writing—original draft preparation, F.J.d.C.; writing—review and editing, C.M., A.S., N.A., B.M. and M.D.; visualization, F.J.d.C. and M.D.; supervision, C.M., A.S. and M.D.; project administration, B.M. and M.D.; funding acquisition, B.M. and M.D. All authors have read and agreed to the published version of the manuscript.

Funding

This research was funded by the French Embassy in Luanda (Angola) and CIRAD Montpellier (France).

Institutional Review Board Statement

Not applicable.

Data Availability Statement

The original contributions presented in this study are included in the article/Supplementary Materials. Further inquiries can be directed to the corresponding author.

Acknowledgments

The authors are grateful to the French Embassy in Luanda, Angola, the main funder of the project, to CIRAD (Montpellier, France) for its contribution to the successful completion of this work, and to Rainha Njinga a Mbande University (Malanje, Angola) for its support in carrying out this research. They also thank INRAE and UMR SQPOV (Avignon, France) for their contribution to the HPLC-MSn analyses.

Conflicts of Interest

There are no conflicts of interest, as all authors are employed by either the French or Angolan government. None are associated with a private company.

References

  1. Timko, J.A.; Waeber, P.O.; Kozak, R.A. The Socio-Economic Contribution of Non-Timber Forest Products to Rural Livelihoods in Sub-Saharan Africa: Knowledge Gaps and New Directions. Int. For. Rev. 2010, 12, 284–294. [Google Scholar] [CrossRef]
  2. Dewees, P.A.; Campbell, B.M.; Katerere, Y.; Sitoe, A.; Cunningham, A.B.; Angelsen, A.; Wunder, S. Managing the Miombo Woodlands of Southern Africa: Policies, Incentives and Options for the Rural Poor. J. Nat. Resour. Policy Res. 2010, 2, 57–73. [Google Scholar] [CrossRef]
  3. Ribeiro, N.S.; Snook, L.K.; Nunes De Carvalho Vaz, I.C.; Alves, T. Gathering Honey from Wild and Traditional Hives in the Miombo Woodlands of the Niassa National Reserve, Mozambique: What Are the Impacts on Tree Populations? Glob. Ecol. Conserv. 2019, 17, e00552. [Google Scholar] [CrossRef]
  4. Nkengurutse, J.; Houmy, N.; Mansouri, F.; Moumen, A.B.; Caid, H.S.; Khalid, A. Preliminary Chemical Characterization of Amashindwi (Anisophyllea boehmii Engl.) Kernels and Kernel Oil. J. Mater. Environ. Sci. 2016, 7, 1996–2005. [Google Scholar]
  5. Ryan, C.M.; Pritchard, R.; McNicol, I.; Owen, M.; Fisher, J.A.; Lehmann, C. Ecosystem Services from Southern African Woodlands and Their Future under Global Change. Philos. Trans. R. Soc. B Biol. Sci. 2016, 371, 20150312. [Google Scholar] [CrossRef]
  6. Campbell, B. The Miombo in Transition: Woodlands and Welfare in Africa; Center for International Forestry Research (CIFOR): Bogor, Indonesia, 1996; ISBN 979-8764-07-2. [Google Scholar]
  7. Hakizimana, P.; Masharabu, T.; Bangirinama, F.; Habonimana, B.; Bogaert, J. Analyse du rôle de la biodiversité végétale des forêts de Kigwena et de Rumonge au Burundi. Tropicultura 2011, 29, 28–38. [Google Scholar]
  8. Binaki, A.F.; Loumouamou, B.W.; Bassiloua, J.B.; Biassala, E.T.; Bopoundza, F.C.; Niamayoua, R.K.; Silou, T. Morphological and Physicochemical Characteristics of the Fruits of Anisophyllea quangensis Engl. Ex Henriq from the Savannah Surrounding the City of Brazzaville-Congo. J. Food Nutr. Sci. 2024, 12, 213–221. [Google Scholar] [CrossRef]
  9. Nkengurutse, J.; Mansouri, F.; Bekkouch, O.; Ben Moumen, A.; Masharabu, T.; Gahungu, G.; Serghini, H.C.; Khalid, A. Chemical Composition and Oral Toxicity Assessment of Anisophyllea boehmii Kernel Oil: Potential Source of New Edible Oil with High Tocopherol Content. Food Chem. 2019, 278, 795–804. [Google Scholar] [CrossRef]
  10. Sanfilippo, M. Trinta Árvores e Arbustos do Miombo Angolano: Guia de Campo Para a Identificação, 1st ed.; ONG COSPE (Cooperazione per lo Sviluppo dei Paesi Emergenti): FLorence, Italy, 2014. [Google Scholar]
  11. Ibrahim, K.G.; Siulapwa, N.; Chivandi, E.; Mwambungu, A.; Sichilima, W.; Erlwanger, K. Lipid Profile and Proximate Analysis of the Seeds of Anisophyllea Boehmii. Res. J. Chem. Environ. Sci. 2015, 3, 22–26. [Google Scholar]
  12. Kalaba, F.K. The Role of Indigenous Fruit Trees in the Rural Livelihoods: A Case of the Mwekera Area, Copperbelt Province, Zambia. Ph.D. Thesis, Stellenbosch University, Stellenbosch, South Africa, 2007. [Google Scholar]
  13. Lofa, A.M.; Mourato, M.P.; Prista, C.; Sousa, I.; Ferreira, R.B. Chemical and Nutritional Characterization of Loengo (Anisophyllea boehmii) Fruits as a Source of Important Bioactive with Impact on Health. Front. Food Sci. Technol. 2024, 4, 1443185. [Google Scholar] [CrossRef]
  14. Tchobo, F.P. Caractérisation du Beurre de Pentadesma Butyracea Sabine, Fonctionnalisation des Triacylglycérols par Transfert Acyle Sélectif en Biocatalyse. Ph.D. Thesis, Université Montpellier II (France) & Universté d’Abomey-Calavi (Benin), Montpellier, France, 2008. [Google Scholar]
  15. Haj, A.H.E. Converting Apple, Blueberry, and Cranberry Waste Biomass into a Powder Food Ingredient. Master’s Thesis, Bioresource Engineering, McGill University, Montreal, QC, Canada, 2022. [Google Scholar]
  16. Van Soest, P.J.; Robertson, J.B.; Lewis, B.A. Methods for Dietary Fiber, Neutral Detergent Fiber, and Nonstarch Polysaccharides in Relation to Animal Nutrition. J. Dairy Sci. 1991, 74, 3583–3597. [Google Scholar] [CrossRef] [PubMed]
  17. Chin, L.; Servent, A.; Hor, S.; Mith, H.; Bugaud, C. Predictive Models for Estimating the Sugar Content and Organic Acids in Processed Mangoes Based on the Initial Content. Int. J. Food Sci. Technol. 2024, 59, 9547–9558. [Google Scholar] [CrossRef]
  18. Thanh, C.; Mith, H.; Peng, C.; Servent, A.; Poss, C.; Laillou, A.; Phal, S.; Avallone, S. Assessment of the Nutritional Profiles and Potentially Toxic Elements of Wild and Farmed Freshwater Fish in Cambodia. J. Food Compos. Anal. 2024, 133, 106357. [Google Scholar] [CrossRef]
  19. Servent, A.; Hector, L.; Jobard, G.; Dornier, M. Coupling Crossflow Microfiltration and Nanofiltration for the Concentration of Aroma Compounds in a Raspberry Hydroalcoholic Extract. J. Food Process Eng. 2024, 47, e14739. [Google Scholar] [CrossRef]
  20. Mertz, C.; Gancel, A.-L.; Gunata, Z.; Alter, P.; Dhuique-Mayer, C.; Vaillant, F.; Perez, A.M.; Ruales, J.; Brat, P. Phenolic Compounds, Carotenoids and Antioxidant Activity of Three Tropical Fruits. J. Food Compos. Anal. 2009, 22, 381–387. [Google Scholar] [CrossRef]
  21. Peng, Y.; Ma, C.; Li, Y.; Leung, K.S.-Y.; Jiang, Z.-H.; Zhao, Z. Quantification of Zeaxanthin Dipalmitate and Total Carotenoids in Lycium Fruits (Fructus Lycii). Plant Foods Hum. Nutr. 2005, 60, 161–164. [Google Scholar] [CrossRef]
  22. Britton, G.; Liaanen-Jensen, S.; Pfander, H. Carotenoids; Birkhaüser: Basel, Switzerland, 1995; Volume 1B, Spectroscopy. [Google Scholar]
  23. Mertz, C.; Brat, P.; Caris-Veyrat, C.; Gunata, Z. Characterization and Thermal Lability of Carotenoids and Vitamin C of Tamarillo Fruit (Solanum betaceum Cav.). Food Chem. 2010, 119, 653–659. [Google Scholar] [CrossRef]
  24. Marin-Castro, U.R.; Garcia-Alvarado, M.Á.; Vargas-Ortiz, M.; Salgado-Cervantes, M.A.; Servent, A.; Pallet, D. Sensory and Nutritional Qualities of ‘Manila’ Mango Ready-to-Eat Puree Enhanced Using Mild Flash Vacuum Expansion Processing. Fruits 2021, 76, 248–257. [Google Scholar] [CrossRef]
  25. Kalaba, F.K.; Chirwa, P.W.; Prozesky, H.; Ham, C. The Role of Indigenous Fruit Trees in Rural Livelihoods: The Case of Communities in the Mwekera Area, Copperbelt Province, Zambia. Acta Hortic. 2009, 806, 129–136. [Google Scholar] [CrossRef]
  26. Mpasiwakomu, A.R.; Nyomora, A.M.S.; Gimbi, A.A. Diversity and Utilization of Wild Edible Plant Species from the Uvinza Miombo Woodlands, Tanzania. Huria J. 2017, 24, 150–168. [Google Scholar]
  27. Mendelsohn, J.; Weber, B. An Atlas and Profile of Huambo: Its Environment and People; Development Workshop (DW): Luanda, Angola, 2013. [Google Scholar]
  28. Malaisse, F. How to Live and Survive in Zambezian Open Forest (Miombo Ecoregion); Les Presses Agronomiques de Gembloux: Gembloux, Belgium, 2010; ISBN 978-2-87016-106-7. [Google Scholar]
  29. Onivogui, G.; Zhang, H.; Mlyuka, E.; Diaby, M.; Song, Y. Chemical Composition, Nutritional Properties and Antioxidant Activity of Monkey Apple (Anisophyllea laurina Br. Ex Sabine). J. Food Nutr. Res. 2014, 2, 281–287. [Google Scholar] [CrossRef]
  30. Santos, M.B.D.; Cardoso, R.L.; Fonseca, A.A.d.O.; Conceição, M.d.N. Characterization and quality of Umbu-caja fruits (Spondias tuberosa X S. mombin) procceeding from the Southern Reconcavo in Bahia. Rev. Bras. Frutic. 2010, 32, 1089–1097. [Google Scholar] [CrossRef]
  31. Guedes, M.N.S.; Rufini, J.C.M.; Azevedo, A.M.; Pinto, N.A.V.D. Fruit Quality of Jabuticaba Progenies Cultivated in a Tropical Climate of Altitude. Fruits 2014, 69, 449–458. [Google Scholar] [CrossRef]
  32. Shree, S.P.; Nanjappanavar, A.G.; Patil, S.N.; Lokesh, M.S.; Gandolkar, K.; Hadlegeri, R. Impact of Net House and Open Field Cultivation on Quality Parameters of Banana (Musa Spp.) Varieties. Plant Arch. 2024, 24, 915–920. [Google Scholar] [CrossRef]
  33. Richards, K.; Tran, K.; Levine, R.; Luo, R.; Maia, J.; Sabaa-Srur, A.; Maciel, M.; Melo, E.; Moraes, M.; Godoy, H.; et al. Improved Extraction of Soluble Solids from Some Brazilian and North American Fruits. Nat. Prod. J. 2014, 4, 201–210. [Google Scholar] [CrossRef]
  34. Dimkova, S.; Ivanova, D.; Stefanova, B.; Marinova, N.; Todorova, V. Chemical and Technological Characteristic of Plum Cultivars of Prunus Domestica L. Bulg. J. Agric. Sci. 2018, 24, 43–47. [Google Scholar]
  35. Kante-Traore, H.; Ilboudo, A.; Semde, Z.; Lodoun, A.; Sanou, M.; Samadoulougou, P.M.J.; Ky, L.; Guira, M.; Lingani, H.S.; Dicko, H.M. Physico-Chemical and Nutritional Characteristics of Five Varieties and One Accession of Mango from Burkina Faso. Food Nutr. Sci. 2024, 15, 1299–1316. [Google Scholar] [CrossRef]
  36. Kendrick, E.L.; Shipley, L.A.; Hagerman, A.E.; Kelley, L.M. Fruit and Fibre: The Nutritional Value of Figs for a Small Tropical Ruminant, the Blue Duiker (Cephalophus Monticola). Afr. J. Ecol. 2009, 47, 556–566. [Google Scholar] [CrossRef]
  37. Samuel, I. Nutritional Evaluation of Selected Browse Plants Consumed by Small Ruminants in Northern Sudan Savannah of Nigeria. Asian J. Adv. Agric. Res. 2018, 5, 1–8. [Google Scholar] [CrossRef]
  38. Aurore, G.; Parfait, B.; Fahrasmane, L. Bananas, Raw Materials for Making Processed Food Products. Trends Food Sci. Technol. 2009, 20, 78–91. [Google Scholar] [CrossRef]
  39. Forster, M.; Rodríguez, E.R.; Martín, J.D.; Romero, C.D. Distribution of Nutrients in Edible Banana Pulp. Food Technol Biotechnol 2003, 41, 167–171. [Google Scholar]
  40. Shi, S.; Ma, X.; Xu, W.; Zhou, Y.; Wu, H.; Wang, S. Evaluation of 28 Mango Genotypes for Physicochemical Characters, Antioxidant Capacity, and Mineral Content. J. Appl. Bot. Food Qual. 2015, 88, 264–273. [Google Scholar] [CrossRef]
  41. Ding, P.; Tee, Y.K. Physicochemical Characteristics of Dabai (Canarium odontophyllum Miq.) Fruit. Fruits 2011, 66, 47–52. [Google Scholar] [CrossRef]
  42. Maldonado-Celis, M.E.; Yahia, E.M.; Bedoya, R.; Landázuri, P.; Loango, N.; Aguillón, J.; Restrepo, B.; Guerrero Ospina, J.C. Chemical Composition of Mango (Mangifera indica L.) Fruit: Nutritional and Phytochemical Compounds. Front. Plant Sci. 2019, 10, 1073. [Google Scholar] [CrossRef]
  43. Sarni-Manchado, P.; Cheynier, V. Les Polyphénols En Agroalimentaire; TEC&DOC, Lavoisier: Paris, France, 2006; ISBN 2-7430-0805-9. [Google Scholar]
  44. Aaby, K.; Skrede, G.; Wrolstad, R.E. Phenolic Composition and Antioxidant Activities in Flesh and Achenes of Strawberries (Fragaria ananassa). J. Agric. Food Chem. 2005, 53, 4032–4040. [Google Scholar] [CrossRef]
  45. Sanou, M.; Kanté-Traoré, H.; Haro, K.; Somda, S.; Offei, F.; Zhang, Y.; Parkouda, C.; Dicko, M.H. Biochemical Properties and Biotechnological Potential of Mango Biowastes for Economical Valorization in Burkina Faso. Waste Biomass Valorization 2025, 16, 53–73. [Google Scholar] [CrossRef]
  46. Singh, B.; Singh, J.P.; Kaur, A.; Singh, N. Bioactive Compounds in Banana and Their Associated Health Benefits–A Review. Food Chem. 2016, 206, 1–11. [Google Scholar] [CrossRef]
  47. De Souza, V.R.; Pereira, P.A.P.; Da Silva, T.L.T.; De Oliveira Lima, L.C.; Pio, R.; Queiroz, F. Determination of the Bioactive Compounds, Antioxidant Activity and Chemical Composition of Brazilian Blackberry, Red Raspberry, Strawberry, Blueberry and Sweet Cherry Fruits. Food Chem. 2014, 156, 362–368. [Google Scholar] [CrossRef]
  48. Zitouni, H.; Hssaini, L.; Ouaabou, R.; Viuda-Martos, M.; Hernández, F.; Ercisli, S.; Ennahli, S.; Messaoudi, Z.; Hanine, H. Exploring Antioxidant Activity, Organic Acid, and Phenolic Composition in Strawberry Tree Fruits (Arbutus unedo L.) Growing in Morocco. Plants 2020, 9, 1677. [Google Scholar] [CrossRef]
  49. Liaudanskas, M.; Okulevičiūtė, R.; Lanauskas, J.; Kviklys, D.; Zymonė, K.; Rendyuk, T.; Žvikas, V.; Uselis, N.; Janulis, V. Variability in the Content of Phenolic Compounds in Plum Fruit. Plants 2020, 9, 1611. [Google Scholar] [CrossRef]
  50. Mahmood, T.; Anwar, F.; Abbas, M.; Saari, N. Effect of Maturity on Phenolics (Phenolic Acids and Flavonoids) Profile of Strawberry Cultivars and Mulberry Species from Pakistan. Int. J. Mol. Sci. 2012, 13, 4591–4607. [Google Scholar] [CrossRef] [PubMed]
  51. Nagar, E.E.; Okun, Z.; Shpigelman, A. In Vitro Bioaccessibility of Polyphenolic Compounds: The Effect of Dissolved Oxygen and Bile. Food Chem. 2023, 404, 134490. [Google Scholar] [CrossRef]
  52. Giordano, E.; Quadro, L. Lutein, Zeaxanthin and Mammalian Development: Metabolism, Functions and Implications for Health. Arch. Biochem. Biophys. 2018, 647, 33–40. [Google Scholar] [CrossRef] [PubMed]
  53. Assanvo, B.J.; Niamké, M.A.; Bahi, P.L.E.; Coxam, V.; Kati, S.; Koffi, K.M. Pulpe de 4 variétés de papaye (Carica papaya) vendues sur le marché d’Abidjan-Côte d’Ivoire. Am. J. Innov. Res. Appl. Sci. 2022, 15, 247–265. [Google Scholar]
  54. Silvino, R.; Silva, G.; Dos Santos, O.V. Qualidade nutricional e parâmetros morfológicos do fruto cajá (Spondias mombin L.). DESAFIOS-Rev. Interdiscip. Univ. Fed. Tocantins 2017, 4, 3–11. [Google Scholar] [CrossRef]
  55. Sabuz, A.A.; Molla, M.M.; Khan, M.H.H.; Chowdhury, M.G.F.; Pervin, S.; Alam, M.; Khatun, A.; Al-Rafi, I.; Al-Zihad, M.R. Comparison of Physicochemical Composition, Antioxidant Activity and Common Phytochemicals of Selected BARI Mango Varieties and Commercial Cultivar, Langra. Food Chem. Adv. 2024, 4, 100580. [Google Scholar] [CrossRef]
  56. Dhuique-Mayer, C.; Servent, A.; Messan, C.; Achir, N.; Dornier, M.; Mendoza, Y. Bioaccessibility of Biofortified Sweet Potato Carotenoids in Baby Food: Impact of Manufacturing Process. Front. Nutr. 2018, 5, 98. [Google Scholar] [CrossRef]
  57. Rajendran, S.; Silcock, P.; Bremer, P. Flavour Volatiles of Fermented Vegetable and Fruit Substrates: A Review. Molecules 2023, 28, 3236. [Google Scholar] [CrossRef]
  58. Chastrette, M.; Cretin, D.; Aïdi, E. Structure-Odor Relationships: Using Neural Networks in the Estimation of Camphoraceous or Fruity Odors and Olfactory Thresholds of Aliphatic Alcohols. J. Chem. Inf. Comput. Sci. 1996, 36, 108–113. [Google Scholar] [CrossRef]
  59. Xu, X.; Bi, S.; Lao, F.; Chen, F.; Liao, X.; Wu, J. Comprehensive Investigation on Volatile and Non-Volatile Metabolites in Broccoli Juices Fermented by Animal- and Plant-Derived Pediococcus Pentosaceus. Food Chem. 2021, 341, 128118. [Google Scholar] [CrossRef]
  60. Burdock, G.A. Fenaroli’s Handbook of Flavor Ingredients, 6th ed.; CRC Press/Taylor & Francis Group: Boca Raton, FL, USA, 2010; ISBN 978-1-4200-9077-2. [Google Scholar]
  61. Sohail, A.; Al-Dalali, S.; Wang, J.; Xie, J.; Shakoor, A.; Asimi, S.; Shah, H.; Patil, P. Aroma Compounds Identified in Cooked Meat: A Review. Food Res. Int. 2022, 157, 111385. [Google Scholar] [CrossRef] [PubMed]
  62. Chiang, Y.-C.; Chiang, P.-Y. Accentuation of the Browning Characteristics and Functional Properties of Aged Tomatoes (Solanum lycopersicum Cv.). Food Chem. X 2024, 22, 101499. [Google Scholar] [CrossRef]
  63. Yan, J.; Alewijn, M.; Ruth, S.M. van From Extra Virgin Olive Oil to Refined Products: Intensity and Balance Shifts of the Volatile Compounds versus Odor. Molecules 2020, 25, 2469. [Google Scholar] [CrossRef]
  64. Juhari, N.H.; Bredie, W.L.P.; Toldam-Andersen, T.B.; Petersen, M.A. Characterization of Roselle Calyx from Different Geographical Origins. Food Res. Int. 2018, 112, 378–389. [Google Scholar] [CrossRef]
  65. Li, T.; Jiang, T.; Liu, N.; Wu, C.; Xu, H.; Lei, H. Biotransformation of Phenolic Profiles and Improvement of Antioxidant Capacities in Jujube Juice by Select Lactic Acid Bacteria. Food Chem. 2021, 339, 127859. [Google Scholar] [CrossRef]
  66. Niu, Y.; Wang, R.; Xiao, Z.; Zhu, J.; Sun, X.; Wang, P. Characterization of Ester Odorants of Apple Juice by Gas Chromatography-Olfactometry, Quantitative Measurements, Odour Threshold, Aroma Intensity and Electronic Nose. Food Res. Int. 2019, 120, 92–101. [Google Scholar] [CrossRef]
  67. Janzantti, N.S.; Monteiro, M. HS–GC–MS–O Analysis and Sensory Acceptance of Passion Fruit during Maturation. J. Food Sci. Technol. 2017, 54, 2594–2601. [Google Scholar] [CrossRef]
  68. Steinhaus, M.; Sinuco, D.; Polster, J.; Osorio, C.; Schieberle, P. Characterization of the Key Aroma Compounds in Pink Guava (Psidium guajava L.) by Means of Aroma Re-Engineering Experiments and Omission Tests. J. Agric. Food Chem. 2009, 57, 2882–2888. [Google Scholar] [CrossRef]
  69. Buchecker, F.; Baum, A.; Loos, H.M.; Buettner, A. Follow Your Nose-Traveling the World of Odorants in New Cars. Indoor Air 2022, 32, e13014. [Google Scholar] [CrossRef]
  70. Wang, J.; Ming, Y.; Li, Y.; Huang, M.; Luo, S.; Li, H.; Li, H.; Wu, J.; Sun, X.; Luo, X. Characterization and Comparative Study of the Key Odorants in Caoyuanwang Mild-Flavor Style Baijiu Using Gas Chromatography–Olfactometry and Sensory Approaches. Food Chem. 2021, 347, 129028. [Google Scholar] [CrossRef]
  71. Pripdeevech, P.; Khummueng, W.; Park, S.-K. Identification of Odor-Active Components of Agarwood Essential Oils from Thailand by Solid Phase Microextraction-GC/MS and GC-O. J. Essent. Oil Res. 2011, 23, 46–53. [Google Scholar] [CrossRef]
  72. Wei, C.-B.; Liu, S.-H.; Liu, Y.-G.; Lv, L.-L.; Yang, W.-X.; Sun, G.-M. Characteristic Aroma Compounds from Different Pineapple Parts. Molecules 2011, 16, 5104–5112. [Google Scholar] [CrossRef]
  73. Fernández-Trujillo, J.; Dos-Santos, N.; Martínez-Alcaraz, R.; Le Bleis, I. Non-Destructive Assessment of Aroma Volatiles from a Climacteric Near-Isogenic Line of Melon Obtained by Headspace Stir-Bar Sorptive Extraction. Foods 2013, 2, 401–414. [Google Scholar] [CrossRef]
  74. Lasekan, O.; Abbas, K.A. Distinctive Exotic Flavor and Aroma Compounds of Some Exotic Tropical Fruits and Berries: A Review. Crit. Rev. Food Sci. Nutr. 2012, 52, 726–735. [Google Scholar] [CrossRef]
  75. Niu, Y.; Wang, R.; Xiao, Z.; Sun, X.; Wang, P.; Zhu, J.; Cao, X. Characterization of Volatile Compounds of Rosa Roxburghii Tratt by Gas Chromatography-Olfactometry, Quantitative Measurements, Odor Activity Value, and Aroma Intensity. Molecules 2021, 26, 6202. [Google Scholar] [CrossRef]
  76. Popescu, D.I.; Botoran, O.R.; Ionete, R.E.; Sandru, D.; Sutan, N.A.; Niculescu, V.-C. Highlighting the Terroir Influence on the Aromatic Profile of Two Romanian White Wines. Appl. Sci. 2024, 14, 19. [Google Scholar] [CrossRef]
  77. Schmidtke, L.M.; Antalick, G.; Šuklje, K.; Blackman, J.W.; Boccard, J.; Deloire, A. Cultivar, Site or Harvest Date: The Gordian Knot of Wine Terroir. Metabolomics 2020, 16, 52. [Google Scholar] [CrossRef]
  78. Mignard, P.; Beguería, S.; Giménez, R.; Font I Forcada, C.; Reig, G.; Moreno, M.Á. Effect of Genetics and Climate on Apple Sugars and Organic Acids Profiles. Agronomy 2022, 12, 827. [Google Scholar] [CrossRef]
  79. Coklar, H. Antioxidant Capacity and Phenolic Profile of Berry, Seed, and Skin of Ekşikara (Vitis vinifera L) Grape: Influence of Harvest Year and Altitude. Int. J. Food Prop. 2017, 20, 2071–2087. [Google Scholar] [CrossRef]
  80. Mansour, G.; Ghanem, C.; Mercenaro, L.; Nassif, N.; Hassoun, G.; Del Caro, A. Effects of Altitude on the Chemical Composition of Grapes and Wine: A Review. OENO One 2022, 56, 227–239. [Google Scholar] [CrossRef]
  81. Sinela, A.; Rawat, N.; Mertz, C.; Achir, N.; Fulcrand, H.; Dornier, M. Anthocyanins Degradation during Storage of Hibiscus Sabdariffa Extract and Evolution of Its Degradation Products. Food Chem. 2017, 214, 234–241. [Google Scholar] [CrossRef]
  82. Villavicencio, J.D.; Zoffoli, J.P.; Plotto, A.; Contreras, C. Aroma Compounds Are Responsible for an Herbaceous Off-Flavor in the Sweet Cherry (Prunus avium L.) Cv. Regina during Fruit Development. Agronomy 2021, 11, 2020. [Google Scholar] [CrossRef]
  83. CIQUAL. Table de Composition Nutritionnelle des Aliments. ANSES 2020. Available online: https://ciqual.anses.fr/ (accessed on 10 January 2025).
Figure 1. Locations where surveys were conducted and samples were performed.
Agriculture 15 01175 g001
Figure 2. The A. boehmii Engl. tree (a), leaves (b), fruits (c), and fruit anatomy (d).
Agriculture 15 01175 g002
Figure 3. Survey response analysis of harvest and sale of loengo fruit: (a) harvest period; (b) daily quantity of loengo harvested per tree; and (c) average selling price, where Kz (kwanza) or AOA is the currency of Angola. Exchange rate (21/01/2025): 1000 Kz ≡ EUR 1.05.
Agriculture 15 01175 g003
Figure 4. Survey response analysis of usage and consumption elements of the fruit: (a) shelf life in its fresh state before consumption and/or processing; (b) monthly consumption frequency across all areas; and (c) interest in processed products across all areas.
Agriculture 15 01175 g004
Figure 5. Total polyphenol content (TPC) of the samples of loengo fruit (mean with n = 3). Different letters for significant difference, according to the Tukey test (p < 0.05).
Agriculture 15 01175 g005
Figure 6. Anthocyanin and flavonol contents of the samples of loengo fruit (mean with n = 3). Different letters for significant difference, according to the Tukey test p < 0.05.
Agriculture 15 01175 g006
Figure 7. Total carotenoid content (TCC) of the samples of loengo fruit (mean with n = 3). Different letters for significant difference, according to the Tukey test (p < 0.05).
Agriculture 15 01175 g007
Figure 8. Venn diagram representing the number of aroma compounds identified in fruit from the different samples.
Agriculture 15 01175 g008
Figure 9. Principal component analysis (PCA) performed on (a) overall composition related to the four samples studied; (b) quantified aroma compounds related to the three samples from 2022.
Agriculture 15 01175 g009
Table 1. Results of the analyses conducted on loengo fruit.
ComponentsSamples
Ab21AbM22AbHb22AbHa22
Mass per fruit (g)-14.3 (1.0) a14.0 (1.1) a13.4 (1.1) a
Pulp mass per fruit (g)-8.2 (0.7) a7.7 (1.0) a7.2 (1.2) a
Pulp mass fraction obtained after processing (%)-57.7 (1.7) a55.1 (2.1) a53.2 (2.3) a
Longitudinal diameter (mm)-30.6 (2.0) a28.5 (2.3) b29.1 (2.0) b
Transverse diameter (mm)-23.9 (1.2) b24.6 (1.9) ab24.0 (1.4) a
DM (g·100 g−1)24.71 (0.51) a21.89 (0.15) c22.73 (0.21) b20.24 (0.19) d
TSSs (g·100 g−1 FM)19.80 (0.40) a17.91 (0.38) b18.05 (0.54) b16.29 (0.24) c
pH3.27 (0.05) a3.14 (0.07) bc3.11 (0.03) c3.24 (0.02) ab
TA (g eq.cit·100 g−1 FM)2.62 (0.08) a1.99 (0.01) bc1.86 (0.06) c2.09 (0.03) b
TSSs/TA (gsugar·gacid−1)7.57 (0.30) c9.00 (0.18) b9.71 (0.25) a7.79 (0.20) c
Total protein (g·100 g−1 DM)6.51 (0.23) b6.20 (0.01) b8.36 (0.94) a7.92 (0.03) a
Lipids (g·100 g−1 DM)3.48 (0.31) a3.75 (0.11) a3.53 (0.13) a3.75 (0.23) a
Insoluble Dietary Fibers
NDFs (g·100 g−1 DM)20.99 (0.31) a15.48 (0.17) d18.05 (0.11) c20.25 (0.07) b
ADFs (g·100 g−1 DM)15.24 (0.04) a9.93 (0.21) d12.04 (0.33) c13.57 (0.43) b
ADL (g·100 g−1 DM)8.97 (0.08) a5.55 (0.38) d6.57 (0.09) c7.96 (0.56) b
Sugars
Sucrose (g·100 g−1 DM)18.14 (0.20) d35.05 (0.83) a31.50 (0.36) b23.08 (0.18) c
Glucose (g·100 g−1 DM)12.71 (0.15) ab13.04 (0.11) a12.37 (0.23) b12.39 (0.11) b
Fructose (g·100 g−1 DM)14.95 (0.20) b15.98 (0.40) a14.93 (0.64) b15.15 (0.06) ab
Organic Acids
Citric acid (g·100 g−1 DM)11.47 (0.22) b11.04 (0.07) b9.58 (0.22) c12.52 (0.11) a
Malic acid (g·100g−1 DM)5.39 (0.16) a4.89 (0.14) ab4.32 (0.26) c4.41 (0.27) bc
Minerals
Total Ash (g·100 g−1 DM)5.51 (0.12) a4.37 (0.03) c4.27 (0.07) c5.17 (0.07) b
P (g·100 g−1 DM)0.111 (0.001) a0.093 (0.001) c0.104 (0.001) b0.092 (0.001) c
K (g·100 g−1 DM)1.254 (0.009) a1.036 (0.001) b1.013 (0.002) c1.248 (0.002) a
Ca (g·100 g−1 DM)0.256 (0.001) a0.197 (0.002) b0.151 (0.005) d0.163 (0.001) c
Mg (g·100 g−1 DM)0.181 (0.001) a0.134 (0.001) c0.166 (0.003) b0.181 (0.001) a
Na (g·100 g−1 DM)0.006 (0.001) a0.003 (0.001) b0.004 (0.001) b0.004 (0.001) b
Cu (mg·kg−1 DM)7.48 (0.35) a7.36 (0.03) a6.80 (0.05) b5.59 (0.23) c
Fe (mg·kg−1 DM)29.82 (1.67) a30.03 (1.56) a30.73 (3.49) a25.29 (1.77) a
Mn (mg·kg−1 DM)202.47 (0.76) a133.63 (0.52) b113.74 (2.95) c202.73 (0.50) a
Zn (mg·kg−1 DM)15.00 (0.38) a7.58 (0.29) c9.80 (0.46) b8.93 (0.29) b
B (mg·kg−1 DM)19.37 (0.35) a15.37 (0.15) b16.08 (0.96) b16.44 (0.24) b
Energy value (kJ·100 g−1 DM)1008 (25) 1317 (27) 1257 (41) 1121 (15)
Values with the same letter within the row were not significantly different, according to the Tukey test (p < 0.05). Mean and standard deviation in brackets with n = 3. DM: dry matter; TSSs: total soluble solids; TA: titratable acidity; NDFs: Neutral Detergent Fibers; ADFs: Acid Detergent Fibers; ADL: Acid Detergent Lignin; and FM: Fresh Matter.
Table 2. Identification and concentration of the main phenolic compounds found in the A. boehmii fruits (example of the AbM22 sample).
HPLC-DADHPLC-MS
Peak Nr.RT (min)λmax (nm)MS (m/z)MS2 (m/z)CompoundsContent (mg·100 g−1 DM)
122.4244, 282, 344NDNDNI-
225.5280, 516447285Cyanidin 3-O-glucoside (C3G)45.22 (1.28) 1
330.1262, 356625316Myricetin O-glucoside rhamnoside1.44 (0.09) 2
430.6262, 356625316Myricetin O-glucoside rhamnoside1.71 (0.15) 2
533.8258, 354609301Quercetin O-glucoside rhamnoside0.75 (0.09) 2
634.2258, 354609301Quercetin O-glucoside rhamnoside1.64 (0.34) 2
734.4258, 354463301Quercetin O-glucoside2.76 (0.21) 2
835.1258, 354463301Quercetin O-glucoside2.95 (0.37) 2
937.5240, 356NDNDNI-
1048.0256, 372301NDQuercetin0.14 (0.06) 2
RT: retention time; ND: undetected; NI: unidentified; MS: molecular ion mass in negative mode; MS2: fragment ion mass in negative mode; 1: expressed in mg eq. cyanidin·100 g−1 of DM; 2: expressed in mg eq. quercetin·100 g−1 of DM.
Table 3. Identification and spectral characteristics of the carotenoids found after saponification in the A. Boehmii fruits (example of the AbHb22 sample).
PeakRT (min)Identified Compoundsλmax (nm)% III/II
120.72Antheraxanthin(422); 444; 47258
222.29Zeaxanthin(426); 451; 47623
328.06β-Cryptoxanthin(424); 452; 47618
432.05Lutein(424); 446; 47352
534.67β-Carotene(424); 452; 47615
Table 4. Aromatic compounds found in the samples. The 14 compounds marked with an asterisk (*) were common to all samples, and those marked in bold were quantified.
Aroma CompoundOdor DescriptionReferences
Alcohols
Ethanol *Apple, sweet, strong, alcoholic[57]
Heptan-4-olFloral[58]
Hexan-1-ol *Ethereal, fruity, sweet, green[59]
(Z)-hex-3-en-1-ol *Fresh green cut grass, vegetable[59]
(E)-hex-2-en-1-olGreen, leafy, fruity[59]
2-Ethylhexan-1-ol Fruity, oily, sweet, reminiscent of roses[60]
Aldehydes and Ketones
Hexanal *Green, grassy[59]
(E)-pent-2-enal Sweet, herbaceous[61]
(E)-hex-3-enal Green, fruity, apple-like[60]
HeptanalVery strong, fatty, harsh, pungent odor and an unpleasant, fatty taste[60]
(E)-2-Hexen-1-alSweet, fragrant, almond, fruity green, leafy, apple, plum, vegetable odor[60]
(Z)-hept-4-enal Oily, fishy[61]
Benzaldehyde *Almonds, cherry, sweetness, burnt sugar[57]
2-phenylacetaldehyde Honey-like[62]
NonanalCitrus, green, citronella, grass[61]
Pentan-3-one *Sweet, green[63]
2-methylpent-1-en-3-oneCitrus-like, orange, dried flower, rose[64]
Pentane-2,3-dioneSweet odor similar to quinone[60]
AcetoinSweet, butter, cream[65]
Pent-1-en-3-oneGreen, pungent, mustard[63]
Heptan-3-one Fruity, green, fatty, sweet, ethereal, powerful odor and a melon, banana flavor[60]
Esters
Ethyl Acetate *Pineapple, fruity, ethereal[57]
Ethyl 2-furanpropionateFruity odor reminiscent of chamomile[60]
Ethyl 2-methylpropanoate *Sweet[57]
Methyl butanoateEther, fruity, sweet[65]
Ethyl butyrate *Apple, strawberry, fruity, pineapple[57]
Ethyl (E)-but-2-enoateFruity, rum, caramellic[66]
Ethyl 2-methylbutanoate *Powerful, green, fruity, apple-like odor[60]
Ethyl 3-methylbutanoate Strong, fruity, vinous, apple-like odor on dilution[60]
Butyl acetateStrong, fruity odor, burning, and then sweet taste reminiscent of pineapple[60]
Diethyl carbonate * Plastic [67]
3-methylbutyl acetate *Fruity, banana, sweet, fragrant, powerful, reminiscent of pear[60]
Ethyl (Z)-but -2-enoatePowerful, sour, caramellic, fruity[60]
Methyl hexanoateFruity, fatty[66]
Ethyl hexanoateApple peel, fruit, green apple[57]
Hexyl acetatePleasant fruity, apple, cherry, bittersweet taste suggestive of pear[60]
(Z)-hex-3-enyl acetatePowerful, green, fruity, floral note reminiscent of banana[60]
(E)-hex-2-enyl acetate Green, fruity[57]
(E)-Ethyl 2-hexenoateFruity, green, pulpy pineapple and apple odor[60]
Ethyl benzoate * Somewhat fruity, similar to ylang-ylang[60]
3-Methylbut-2-enyl acetate Fruity, green apple, banana, melon[60]
Ethyl octanoate Fruity, fat[57]
Ethyl (methylthio) acetateFruity[60]
Ethyl pentanoateFruity, sweet[61]
Methyl benzoateViolet, floral[68]
Propyl acetatePleasant, bittersweet flavor reminiscent of pear on dilution[60]
Isobutyl acetateFruity, apple[63]
Butyl prop-2-enoate Mushroom-like, geranium-like[69]
Furan
2-EthylFuranSweet, chemical with clean, fresh, fruity lift[60]
Hydrocarbons
1,2-dimethoxybenzene Smoky[70]
1-methoxy-4-propylbenzene *Anise-type odor with a sassafras undertone[60]
LimonenePleasant, lemon-like odor free from camphoraceous and turpentine-like odor[60]
1-Methyl-3-propan-2-ylbenzene Citrus[62]
Ethylbenzene Strong[63]
1,3-xylene Sweet[71]
EstragoleReminiscent of anise with a corresponding sweet taste[60]
Carboxylic acids
Acetic acidSharp, pungent, vinegar, cheesy, fatty, sour[57]
Table 5. Identification and quantification of aroma compounds, found in the fruits of A. boehmii; odor threshold and evaluation of odor activity.
Concentration
(µg eq. 3-Heptanol·kg−1 FM)
Odor Threshold (µg·kg−1)Evaluation of the
Odor Activity Value
KI Lit.KI Cal.Aroma Compounds (Match Factor > 80%)AbM22AbHb22AbHa22AbM22AbHb22AbHa22
888892Ethyl Acetate353 (34) b11 (12) a411 (31) b3300 f0.1070.0030.125
932928Ethanol92 (12) c212 (1) b286 (17) a200,000 f<0.0010.0010.001
10361035Ethyl butyrate13 (2) b26 (2) a15 (1) b0.18 g72.2144.483.3
10521052Ethyl 2-Methylbutanoate 18 (2) c41 (4) b53 (5) a0.006 h300068338833
112311283-methylbutyl acetate<2.9<2.920 (2)3 i--6.7
11601170Ethyl (Z)-but -2-enoate10 (1) b23 (2) a22 (2) aUnkonwn---
12131217(E)-2-Hexen-1-al10 (1) a14 (3) a12 (2) a82 f0.120.170.15
12811285Heptan-4-ol8 (1) <2.9<2.9Unkonwn---
13161317 (Z)-hex-3-enyl acetate 31 (5) a29 (2) a12 (1) b16 f1.91.80.8
13551351Hexan-1-ol9 (2) c22 (2) b36 (5) a1600 f0.0060.0140.023
13821382(Z)-hex-3-en-1-ol30 (5) b46 (6) a44 (6) a910 f0.030.060.02
14061407(E)-hex-2-en-1-ol 33 (4) c54 (4) a19 (2) b100 f0.330.540.19
160316181-methoxy-4-Propylbenzene<2.989 (9) a26 (2) bUnknown---
16581664Ethyl benzoate39 (4) b205 (22) a22 (2) b53 j0.743.870.42
Values with the same letter within the row were not significantly different, according to the Tukey test (p < 0.05). Mean and standard deviation with n = 3. KI Lit: Kovats retention index from the literature; KI Cal: Calculated Kovats retention index. Sources: f [59]; g [66]; h [72]; i [73]; and j [68].
Disclaimer/Publisher’s Note: The statements, opinions and data contained in all publications are solely those of the individual author(s) and contributor(s) and not of MDPI and/or the editor(s). MDPI and/or the editor(s) disclaim responsibility for any injury to people or property resulting from any ideas, methods, instructions or products referred to in the content.

