
Life Cycle Assessment of CO2, Rumen, and Biological Biomass Pretreatment Methods for Biomethane Production


Abstract
1. Introduction
1.1. Background Information
1.2. Biomass for Biogas Production Pretreatment Effect on Environment Pollution
2. Materials and Methods
2.1. LCA Goal, Tasks, and Scope
2.2. Functional Unit
2.3. Life Cycle Assessment System Boundaries
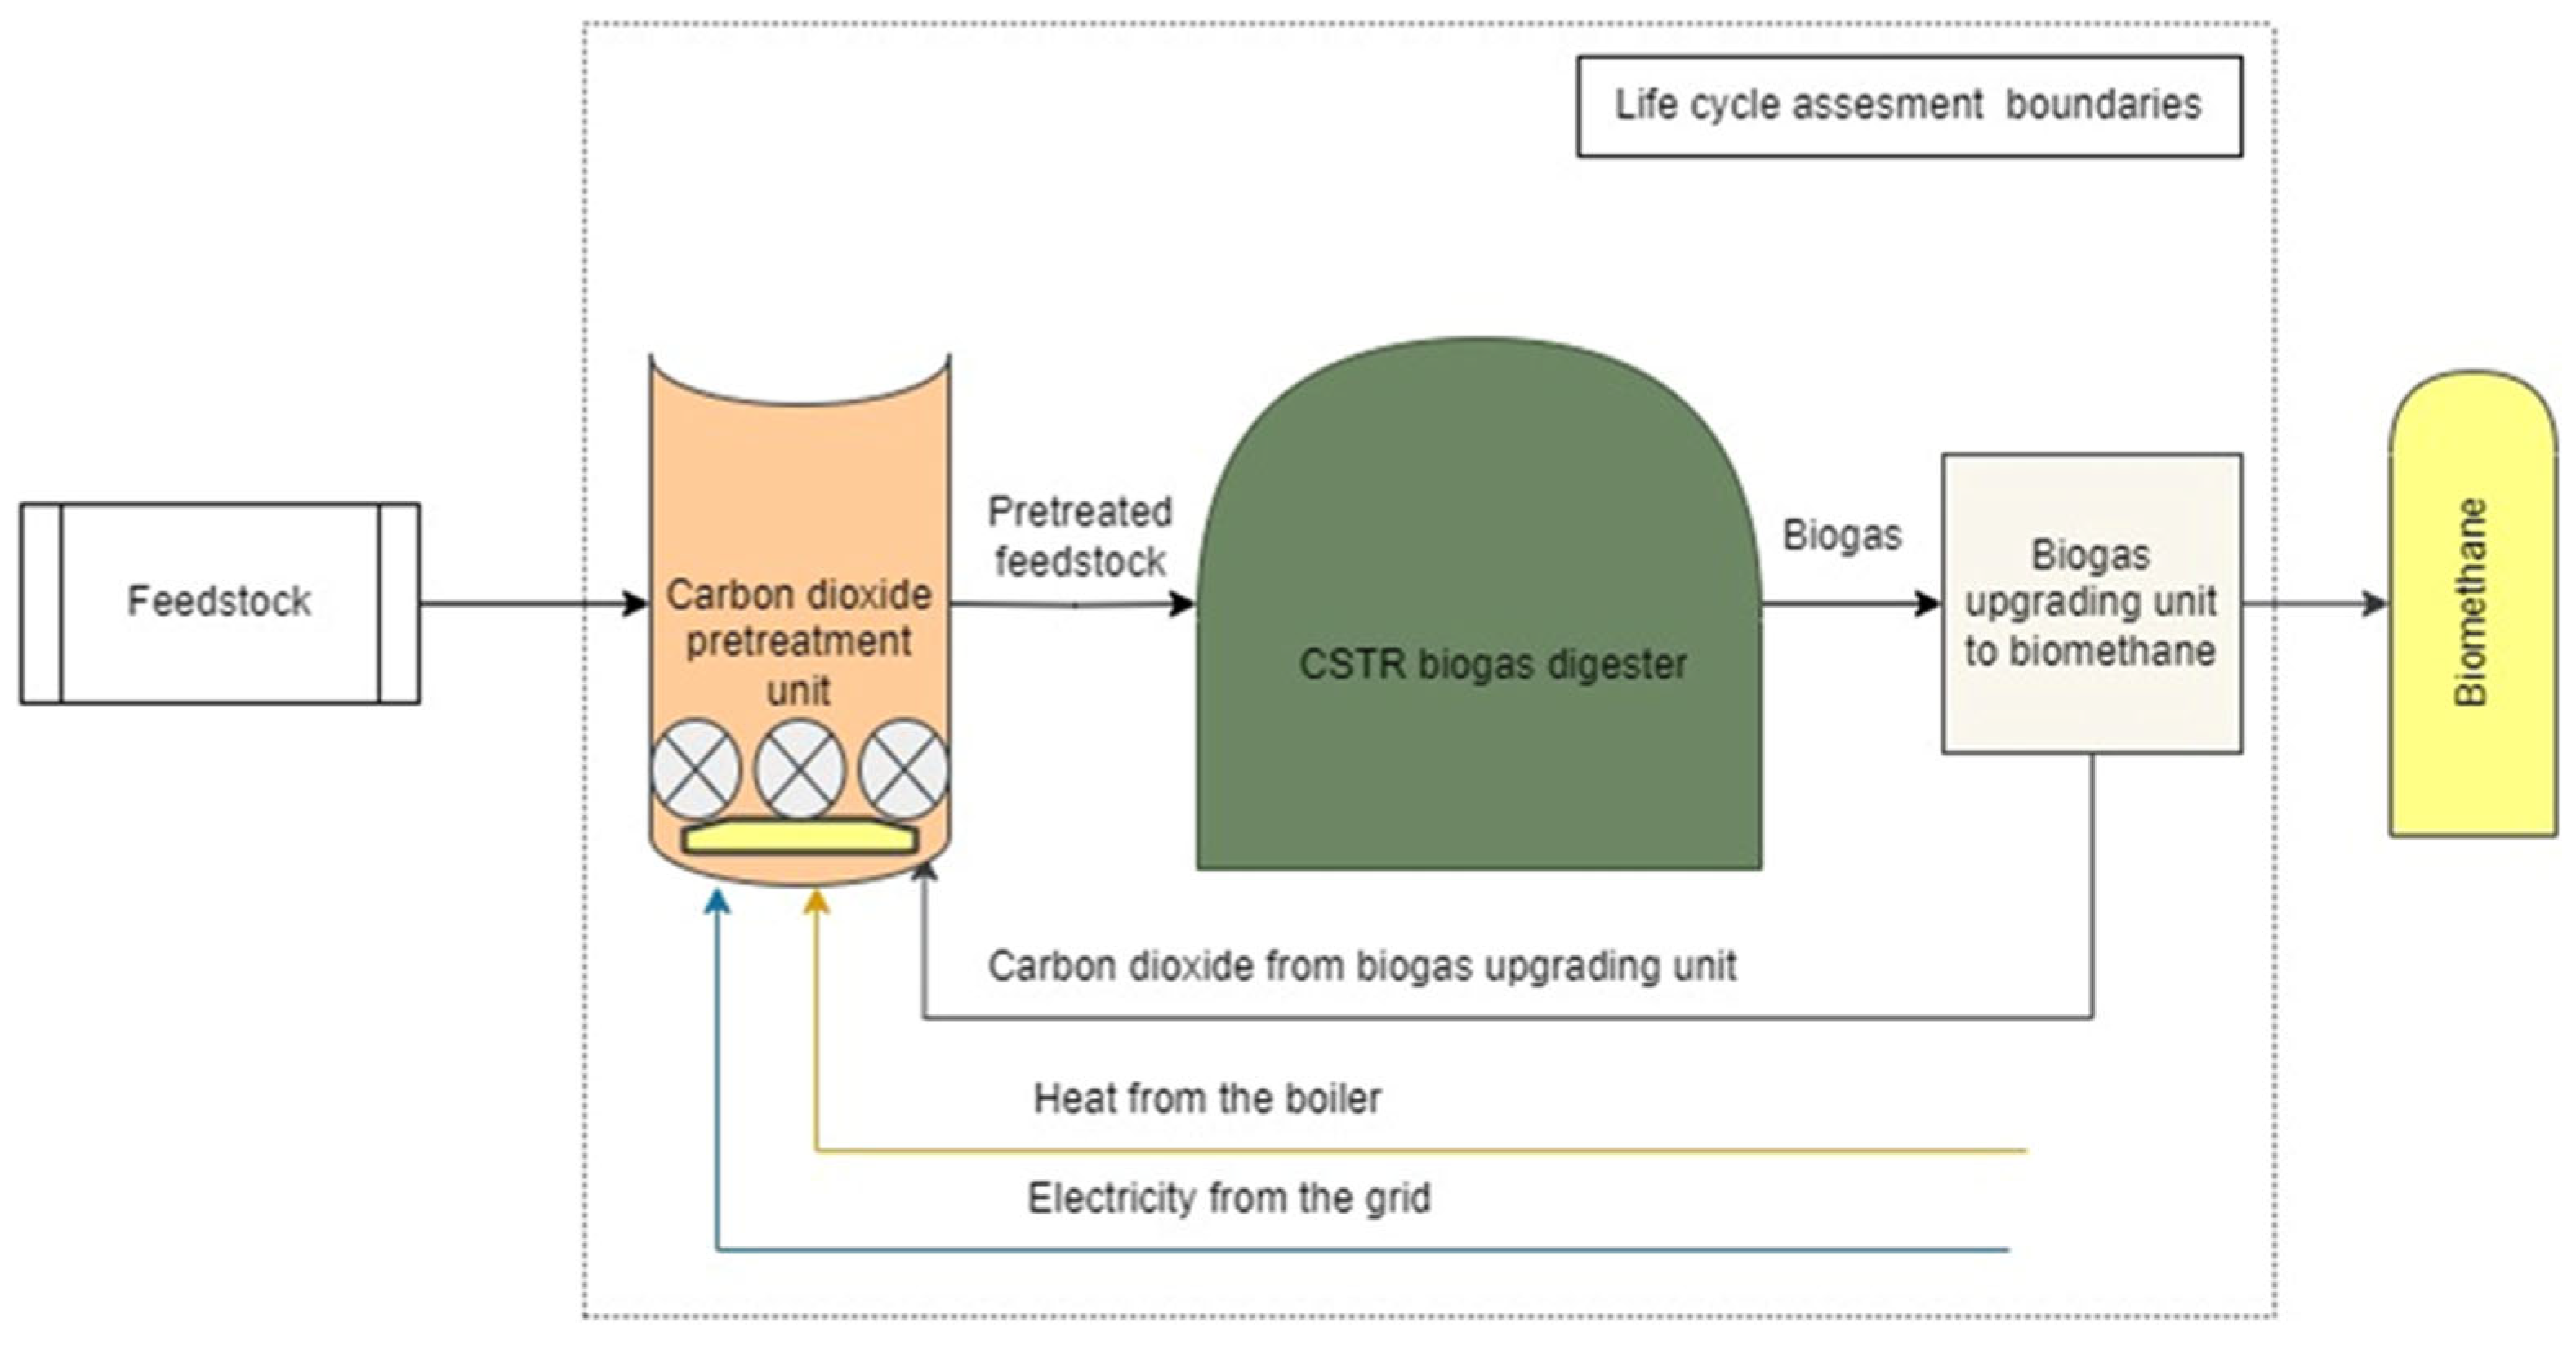
2.3.1. CO2 Pretreatment LCA Boundaries
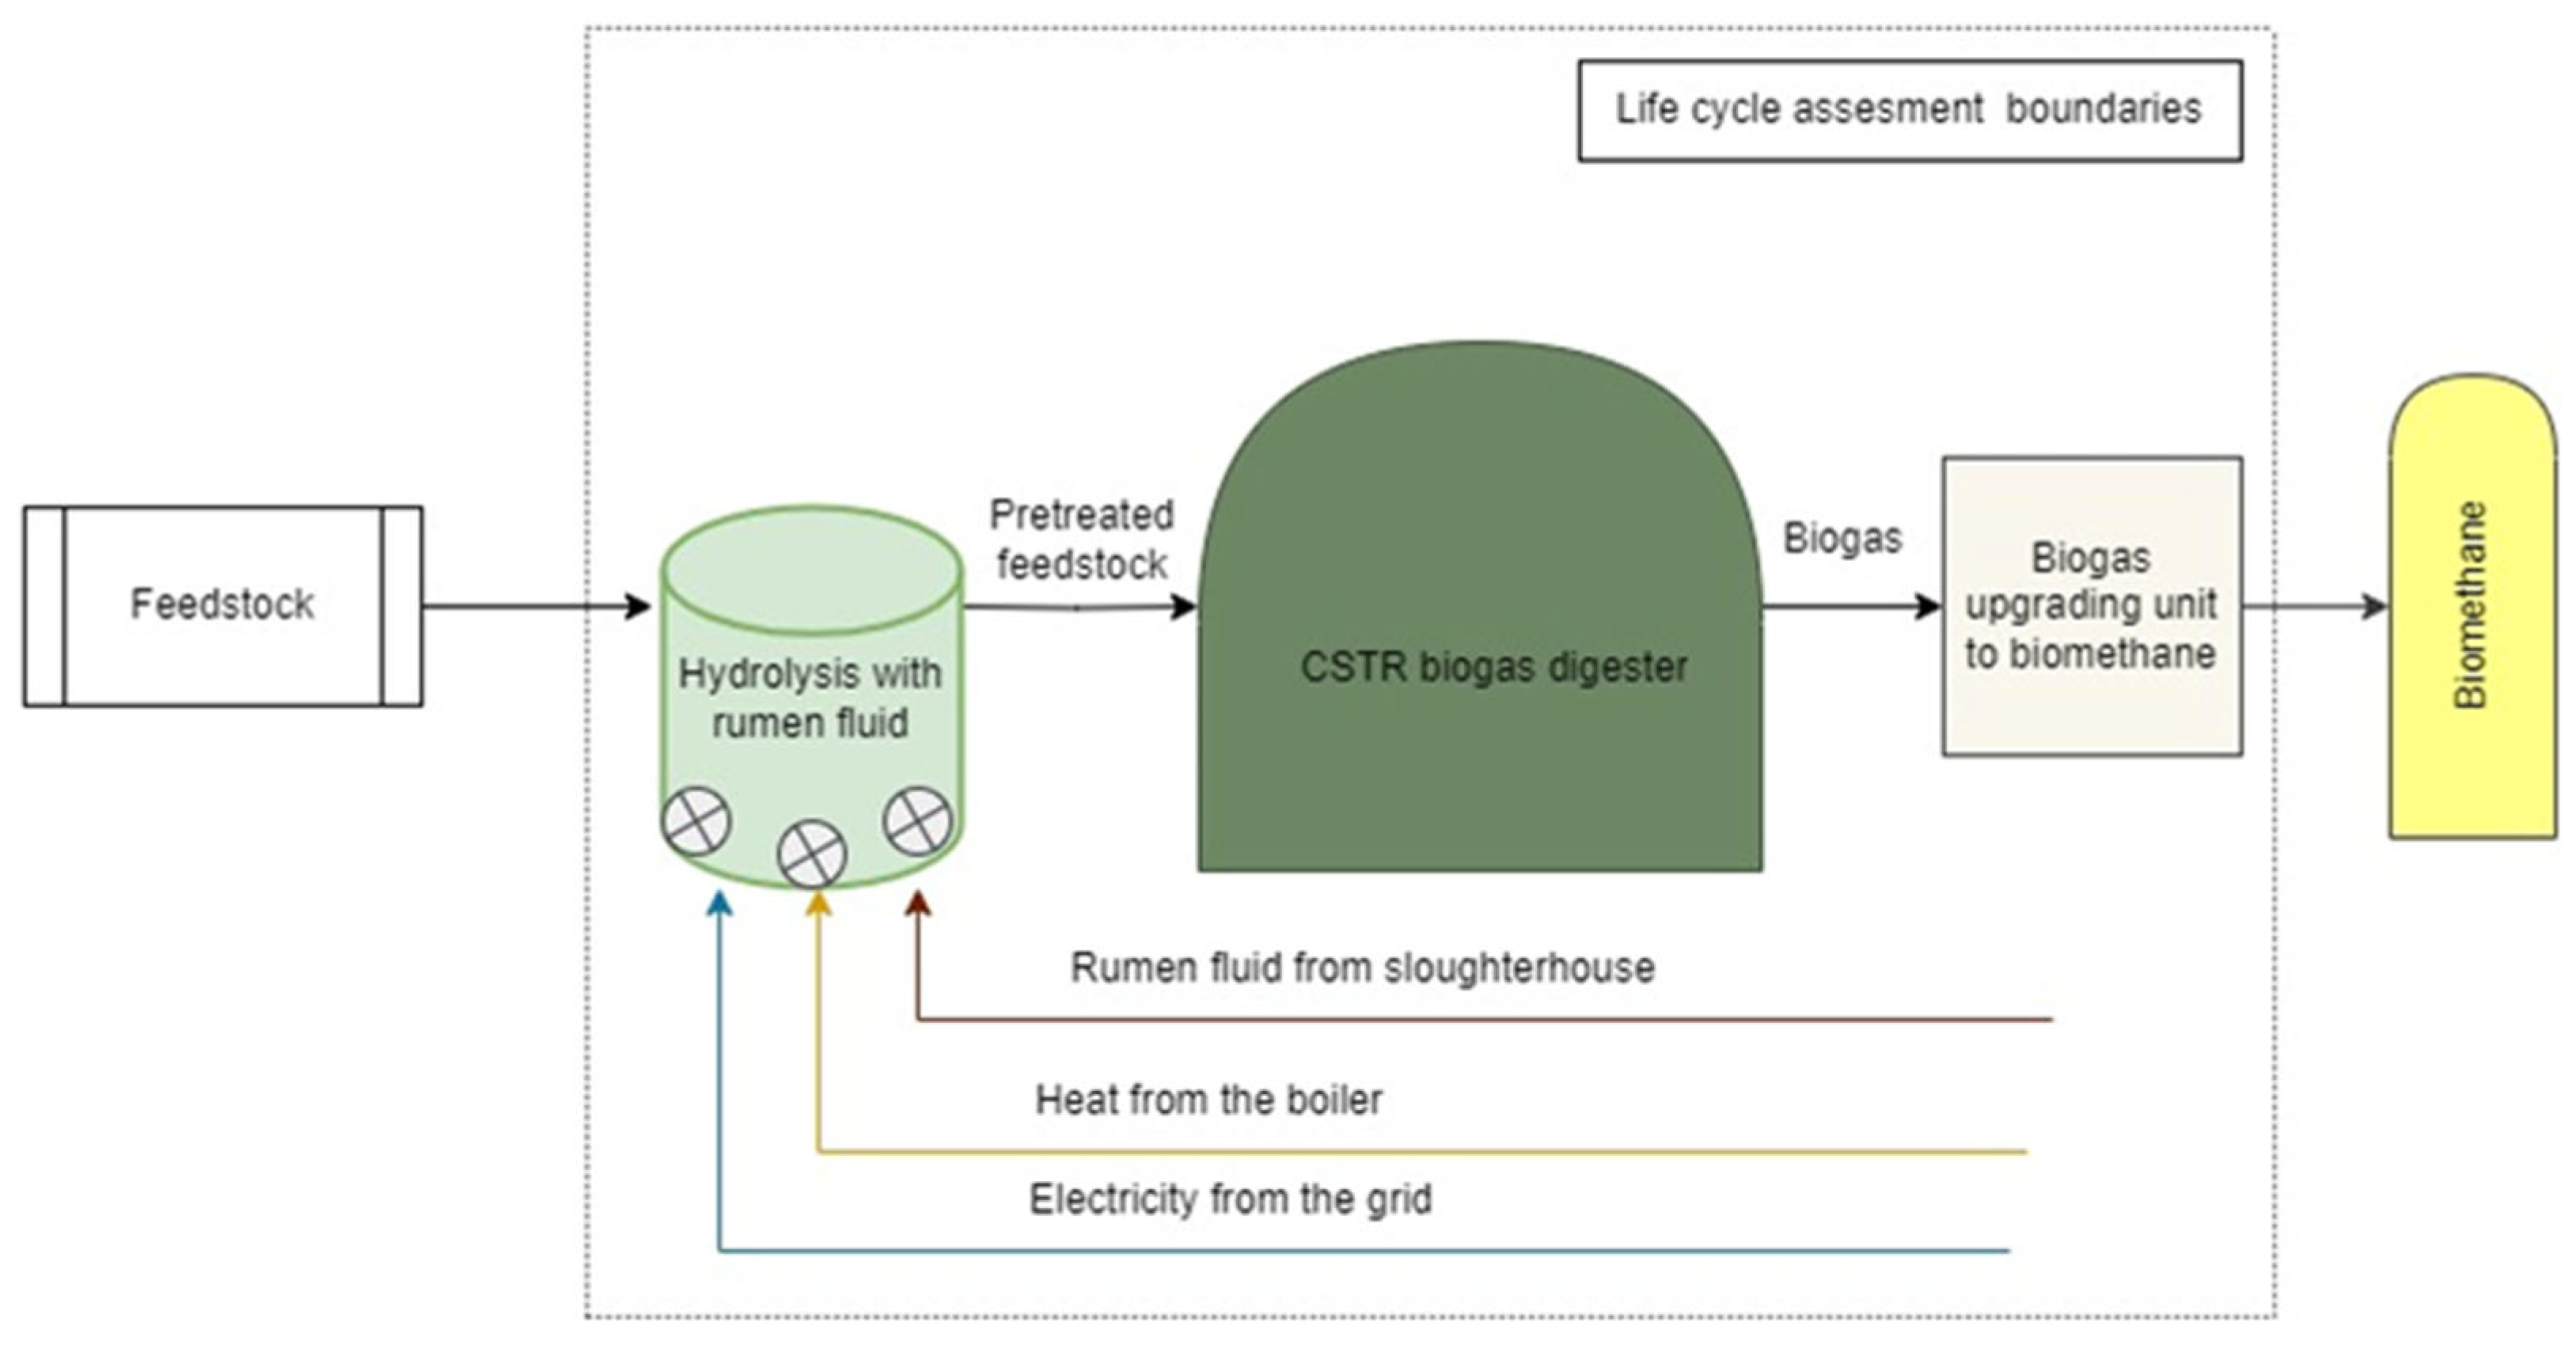
2.3.2. Rumen Fluid Pretreatment LCA Boundaries
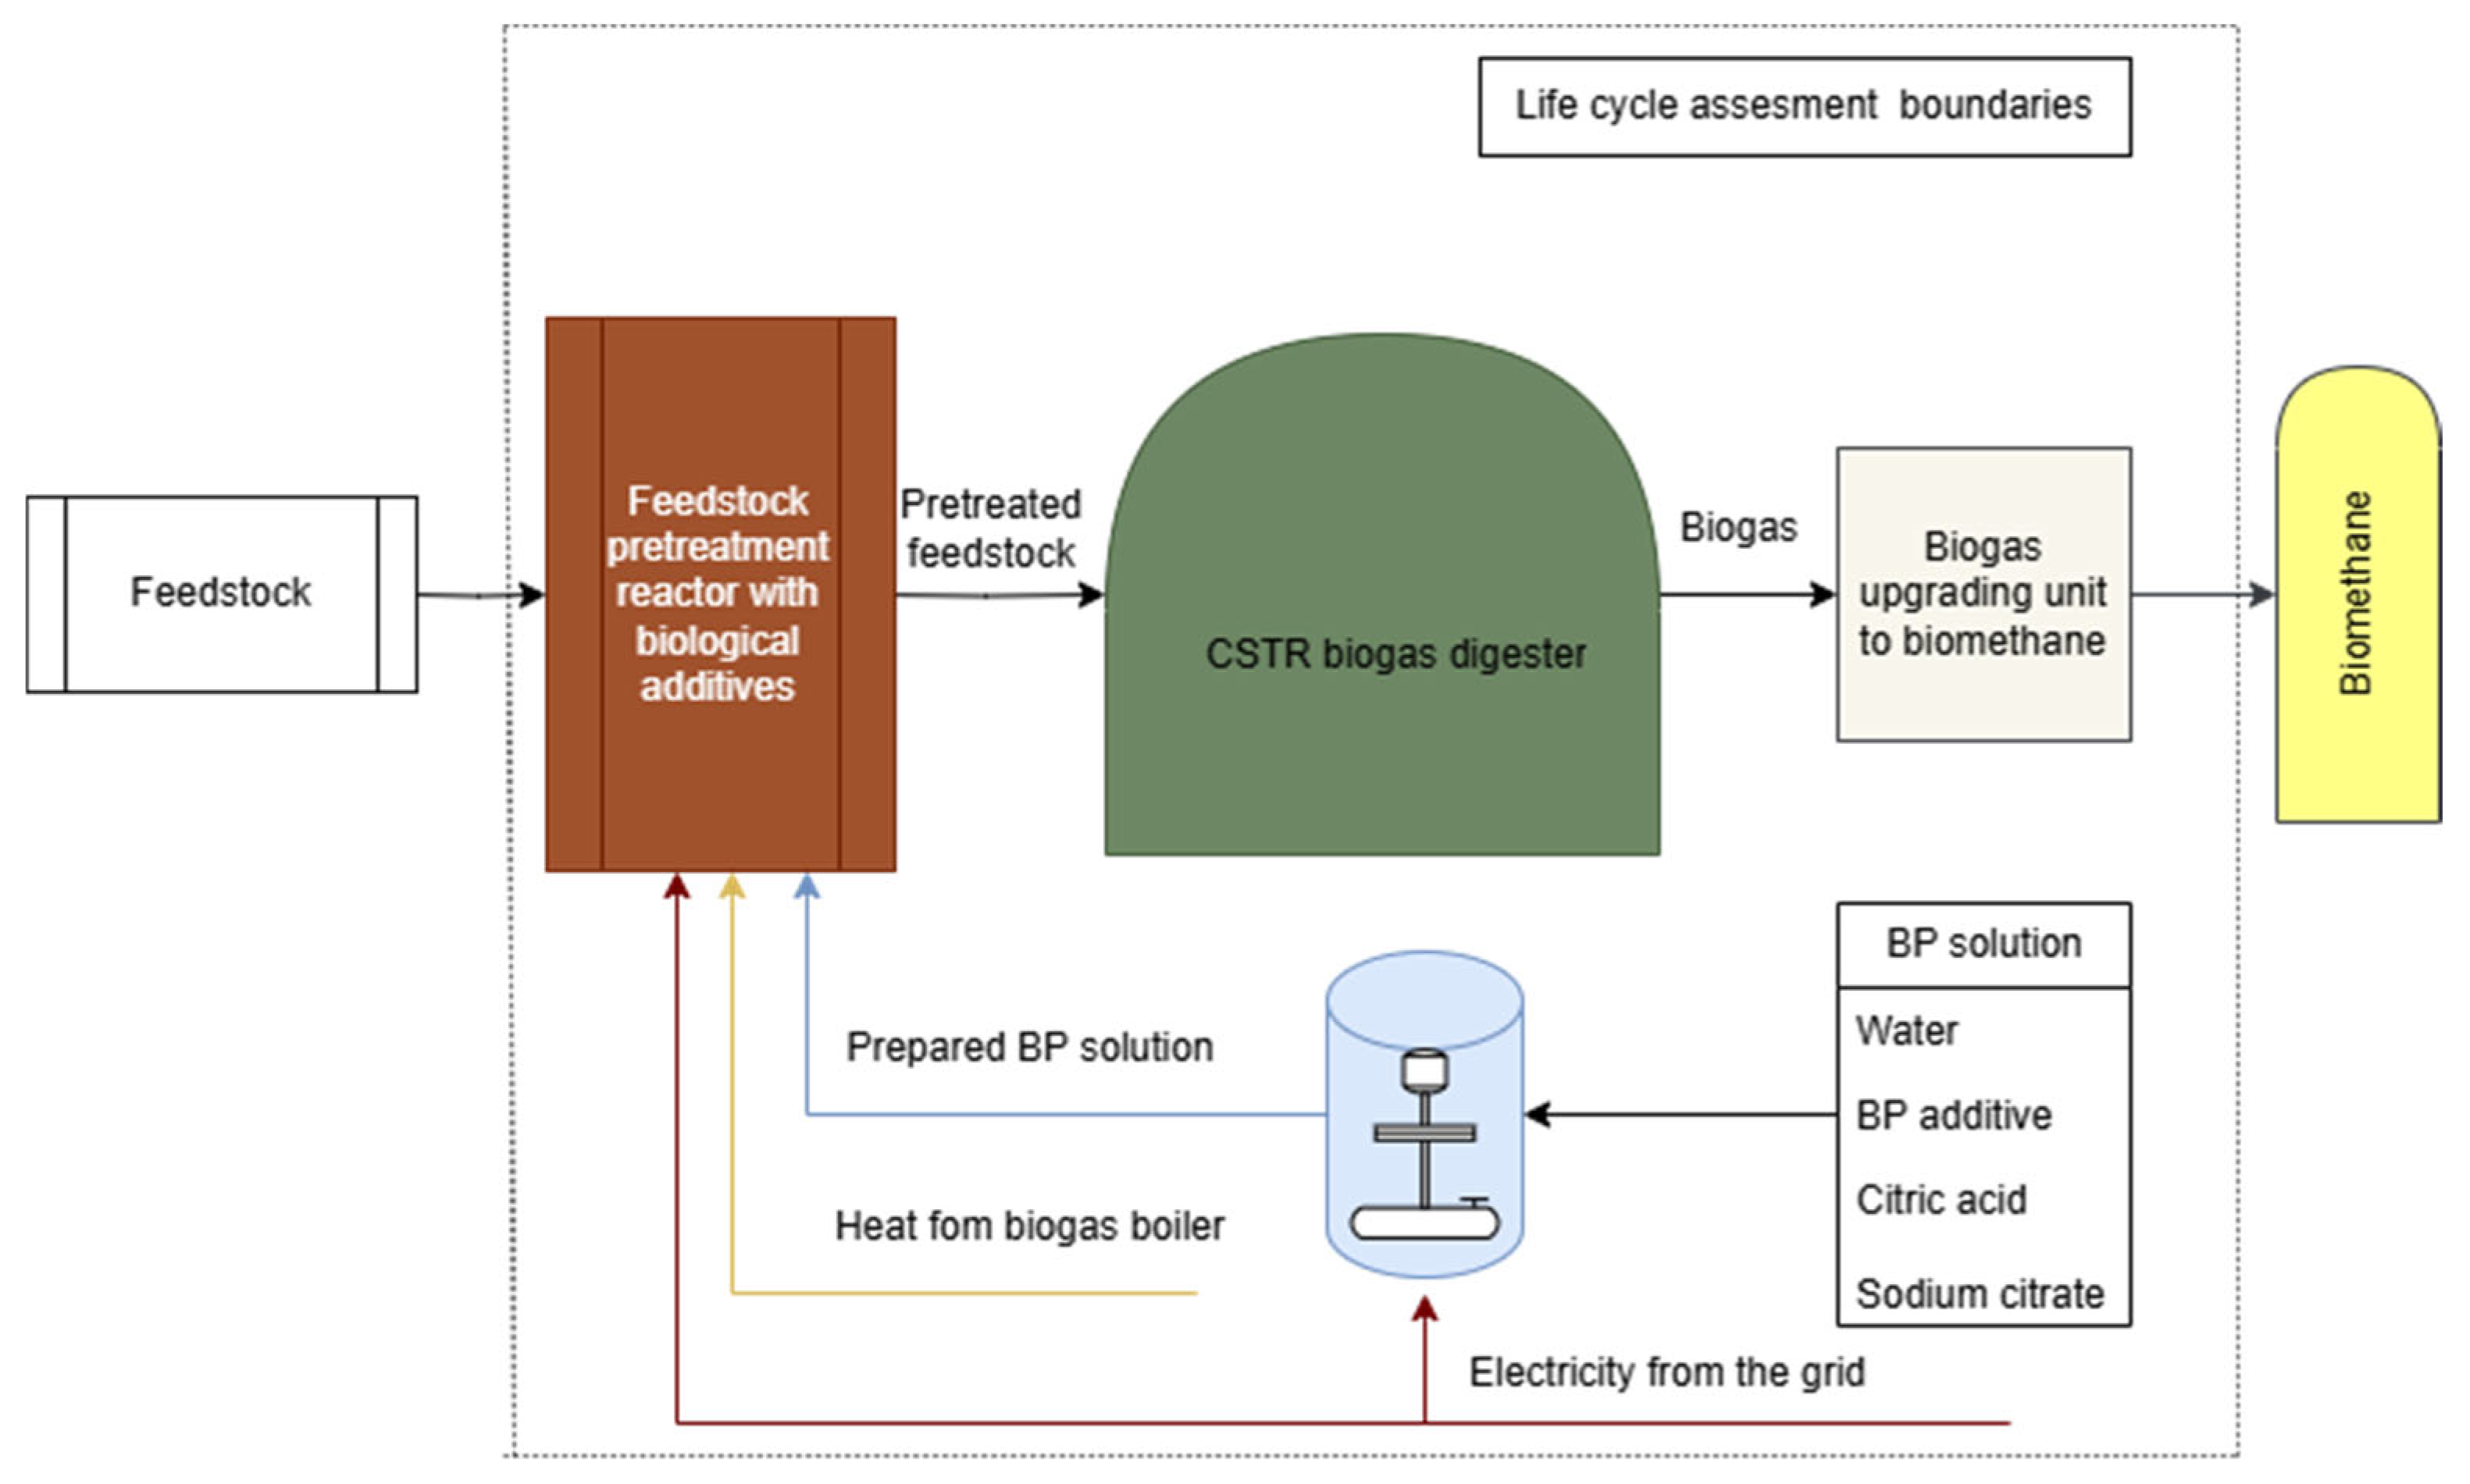
2.3.3. Biological Product Pretreatment LCA Boundaries
2.4. Life Cycle Inventory
3. Results and Discussion
3.1. LCA of Manure CO2 Pretreatment Comparison to Raw Feedstock
3.2. LCA of Alfalfa Pretreatment Using Rumen Fluid
3.3. LCA of WWS Pretreatment with Biological Products Comparison to Raw Feedstock
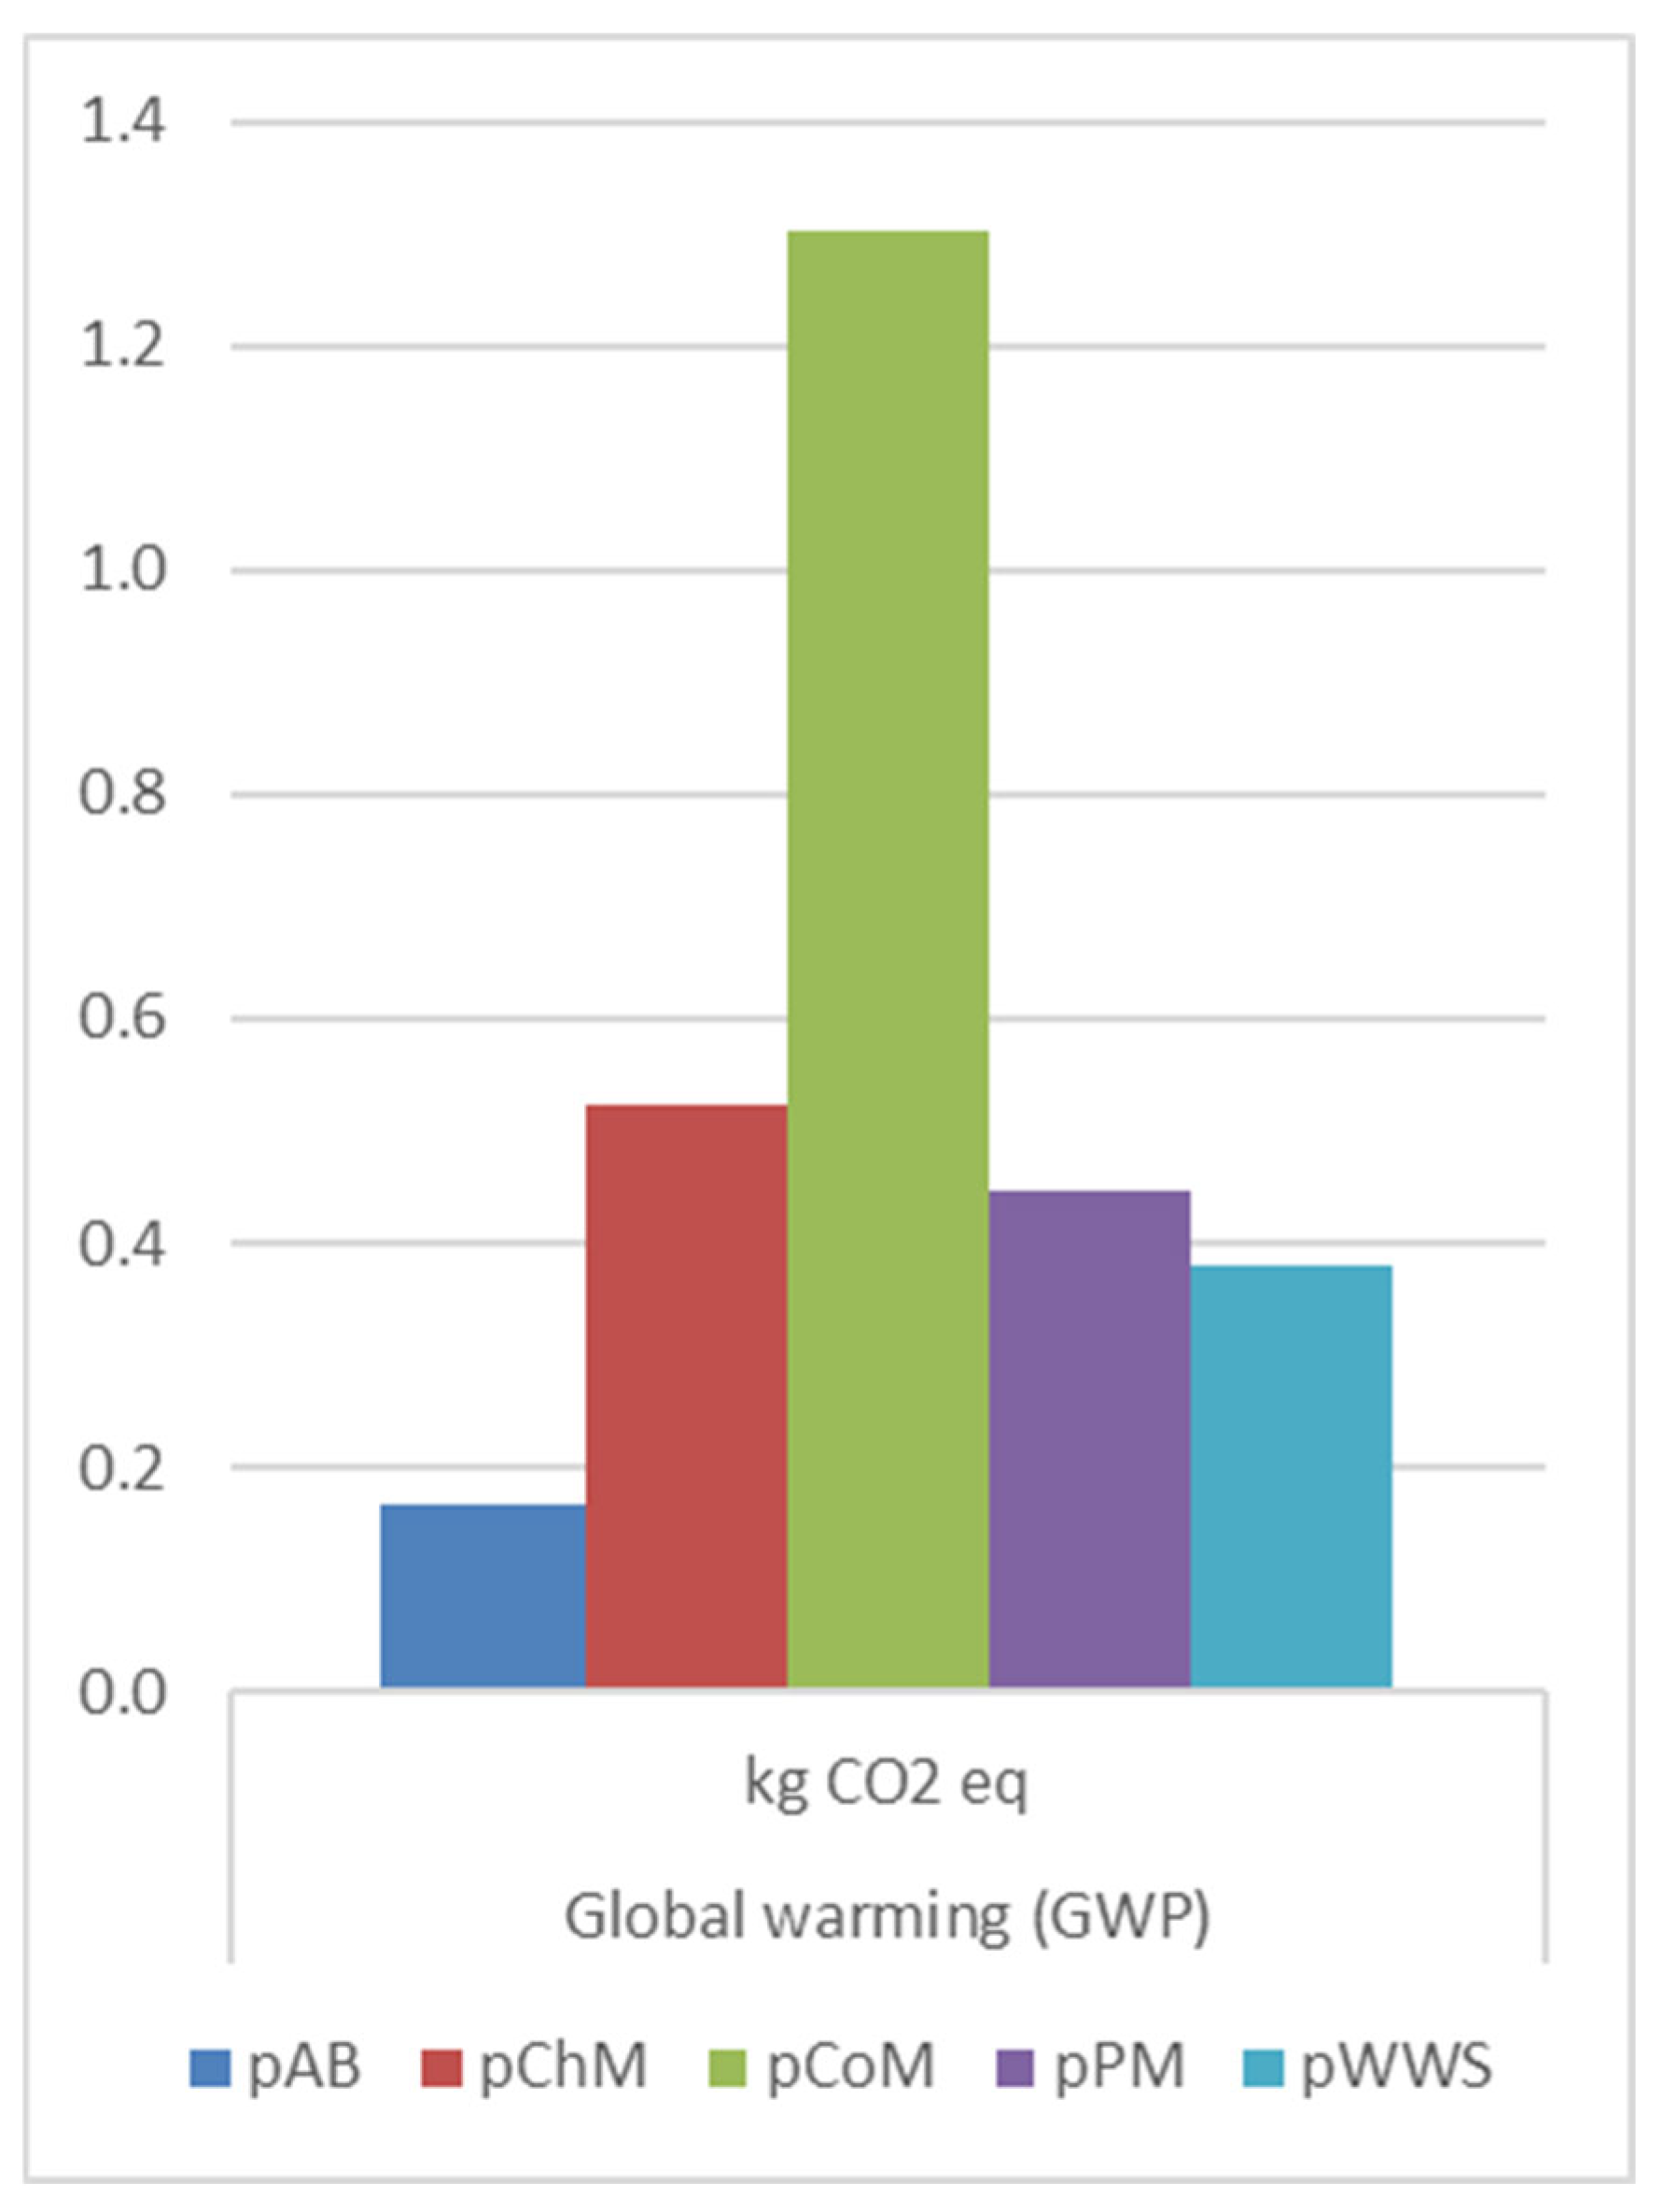
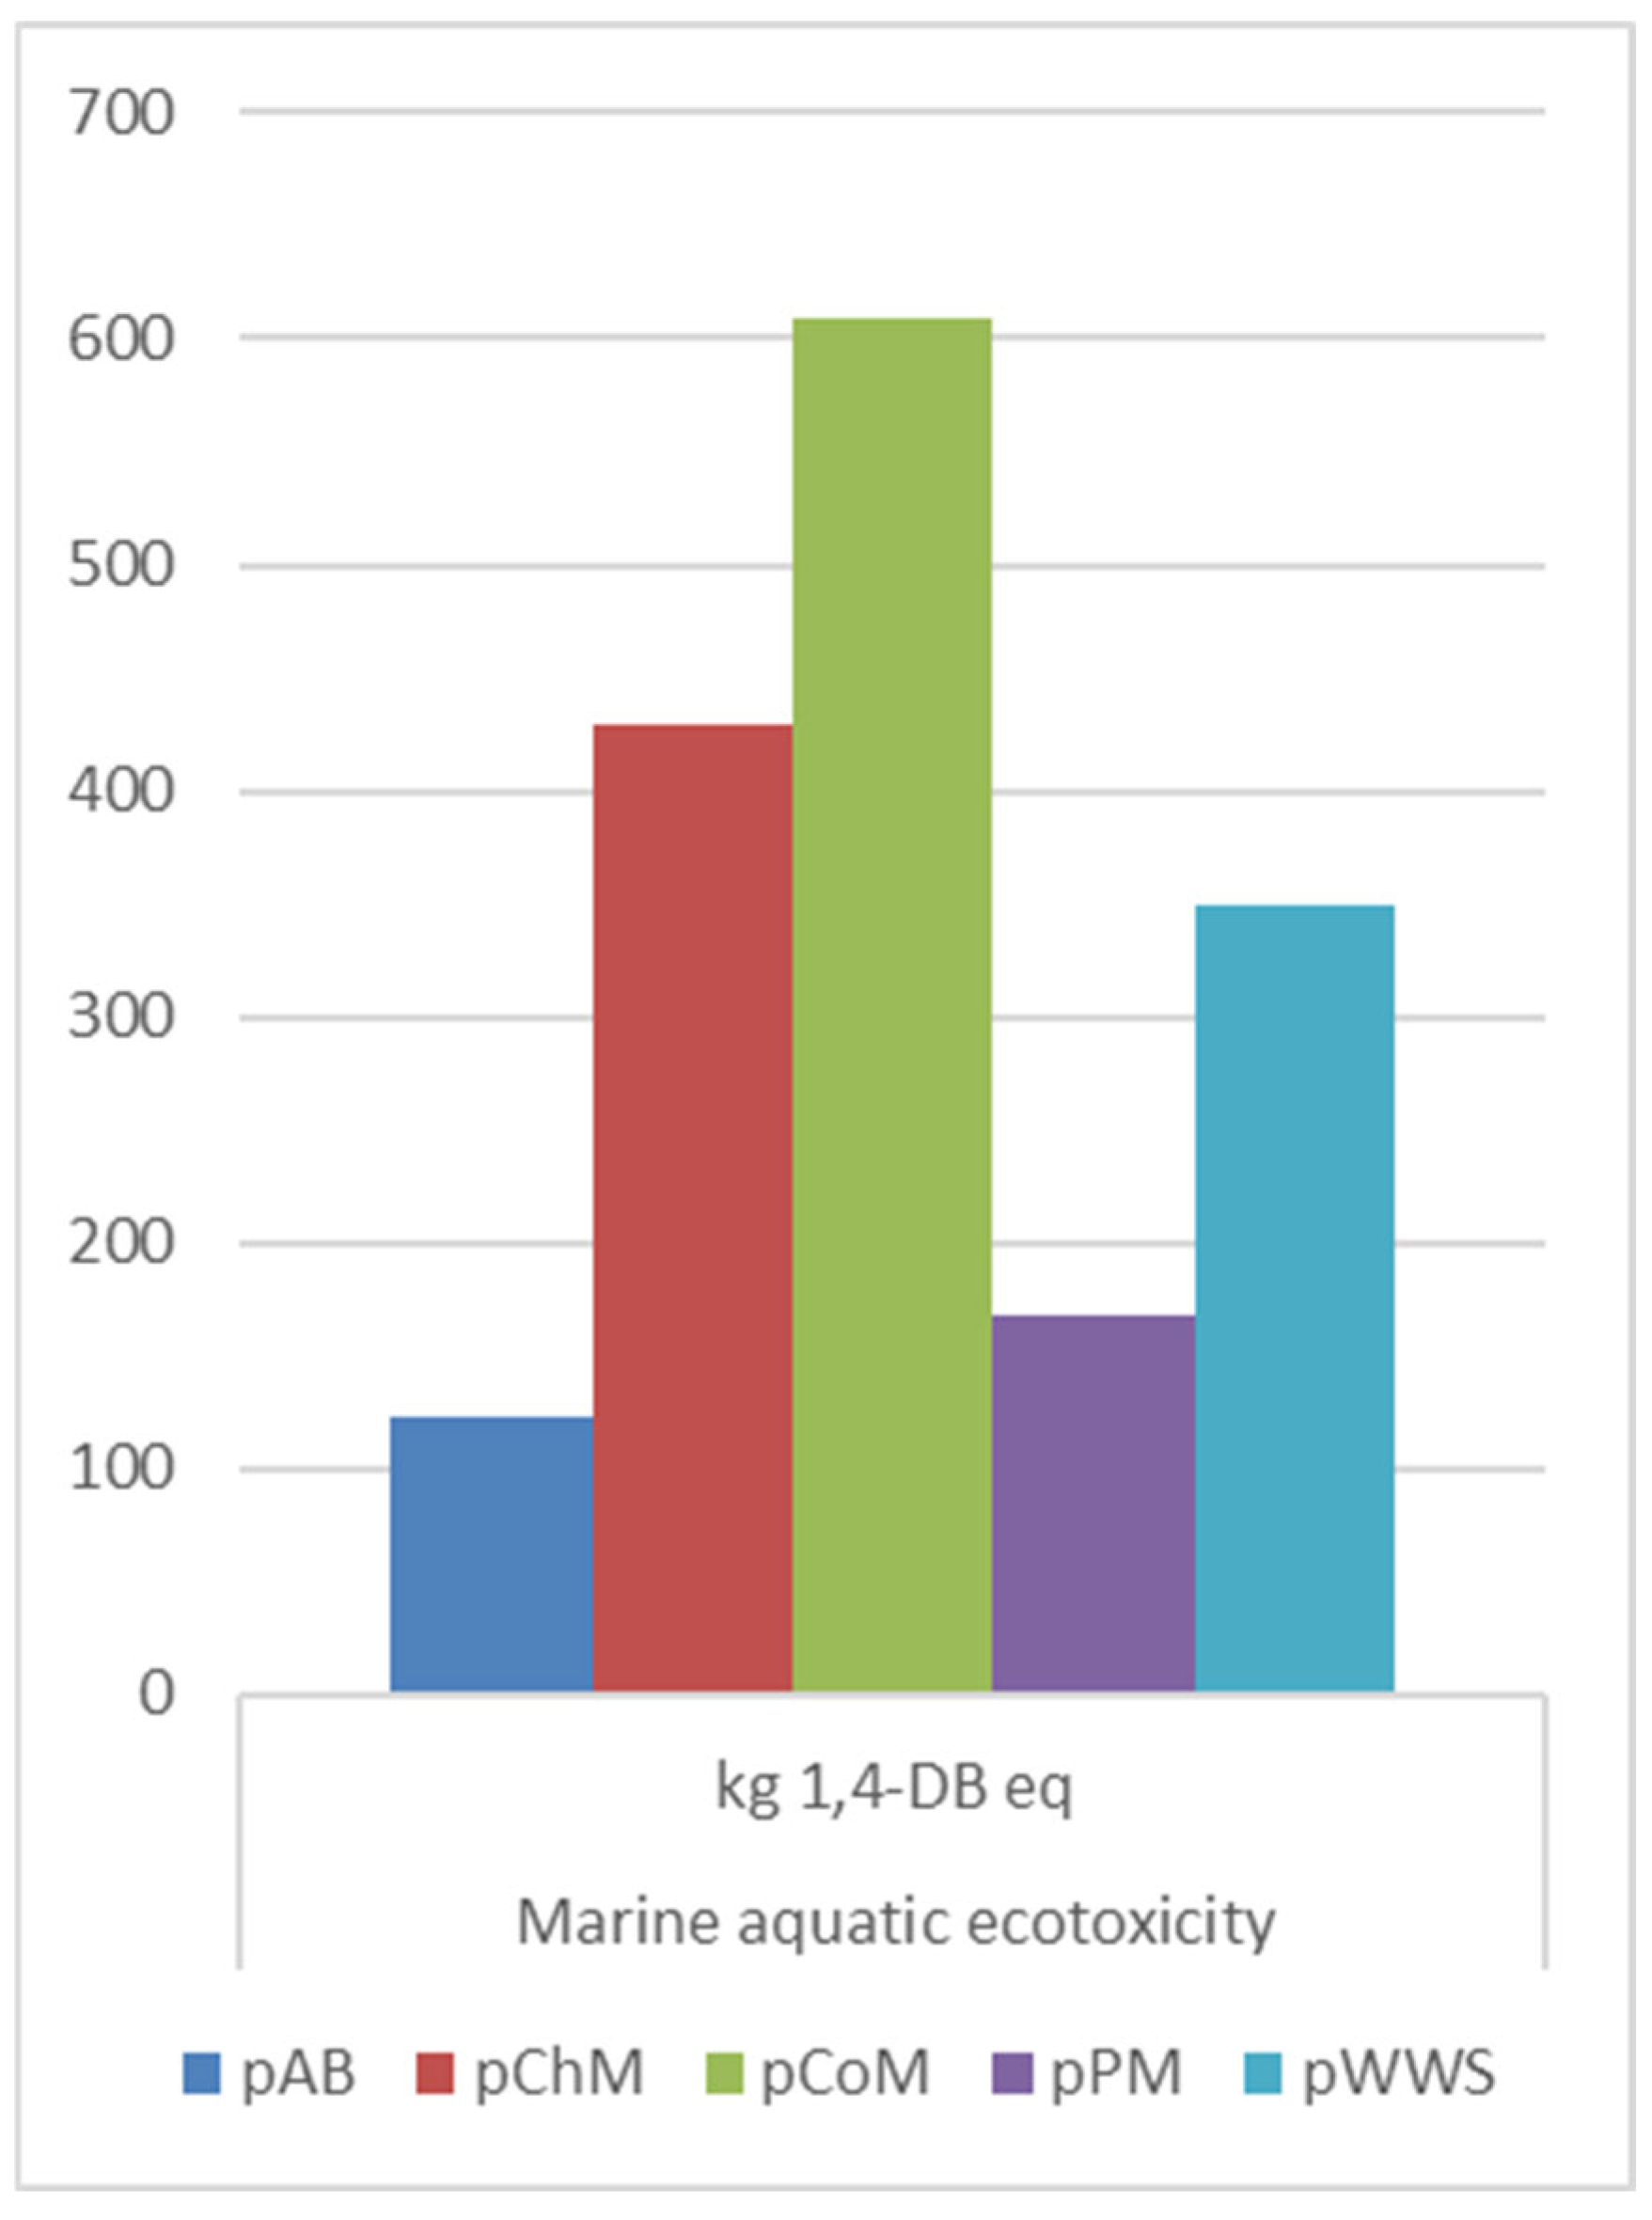
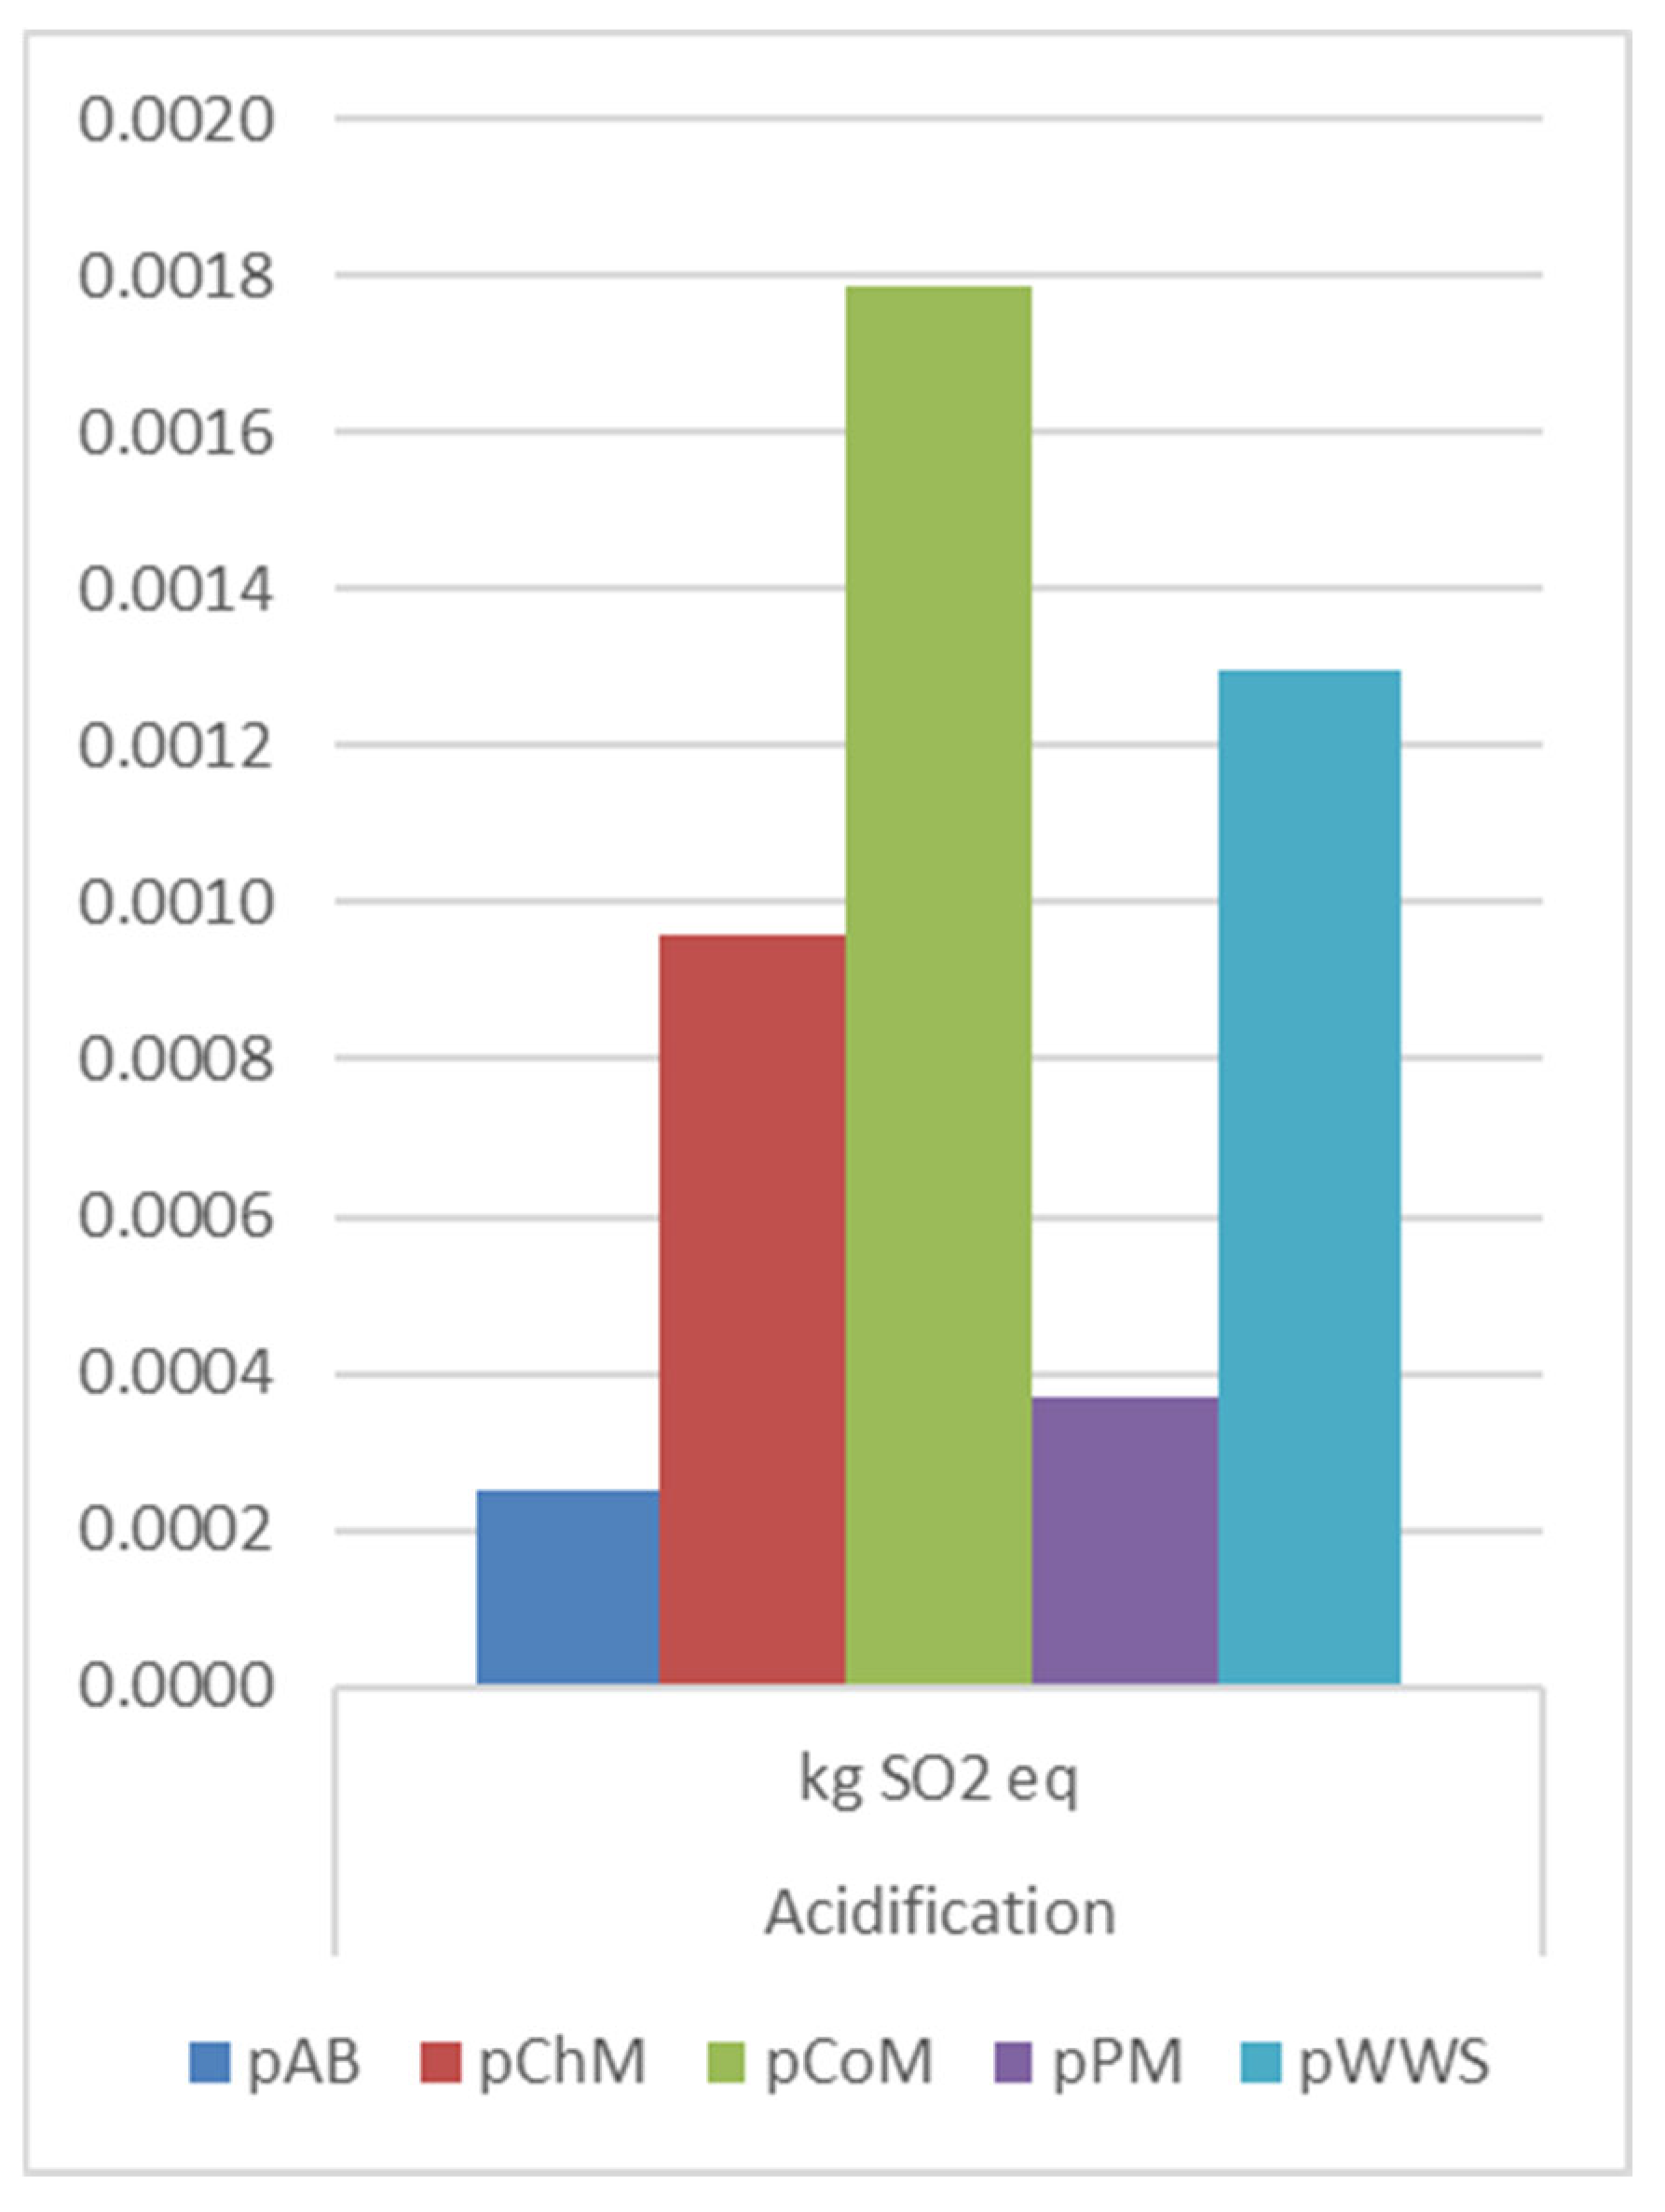
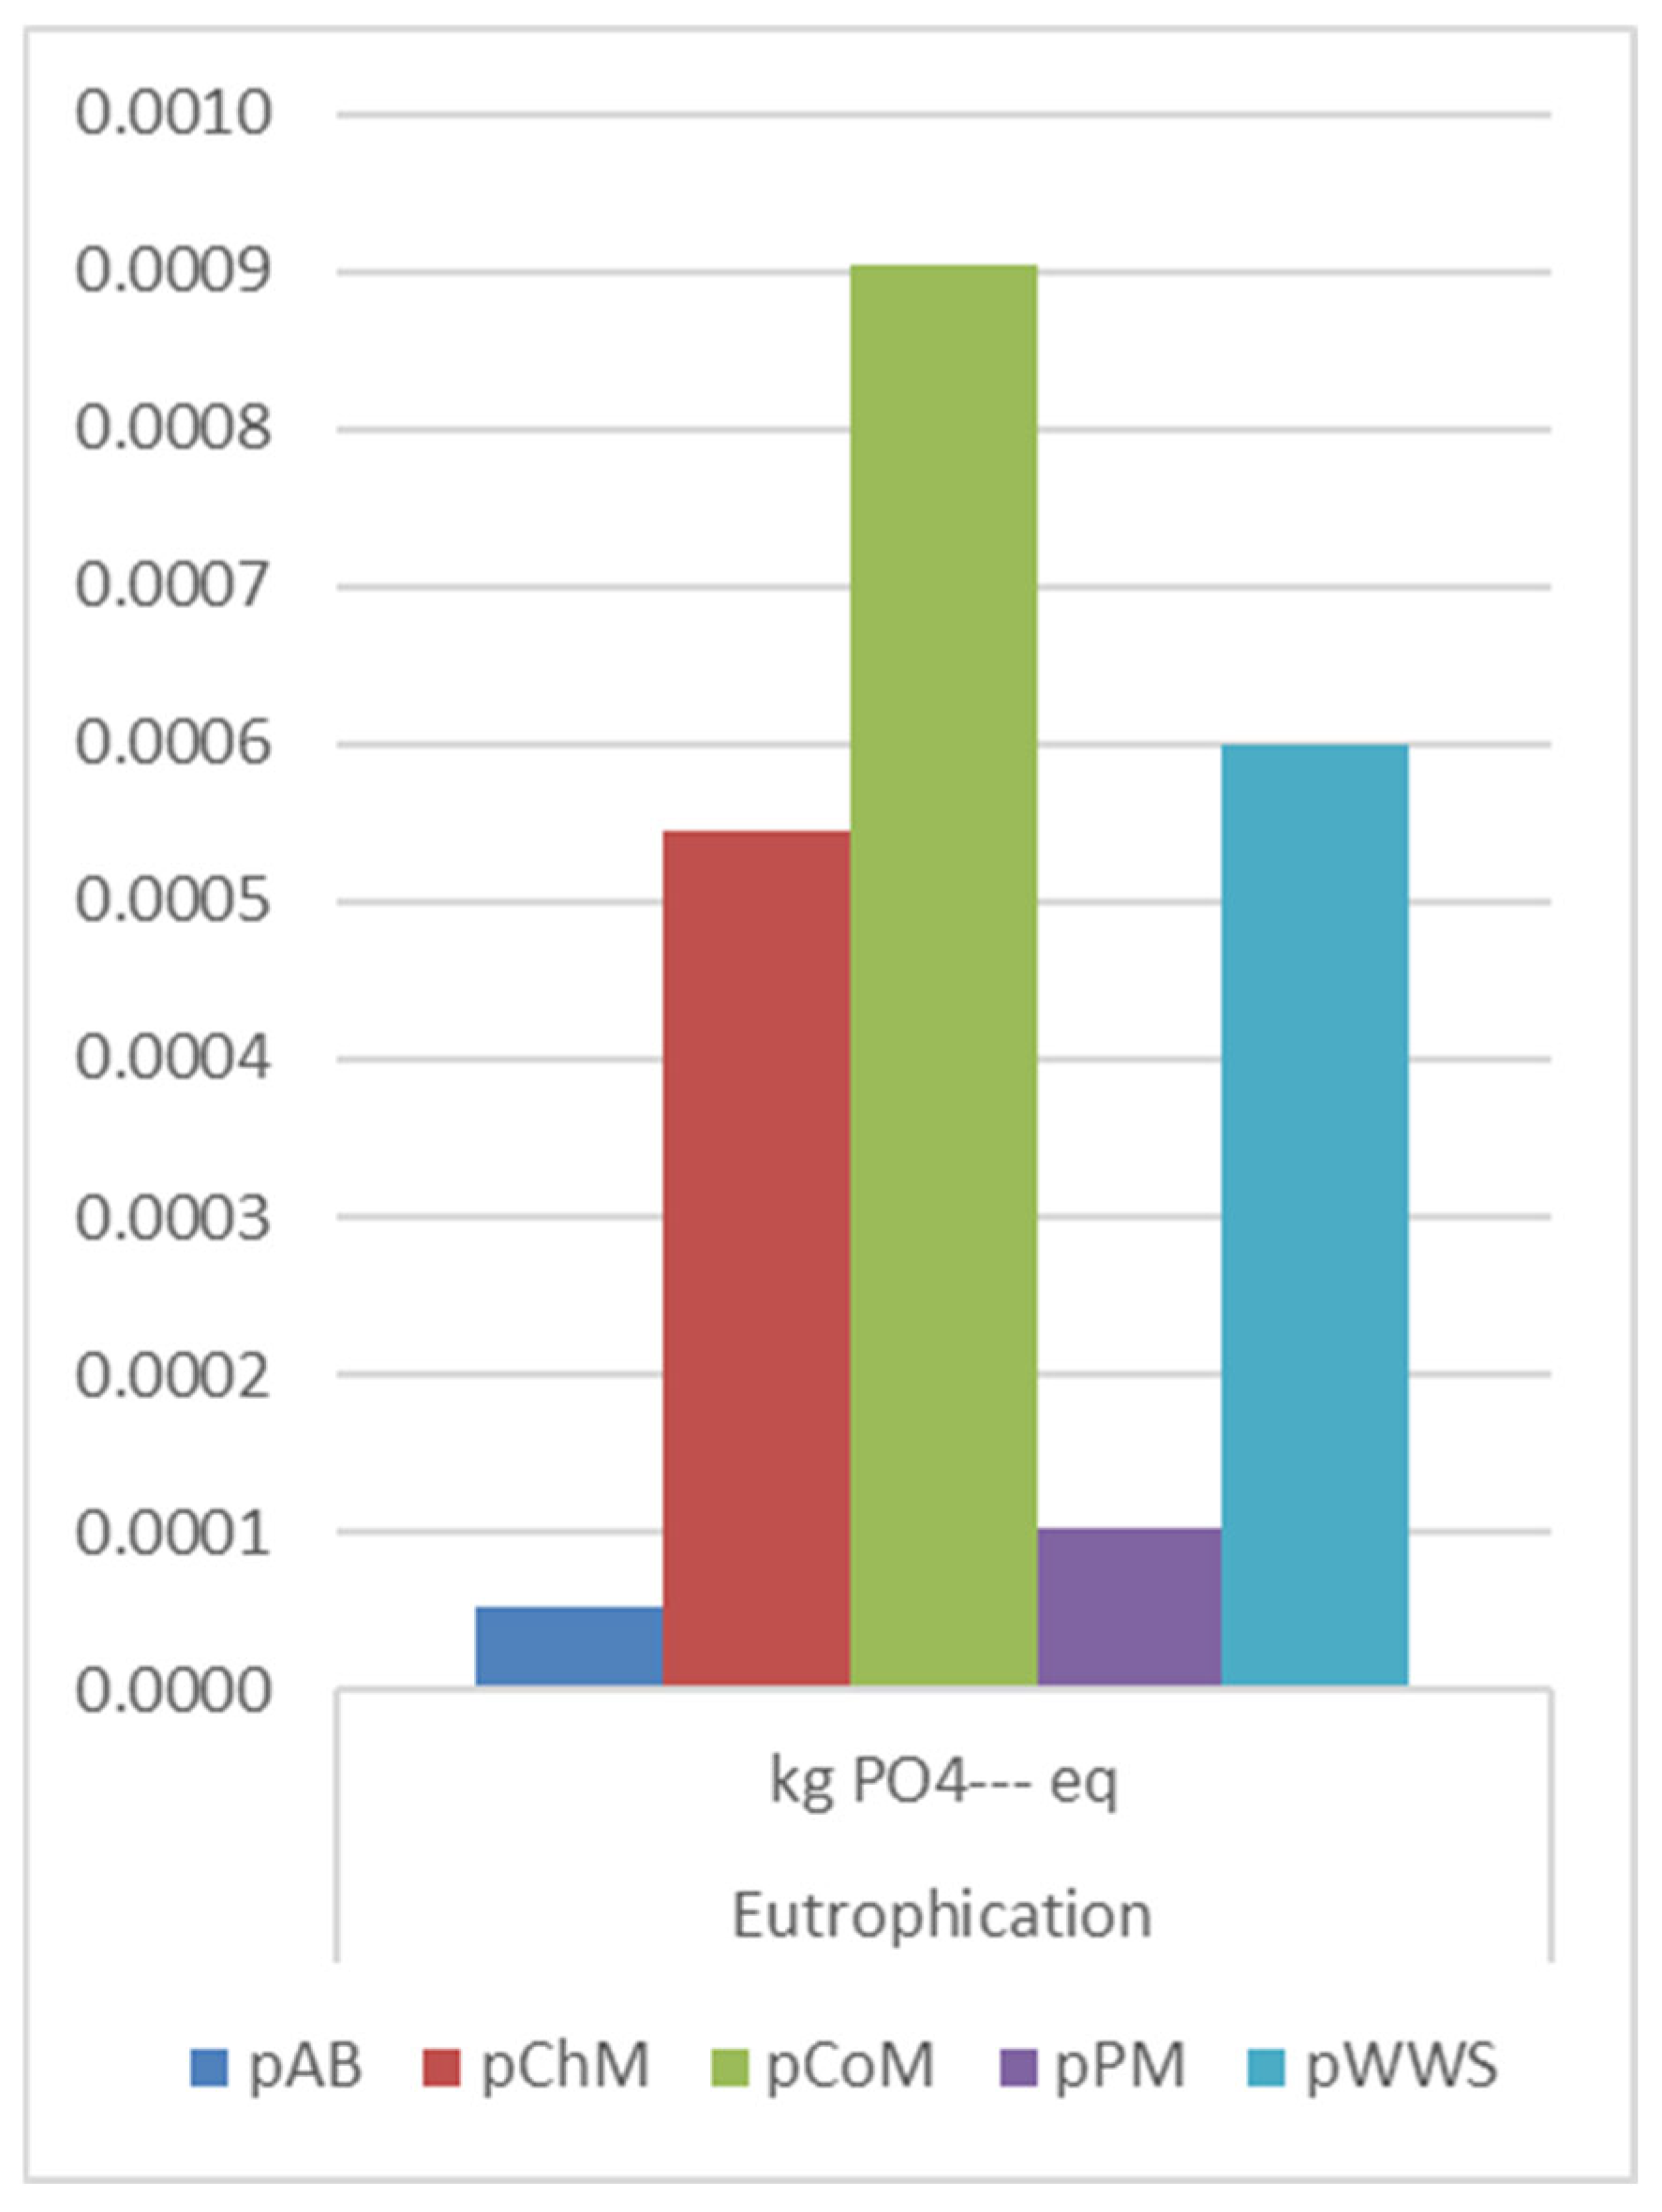
3.4. Comparison of Pretreatment Technologies in LCA Perspective
3.5. Advancing and Optimizing Pretreatment Processes
4. Conclusions
Author Contributions
Funding
Institutional Review Board Statement
Data Availability Statement
Acknowledgments
Conflicts of Interest
References
- Su, H.; Tan, F.; Xu, Y. Enhancement of Biogas and Methanization of Citrus Waste via Biodegradation Pretreatment and Subsequent Optimized Fermentation. Fuel 2016, 181, 843–851. [Google Scholar] [CrossRef]
- Rafique, R.; Poulsen, T.G.; Nizami, A.S.; Asam, Z.-u.-Z.; Murphy, J.D.; Kiely, G. Effect of Thermal, Chemical and Thermo-Chemical Pre-Treatments to Enhance Methane Production. Energy 2010, 35, 4556–4561. [Google Scholar] [CrossRef]
- Zhu, X.; Cao, Q.; Chen, Y.; Sun, X.; Liu, X.; Li, D. Effects of Mixing and Sodium Formate on Thermophilic In-Situ Biogas Upgrading by H2 Addition. J. Clean. Prod. 2019, 216, 373–381. [Google Scholar] [CrossRef]
- Esteves, E.M.M.; Herrera, A.M.N.; Esteves, V.P.P.; Morgado, C. do R.V. Life Cycle Assessment of Manure Biogas Production: A Review. J. Clean. Prod. 2019, 219, 411–423. [Google Scholar] [CrossRef]
- Cata Saady, N.M.; Rezaeitavabe, F.; Espinoza, J.E.R. Chemical Methods for Hydrolyzing Dairy Manure Fiber: A Concise Review. Energies 2021, 14, 6159. [Google Scholar] [CrossRef]
- Agbor, V.B.; Cicek, N.; Sparling, R.; Berlin, A.; Levin, D.B. Biomass Pretreatment: Fundamentals toward Application. Biotechnol. Adv. 2011, 29, 675–685. [Google Scholar] [CrossRef]
- Zheng, Y.; Wang, X.; Yang, F. Improving the Anaerobic Digestion of Switchgrass via Cofermentation of Rumen Microorganisms (Rumen Bacteria, Protozoa, and Fungi) and a Biogas Slurry. Energy Fuels 2019, 33, 1185–1195. [Google Scholar] [CrossRef]
- Weiland, P. Biogas Production: Current State and Perspectives. Appl. Microbiol. Biotechnol. 2010, 85, 849–860. [Google Scholar] [CrossRef]
- European Commission Directive (EU) 2023/2413 of the European Parliament and of the Council of 18 October 2023 Amending Directive (EU) 2018/2001, Regulation (EU) 2018/1999 and Directive 98/70/EC as Regards the Promotion of Energy from Renewable Sources. Off. J. Eur. Union 2023, 2413, 1–77.
- Ramos-Suárez, J.L.; Gómez, D.; Regueiro, L.; Baeza, A.; Hansen, F. Alkaline and Oxidative Pretreatments for the Anaerobic Digestion of Cow Manure and Maize Straw: Factors Influencing the Process and Preliminary Economic Viability of an Industrial Application. Bioresour. Technol. 2017, 241, 10–20. [Google Scholar] [CrossRef]
- Zhang, Y.; He, H.; Liu, Y.; Wang, Y.; Huo, F.; Fan, M.; Adidharma, H.; Li, X.; Zhang, S. Recent Progress in Theoretical and Computational Studies on the Utilization of Lignocellulosic Materials. Green Chem. 2019, 21, 9–35. [Google Scholar] [CrossRef]
- Anu; Kumar, A.; Rapoport, A.; Kunze, G.; Kumar, S.; Singh, D.; Singh, B. Multifarious Pretreatment Strategies for the Lignocellulosic Substrates for the Generation of Renewable and Sustainable Biofuels: A Review. Renew. Energy 2020, 160, 1228–1252. [Google Scholar] [CrossRef]
- Zheng, Y.; Zhao, J.; Xu, F.; Li, Y. Pretreatment of Lignocellulosic Biomass for Enhanced Biogas Production. Prog. Energy Combust. Sci. 2014, 42, 35–53. [Google Scholar] [CrossRef]
- Atelge, M.R.; Atabani, A.E.; Banu, J.R.; Krisa, D.; Kaya, M.; Eskicioglu, C.; Kumar, G.; Lee, C.; Yildiz, Y.; Unalan, S.; et al. A Critical Review of Pretreatment Technologies to Enhance Anaerobic Digestion and Energy Recovery. Fuel 2020, 270, 117494. [Google Scholar] [CrossRef]
- Yu, B.; Xu, J.; Yuan, H.; Lou, Z.; Lin, J.; Zhu, N. Enhancement of Anaerobic Digestion of Waste Activated Sludge by Electrochemical Pretreatment. Fuel 2014, 130, 279–285. [Google Scholar] [CrossRef]
- Miron, J.; Ben-Ghedalia, D.; Morrison, M. Invited Review: Adhesion Mechanisms of Rumen Cellulolytic Bacteria. J. Dairy Sci. 2001, 84, 1294–1309. [Google Scholar] [CrossRef]
- Yoo, C.G.; Meng, X.; Pu, Y.; Ragauskas, A.J. The Critical Role of Lignin in Lignocellulosic Biomass Conversion and Recent Pretreatment Strategies: A Comprehensive Review. Bioresour. Technol. 2020, 301, 122784. [Google Scholar] [CrossRef]
- Serna-Maza, A.; Heaven, S.; Banks, C.J. In Situ Biogas Stripping of Ammonia from a Digester Using a Gas Mixing System. Environ. Technol. 2017, 38, 3216–3224. [Google Scholar] [CrossRef]
- Rubežius, M.; Venslauskas, K.; Navickas, K.; Bleizgys, R. Influence of Aerobic Pretreatment of Poultry Manure on the Biogas Production Process. Processes 2020, 8, 1109. [Google Scholar] [CrossRef]
- Mirmohamadsadeghi, S.; Karimi, K.; Azarbaijani, R.; Parsa Yeganeh, L.; Angelidaki, I.; Nizami, A.S.; Bhat, R.; Dashora, K.; Vijay, V.K.; Aghbashlo, M.; et al. Pretreatment of Lignocelluloses for Enhanced Biogas Production: A Review on Influencing Mechanisms and the Importance of Microbial Diversity. Renew. Sustain. Energy Rev. 2021, 135, 110173. [Google Scholar] [CrossRef]
- Fuchs, W.; Wang, X.; Gabauer, W.; Ortner, M.; Li, Z. Tackling Ammonia Inhibition for Efficient Biogas Production from Chicken Manure: Status and Technical Trends in Europe and China. Renew. Sustain. Energy Rev. 2018, 97, 186–199. [Google Scholar] [CrossRef]
- Yin, D.M.; Qiao, W.; Negri, C.; Adani, F.; Fan, R.; Dong, R.J. Enhancing Hyper-Thermophilic Hydrolysis Pre-Treatment of Chicken Manure for Biogas Production by in-Situ Gas Phase Ammonia Stripping. Bioresour. Technol. 2019, 287, 121470. [Google Scholar] [CrossRef] [PubMed]
- Nges, I.A.; Wang, B.; Cui, Z.; Liu, J. Digestate Liquor Recycle in Minimal Nutrients-Supplemented Anaerobic Digestion of Wheat Straw. Biochem. Eng. J. 2015, 94, 106–114. [Google Scholar] [CrossRef]
- Gianico, A.; Gallipoli, A.; Gazzola, G.; Pastore, C.; Tonanzi, B.; Braguglia, C.M. A Novel Cascade Biorefinery Approach to Transform Food Waste into Valuable Chemicals and Biogas Through Thermal Pretreatment Integration. Bioresour. Technol. 2021, 338, 125517. [Google Scholar] [CrossRef]
- Naujokienė, V.; Bagdonienė, I.; Bleizgys, R.; Rubežius, M. A Biotreatment Effect on Dynamics of Cattle Manure Composition and Reduction of Ammonia Emissions from Agriculture. Agriculture 2021, 11, 303. [Google Scholar] [CrossRef]
- Jiang, Y.; McAdam, E.; Zhang, Y.; Heaven, S.; Banks, C.; Longhurst, P. Ammonia Inhibition and Toxicity in Anaerobic Digestion: A Critical Review. J. Water Process Eng. 2019, 32, 100899. [Google Scholar] [CrossRef]
- Angelidaki, I.; Ahring, B.K. Methods for Increasing the Biogas Potential from the Recalcitrant Organic Matter Contained in Manure. Water Sci. Technol. 2000, 41, 189–194. [Google Scholar] [CrossRef]
- Kim, K.H.; Hong, J. Supercritical CO2 Pretreatment of Lignocellulose Enhances Enzymatic Cellulose Hydrolysis. Bioresour. Technol. 2001, 77, 139–144. [Google Scholar] [CrossRef]
- Angelidaki, I.; Ahring, B.K. Methods for Increasing the Biogas Potential from the Recalcitrant Organic Matter Contained in Manure. In Proceedings of the 10th European Conference and Technology Exhibition on Biomass for Energy and Industry, Wurzburg, Germany, 8–11 June 1998; pp. 145–148. [Google Scholar]
- Costa, J.C.; Barbosa, S.G.; Alves, M.M.; Sousa, D.Z. Thermochemical Pre- and Biological Co-Treatments to Improve Hydrolysis and Methane Production from Poultry Litter. Bioresour. Technol. 2012, 111, 141–147. [Google Scholar] [CrossRef]
- Zdeb, M.; Bis, M.; Przywara, A. Multi-Criteria Analysis of the Influence of Lignocellulosic Biomass Pretreatment Techniques on Methane Production. Energies 2023, 16, 468. [Google Scholar] [CrossRef]
- Hasunuma, T.; Okazaki, F.; Okai, N.; Hara, K.Y.; Ishii, J.; Kondo, A. A Review of Enzymes and Microbes for Lignocellulosic Biorefinery and the Possibility of Their Application to Consolidated Bioprocessing Technology. Bioresour. Technol. 2013, 135, 513–522. [Google Scholar] [CrossRef] [PubMed]
- Poddar, B.J.; Nakhate, S.P.; Gupta, R.K.; Chavan, A.R.; Singh, A.K.; Khardenavis, A.A.; Purohit, H.J. A Comprehensive Review on the Pretreatment of Lignocellulosic Wastes for Improved Biogas Production by Anaerobic Digestion. Int. J. Environ. Sci. Technol. 2022, 19, 3429–3456. [Google Scholar] [CrossRef]
- Kral, I.; Piringer, G.; Saylor, M.K.; Lizasoain, J.; Gronauer, A.; Bauer, A. Life Cycle Assessment of Biogas Production from Unused Grassland Biomass Pretreated by Steam Explosion Using a System Expansion Method. Sustainability 2020, 12, 9945. [Google Scholar] [CrossRef]
- Xue, Y.; Li, Q.; Gu, Y.; Yu, H.; Zhang, Y.; Zhou, X. Improving Biodegradability and Biogas Production of Miscanthus Using a Combination of Hydrothermal and Alkaline Pretreatment. Ind. Crops Prod. 2020, 144, 111985. [Google Scholar] [CrossRef]
- Mosier, N.; Wyman, C.; Dale, B.; Elander, R.; Lee, Y.Y.; Holtzapple, M.; Ladisch, M. Features of Promising Technologies for Pretreatment of Lignocellulosic Biomass. Bioresour. Technol. 2005, 96, 673–686. [Google Scholar] [CrossRef]
- Olatunji, K.O.; Ahmed, N.A.; Ogunkunle, O. Optimization of Biogas Yield from Lignocellulosic Materials with Different Pretreatment Methods: A Review. Biotechnol. Biofuels 2021, 14, 359. [Google Scholar] [CrossRef]
- Venslauskas, K.; Navickas, K.; Rubežius, M.; Žalys, B.; Gegeckas, A. Processing of Agricultural Residues with a High Concentration of Structural Carbohydrates into Biogas Using Selective Biological Products. Sustainability 2024, 16, 1553. [Google Scholar] [CrossRef]
- Nagler, M.; Kozjek, K.; Etemadi, M.; Insam, H.; Podmirseg, S.M. Simple yet Effective: Microbial and Biotechnological Benefits of Rumen Liquid Addition to Lignocellulose-Degrading Biogas Plants. J. Biotechnol. 2019, 300, 1–10. [Google Scholar] [CrossRef]
- Palmqvist, E.; Hahn-Hägerdal, B. Fermentation of Lignocellulosic Hydrolysates. II: Inhibitors and Mechanisms of Inhibition. Bioresour. Technol. 2000, 74, 25–33. [Google Scholar] [CrossRef]
- Zhang, X.; Zhu, J.; Sun, L.; Yuan, Q.; Cheng, G.; Argyropoulos, D.S. Extraction and Characterization of Lignin from Corncob Residue After Acid-Catalyzed Steam Explosion Pretreatment. Ind. Crops Prod. 2019, 133, 241–249. [Google Scholar] [CrossRef]
- Žalys, B.; Venslauskas, K.; Navickas, K.; Buivydas, E.; Rubežius, M. The Influence of CO2 Injection into Manure as a Pretreatment Method for Increased Biogas Production. Sustainability 2023, 15, 3670. [Google Scholar] [CrossRef]
- Žalys, B.; Venslauskas, K.; Navickas, K.; Buivydas, E.; Rubežius, M. The Influence of Dairy Rumen Anaerobic Bacteria Inoculum on Biogas Production. Eng. Proc. 2023, 37, 83. [Google Scholar] [CrossRef]
- Abbas, Y.; Jamil, F.; Rafiq, S.; Ghauri, M.; Khurram, M.S.; Aslam, M.; Bokhari, A.; Faisal, A.; Rashid, U.; Yun, S.; et al. Valorization of Solid Waste Biomass by Inoculation for the Enhanced Yield of Biogas. Clean Technol. Environ. Policy 2020, 22, 513–522. [Google Scholar] [CrossRef]
- Weimer, P.J. Degradation of Cellulose and Hemicellulose by Ruminal Microorganisms. Microorganisms 2022, 10, 2345. [Google Scholar] [CrossRef]
- Budiyono, B.; Widiasa, I.N.; Johari, S.; Sunarso, S. Increasing Biogas Production Rate from Cattle Manure Using Rumen Fluid as Inoculums. Int. J. Sci. Eng. 2014, 6, 31–38. [Google Scholar] [CrossRef]
- Park, H.S.; Jung, Y.M.; You, J.K.; Hong, W.H.; Kim, J.N. Analysis of the CO2 and NH3 Reaction in an Aqueous Solution by 2D IR COS: Formation of Bicarbonate and Carbamate. J. Phys. Chem. A 2008, 112, 6558–6562. [Google Scholar] [CrossRef]
- Andriani, D.; Wresta, A.; Atmaja, T.D.; Saepudin, A. A Review on Optimization Production and Upgrading Biogas Through CO2 Removal Using Various Techniques. Appl. Biochem. Biotechnol. 2014, 172, 1909–1928. [Google Scholar] [CrossRef]
- Muntau, M.; Lebuhn, M.; Polag, D.; Bajón-Fernández, Y.; Koch, K. Effects of CO2 Enrichment on the Anaerobic Digestion of Sewage Sludge in Continuously Operated Fermenters. Bioresour. Technol. 2021, 332, 125147. [Google Scholar] [CrossRef]
- Islam, S.M.M.; Li, Q.; Al Loman, A.; Ju, L.K. CO2-H2O Based Pretreatment and Enzyme Hydrolysis of Soybean Hulls. Enzym. Microb. Technol. 2017, 106, 18–27. [Google Scholar] [CrossRef]
- Wernet, G.; Bauer, C.; Steubing, B.; Reinhard, J.; Moreno-Ruiz, E.; Weidema, B. The Ecoinvent Database Version 3 (Part I): Overview and Methodology. Int. J. Life Cycle Assess. 2016, 21, 1218–1230. [Google Scholar] [CrossRef]
- Guinée, J.B.; Heijungs, R.; Huppes, G.; Kleijn, R.; de Koning, A.; van Oers, L.; Wegener Sleeswijk, A.; Suh, S.; Udo de Haes, H.A.; de Bruijn, H.; et al. I: LCA in Perspective. IIa: Guide. IIb: Operational Annex. III: Scientific Background. In Handbook on Life Cycle Assessment. Operational Guide to the ISO Standards; Kluwer Academic Publishers: Dordrecht, The Netherlands, 2002. [Google Scholar]
- Buivydas, E.; Navickas, K.; Venslauskas, K. A Life Cycle Assessment of Methane Slip in Biogas Upgrading Based on Permeable Membrane Technology with Variable Methane Concentration in Raw Biogas. Sustainability 2024, 16, 3323. [Google Scholar] [CrossRef]
- Filippa, F.; Panara, F.; Leonardi, D.; Arcioni, L.; Calderini, O. Life Cycle Assessment Analysis of Alfalfa and Corn for Biogas Production in a Farm Case Study. Processes 2020, 8, 1285. [Google Scholar] [CrossRef]
- Jiménez-González, C.; Kim, S.; Overcash, M.R. Methodology for Developing Gate-to-Gate Life Cycle Inventory Information. Int. J. Life Cycle Assess. 2000, 5, 153–159. [Google Scholar] [CrossRef]
- Wiloso, E.I.; Heijungs, R.; Huppes, G.; Fang, K. Effect of Biogenic Carbon Inventory on the Life Cycle Assessment of Bioenergy: Challenges to the Neutrality Assumption. J. Clean. Prod. 2016, 125, 78–85. [Google Scholar] [CrossRef]
- Sawatdeenarunat, C.; Surendra, K.C.; Takara, D.; Oechsner, H.; Khanal, S.K. Anaerobic Digestion of Lignocellulosic Biomass: Challenges and Opportunities; Elsevier Ltd.: Amsterdam, The Netherlands, 2015; Volume 178, ISBN 1808956354. [Google Scholar]
- Whiting, A.; Azapagic, A. Life Cycle Environmental Impacts of Generating Electricity and Heat from Biogas Produced by Anaerobic Digestion. Energy 2014, 70, 181–193. [Google Scholar] [CrossRef]
- Holm-Nielsen, J.B.; Al Seadi, T.; Oleskowicz-Popiel, P. The Future of Anaerobic Digestion and Biogas Utilization. Bioresour. Technol. 2009, 100, 5478–5484. [Google Scholar] [CrossRef]
- Rehan, M.; Nizami, A.-S.; Rashid, U.; Naqvi, M.R. Waste Biorefineries: Future Energy, Green Products and Waste Treatment; Frontiers Research Topics; Frontiers Media SA: Lausanne, Switzerland, 2019; ISBN 9782889459933. [Google Scholar]

| Indicator | CO2 Pretreatment Method | Rumen Fluid Pretreatment | Biological Pretreatment | |||||||
|---|---|---|---|---|---|---|---|---|---|---|
| rPM | pPM | rCoM | pCoM | rChM | pChM | rAB | pAB | rWWS | pWWS | |
| Biogas yield from feedstock (BM), L/kg | 21.66 ± 1.06 | 26.52 ± 1.22 | 8.32 ± 0.20 | 10.34 ± 0.23 | 123.09 ± 2.35 | 137.56 ± 2.94 | 576 ± 4.8 | 645 ± 6 | 364.1 ± 5.6 | 439.9 ±9.0 |
| Biogas yield from feedstock total solids (BTS), L/kg | 288.76 ± 14.34 | 353.60 ± 16.30 | 112.06 ± 3.05 | 139.34 ± 3.05 | 531.52 ± 10.15 | 593.99 ± 12.68 | 370 ± 3.3 | 415 ± 4.2 | - | - |
| Biogas yield from feedstock volatile solids (BVS), L/kg | 406.33 ± 20.17 | 497.56 ± 22.94 | 142.87 ± 3.36 | 177.65 ± 3.89 | 758.31 ± 14.48 | 847.44 ± 18.08 | 340 ± 3.2 | 381 ± 3.9 | 490.0 ± 15.7 | 582.0 ± 24.1 |
| Methane concentration in biogas (CM), % | 66.69 ± 0.66 | 66.35 ± 0.34 | 54.70 ± 0.06 | 58.40 ± 1.51 | 54.73 ± 0.70 | 63.0 ± 0.45 | 63.2 ± 1.5 | 63.9 ± 1.9 | 52.9 ± 1.8 | 55.8 ± 1.1 |
| Influence of the pretreatment on biomethane yield, % | +21.78 | +33.78 | +28.76 | +12.97 | +25.13 | |||||
| Inputs | rPM | pPM | rCoM | pCoM | rChM | pChM | rAB | pAB | rWWS | pWWS |
| Daily feedstock input, t | 300 | 300 | 300 | 300 | 25 | 25 | 25 | 25 | 140 | 140 |
| Digestate, inoculant or BP for dilution, t | 0 | 0 | 0 | 0 | 75 | 75 | 75 | 75 | 0 | 1400 |
| Feedstock input t/h | 12.50 | 12.50 | 12.50 | 12.50 | 1.04 | 1.04 | 1.04 | 1.04 | 5.83 | 5.83 |
| Volume necessary for pretreatment, m3 | 0 | 900 | 0 | 900 | 0 | 300 | 0 | 300 | 0 | 1540 |
| Biomethane yield, m3/h | 180.56 | 219.95 | 56.89 | 75.48 | 70.17 | 90.27 | 379.20 | 429.33 | 1123.55 | 1431.87 |
| Biomethane produced trough lifetime, thous. m3 | 31,634.7 | 38,535.3 | 9966.8 | 13,224.4 | 12,294.5 | 15,816.0 | 66,435.8 | 75,218.3 | 196,846 | 250,864 |
| Electricity used for pretreatment, kWh | 0 | 28.5 | 0 | 28.5 | 0 | 28.5 | 0 | 17.5 | 0 | 18 |
| Heat used for substrate (preheat from 2 °C to 25 °C), kWh | 0 | 287.59 | 0 | 287.59 | 0.00 | 95.86 | 0 | 95.86 | 0 | 210.9 |
| Heat loss trough pretreatment reactor walls, kWh | 0 | 29.91 | 0 | 29.91 | 0 | 13.75 | 0 | 13.75 | 0 | 40.5 |
| Total heat demand for pretreatment, kWh | 0 | 317.5 | 0.0 | 317.5 | 0.0 | 109.6 | 0 | 109.6 | 0 | 251.4 |
| Outputs | ||||||||||
| Electricity used for pretreatment kWh/m3 | 0.000 | 0.13 | 0.000 | 0.378 | 0.000 | 0.316 | 0.000 | 0.41 | 0.000 | 0.13 |
| Electricity used for biomethane production (membrane technology) kWh/m3 | 0.435 | 0.438 | 0.549 | 0.51 | 0.549 | 0.47 | 0.469 | 0.462 | 0.564 | 0.54 |
| Effect on electricity used for biomethane production because of pretreatment technology, kWh/m3 | 0.003 | −0.039 | −0.079 | −0.007 | −0.024 | |||||
| Total electricity used for pretreatment, kWh/m3 | 0.133 | 0.339 | 0.237 | 0.034 | −0.011 | |||||
| Heat demand for pretreatment kWh/m3 | 1.44 | 4.206 | 1.214 | 0.255 | 0.176 |
| 1 m3 of Biomethane | Unit | rCoM | pCoM | Difference Between rCoM and pCoM |
|---|---|---|---|---|
| Impact Category | ||||
| ADP | kg Sb eq | −3.04 × 10⁻⁶ | −3.11 × 10⁻⁶ | −7.49 × 10⁻⁸ |
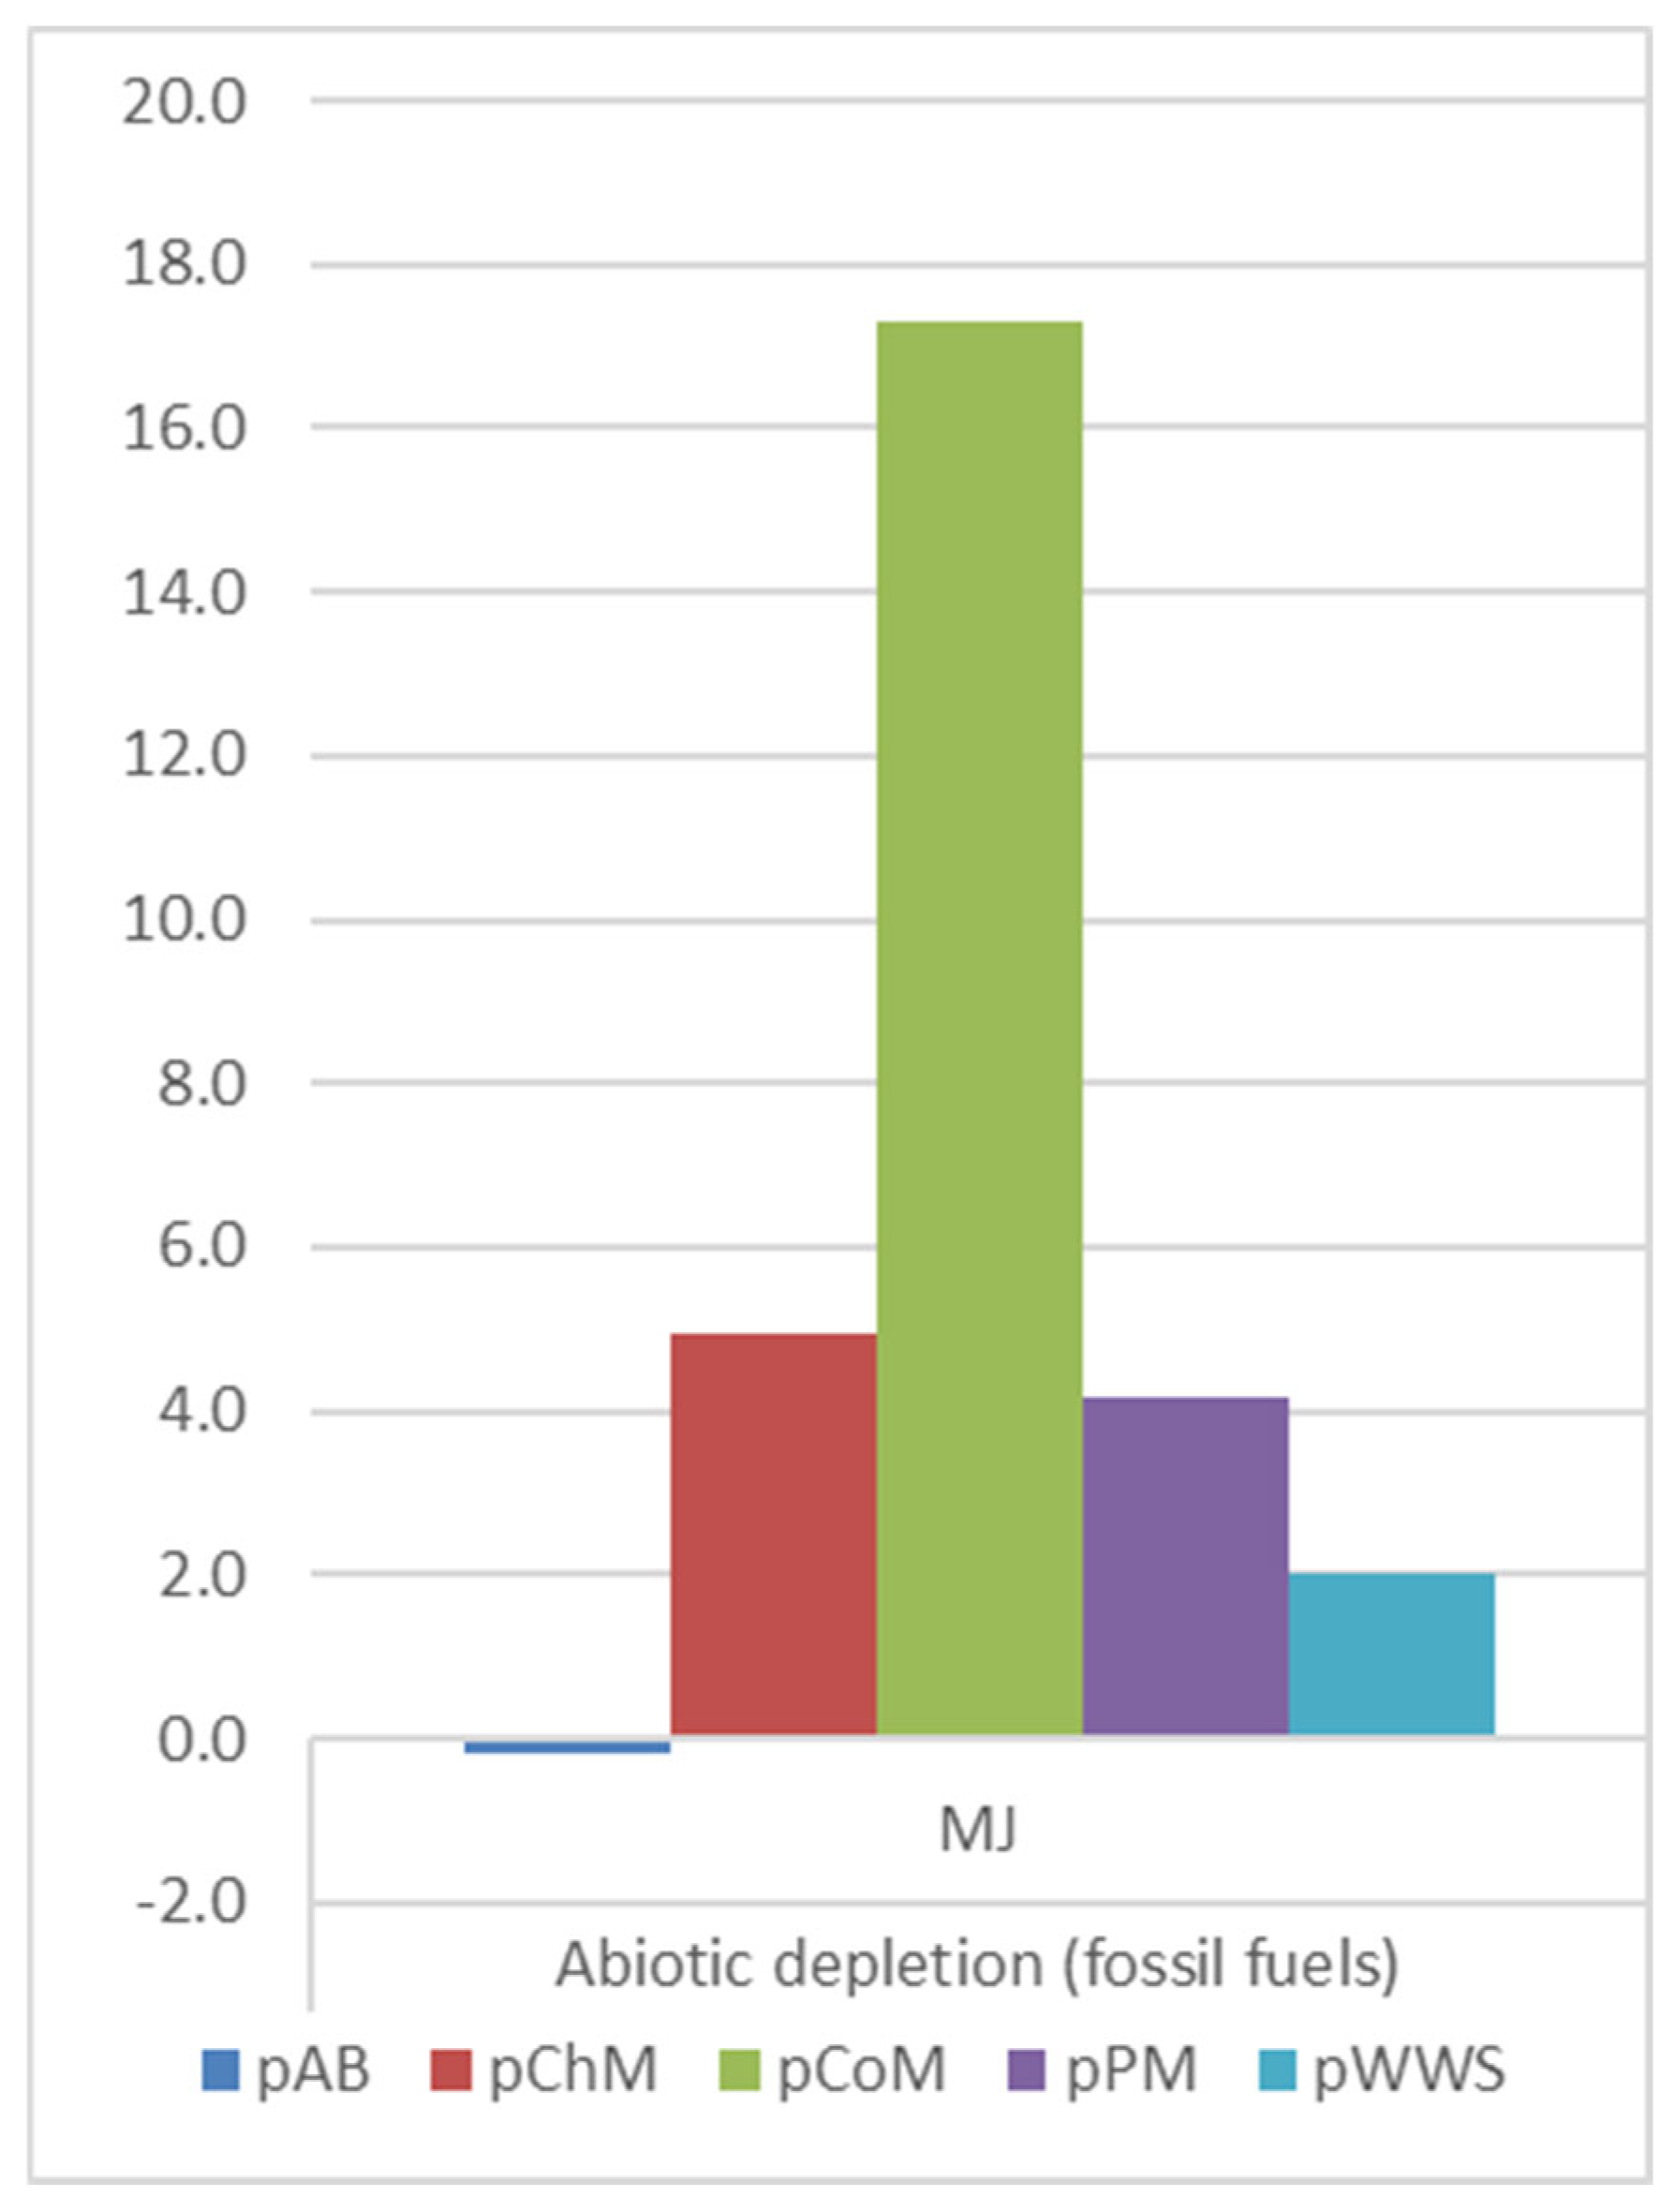
| ADP(f) | MJ | 0.37 | 17.31 | 16.9 |
| GWP | kg CO2 eq | 0.22 | 1.30 | 1.08 |
| ODP | kg CFC-11 eq | −4.78 × 10⁻⁷ | −4.16 × 10⁻⁷ | 6.19 × 10⁻⁸ |
| HTP | kg 1,4-DB eq | 0.092 | 0.16 | 6.63 × 10⁻² |
| FWAEP | kg 1,4-DB eq | 0.19 | 0.33 | 1.47 × 10⁻¹ |
| MAEP | kg 1,4-DB eq | 343.8 | 608.3 | 264.0 |
| TEP | kg 1,4-DB eq | −1.77 × 10⁻³ | −1.01 × 10⁻³ | 7.61 × 10⁻⁴ |
| POP | kg C2H4 eq | 2.07 × 10⁻⁴ | 2.89 × 10⁻⁴ | 8.16 × 10⁻⁵ |
| AP | kg SO2 eq | 7.36 × 10⁻⁴ | 1.79 × 10⁻³ | 1.05 × 10⁻³ |
| EP | kg PO4 eq | 3.98 × 10⁻⁴ | 9.05 × 10⁻⁴ | 5.07 × 10⁻⁴ |
| 1 m3 of Biomethane | Unit | rPM | pPM | Difference Between rPM and pPM |
|---|---|---|---|---|
| Impact Category | ||||
| ADP | kg Sb eq | −8.7 × 10⁻⁶ | −8.09 × 10⁻⁶ | 5.8 × 10⁻⁷ |
| ADP(f) | MJ | −1.91 | 4.17 | 6.1 |
| GWP | kg CO2 eq | 0.055 | 0.45 | 3.9 × 10⁻¹ |
| ODP | kg CFC-11 eq | −7.2 × 10⁻⁷ | −6.71 × 10⁻⁷ | 5.3 × 10⁻⁸ |
| HTP | kg 1,4-DB eq | −0.15 | −0.1 | 4.6 × 10⁻² |
| FWAEP | kg 1,4-DB eq | −0.014 | 0.058 | 7.2 × 10⁻² |
| MAEP | kg 1,4-DB eq | 43.1 | 168.2 | 1.3 × 10² |
| TEP | kg 1,4-DB eq | −4.2 × 10⁻³ | −3.63 × 10⁻³ | 5.7 × 10⁻⁴ |
| POP | kg C2H4 eq | 1.99 × 10⁻⁴ | 2.27 × 10⁻⁴ | 2.8 × 10⁻⁵ |
| AP | kg SO2 eq | −9 × 10⁻⁵ | 3.71 × 10⁻⁴ | 4.6 × 10⁻⁴ |
| EP | kg PO4 eq | −1.4 × 10⁻⁴ | 1.02 × 10⁻⁴ | 2.4 × 10⁻⁴ |
| 1 m3 of Biomethane | Unit | rChM | pChM | Difference Between rChM and pChM |
|---|---|---|---|---|
| Impact Category | ||||
| ADP | kg Sb eq | −3.45 × 10⁻⁶ | −5.32 × 10⁻⁶ | −1.87 × 10⁻⁶ |
| ADP(f) | MJ | 0.3 | 4.93 | 4.63 |
| GWP | kg CO2 eq | 0.21 | 0.52 | 3.16 × 10⁻¹ |
| ODP | kg CFC-11 eq | −4.79 × 10⁻⁷ | −5.99 × 10⁻⁷ | −1.2 × 10⁻⁷ |
| HTP | kg 1,4-DB eq | 0.065 | 0.046 | −1.92 × 10⁻² |
| FWAEP | kg 1,4-DB eq | 0.17 | 0.22 | 5.26 × 10⁻² |
| MAEP | kg 1,4-DB eq | 325 | 429 | 104 |
| TEP | kg 1,4-DB eq | −1.8 × 10⁻³ | −2.23 × 10⁻³ | −4.33 × 10⁻⁴ |
| POP | kg C2H4 eq | 2.05 × 10⁻⁴ | 2.44 × 10⁻⁴ | 3.98 × 10⁻⁵ |
| AP | kg SO2 eq | 7.07 × 10⁻⁴ | 9.57 × 10⁻⁴ | 2.5 × 10⁻⁴ |
| EP | kg PO4 eq | 3.84 × 10⁻⁴ | 5.44 × 10⁻⁴ | 1.6 × 10⁻⁴ |
| 1 m3 of Biomethane | Units | rAB | pAB | Difference Between rAB and pAB |
|---|---|---|---|---|
| Impact Category | ||||
| ADP | kg Sb eq | −7.42 × 10⁻⁶ | −7.78 × 10⁻⁶ | −3.58 × 10⁻⁷ |
| ADP(f) | MJ | −1.21 | −0.17 | 1.04 |
| GWP | kg CO2 eq | 0.099 | 0,17 | 6.94 × 10⁻² |
| ODP | kg CFC-11 eq | −6.28 × 10⁻⁷ | −6.52 × 10⁻⁷ | −2.54 × 10⁻⁸ |
| HTP | kg 1,4-DB eq | −0.117 | −0.122 | −4.29 × 10⁻³ |
| FWAEP | kg 1,4-DB eq | 0.024 | 0.029 | 5.03 × 10⁻³ |
| MAEP | kg 1,4-DB eq | 110.7 | 122.8 | 12.1 |
| TEP | kg 1,4-DB eq | −3.34 × 10⁻³ | −3.48 × 10⁻³ | −1.38 × 10⁻⁴ |
| POP | kg C2H4 eq | 1.96 × 10⁻⁴ | 2.05 × 10⁻⁴ | 8.83 × 10⁻⁶ |
| AP | kg SO2 eq | 1.57 × 10⁻⁴ | 2.49 × 10⁻⁴ | 9.17 × 10⁻⁵ |
| EP | kg PO4 eq | 2.67 × 10⁻⁵ | 5.3 × 10⁻⁵ | 2.62 × 10⁻⁵ |
| 1 m3 of Biomethane | Units | rWWS | pWWS | Difference Between rWWS and pWWS |
|---|---|---|---|---|
| Impact Category | ||||
| ADP | kg Sb eq | −7.4 × 10⁻⁷ | −4.61 × 10⁻⁶ | −3.88 × 10⁻⁶ |
| ADP(f) | MJ | 2 | 2.01 | 1.05 × 10⁻² |
| GWP | kg CO2 eq | 0.34 | 0.38 | 4.08 × 10⁻² |
| ODP | kg CFC-11 eq | −2.1 × 10⁻⁷ | −4.81 × 10⁻⁷ | −2.7 × 10⁻⁷ |
| HTP | kg 1,4-DB eq | 0.1 | 0.0058 | −9.87 × 10⁻² |
| FWAEP | kg 1,4-DB eq | 0.23 | 0.15 | −7.36 × 10⁻² |
| MAEP | kg 1,4-DB eq | 448.2 | 349.7 | −98.5 |
| TEP | kg 1,4-DB eq | 3.4 × 10⁻⁴ | 2.9 × 10⁻³ | 2.56 × 10⁻³ |
| POP | kg C2H4 eq | 2.32 × 10⁻⁴ | 2.47 × 10⁻⁴ | 1.47 × 10⁻⁵ |
| AP | kg SO2 eq | 1.44 × 10⁻³ | 1.3 × 10⁻³ | −1.44 × 10⁻⁴ |
| EP | kg PO4 eq | 7.76 × 10⁻⁴ | 6 × 10⁻⁴ | −1.76 × 10⁻⁴ |
Disclaimer/Publisher’s Note: The statements, opinions and data contained in all publications are solely those of the individual author(s) and contributor(s) and not of MDPI and/or the editor(s). MDPI and/or the editor(s) disclaim responsibility for any injury to people or property resulting from any ideas, methods, instructions or products referred to in the content. |
© 2025 by the authors. Licensee MDPI, Basel, Switzerland. This article is an open access article distributed under the terms and conditions of the Creative Commons Attribution (CC BY) license (https://creativecommons.org/licenses/by/4.0/).
Share and Cite
Žalys, B.; Navickas, K.; Venslauskas, K. Life Cycle Assessment of CO2, Rumen, and Biological Biomass Pretreatment Methods for Biomethane Production. Agriculture 2025, 15, 1169. https://doi.org/10.3390/agriculture15111169
Žalys B, Navickas K, Venslauskas K. Life Cycle Assessment of CO2, Rumen, and Biological Biomass Pretreatment Methods for Biomethane Production. Agriculture. 2025; 15(11):1169. https://doi.org/10.3390/agriculture15111169
Chicago/Turabian StyleŽalys, Bronius, Kęstutis Navickas, and Kęstutis Venslauskas. 2025. "Life Cycle Assessment of CO2, Rumen, and Biological Biomass Pretreatment Methods for Biomethane Production" Agriculture 15, no. 11: 1169. https://doi.org/10.3390/agriculture15111169
APA StyleŽalys, B., Navickas, K., & Venslauskas, K. (2025). Life Cycle Assessment of CO2, Rumen, and Biological Biomass Pretreatment Methods for Biomethane Production. Agriculture, 15(11), 1169. https://doi.org/10.3390/agriculture15111169