1. Introduction
Apiculture is an important part of modern agriculture. Apiculture features include low investment, faster benefits, no occupation of cultivated land, and no environmental pollution. Large-scale bee pollination can also greatly improve the yield and quality of crops, promoting the healthy, green, and high-quality development of agriculture [
1]. According to the statistics of the United States Department of Agriculture, the value of honey bee pollination in US is 140 times higher than the value of bee products [
2]. Increasing consumer demand for natural health food has put pressure on the honey industry. There is huge demand in the current global honey market. In 2020, the total global honey production was 1.77 million tons. Asia, Europe, and North America are still the main natural honey production areas in the world. In 2020, the honey production of these three continents accounted for 47.6%, 22.0%, and 19.6% of the total global honey production in that year, respectively [
3]. In terms of the number of bee colonies, by the end of 2018, there were 92.26 million bee colonies globally, of which Asia had the largest number of bee colonies, approximately 43.05 million, followed by Europe and North America, with 18.96 and 11.68 million colonies, respectively [
4]. Since the beginning of the 21st century, the pattern of beekeeping has changed globally. With the development of science and technology and influence of various factors, the number of bee colonies in most developed countries has shown a downward trend, causing Europe to drop from the first continent to the third continent in terms of the number of bee colonies [
5].
Apiculture is an ancient industry in China. The earliest records about honey in China appeared in the 16th–11th century BC. A record of the word “honey” was found in the oracle bone inscriptions of the Yin and Shang Dynasties, indicating that the Chinese apiculture has a history of more than 3000 years. China is the birthplace of the Chinese honeybee (
Apis cerana cerana Fabricius). Historically, Chinese apiculture has gone through two stages, starting with the original collection of honey, traditional artificial breeding of bees, and traditional breeding characteristics of Chinese honeybees. In 1840, with the introduction of Western culture and new technology, beekeeping technology for Western honeybees and movable honeycombs were introduced in China, and Chinese apiculture began to enter a stage of rapid development. However, before 1949, due to successive years of war and disasters, China’s apiculture experienced several twists and turns [
6]. After 1949, especially after the reform and opening up, apiculture in China entered a stage of rapid development. During the 1980s, the annual growth rate of honey production reached 11.69%. However, in the decade after 2010, the development of apiculture in China has been slow. Why is China’s apiculture entering a slow development stage? What are the characteristics of slow developmental stages? What are the primary influencing factors? To date, these problems have not been investigated thoroughly or systematically.
Apiculture is a special industry that raises honeybees in a certain colony and selects nectar source plants during a suitable flowering period for concentrated honey collection. China has vast land and abundant resources, comprising a large number of plants that are widely distributed, with a long flowering period and large amount of nectar production suitable for consumption by bees. Some of the plant varieties include rape, acacia, linden tree, sunflower, mountain flower, and milk vetch. Restricted by the climatic conditions in different regions and the flowering period of nectar source plants, various beekeeping models have been formed for a long time, such as beekeeping in permanent apiary (PAB), small-scale migratory beekeeping (SMB), and large-scale migratory beekeeping (LMB). In PAB, beehives are placed in a fixed location, and the bees obtain honey and pollen from flowering plants in the surrounding area. In SMB, although beehives are placed in a fixed location, the beehives are shifted to nearby places according to the climate and nectar source. In contrast in LMB, the beehives are not placed in a fixed location; instead, they are moved to places where flowers bloom, and the bees are released to collect nectar for reproduction and production per the climatic condition and nectar source availability. Thus, in LMB, the transshipment range is large, transportation distance is long, and several migrations are often required per year. PAB requires that local nectar source plants have a flowering period of more than four months per year, and the minimum temperature in winter is higher than zero, to ensure that the beehives can survive the winter. Migratory beekeeping can effectively use plant nectar sources in different regions and seasons across the country. Similar to the current agricultural production and operation in China that are still based on the family operations of small farmers, apiculture is also based on the family beekeeping of small farmers, and most beekeepers are PAB and SMB, with a breeding population of less than 100 groups [
1].
The beekeepers’ different beekeeping models, number of transfer sites, selection of nectar source plants, and changes in the routing and flow of transfer sites are all important factors affecting the yield, quality, and benefits of honey. What changes have occurred in beekeepers’ decisions and transfer flows in the last decade? How do these changes affect apiculture development? How do factors such as climate change and socioeconomic development affect beekeeper decisions? How can we systematically study and establish efficient and sustainable apiculture promotion policies? These issues require in-depth research to provide a basis as well as scientific and technological support to promote the high-quality development of future apiculture.
Farmer behavior research is one of the hotspots in current agricultural economic management research. Scholars have focused on farmers’ production, consumption, new technology adoption, risk aversion and avoidance, and other influencing factors [
7,
8,
9]. Theories used in the study of farmers’ behavior include planned behavior theory, risk preference and aversion theory, innovation diffusion theory, the technology acceptance model, mental account theory, and grounded theory. Some scholars have also tried to combine different theories, such as planned behavior theory with innovation diffusion theory, to build a more comprehensive research framework [
7,
10,
11].
Few studies have been conducted on beekeepers’ production behavior. Wang et al. [
12] conducted research on the quality and safety of beekeepers using a questionnaire. Xi et al. [
13] conducted research on the production methods, breeding scale, production input, technology adoption, production willingness, and other behaviors of beekeepers based on survey data of fixed beekeeper observation points in the national apiculture technology system for 2011 and 2012. However, long-term systematic research on the migratory behavior of beekeepers is still lacking.
Migratory beekeeping is problematic in flow spaces. At present, the study of flow space is a new research perspective and method for studying temporal and spatial changes in cities, villages, transportation, tourism, etc. [
14,
15]. To date, there have been no reports on beekeepers’ decisions made from the perspective of flow space.
Therefore, this study aimed to systematically analyze the changing trend of beekeepers’ beekeeping decisions made and related influencing factors from 2009 to 2020, based on the long-term scale survey data of beekeeper households in the national apiculture technology system, to promote the transformation of China’s apiculture. The outcomes of this study will aid in upgrading and transitioning to a new stage of rapid development as soon as possible.
2. Materials and Methods
The basic data used in this research came from the continuous follow-up survey data of fixed survey beekeeper households using the national apiculture technology system. Since 2009, the Apiculture Economic Research Group of the National Apiculture Technology System has selected fixed beekeeper households to survey in more than 10 provinces across the country and has continuously tracked beekeepers’ beekeeping production information every year. The surveyed provinces were Zhejiang, Shandong, Jiangxi, Henan, Yunnan, Sichuan, Guangdong, Hubei, Beijing, Jilin, Shanxi, Gansu, and Hainan. The list of beekeepers in some provinces changed considerably between the early and late surveys because of inconsistencies in the survey process in various provinces and changes in beekeepers. Since this study focused on the long-term changes in beekeepers’ behavior, we screened the survey data of fixed survey beekeeper households for 12 consecutive years from 2009 to 2020 as much as possible to select beekeepers with longer continuous survey times and more detailed survey information. Relatively complete beekeeper households were used as research objects.
2.1. Data Screening and Collation
2.1.1. Selection of Research Households
Based on continuous tracking survey data of fixed beekeeper survey households in the national apiculture technology system from 2009 to 2020, this study adopted two beekeeper household screenings. The first screening focused on selecting beekeepers with at least eight years of research data as research samples. A total of 300 beekeepers, mainly distributed in Zhejiang, Hubei, Sichuan, Henan, Jilin, Shanxi, and Gansu, were selected to study the migratory behavior and influencing factors of beekeepers. The second screening focused on beekeeper households with longitude and latitude information on the sites where they migrate for beekeeping every year. After screening, the number of retained households varied in different years, and approximately 118–147 households were used for the study of spatial dynamic changes in beekeeper migration.
2.1.2. Collation of Research Household Information
The collation information for each beekeeper includes (1) the attributes of the beekeeper’s household, including age of beekeeper, educated years, and household population; (2) the beekeeping production information of the beekeeper, including the start year of beekeeping, number of beekeepers in the family, and total labor invested in beekeeping by family members, that is, days, number of beekeeping workers, number of days of employment, total number of bee colonies before spring breeding, honey production, and net income of beekeeping and total cost; (3) beekeeper’s migratory information, including beekeeping models (PAB, SMB, and LMB), number of days away from home to release bees, number of nectar sources visited, nectar source plants used, and latitude and longitude information of migratory sites; (4) relevant natural and socioeconomic factors, including ratio of beekeeping net income to total household net income, income level of beekeepers in the village, whether they have been affected by natural disasters or human-induced environmental disasters, and whether they have participated in cooperatives.
2.2. Research Methods
Based on basic information from continuous tracking survey data of beekeepers’ fixed survey households, the production behavior of beekeepers’ migratory research in this study includes three aspects: migratory behavior, nectar plant utilization behavior, and migratory flow space behavior. Migratory behaviors included PAB, SMB, and LMB. Nectar source plant utilization behavior refers to the plant beekeepers’ selection when they are in fixed and migratory beekeeping. Migratory flow space behavior is the group spatial behavior of the migratory paths of beekeeper households. The factors and mechanisms responsible for the shift in China’s apiculture over the last decade were systematically revealed through the three aspects of research on the changes in the beekeepers’ behavior.
2.2.1. Research on Beekeepers’ Migratory Behavior
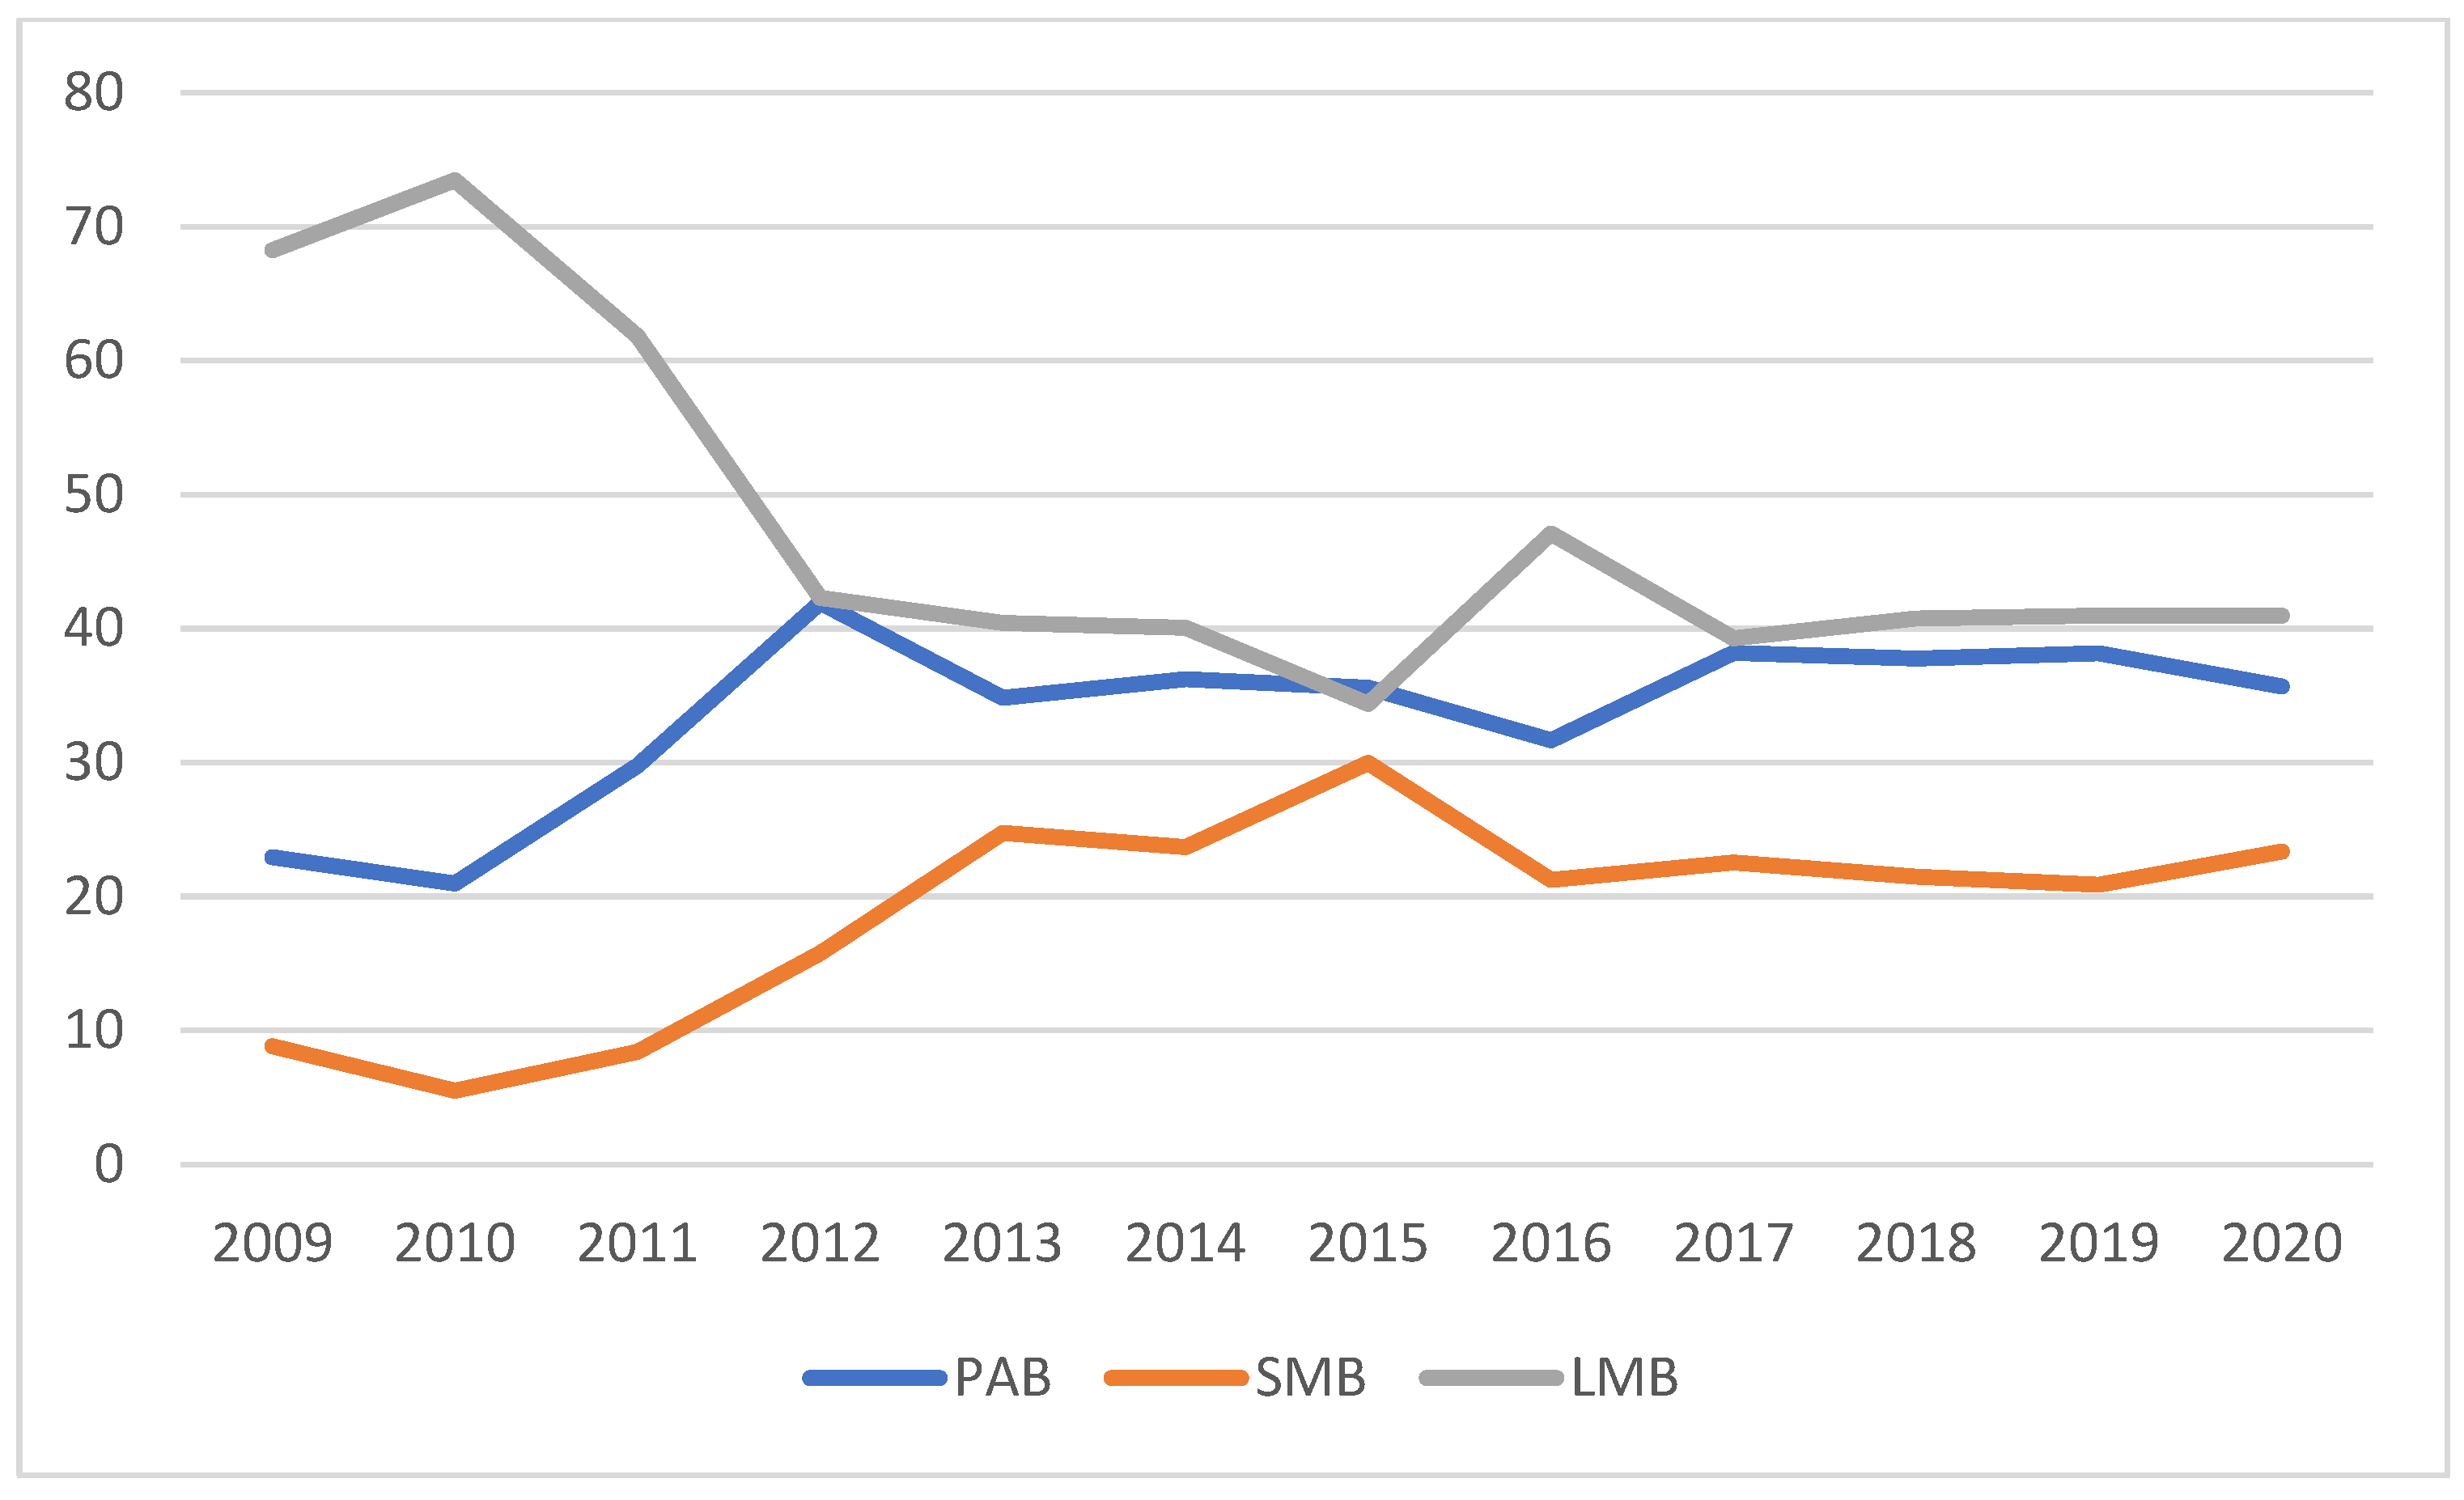
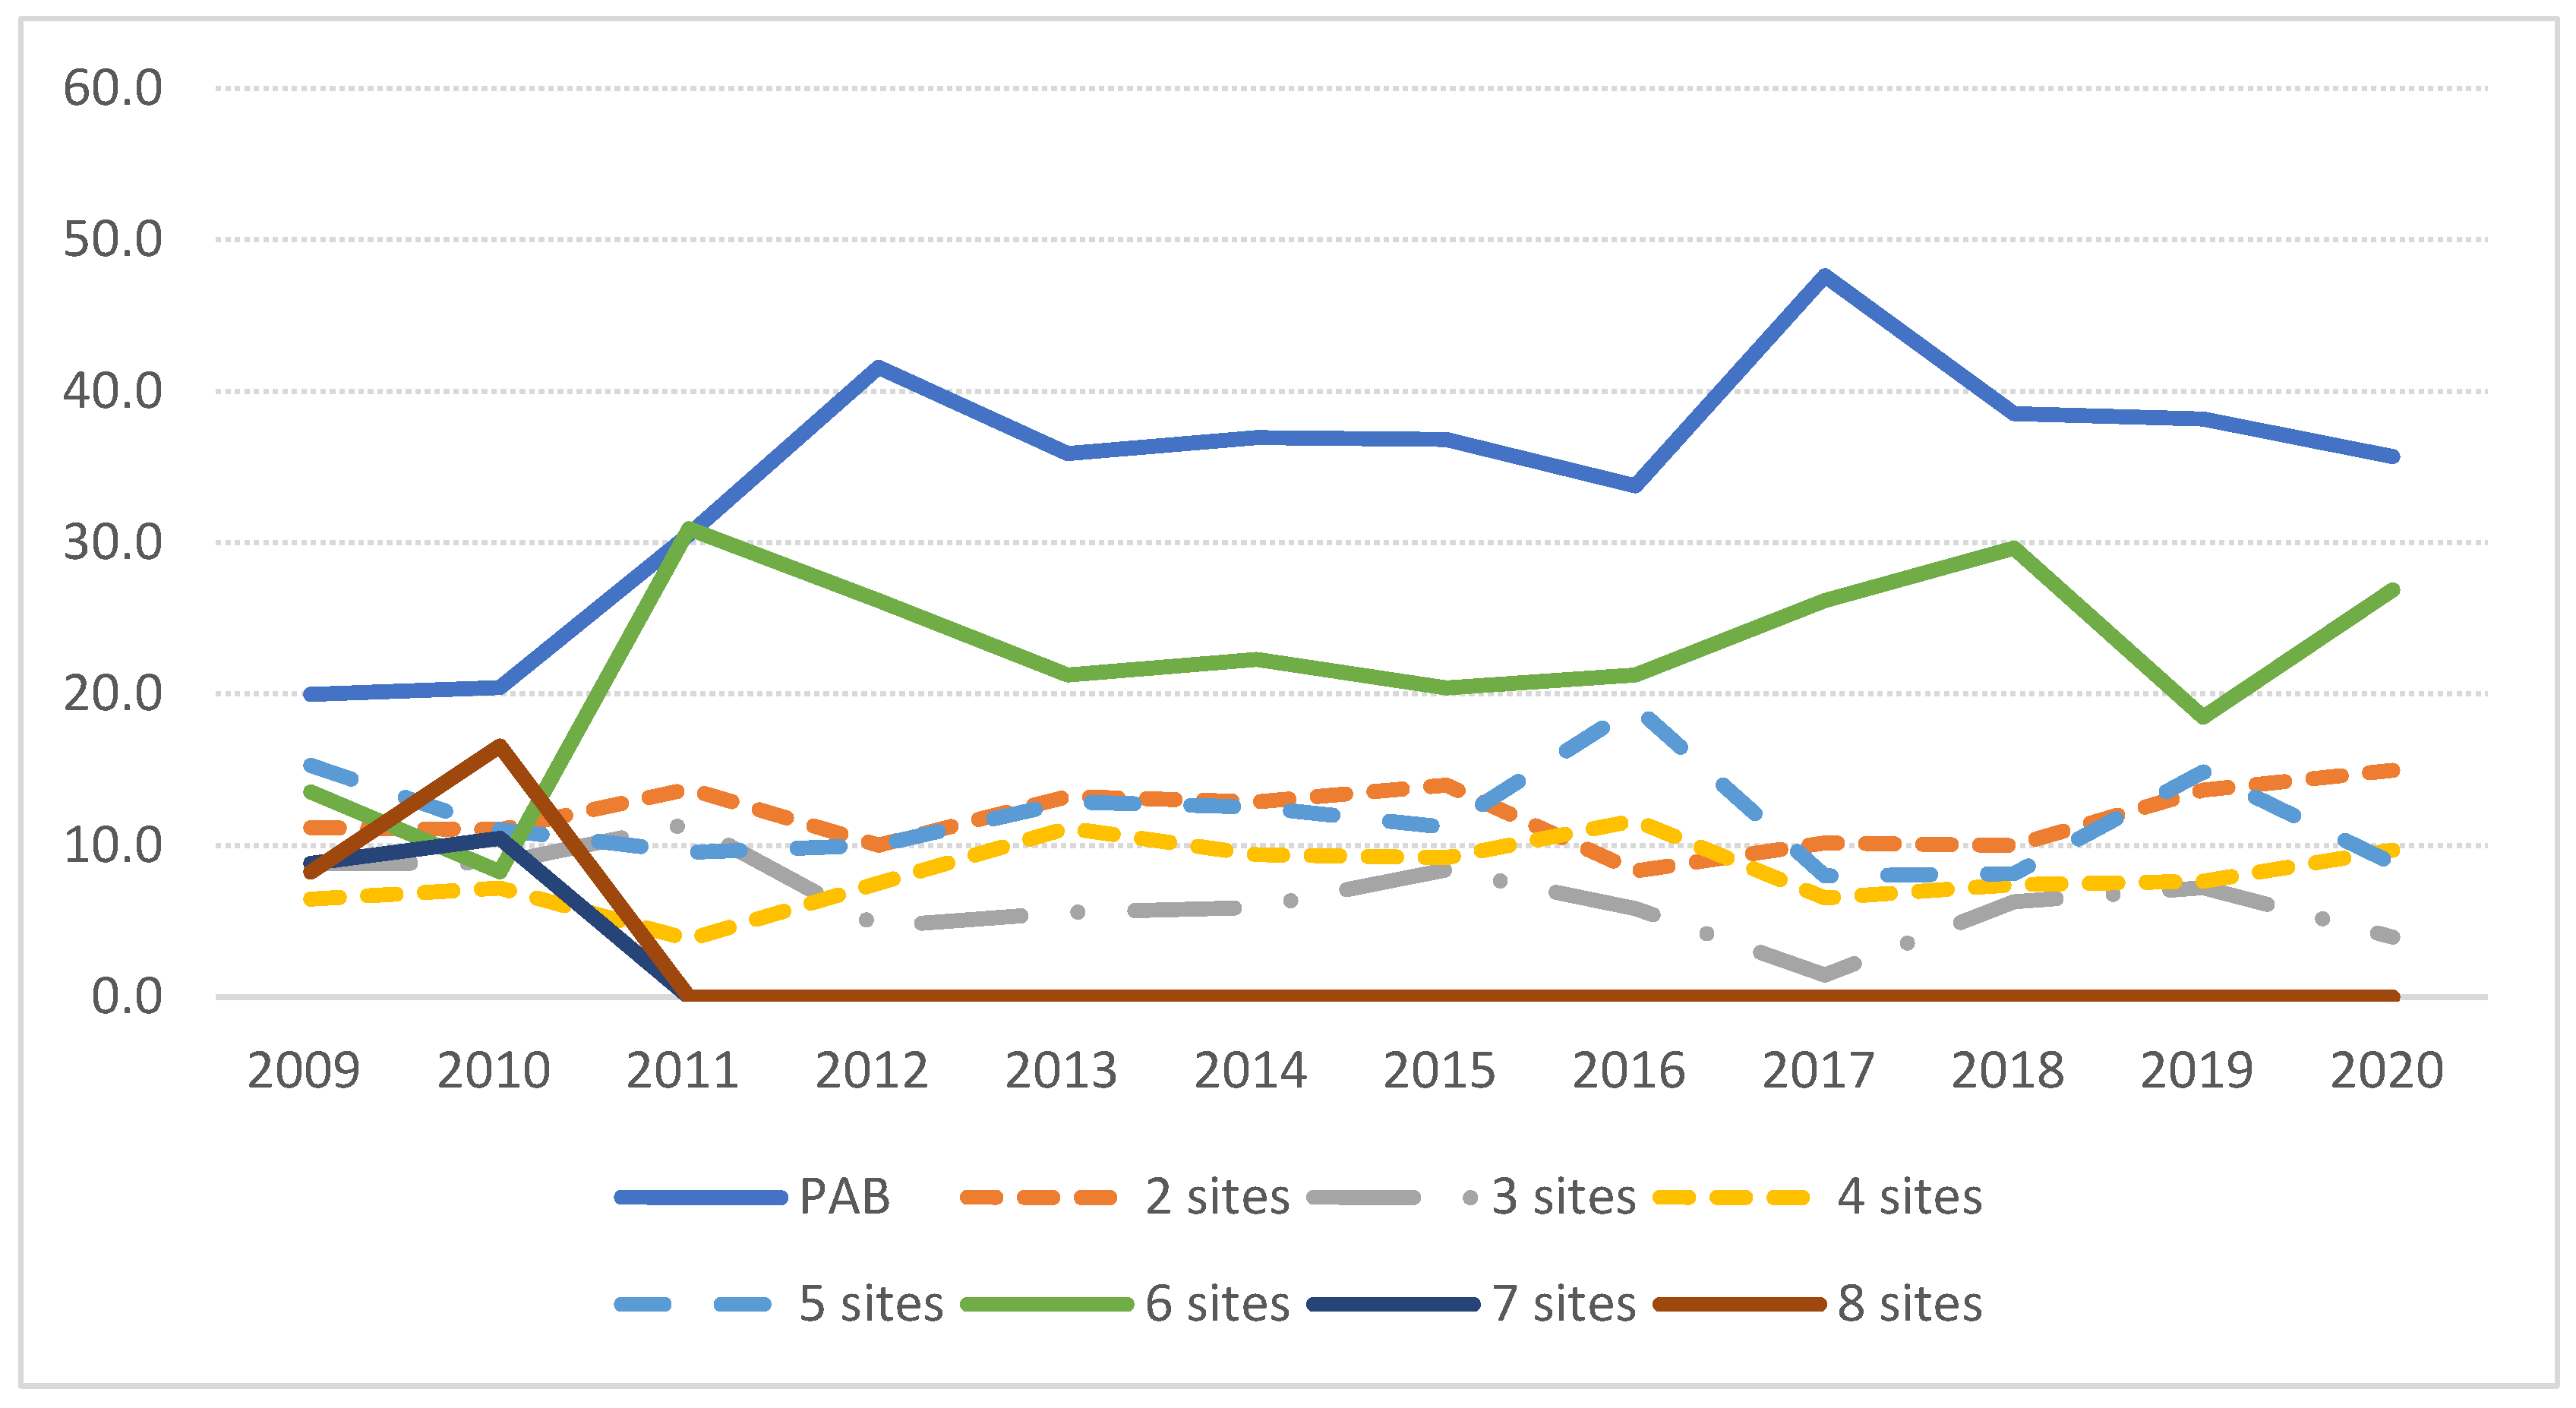
An Excel pivot table was used to count the frequency of selected beekeepers adopting permanent beekeeping, small-scale migratory beekeeping, or large-scale migratory beekeeping year by year from 2009 to 2020, counting the number of nectar source plants visited year by year, and drawing line charts for the visual display of the changing trend of beekeeping models of beekeepers in the last decade.
Considering that the three models of beekeeping and number of nectar sources visited annually are all ordered multicategorical variables, an ordered multiclass logistic regression analysis was used [
16,
17,
18,
19,
20]. The expressions for the regression analysis are shown in Equations (1) and (2). Among them,
k means that there are
k categories of beekeeping models for beekeepers, and the probability of each category is expressed as
;
represents the regression coefficients of the equation, reflecting the influence of various influencing factors on the selection of beekeeping models.
Related influencing factors include the family attributes of beekeepers, investment in beekeeping, economic status, disaster situation, and cooperative participation, as shown in
Table 1. Ordered logistic regression analysis was performed using Stata 16.0, and the results were analyzed.
2.2.2. Change in Utilizing Frequency of Nectar Source Plants and Affecting Factors
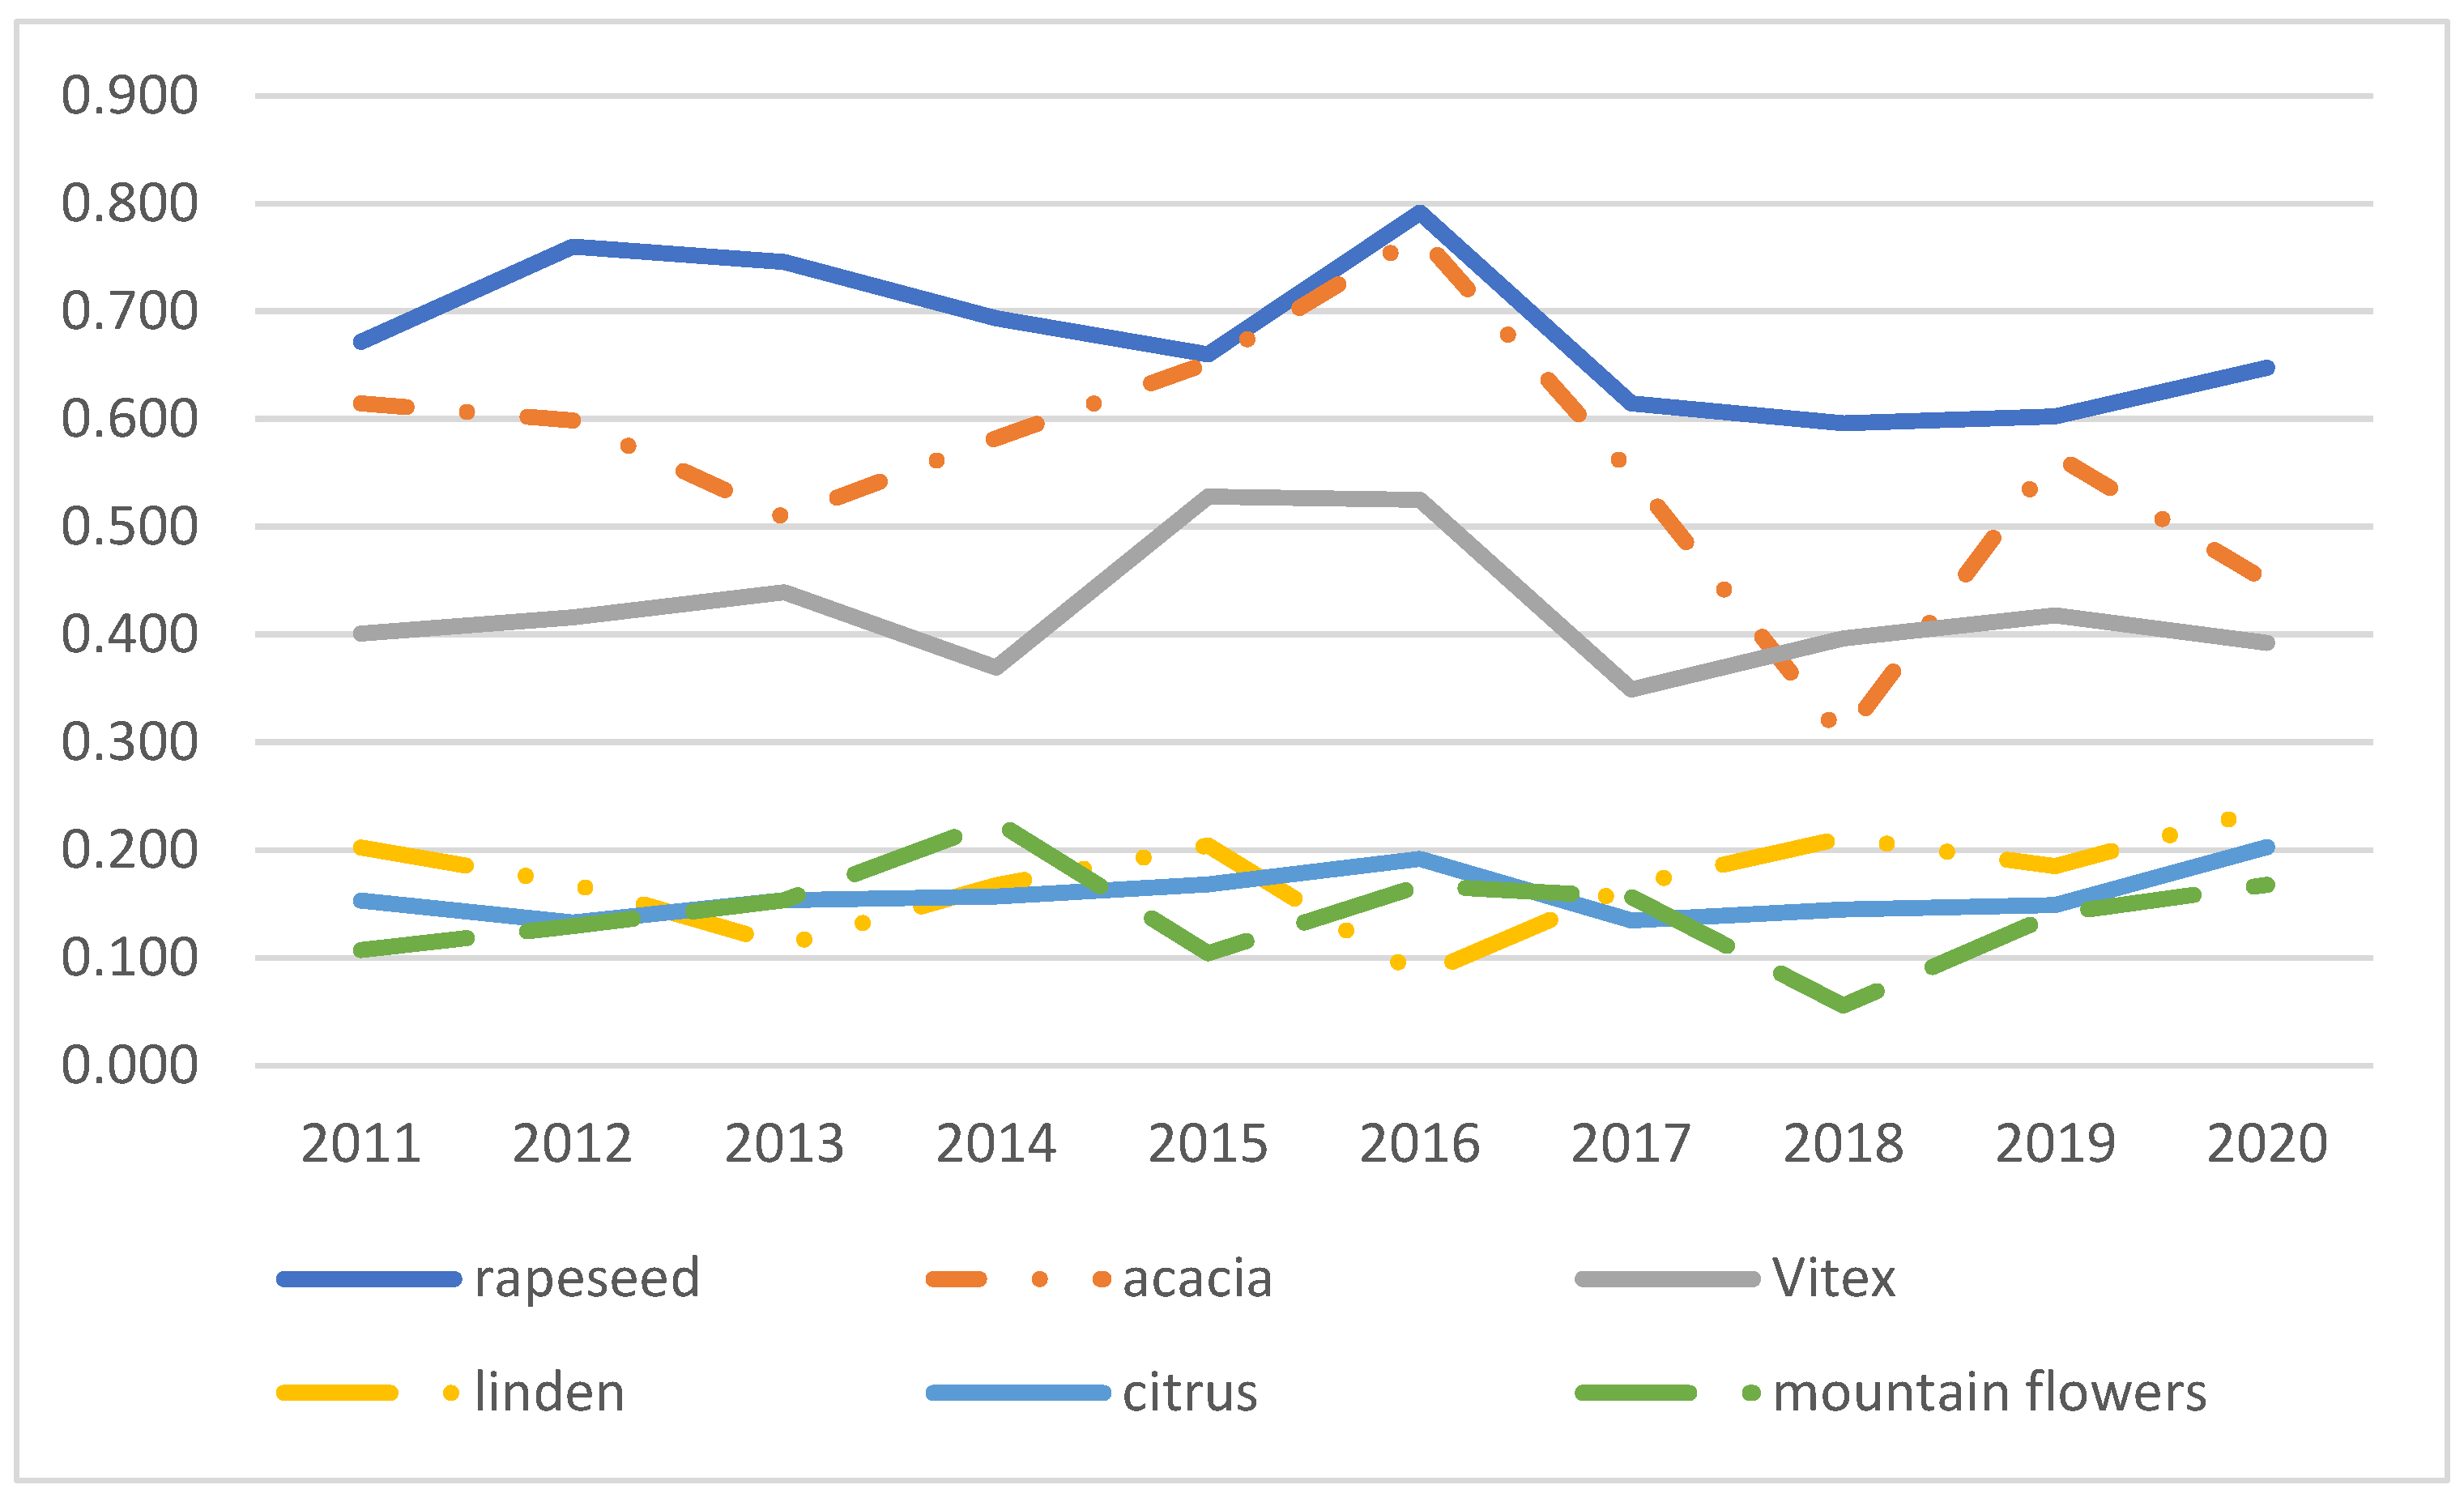
The utilization frequency of different nectar source plants was counted annually from 2009 to 2020 using an Excel pivot table, and line charts were drawn to show the changing trends of the utilization frequency of nectar source plants in the last decade.
Considering the characteristics of the use frequency of different nectar plants in different years, ordered multiclass logistic regression analysis was used.
The relevant influencing factors variables are also shown in
Table 1.
2.2.3. Research on Migratory Flow Space
Based on the analysis of the migratory characteristics of individual beekeepers, the flow space analysis method can be used to analyze the change in the characteristics of beekeepers from the perspective of aggregation. The concept of flow space was first proposed by Manuel Castells in the book
The Informational City: Information Technology, Economic Restructuring, and the Urban-Regional Progress in 1989, and further explained in his book
The Rise of the Network Society [
21]. Flow space is defined as the material organization of time-sharing social practices that operate through flow [
22].
The specific research steps and methods of this part are as follows:
(1) Geographical coordinate marking of the transition location: Based on screening the information of the beekeepers who have migratory information, we marked the specific latitude and longitude of the migratory locations of the beekeepers individually, and marked the center coordinates of the county as much as possible.
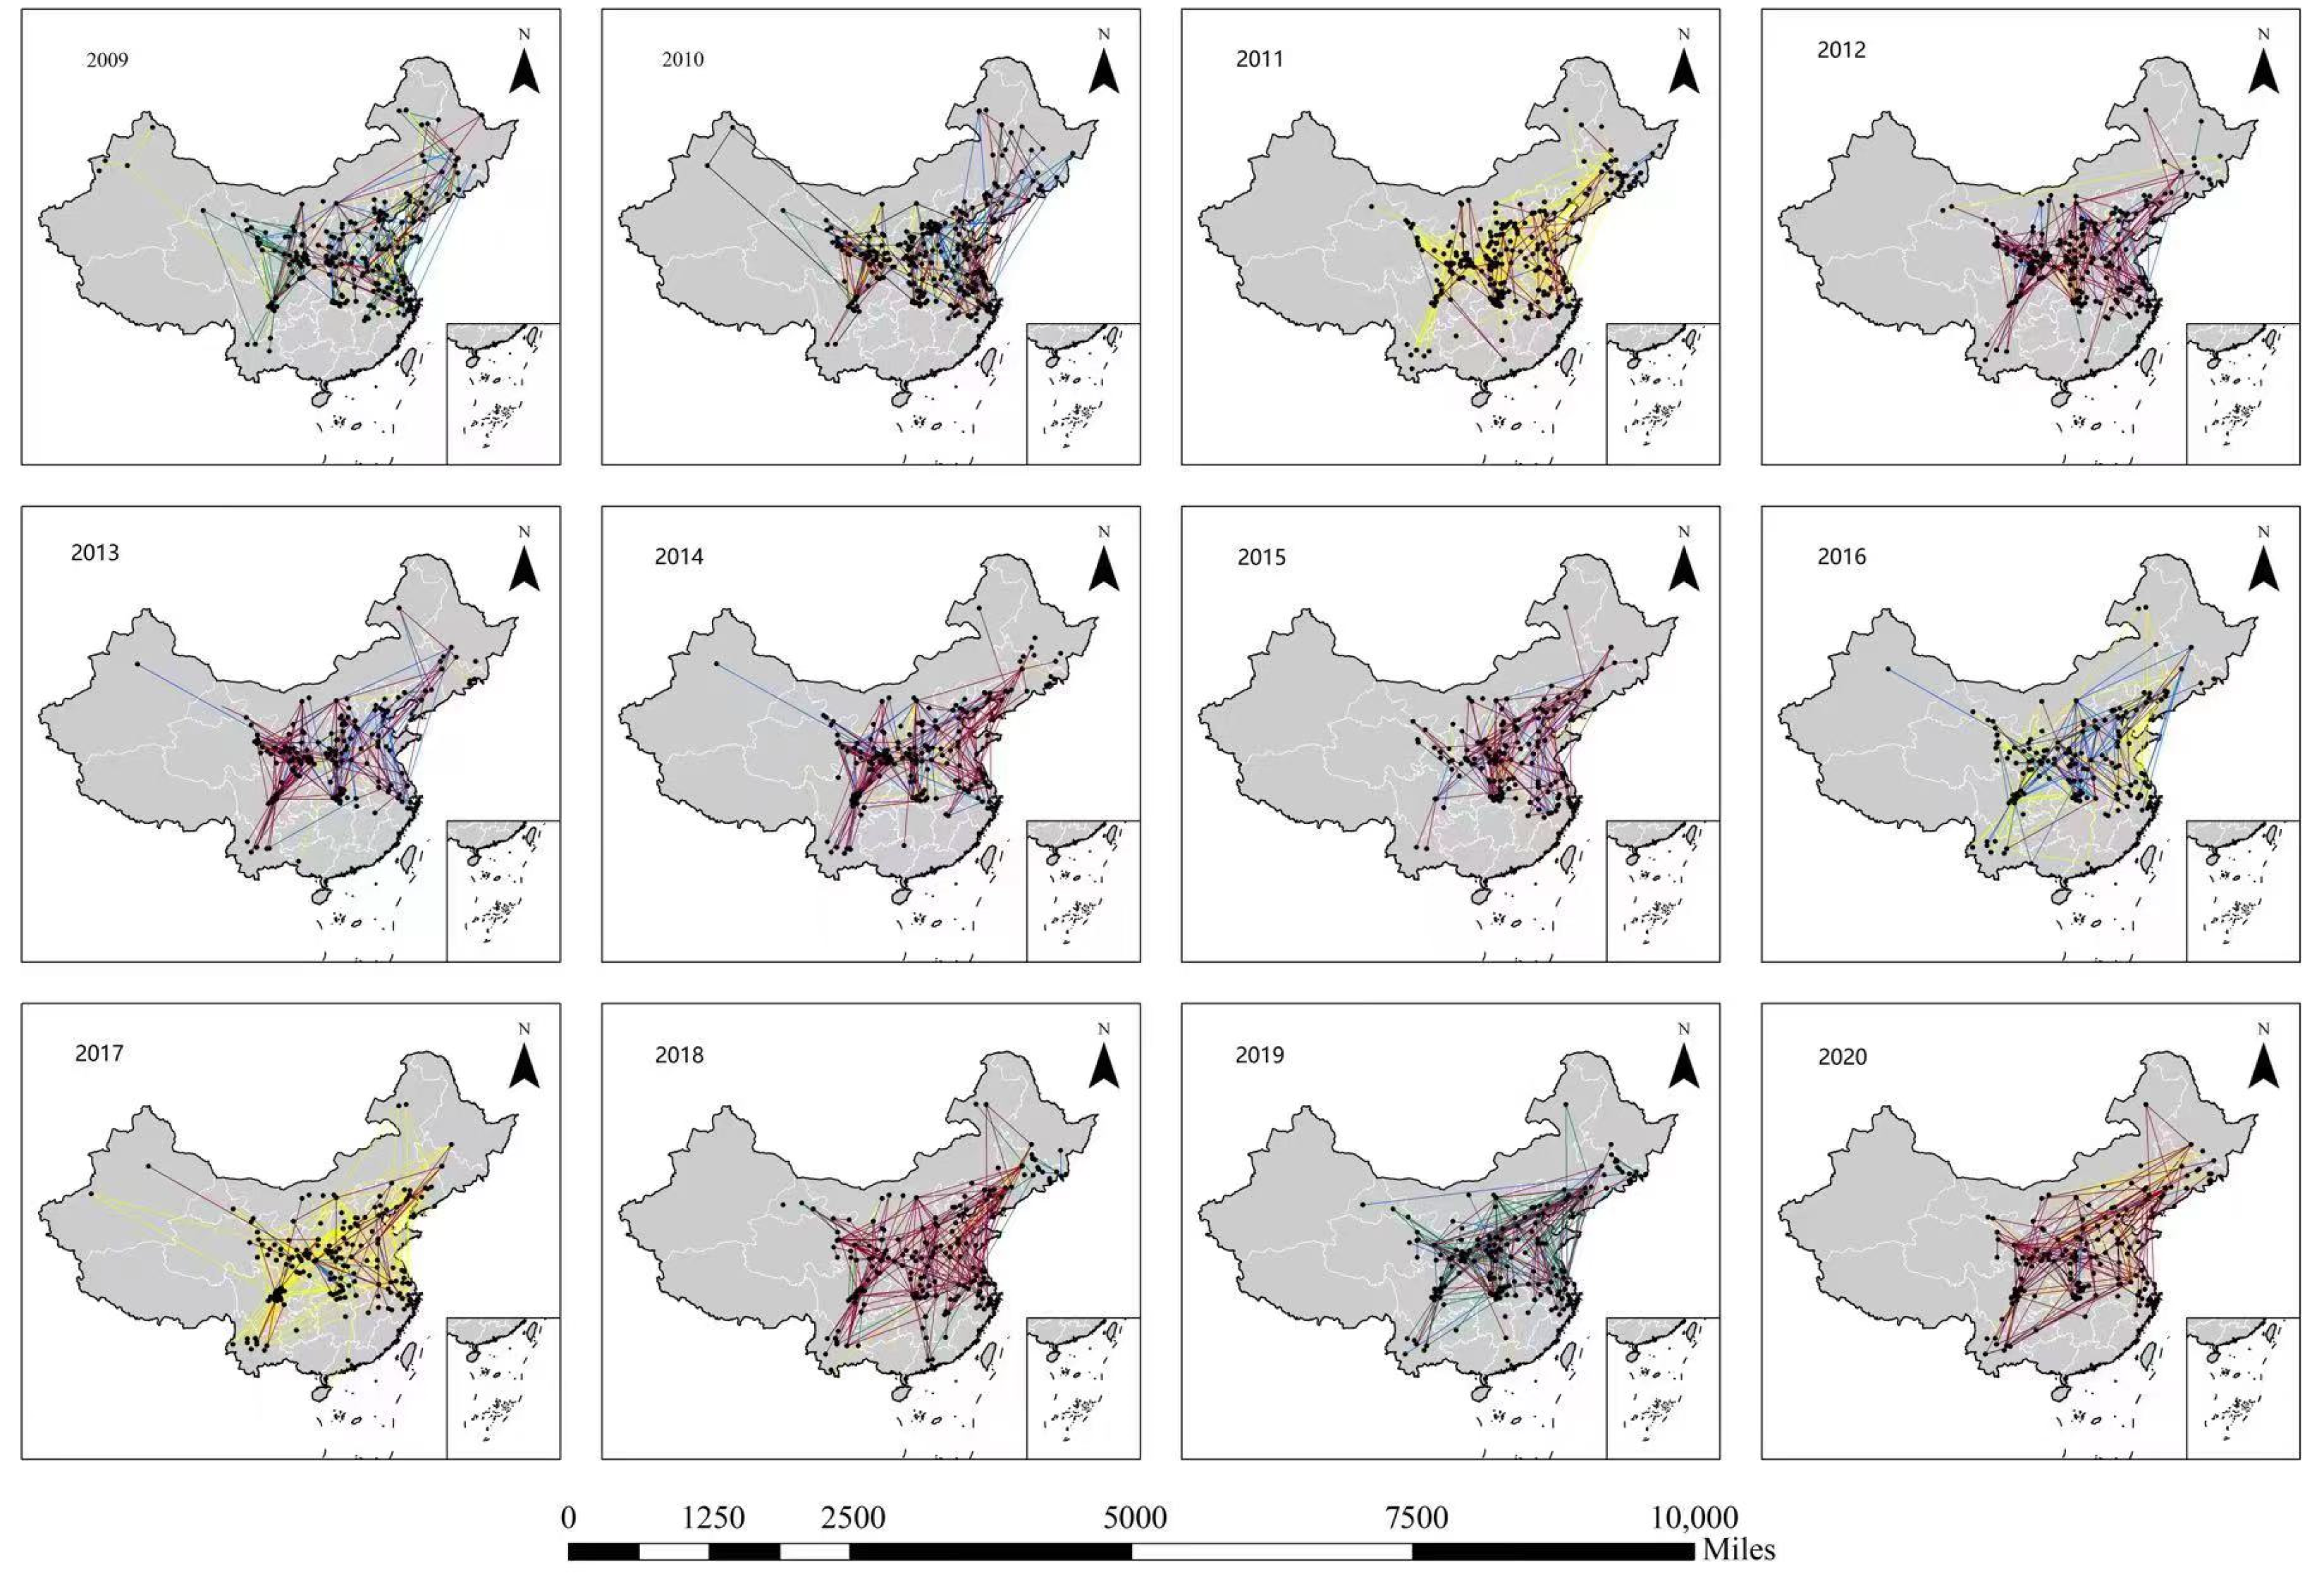
(2) GIS visualization of migratory locations and paths: From 2009 to 2020, we drew a path map of beekeepers’ migration for each year using GIS and visually viewed the annual change characteristics of beekeepers’ migration.
(3) Flow cluster analysis: Flow clustering analysis of unsupervised learning was conducted according to the marked coordinate point information of different beekeepers’ migratory flows. Considering that streams can be represented by directional line segments, three principles were considered when measuring the spatial similarity between flows [
23]: (a) flows are spatially close to each other, (b) flow directions are approximately equal, and (c) the flow lengths are similar. Referring to the method introduced by Tao and Thill [
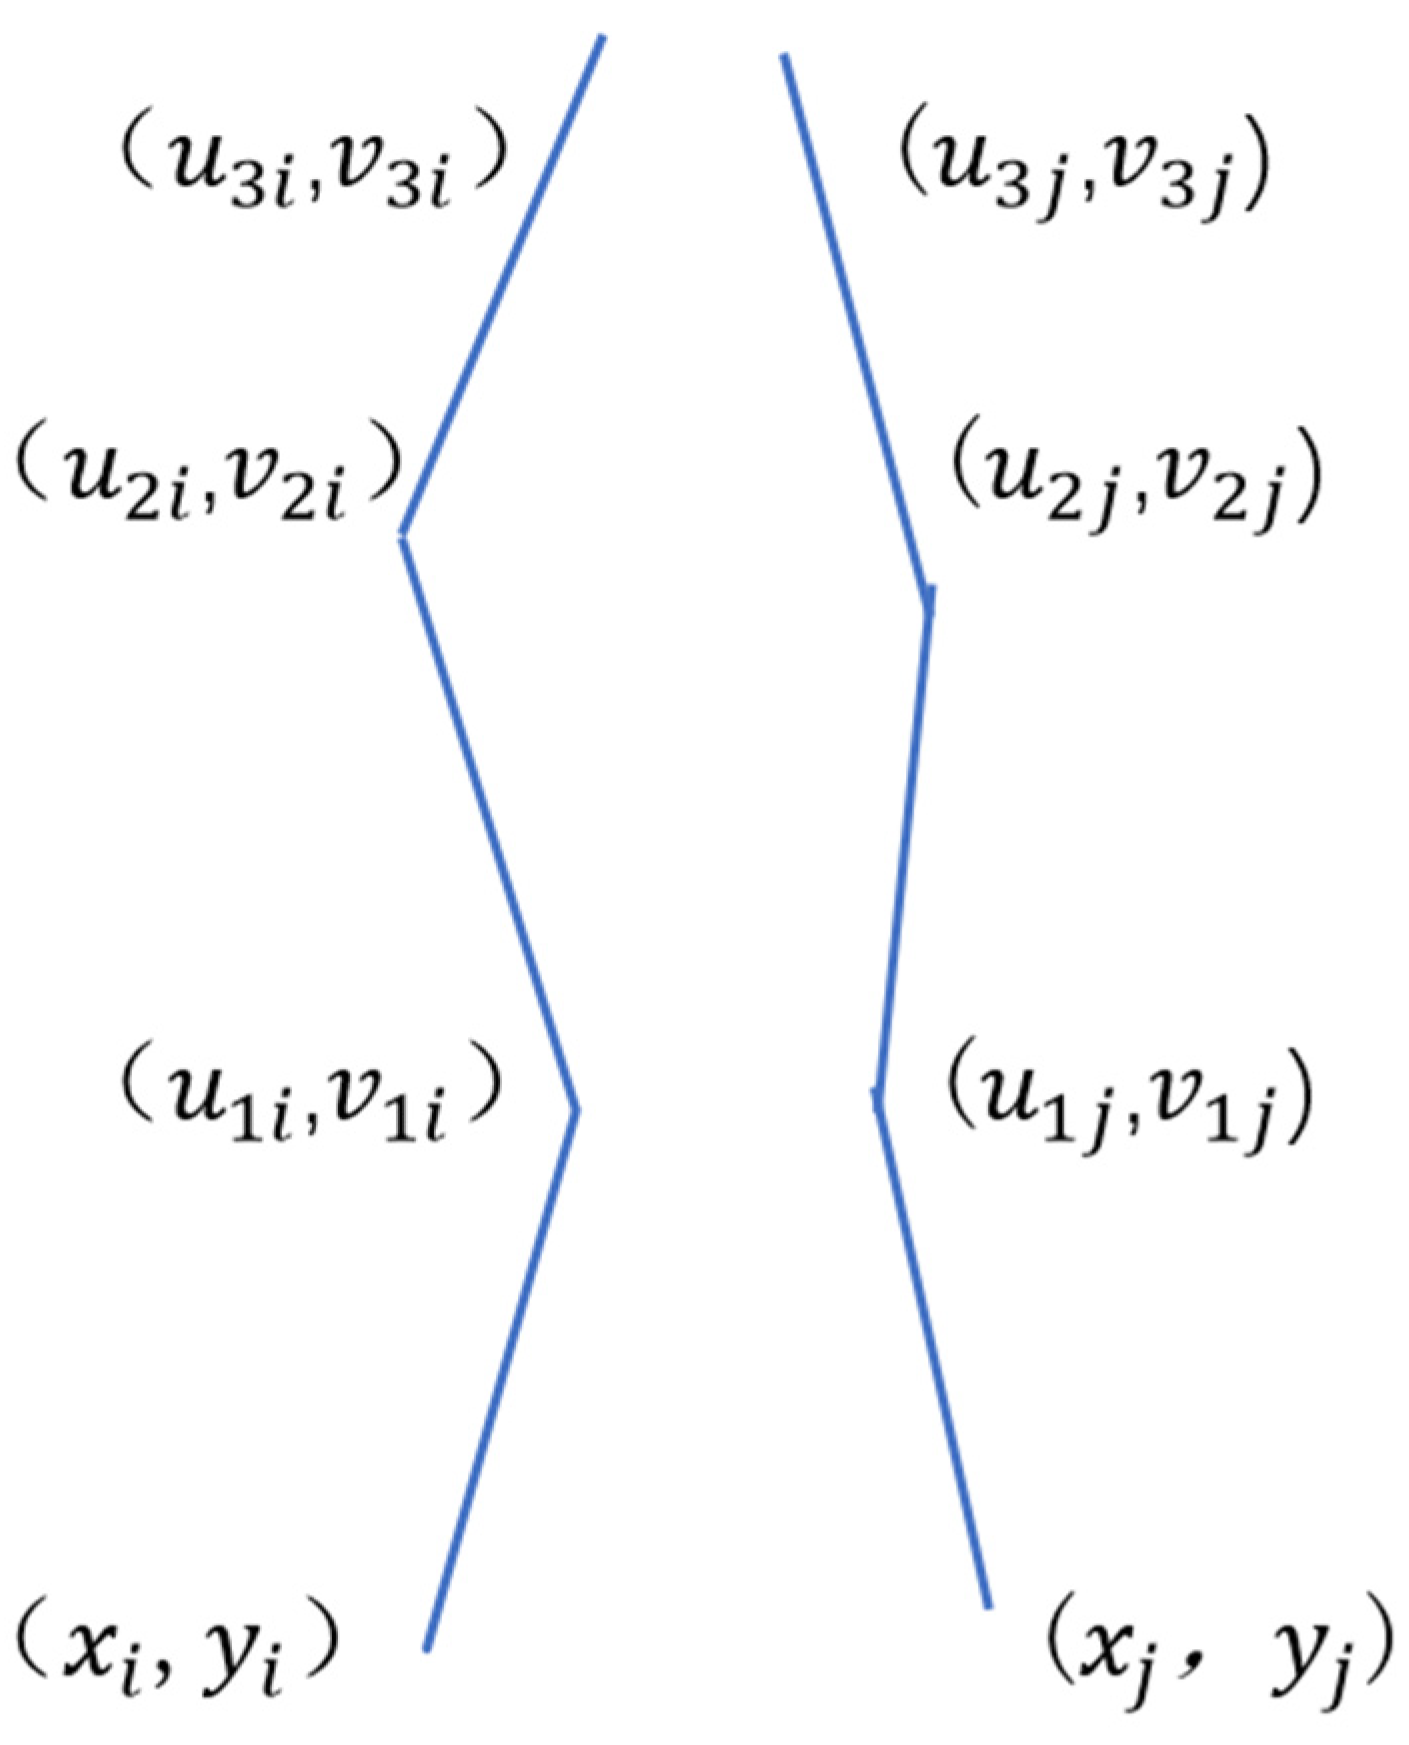
24], which uses spatial statistical methods to detect clustering in flow data, a schematic diagram of the spatial position between two beekeeper-to-ground flows is shown in
Figure 1.
In
Figure 1,
and
are the starting sites of the
ith and
jth beekeepers, respectively, in a year;
refer to their first, second, and third migratory sites, respectively. From
to
is the migratory flow of the
ith beekeeper, and
to
is the migratory path flow of the
jth beekeeper.
Considering that beekeepers perform migratory beekeeping at several sites within a year, assuming
n migratory sites, we calculated the spatial distance between different migratory path flows based on the Euclidean definition, as shown in Equation (3).
where
is the spatial distance between the migratory path flow of the
ith beekeeper and that of the
jth beekeeper;
and
are starting point longitude and latitude coordinates of
ith and
jth beekeepers, respectively;
are migratory point longitude and latitude coordinates of
ith and
jth beekeepers, respectively; and
k = 1 to
n are points from the 1st to
nth coordinates.
Based on the Euclidean spatial distance between different beekeepers, cluster analysis of the migratory flows of beekeepers was performed using Stata 16.0.
(4) Flow space analysis: Based on the results of the annual flow clustering analysis, the color marks the migratory flows in the GIS and the spatial Gini coefficient of the flow clusters is analyzed.
The Gini coefficient reflects the homogeneity of the migratory flow distribution, as shown in Equation (4).
where
Pj is the proportion of the
jth migratory path clustering in all beekeepers in the year,
N is the number of clustering channels for migratory paths, and
C is the homogeneity of the distribution. The Gini coefficient ranged between 0 and 1. The higher the value, the higher the concentration and the more uneven the spatial distribution.
4. Discussion and Conclusions
Based on the analysis of the tracking survey data, the beekeeping behavior of beekeepers showed a certain degree of spatial contraction from 2009 to 2020. Among the three aspects of beekeeping behaviors analyzed in this study, the proportion of the LMB model decreased, while the PAB and SMB models continued to increase. The frequency of utilization of the main nectar source plants for honey collection decreased, and the degree of concentration of migratory flow of beekeeping increased. These phenomena show that Chinese beekeepers have experienced a shrinking trend in the use of nectar plant resources over the last decade. The shrinkage of resources used by beekeepers may reflect the slow development of bee production in China over the last decade. From the regression analysis of the beekeeping models and the number of migratory points, the beekeeper’s family attributes, economic income, natural disasters, and pesticide damage had a significant impact on the changes in the beekeeping models. The age of the beekeeper was significantly negatively correlated with the migratory model, and the older the beekeeper, the more inclined the PAB and SMB. As the age of the beekeeping households increased, the proportion of households that adopted the migratory beekeeping model decreased. The beekeeping income structure has a significant impact on the beekeeping model. The higher the proportion of beekeeping net income in the total household net income, the greater the proportion of LMB. With the expansion of beekeeper income channels and an increase in the proportion of part-time income, the proportion of the PAB and SMB models increased. The occurrence of disasters is also a factor that significantly affects changes in beekeeping models.
The frequency of honey collection from the three main nectar sources (rapeseed, acacia, and vitex) decreased from 2009 to 2020. On one hand, it was related to the distribution, scale, and quality of honey production of the main nectar source plants. On the other hand, it was related to changes in beekeeping models. Researchers have claimed that rapeseed planting areas in the main regions of Brazil have shown a downward trend over the last decade [
25]. Temperature, relative income ratio, and planting policies all have certain influences. According to the National Forestry and Grassland Science Data Center, the distribution area of acacia across China reached 3.2 million hectares between 2009 and 2013, mainly in Shaanxi, Shanxi, Liaoning, Gansu, Shandong, Henan, Hebei, and other provinces. The distribution area of acacia does not change significantly from year to year, but the quality of mature and over-mature acacia forests in many areas has deteriorated. In addition, the climate in some areas is abnormal, with frequent cold, drought, and waterlogging, especially concerning microclimate weather disasters, which affect the flow of honey from honey sources. Affected by early drought, low temperatures, and rainy weather, acacia has experienced severe harvest failure or no harvest in Liaoning for many years [
26,
27]. Vitex and linden were similarly affected. These changes inevitably affect the beekeeper selection of honey plants. The study of beekeepers’ migratory spatial flow showed that the concentration of the beekeeper’s migratory path flow was very high, and the number of clusters and Gini coefficient of the transit path flow showed an increasing trend in the last decade, indicating that beekeepers’ beekeeping behavior showed a trend of spatial contraction. This trend is not conducive to the rational use of honey resources in the different regions of the country. Therefore, in the areas where beekeeping is concentrated, it is necessary to focus on strengthening the construction and protection of nectar source plants, expanding the area of nectar plant areas, improving the quality of nectar source plants, reducing the risk of natural disasters and pesticide disasters, and improving the efficiency and effectiveness of honey collection.
From a global perspective, the beekeeping industry developed rapidly in the 20th century, but in the 21st century, the development of bee colonies in the world slowed down. The number of bee colonies in Asia and Africa is increasing, whereas that in developed countries dominated by Europe is declining [
28]. The honey harvest rate in 2019 was poor in most European countries. The honey production of French beekeepers in that year was only more than a quarter of the seasonal normal production in the 1990s. The honey production of Italian beekeepers dropped by 50% in 2018, and Spanish honey production has continued to fall since 2015. Climate change is the main influencing factor, and chaotic weather events occurring across Europe. Pesticides and other phytotoxicities are considered important inducing factors [
29]. The shrinking phenomenon of the European beekeeping industry in the early 21st century seems to be related to the shrinking trend of the Chinese beekeeping industry over the last decade. Therefore, it is necessary to strengthen the comparative study of global beekeeping behavior and industrial development.
5. Policy Implications
Our results have important implications for accelerating the development of high-quality apiculture. First, it is imperative to initiate training and development plans for young beekeepers at different levels, strengthen the professional knowledge and skills of young beekeepers, and rejuvenate beekeeping as soon as possible. Second, implement a reward system for the ecological protection of nectar source plants in a planned manner, provide financial incentives for areas that protect and maintain nectar source plants, encourage farmers and communities to actively participate in ecological protection, promote the ecological restoration of nectar source plants, and increase the number of nectar source plants. Third, establish a market-oriented beekeeping insurance system, effectively managing beekeeping risks, and improving the scale and benefits of compensated pollination of crops and fruit trees. Through the establishment and implementation of these policies, the technical level and efficiency of the beekeeping industry can be comprehensively improved, and the sustainable development of China’s apiculture can be promoted.
Simultaneously, strengthening the development of the world apiculture is of great significance for adapting to global climate change, alleviating the world food security crisis, promoting human health, and building a world community with a shared future. Beekeeping is a worldwide sunrise industry and a pillar industry whose potential value is far greater than the market value, which can produce a hundredfold multiplier benefit. In developing countries, there is a large gap in the development of beekeeping, and there is great potential. Therefore, we should refer to the methods we proposed in the previous paragraph to strengthen the development of beekeeping in their countries and regions in terms of talent team building, protection and utilization of nectar source plants, beekeeping subsidies, and insurance. In developed countries, it is necessary to strengthen the research and development of climate change technologies and the coupling of new and traditional technologies to achieve breakthroughs in modern beekeeping.


