Article

Design and Optimization of a Mixed-Flow Drying Chamber for Tiger Nuts Based on CFD-DEM Heat and Mass Transfer Model

College of Mechanical and Electrical Engineering, Henan Agricultural University, Zhengzhou 450002, China
*
Author to whom correspondence should be addressed.
Agriculture 2024, 14(4), 541; https://doi.org/10.3390/agriculture14040541
Submission received: 27 February 2024 / Revised: 22 March 2024 / Accepted: 22 March 2024 / Published: 28 March 2024
(This article belongs to the Special Issue Advances in Modern Agricultural Machinery)

Abstract

:
In order to solve the problem of inconsistent moisture content in particles during the drying process of tiger nuts (Cyperus esculentus) due to uneven air flow and temperature distribution in the drying chamber, an open-hole corner box was designed based on the principle of negative pressure micro-perforated air supply. Using computational fluid dynamics (CFD) and discrete element method (DEM) simulation, coupled with the basic theory of interphase heat and mass transfer, a mathematical model for interphase heat and moisture coupling transfer was established. The effects of different aperture rates of corner boxes in the drying chamber, spatial location arrangement, and other related variables on the airfield distribution, temperature field distribution, tiger nut temperature, and moisture content changes were investigated. The results show that the average air velocity below the air inlet gradually increases as the opening ratio increases. When the opening rate is 0.33%, the wind field uniformity is better, and the inhomogeneity of the drying chamber wind field is improved. As the lateral distance increases, the consistency of the moisture content distribution increases and then decreases, and the flow rate of the tiger nuts gradually increases when the grain is discharged. The rate of decrease in water content decreases gradually with the increase in longitudinal distance. When the wind speed reaches 4 m/s, the drying chamber wind field is more uniform, and the water vapor diffusion efficiency at the outlet is basically the same. Therefore, the appropriate corner box has a horizontal distance of 320 mm and a longitudinal distance of 420 mm, providing a basis for the design of tiger nut drying equipment.

1. Introduction

The tiger nut is a new type of oil crop. It integrates grain, oil, pasture, and feed, and is expected to become a high-quality resource to replace soybeans and solve the problem of food and oil security that has long plagued the world [1]. The benefits of tiger nut cultivation are much higher than those of major food crops, which are conducive to promoting farmers’ income growth [2]. The drying of tiger nuts after harvest is one of the key links in the mechanization of tiger nut production. At present, the natural drying method is mainly used. However, it is no longer able to meet the requirements of the large-scale production and quality of tiger nuts, and there is an urgent need to develop special drying equipment for tiger nuts [3]. Mixed-flow drying towers have been widely used in grain drying, and the use of mixed-flow drying towers can effectively mitigate the impact of weather conditions on tiger nut drying operations. The drying chamber is the core part of the mixed-flow drying tower. However, tiger nuts are highly susceptible to uneven heating in the drying chamber of traditional mixed-flow drying towers [4,5,6]. Therefore, the structure and layout of the drying chamber’s inner ventilation corner box are important factors that affect the airflow distribution.
Optimizing the drying chamber structure can improve the drying performance of the drying tower, reduce production costs, and cut down energy consumption. The researchers used mathematical modeling to conduct a large number of studies on the shape and spatial layout of the corner box. C. W. Cao et al. [7] investigated the effects of the duct size, shape, number of rows, and arrangement on the performance of a mixed-flow grain dryer. F. Weigler et al. [8] investigated the effects of dryer geometry and different corner box arrangements (horizontal and diagonal) on the wind and temperature fields using the CFD technique. Keppler, Istvan et al. [9] used the DEM technique to analyze the effects of the corner box shape and arrangement on particle flow uniformity. Qing Jiang et al. [10] used the CFD technique to optimize the drying tower with a variable cross-section corner box structure. The uniformity of the temperature field and airfield distribution in the drying chamber was improved. Che Gang et al. [11] designed a variable-diameter open-ended corner box using CFD technology in order to improve the air distribution relationship within the drying chamber and further improve the uniformity of rice drying. Anderson Rodrigo Visconcini et al. [12] studied the inlet and outlet airflow using CFD techniques. The material was set up as a laminar porous medium in an isothermal state. Luo, H et al. [13] used the DEM technique to analyze the flow state of paddy in the drying chamber and concluded that there is a velocity difference between adjacent paddy flow processes. The wind field and temperature field of the mixed-flow drying tower are more complicated. Merely analyzing the temperature field and wind field in the drying chamber does not directly indicate the drying effect, which is quite different from the actual situation. In order to better design the structure of the drying chamber, it is also necessary to obtain two important parameters, such as the moisture content and temperature of tiger nuts.
In order to optimize the design of the drying system, the use of CFD-DEM modeling is the most effective way to achieve this goal [14,15,16,17,18,19,20]. Bin Lan et al. [21] developed a CFD-DEM-IBM (immersed boundary method) method for the simulation of the particle drying process, which is useful for simulating the fluid flow, mass transfer, and heat transfer within a gas-fluidized bed. Rong Guo et al. [22] investigated the hydrodynamic and heat transfer characteristics of wet and dry particles in a fluidized bed using numerical modeling by introducing the effect of the liquid bridge force on the wet content of particles. H.Q. Che et al. [19] proposed a complete and reliable CFD-DEM model to study the coating process. Numerical methods focusing on particle–fluid thermal convection, coating fluid ejection, and evaporation of the ejected fluid on the particle surface were investigated. M. Sousani et al. [23] proposed an accelerated heat and mass transfer simulation using graphics processing unit (GPU) technology. The coupled model accurately captured the fluid-to-solid phase convective heat transfer process with a significant improvement in the simulation time. Khomwachirakul P et al. [24] used the CFD-DEM model to explore gas-particle motion behavior, average particle water content, average particle residence time, and particle residence time distribution. Aziz, H et al. [25] used CFD-DEM to simulate the drying process of pharmaceutical wet particles in a fluidized bed dryer. Water evaporation from the particle surface was considered. Obviously, CFD-DEM can explore the wind field and temperature field distribution in the drying chamber of the mixed-flow drying tower. More importantly, temperature and moisture content changes in tiger nut particles can be obtained.
This paper addresses the problem of inconsistent moisture content during the drying process of tiger nuts due to uneven airflow and temperature distribution. Based on the CFD-DEM coupled simulation and the basic theory of interphase heat and mass transfer, the mathematical model of interphase heat and moisture coupling transfer is established. The influences of different aperture rates of corner boxes and space position arrangements on the distribution of an airfield, temperature field, and the temperature and moisture content of tiger nuts in the drying chamber are investigated, providing a theoretical basis for the design of tiger nut drying equipment.

2. Materials and Methods

2.1. Mathematical Model

In order to facilitate the simulation and analysis of the wind field and temperature field distributions, as well as the temperature and humidity changes of tiger nuts in the drying room, using the CFD-DEM coupled simulation and the basic theory of interphase heat and mass transfer, a mathematical model of heat and humidity coupled transfer for tiger nuts was established.
During the actual drying process, the hot medium enters the drying chamber from the air inlet to carry out the drying operation. The exhaust gas leaves the drying section by the air outlet, and there are some uncertainties in this process. The theoretical control equations in the simulation refer to the ideal state. In order to simplify the model calculation, the following assumptions are made: it is assumed that the volume state of tiger nuts does not change during the drying process; the hot medium inside the drying section is considered a continuous, incompressible ideal gas; and the spontaneous heat generated by the respiration of the tiger nuts themselves is ignored.

2.1.1. Governing Equations for Solid Phase

The DEM is used to track the trajectory and rotation of each particle in the system through a time-stepped simulation. The motion of the mass is governed by Newton’s second law of motion, and the equations of motion for translational and rotational motion are as follows [23]:
F = m p u ¨ i I θ ˙
where F is the interparticle contact force; m p is the mass of the particle; u ¨ i is the translational acceleration; I is the moment of inertia; and θ ˙ is the corner acceleration. The equation used to calculate the force of different particle–particle interactions is as follows [23,24,25,26]:
F n = 4 3 E * R * δ n 3 / 2
F n d = 2 5 / 6 β S n m * U n r e l
F t = S t δ t
F n d = 2 5 / 6 β S t m U t r e l
where E * is the effective Young’s modulus; R * is the particle equivalent radius; values of β are in the range of 0.01–0.03; m * is the equivalent mass; U n . t r e l is the normal/tangential component of the relative velocity; and S n , t is the normal/tangential stiffness.

2.1.2. Governing Equations for Gas Phase
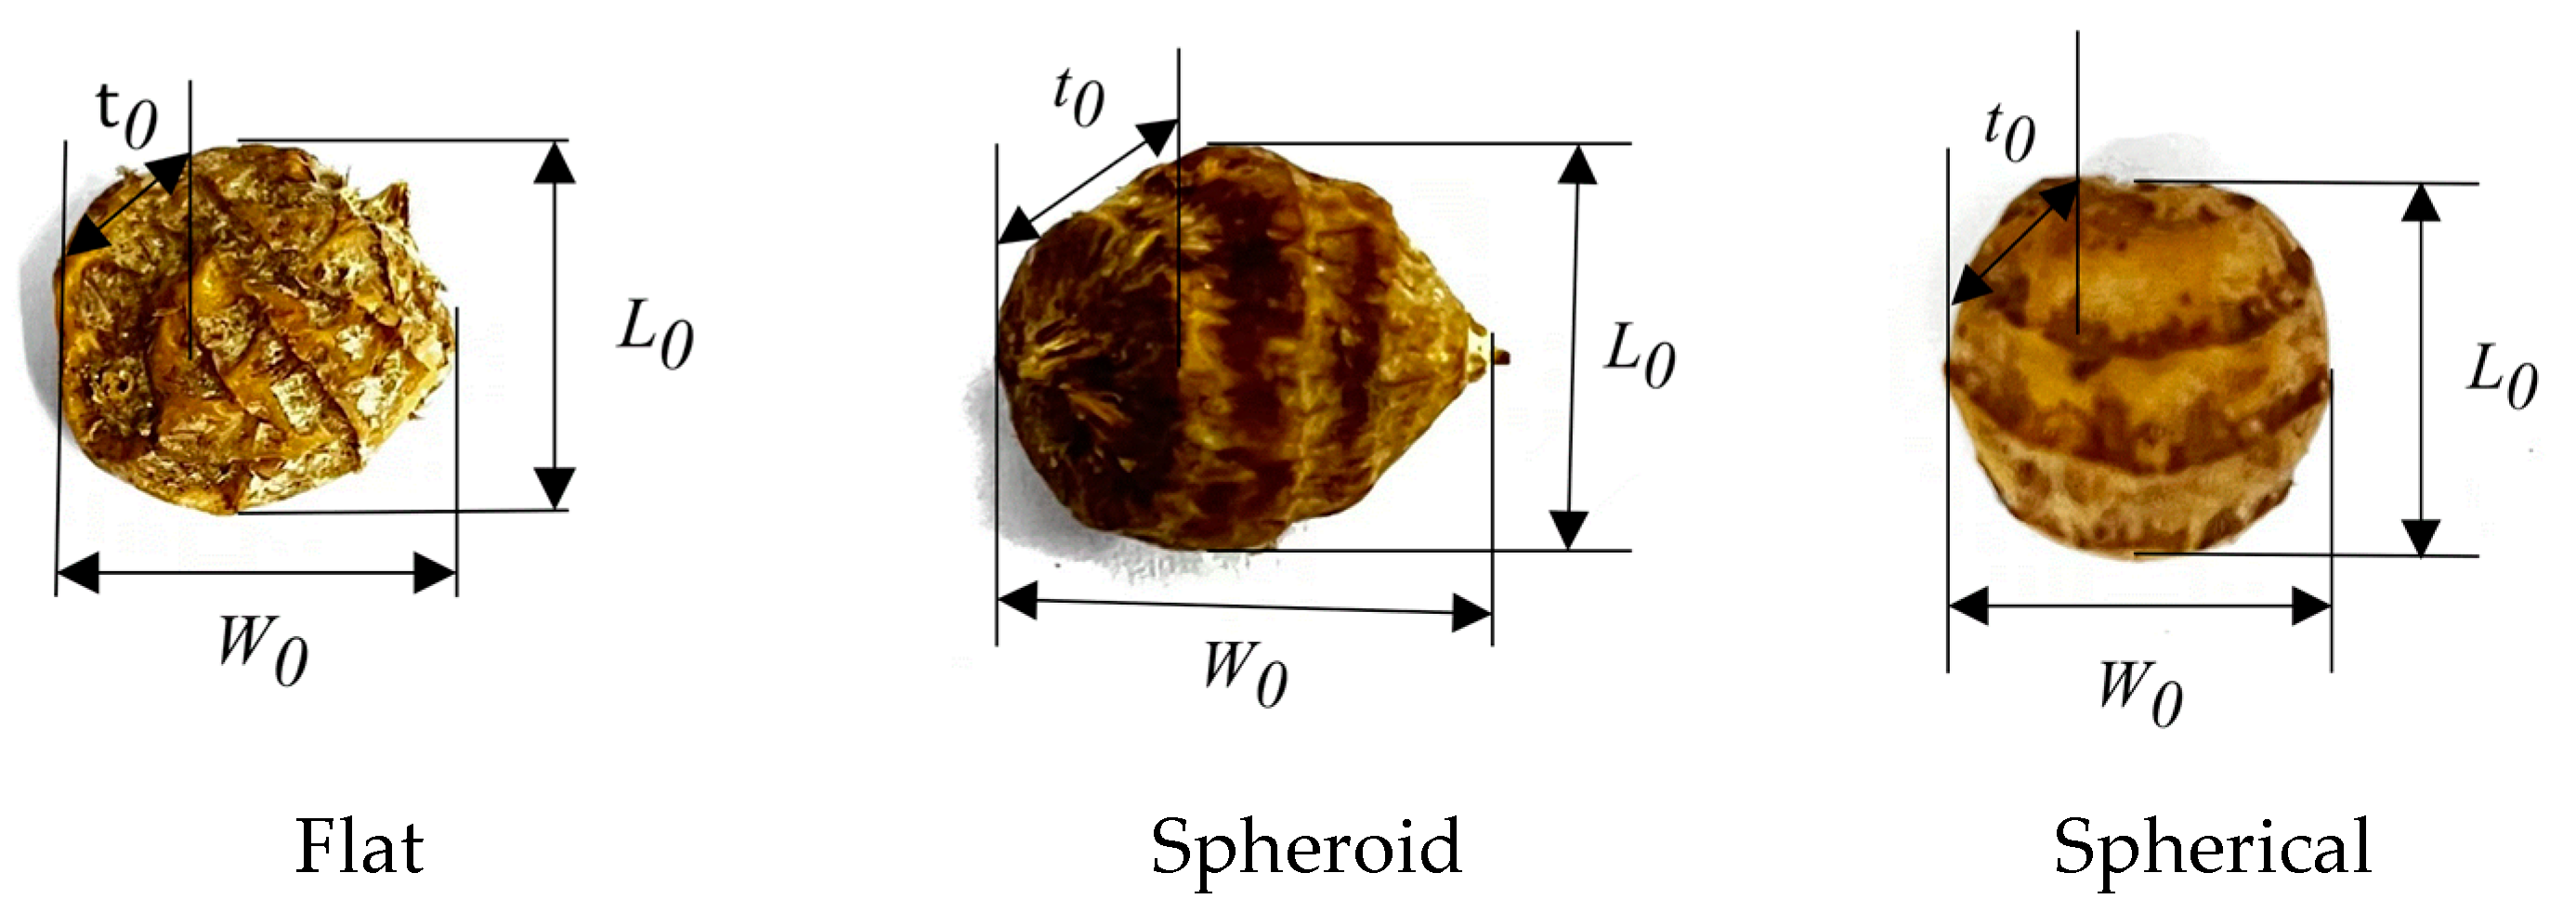
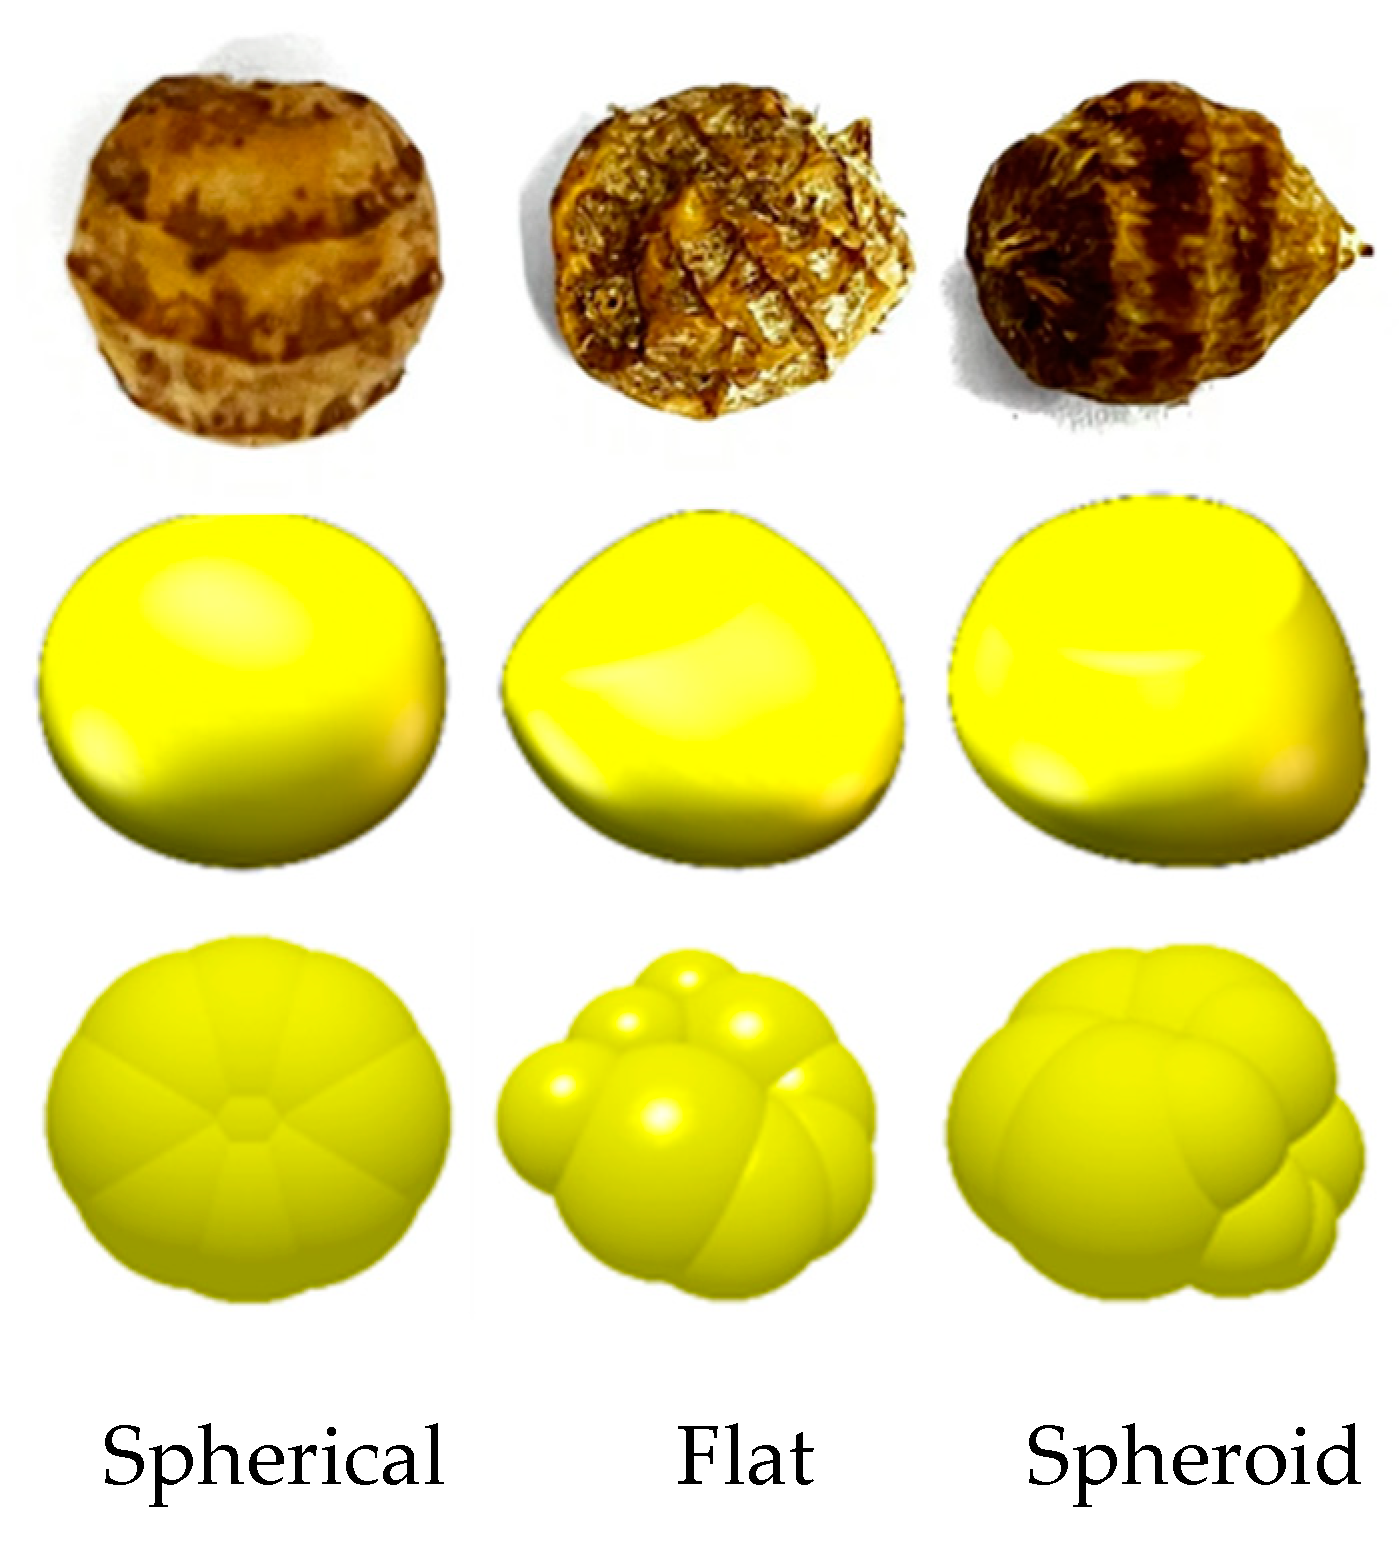
The new dense discrete phase model (DDPM), which converts EDEM (engineering discrete element method, DEM Solution Ltd., Edin, UK) particle data into discrete phase model (DPM) injections, is used. Moreover, the volume fraction resistance, heat, and mass transfer are calculated by Fluent software (Fluent 2022, ANSYS, Inc., Canonsburg, PA, USA), thus improving the computational efficiency. Each phase satisfies the laws of the conservation of mass and conservation of momentum. The mass and momentum conservation equations for the fluid phase g are as follows [23]:
t ( α g ρ g ) + ( α g ρ g v g ) = q = 1 n p h a s e s ( m ˙ g p m ˙ p g )
where subscripts p and g denote the solid phase and fluid phase, respectively; α g denotes the fluid volume fraction; ρ g denotes the density of the fluid phase; V g denotes the velocity of the fluid phase; m ˙ g p denotes the mass transferred from the fluid phase to the solid phase; and m ˙ p g denotes the mass transferred from the solid phase to the fluid phase.
The fluid phase momentum conservation equation is as follows [23]:
t ( α g ρ g v g ) + ( α g ρ g v g v g ) = α g g + α g μ g ( V g + V g r ) + α g ρ g g + F v m , i f t , u s e r + p g ( K p g ( v g v p ) + m ˙ g p v g p m ˙ p g v p g ) + K D P M ( V D P M v g ) + S D P M , e x p l i c i t
where μ g is the shear viscosity of the particle phase g; K p g is the interphase momentum exchange coefficient between the fluid and particle phases; F v m , l i f t , u s e r is the lift force (due to the velocity gradients in the initial phase flow field); v p and v g are the particle and fluid velocities, respectively; v g p is the interphase velocity and is dependent upon m ˙ g p ; S D P M , e x p l i c i t is the explicit component of the particle sink term; and V D P M and K D P M are the implicit terms of the particle averaged velocity of the considered discrete phase and interphase momentum exchange coefficient, respectively. In this study, the heat, mass, and momentum transfer between phases are considered, so the mass of the tiger nut particles is variable.
Modeling the drying process of particles containing water is a complex process. Scholars have provided a wealth of models for studying the mathematical modeling of drying processes. The following equation presents a simple kinetic model that considers the latent heat of the vaporization of water, as well as the different vaporization processes of surface-free water and internal bound water in solids. The mass transferred from the solid phase to the fluid phase can be expressed as follows [27]:
m ˙ p g = α π d 2 ( P s a t P ) M w 2 π R T
P s a t = 133.322 × 10 0.6715 + 0.030 ( T 273.15 ) 0.0000798 ( T 273.15 ) 2
α = S h p D g d p
D g = 5.05 × 10 9 T g 1.5
where α denotes the particle evaporation coefficient; M w denotes the molecular weight of water (0.018 kg/mol for water); R denotes the universal gas constant (8.3145 J/mol K); T denotes the temperature of the particles, K; P denotes the gas pressure, pa; p sat denotes the saturation pressure at temperature T, pa; d p denotes the particle diameter, mm; D g denotes the diffusion coefficient of water vapor in the gas phase; T g the temperature of the gas phase, K.
The Ranz–Marshall model uses a similar approach to the Ranz–Marshall heat transfer coefficient model. The expression for the Sherwood number flowing through the spherical particles is the same as that for the Nusselt number in heat transfer, and the Prandtl number is replaced by the Schmidt number [27].
S h p = 2 + 0.6 R e 1 / 2 S c p 1 / 3
where the Schmidt number is defined as follows:
S c p = μ p ρ p D p
where μ P and ρ p are the dynamic viscosity and density of the fluid phase, respectively. The Ranz–Marshall model is based on the boundary layer theory and is used to stabilize the flow through spherical particles. It is usually applied under the following conditions.
0 S c q < 250
0 R e q < 200
This work considers the heat transfer between ‘particle–particle’ and ‘particle–fluid’. The energy control equation for a single particle is as follows [17,23,24,25,26,27]:
m p C p d T d t = ( Q P F + Q P 1 P 2 )
Q P F = h P F A p Δ T P F
Q P 1 P 2 = h c Δ T P 1 P 2
h c = 4 k P 1 k P 2 k P 1 + k P 2 ( 3 F N r * 4 E * ) 1 / 3
h P F = k F N u / d p
N u = 2 + 0.6 R e 1 / 2 P r 1 / 3 R e < 200
P r = C μ / k
where h P F is the convective fluid–particle heat transfer coefficient; A P is the particle surface area, mm2; Δ T P F is the temperature difference between the fluid and the particles, K; Q P 1 P 2 is the inter-particle heat flux, W/m2; h c is the conductive heat transfer coefficient between two particles; Δ T P 1 P 2 is their temperature difference, K; k p is the thermal conductivity of the particles; F N is the normal force, N; r * is the geometric mean of the particles radii, mm. The bracketed term in the equation models the contact area between two particles. Finally, K F is the gas thermal conductivity of the fluid; N u is the Nusselt number; d p is the particle diameter, mm; R e is the Reynold’s number based on the diameter of the individual phase and the relative velocity | v p v g | ; and P r is the Prandtl number for the subsequent phase. The model presented does not consider conductive heat transfer from the particles to the geometry.

2.2. Particle Model

Yu tiger nut one seeds were used as test subjects. We randomly selected 1000 tiger nut seeds for the test, and the length, width, and height of each seed were measured with vernier calipers. The seeds were categorized into flat, spheroid, and spherical, according to their shapes, as shown in Figure 1. Each seed was measured five times, and the average value was taken as the triaxial dimensions of the length, width, and height of the seeds. The triaxial dimensions of the seeds were also statistically analyzed to determine the distribution of the mean diameter of the seeds, as shown in Table 1.
The sphericity of tiger nut seeds is as follows:
S p = ( L D H ) 1 / 3 L × 100 %
where S p is sphericity, %; L is seed length, mm; D is seed width, mm; and H is seed height, mm.
From Equation (21), the tiger nut seed sphericity is 84%. To make the simulation more realistic, the three common tiger nut seed shapes and sizes described above are used, as shown in the top row in Figure 2. In the DEM simulation, seed particles are filled by a combination of multi-spherical surfaces to generate a particle model in the EDEM 2022 software.

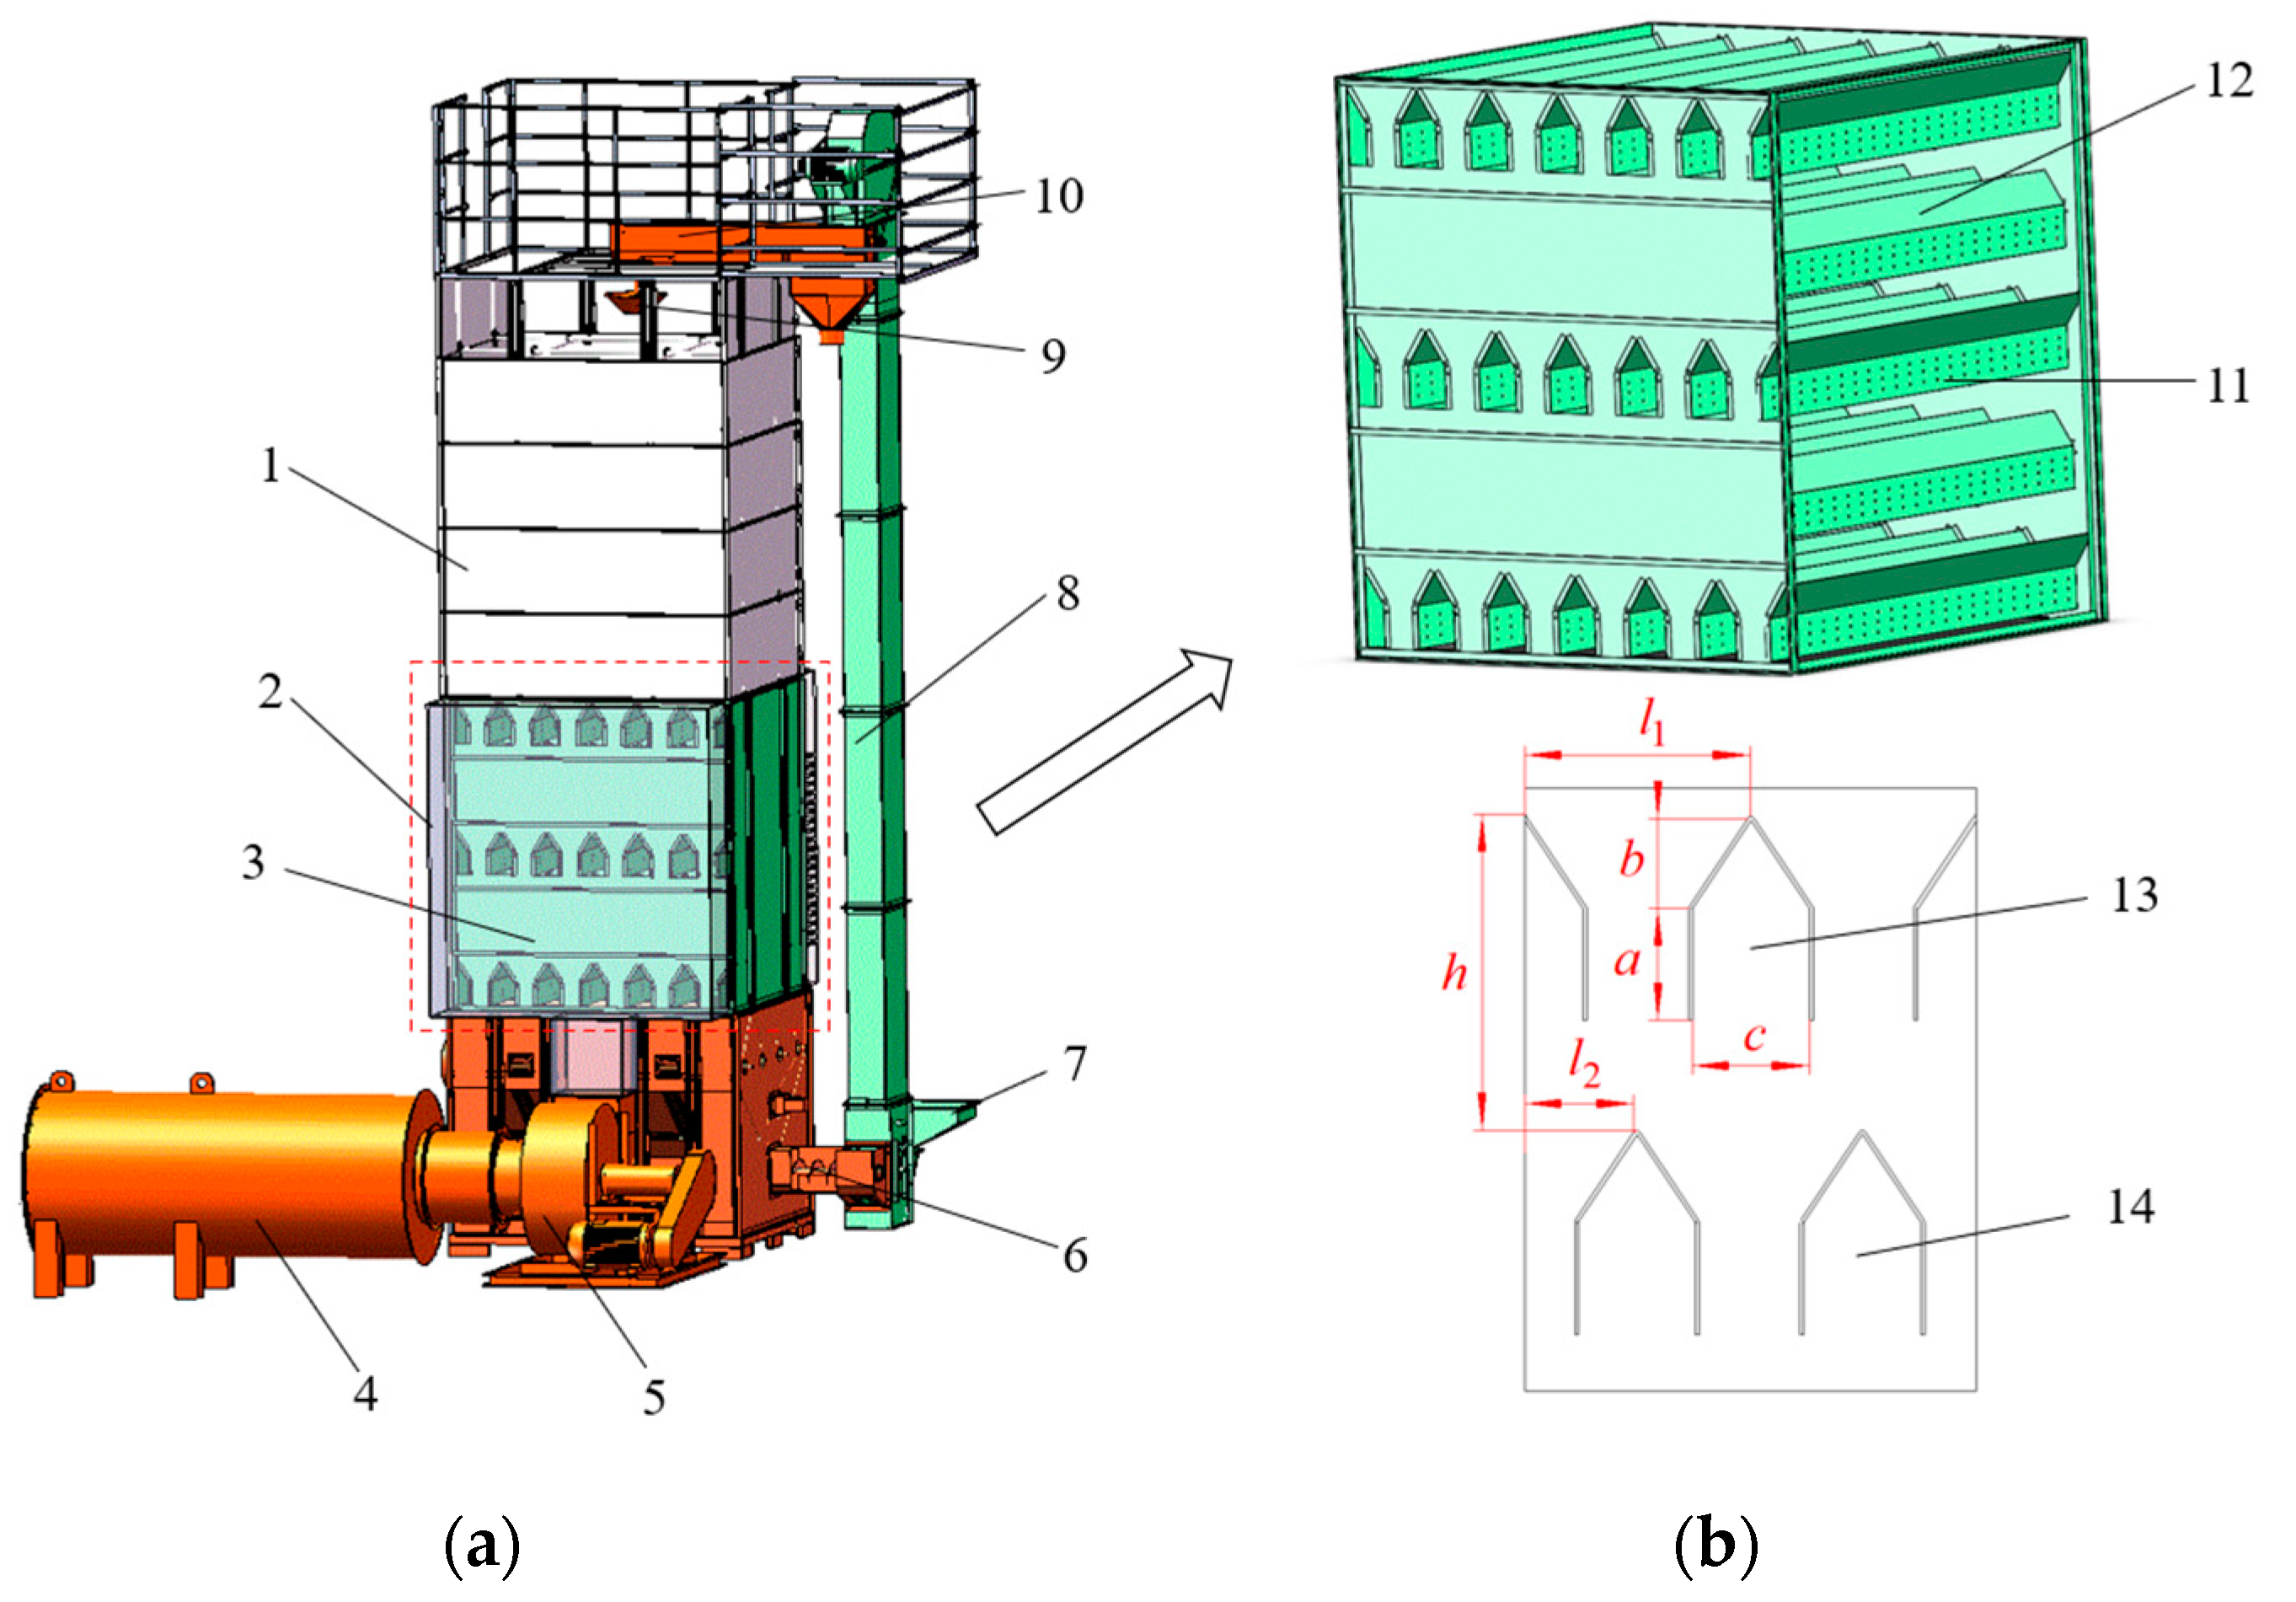
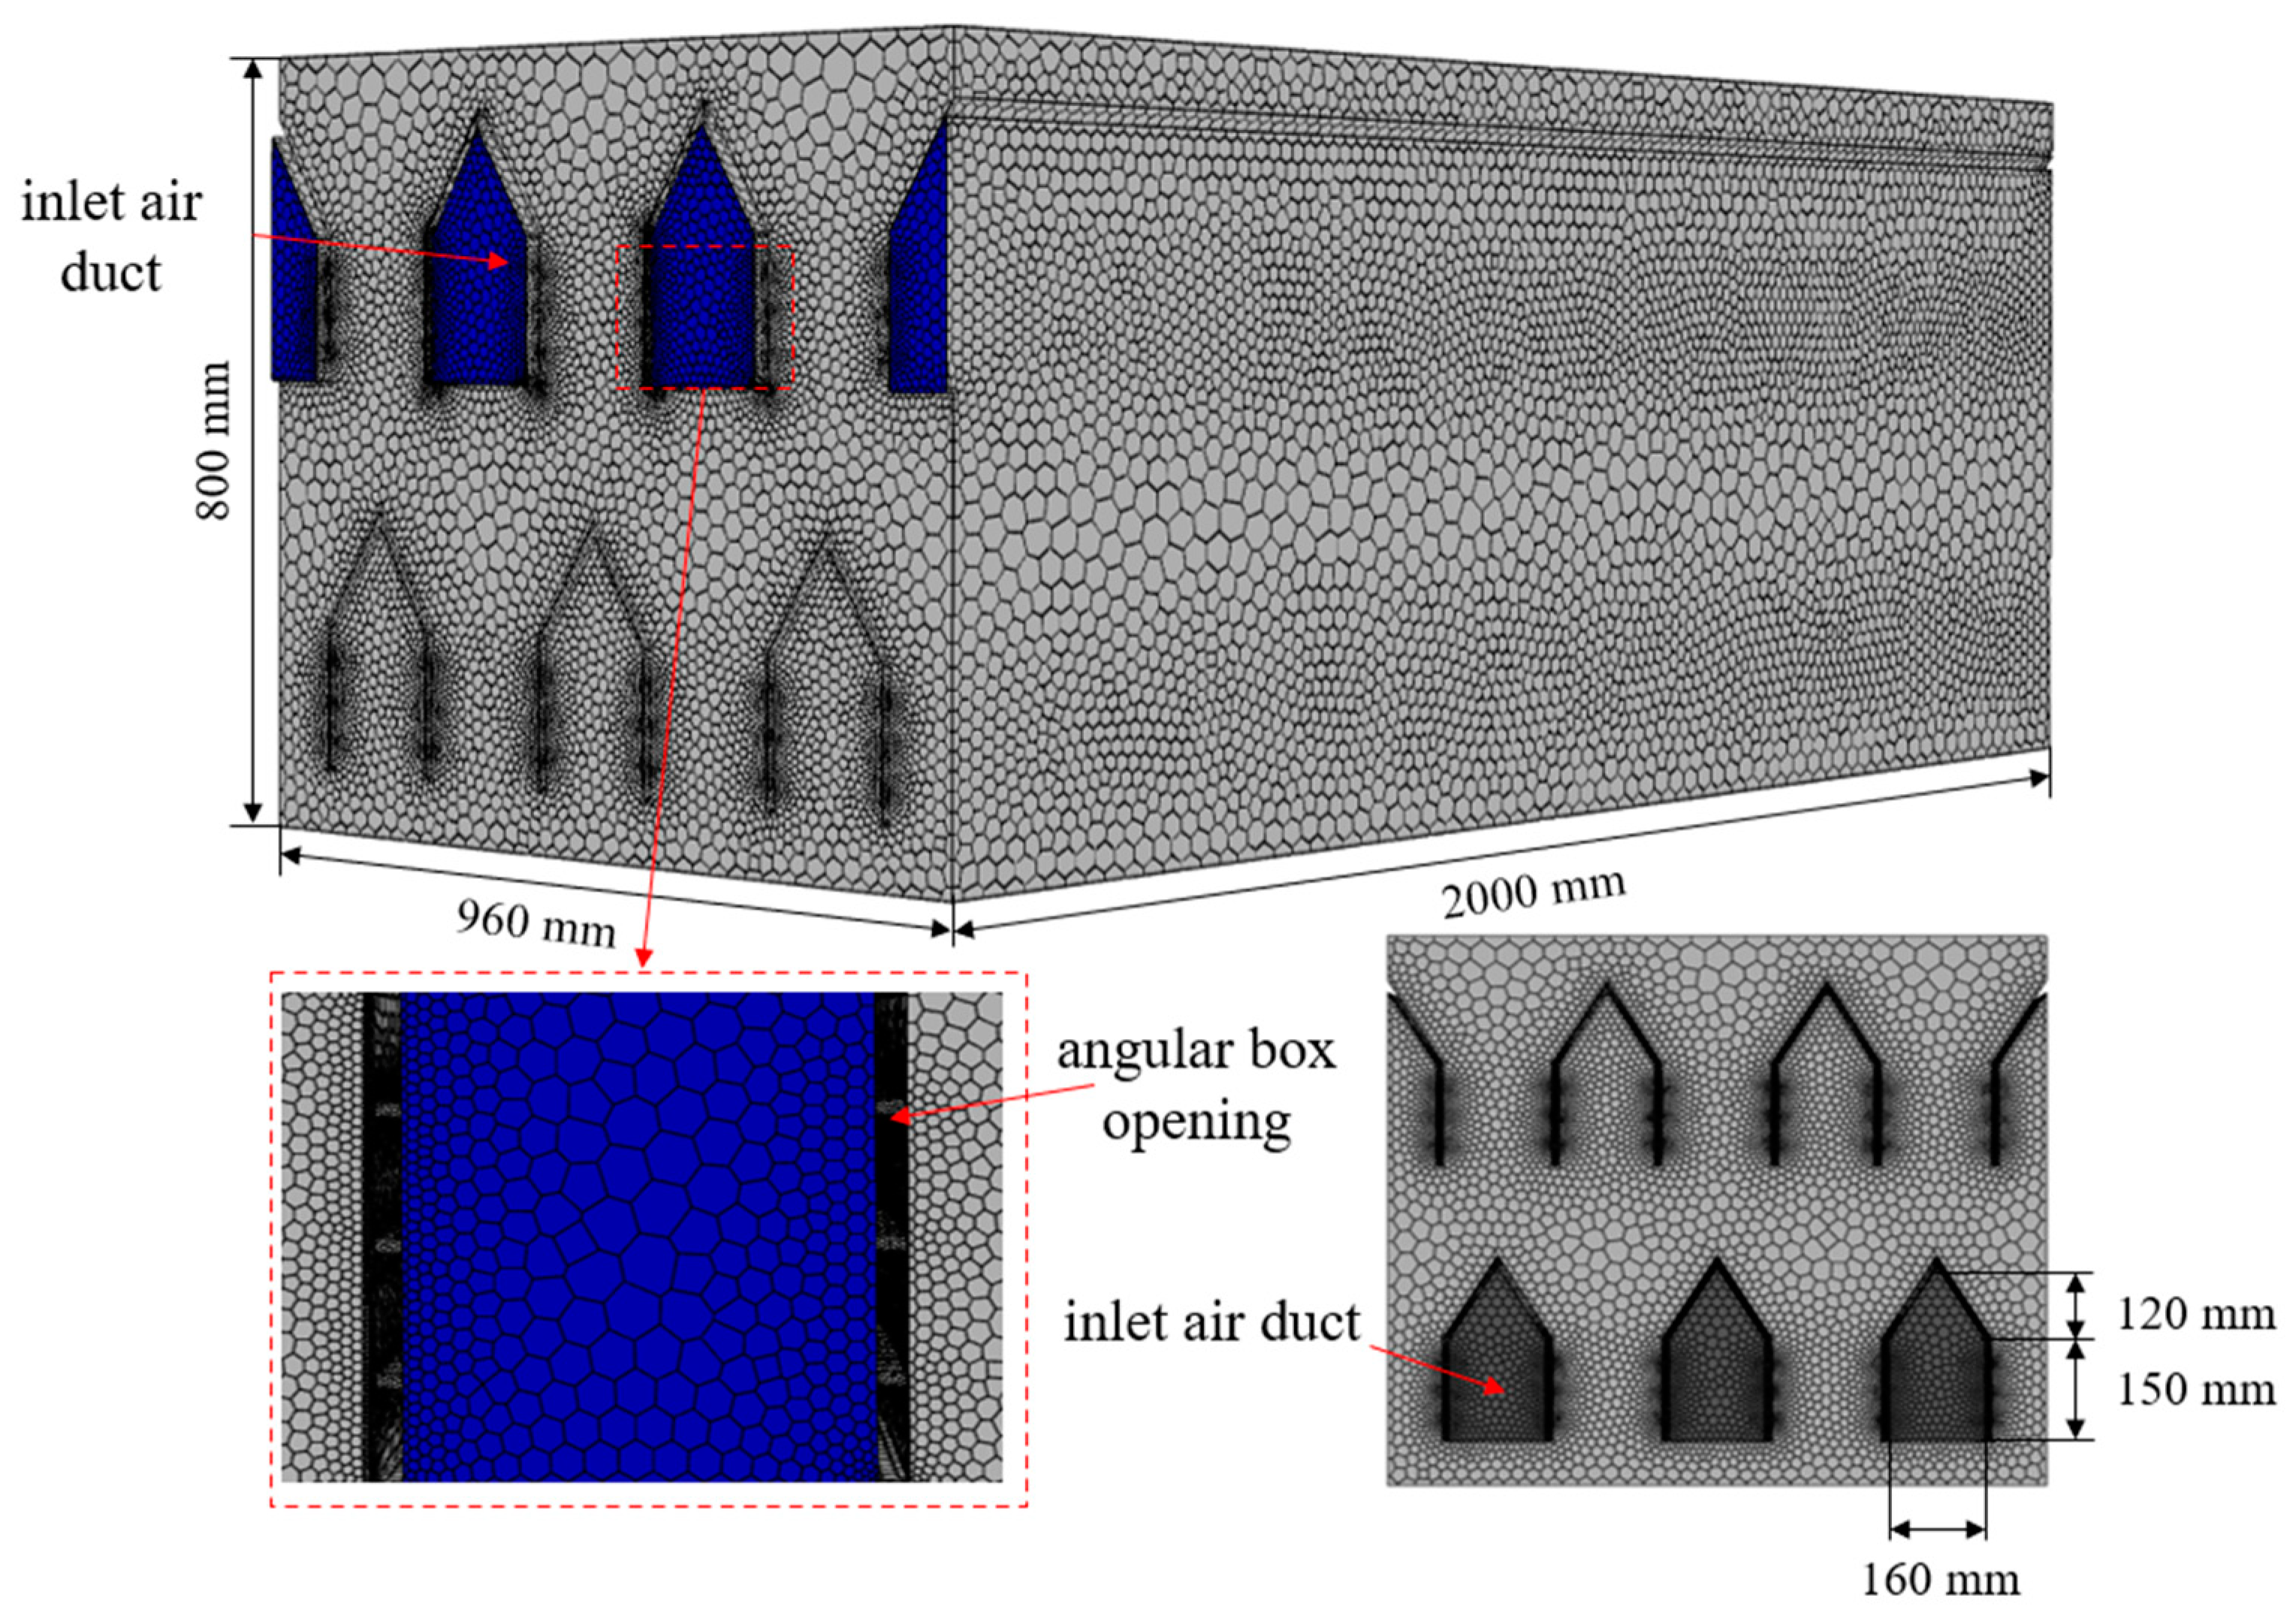
2.3. Geometric Model
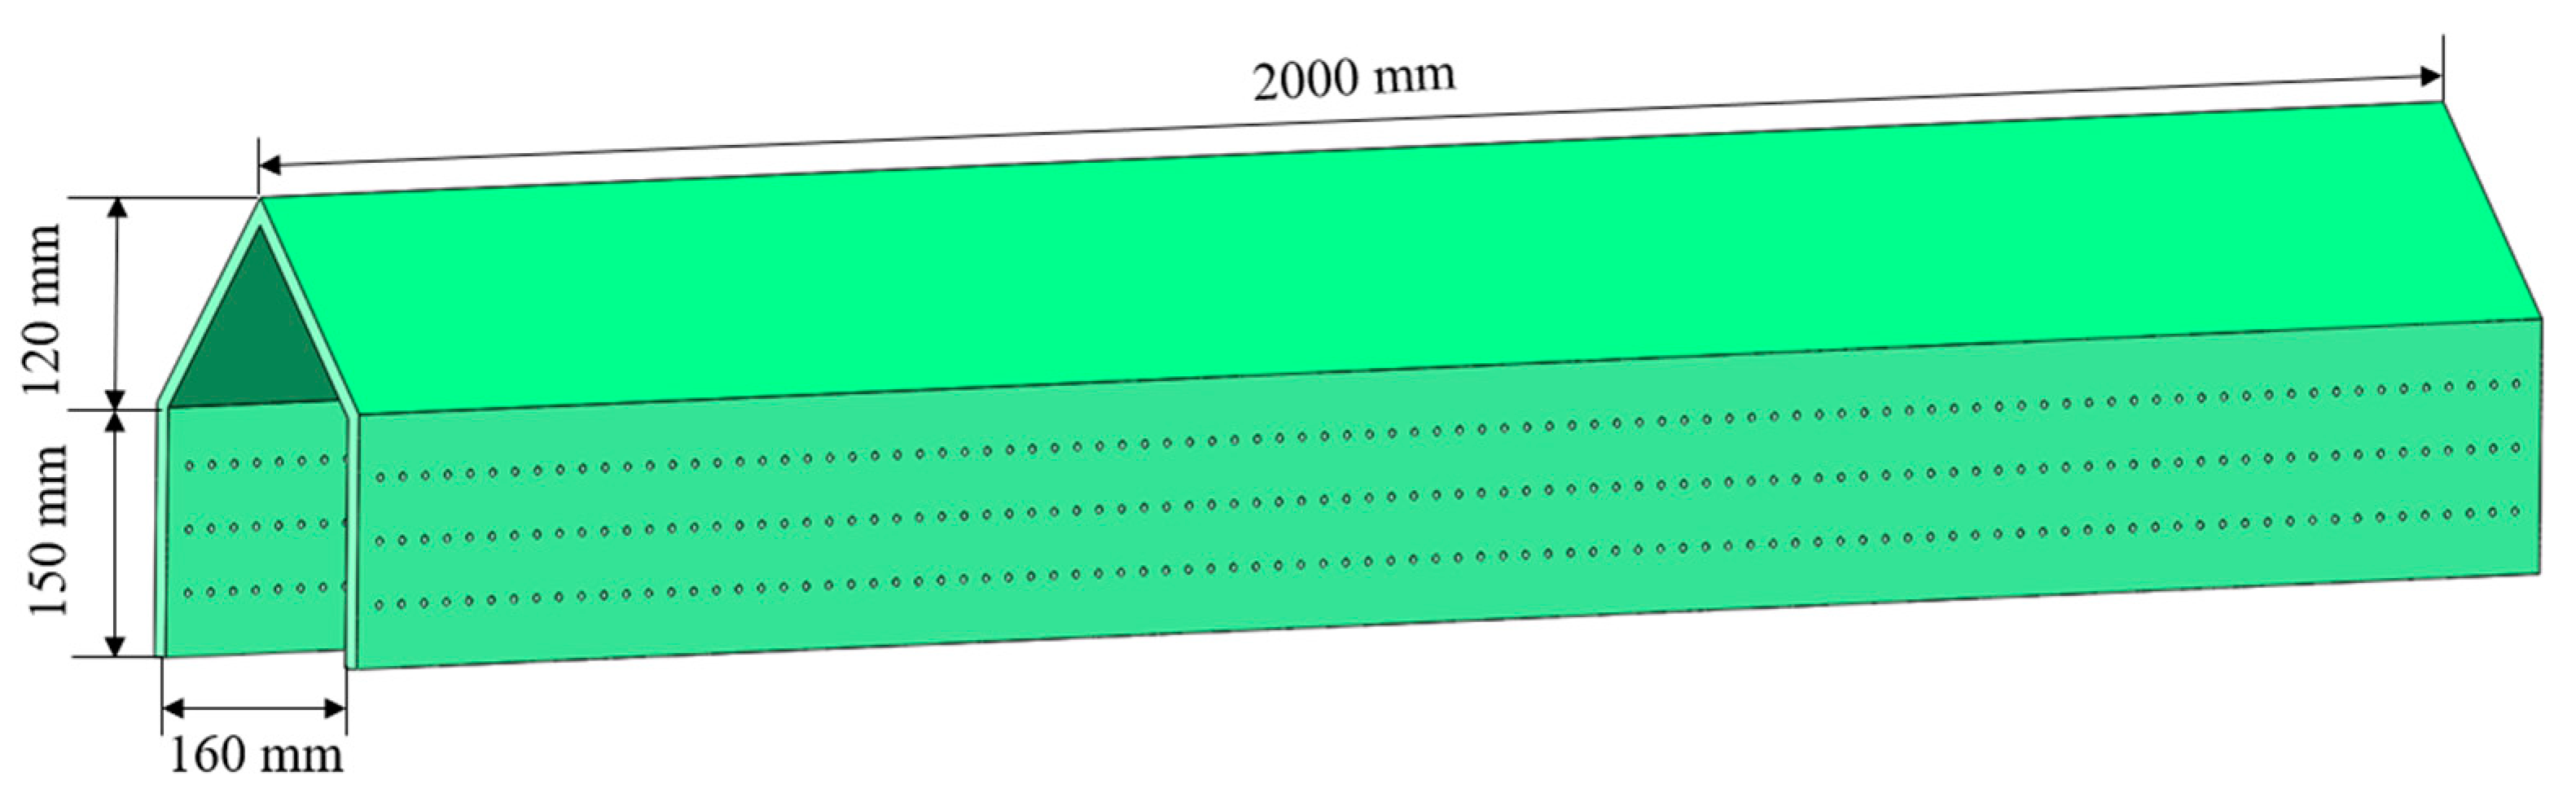
2.3.1. Corner Box

As shown in Figure 3, the tiger nut mixed-flow drying tower consists of a slow suction section, air inlet duct, drying chamber, natural gas burner, hot air blower, discharge screw conveyor, feed inlet, bucket elevator, equalizer, feed screw conveyor, corner box opening, corner box, air inlet, air outlet, and so on. When the mixed-flow drying tower works, tiger nuts enter the drying tower from the feed opening and are lifted to the top of the drying tower by the bucket elevator and feed screw conveyor. Under the grain equalizer, the tiger nuts fall into the inside of the tower. When the tiger nuts completely fill the drying tower, the hot air enters the drying room from the inlet corner box to exchange moisture and heat with the tiger nuts, and the water vapor is discharged from the drying room through the outlet corner box. When the temperature of hot air reaches the set value, the discharge screw conveyor and six impellers start to run, and the tiger nuts fall to the bottom of the tower and return to the bucket elevator through the discharge screw conveyor. Tiger nuts continuously move from top to bottom through the slow suction section, the drying chamber of the operation process, until the moisture content of the tiger nuts meets the drying requirements.
The design of the corner tube is based on the Danish CIMBRIA and Swedish SVEGMA manuals, which cover machine type and drying technology [28]. The design of corner boxes adheres to the principle that relates wind pressure and medium flow rate. The corner box has a length of 2000 mm, a width c of 160 mm, a height a of 150 mm, and a height b of 120 mm, as shown in Figure 3b, drawing on the design concept of an air distribution board in a fluidized bed dryer. The open-hole corner box is designed with the principle of negative pressure microporous air supply. The formula for calculating the opening rate of the corner tube in the vertical box dryer is as follows:
α = ζ ρ g μ 1 2 2 g Δ P D S C 1 2
Among them:
R S C = 0.01 + 0.2 1 e 0.5 S H
Δ P B = L mf 1 ε mf ρ s ρ g
ε mf = 1 14 φ s 1 3
where α is the opening rate, %; ξ is denotes the side resistance coefficient of the corner box, 1.5~2.5; ρ g is the hot air density, measured in kg/m3, determined to be 0.972 kg/m3; μ 1 is no-load airflow velocity, m/s; Δ P D S C is the corner box side critical pressure drop, Pa; R S C is the parameter related to the bed diameter, D, and bed height, L. It can be approximated as the parameter related to the size of the drying chamber structure of the vertical dryer. S is the bottom circumference of the drying section, mm; H is the drying section height, mm; Δ P B is the theoretical bed pressure drop, Pa; L mf is the static height of the tiger nut in the drying chamber, and is approximately the thickness of the valley, mm; ρ s is the particle density of the tiger nut, 1.455 × 10 3 kg/m3; ε mf is the porosity of minimum fluidization velocity; φ s is the sphericity of solid particles, with tiger nut particles being irregular in shape, and its sphericity is 0.84.
According to the principle of a low aperture rate, the along-travel resistance of the open hole corner box is balanced with the static pressure difference across the micro-aperture to regulate the uniformity of the lateral wind field. The appropriate openings for the side panels of the corner box are calculated to be 1.9% to 4.7%. The three openings are determined to be 1.9%, 3.3%, and 4.7%, respectively, based on the percentage size of the orifice plate. The micropore diameter is 5 mm, and the size is smaller than the diameter of the tiger nut to prevent blockage during drying. Considering the size range of the side panels of the corner box, the number of micro-perforations corresponding to different opening rates is designed to be 290, 504, and 718, respectively. The schematic structure of the open-hole corner box is shown in Figure 4.

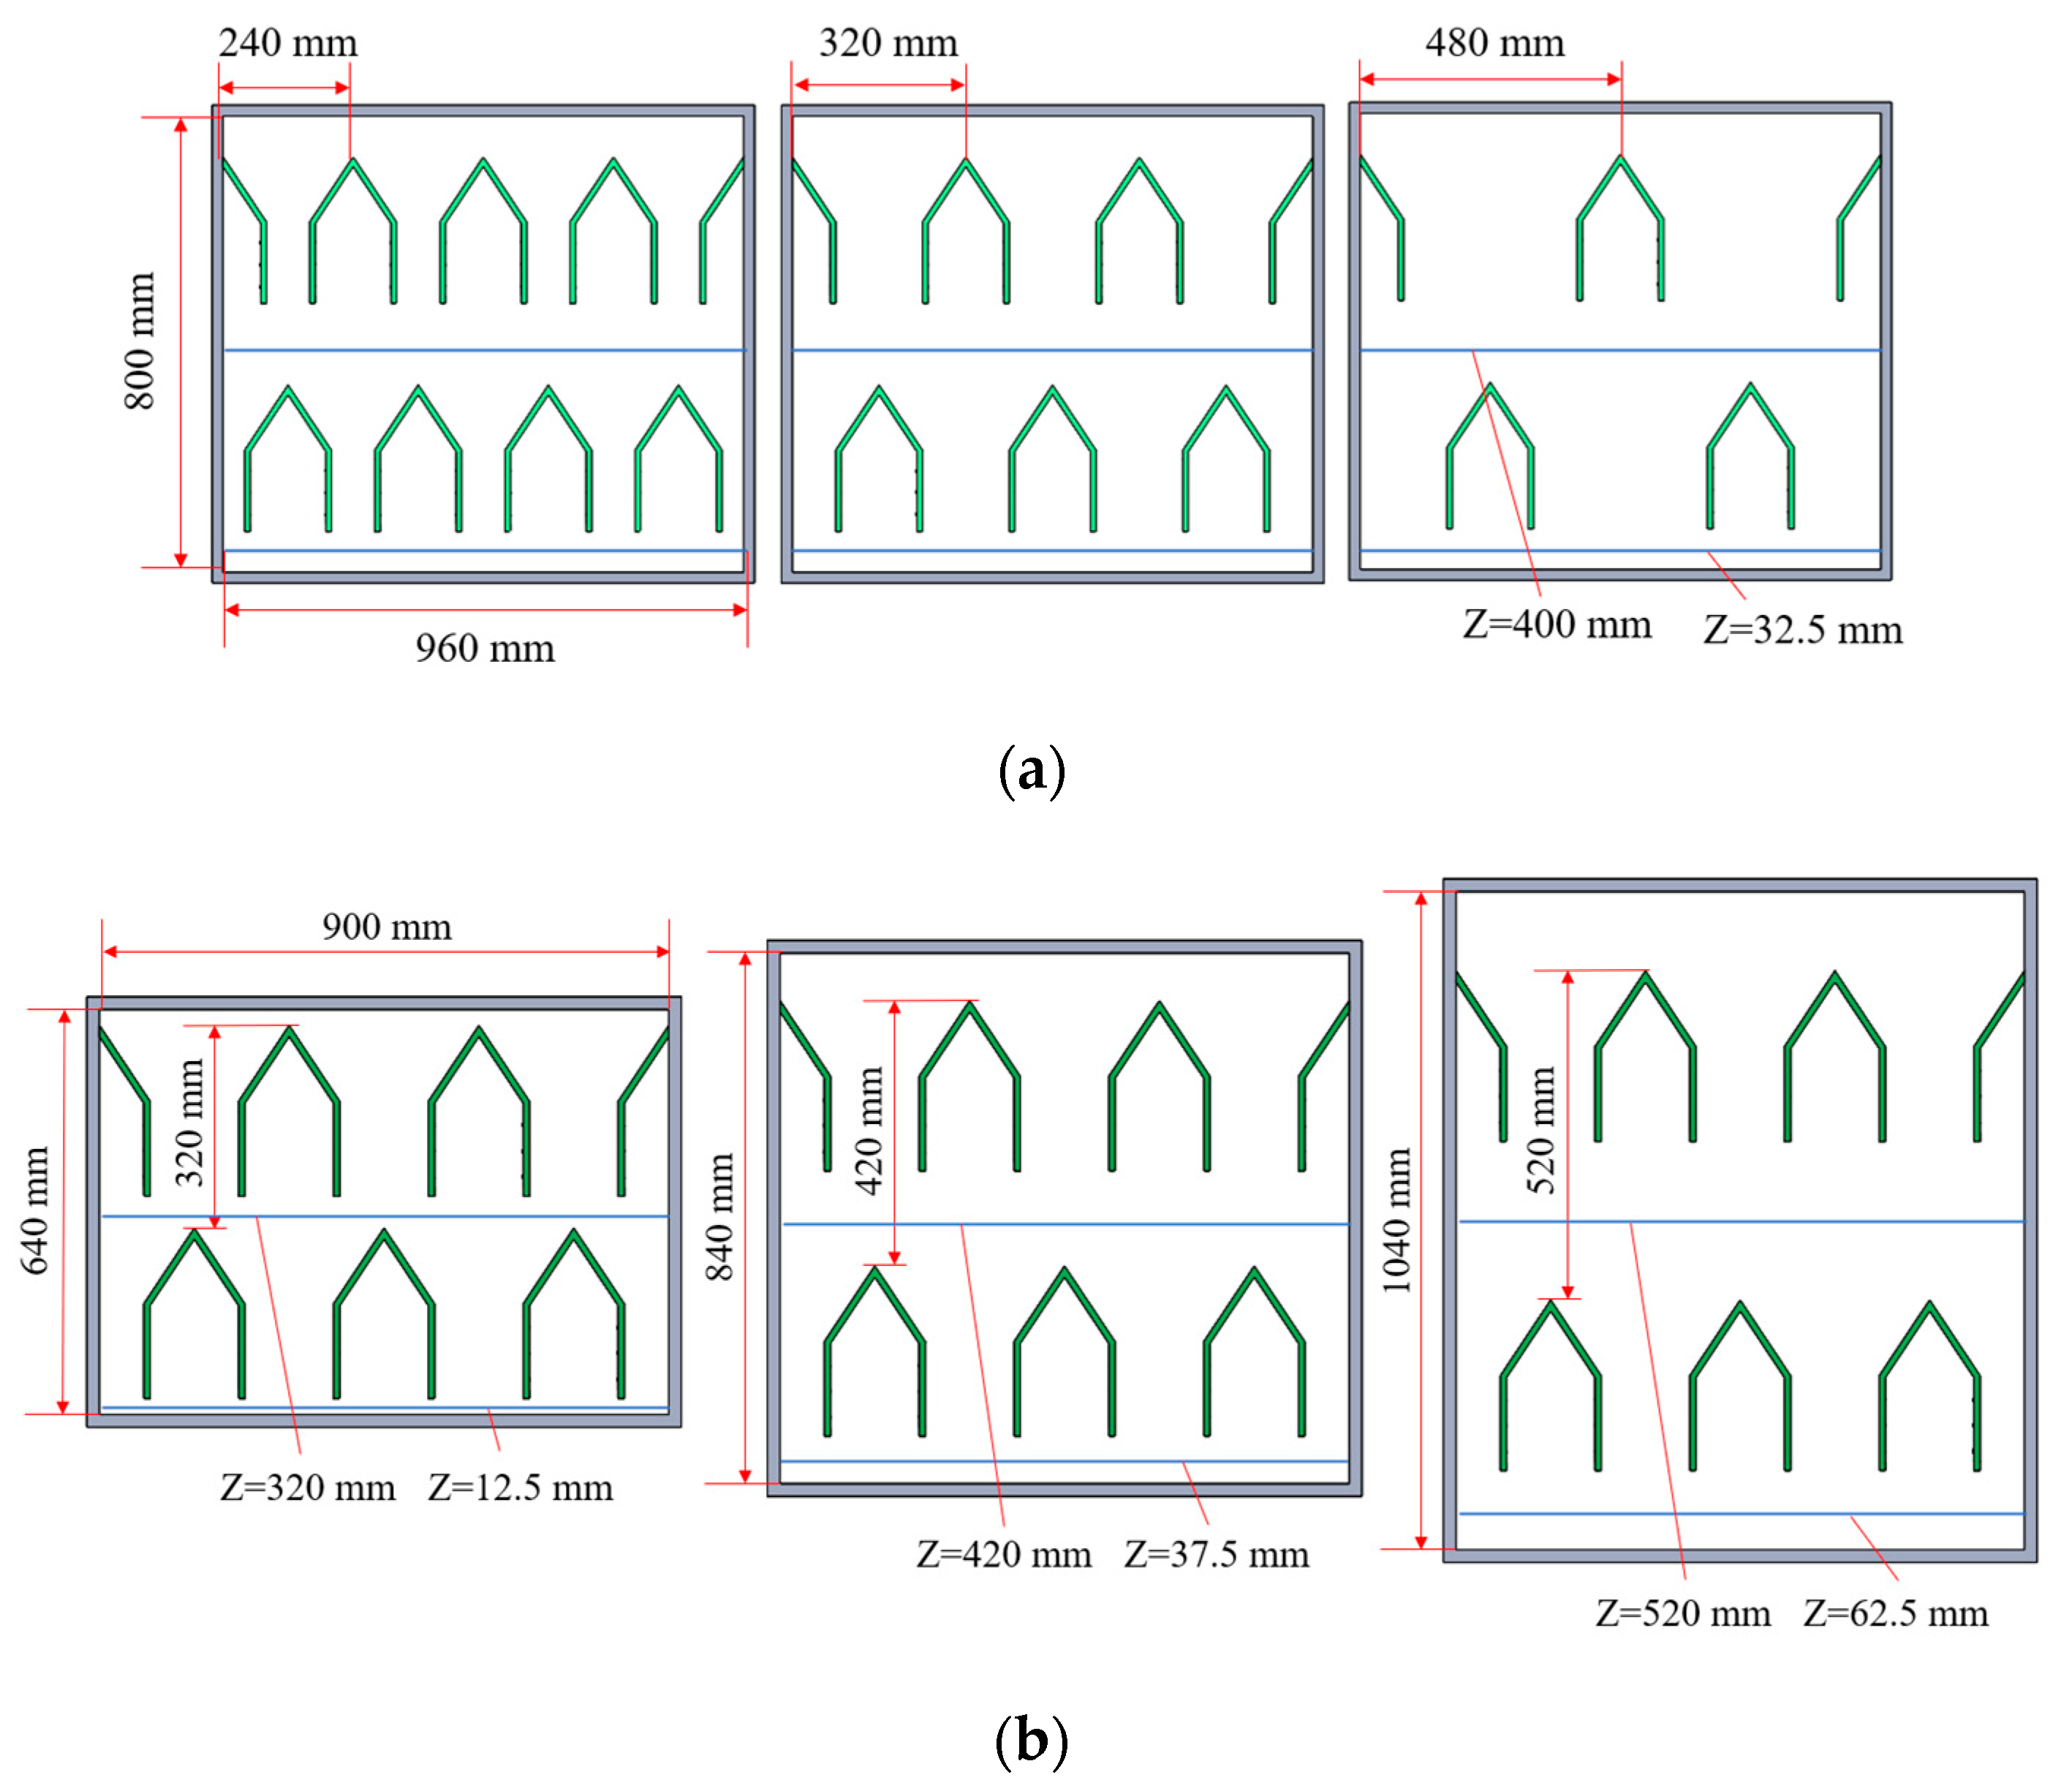
2.3.2. Corner Box Layout Analysis

In order to address the problems of clogging and uneven heating of tiger nuts in the drying chamber of the drying tower, the horizontal and vertical spacing of the corner boxes in the drying chamber are designed by optimizing the design. This improves the movement, heat condition, and airfield distribution of tiger nut particles inside the drying chamber of the drying tower. From the literature [29], it is known that the horizontal spacing of the corner box in the drying tower chamber ranges from 200 to 500 mm, and the vertical spacing ranges from 290 to 550 mm. Considering the size of the drying tower chamber and the sizes of the tiger nuts on the corner box spacing design, spacings of 240 mm, 320 mm, and 480 mm are selected for the lateral simulation tests of the drying tower chamber, and 320 mm, 420 mm, and 520 mm are selected as the three vertical levels. In order to reduce the number of coupled simulation calculations, the length of the drying chamber is determined to be 960 mm, and the height is 800 mm when studying the impact of horizontal spacing. When studying the effect of vertical spacing, the length of the drying chamber is determined to be 900 mm, and the height values are determined to be 640, 840, and 1040 mm, respectively, as shown in Figure 5.

2.4. Simulation Conditions

CFD-DEM is based on ANSYS Fluent 2022 and EDEM 2022 software. First, Fluent meshing in ANSYS is utilized to perform meshing, and mesh encryption is performed on the corner box opening portion. The corner box inlet is set as the velocity inlet boundary condition and the corner box outlet is set as the pressure outlet boundary condition, as shown in Figure 6. The standard k-ε turbulence model in ANSYS, the SST k-omega equation, is used as the turbulence model. The Ranz and Marshall heat transfer model and multicomponent model [15,16,17,18,19] are used because heat and mass transfer are considered in the work. In the component set, two compositions are identified: the evaporable component of water and a non-evaporable component of tiger nuts; the composition ratio is 45% and 55%, respectively. They represent the initial water content of the tiger nut and the other parameters of the tiger nut, as referred to in the literature [30]. The inlet air velocity and temperature are set according to preliminary tests and by consulting references [28,31,32]. All CFD input parameters and boundary conditions are shown in Table 2.
In EDEM, the material of the drying tower is set as a steel plate, and the detailed parameters of DEM are shown in Table 3. During the working process, the seeds may slide, roll, collide, extrude, and perform other motions in the device. Therefore, intrinsic (e.g., Poisson’s ratio, density, etc.) and operating (e.g., the coefficient of rolling friction, coefficient of sliding friction, etc.) parameters need to be set for both the seed and the drying device. Heat and mass transfer between the seeds also need to be taken into account. So, opening the heat conduction model and temperature update model, as well as setting parameters, such as thermal conductivity and specific heat capacity in EDEM 2022 software, are necessary. The water content of the tiger nut particles is set in the particle parameters, which are added to the particle factory by Fluent after coupling. The DEM parameters used for the tiger nut particles are referenced in [33,34] in Table 3. Before the coupling simulation, it is necessary to pre-fill the drying chamber with tiger nuts in order to make the tiger nuts completely stationary at the time of coupling; the particle generation time is 3 s, and the total simulation time is 10 s.

2.5. Experiment

2.5.1. Materials

The raw material for the experiment was fresh tiger nuts harvested in October 2023 from Shangqiu City, Henan Province, and the variety was Yu tiger nut I. The tiger nuts were ellipsoidal, with an average mass of 1.13 g/pc, an average geometric diameter of 10.99 mm, a density of 1.17 g cm−3, a wet basis moisture content of 45% (103 ± 2 °C constant weight method), and an angle of repose of 32.91°. The tiger nuts were cleaned using a cylindrical primary cleaning sieve to remove dust and cilia from the surface and obtain uniform and full tiger nuts. The moisture content was determined according to the direct drying method outlined in GB5009.3-2016, regarding the determination of moisture in food. The tiger nuts were dried in an oven at 105 °C until a constant mass was achieved. The drying equipment used for the tiger nut samples was a JK-KB1700 thin layer drying test bed (National Engineering Laboratory of Grain Storage and Transportation, Changchun, China), with a wind temperature range between 20 °C and 100 °C (±1 °C), a humidity range between 20 and 80% RH (±4% RH), and a wind speed range between 1.0 and 3.2 m/s. There are two methods to express the moisture content of a material, namely the dry basis method and the wet basis method. The dry basis expression is calculated on the basis of the solid dry matter in the material, and the wet basis expression is calculated on the basis of the material’s mass. The wet basis moisture content was used in this test, and the wet basis moisture content can be expressed by Equation (23):
M w = m w m s + m w
where M w is the wet basis moisture content, %; m w is the mass of moisture contained in tiger nuts, g; and m s is the mass of dry matter contained in tiger nuts, g.

2.5.2. Experiment Equipment

In order to verify the accuracy of the simulation, drying experiments were conducted using the experimental platform shown in Figure 7. The experimental equipment consisted of four parts, i.e., a mixed-flow dryer, an airflow velocity measurement system, a temperature acquisition system, and an information processing system.
In order to verify the simulation results of the temperature field and wind field inside the drying chamber, the K-type thermocouple sensor and the hot-wire air velocity sensor were fixed on the bottom surface of the inlet corner box (Z = 400 m), and the bottom surface of the outlet corner box (Z = 32.5 mm), respectively. As shown in Figure 5, the blue part shows the locations of 98 sampling points, including 49 monitoring points below the air inlet and 49 monitoring points below the air outlet.
The wind speed acquisition system includes the FY-CJ2 data collector (FY-CJ2, Wuhan Fuyuan Flying Fortress Electronic Technology Co., Ltd., Wuhan, China), a hot-wire wind speed sensor (Wuhan Fuyuan Flying Fortress Electronic Technology Co., Ltd., China), an industrial-grade USB-to-RS485 modular protocol converter, and an information processing system (ASUS ASUS Flying Fortress 6 ZX80G, ASUS, Taiwan, China). The temperature acquisition system consists of an LK1048U Multi-Circuit Temperature Inspector (LK1048U, Changzhou Blu-ray Electronics Co., Ltd., Changzhou, China), a K-Type Thermocouple Sensor (K-Type, Shanghai Song guide Heating Sensors Co., Ltd., Shanghai, China), and an industrial-grade USB-to-RS485 Module Protocol Converter and Information Processing System (ASUS ASUS Flying Fortress 6 ZX80G).

2.5.3. Experiment Method

The harvested tiger nuts are decontaminated and mixed thoroughly. Before the test, the moisture content of tiger nuts was measured three times using the JK-KB1700 thin-layer drying test bench, and the average value was taken as the initial moisture content of tiger nuts for the test and simulation. In the test, the horizontal spacing of the corner boxes in the drying chamber was 320 mm, the vertical spacing was 420 mm, and the opening rate of the corner boxes was 4.7%. The tiger nut drying test was carried out at the three-area experimental center of Henan Agricultural University, with an ambient temperature of about 15 °C, an ambient humidity of 15–25%, and cloudy weather. The drying validation test platform used the developed mixed-flow drying tower for tiger nuts, model 5HH-7.5. The hot air temperature and air velocity were monitored by temperature and humidity sensors, and air velocity sensors were mounted below the air intake chamber and the air intake angle-shaped tube. The heat source equipment was first turned on to bring the wind speed and heat medium temperature up to the required level, after which, grain loading was carried out. The timing started at the end of grain loading, the drying duration of each test was 1 h, and the test was conducted 8 times. At the end of the test, the moisture content of tiger nuts was measured three times, and the average value was taken as the moisture content of tiger nuts after drying.

3. Results and Discussion

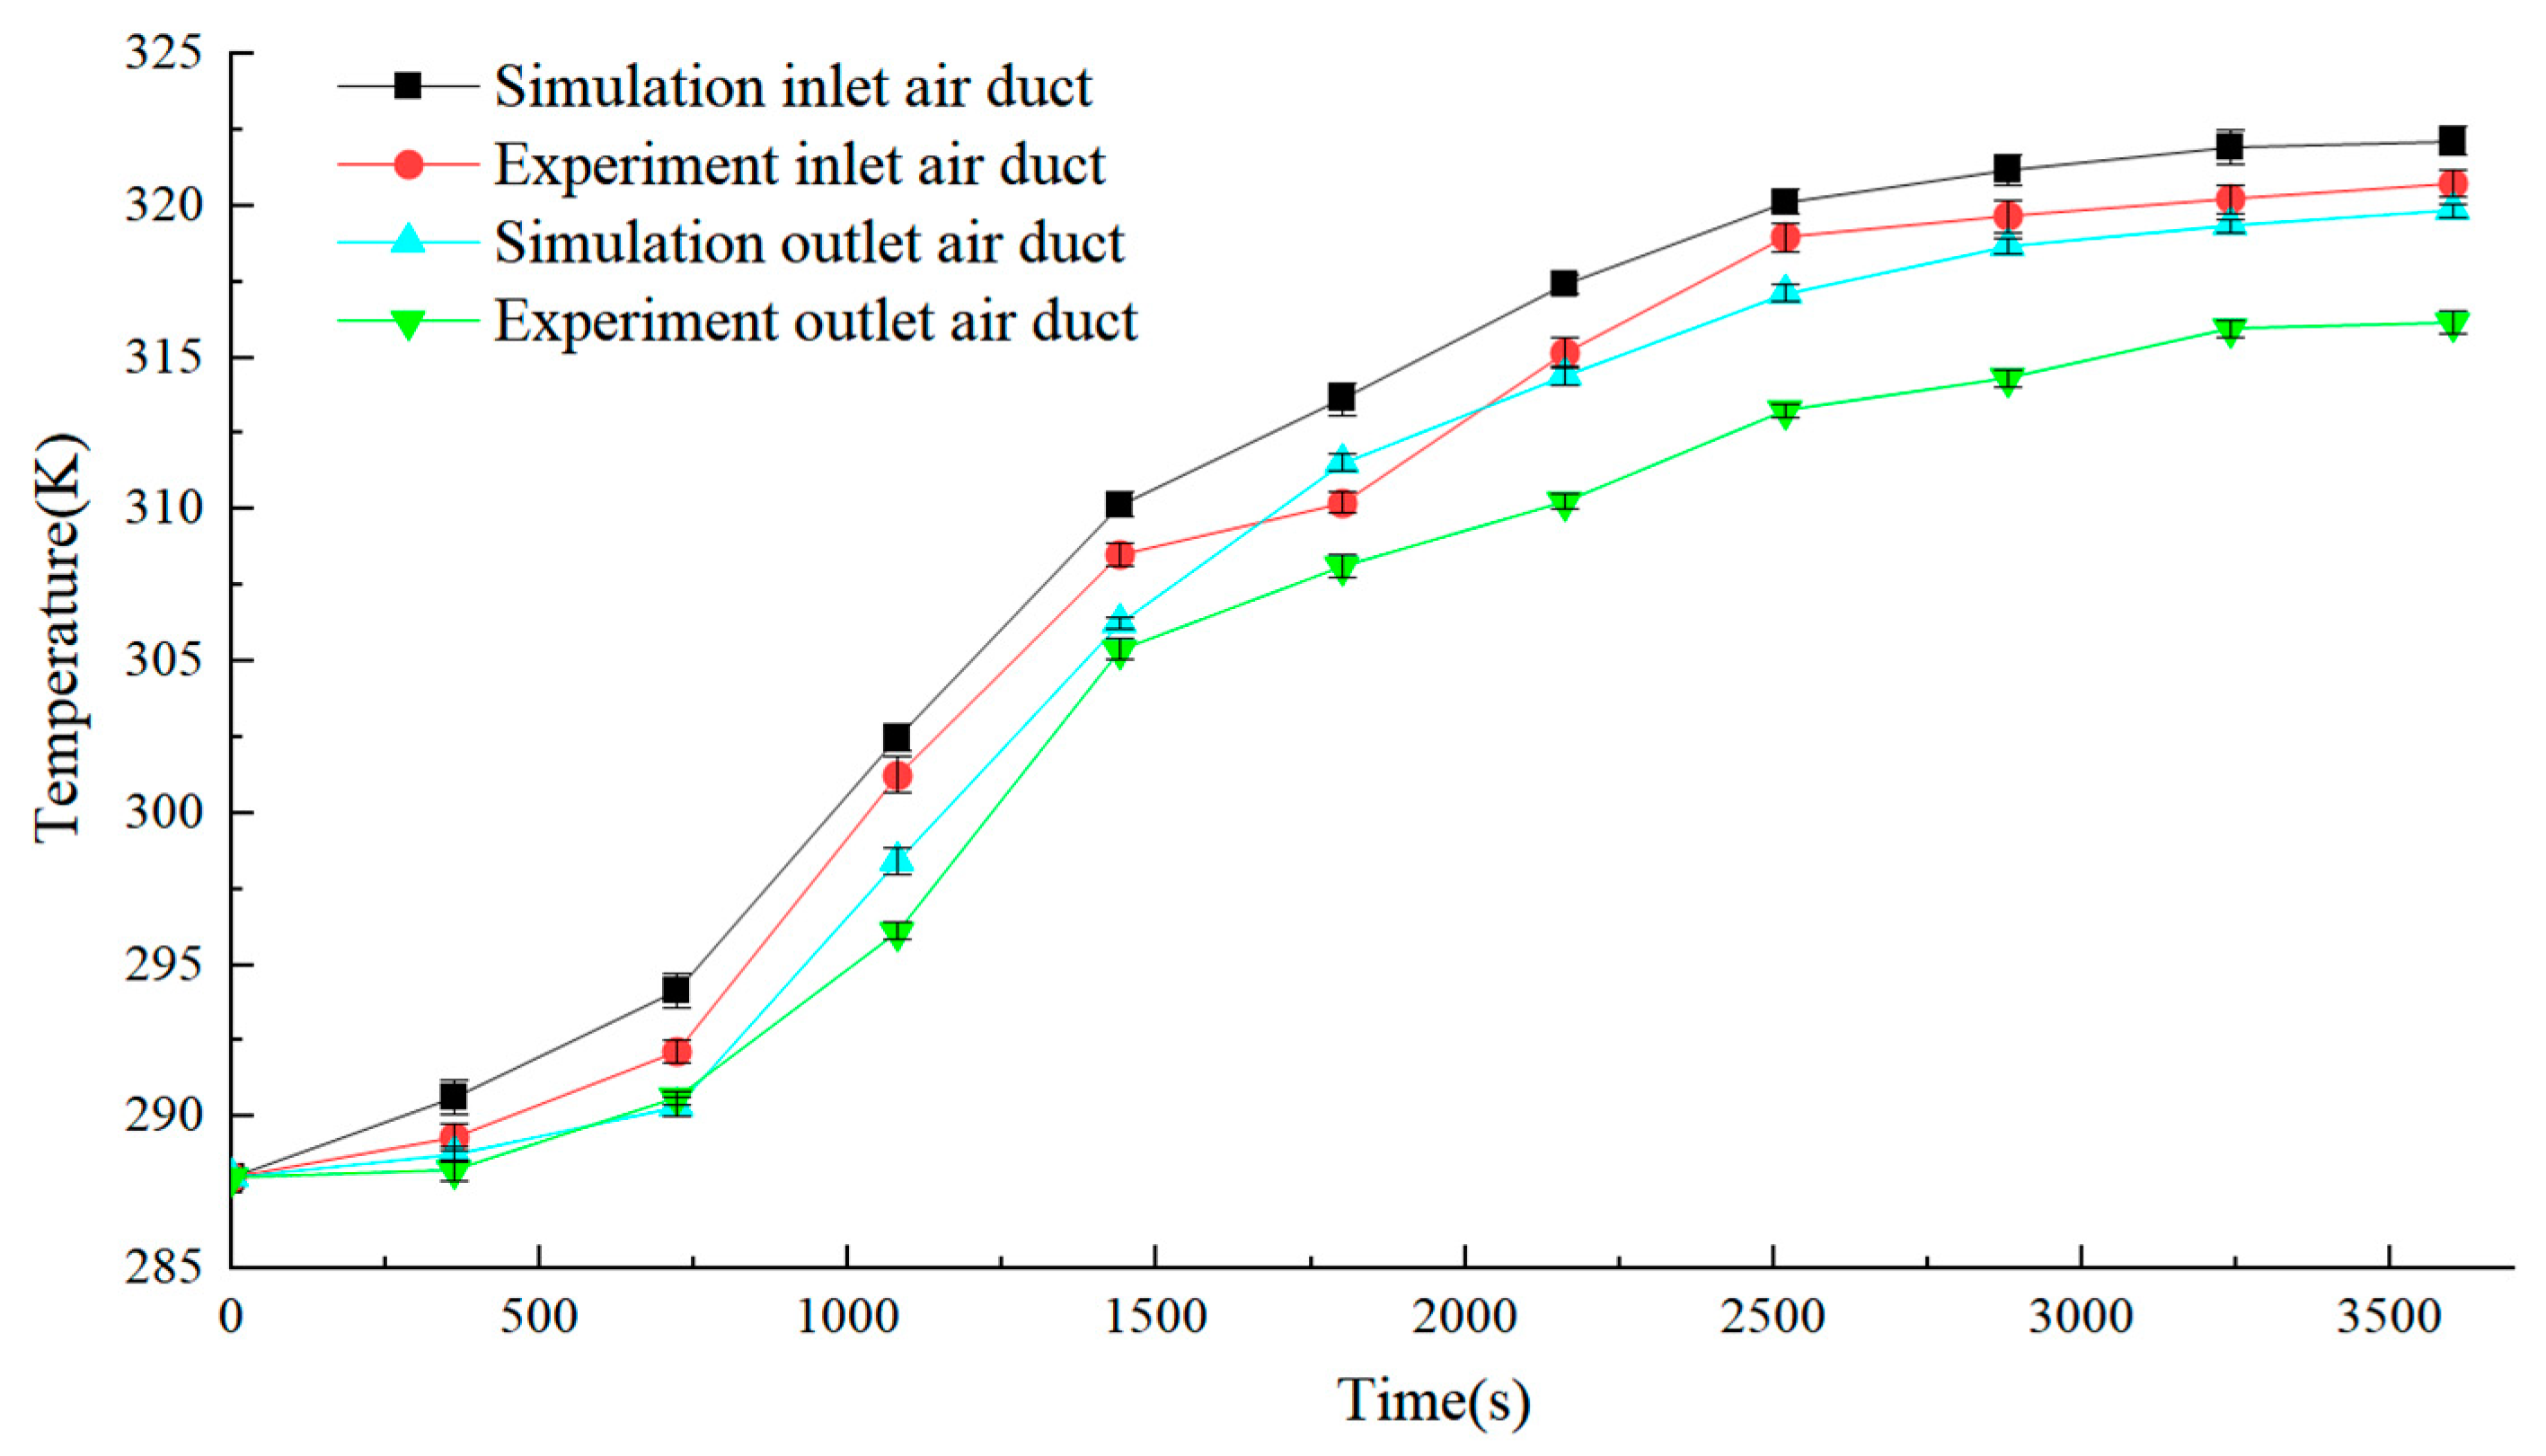
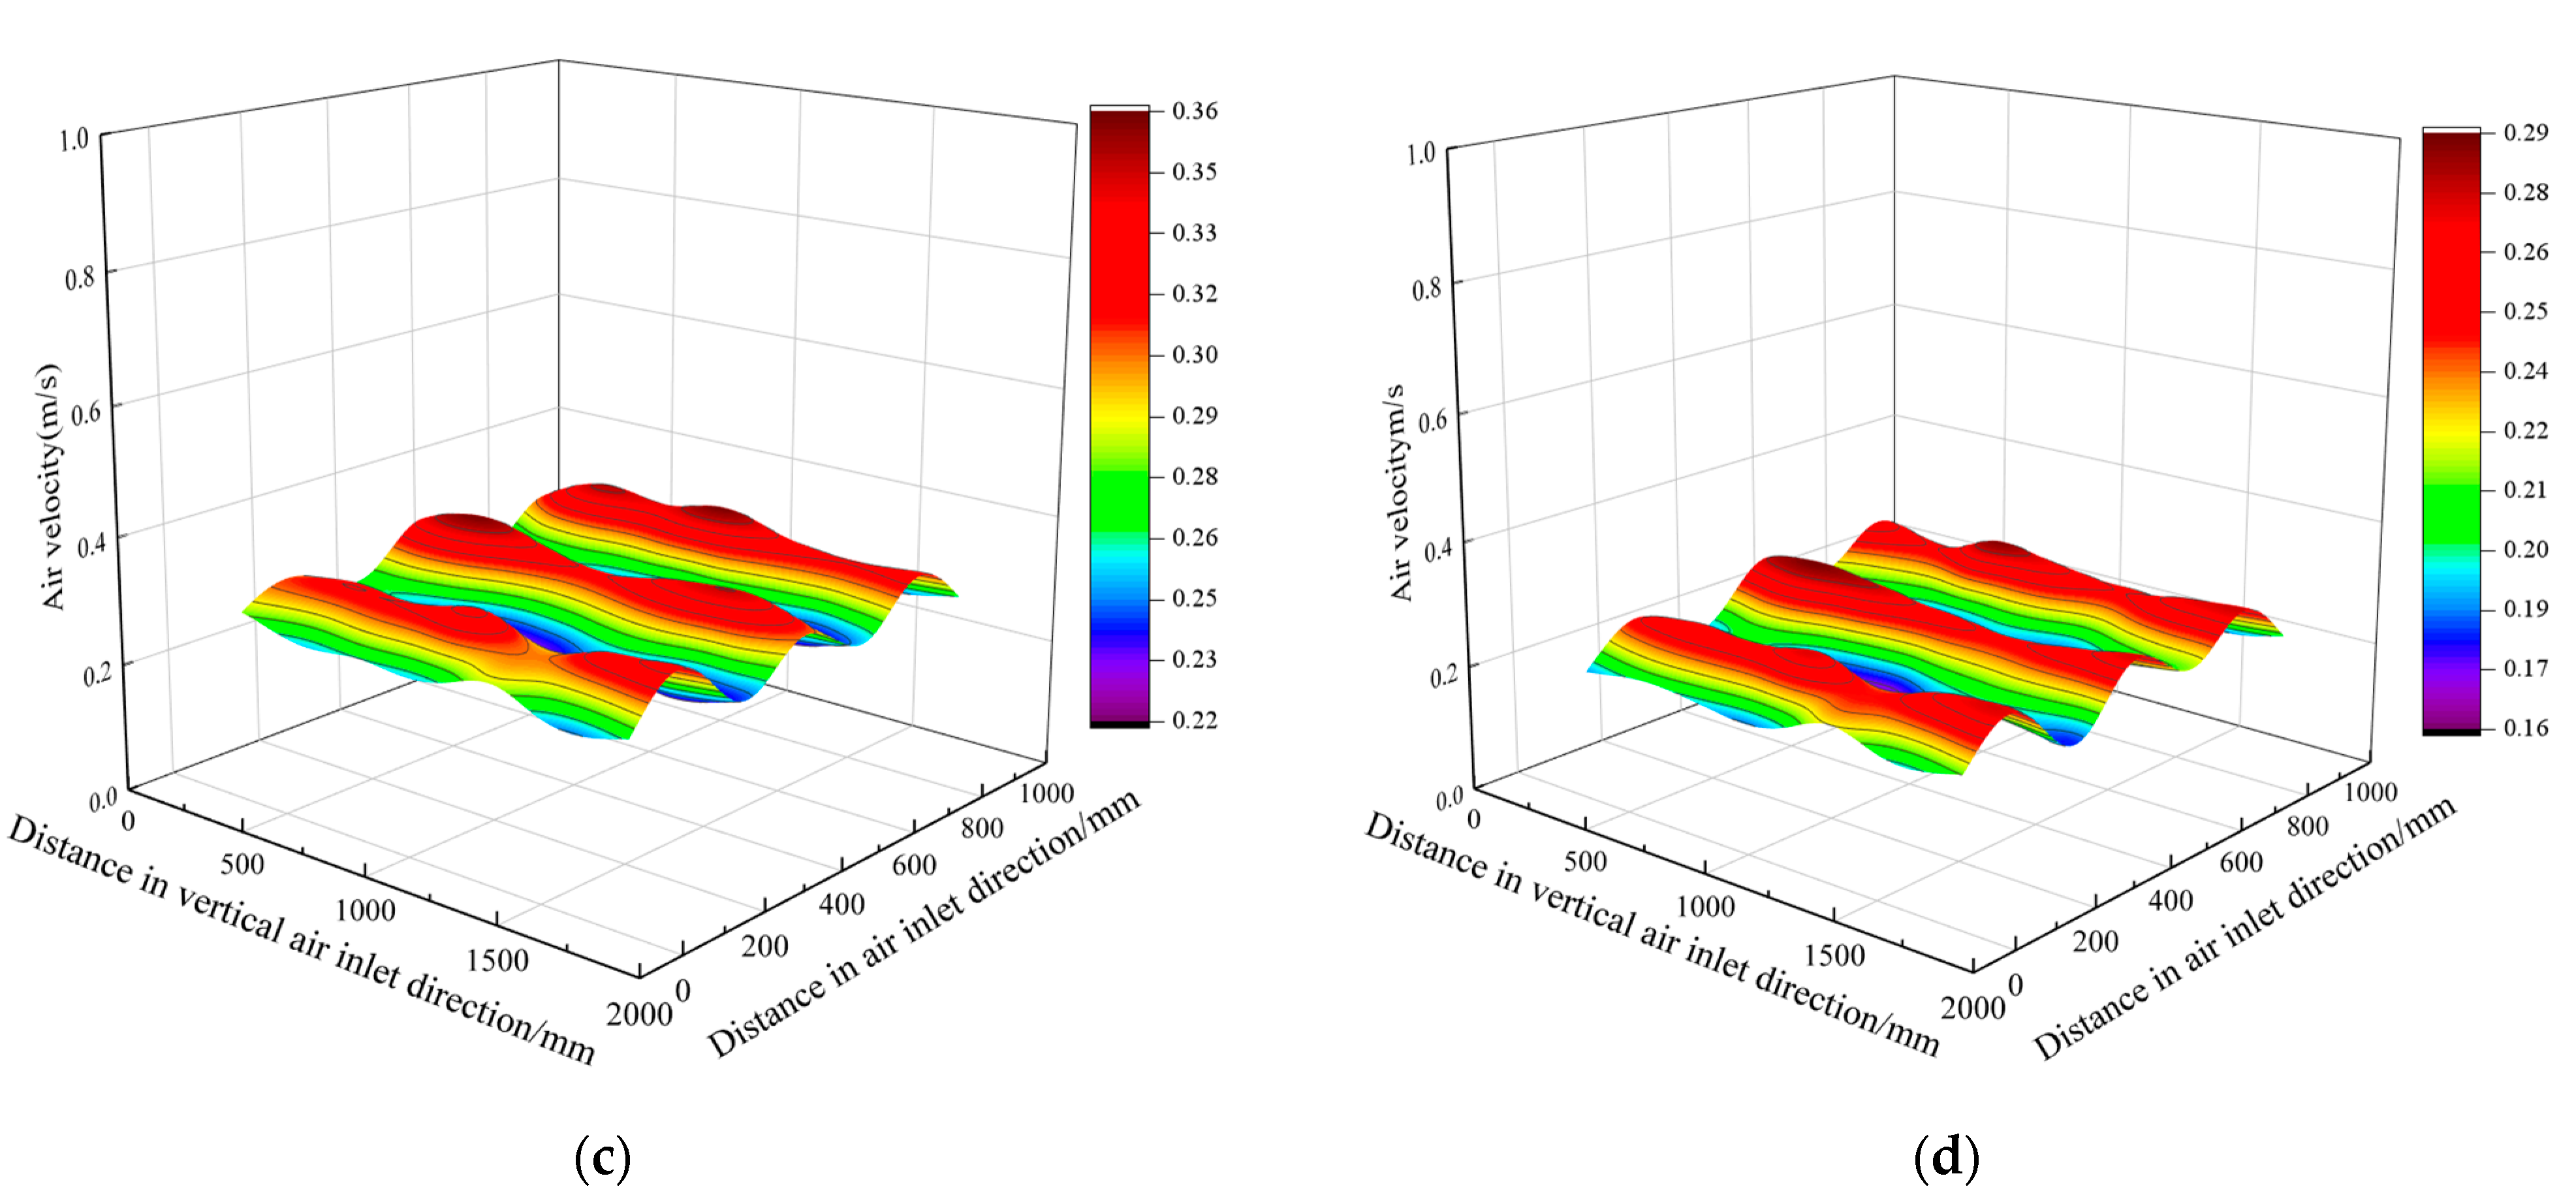
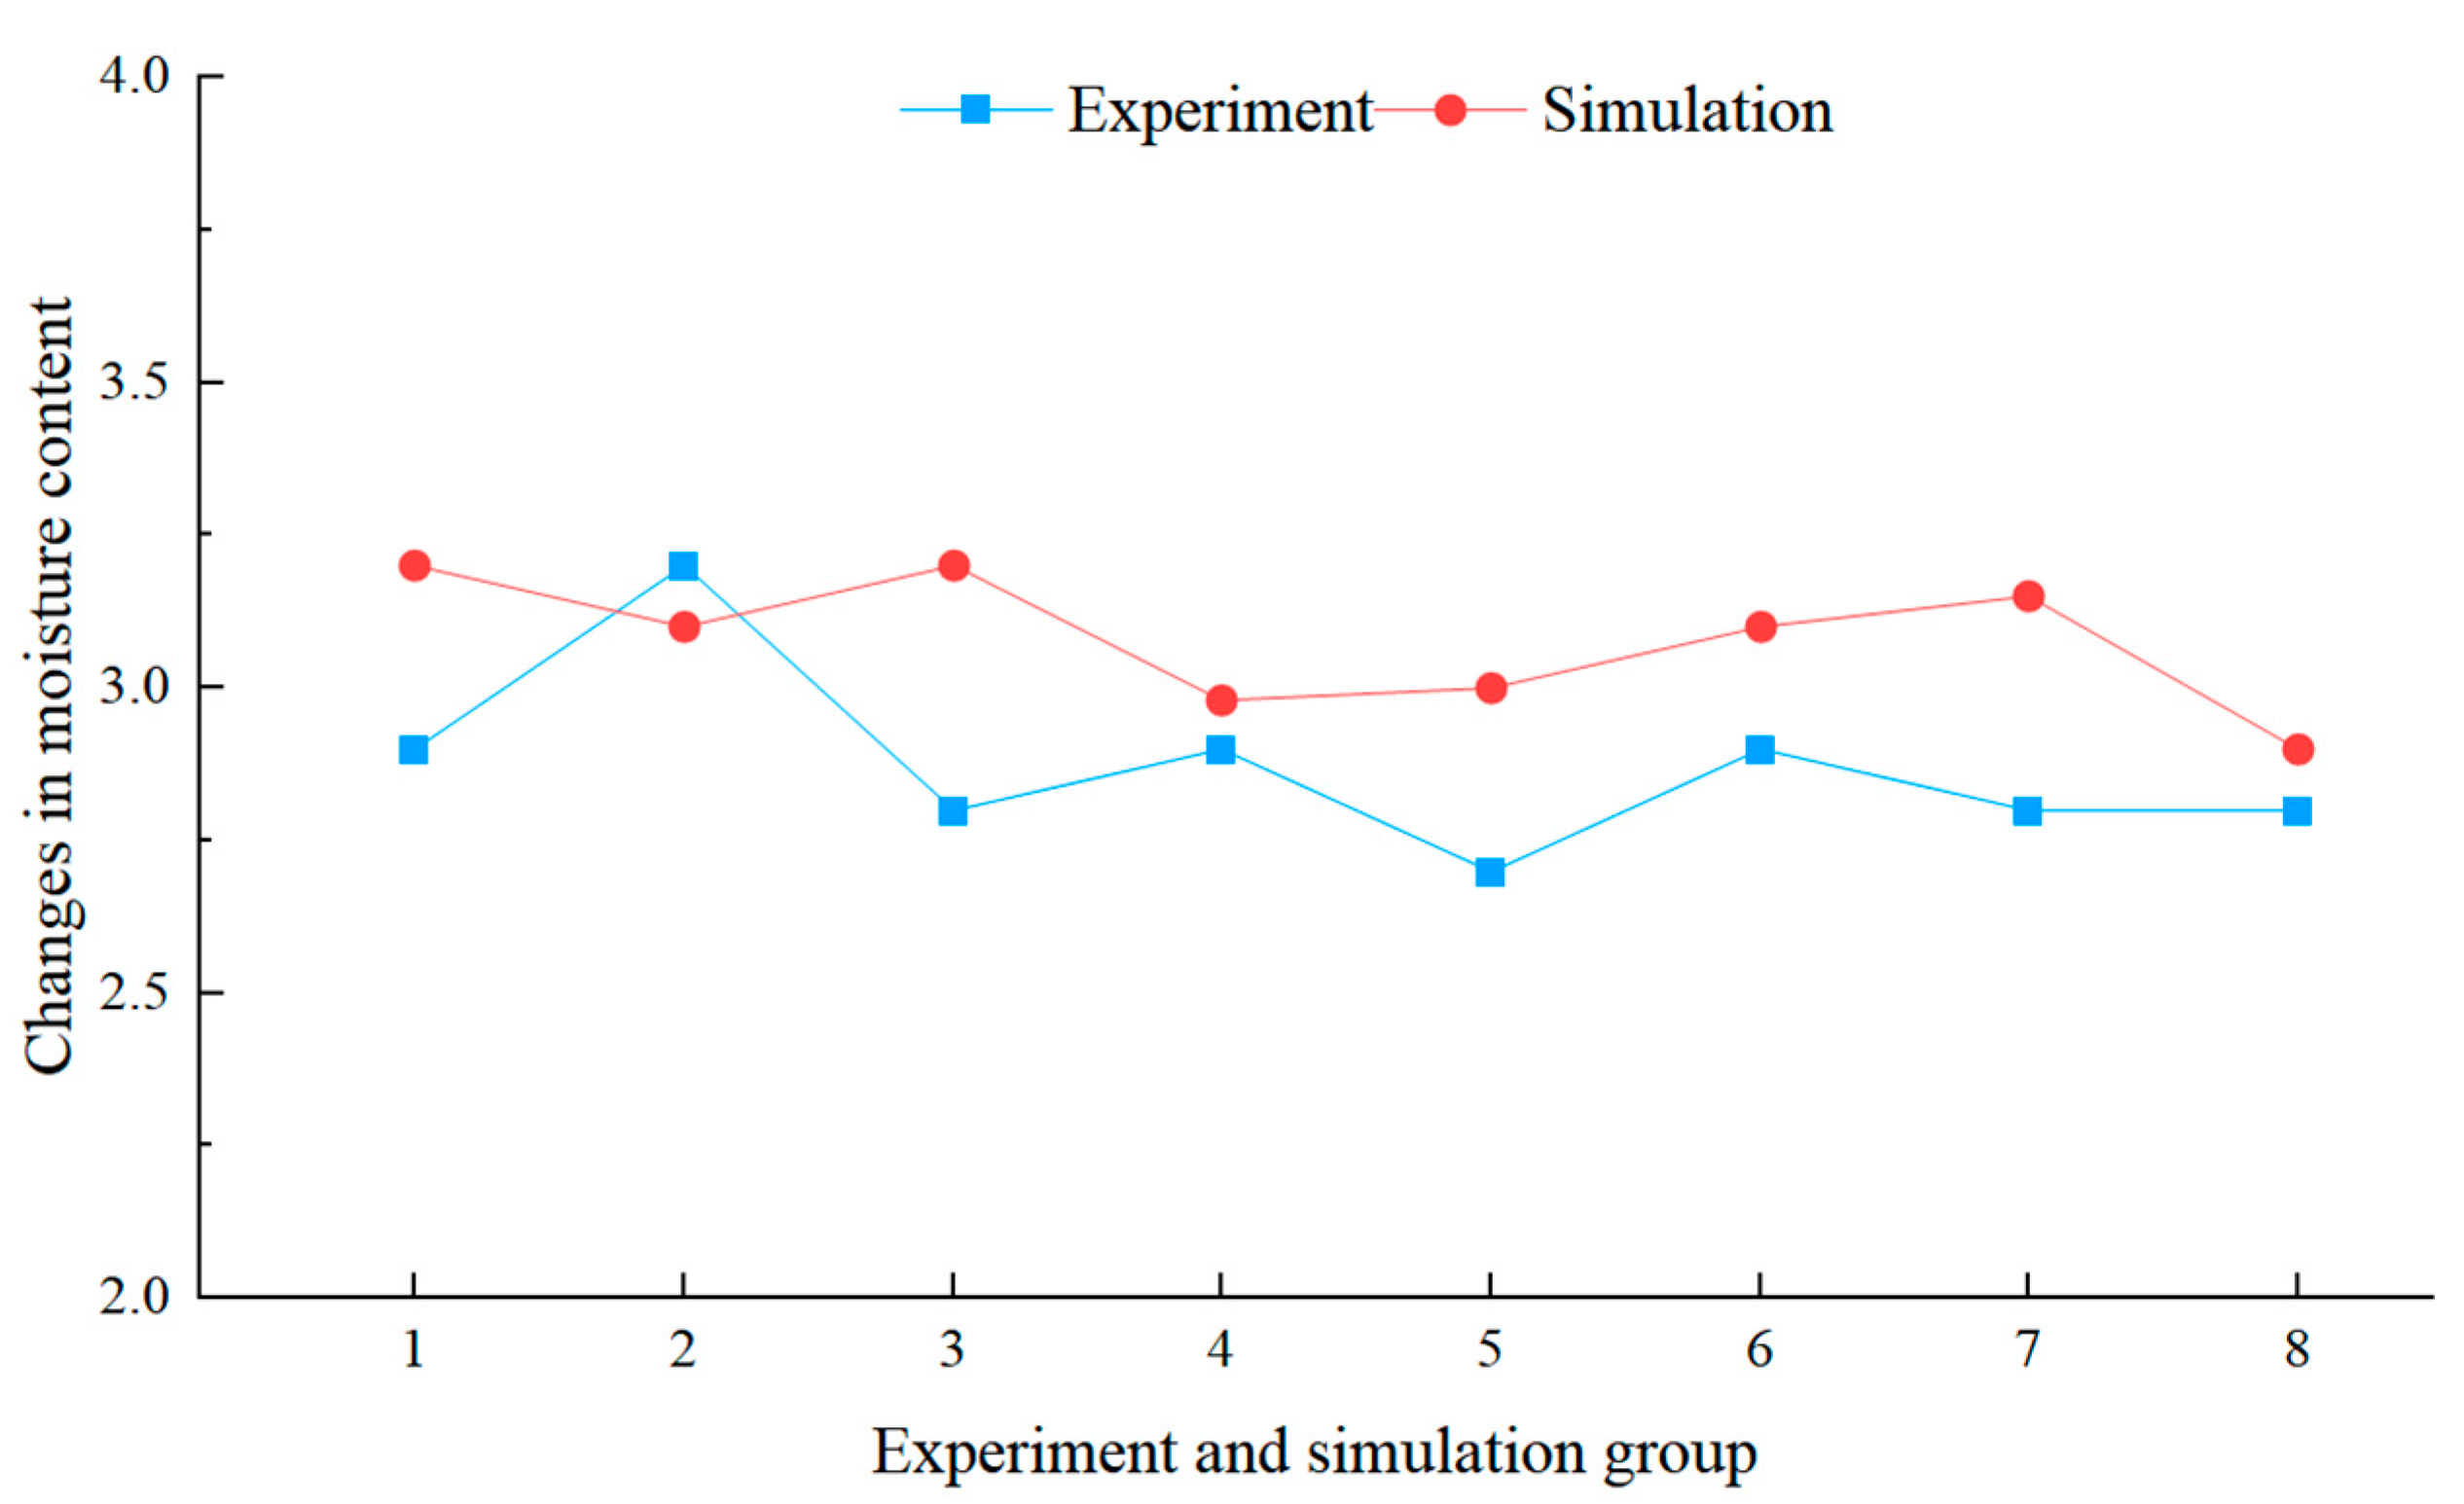
3.1. Simulation vs. Experimental Results

In order to determine the accuracy of the fluid model, the average temperatures of 49 monitoring points below the air inlet and 49 monitoring points below the air outlet were calculated, as shown in Figure 8, for the average temperature of the monitoring points over time, similar to the hot air temperature variation curve in reference [13]. In order to compare the differences between the simulation and experimental results, an analysis of variance (ANOVA) was performed on the temperatures at the monitoring points below the air inlet and outlet. ANOVA is used as a test of significance for the difference between the means of two or more samples. It is used to determine the magnitude of the influence of controllable factors on the results of the study by analyzing the magnitude of the contribution of different sources of variation to the total variation of the study [35]. The results are shown in Table 4 and Table 5. The results show that the simulated mean values of the monitoring points inside the drying chamber are all greater than the experimental mean values. This is because the simulation of the drying chamber box was simplified and set as an adiabatic wall, and the interference of external environmental changes was ignored, so the error occurred. However, the trend in the simulation results is consistent with the experimental results. The ANOVA results show that there is no statistically significant difference between the experimental and simulated results (p > 0.01), as shown in Table 4 and Table 5.
In order to compare the simulation and test wind field distribution more intuitively, the measured wind speed data array is interpolated and smoothed using Origin 2022 software. The distribution of the wind velocity field under the inlet angle box and outlet angle box for the simulation and test is obtained, as shown in Figure 9. From Figure 9, the simulation results are slightly higher than the test results. The wind field distribution is similar to that of reference [11]. This is because the drying chamber box is idealized in the simulation and is a closed environment except for the air inlet and outlet, while it is difficult to achieve such a closed environment in the test. Moreover, errors are generated due to the measurement accuracy of the sensors and the influence of the external environment on the test data. In order to compare the difference between the simulated and experimental wind velocity field distributions, a repeatable two-factor ANOVA was performed on the wind velocity field, as shown in Table 6 and Table 7. The ANOVA results show that there is no significant difference (p > 0.01) between the experimental and simulated results.
To compare the variations in the water content of tiger nuts, 300 tiger nut seeds were used in each experiment, with their temperature measured and averaged. In the simulation experiment, 300 seeds were randomly selected to calculate the average value. The comparison between the experimental results and simulation results is shown in Figure 10. It can be seen that the water content of tiger nuts in each group decreased by about 3.0%; the simulation results are consistent with the experimental results and in accordance with the general law of drying [36]. The results show that the above CFD-DEM model can simulate the hot air drying of tiger nuts in the drying chamber of the drying tower.

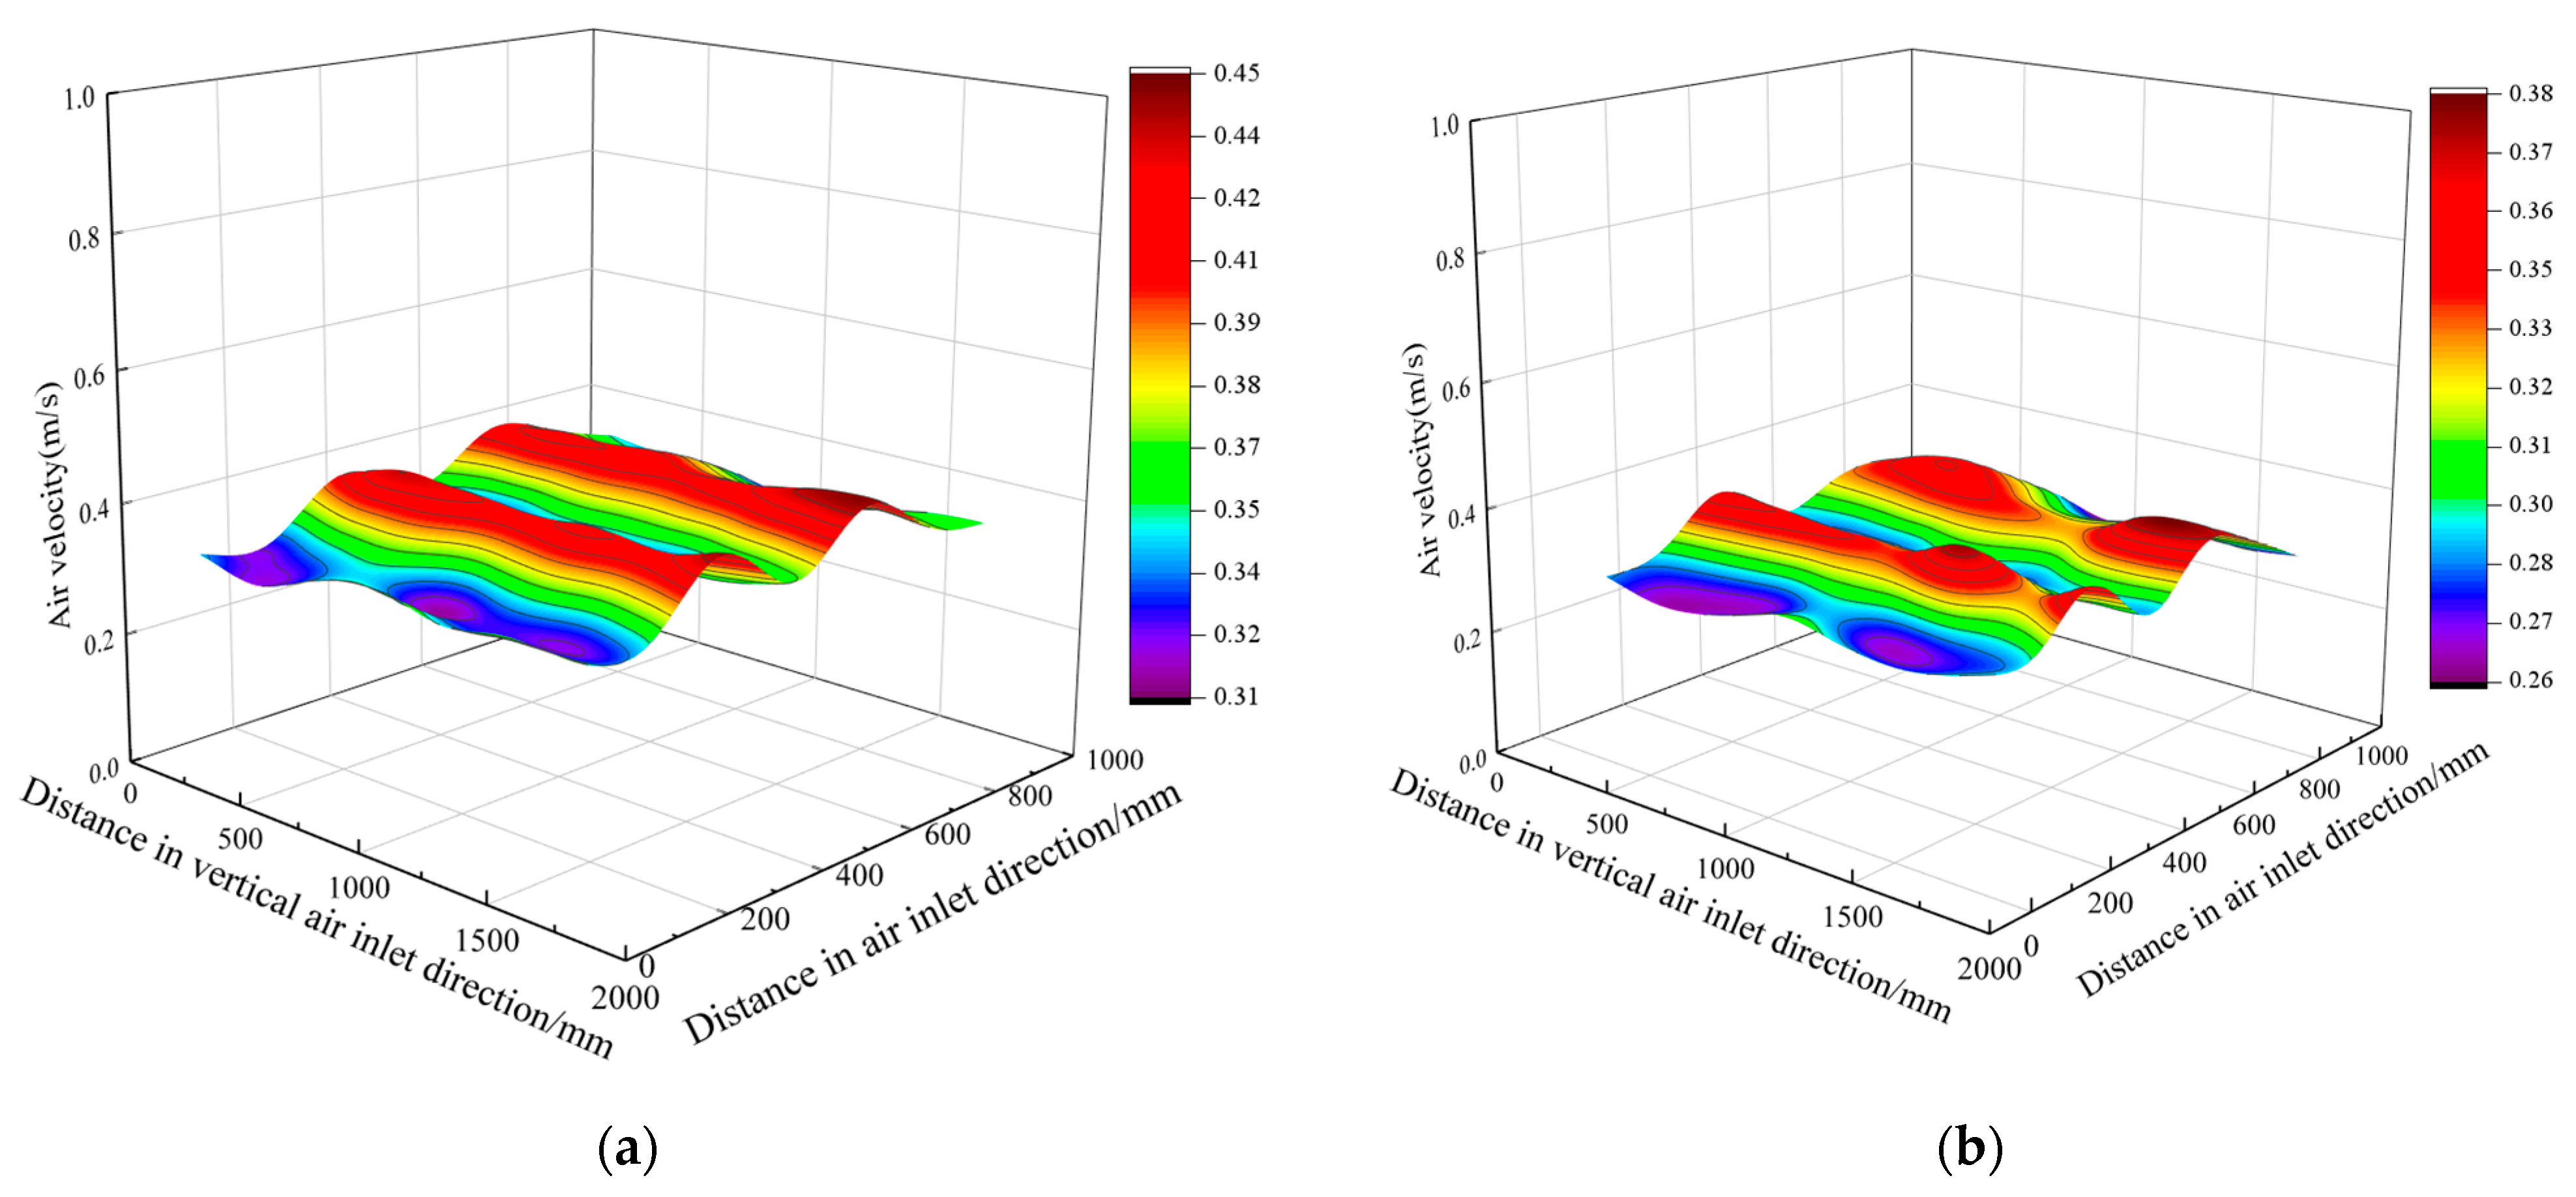
3.2. Effect of Opening Rate

In order to further study the influence of the open corner box on the uniformity of the flow field in the drying chamber, the transverse distance of the fixed corner box is 320 mm, the longitudinal distance is 420 mm, and the wind speed at the inlet is 4 m/s. Moreover, 20 mm below the inlet corner box is selected as the measurement point, and the wind speed distribution trend is obtained, as shown in Figure 11. The average wind speed below the unopened corner box is 0.68 m/s, and the standard deviation is 0.58 m/s. The wind speed is higher near the air inlet and outlet and lower in the middle position, and the overall distribution of wind speed is not uniform. This is due to the higher wind pressure at the air inlet and outlet. In the open-hole corner tube flow, part of the gas can be released through the microporous sides of the side plate of the corner box, resulting in a significantly lower internal wind speed compared to the unopened-hole corner tube; this tends to stabilize the effect of wind distribution. The average wind speed under the corner box with 0.19% pore opening rate is 0.52 m/s, and the standard deviation is 0.43 m/s. This is because the pressure at the air inlet and outlet with a small pore opening rate is still larger than the pressure in the middle, the wind speeds at both ends are higher than that in the middle, and the wind speeds at both ends are lower. The average wind speed below the corner box with 4.7% openings is 0.41 m/s, and the standard deviation is 0.35 m/s. This is because more hot air flows into the side holes of the corner box, resulting in a significant reduction in wind speed and an increase in wind speed inhomogeneity. The advantage of the corner box with an opening rate of 0.33% is obvious, and the difference in wind speed along the inlet direction is small, with the average wind speed below the corner box being 0.47 m/s and the standard deviation being 0.12 m/s, which makes the wind field uniformity better. Therefore, it is preferable to adopt the corner box with an opening rate of 0.33% as the main ventilation structure in the drying room.

3.3. Effects of Spatial Location

The grain layer’s resistance to hot air will be different for different longitudinal and transverse spacings of the corner boxes in the drying chamber. The resistance of the grain layer is also related to the type of seed. A suitable layer resistance will reduce the energy consumed by the drying system. Therefore, there is a reasonable range of corner box layouts that depend on the grain being dried in the drying tower.

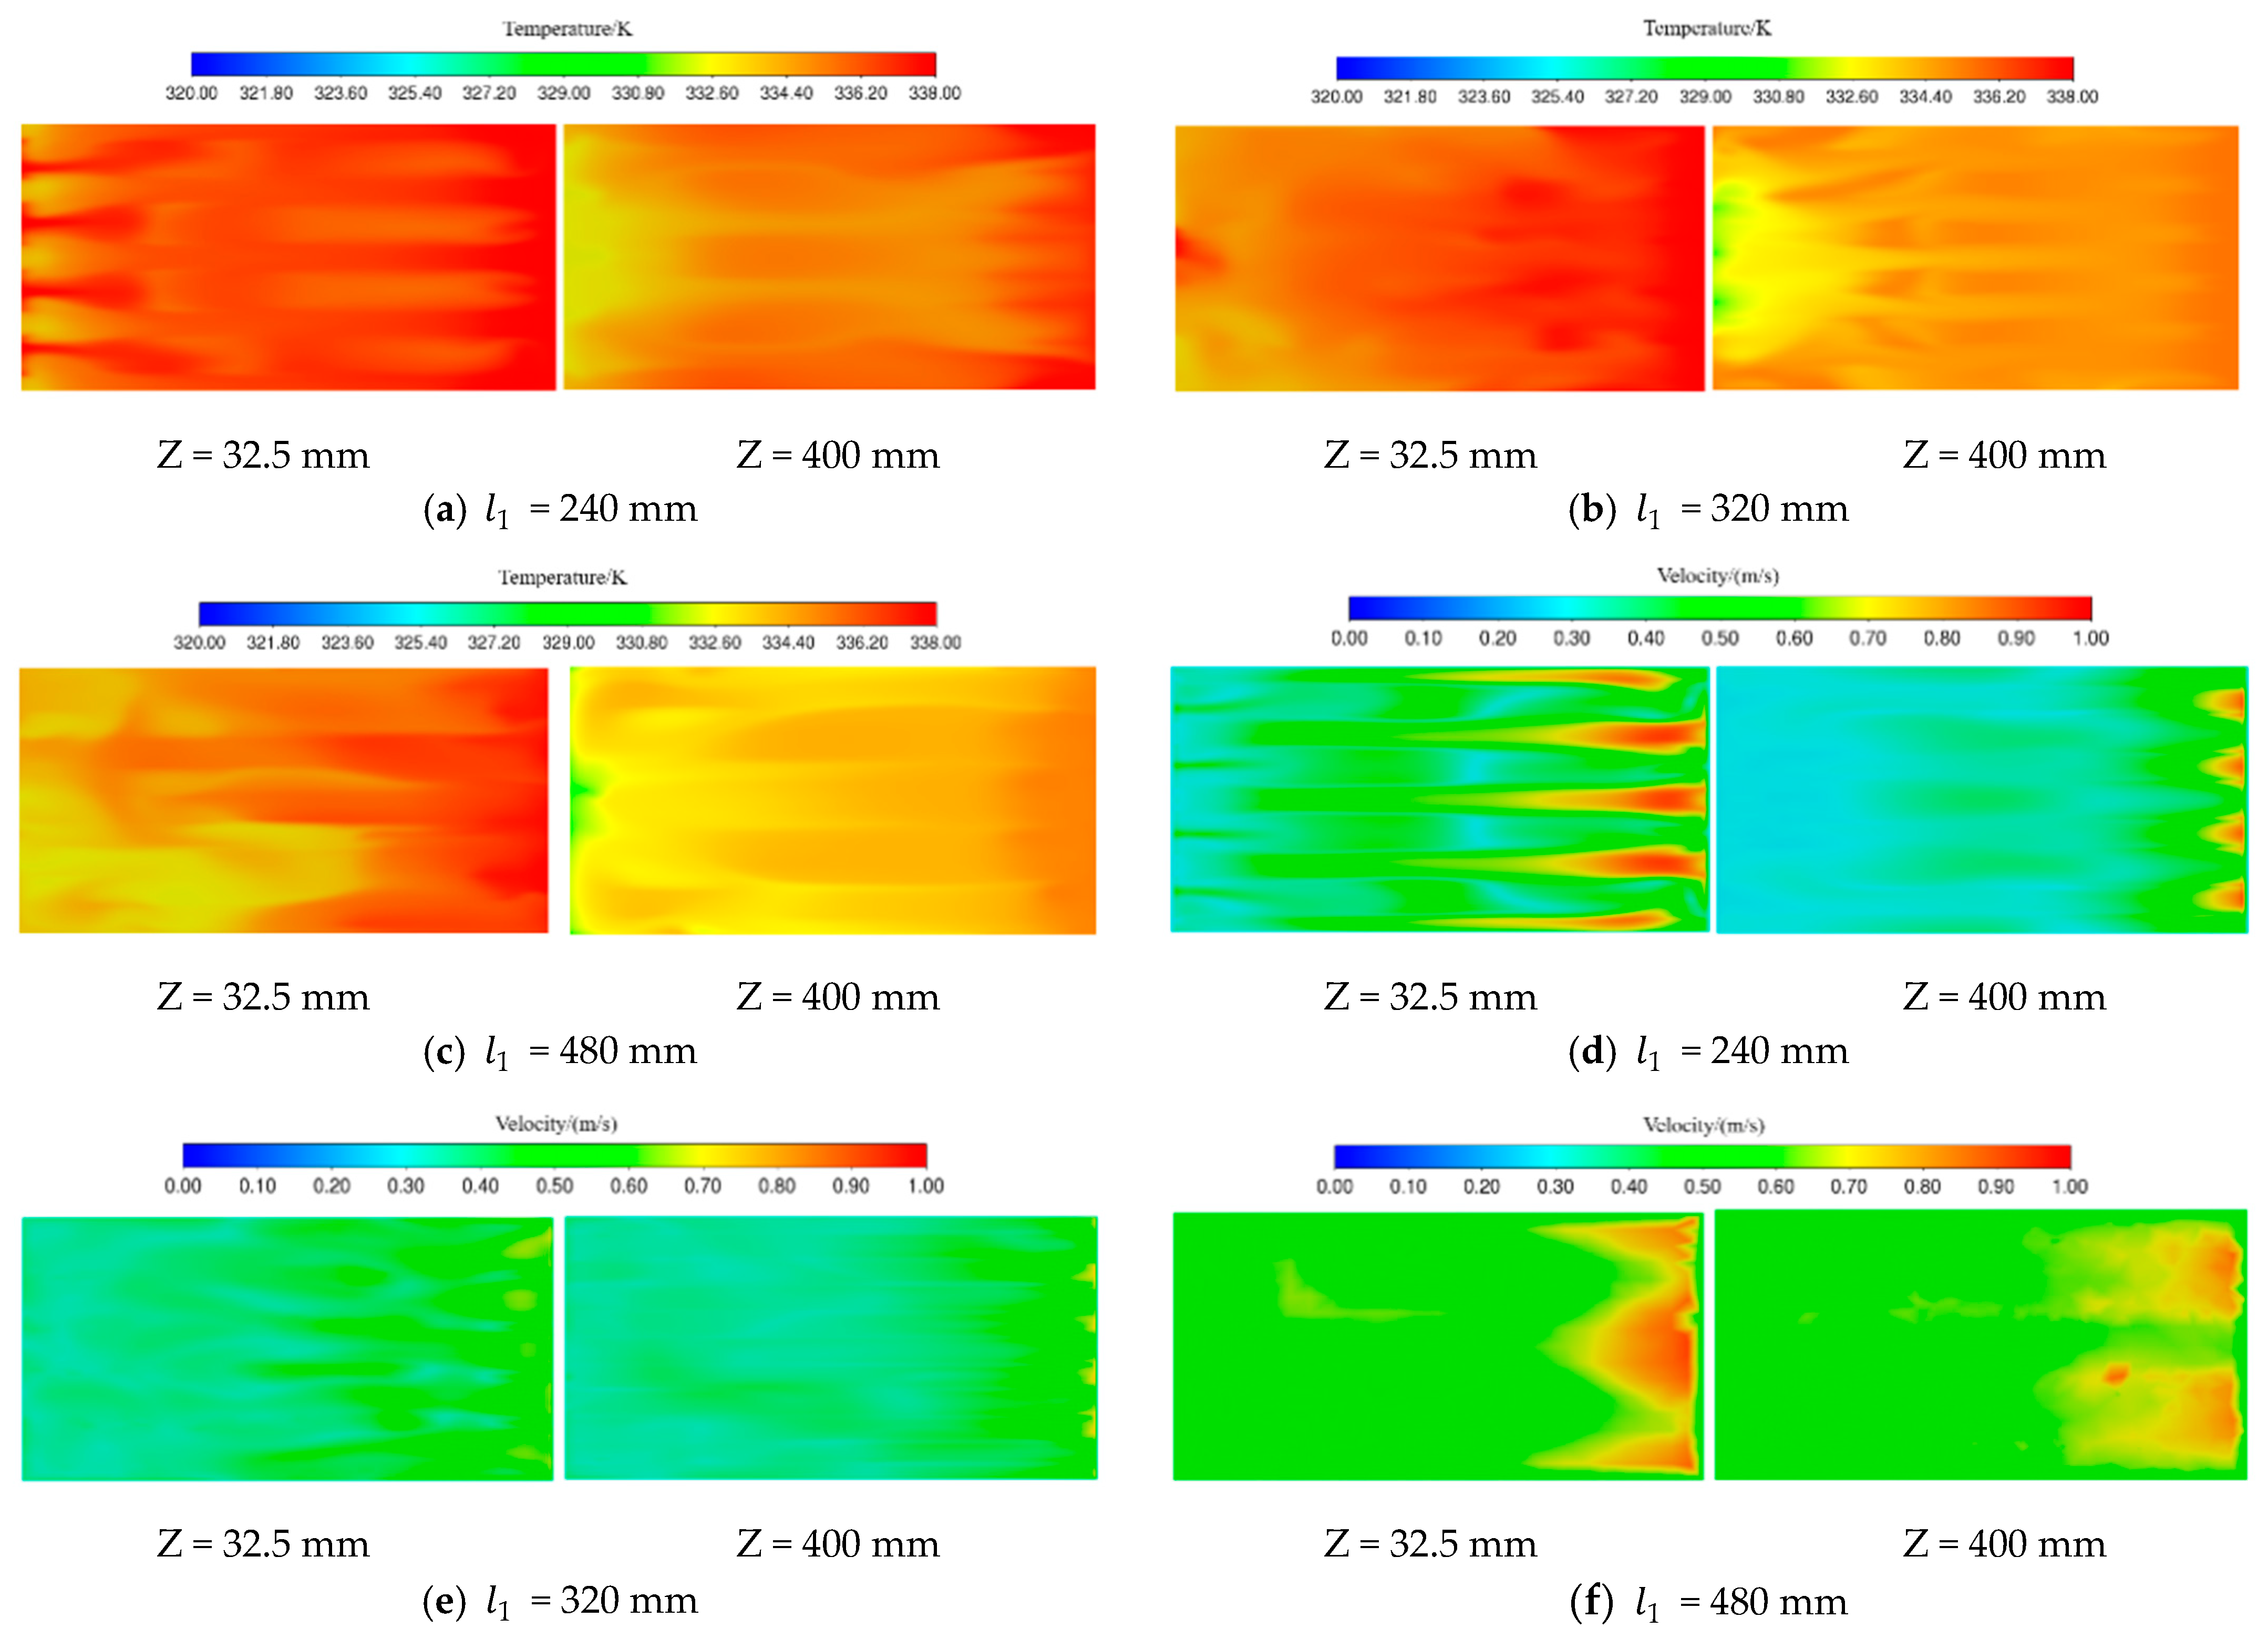
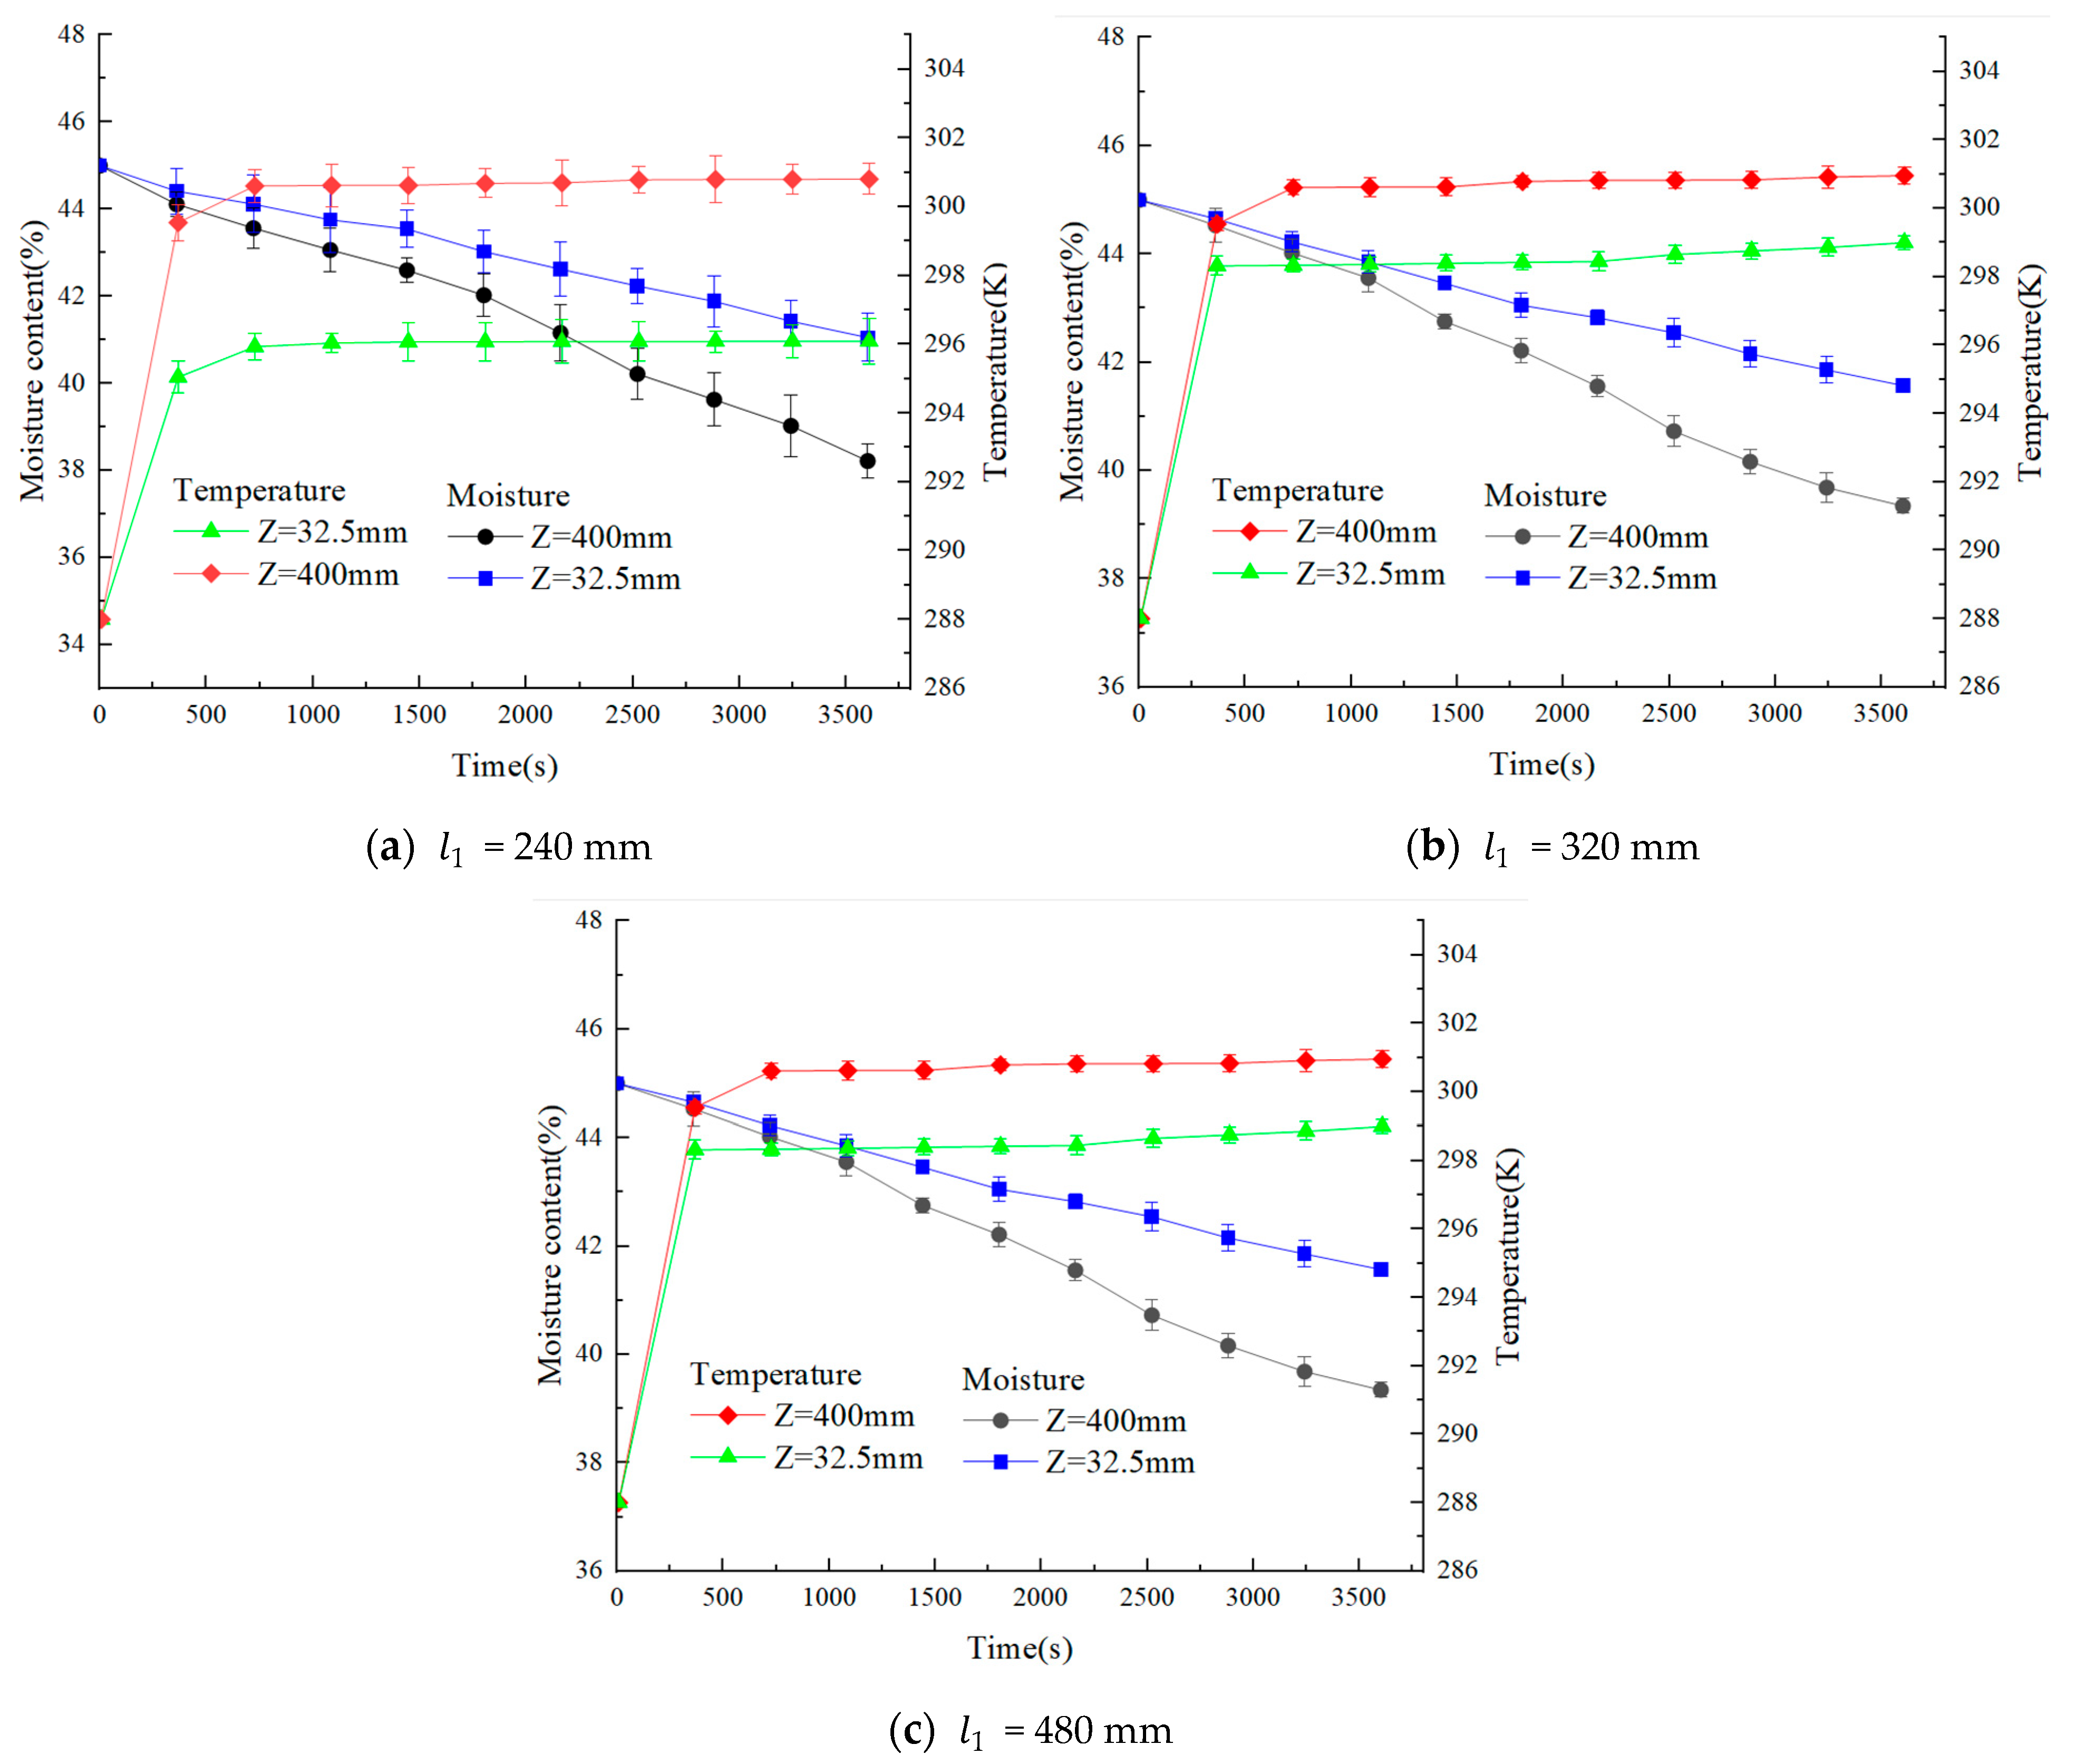
3.3.1. Effects of Lateral Distance

In Figure 12, the temperature and wind field distributions at different corner box horizontal spacings are displayed. The temperature and wind speed distributions in the figure are similar to those in references [11,31]. It can be seen that as the horizontal distance increases, the temperature and wind speed below the exit gradually decrease, and the temperature gradient and wind speed gradient change. When the horizontal spacing of the corner box is equal to 240 mm, the temperature field and wind field are not uniformly distributed. The wind speed is higher, and the temperature is higher near the exit direction. This is due to the high number of corner-mounted boxes, whose walls form a wall effect with the tiger nut seeds. The void ratio of tiger nut seeds on and near the walls of the corner boxes is always greater than that inside the drying bed. Because the resistance is relatively small, the fluid flow rate near the wall must be greater than inside the bed. The number of seeds is relatively small, and tiger nut seeds to the hot air lateral resistance is reduced. As a result, excessive wind speeds and temperatures are formed in some places. When the corner box spacing increases to 320 mm, the temperature and wind speed distributions at the two cross-sections are more uniform; the region basically realizes uniform wind distribution. In the air inlet corner of the box below, the temperature distribution is more uniform, meeting the requirements of the drying tower air temperature. When the spacing between the corner box is 480 mm, the temperature at the outlet and the temperature near the inlet has a certain gap, and the gradient of wind speed is larger in the two cross-sections. This is because the spacing between the two corner boxes is too large, and the tiger nut seeds have a greater lateral resistance to the hot air, resulting in a lower wind speed and temperature in the middle of the two corner boxes.
In order to further analyze the effect of the horizontal spacing of the corner box on the heat condition of the particles, as shown in Figure 5, 100 tiger nut seeds are selected at cross-sections Z = 32.5 and Z = 400 mm, respectively, to determine the variation in temperature and moisture content over time, and the results are shown in Figure 13. The trends in temperature and moisture content are similar to those in reference [13,36]. From Figure 13, it can be seen that with the increase in time, the tiger nut temperature first increases rapidly and then tends to stabilize, and the water content gradually decreases. This is because, first of all, the wet particles are preheated and heated, and at the same time vaporize a small amount of water, so the warming is faster in the early stage, and the water content decreases slowly. Then, all the heat transferred from the hot airflow to the pellet is used to vaporize the water, and the surface temperature of the pellet remains basically unchanged while the water is vaporized at a certain rate. When the horizontal spacing of the cassettes is equal to 240 mm, the final average temperatures of the tiger nuts are 298.20 K and 296.51 K, with high extreme temperatures and coefficients of variation. The final average moisture content values of tiger nuts are 38.1% and 41.5%. This is because—at this time—the corner box hot air volume is larger, the corner box is directly below the higher temperature field, and the wind speed is larger, so this part of the surface of the tiger nut air flow rate is larger, and the drying rate is accelerated. When the horizontal spacing of the box is equal to 320 mm, the final average temperature values of the tiger nut are 297.5 K and 295 K; moreover, the final average moisture content values of the tiger nut are 39.7% and 41.1%. Overall, the temperature and moisture content distribution of tiger nuts in each region are basically the same. When the horizontal spacing of the boxes is equal to 480 mm, the final average temperature values of tiger nuts are 296 K and 294.21 K, and the final average moisture content values are 40.3% and 43.1%. At this time, the extreme difference and coefficient of the variation in temperature and water content are high. This is because the number of tiger nuts is large, and the distribution distance of the corner box is far away, so it is not evenly heated.
In order to investigate the effect of the lateral spacing of the corner-mounted box on the flow velocity of tiger nuts during grain discharge, the flow characteristics of tiger nuts are analyzed, as shown in Figure 14. As in Figure 14a, the flow velocities of tiger nut particles in contact with the corner box or the wall are comparatively lower than the flow velocities in other regions. The tiger nut flow velocities in the region between neighboring corner tubes are higher than those between the corner box and the inner wall, and there is a significant velocity difference between the particles. These effects were confirmed by flow experiments by K. L. Iroba and Jochen Mellmann et al. [37,38]. In order to assess the impact of different lateral distances of the corner box on the falling velocity of tiger nut particles, seed velocity monitors were set up at A, and B to monitor the vertical downward velocity of the seeds. As can be seen in Figure 14b–d, the seed falling velocity gradually accelerates with the increase in the lateral distance. When the lateral distance is equal to 240 mm, the average flow velocities at A and B are, respectively, 0.199 m/s and 0.271 m/s. The flow velocity of the tiger nuts on the side close to the inner wall of the drying chamber is significantly lower than that in the middle area of the two corner boxes. When the lateral distance is equal to 320 mm, the average flow rate values at A and B are 0.281 m/s and 0.267 m/s, respectively, and the flow rates of tiger nuts in the two areas are basically the same. When the lateral distance is equal to 480 mm, the average flow velocities at A and B are 0.314 m/s and 0.318 m/s. The difference in flow rates between the two regions is not significant, but there are large fluctuations in flow rates. By analyzing this, it can be seen that the shape of the tiger nut is irregular and the friction of the wall during the flow hinders the movement of the grains. If the residence time of the grain is less than the drying time, the grain will be under-dried. If the residence time of the grain is higher than the drying time, the grain will be over-dried. Increasing the transverse distance can, to a certain extent, prevent the thermal damage caused by localized overheating within the grains during the drying process, which can correspondingly improve the drying quality of tiger nuts. Therefore, it is best to choose a transverse distance of about 320 mm for corner boxes.

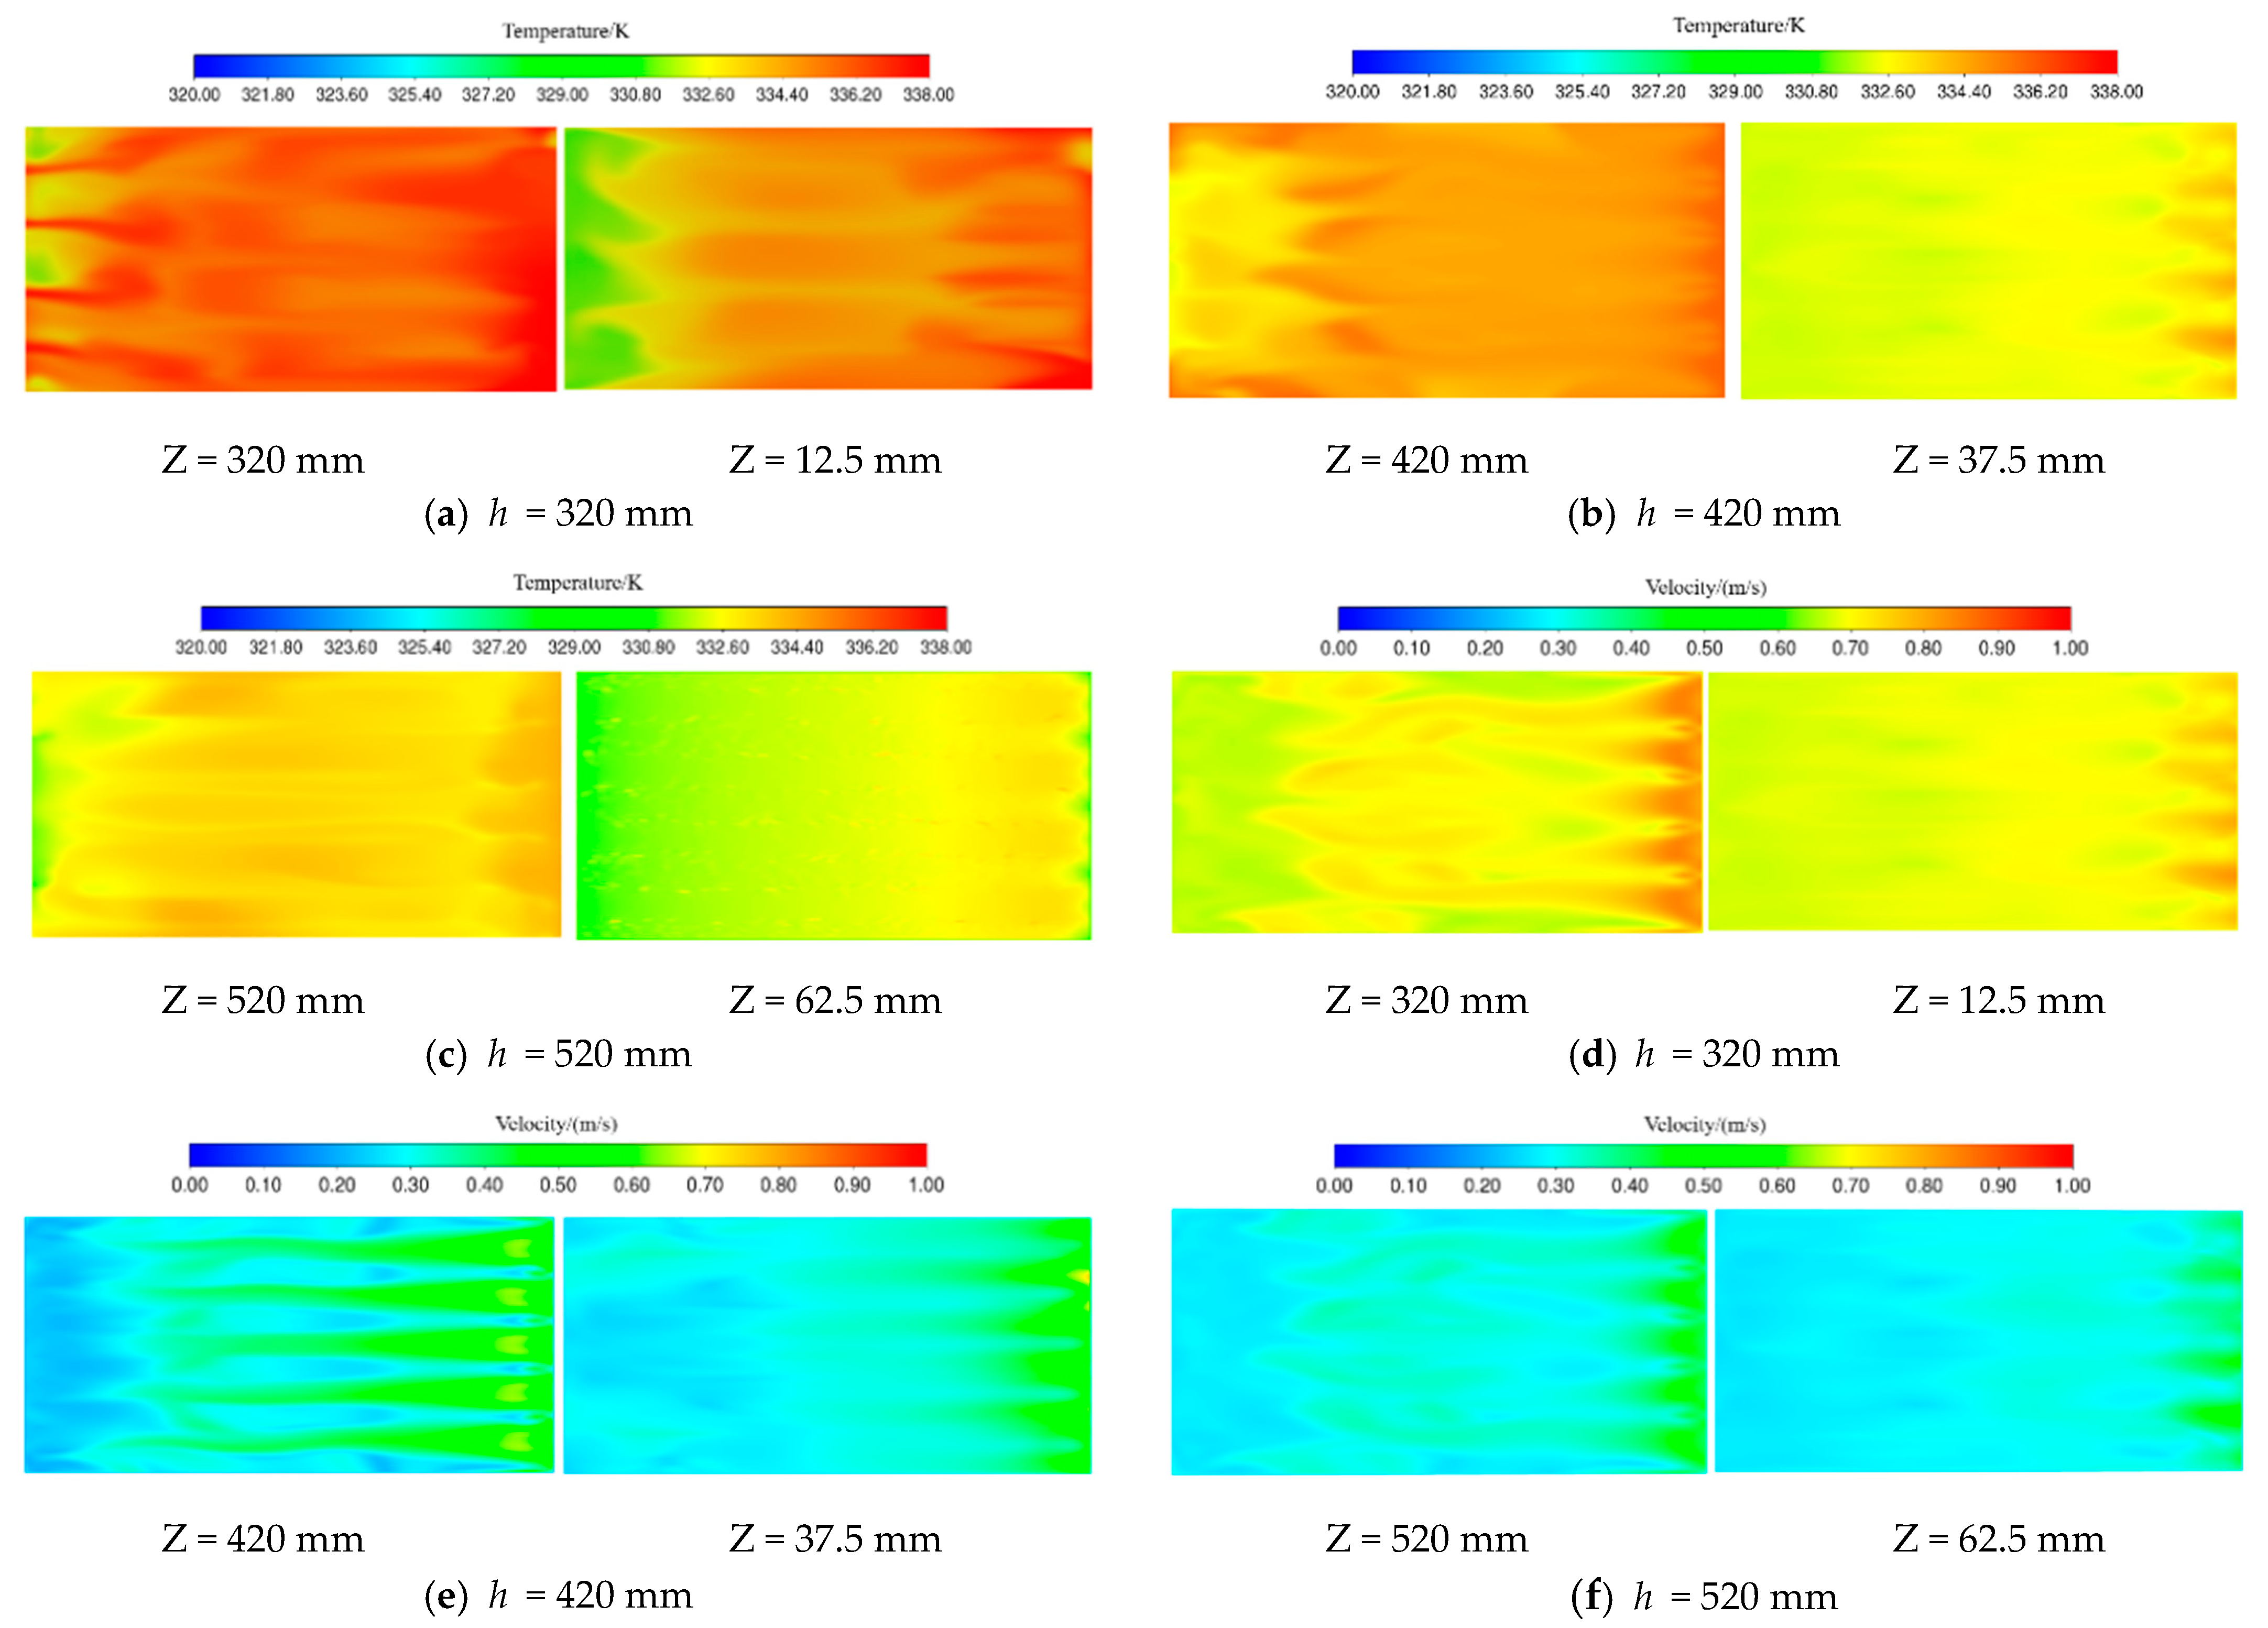
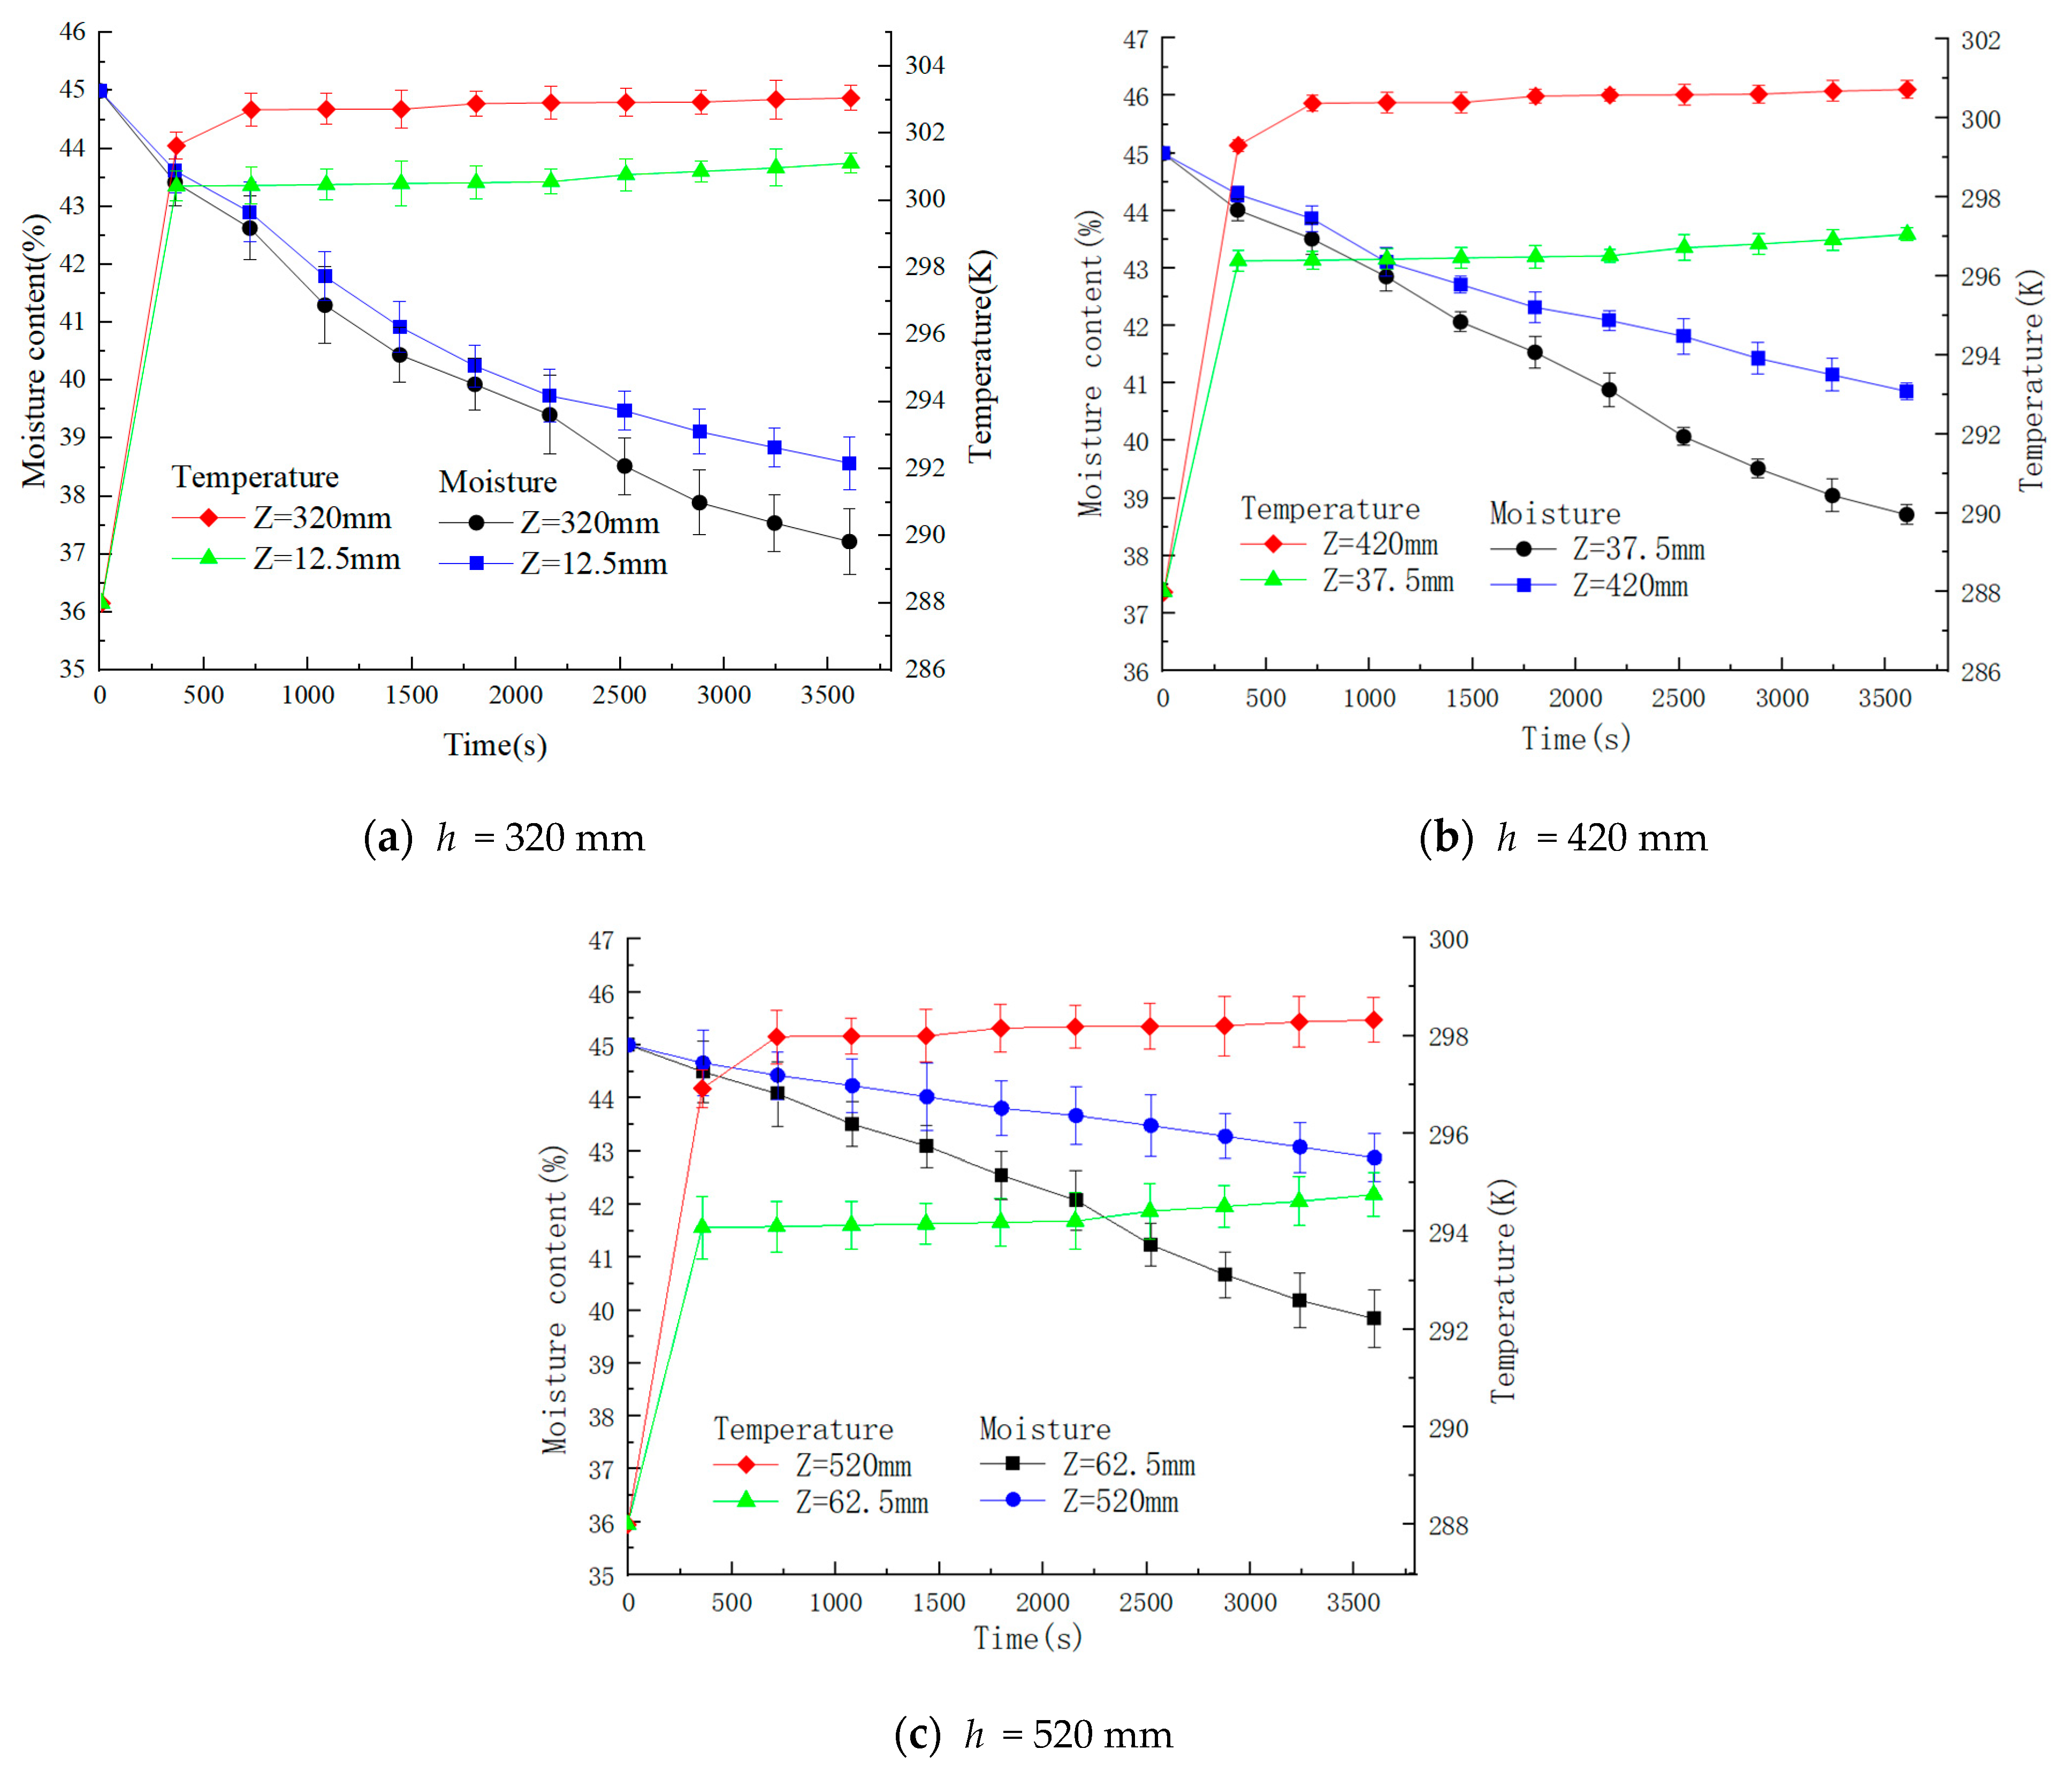
3.3.2. Effect of Longitudinal Distance

As shown in Figure 15, the temperature field and wind field distribution under different corner box vertical spacings are shown. When the vertical spacing of the corner box is equal to 320 mm, there is a significant difference in temperature in the same plane. In the horizontal direction, there is a laminar distribution, with the temperature on the exit side significantly higher than the import direction. If the vertical spacing of the corner box is equal to 520 mm, a drying dead zone is formed near the bottom of the air inlet, where the hot air temperature and wind speed are significantly lower than in other areas. When the vertical distance of the corner box is equal to 420 mm, the temperature difference between the two sections is small, and the hot air temperature is basically uniformly distributed. It can be seen that with the increase in the longitudinal distance, the gap between the average wind speeds of the two planes gradually becomes larger. This is because, due to the role of gravity, the closer to the bottom, the greater the static pressure between the tiger nut grain layer and the tiger nut particles. At this time, the denser accumulation of tiger nut particles results in a lower porosity of the tiger nut grain layer and a greater resistance to airflow; an increase in airflow resistance leads to a decrease in wind speed.
In order to further analyze the impact of the horizontal spacing of corner boxes on the heat conditions of particles, 100 tiger nut seeds are selected at cross-section Z = 320, Z = 12.5 mm; Z = 420, Z = 37.5 mm; Z = 520, Z = 62.5 mm, respectively, to find out the changes in temperature and moisture content over time; the results are shown in Figure 16. From the figure, it can be seen that with the increase in time, the temperature of the tiger nut first increases rapidly and then tends to stabilize, and the water content gradually decreases. With the increase in longitudinal distance, the gap between the temperature and moisture content of tiger nuts at two sections of the same vertical distance gradually increases. When the vertical distance between the corner boxes is equal to 320 mm, the final average temperature values of the tiger nuts are 305.14 K and 301.52 K, the extreme temperature and coefficient of variation are higher, and the average water content values are 36.4% and 38.7%. As the vertical spacing of corner boxes is equal to 420 mm, the final average temperatures of tiger nuts are 301.6 K and 296.4 K, and the average water content values are 39.6% and 41.3%. Overall, the temperature and moisture content distribution of tiger nuts in each region are basically the same. The average final temperatures of tiger nuts are 295.8 K and 292.9 K, and the average moisture content values are 39.5% and 42.3% when corner boxes are vertically spaced, equaling 520 mm. This is due to the large number of tiger nuts, and the distribution distance of the corner-mounted boxes is wide, making them unevenly heated. Therefore, it is better to choose a longitudinal spacing of corner boxes around 420 mm. This is because the increase in the thickness of the grain layer leads to an increase in airflow resistance and a decrease in the porosity between the tiger nuts. As a result, the airflow space inside the drying chamber decreases, leading to a decrease in air velocity. The water vapor evaporated from the surface of the tiger nut is taken away at a reduced rate, and the time required to reach equilibrium within the tiger nut grows, slowing down the drying rate.

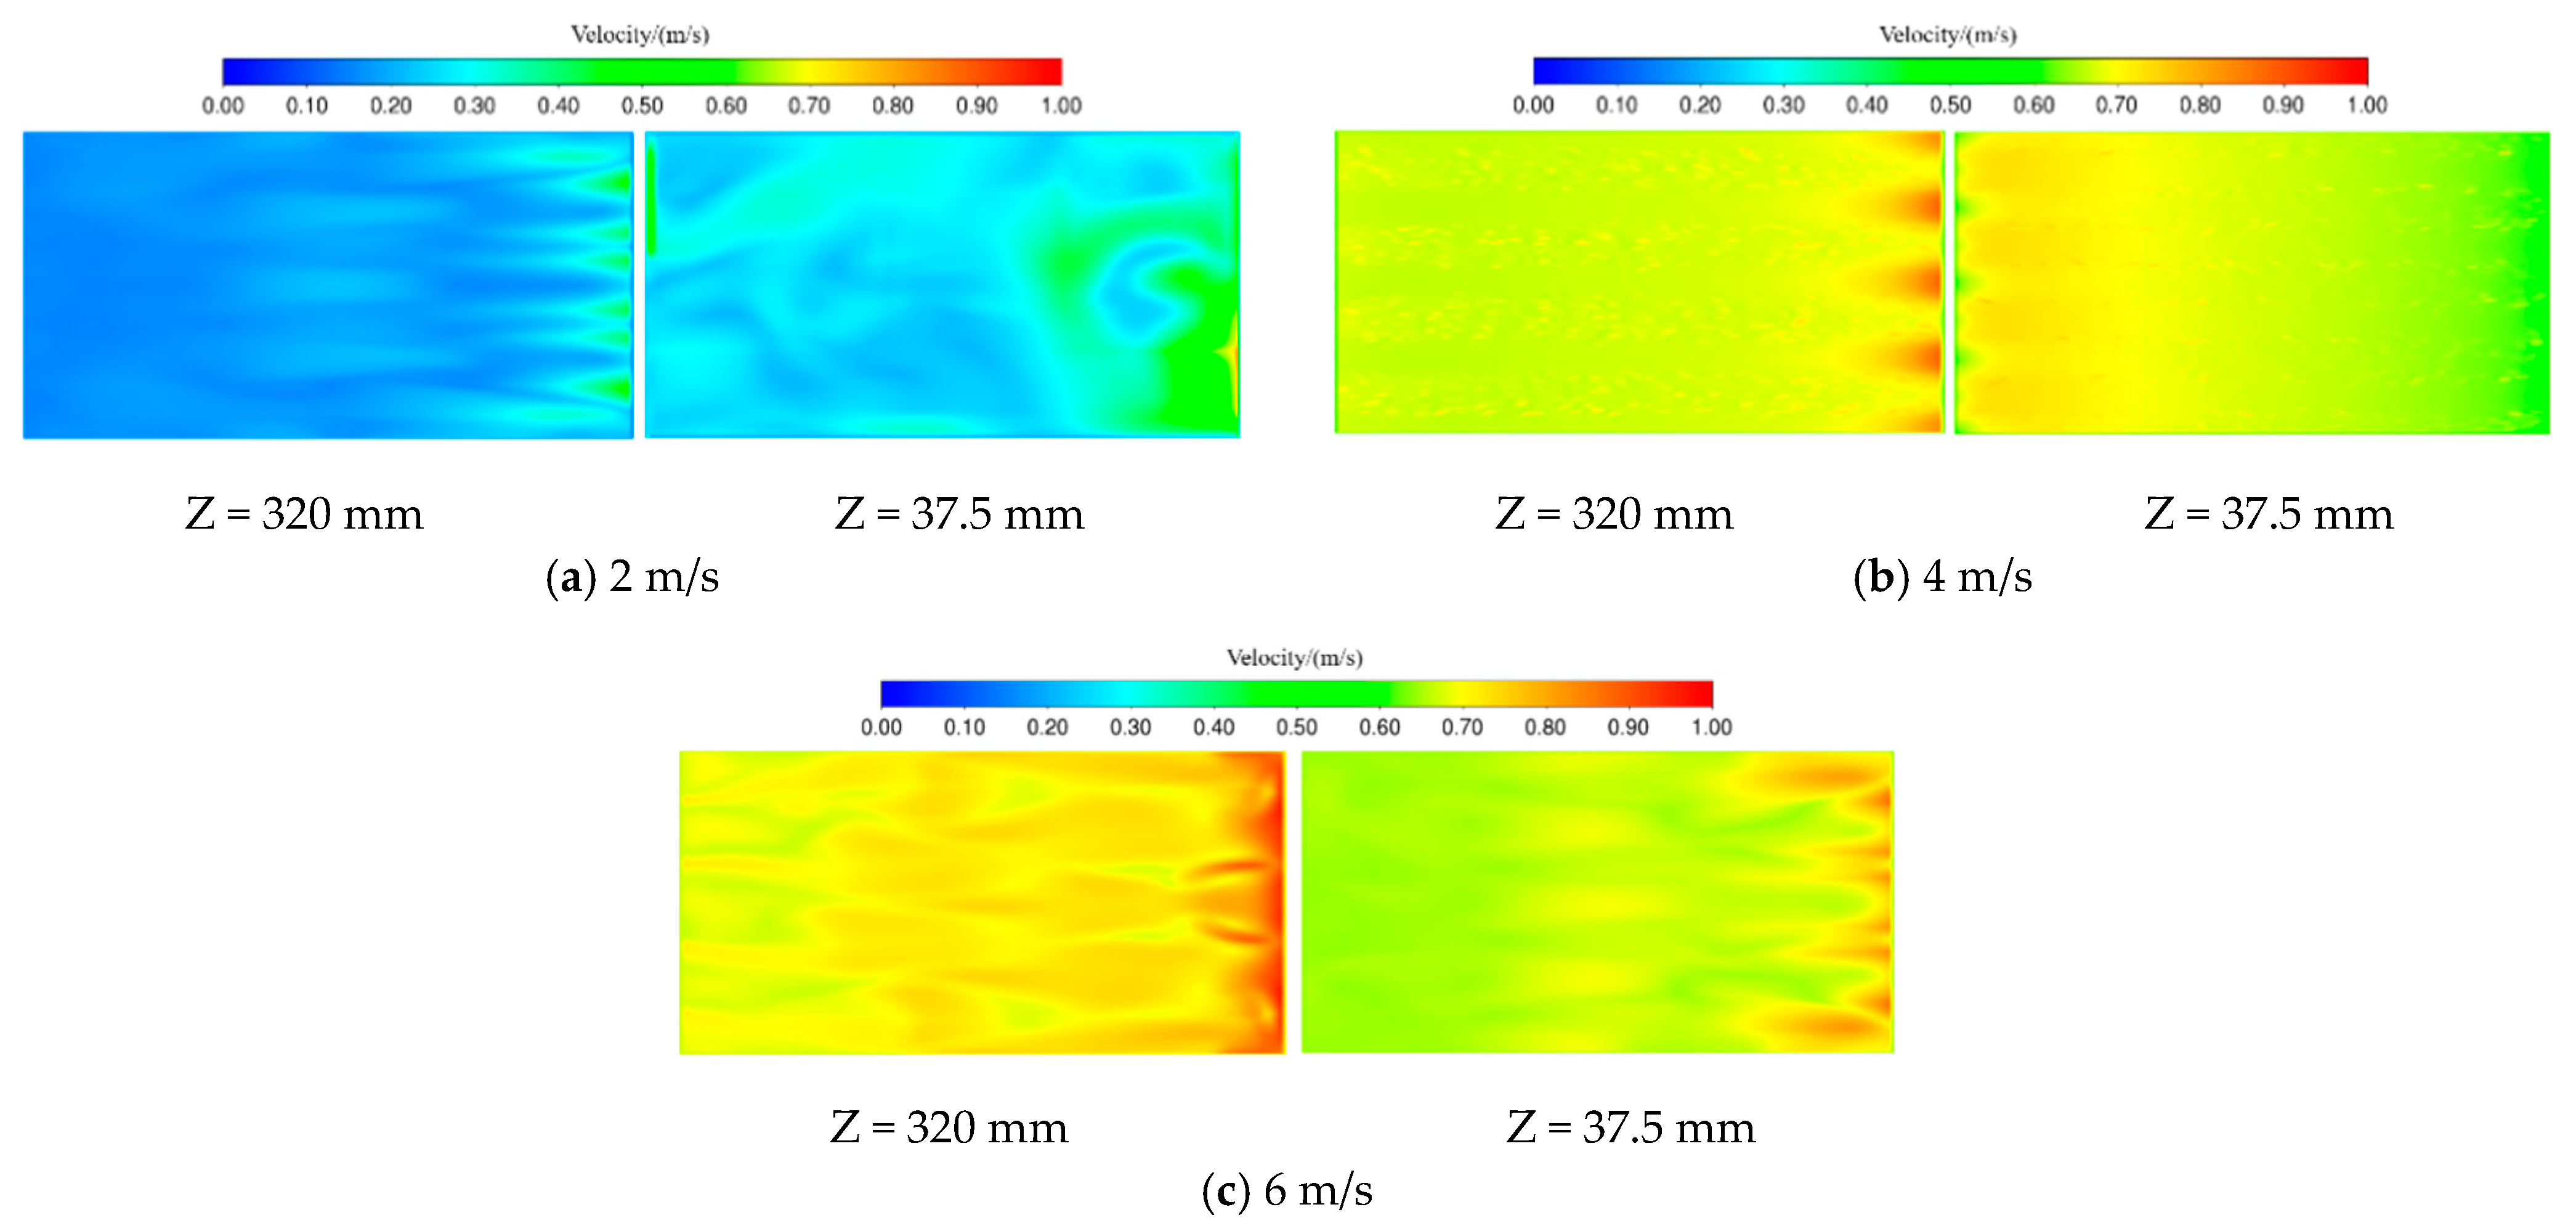
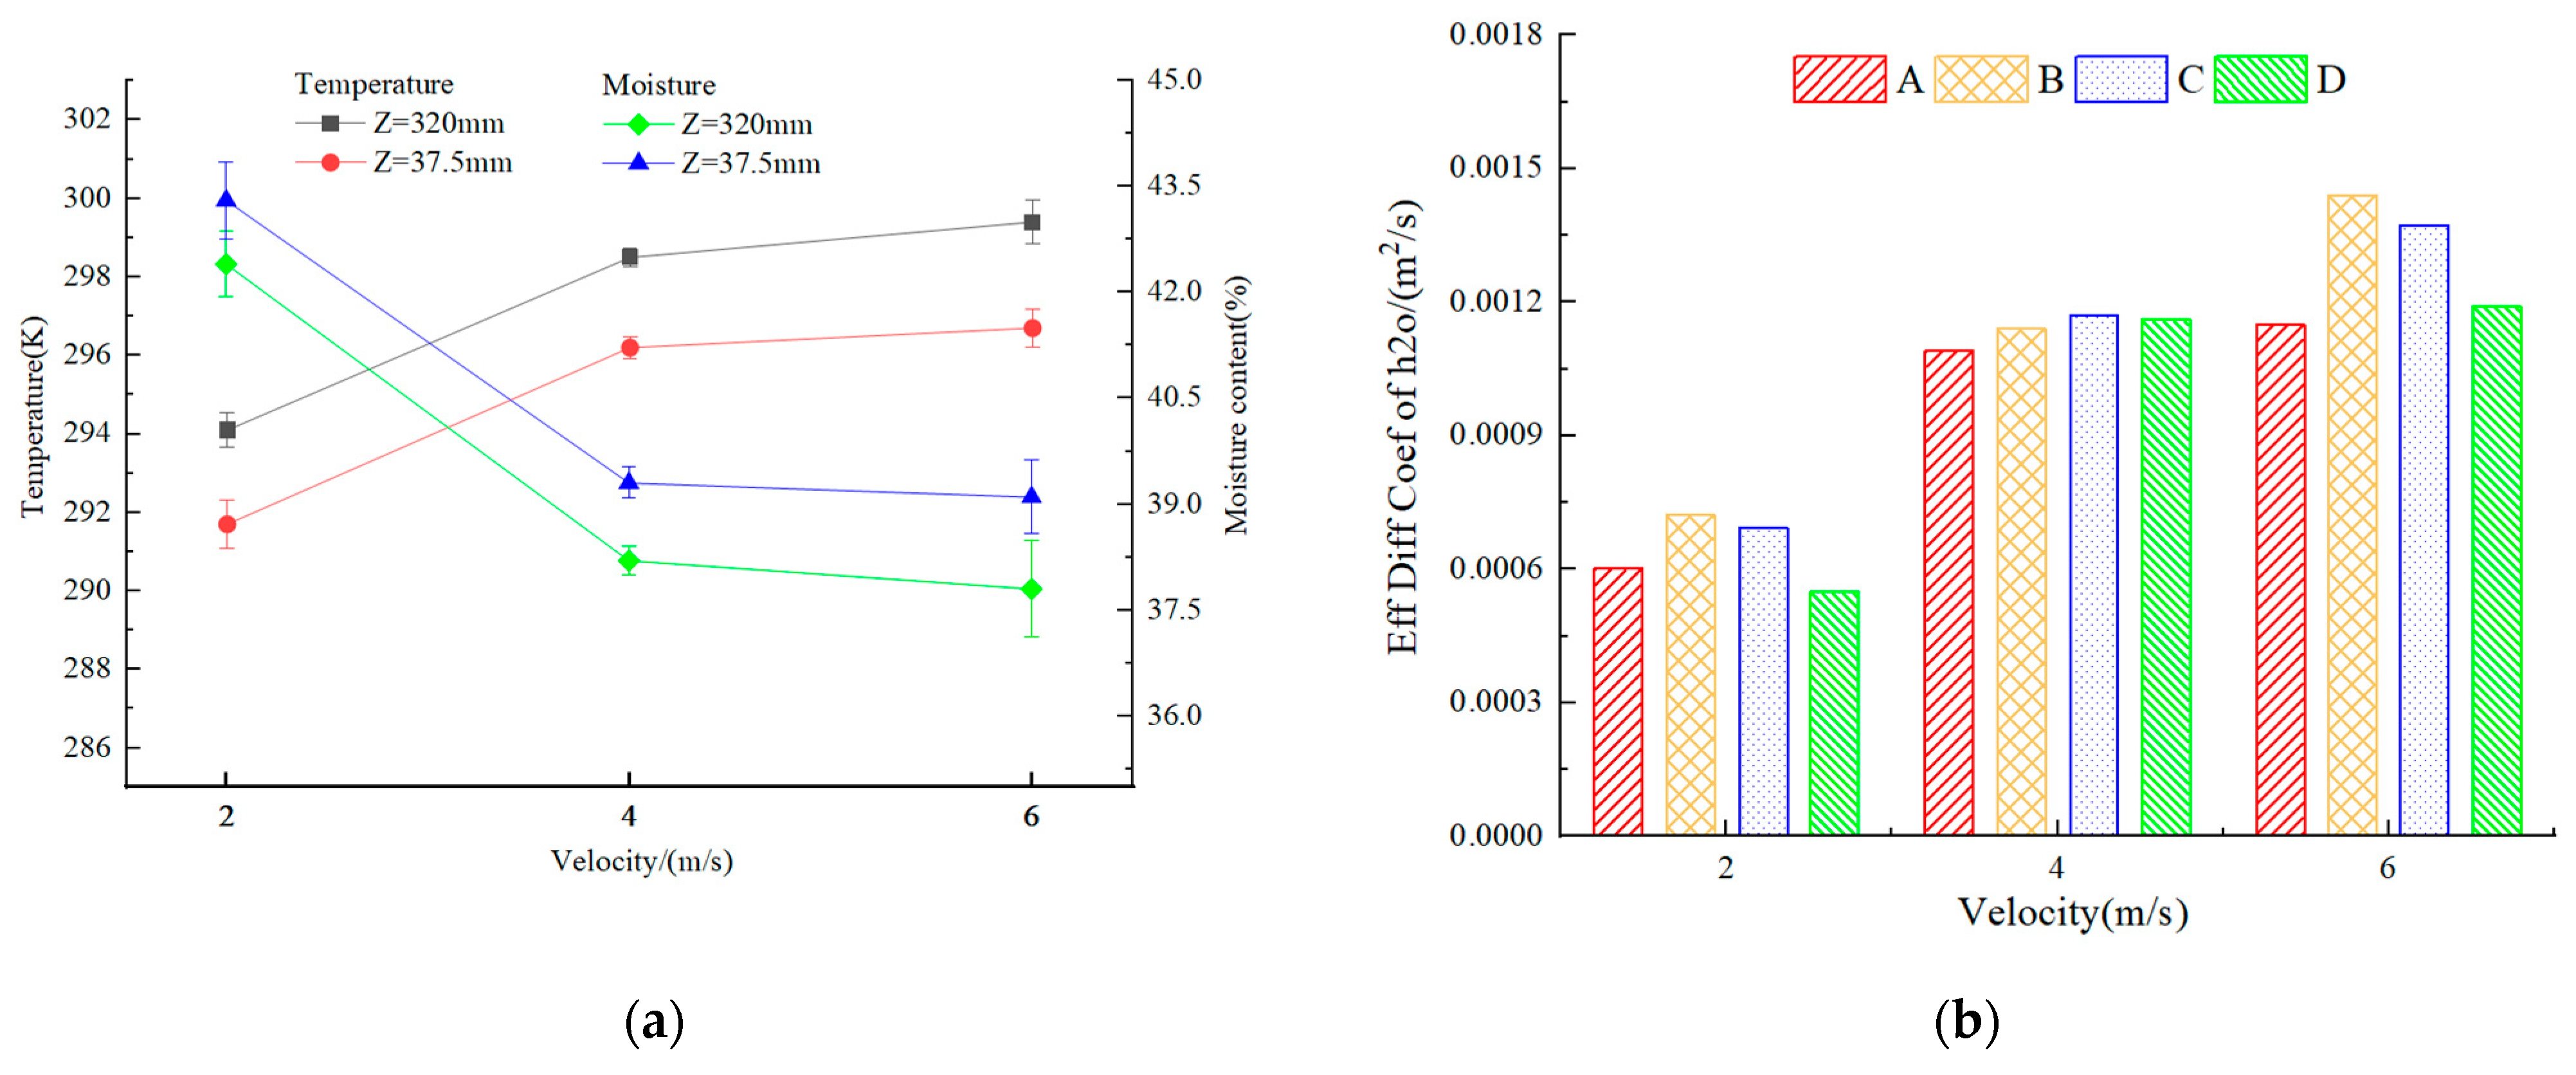
3.4. Effect of Wind Speed on Drying Effect

Wind speed is an important operating parameter and indicator used to measure energy consumption. The wind speeds selected in this paper are 2, 4, and 6 m/s. Different tiger nut particle thicknesses have different ventilation resistance values and drying rates. In order to select the airspeed that is applicable to the designed dryer, in addition to analyzing the drying characteristics, it is also necessary to study the ventilation resistance, so as to determine the optimal drying airspeed for a certain tiger nut particle thickness. According to the previous simulation test results, a horizontal spacing of 320 mm and a longitudinal spacing of 420 mm were selected for the layout of the drying chamber’s corner box space structure.
Figure 17 shows the wind field distribution at different wind speeds. From the figure, it can be seen that with the inlet wind speed increase, the wind speed inside the drying chamber gradually increases, but the uniformity of the wind field first increases and then decreases. Reference [31] reaches similar conclusions in the experimental part. When the wind speed is 2 m/s, the wind field distribution map in the middle position of the flow field line distribution is messy, resulting in the formation of a large vortex area, with large differences in wind speed at different positions. When the wind speed is 4 m/s, the wind speed distribution is uniform, and the wind speed difference between each part is small. When the wind speed is 6 m/s, the wind speed in the drying room near the air outlet side is greater than the air inlet side. This is mainly due to the airflow in the corner of the box moving in a straight line without any obstacles caused by the air volume being gathered in the second half of the duct.
To study the impact of wind speed on the drying rate, 100 tiger nut seeds that were dried for 1 h were selected at cross-sections Z = 37.5 mm and Z = 320 mm, respectively, and the average values of temperature and moisture content were found, as shown in Figure 18a. From the figure, it can be seen that with the inlet wind speed increase, the final temperature and drying rate of the tiger nut gradually increase, and the moisture content gradually decreases. However, from 2 m/s to 4 m/s, when the temperature and moisture content of tiger nuts have greater changes, the drying rate obviously accelerates; 4 m/s to 6 m/s is when the temperature and moisture content of tiger nuts have little effect. When the wind speed is 2 m/s and 6 m/s, the temperature difference and moisture content difference between two sections of tiger nuts are larger, with a larger standard deviation, indicating that uniformity is poor. At 4 m/s, the uniformity is good.
To further demonstrate the impact of wind speed on the drying effect, the diffusion efficiency of water vapor at the air outlet is extracted, as shown in Figure 18b. It can be seen that the diffusion efficiency of water vapor increases gradually with the wind speed increase at the inlet. From 2 m/s to 4 m/s, the diffusion efficiency increases significantly. From 4 m/s to 6 m/s, only the diffusion efficiency in the middle two outlets increases, and there is no significant change in the two side outlets. When the wind speeds are 4 m/s and 6 m/s, there is a significant difference in the diffusion efficiency of water vapor in the four air outlets. When the wind speed is 2 m/s, the diffusion efficiency of water vapor in the four air outlets is basically the same. Therefore, increasing the wind speed can effectively improve the drying rate of tiger nut particles and reduce the drying time of tiger nut particles. This is mainly because the greater the wind speed, the more air flows over the surface of the tiger nut in a unit of time, and the thinner the flow boundary layer, reducing the moisture content in the air. Therefore, by reducing the resistance to water vapor diffusion from the tiger nut surface to the air, moisture evaporation accelerated, and the time required for drying is reduced. However, when the fan wind speed is too high, it will consume a lot of energy, resulting in waste, and when the outlet wind speed is too high, it may exceed the suspension velocity of the particles, and the particles may overflow from the position of the air outlet, leading to losses in drying. Therefore, the best wind speed is about 4 m/s.

4. Conclusions

(1)
Using the principle of negative pressure micro-perforated air supply, the open-hole corner box is designed. The tiger nut model is established using EDEM, and the tiger nut drying process is simulated using CFD-DEM coupled simulation to verify the accuracy of the simulation model. Analysis of variance (ANOVA) is used to analyze the temperature and wind speed data of the simulation and test; it is concluded that there is no statistically significant difference between the test and simulation results. Therefore, the tiger nut drying process can be simulated better by using this model.
(2)
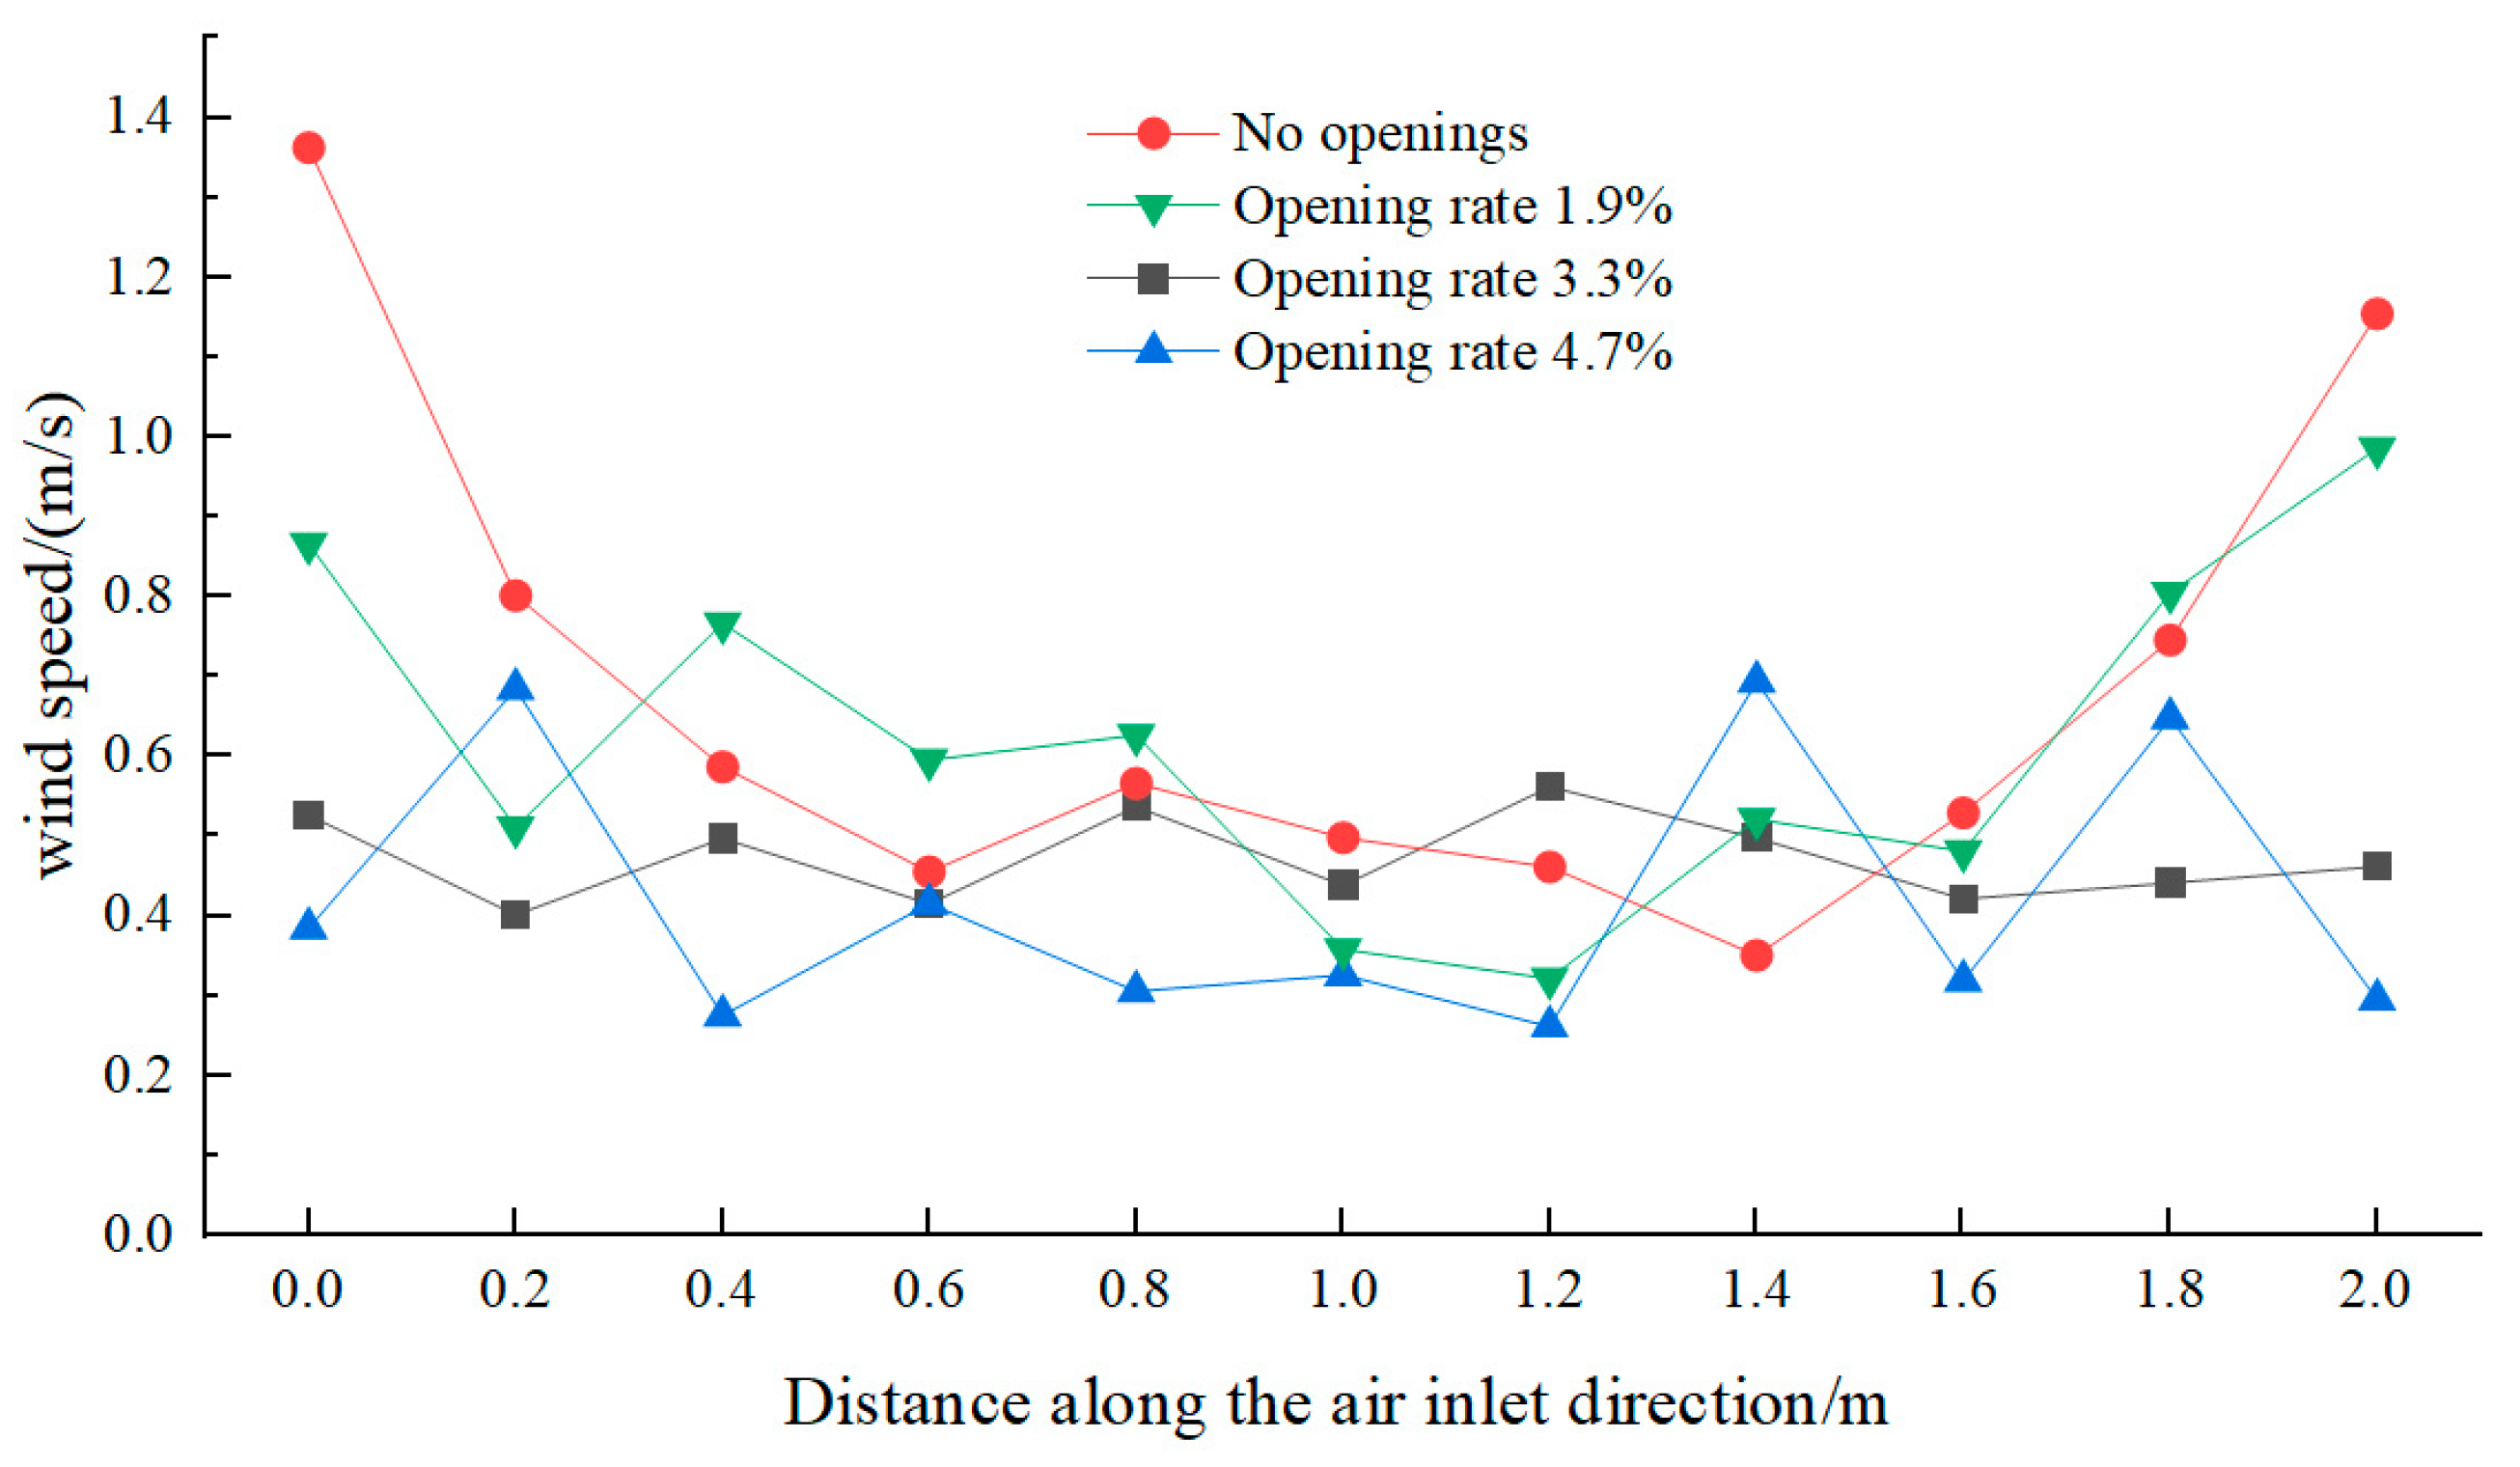
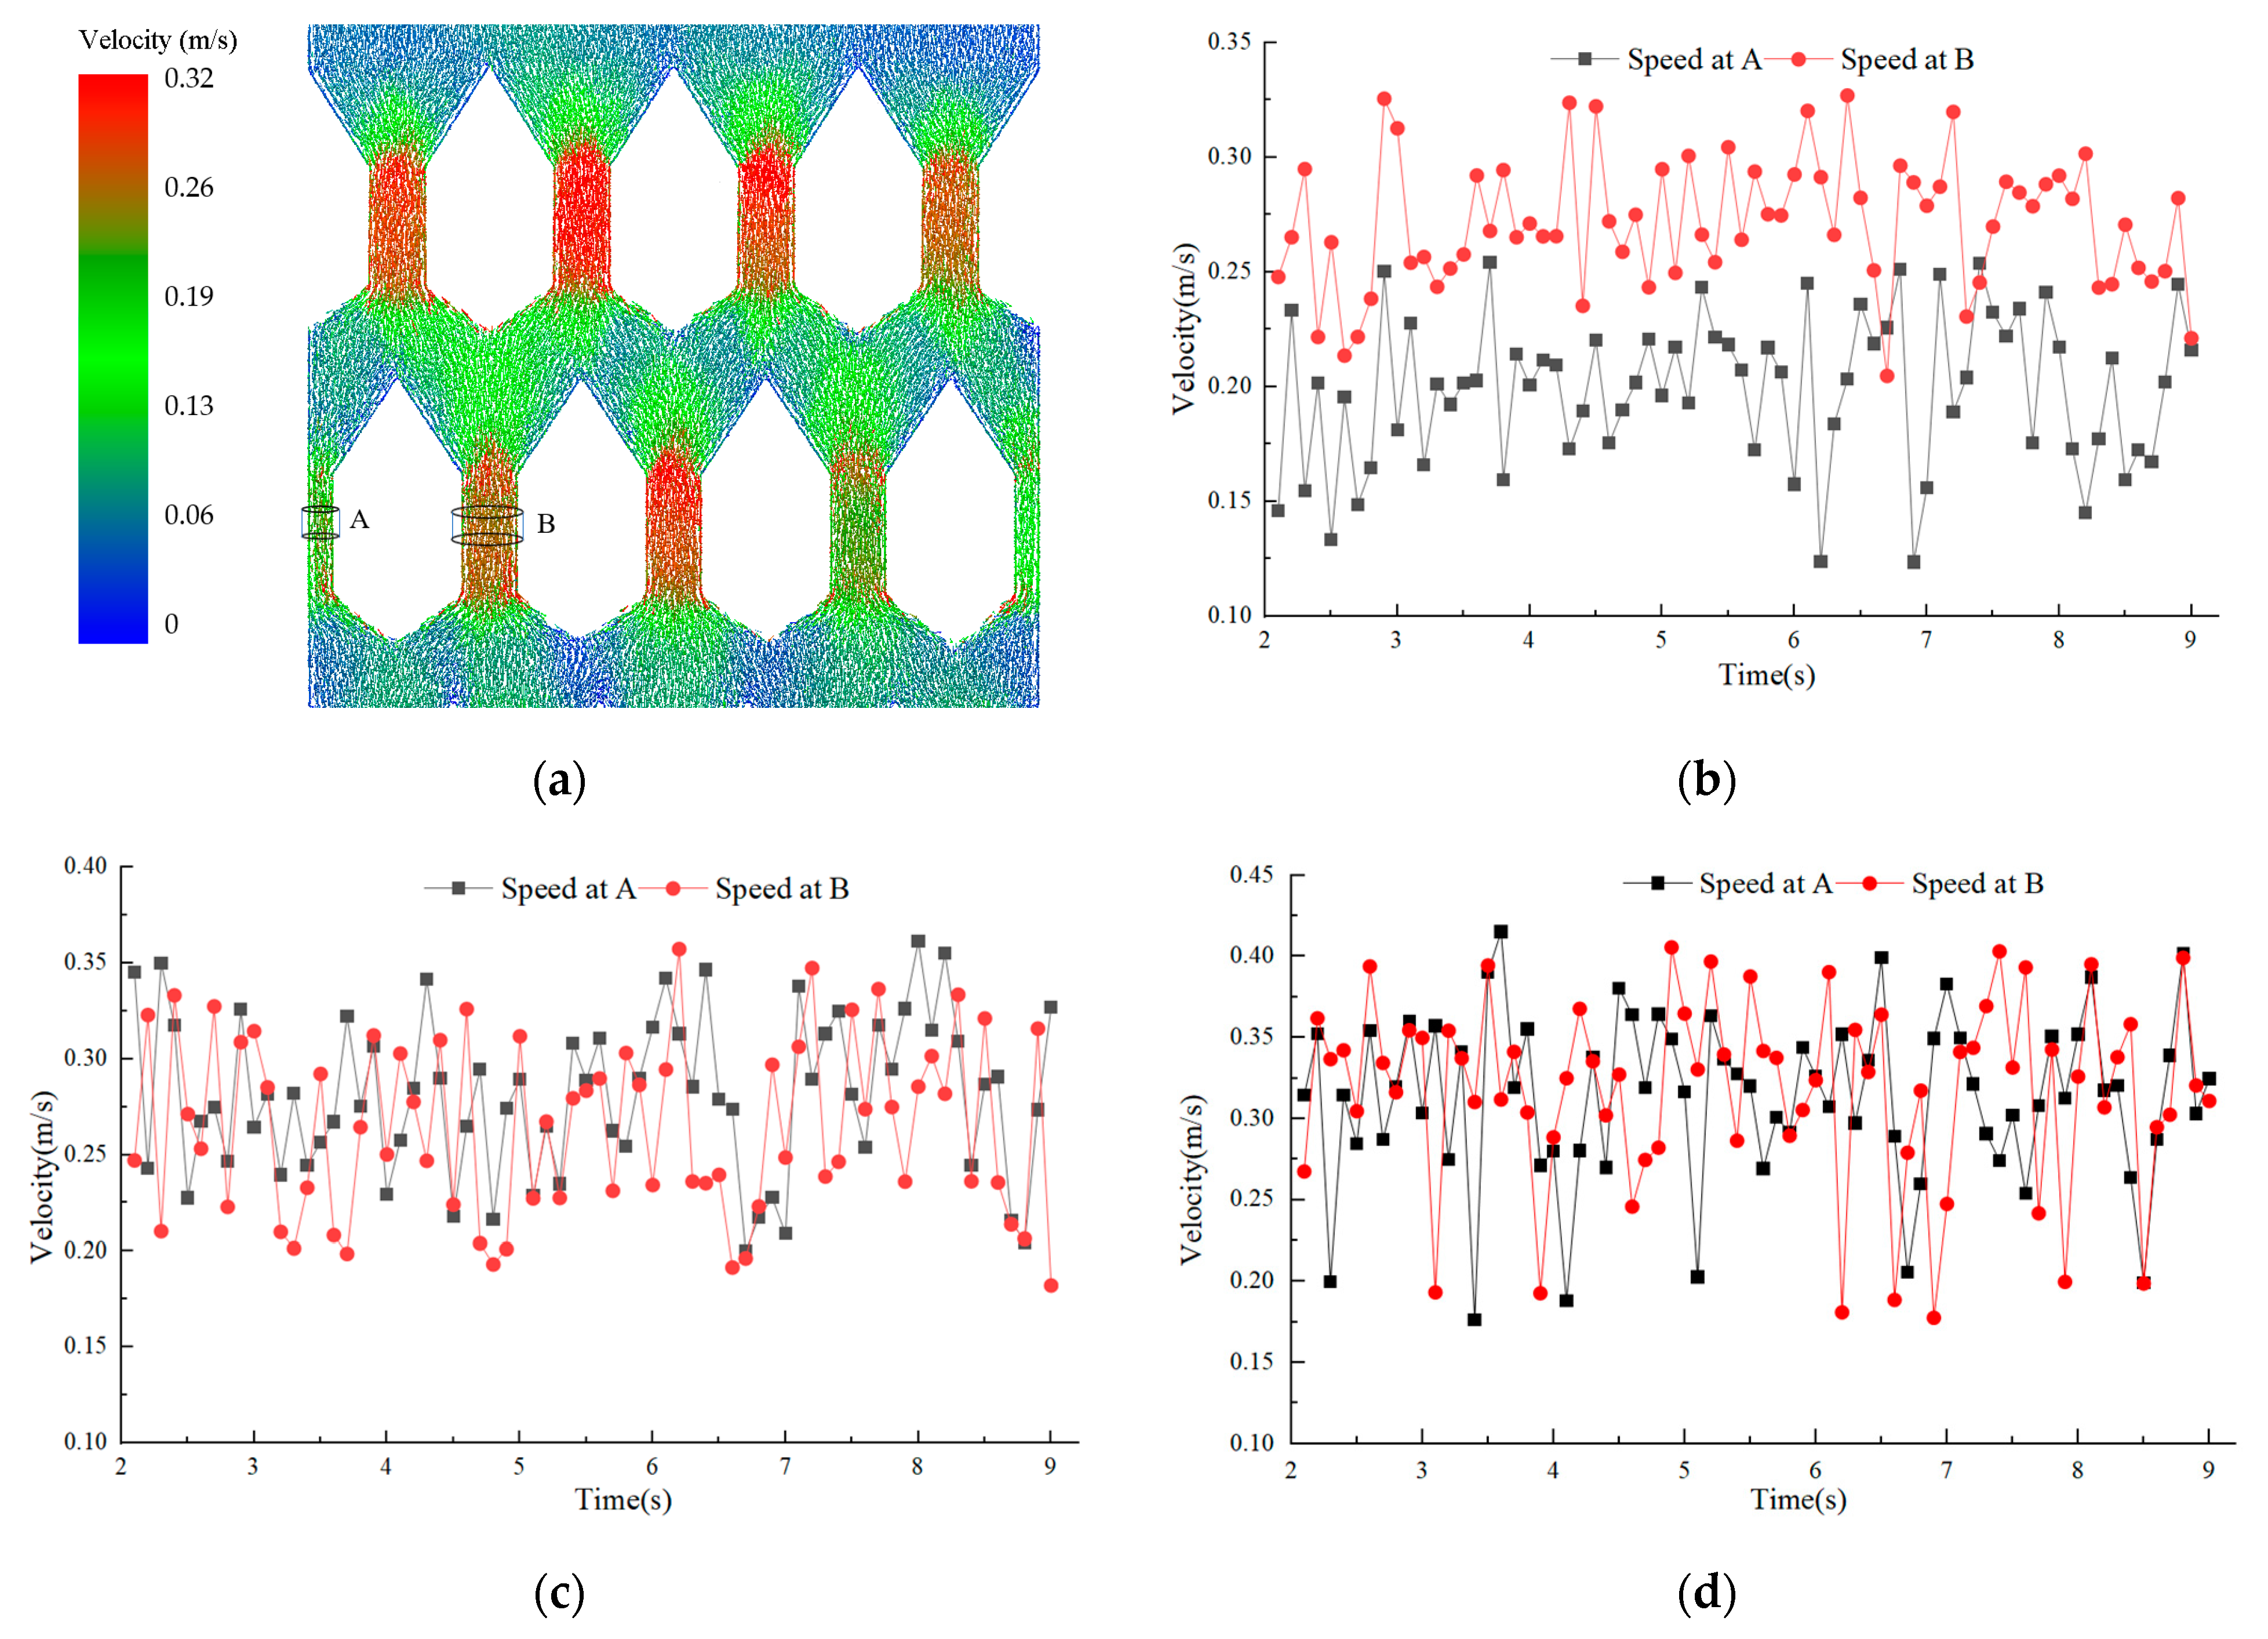
The wind fields of three corner boxes with different aperture ratios are compared and analyzed. The results show that the average wind speed below the air inlet increases gradually with the opening ratio increase. When the opening ratio is 0.33%, the wind field uniformity is better.
(3)
The influence of corner box distribution on changes in the water content of tiger nuts is analyzed. The consistency of water content distribution increases and then decreases with increasing lateral distance, and the flow rate of tiger nuts during grain discharge gradually increases. The rate of water content decrease gradually decreases with the longitudinal distance increase. When the lateral distance is 320 mm and the longitudinal distance is 420 mm, the water content of the grain is basically consistent.
(4)
The effects of different inlet wind speeds on the drying effect are analyzed. With the increase in wind speed, the temperature of the seeds warms up faster, the water content decreases faster, and the diffusion rate of water vapor increases faster. When the wind speed is 4 m/s, the temperature and water content of tiger nuts basically change in the same way, and the water content has good consistency. Therefore, this can provide a theoretical basis for the design of tiger nut drying equipment.

Author Contributions

Conceptualization, L.D. and Y.D.; methodology, L.D. and Y.D.; validation, Y.D., T.Y., J.L. and A.M.; formal analysis, Y.D., Y.Y. and J.L.; resources, L.D.; data curation, Y.D.; writing—original draft preparation, Y.D.; writing—review and editing, L.D., L.W. and H.L.; supervision, L.D. and H.L.; project administration, L.D. and H.L.; funding acquisition, L.D. and H.L. All authors have read and agreed to the published version of the manuscript.

Funding

Major Science and Technology Special Project of Henan Province: Technical Innovation and Integrated Application of Wheat and Corn Disaster Response under Abnormal Weather by Integrating Multi-source Data, National Modern Agricultural Industrial Technology System Project (CARS-04), Key Technologies R & D Program of Henan Province (222102110032), Henan Science and Technology R&D Program Joint Fund Project (232103810019).

Institutional Review Board Statement

Not applicable.

Data Availability Statement

The data used to support the results of this study are available from the corresponding authors upon request.

Acknowledgments

The authors would like to express their sincere gratitude to their colleagues and laboratories and to the reviewers who provided helpful suggestions for this manuscript.

Conflicts of Interest

The authors declare no conflicts of interest.

References

  1. Ezeh, O.; Gordon, M.; Niranjan, K. Enhancing the recovery of tiger nut (Cyperus esculentus) oil by mechanical pressing: Moisture content, particle size, high pressure and enzymatic pre-treatment effects. Food Chem. 2016, 194, 354–361. [Google Scholar] [CrossRef]
  2. Qu, Z.; Han, M.; Lv, Y.; Zhou, Z.; Lv, Z.; Wang, W.; He, X. Design and Test of a Crawler-Type Tiger-Nut Combine Harvester. Agriculture 2023, 13, 277. [Google Scholar] [CrossRef]
  3. Yu, Y.; Lu, X.; Zhang, T.; Zhao, C.; Guan, S.; Pu, Y.; Gao, F. Tiger Nut (Cyperus esculentus L.): Nutrition, Processing, Function and Applications. Foods 2022, 11, 601. [Google Scholar] [CrossRef] [PubMed]
  4. Jokiniemi, H.T.; Ahokas, J.M. Drying process optimisation in a mixed-flow batch grain dryer. Biosyst. Eng. 2014, 121, 209–220. [Google Scholar] [CrossRef]
  5. Mellmann, J.; Iroba, K.; Metzger, T.; Tsotsas, E.; Mészáros, C.; Farkas, I. Moisture content and residence time distributions in mixed-flow grain dryers. Biosyst. Eng. 2011, 109, 297–307. [Google Scholar] [CrossRef]
  6. Scaar, H.; Franke, G.; Weigler, F.; Delele, M.; Tsotsas, E.; Mellmann, J. Experimental and numerical study of the airflow distribution in mixed-flow grain dryers. Dry. Technol. 2016, 34, 595–607. [Google Scholar] [CrossRef]
  7. Cao, C.; Yang, D.; Liu, Q. Research on modeling and simulation of mixed flow grain dryer. Dry. Technol. 2007, 25, 681–687. [Google Scholar] [CrossRef]
  8. Weigler, F.; Scaar, H.; Mellmann, J. Investigation of particle and air flows in a mixed-flow dryer. Dry. Technol. 2012, 30, 1730–1741. [Google Scholar] [CrossRef]
  9. Keppler, I.; Kocsis, L.; Oldal, I.; Farkas, I.; Csatar, A. Grain velocity distribution in a mixed flow dryer. Adv. Powder Technol. 2012, 23, 824–832. [Google Scholar] [CrossRef]
  10. Jiang, Q.; Zhang, Y.; Yan, S.; Xu, L. Optimal design of an corner box for a mixed flow grain dryer. Appl. Eng. Agric. 2021, 37, 555–562. [Google Scholar] [CrossRef]
  11. Gang, C.; Ruili, G.; Lin, W. Optimized design and experimental study on rice negative pressure mixed flow drying chamber. Trans. CSAE 2021, 37, 87–96. [Google Scholar] [CrossRef]
  12. Visconcini, A.R.; Andrade, C.M.G.; de Souza Costa, A.M. Fluid flow simulation of industrial fixed bed mixed-flow grain dryer using k-ω SST turbulence model. Int. J. Agric. Biol. Eng. 2021, 14, 226–230. [Google Scholar] [CrossRef]
  13. Luo, H.; Li, C.; Zhang, Y. Design and experimental study of 5HP-25 type grain dryer. Trans. CSAE 2021, 37, 279–289. [Google Scholar] [CrossRef]
  14. Ma, H.; Zhou, L.; Liu, Z.; Chen, M.; Xia, X.; Zhao, Y. A review of recent development for the CFD-DEM investigations of non-spherical particles. Powder Technol. 2022, 412, 117972. [Google Scholar] [CrossRef]
  15. Handayani, S.U.; Wahyudi, H.; Agustina, S.; Yulianto, M.E.; Ariyanto, H.D. CFD-DEM Study of heat and mass transfer of ellipsoidal particles in fluidized bed dryers. Powder Technol. 2023, 425, 118535. [Google Scholar] [CrossRef]
  16. Wang, P.; Wang, H.; Zhang, R.; Hu, R.; Hao, B.; Huang, J. Numerical Simulation of an Online Cotton Lint Sampling Device Using Coupled CFD–DEM Analysis. Agriculture 2024, 14, 127. [Google Scholar] [CrossRef]
  17. Luo, X.; Yu, J.; Wang, B.; Wang, J. Heat transfer and hydrodynamics in stirred tanks with liquid-solid flow studied by CFD–DEM method. Processes 2021, 9, 849. [Google Scholar] [CrossRef]
  18. Yuan, Y.; Wang, J.; Zhang, X.; Zhao, S. Effect of Rotary Speed on Soil and Straw Throwing Process by Stubble-Crushing Blade for Strip Tillage Using DEM-CFD. Agriculture 2023, 13, 877. [Google Scholar] [CrossRef]
  19. Che, H.; Wang, H.; Xu, L.; Ge, R. Investigation of gas-solid heat and mass transfer in a Wurster coater using a scaled CFD-DEM model. Powder Technol. 2022, 406, 117598. [Google Scholar] [CrossRef]
  20. Xiao, Y.; Ma, Z.; Wu, M.; Luo, H. Numerical Study of Pneumatic Conveying of Rapeseed through a Pipe Bend by DEM-CFD. Agriculture 2022, 12, 1845. [Google Scholar] [CrossRef]
  21. Lan, B.; Zhao, P.; Xu, J.; Zhao, B.; Zhai, M.; Wang, J. CFD-DEM-IBM simulation of particle drying processes in gas-fluidized beds. Chem. Eng. Sci. 2022, 255, 117653. [Google Scholar] [CrossRef]
  22. Guo, R.; Bai, J.; Wu, F.; Wang, J.; Ma, X.; Hui, Z. CFD–DEM simulation of wet granular-fluid flows and heat transfer in an integral multi-jet spout-fluidized bed. Powder Technol. 2022, 403, 117384. [Google Scholar] [CrossRef]
  23. Sousani, M.; Hobbs, A.M.; Anderson, A.; Wood, R. Accelerated heat transfer simulations using coupled DEM and CFD. Powder Technol. 2019, 357, 367–376. [Google Scholar] [CrossRef]
  24. Khomwachirakul, P.; Devahastin, S.; Swasdisevi, T.; Soponronnarit, S. Simulation of flow and drying characteristics of high-moisture particles in an impinging stream dryer via CFD-DEM. Dry. Technol. 2016, 34, 403–419. [Google Scholar] [CrossRef]
  25. Aziz, H.; Ahsan, S.; De Simone, G.; Gao, Y.; Chaudhuri, B. Computational modeling of drying of pharmaceutical wet granules in a fluidized bed dryer using coupled CFD-DEM approach. Aaps Pharmscitech 2022, 23, 59. [Google Scholar] [CrossRef] [PubMed]
  26. Thornton, C. Granular Dynamics, Contact Mechanics and Particle System Simulations; A DEM Study; Particle Technology Series; Springer International Publishing: Cham, Switzerland, 2015; p. 24. [Google Scholar] [CrossRef]
  27. Shi, D. Advanced Simulation of Particle Processing: The Roles of Cohesion, Mass and Heat Transfer in Gas-Solid Flows. Ph.D. Thesis, University of Pittsburgh, Pittsburgh, PA, USA, 2008. [Google Scholar]
  28. Che, G.; Chen, W.; Wu, C.; Li, H.; Jin, Z.; Wan, L. Design and experiment of large-scale 5HFS-10 type automatic control negative pressure grain dryer. Trans. CSAE 2017, 33, 267–275. [Google Scholar] [CrossRef]
  29. Pan, Y. Modern Drying Technology; Chemical Industry Press: Beijing, China, 2007. [Google Scholar]
  30. Usman, D.; Adanu, E.; Jahun, B.; Ibrahim, K. Effect of moisture content variation on thermo-physical properties of brown variety Tigernut (Cyperus esculentus). Arid. Zone J. Eng. Technol. Environ. 2019, 15, 714–724. [Google Scholar]
  31. Chen, Z.; Che, G.; Wan, L.; Wang, H.; Qu, T.; Zhang, Q. Numerical simulation and experiment of four-way ventilation mixed flow drying section for rice. Trans. CSAE 2022, 38, 237–247. [Google Scholar] [CrossRef]
  32. Li, H.; Niu, X.; Chai, J.; Guo, C.; Sun, Y.; Li, J.; Li, C. Optimization of hot air drying process for tiger nut and analysis of fatty acid composition of tiger nut oil. Int. J. Agric. Biol. Eng. 2021, 14, 228–236. [Google Scholar] [CrossRef]
  33. Chen, Y.; Gao, X.; Jin, X.; Ma, X.; Hu, B.; Zhang, X. Calibration and Analysis of Seeding Parameters of Cyperus esculentus Seeds Based on Discrete Element Simulation. Trans. Chin. Soc. Agric. Mach. 2023, 54, 58–69. [Google Scholar]
  34. He, X.; Lv, Y.; Qu, Z.; Wang, W.; Zhou, Z.; He, H. Parameters Optimization and Test of Caterpillar Self-Propelled Tiger Nut Harvester Hoisting Device. Agriculture 2022, 12, 1060. [Google Scholar] [CrossRef]
  35. Chen, P.; Han, Y.; Jia, F.; Zhao, D.; Meng, X.; Li, A.; Chu, Y.; Zhao, H. Investigation of the mechanism of aerodynamic separation of rice husks from brown rice following paddy hulling by coupled CFD-DEM. Biosyst. Eng. 2022, 218, 200–215. [Google Scholar] [CrossRef]
  36. Lin, J.; Bao, M.; Li, H.; Yang, J. Characteristic simulation and working parameter optimization of the aggregate dryer. Dry. Technol. 2023, 41, 590–604. [Google Scholar] [CrossRef]
  37. Iroba, K.; Weigler, F.; Mellmann, J.; Metzger, T.; Tsotsas, E. Residence time distribution in mixed-flow grain dryers. Dry. Technol. 2011, 29, 1252–1266. [Google Scholar] [CrossRef]
  38. Mellmann, J.; Weigler, F.; Scaar, H. Research on procedural optimization and development of agricultural drying processes. Dry. Technol. 2019, 37, 569–578. [Google Scholar] [CrossRef]
Figure 1. Schematic diagram of tiger nut seed’s triaxial size. In the figure, L 0 is the length of tiger nut seeds; w 0 is the width of tiger nut seeds; and t 0 is the tiger nut seed thickness.
Agriculture 14 00541 g001
Figure 2. Tiger nut seed particle physical map and discrete element model.
Agriculture 14 00541 g002
Figure 3. (a) Overall structure of tiger nut mixed-flow drying tower; (b) corner box arrangement and structure diagram. In the figure, 1. Slow supply section; 2. inlet air duct; 3. drying chamber; 4. natural gas burner; 5. hot-air blower; 6. discharge screw conveyor; 7. inlet; 8. bucket elevator; 9. grain equalizer; 10. inlet screw conveyor; 11. corner box openings; 12. corner box; 13. air inlet; 14. air outlet.
Agriculture 14 00541 g003
Figure 4. Schematic diagram of the corner box structure.
Agriculture 14 00541 g004
Figure 5. (a) Schematic diagram of the distribution of boxed corners in the three lateral positions; (b) schematic diagram of the distribution of boxed corners in the three longitudinal positions.
Agriculture 14 00541 g005
Figure 6. Mesh model of drying cell with a lateral distance of 320 mm in DEM and CFD.
Agriculture 14 00541 g006
Figure 7. Tiger nut drying validation testbed.
Agriculture 14 00541 g007
Figure 8. Variation in average temperature over time at simulation and experimental monitoring points.
Agriculture 14 00541 g008
Figure 9. Wind speed distribution in drying room; (a) simulated wind speed distribution at air inlet; (b) wind speed distribution at air inlet test; (c) simulated wind speed distribution at air outlet; (d) wind speed distribution at air outlet test.
Agriculture 14 00541 g009aAgriculture 14 00541 g009b
Figure 10. Comparison between experimental and simulation results.
Agriculture 14 00541 g010
Figure 11. Distribution of wind speed for corner boxes with different aperture ratios.
Agriculture 14 00541 g011
Figure 12. Temperature field and wind field distribution at different lateral distances.
Agriculture 14 00541 g012
Figure 13. Changes in temperature and moisture content of tiger nut seeds at different lateral distances.
Agriculture 14 00541 g013
Figure 14. Grain velocity analysis. (a) schematic diagram of grain velocity distribution in drying chamber; (b) The change of seed velocity when the lateral distance is 240 mm; (c) The change of seed velocity when the lateral distance is 320 mm; (d) The change of seed velocity when the lateral distance is 480 mm.
Agriculture 14 00541 g014
Figure 15. Temperature and wind field distribution at different longitudinal distances.
Agriculture 14 00541 g015
Figure 16. Changes in the temperature and moisture content of tiger nut seeds with different longitudinal distances.
Agriculture 14 00541 g016
Figure 17. Wind field distribution under different wind speeds.
Agriculture 14 00541 g017
Figure 18. Temperature and moisture content changes of tiger nut seeds (a) and the water vapor diffusion rate at the outlet under different wind speeds (b).
Agriculture 14 00541 g018
Table 1. Three-axis size of tiger nut seeds.
Shape and Size L 0 W 0 t 0
FlatAverage value (mm)14.189.126.76
Standard deviation (mm)0.910.820.61
SpheroidAverage value (mm)12.2410.189.56
Standard deviation (mm)1.10.880.92
SphericalAverage value (mm)9.318.147.94
Standard deviation (mm)0.780.850.79
Table 2. CFD input parameters.
CFD Input Parameters
AirType of fluidAir
Density (kg/m3)1.225
Specific heat capacity (j/Kg·K)4506.43
Viscosity (Pa·s)
Wind speed (m/s)
Wind temperature(K)
1.789 × 10⁻⁵
2, 4, 6
338
Thermal conductivity (W/m·K)0.0242
DPM injectionInitial temperature (K)288
Drag law
Water content of particles (%)
Gidaspow
45
WallsAdiabatic and no slip
Turbulence modelStandard k-ε
CFD cell typeHybrid tetrahedral hexahedral
CFD time step (sec)0.05
Table 3. EDEM Input parameters.
EDEM Input Parameters
Particle density (kg/m3)1.186 × 103
Particle diameter (mm)16
Particle shear modulus (Pa)2.77 × 10⁷
Particle Poisson’s ratio0.18
Geometry density (kg/m3)7850
Geometry shear modulus (Pa)1 × 10¹⁰
Geometry Poisson’s ratio0.3
Particle–particle coefficient of restitution0.48
Particle–particle static friction coefficient0.34
Particle–particle rolling friction coefficient0.1
Particle–geometry coefficient of restitution0.619
Particle–geometry static friction coefficient0.254
Particle–geometry rolling coefficient0.072
EDEM time step (s)1 × 10⁻⁴
Particle gravity (m/s2)
Thermal conductivity (W/(m·k))
Specific heat capacity (J/(kg·k))
9.81
0.106
15,920
Table 4. Analysis of variance for inlet air temperature.
Origin of VarianceSum of SquaresdfMean SquaresF Valuep Value
Different groups15.59608115.596080.112690.740983
Interior groups2491.16518138.3981
Total2506.76219
Extremely significant at p < 0.001.
Table 5. Analysis of variance for outlet air temperature.
Origin of VarianceSum of SquaresdfMean SquaresF Valuep Value
Different groups34.11533134.115330.2679780.610995
Interior groups2291.51318127.3063
Total2325.62819
Extremely significant at p < 0.001.
Table 6. Analysis of variance for inlet air velocity.
Origin of VarianceSum of SquaresdfMean SquaresF Valuep-Value
Sample0.00277860.0004630.2220590.967812
Columns0.11797860.0196639.4320447.03 × 10−7
Interaction0.009594360.0002660.1278351
Interior-groups0.10215490.002085
Total0.23249997
Extremely significant at p < 0.001.
Table 7. Analysis of variance for outlet air velocity.
Origin of VarianceSum of SquaresdfMean SquaresF Valuep-Value
Sample0.15939660.02656614.187182.75 × 10−9
Columns0.00166360.0002770.1480120.988613
Interaction0.010264360.0002850.1522641
Interior-groups0.091754490.001873
Total0.26307797
Extremely significant at p < 0.001.
Disclaimer/Publisher’s Note: The statements, opinions and data contained in all publications are solely those of the individual author(s) and contributor(s) and not of MDPI and/or the editor(s). MDPI and/or the editor(s) disclaim responsibility for any injury to people or property resulting from any ideas, methods, instructions or products referred to in the content.

