_Cheng.png)

Effect of Preparation Process on the Physicochemical Properties of Activated Carbon Prepared from Corn Stalks

Abstract
1. Introduction
2. Material and Methods
2.1. Materials
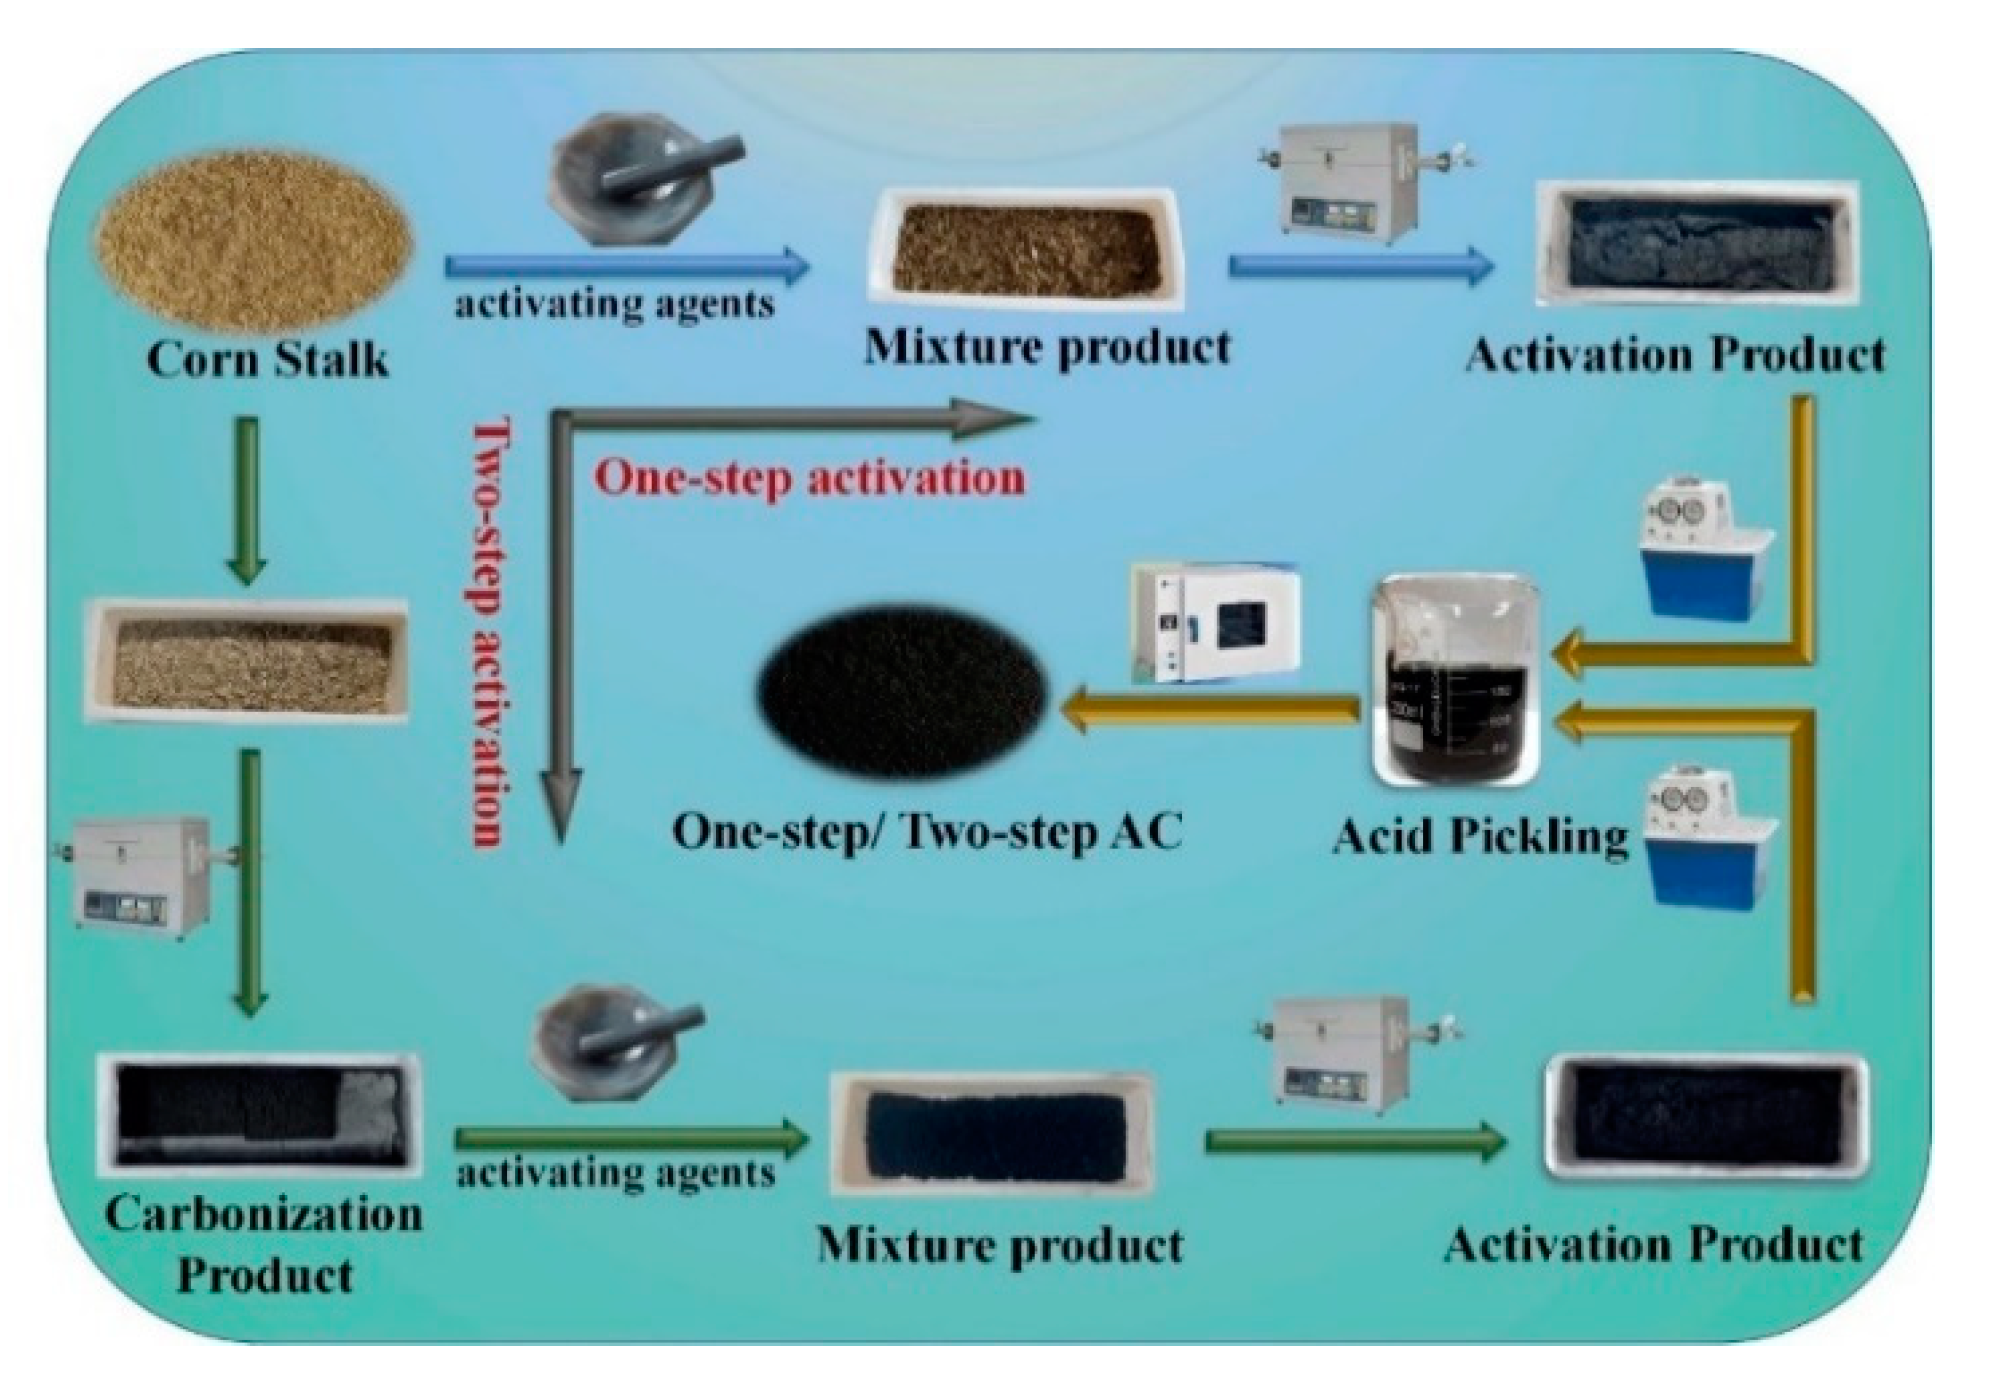
2.2. Preparation of AC
2.3. Analytical Methods
2.3.1. Pyrolysis Characteristics of Biomass and AC
2.3.2. Characterization of AC
3. Results and Discussion
3.1. Thermal Decomposition Properties of Biomass and AC
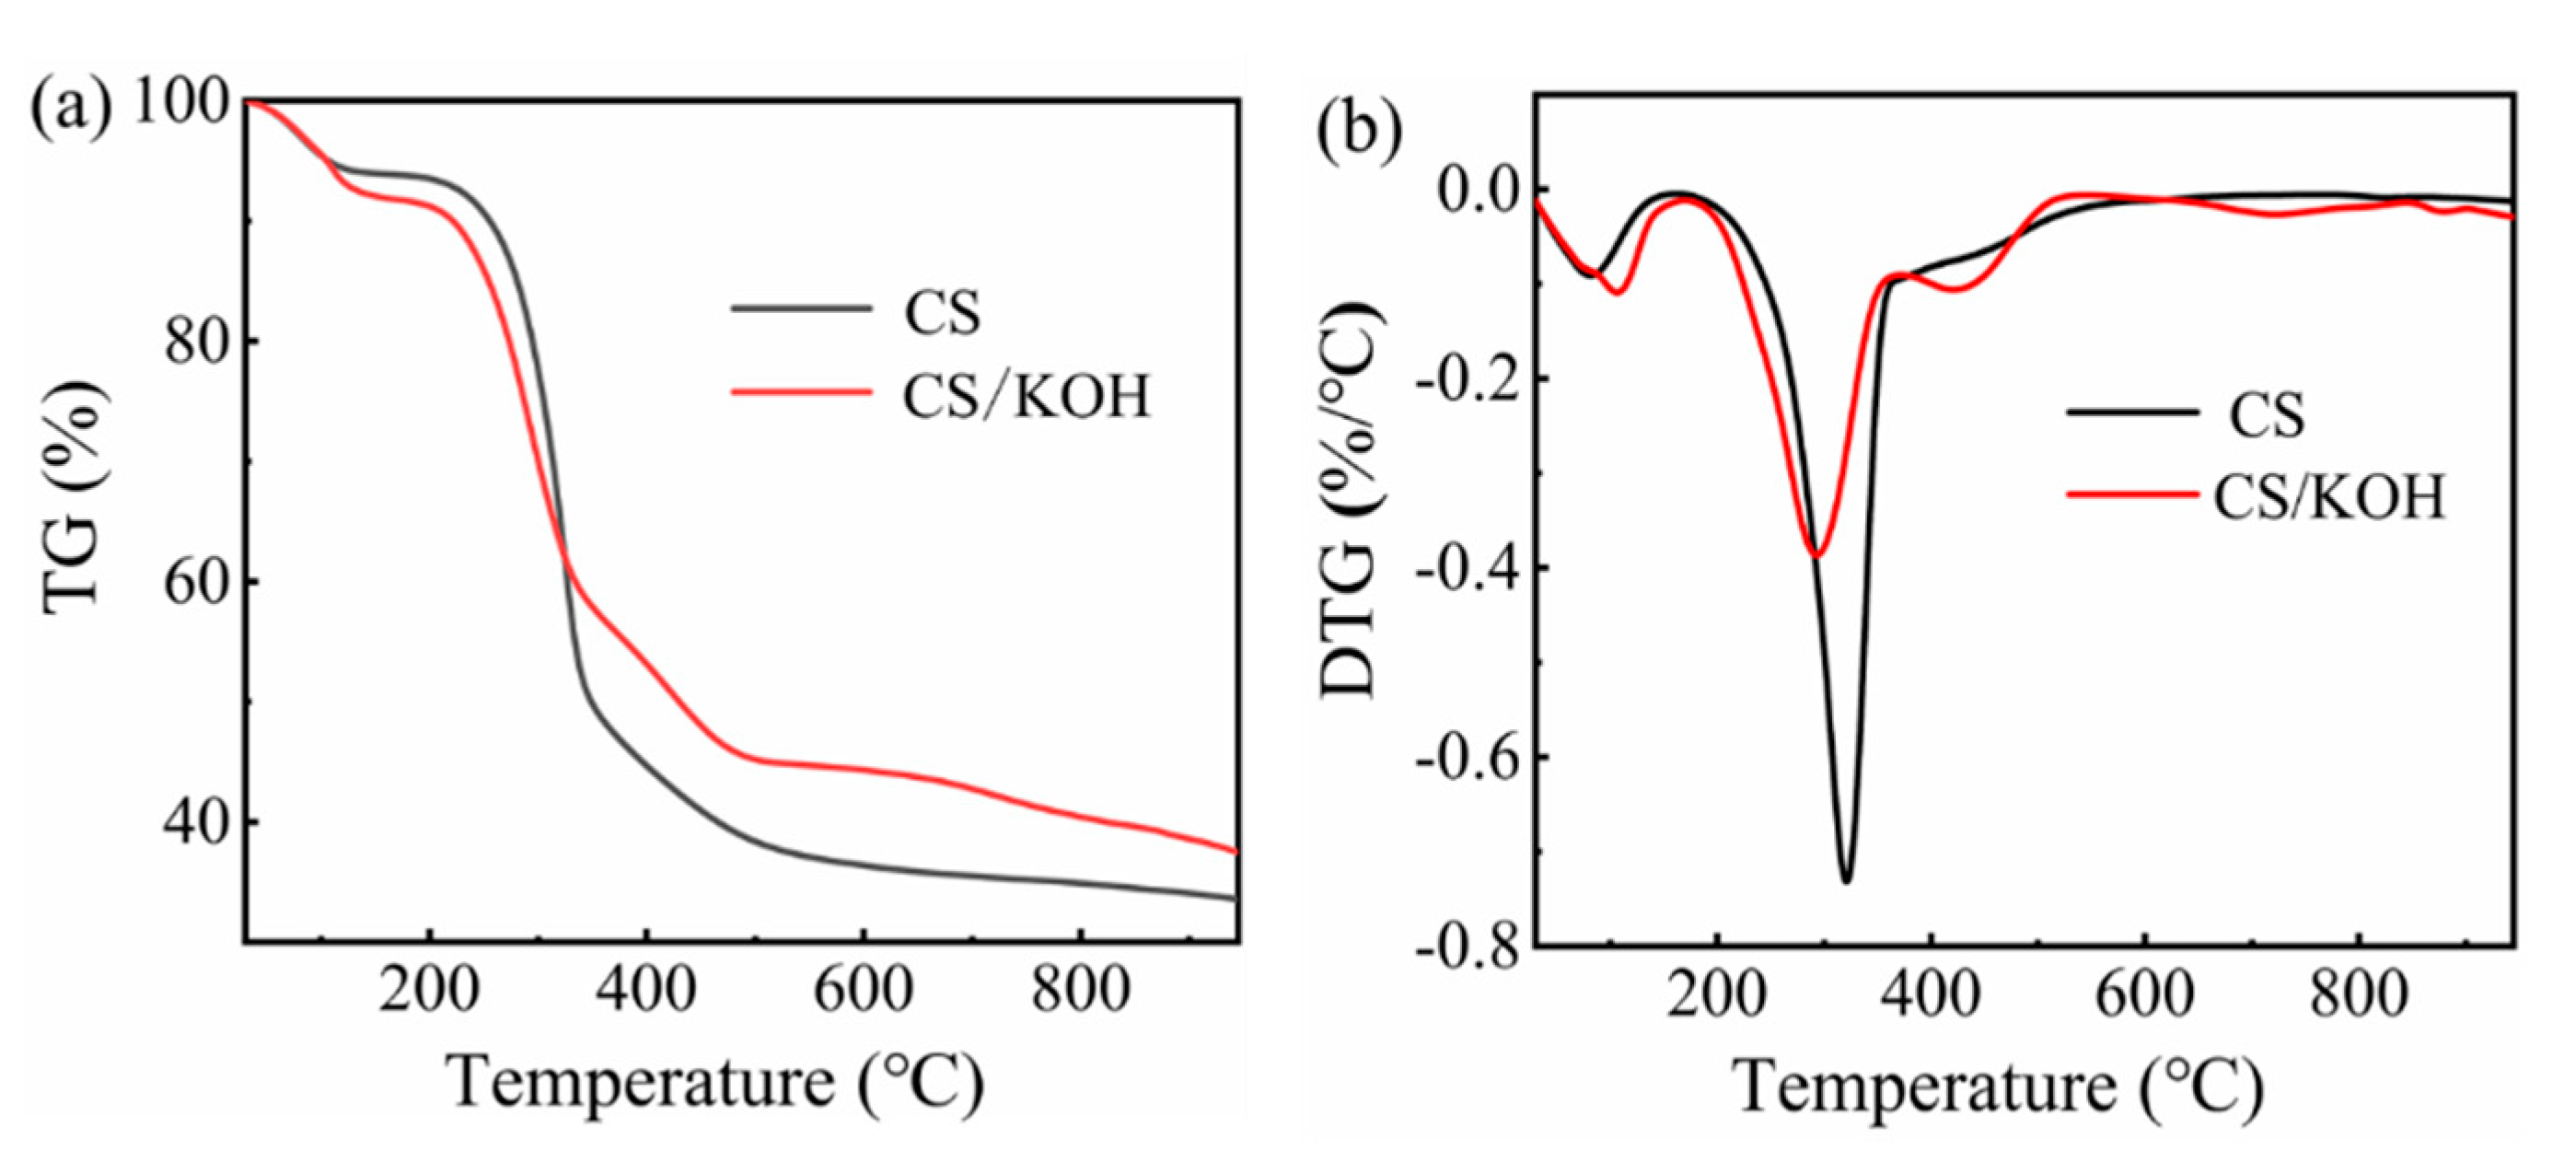
3.1.1. Thermal Decomposition Properties of Biomass
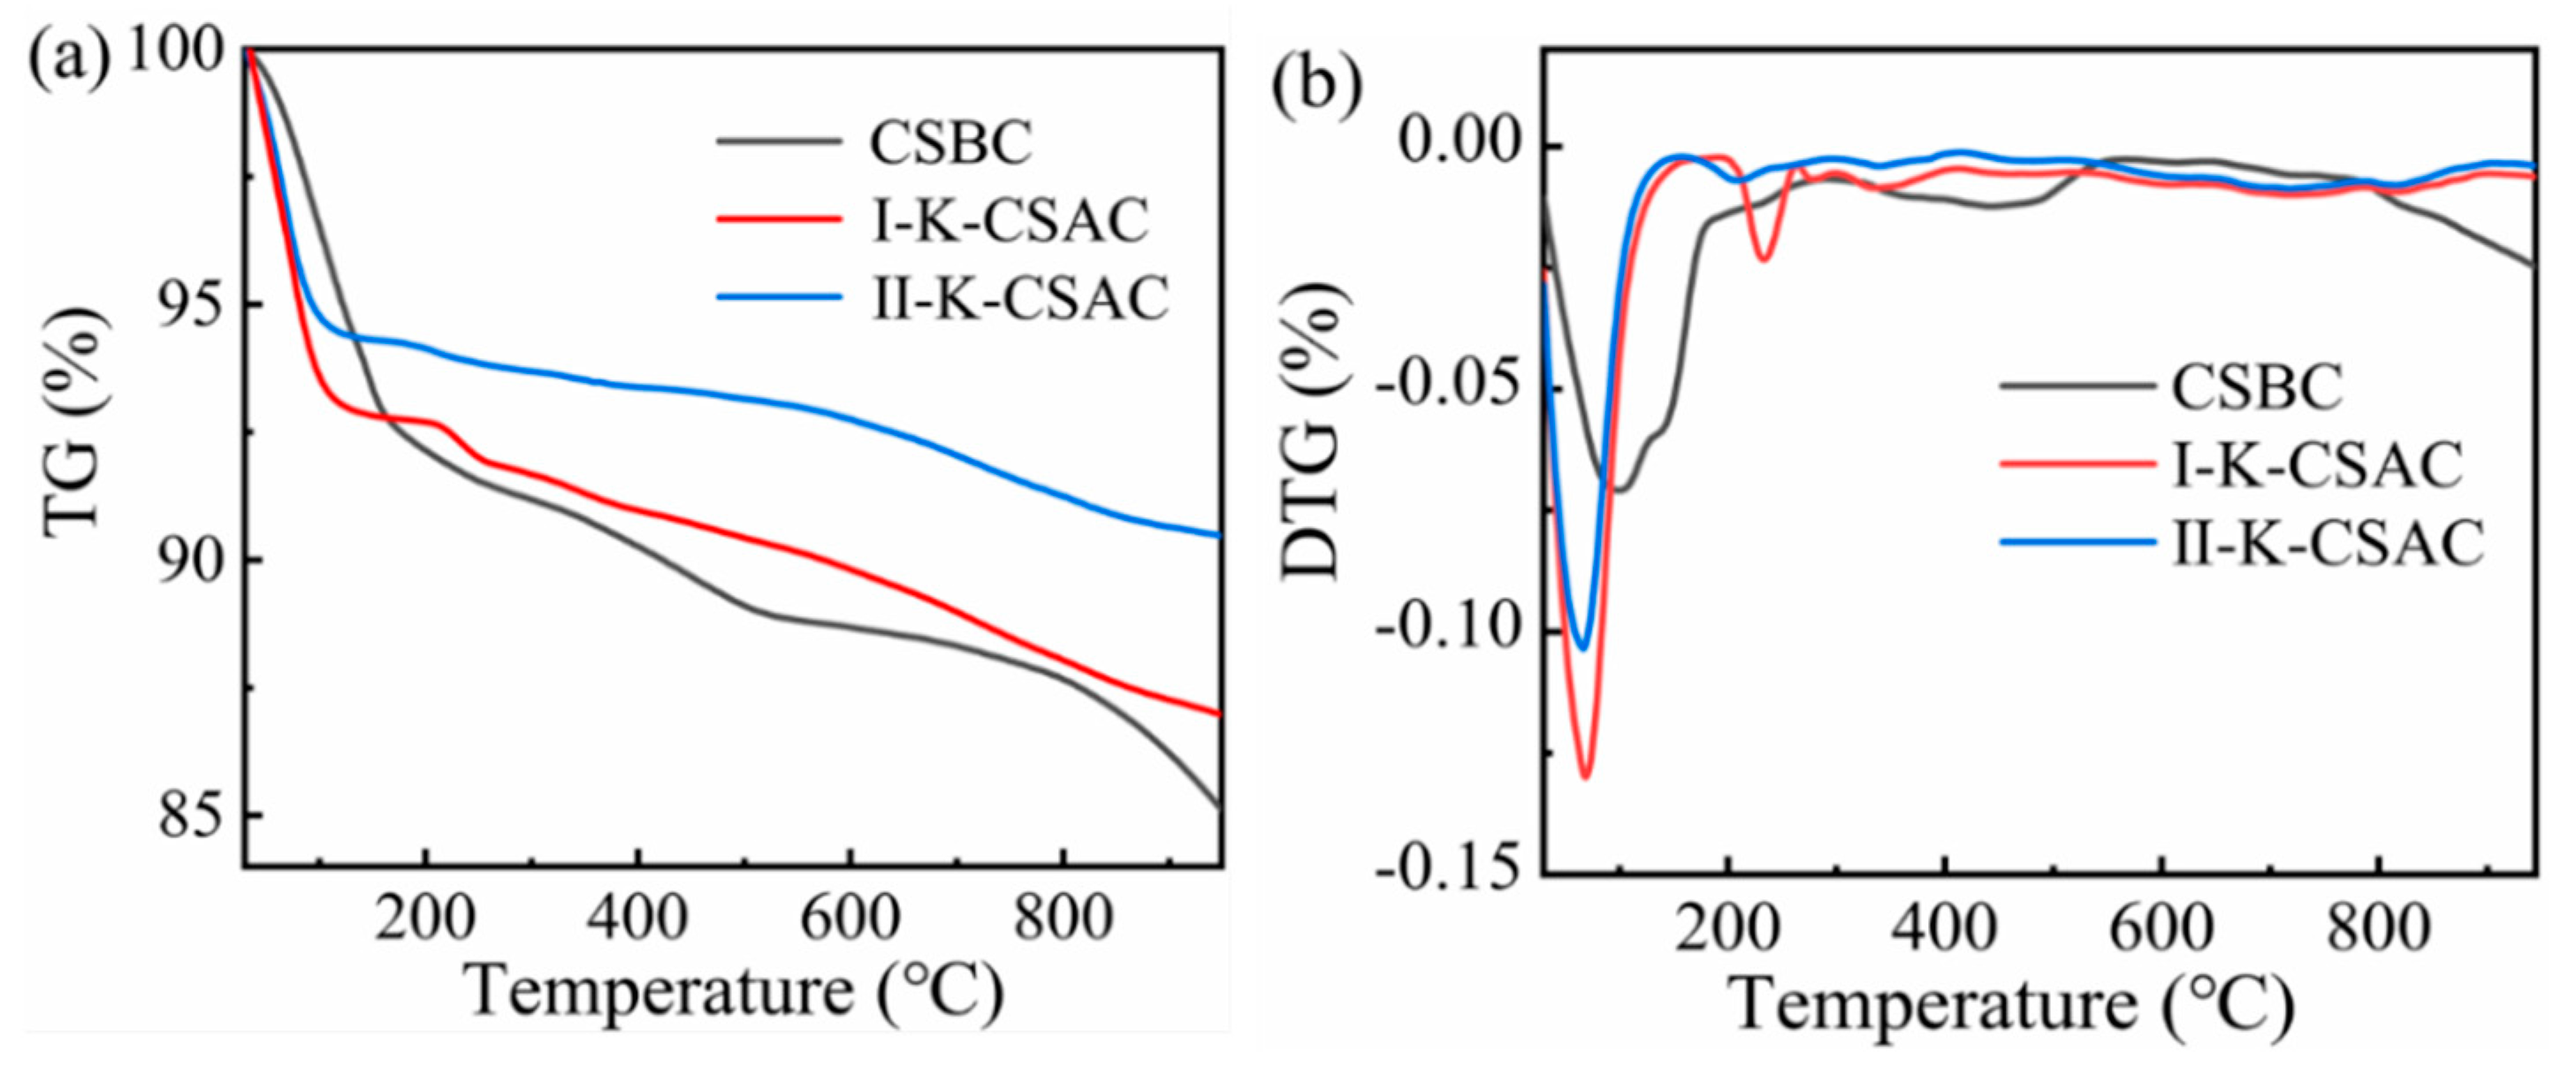
3.1.2. Thermal Decomposition Properties of AC
3.2. Effect of Preparation Method on Properties of AC
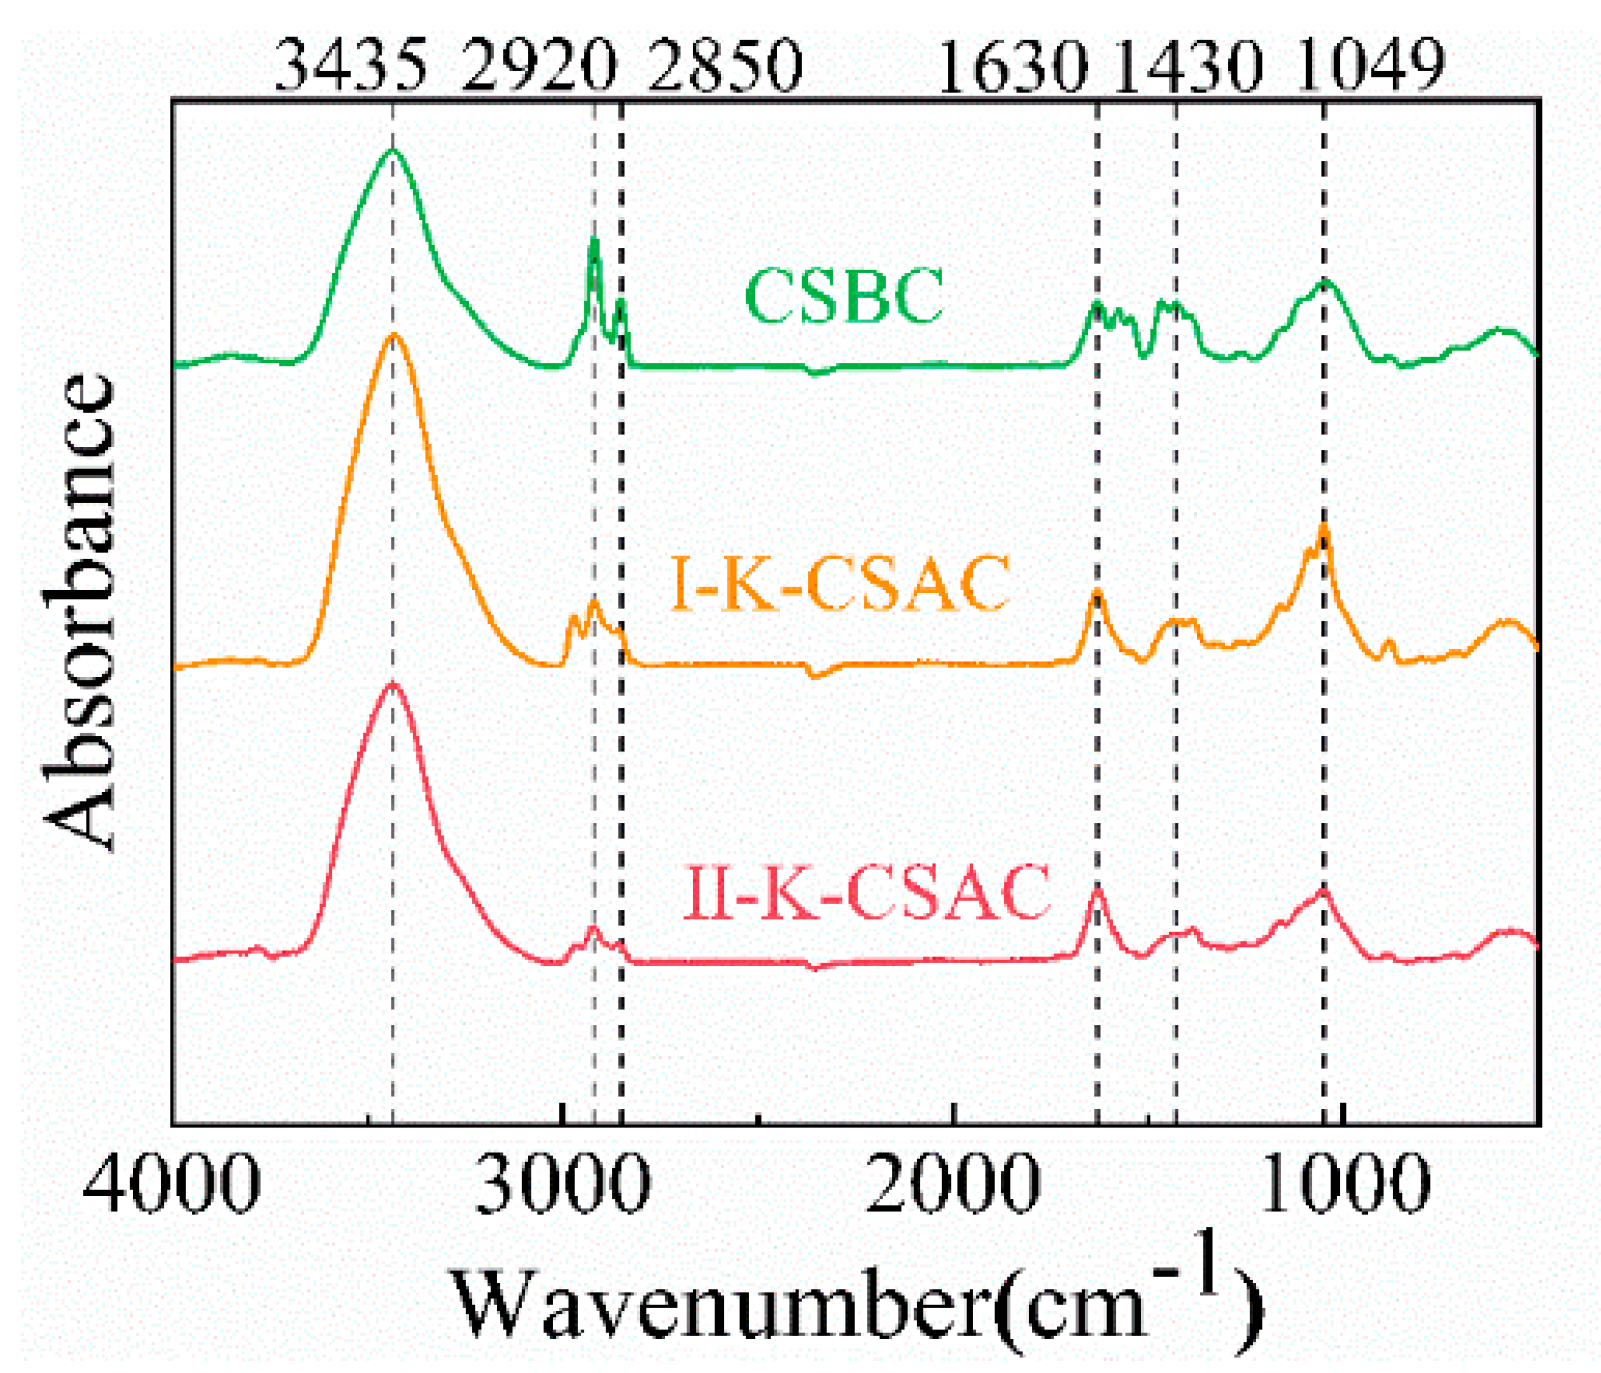
3.2.1. FTIR Analysis
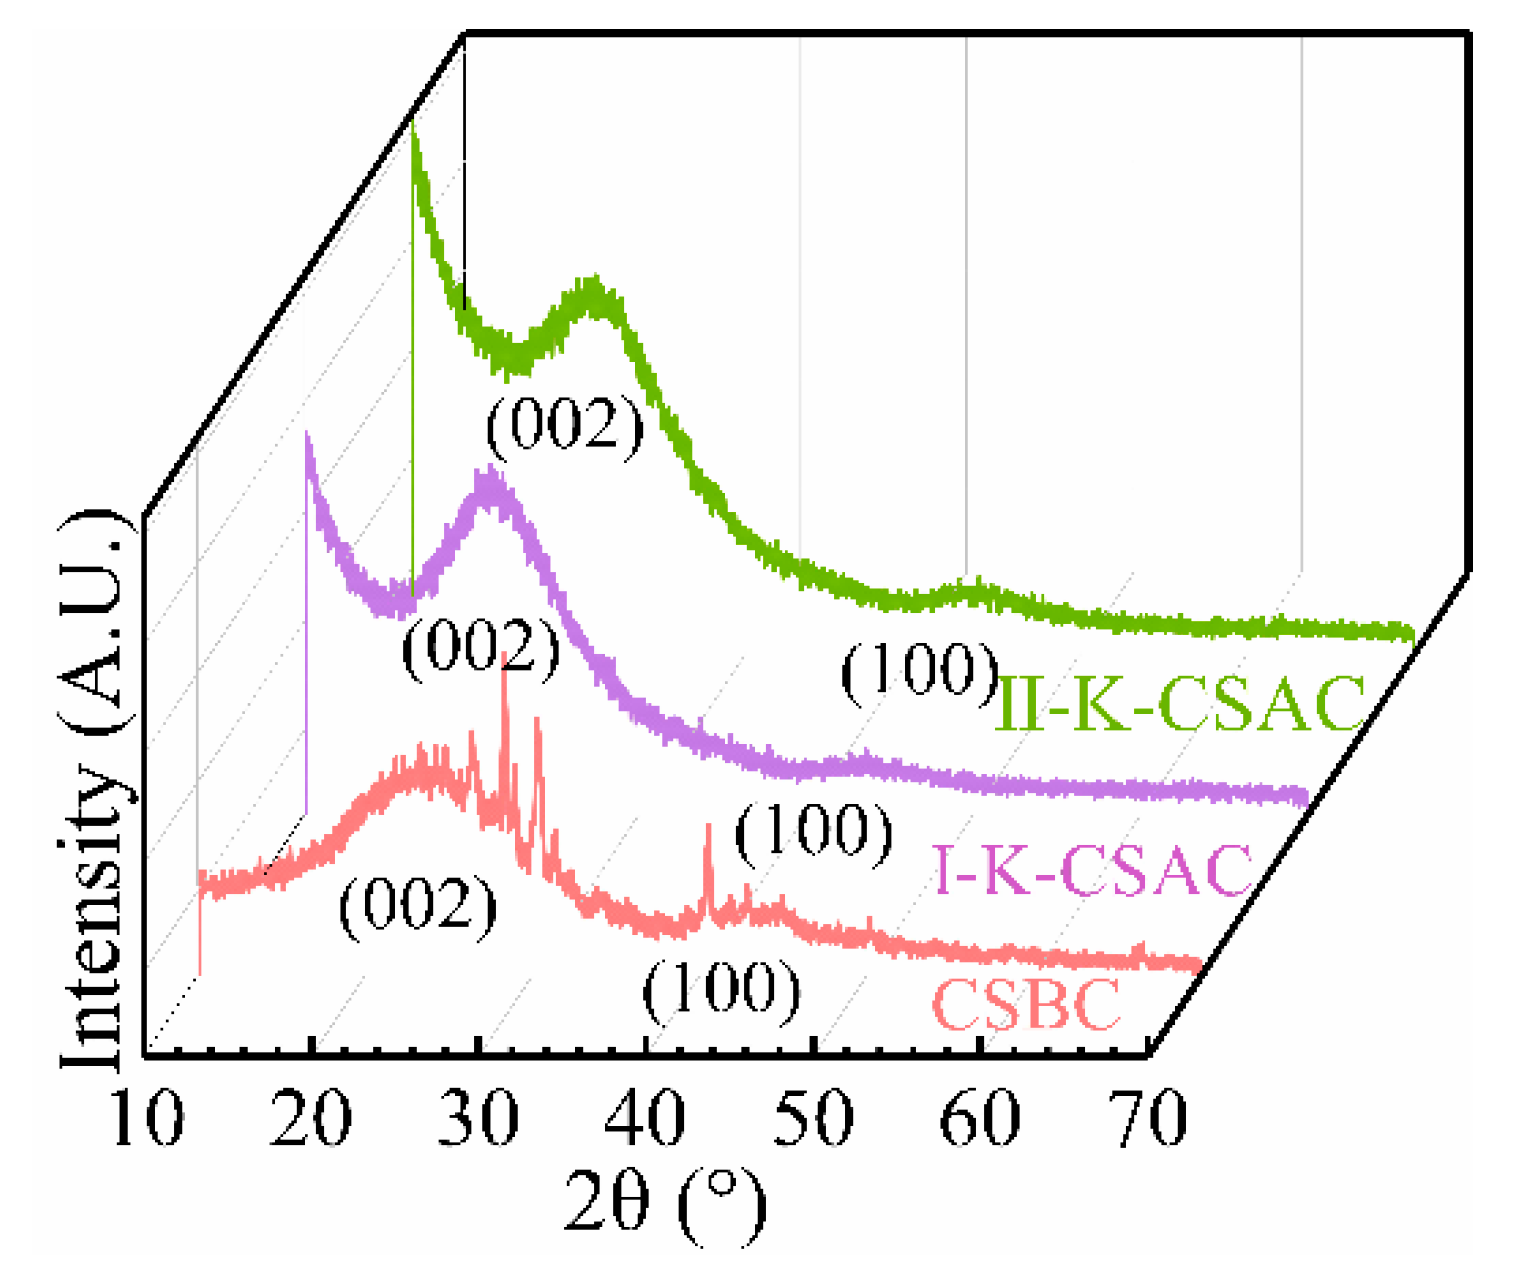
3.2.2. XRD Analysis
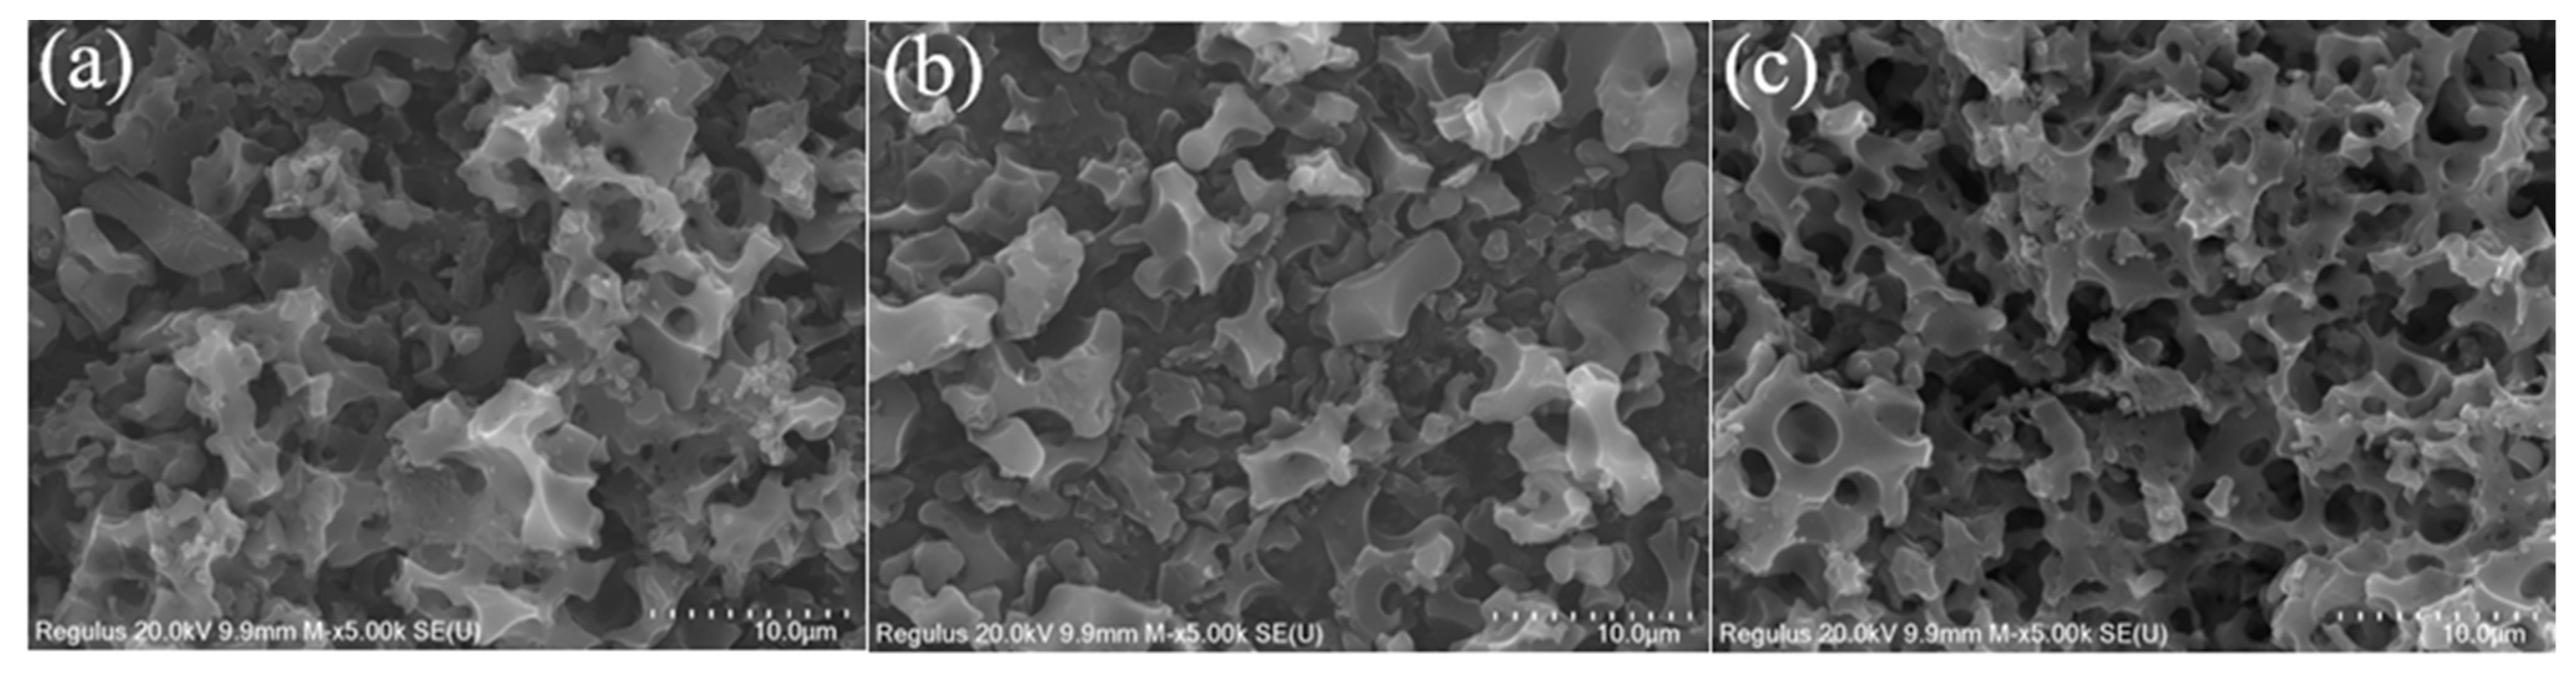
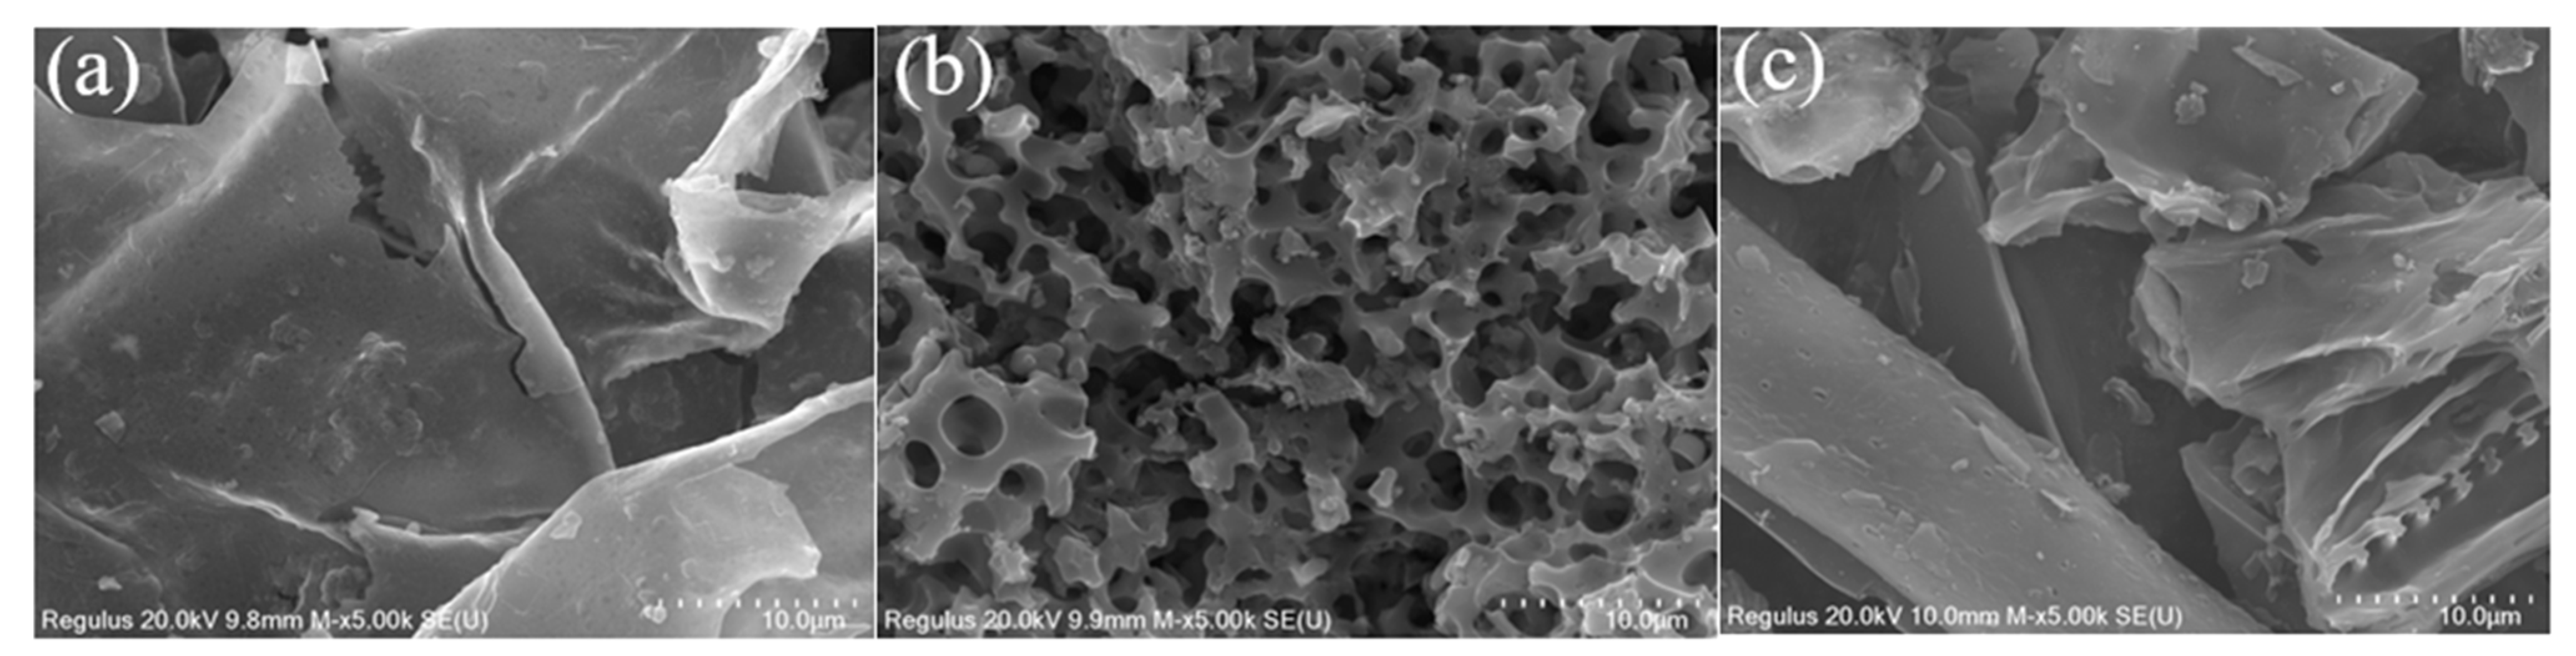
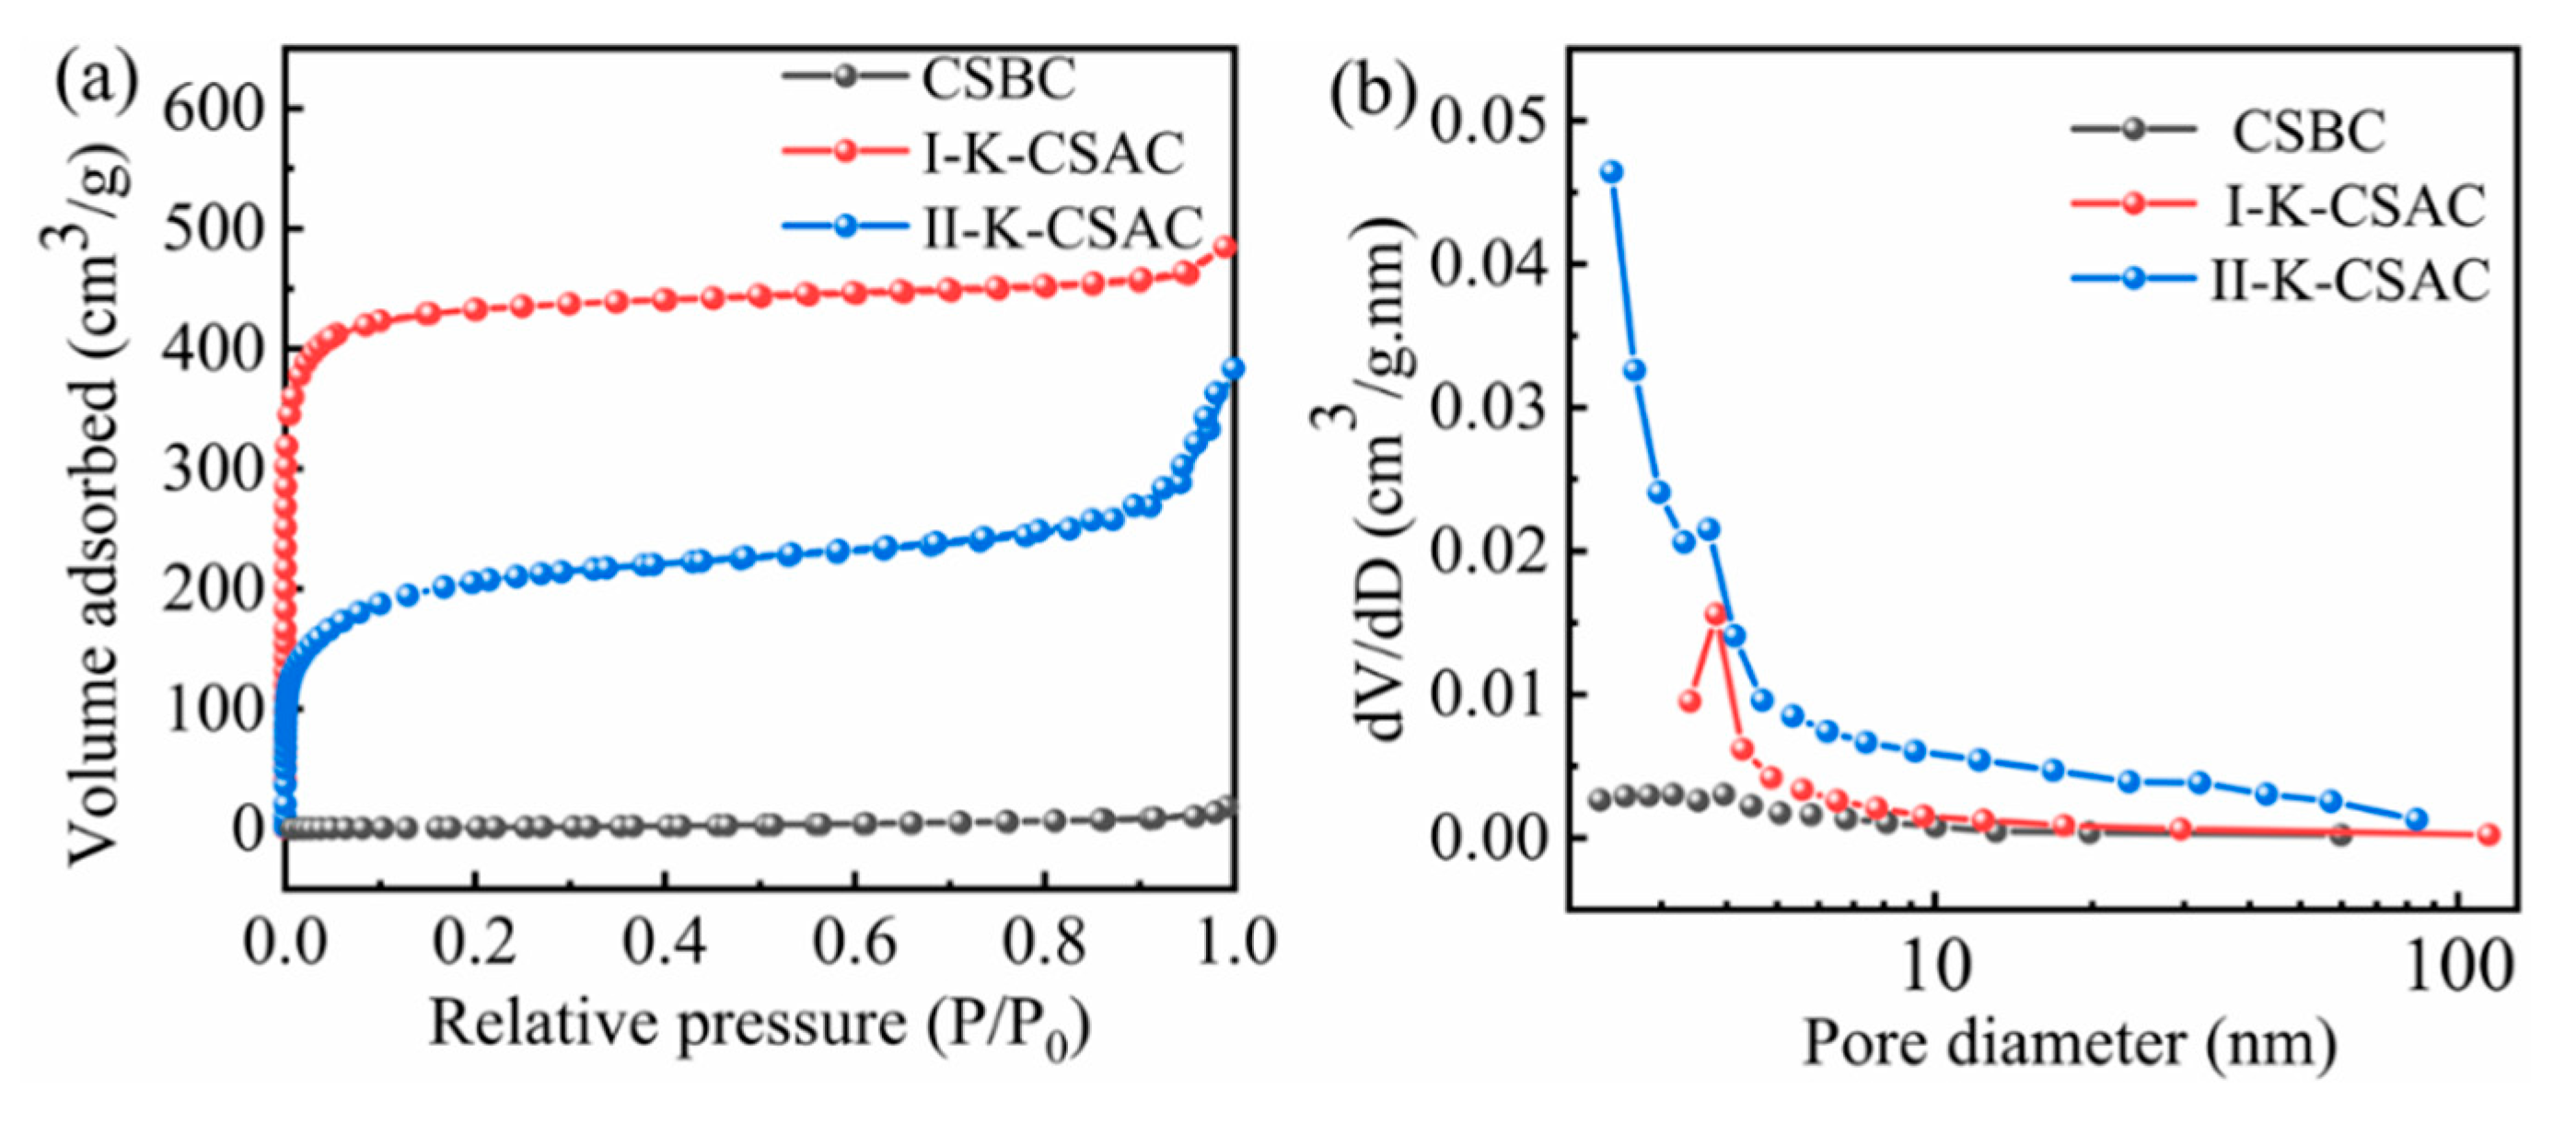
3.2.3. SEM and N2 Adsorption-Desorption Analysis
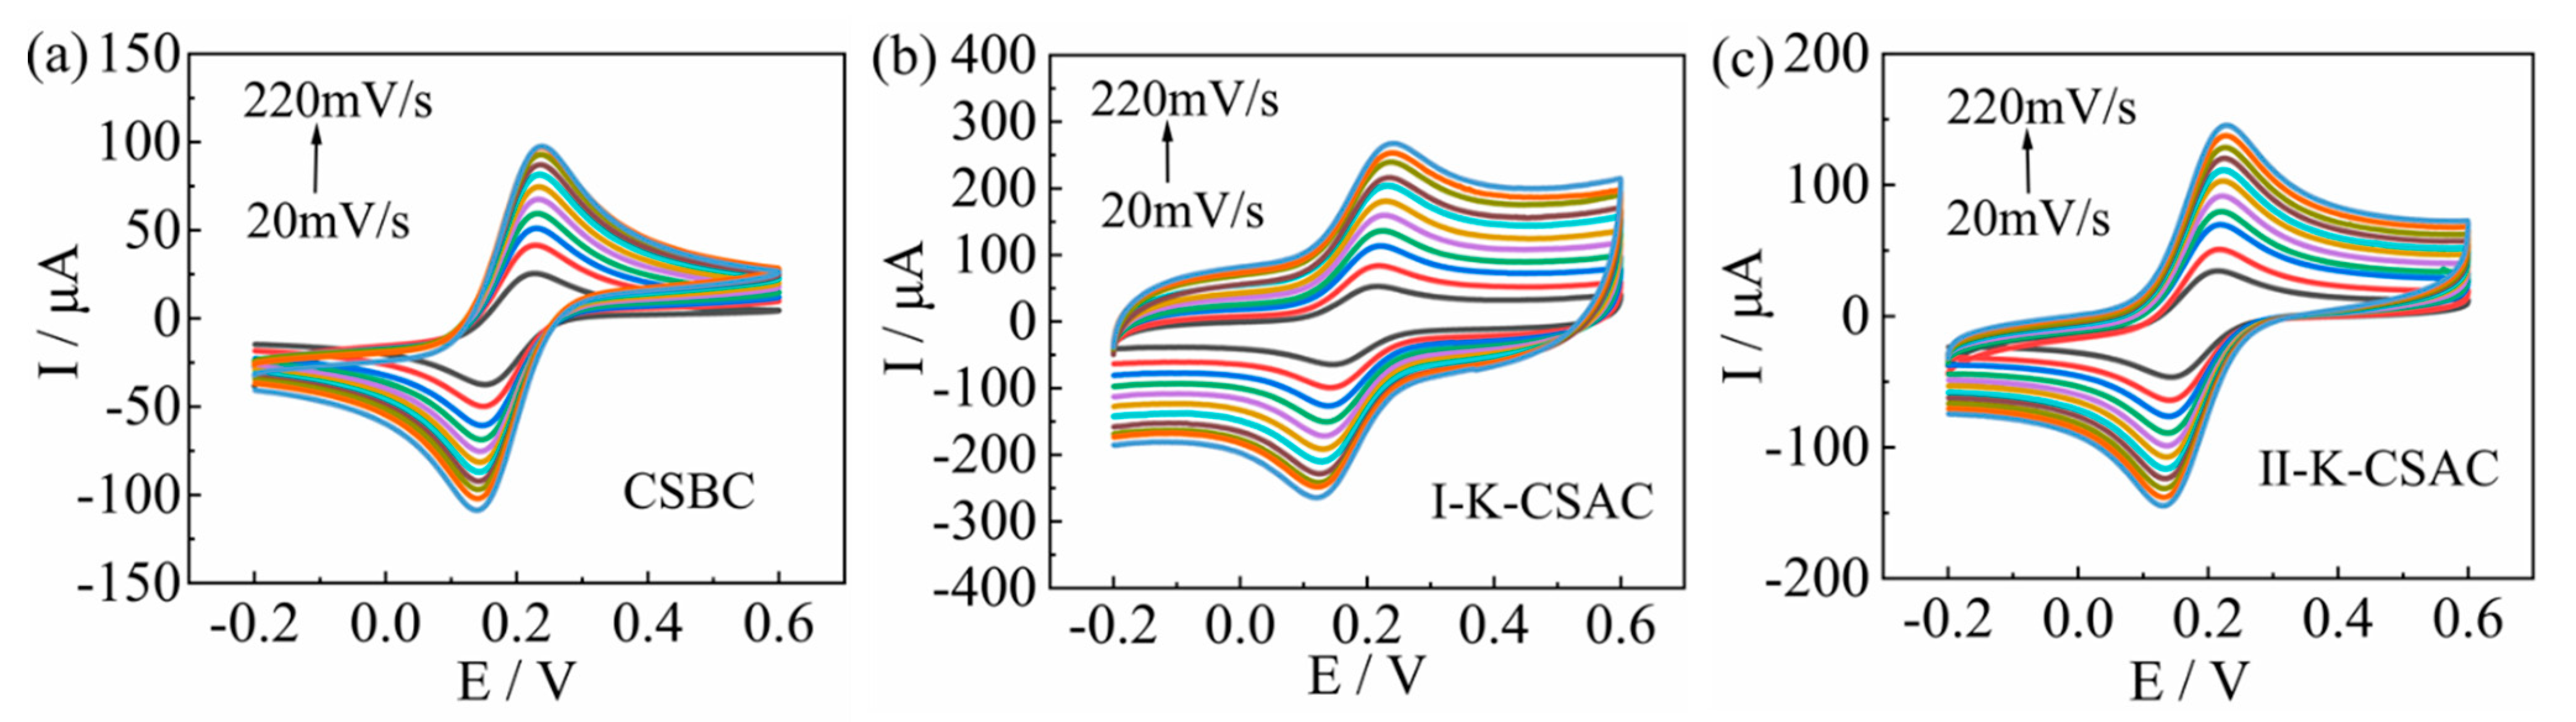
3.2.4. Electrochemical Properties Analysis
3.3. Effect of Preparation Temperature on the Properties of AC
3.3.1. FTIR Analysis
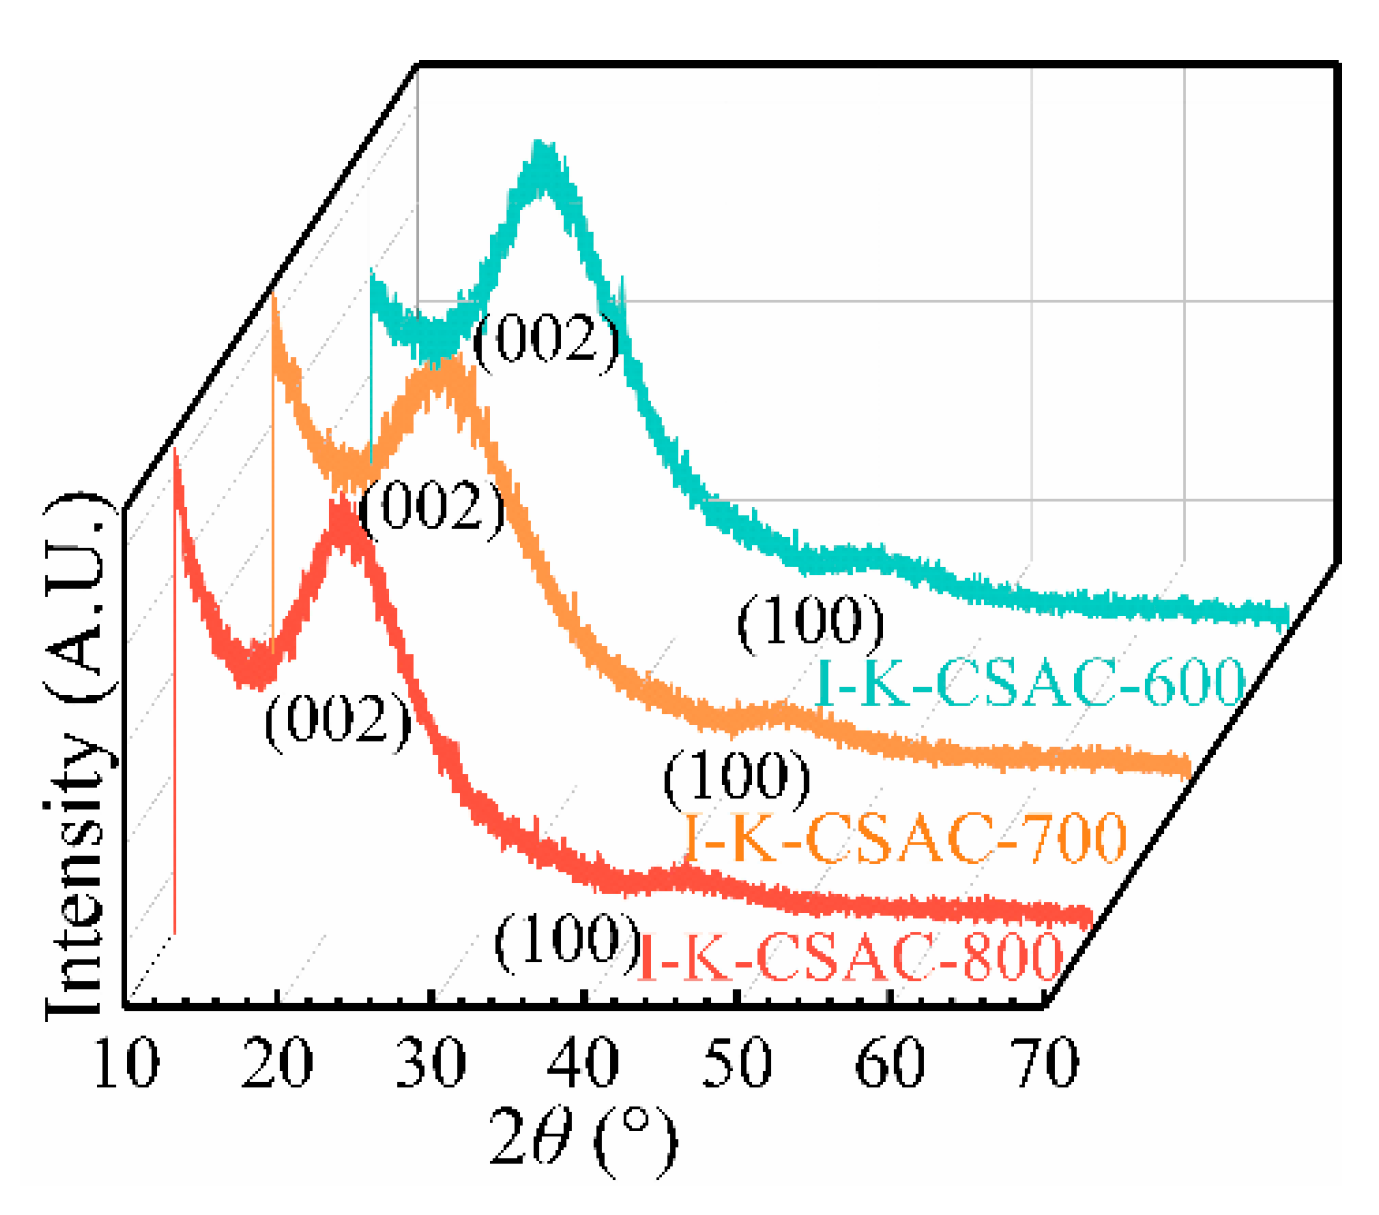
3.3.2. XRD Analysis
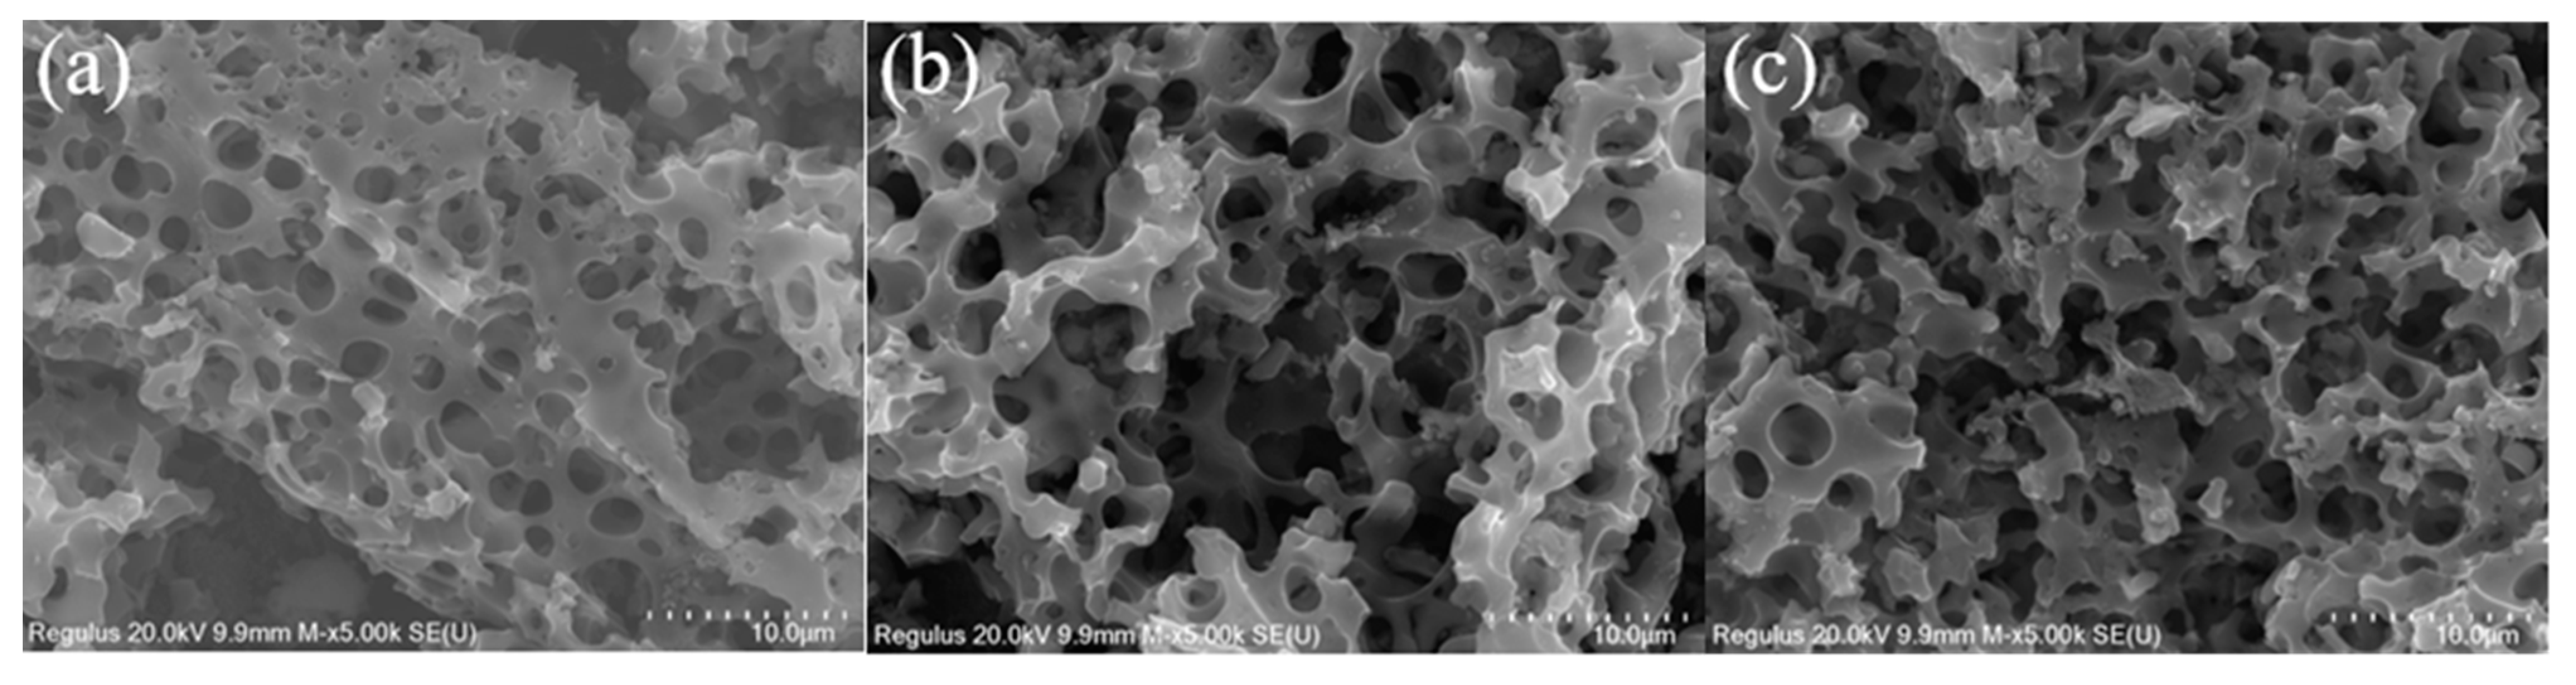
3.3.3. SEM Analysis
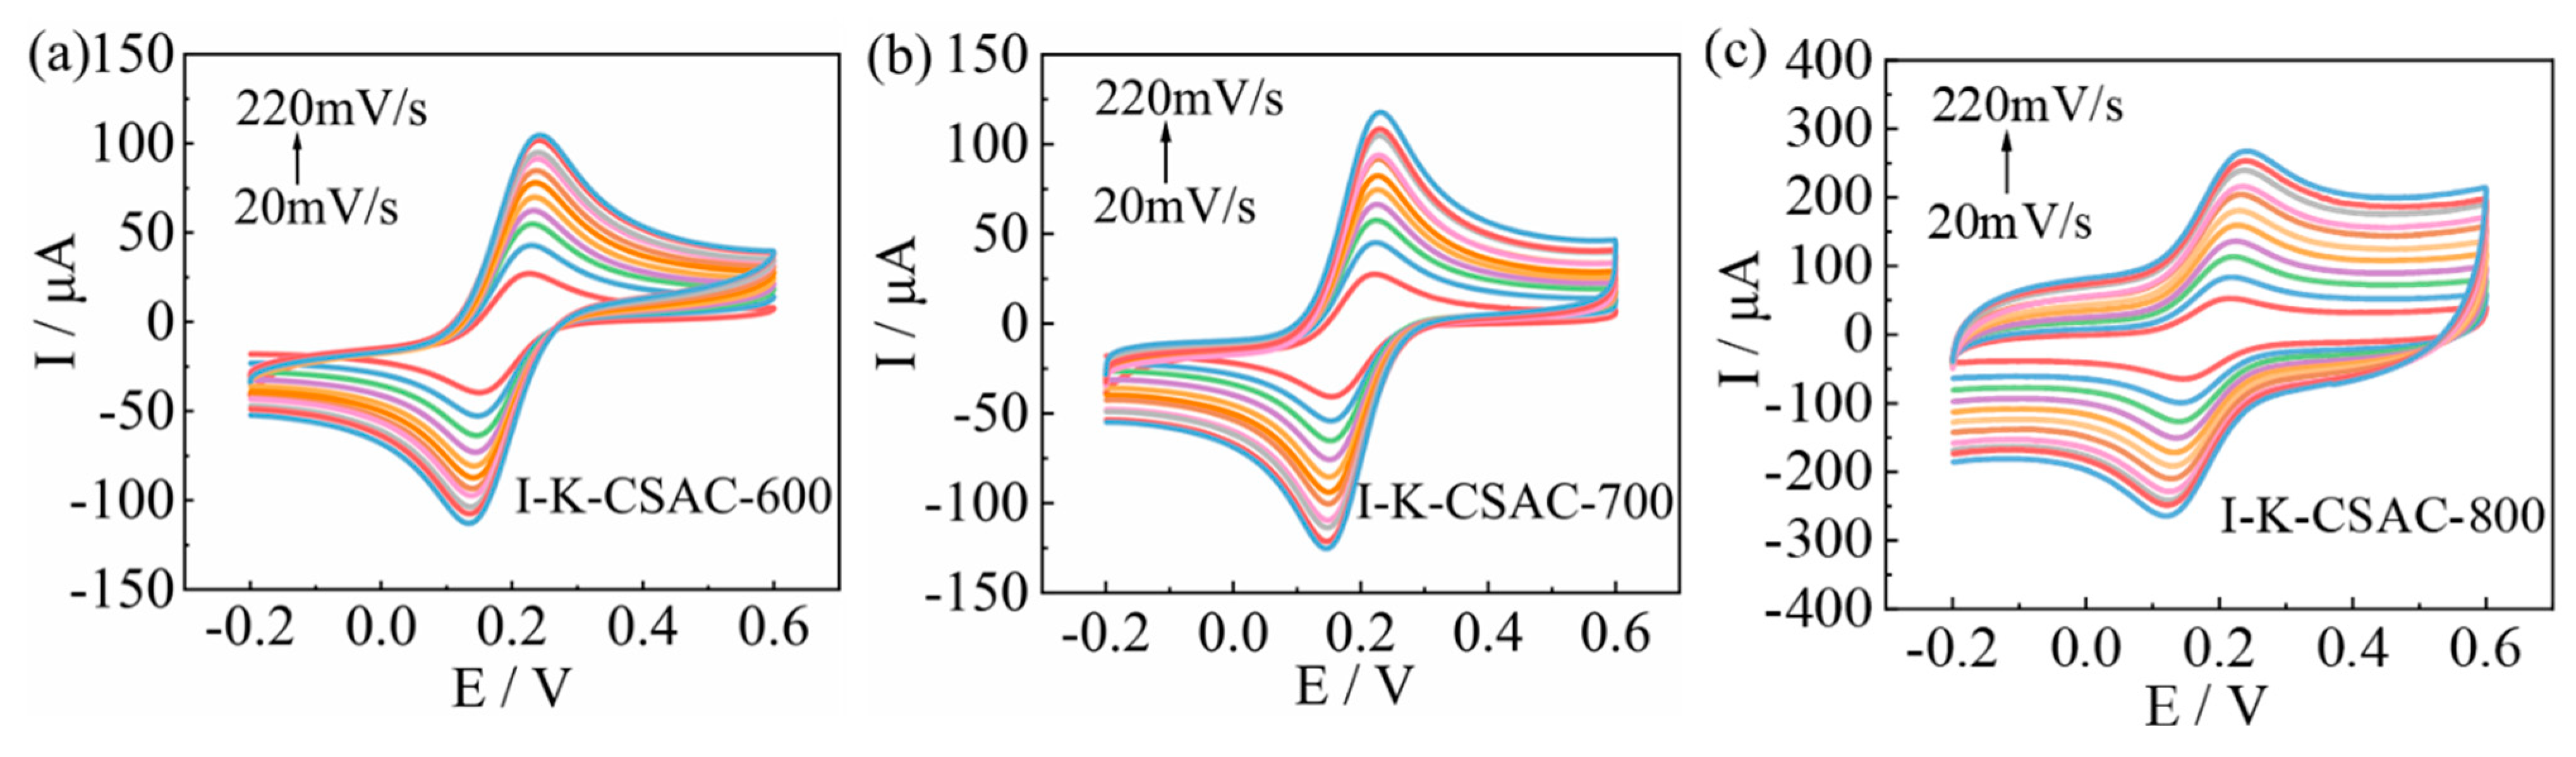
3.3.4. Electrochemical Properties Analysis
3.4. Effect of Activating Agent on the Properties of AC
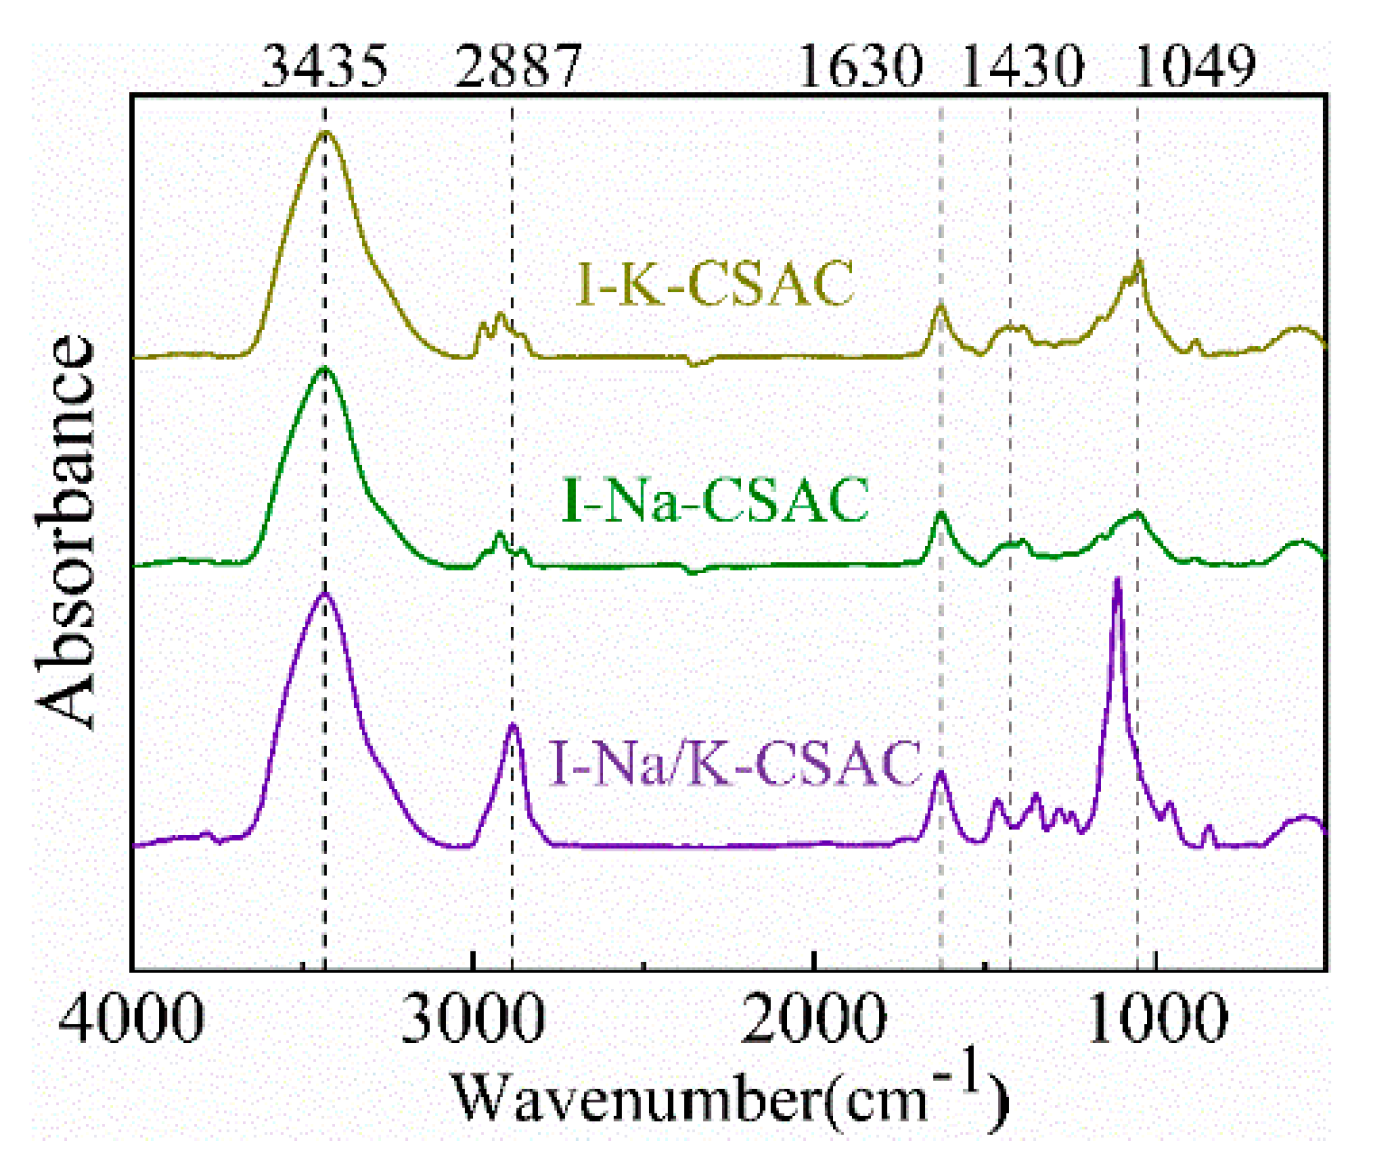
3.4.1. FTIR Analysis
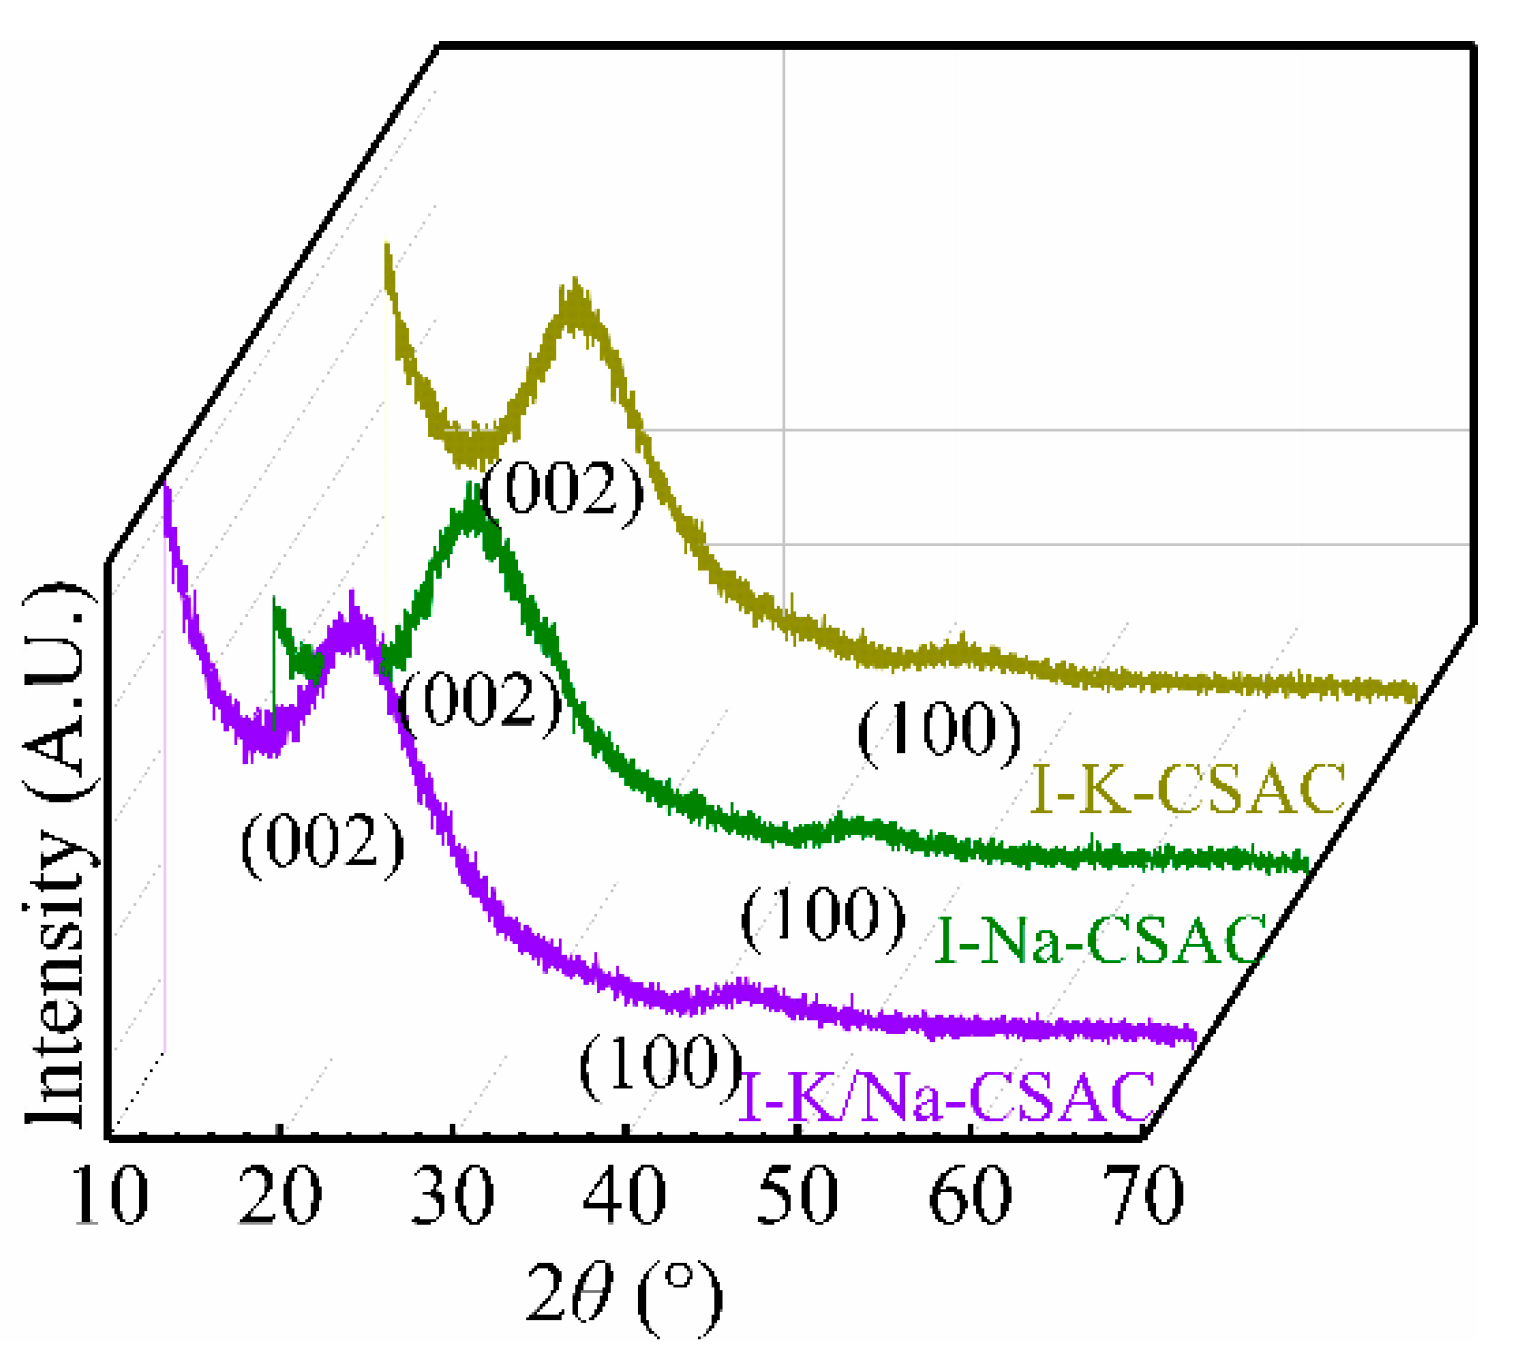
3.4.2. XRD Analysis
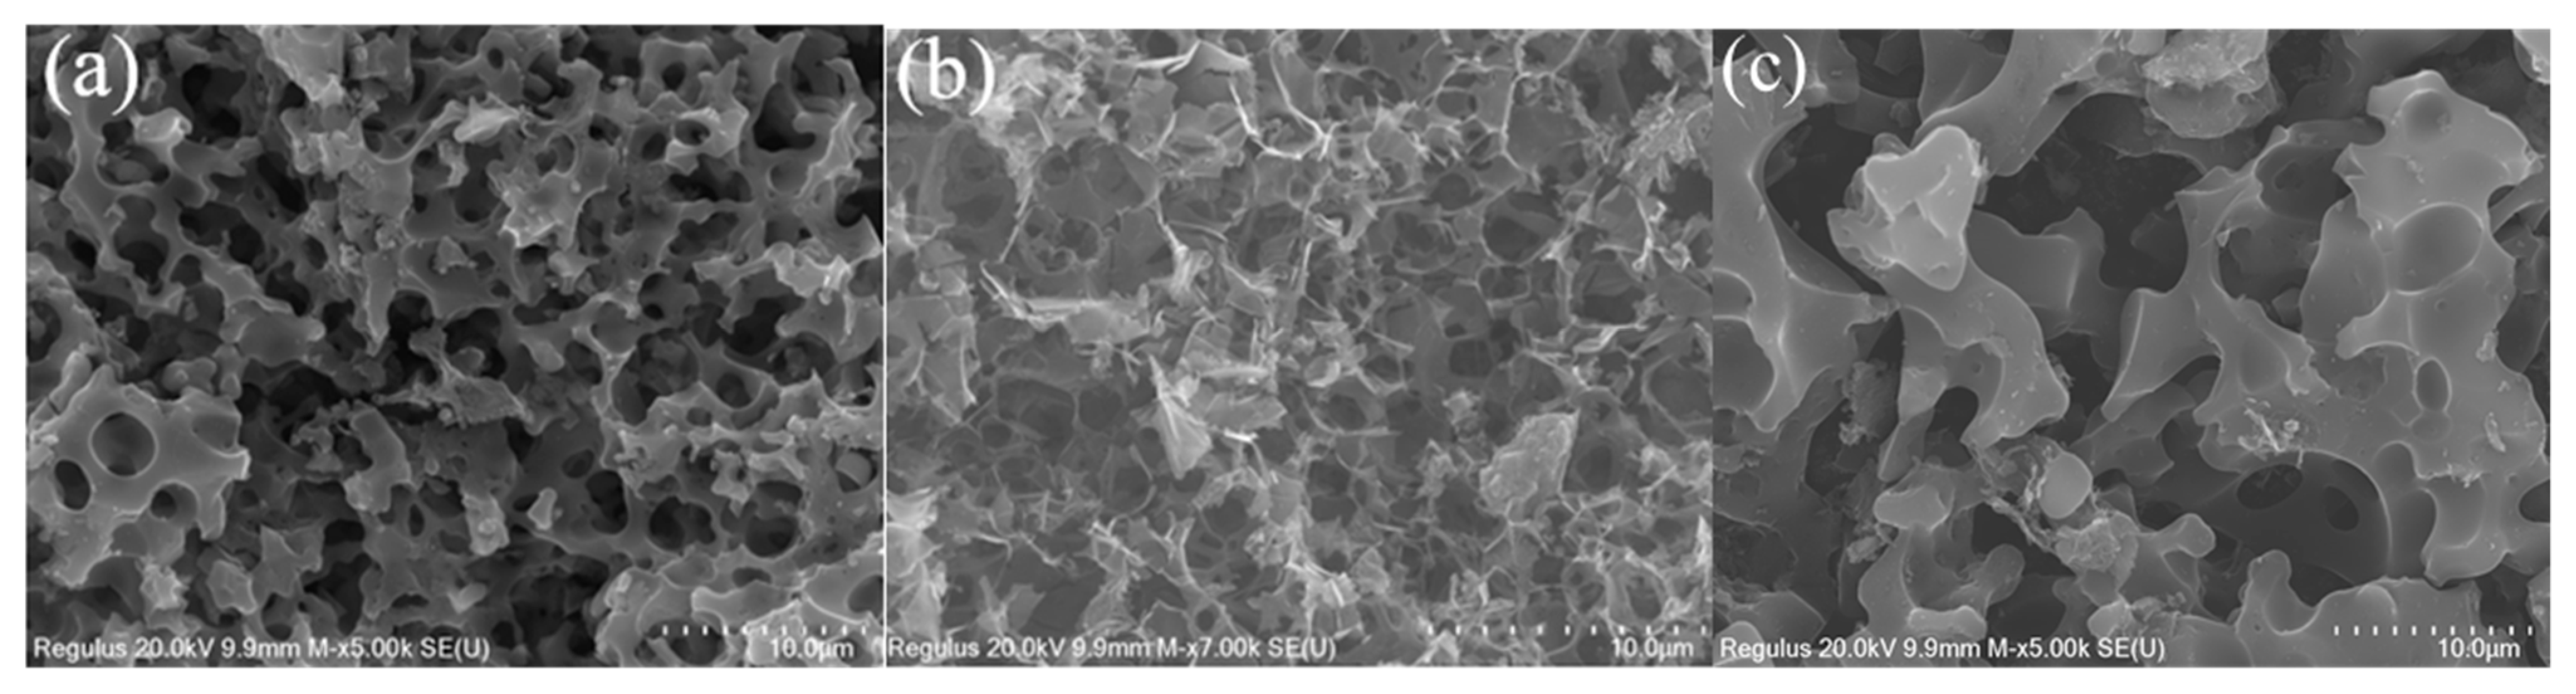
3.4.3. SEM Analysis
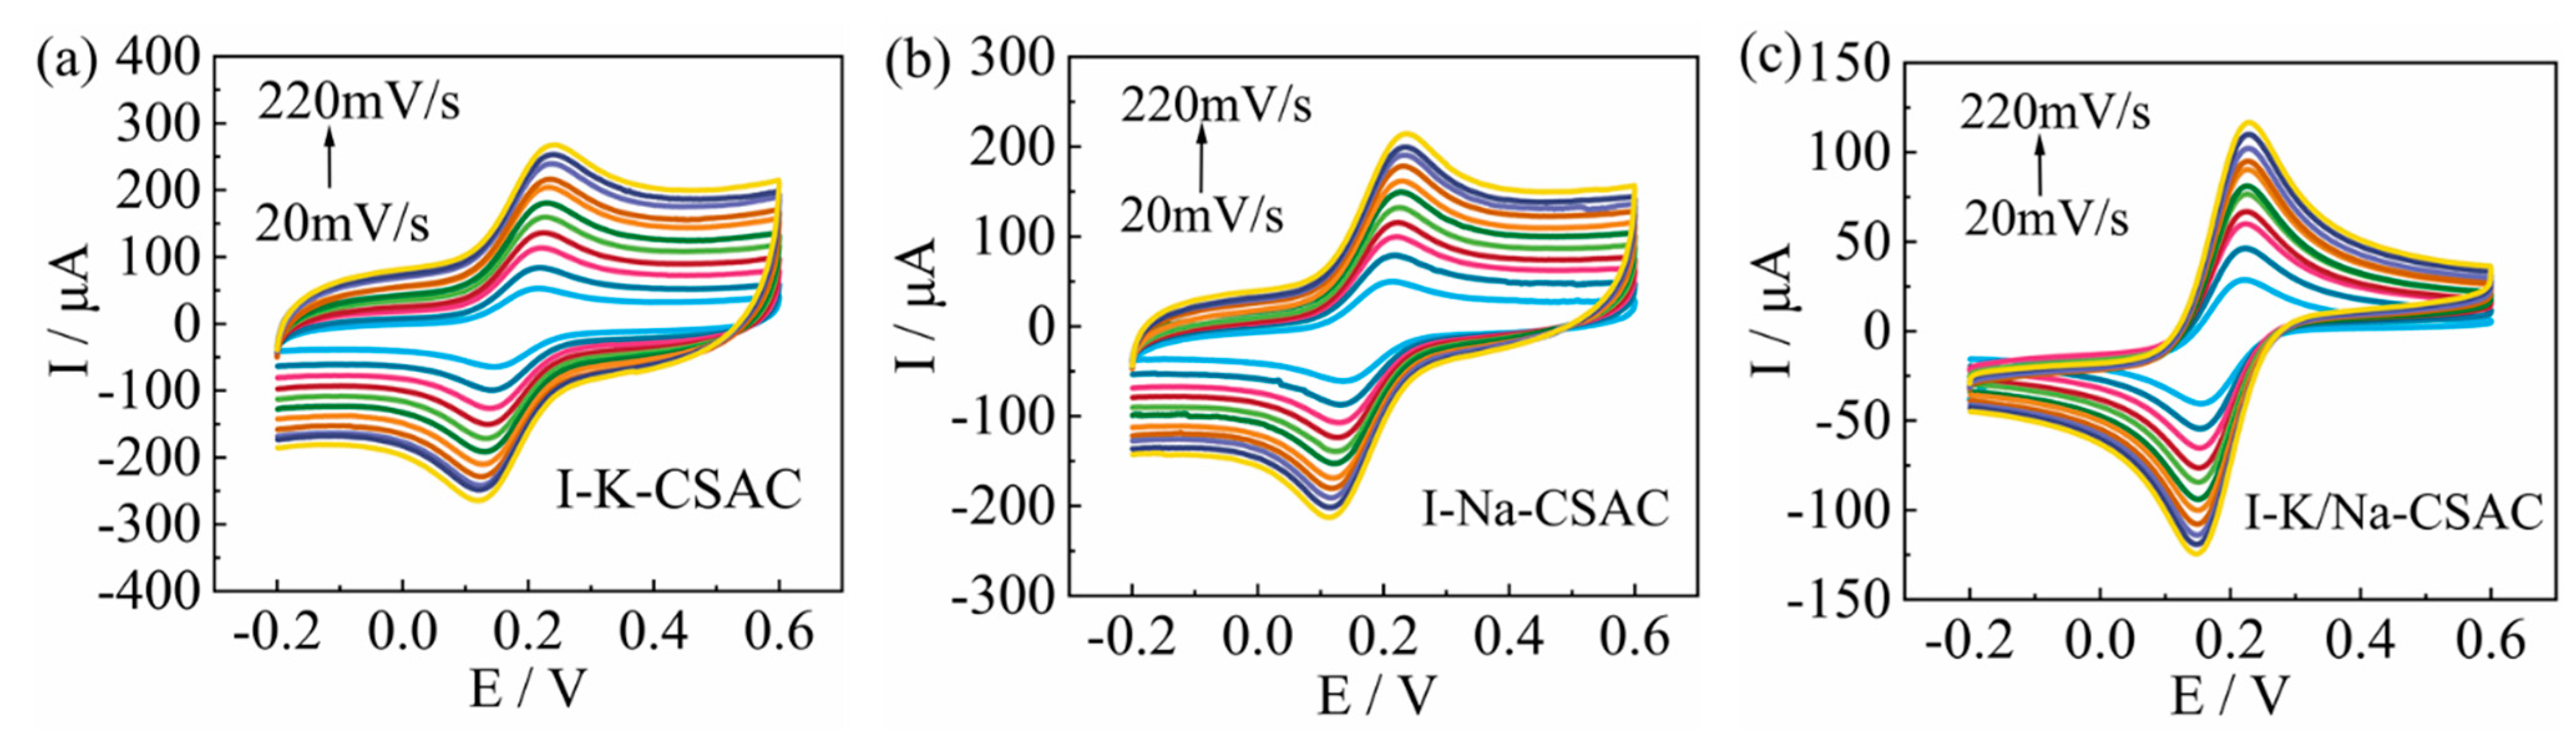
3.4.4. Electrochemical Properties Analysis
3.5. Effect of Activation Time on the Properties of AC
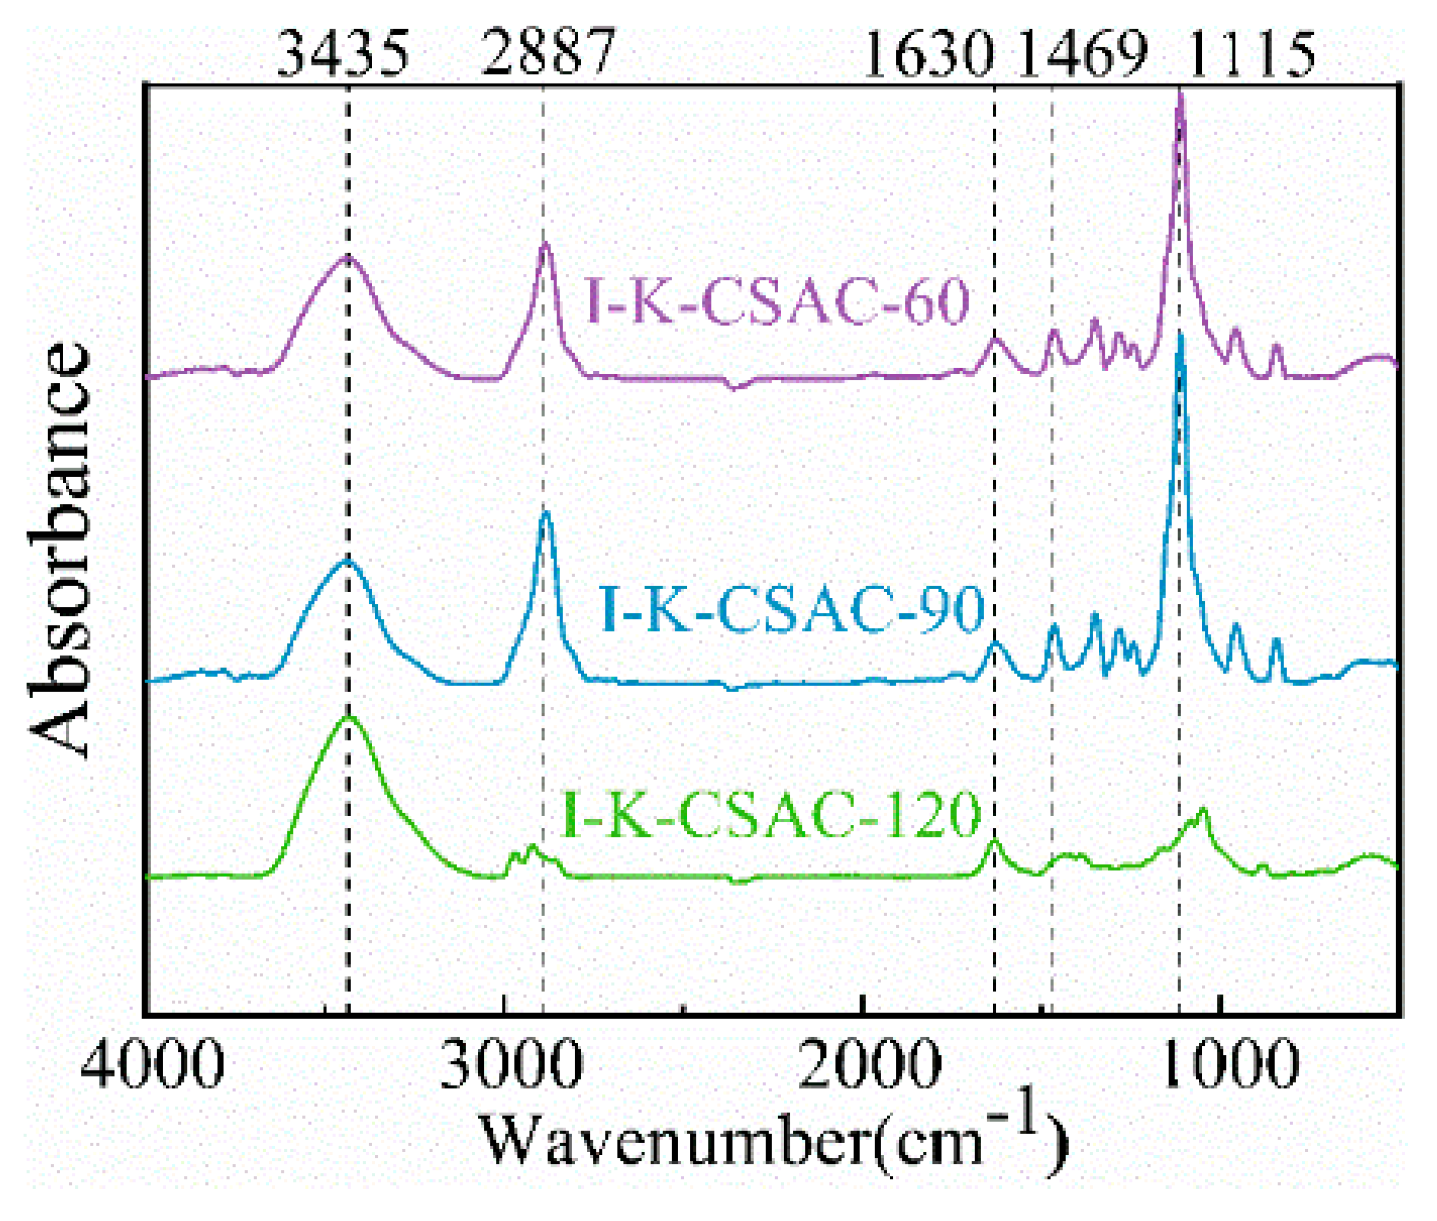
3.5.1. FTIR Analysis
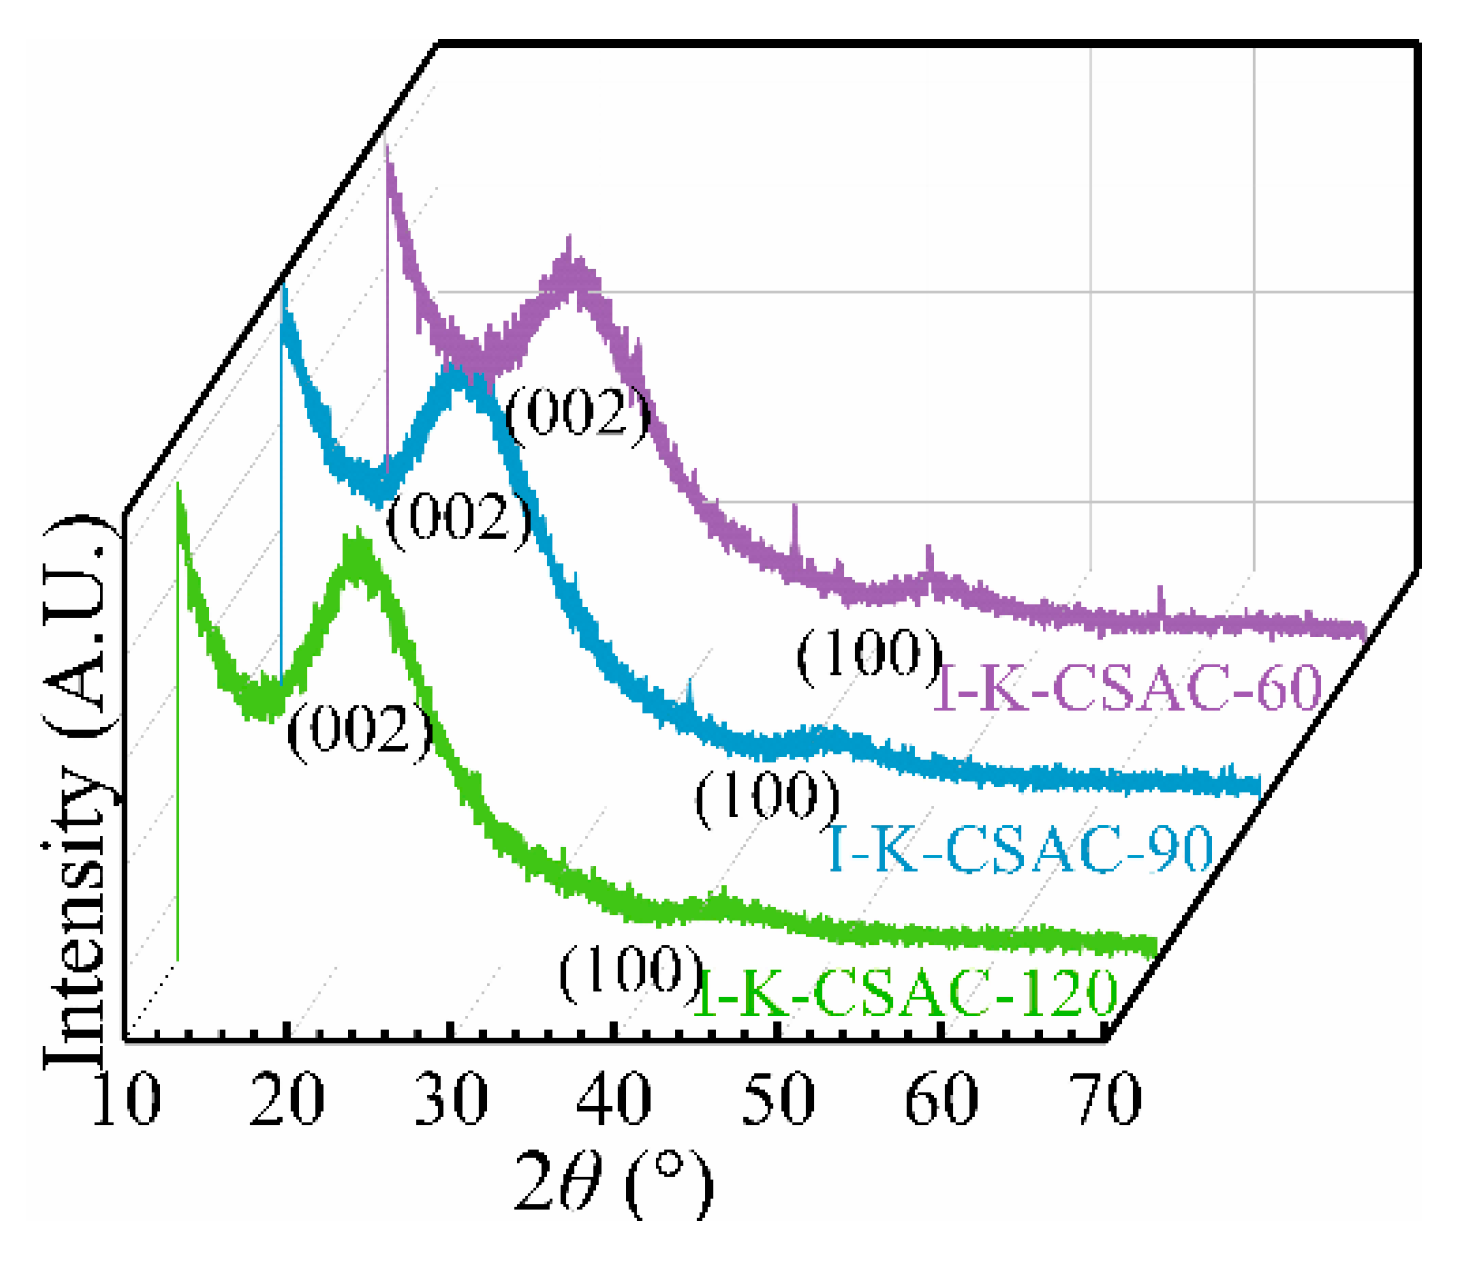
3.5.2. XRD Analysis
3.5.3. SEM Analysis
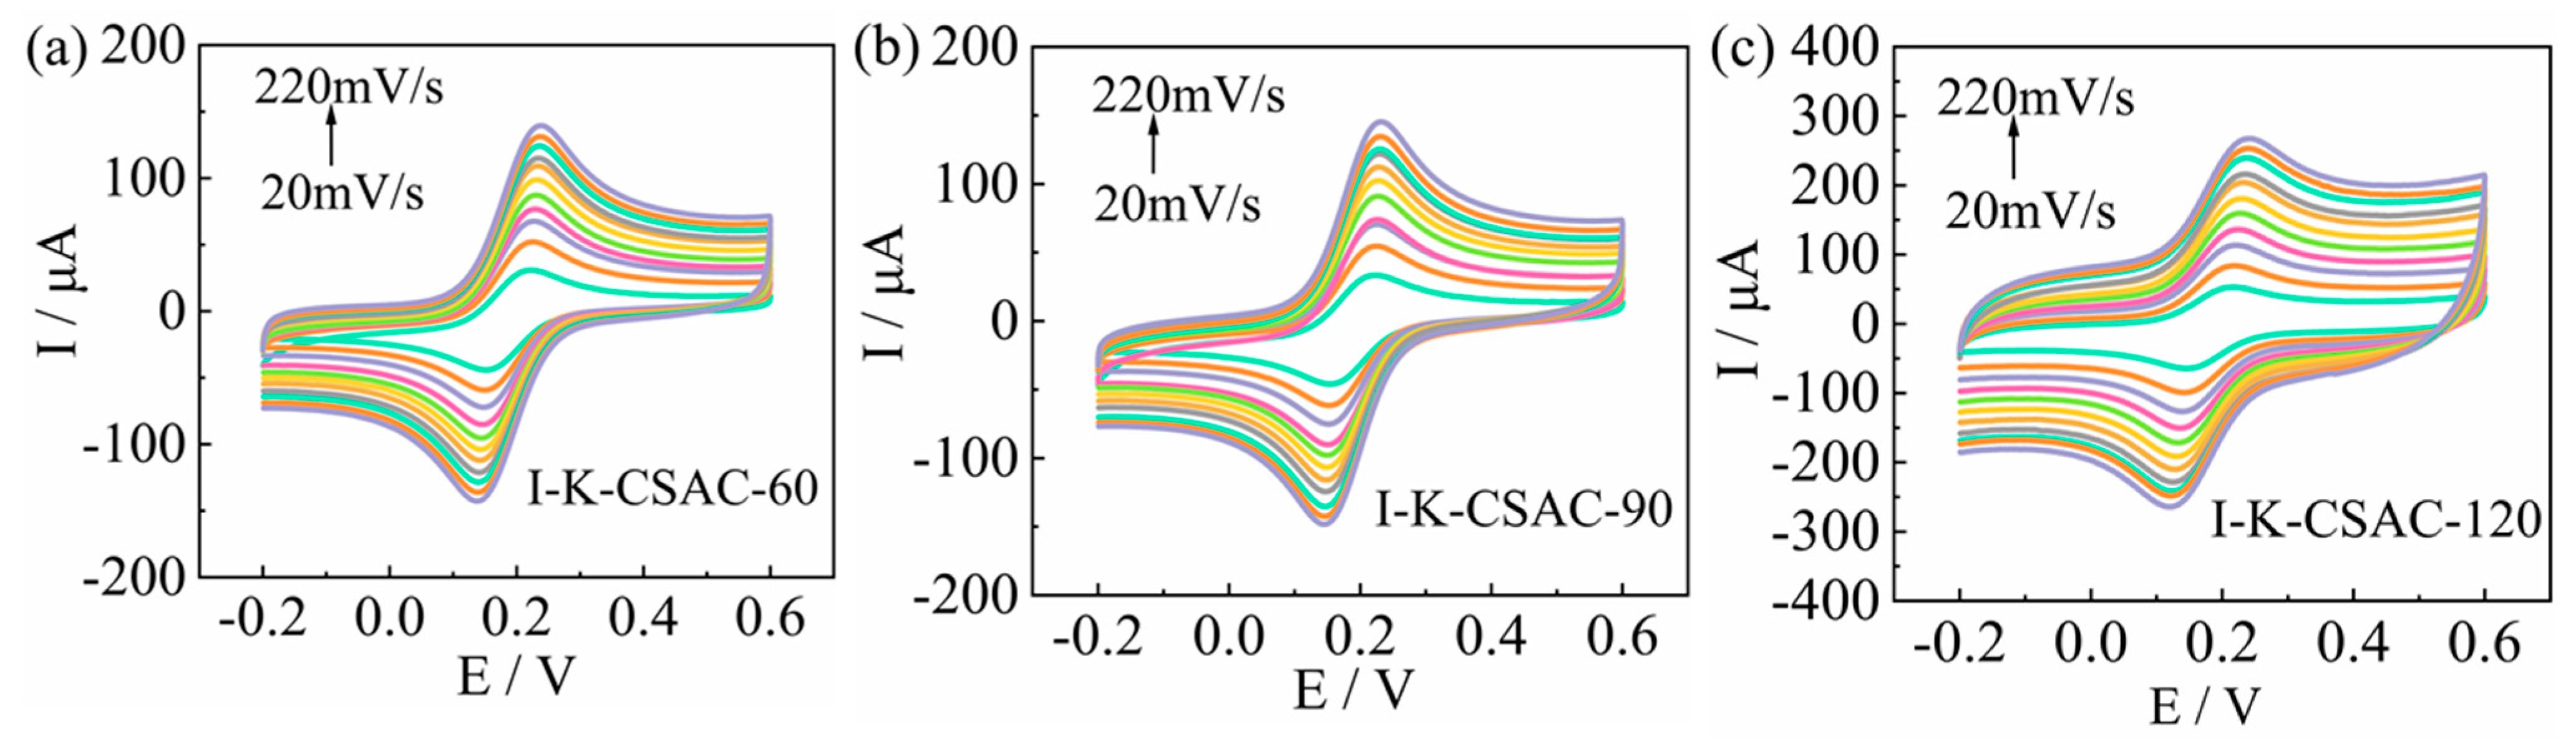
3.5.4. Electrochemical Properties Analysis
4. Conclusions
Author Contributions
Funding
Institutional Review Board Statement
Data Availability Statement
Conflicts of Interest
References
- Hu, L.; Wei, X.; Guo, X.; Lv, H.; Wang, G. Investigation on the kinetic behavior, thermodynamic and volatile products analysis of chili straw waste pyrolysis. J. Environ. Chem. Eng. 2021, 9, 105859. [Google Scholar] [CrossRef]
- McLaughlin, L.P.; Belmont, E.L. Size-resolved aerosol emissions from lignocellulosic biomass and biomass constituent pyrolysis under variable dilution temperatures. J. Aerosol Sci. 2021, 151, 105679. [Google Scholar] [CrossRef]
- Egun, I.L.; He, H.; Hu, D.; Chen, G.Z. Molten Salt Carbonization and Activation of Biomass to Functional Biocarbon. Adv. Sustain. Syst. 2022, 6, 2200294. [Google Scholar] [CrossRef]
- Isahak, W.N.R.W.; Hisham, M.W.M.; Yarmo, M.A. Highly porous carbon materials from biomass by chemical and carbonization method: A comparison study. J. Chem. 2012, 2013, 620346. [Google Scholar] [CrossRef]
- Barjasteh-Askari, F.; Davoudi, M.; Dolatabadi, M.; Ahmadzadeh. S. Iron-modified activated carbon derived from agro-waste for enhanced dye removal from aqueous solutions. Heliyon 2021, 7, e07191. [Google Scholar] [CrossRef]
- Lobato-Peralta, D.R.; Amaro, R.; Arias, D.M.; Cuentas-Gallegos, A.K.; Jaramillo-Quintero, O.A.; Sebastian, P.J.; Okoye, P.U. Activated carbon from wasp hive for aqueous electrolyte supercapacitor application. Electroanalytical. Chem. 2021, 901, 115777. [Google Scholar] [CrossRef]
- Liao, W.; Zhang, X.; Ke, S.; Shao, J.; Yang, H.; Zhang, S.; Chen, H. Effect of different biomass species and pyrolysis temperatures on heavy metal adsorption, stability and economy of biochar. Ind. Crop. Prod. 2022, 186, 115238. [Google Scholar] [CrossRef]
- Cai, Z.Z.; Liu, Q.; Li, H.X.; Wang, J.Y.; Tai, G.Y.; Wang, F.; Han, J.G.; Zhu, Y.L.; Wu, G.Y. Waste-to-resource strategy to fabricate functionalized MOFs composite material based on durian shell biomass carbon fiber and Fe3O4 for highly efficient and recyclable dye adsorption. Int. J. Mol. Sci. 2022, 23, 5900. [Google Scholar] [CrossRef]
- Anuar, N.F.; Shah, D.R.S.I.; Ramli, F.F.; Zaini, M.S.M.; Mohammadi, N.A.; Daud, A.R.M.; Syed-Hassan, S.S.A. The removal of antibiotics in water by chemically modified carbonaceous adsorbents from biomass: A systematic review. J. Clean. Prod. 2023, 401, 136725. [Google Scholar] [CrossRef]
- Luo, L.; Lan, Y.L.; Zhang, Q.Q.; Deng, J.P.; Luo, L.C.; Zeng, Q.Z.; Gao, H.L.; Zhao, W.G. A review on biomass-derived activated carbon as electrode materials for energy storage supercapacitors. J. Energy Storage 2022, 55, 105839. [Google Scholar] [CrossRef]
- Murali, G.; Harish, S.; Ponnusamy, S.; Ragupathi, J.; Therese, H.A.; Navaneethan, M.; Muthamizhchelvan, C. Hierarchically porous structured carbon derived from peanut shell as an enhanced high rate anode for lithium ion batteries. Appl. Surf. Sci. 2019, 492, 464–472. [Google Scholar] [CrossRef]
- Zainal, N.H.; Aziz, A.A.; Idris, J.; Jalani, N.F.; Mamat, R.; Ibrahim, M.F.; Hassan, M.A.; Abd-Aziz, S. Reduction of POME final discharge residual using activated bioadsorbent from oil palm kernel shell. J. Clean. Prod. 2018, 182, 830–837. [Google Scholar] [CrossRef]
- Mortada, W.I.; Mohamed, R.A.; Monem, A.A.A.; Awad, M.M.; Hassan, A.F. Effective and low-cost adsorption procedure for removing chemical oxygen demand from wastewater using chemically activated carbon derived from rice husk. Separations 2023, 10, 43. [Google Scholar] [CrossRef]
- Eda, K.; Canan, A.B. Preparation, structural evaluation and adsorptive properties of activated carbon from agricultural waste biomass. Adv. Powder Technol. 2015, 26, 811–818. [Google Scholar] [CrossRef]
- Dang, H.; Xu, R.S.; Zhang, J.L.; Wang, M.Y.; Ye, L.; Jia, G.L. Removal of oxygen-containing functional groups during hydrothermal carbonization of biomass: Experimental and DFT study. Energy 2023, 276, 127436. [Google Scholar] [CrossRef]
- Ahmed, M.J.; Theydan, S.K. Adsorption of cephalexin onto activated carbons from Albizia lebbeck seed pods by microwave-induced KOH and K2CO3 activations. Chem. Eng. J. 2012, 211–212, 200–207. [Google Scholar] [CrossRef]
- Zhang, W.; Cheng, R.R.; Bi, H.H.; Lu, Y.H.; Ma, L.B.; He, X.J. A review of porous carbons produced by template methods for supercapacitor applications. New Carbon Mater. 2021, 36, 69–81. [Google Scholar] [CrossRef]
- Thithai, V.; Jin, X.; Ajaz, A.M.; Choi, J.W. Physicochemical properties of activated carbons produced from coffee waste and empty fruit bunch by chemical activation method. Energies 2021, 14, 3002. [Google Scholar] [CrossRef]
- Danish, M.; Ahmad, T. A review on utilization of wood biomass as a sustainable precursor for activated carbon production and application. Renew. Sustain. Energy Rev. 2018, 87, 1–21. [Google Scholar] [CrossRef]
- Balahmar, N.; Al-Jumialy, A.S.; Mokaya, R. Biomass to porous carbon in one step: Directly activated biomass for high performance CO2 storage. J. Mater. Chem. A 2017, 5, 12330–12339. [Google Scholar] [CrossRef]
- Yin, Z.; Liu, Y.; Liu, S.; Jiang, L.; Tan, X.; Zeng, G.; Li, M.; Liu, S.; Tian, S.; Fang, Y. Activated magnetic biochar by one-step synthesis: Enhanced adsorption and coadsorption for 17β-estradiol and copper. Sci. Total. Environ. 2018, 639, 1530–1542. [Google Scholar] [CrossRef] [PubMed]
- Lin, H.L.; Liu, Y.P.; Chang, Z.X.; Yan, S.; Liu, S.C.; Han, S. A new method of synthesizing hemicellulose-derived porous activated carbon for high-performance supercapacitors. Microporous Mesoporous Mater. 2020, 292, 109707. [Google Scholar] [CrossRef]
- Sun, S.N.; Yu, Q.F.; Li, M.; Zhao, H.; Wu, C.X. Preparation of coffee-shell activated carbon and its application for water vapor adsorption. Renew. Energy 2019, 142, 11–19. [Google Scholar] [CrossRef]
- Jiang, M.; Zhang, J.L.; Xing, L.B.; Zhou, J.; Cui, H.Y.; Si, W.J.; Zhuo, S.P. KOH-Activated porous carbons derived from chestnut shell with superior capacitive performance. Chin. J. Chem. 2016, 34, 1093–1102. [Google Scholar] [CrossRef]
- Mistar, E.M.; Alfatah, T.; Supardan, M.D. Synthesis and characterization of activated carbon from bambusa vulgaris striata using two-step KOH activation. J. Mater. Res. Technol. 2020, 9, 6278–6286. [Google Scholar] [CrossRef]
- Li, Z.Y.; Gao, X.Y.; Wu, L.; Wang, K.W.; Kobayashi, N. Preparation of activated carbons from poplar wood by chemical activation with KOH. J. Porous Mater. 2017, 24, 193–202. [Google Scholar] [CrossRef]
- Zhu, X.F.; Luo, Z.J.; Zhu, X.F. Novel insights into the enrichment of phenols from walnut shell pyrolysis loop: Torrefaction coupled fractional condensation. Waste Manag. 2021, 131, 462–470. [Google Scholar] [CrossRef] [PubMed]
- Wang, T.P.; Li, H.; Yuan, J.M.; Li, W.X.; Li, K.; Huang, Y.B.; Xiao, L.P.; Lu, Q. Structures and pyrolytic characteristics of organosolv lignins from typical softwood, hardwood and herbaceous biomass. Ind. Crops Prod. 2021, 171, 113912. [Google Scholar] [CrossRef]
- Wang, J.C.; Kaskel, S. KOH activation of carbon-based materials for energy storage. J. Mater. Chem. 2012, 22, 23710–23725. [Google Scholar] [CrossRef]
- Xin, Y.; Cao, H.L.; Yuan, Q.X.; Wang, D.L. Two-step gasification of cattle manure for hydrogen-rich gas production: Effect of biochar preparation temperature and gasification temperature. Waste Manag. 2017, 68, 618–625. [Google Scholar] [CrossRef]
- Zhu, X.F.; Li, K.; Zhang, L.Q.; Wu, X.; Zhu, X.F. Comparative study on the evolution of physicochemical characteristics of biochar produced from bio-oil distillation residue under different induction atmosphere. Energy Convers. Manag. 2018, 157, 288–293. [Google Scholar] [CrossRef]
- Zhu, X.F.; Wang, C.; Li, S.S.; Zhu, X.F. Upgrading biochar from bio-oil distillation residue by adding bituminous coal: Effects of induction conditions on physicochemical properties. Energy Convers. Manag. 2018, 174, 288–294. [Google Scholar] [CrossRef]
- Rani, M.U.; Nanaji, K.; Rao, T.N.; Deshpande, A.S. Corn husk derived activated carbon with enhanced electrochemical performance for high-voltage supercapacitors. J. Power Sources 2020, 471, 228387. [Google Scholar] [CrossRef]
- He, X.; Zeng, K.; Xie, Y.P.; Flamant, G.; Yang, H.P.; Yang, X.Y.; Nzihou, A.; Zheng, A.Q.; Ding, Z.; Chen, H.P. The effects of temperature and molten salt on solar pyrolysis of lignite. Energy 2019, 181, 407–416. [Google Scholar] [CrossRef]
- Mueanpun, N.; Srisuk, N.; Chaiammart, N.; Panomsuwan, G. Nanoporous activated carbons derived from water ferns as an adsorbent for removal of paraquat from contaminated water. Materialia 2021, 15, 100986. [Google Scholar] [CrossRef]
- Guo, Y.; Wang, Q.Y. Fabrication and Characterization of Activated Carbon from Phyllostachys edulis Using Single-Step KOH Activation with Different Temperatures. Processes 2022, 10, 1712. [Google Scholar] [CrossRef]
- Khajonrit, J.; Sichumsaeng, T.; Kalawa, O.; Chaisit, S.; Chinnakorn, A.; Chanlek, N.; Maensiri, S. Mangosteen peel-derived activated carbon for supercapacitors. Prog. Nat. Sci. 2022, 32, 570–578. [Google Scholar] [CrossRef]
- Liu, J.; Li, X.; Weng, W.; Xie, H.; Luo, G.; Niu, Y.; Li, G.; Sun, W. A biomass-derived porous carbon-based nanocomposite for voltammetric determination of quercetin. Microchim. Acta 2019, 186, 783. [Google Scholar] [CrossRef]
- Zhou, X.Y.; Li, H.C.; Yang, J. Biomass-derived activated carbon materials with plentiful heteroatoms for high-performance electrochemical capacitor electrodes. J. Energy Chem. 2016, 25, 35–40. [Google Scholar] [CrossRef]
- Diao, R.; Zhu, X.F.; Wang, C.; Zhu, X.F. Synergistic effect of physicochemical properties and reaction temperature on gasification reactivity of walnut shell chars. Energy Convers. Manag. 2020, 204, 112313. [Google Scholar] [CrossRef]
- Rajasekaran, S.J.; Raghavan, V. Palmyra palm flower biomass-derived activated porous carbon and its application as a supercapacitor electrode. J. Electrochem. Sci. Eng. 2022, 12, 545–556. [Google Scholar] [CrossRef]
- Sangeetha, N.M.; Bhat, S.; Raffy, G.; Belin, C.; Loppinet-Serani, A.; Aymonier, C.; Terech, P.; Maitra, U.; Desvergne, J.; Del Guerzo, A. Hybrid materials combining photoactive 2,3-didecyloxyanthracene physical gels and gold nanoparticles. Chem. Mater. 2009, 21, 3424–3432. [Google Scholar] [CrossRef]
- Gao, Y.; Yue, Q.Y.; Gao, B.Y.; Li, A.M. Insight into activated carbon from different kinds of chemical activating agents: A review. Sci. Total Environ. 2020, 746, 141094. [Google Scholar] [CrossRef] [PubMed]


| Ultimate Analysis (wt.%, Dry & Ash Free Basis) | Proximate Analysis (wt.%, Dry Basis) | |||||||
|---|---|---|---|---|---|---|---|---|
| C | H | O | N | S | Volatile Matter | Fixed Carbon | Ash Content | |
| CS | 44.74 | 6.15 | 47.65 | 0.36 | 0.003 | 82.7 | 16.2 | 1.1 |
| Samples | Activating Agent | Activation Temperature (°C) | Activation Time (min) | Preparation Method |
|---|---|---|---|---|
| CSBC | / | 800 | 120 | pyrolysis |
| II-K-CSAC | KOH | 500/800 | 120/90 | Two-step |
| I-K-CSAC | KOH | 800 | 120 | one-step a |
| I-K-CSAC-600 | KOH | 600 | 120 | one-step |
| I-K-CSAC-700 | KOH | 700 | 120 | one-step |
| I-K-CSAC-800 | KOH | 800 | 120 | one-step |
| I-Na-CSAC | NaOH | 800 | 120 | one-step |
| I-K/Na-CSAC | KOH/NaOH | 800 | 120 | one-step |
| I-K-CSAC-60 | KOH | 800 | 60 | one-step |
| I-K-CSAC-90 | KOH | 800 | 90 | one-step |
| I-K-CSAC-120 | KOH | 800 | 120 | one-step |
| Raw Material/Samples | Activating Agent | Activation Temperature (°C) | Activation Time (min) | SBET (m2/g) | VTotal (cm3/g) | Reference |
|---|---|---|---|---|---|---|
| CSBC | / | 800 | 120 | 9.676 | 0.0254 | |
| I-K-CSAC | KOH | 800 | 120 | 1725 | 0.7497 | This study |
| II-K-CSAC | KOH | 500/800 | 120/90 | 860 | 0.3009 | |
| Mangosteen peel | KOH | 800 | 120 | 1039 | 0.635 | [36] |
| Phyllostachys edulis | KOH | 800 | 60 | 1123 | 0.4478 | [37] |
Disclaimer/Publisher’s Note: The statements, opinions and data contained in all publications are solely those of the individual author(s) and contributor(s) and not of MDPI and/or the editor(s). MDPI and/or the editor(s) disclaim responsibility for any injury to people or property resulting from any ideas, methods, instructions or products referred to in the content. |
© 2024 by the authors. Licensee MDPI, Basel, Switzerland. This article is an open access article distributed under the terms and conditions of the Creative Commons Attribution (CC BY) license (https://creativecommons.org/licenses/by/4.0/).
Share and Cite
Xu, B.; Chang, M.; Fu, C.; Han, J.; Wang, Y.; Feng, Y.; Zhang, Z. Effect of Preparation Process on the Physicochemical Properties of Activated Carbon Prepared from Corn Stalks. Agriculture 2024, 14, 392. https://doi.org/10.3390/agriculture14030392
Xu B, Chang M, Fu C, Han J, Wang Y, Feng Y, Zhang Z. Effect of Preparation Process on the Physicochemical Properties of Activated Carbon Prepared from Corn Stalks. Agriculture. 2024; 14(3):392. https://doi.org/10.3390/agriculture14030392
Chicago/Turabian StyleXu, Beibei, Min Chang, Chengguo Fu, Jiale Han, Yahui Wang, Yipeng Feng, and Zhiping Zhang. 2024. "Effect of Preparation Process on the Physicochemical Properties of Activated Carbon Prepared from Corn Stalks" Agriculture 14, no. 3: 392. https://doi.org/10.3390/agriculture14030392
APA StyleXu, B., Chang, M., Fu, C., Han, J., Wang, Y., Feng, Y., & Zhang, Z. (2024). Effect of Preparation Process on the Physicochemical Properties of Activated Carbon Prepared from Corn Stalks. Agriculture, 14(3), 392. https://doi.org/10.3390/agriculture14030392