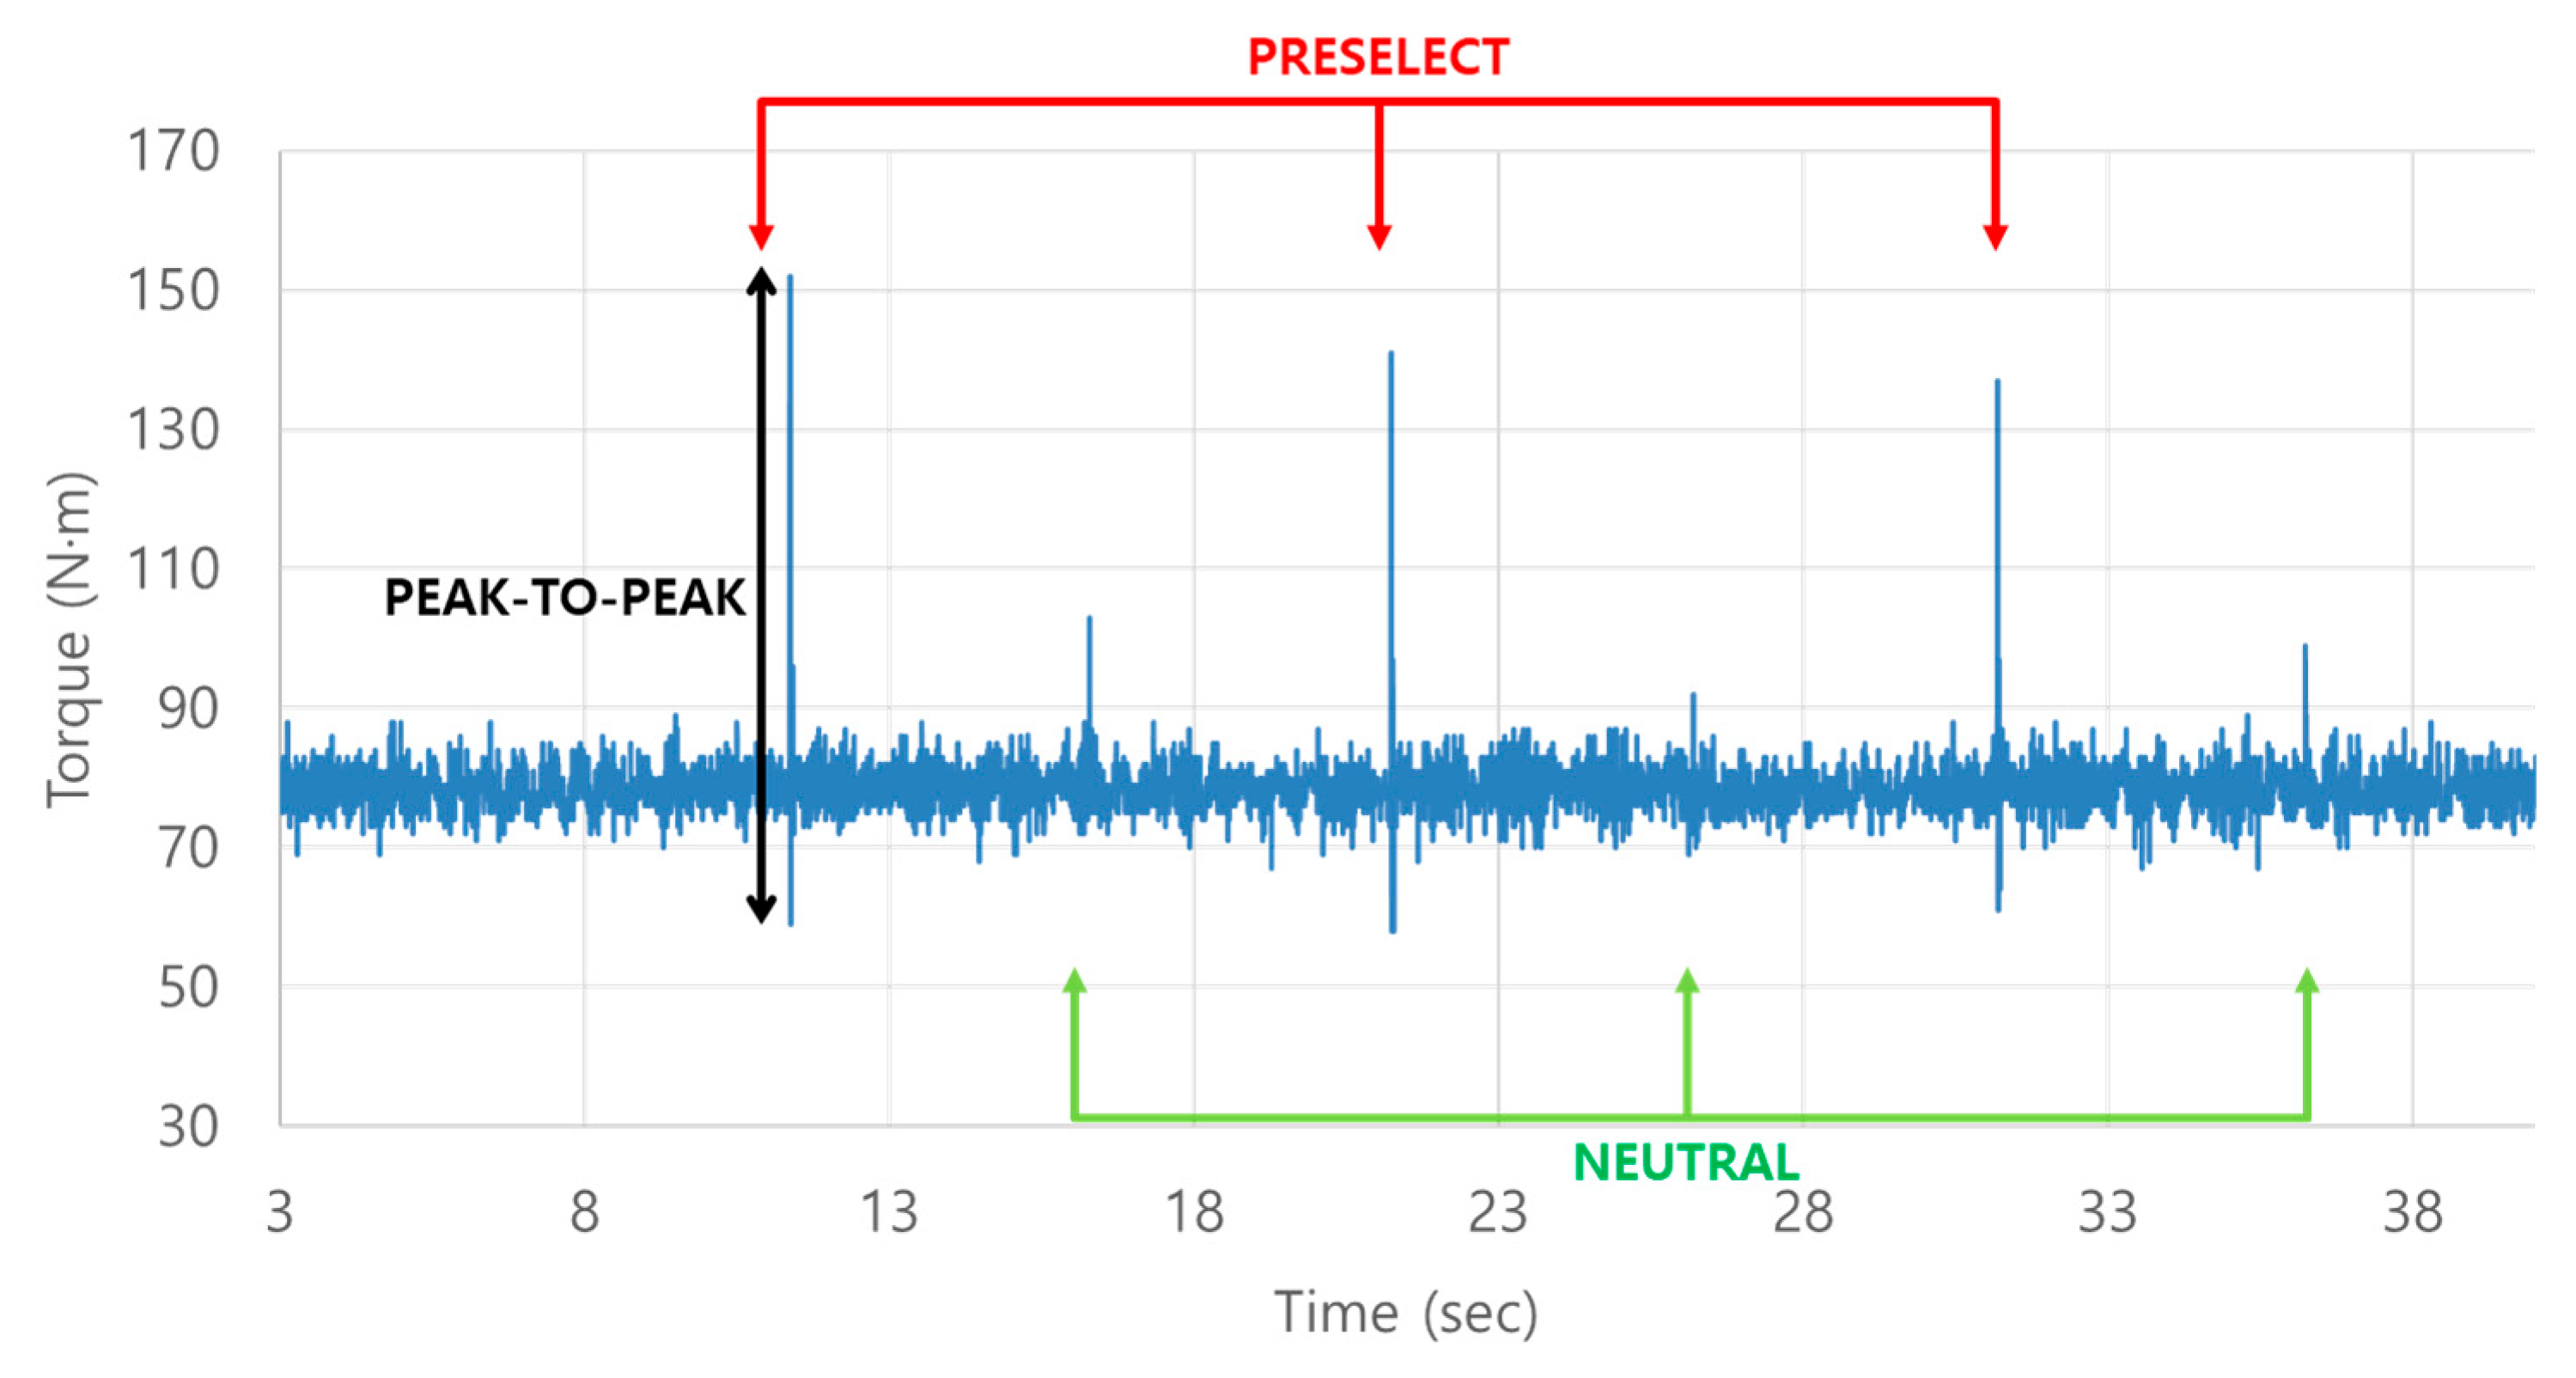
For the tests evaluating the degree of influence of the current, currents ranging from the theoretical synchronizer operating point of 400 mA to 500 mA (8.5 bar) were deemed unable to drive the synchronizer due to component variance and hydraulic friction. Thus, results from 600 mA (12.05 bar) and above were used in the analysis for this study.
6.1. Preselection Engagement (Preselect)
The test for preselection engagement according to shifting force was conducted with a one-way ANOVA to determine if there were any differences in the input shaft torque peak-to-peak and synchronizer shift time resulting from changes in current applied to the cylinder. The results of the one-way ANOVA for input shaft torque peak-to-peak according to shifting force within the same shift stages are shown in
Table 9. In Cases 1, 2, 3, 4, 5, 6, 8, 10, 11, 12, and 14, it appeared to be statistically non-significant based on a significance level of 0.05, meaning that changes in shifting force do not create a significant difference in the mean of input shaft torque peak-to-peak among the conditions. In some conditions (7, 9, and 13), a statistically significant difference was observed as the values were low based on a significance level of 0.05. As shown in
Table 8, in Case 7, the lowest average value was at 900 mA and the highest average value was at 700 mA; in Case 9, the lowest average value was at 700 mA and the highest average value was at 800 mA; and in Case 13, the lowest average value was at 600 mA and the highest average value was at 700 mA. Consequently, it has been determined that the magnitude of the applied pressure based on the current influences torque fluctuations in only some preselection stages according to the
p-value of each case. Additionally, the reason the optimal current is different for each case is because each gear ratio is different, and the relative speed is also different. Therefore, shifting force is considered to be a factor affecting shift shock only in certain preselection stages.
The differences in the means of input shaft torque peak-to-peak according to shift stages within the same shifting force were analyzed as shown in
Table 10. According to the results, the
p-values for each condition were lower than the significance level of 0.05, indicating statistically significant differences in shift stages within the same shifting force conditions. Particularly, as shown in
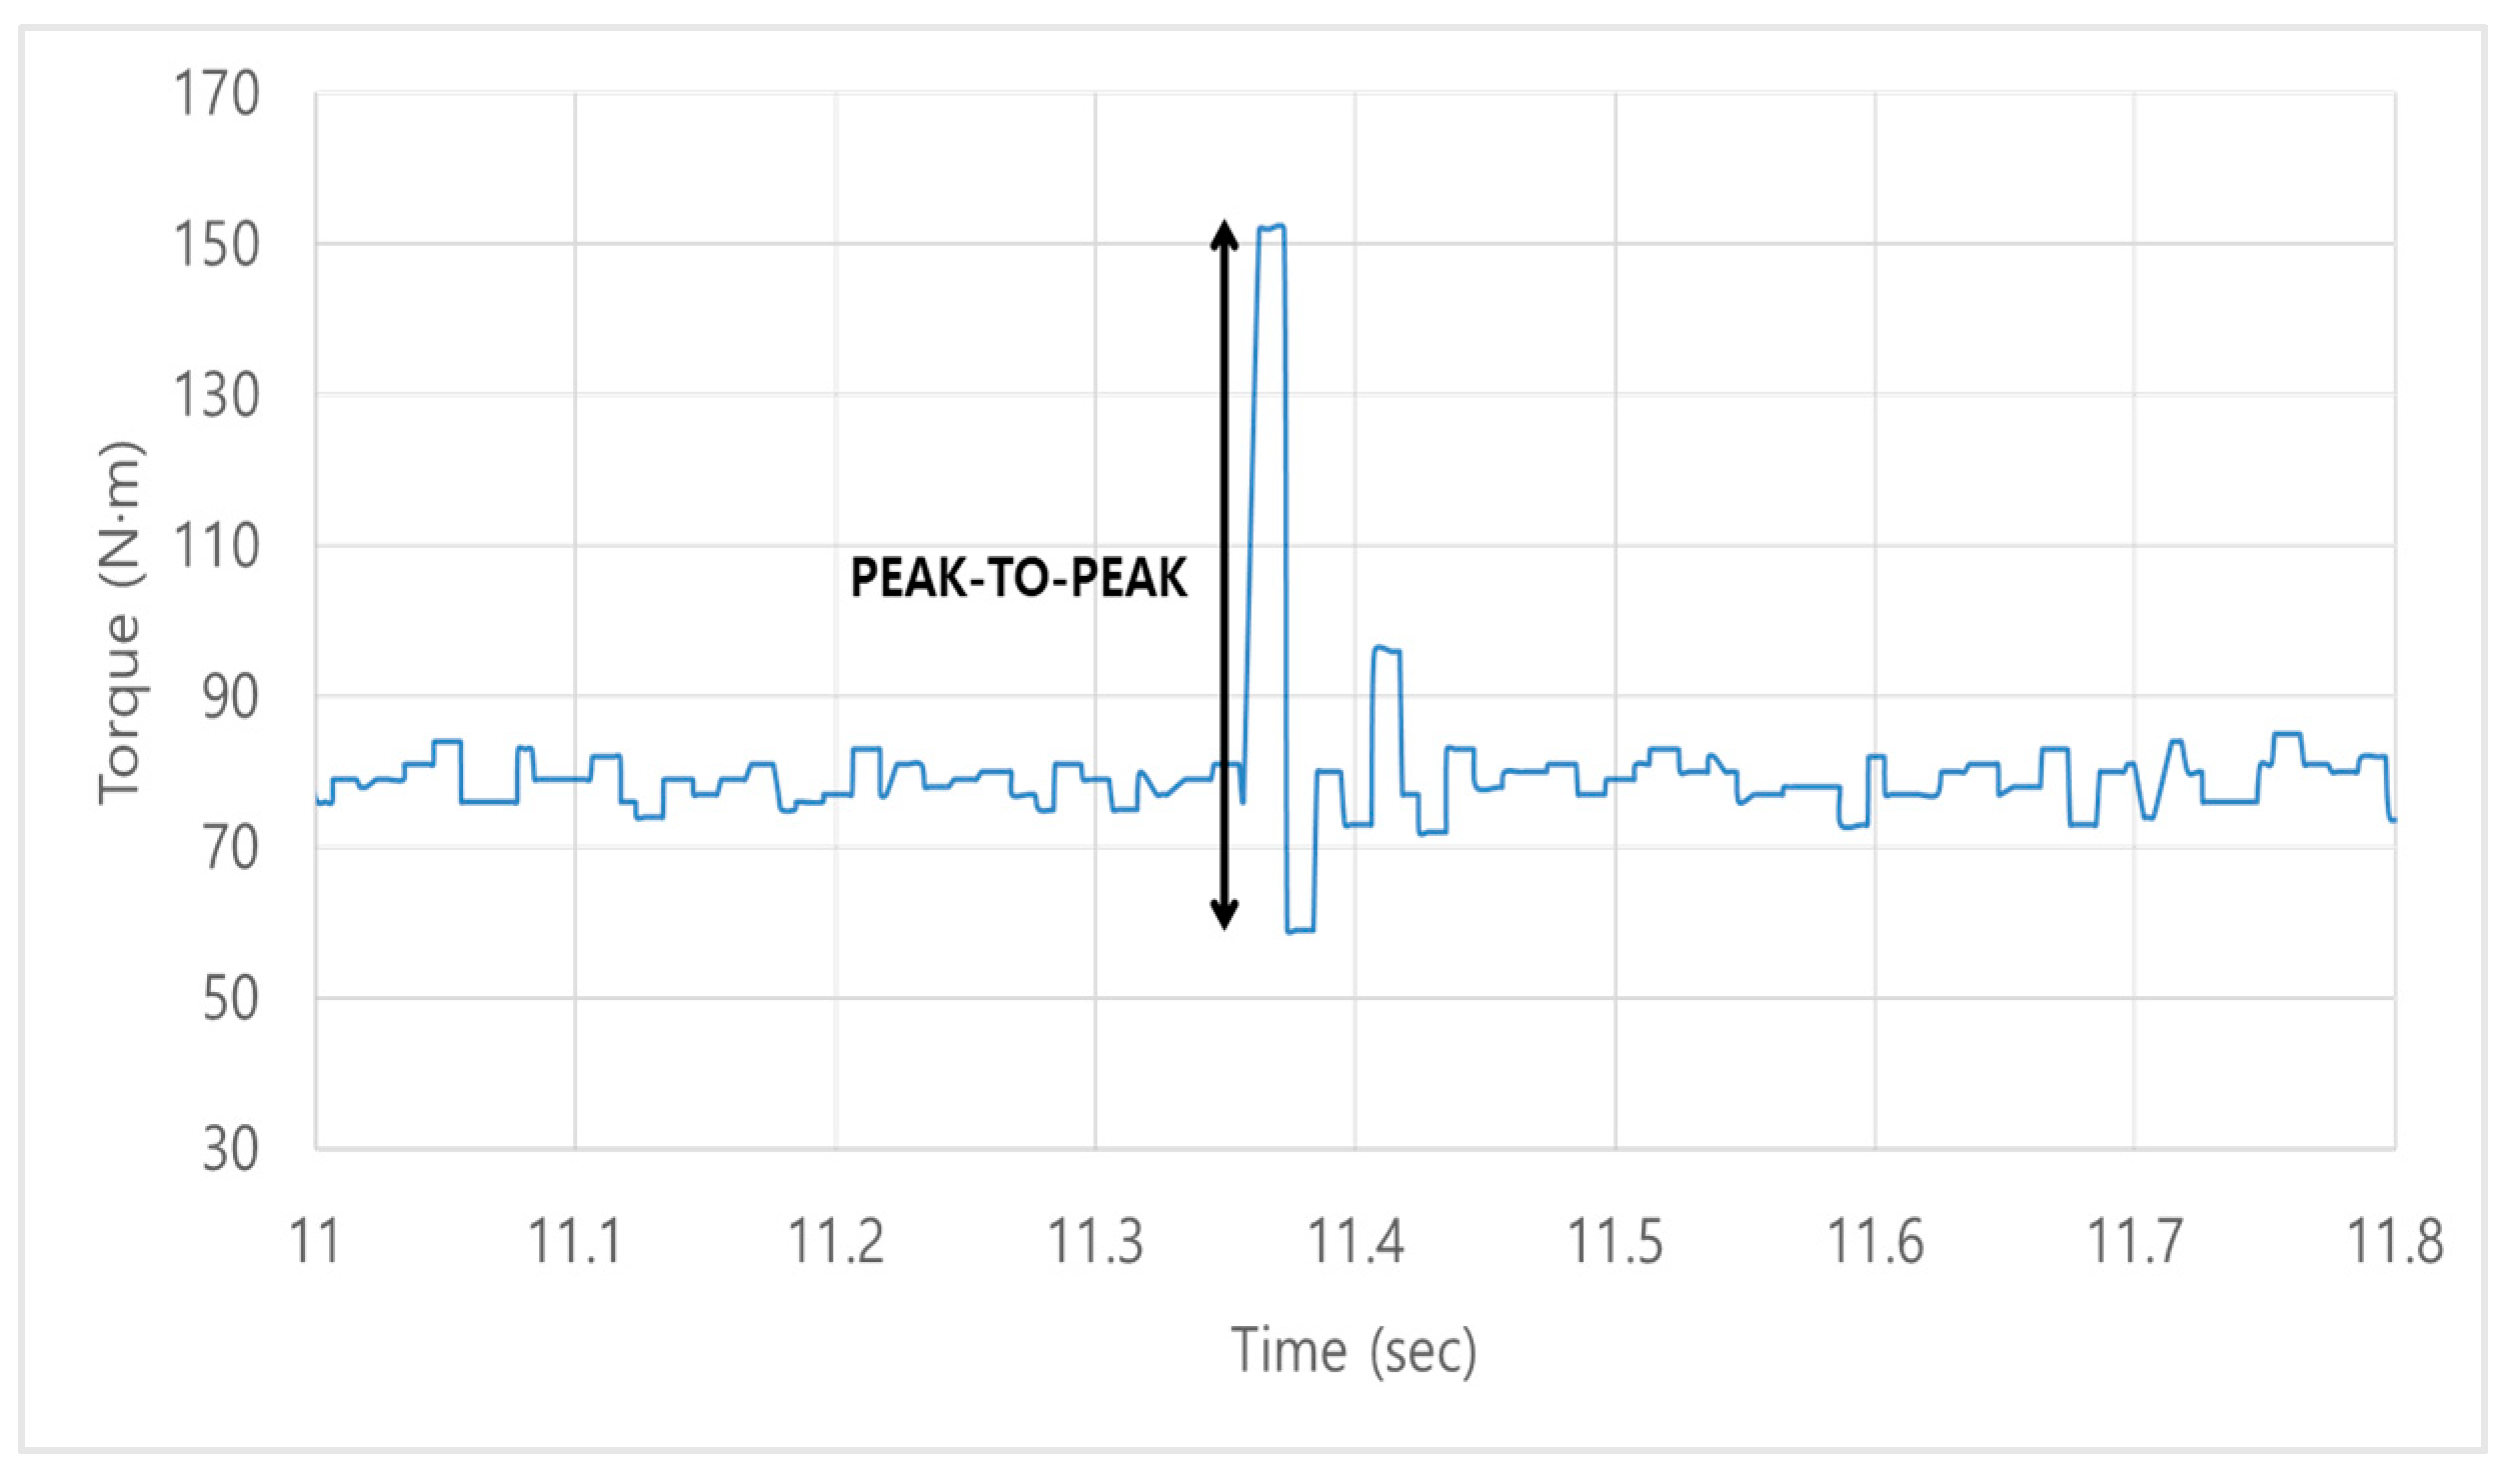
Figure 14, the shift stages increased, a gradual increase in torque peak-to-peak was observed, and it is considered that taking this tendency into account in shift strategies could improve shift quality.
Additionally, upshifts and downshifts were analyzed separately as shown in
Table 11. The results showed
p-values higher than the significance level of 0.05, confirming that there is no significant difference in the average peak-to-peak input shaft torque between upshifts and downshifts.
The results for shift time according to shifting force within the same shift stages are shown in
Table 12. In Cases 2, 5, 6, 8, 10, and 12, no statistically significant difference was shown based on the significance level of 0.05. In Cases 1, 3, 4, 7, 9, 11, 13, and 14, a statistically significant difference was observed based on the significance level of 0.05.
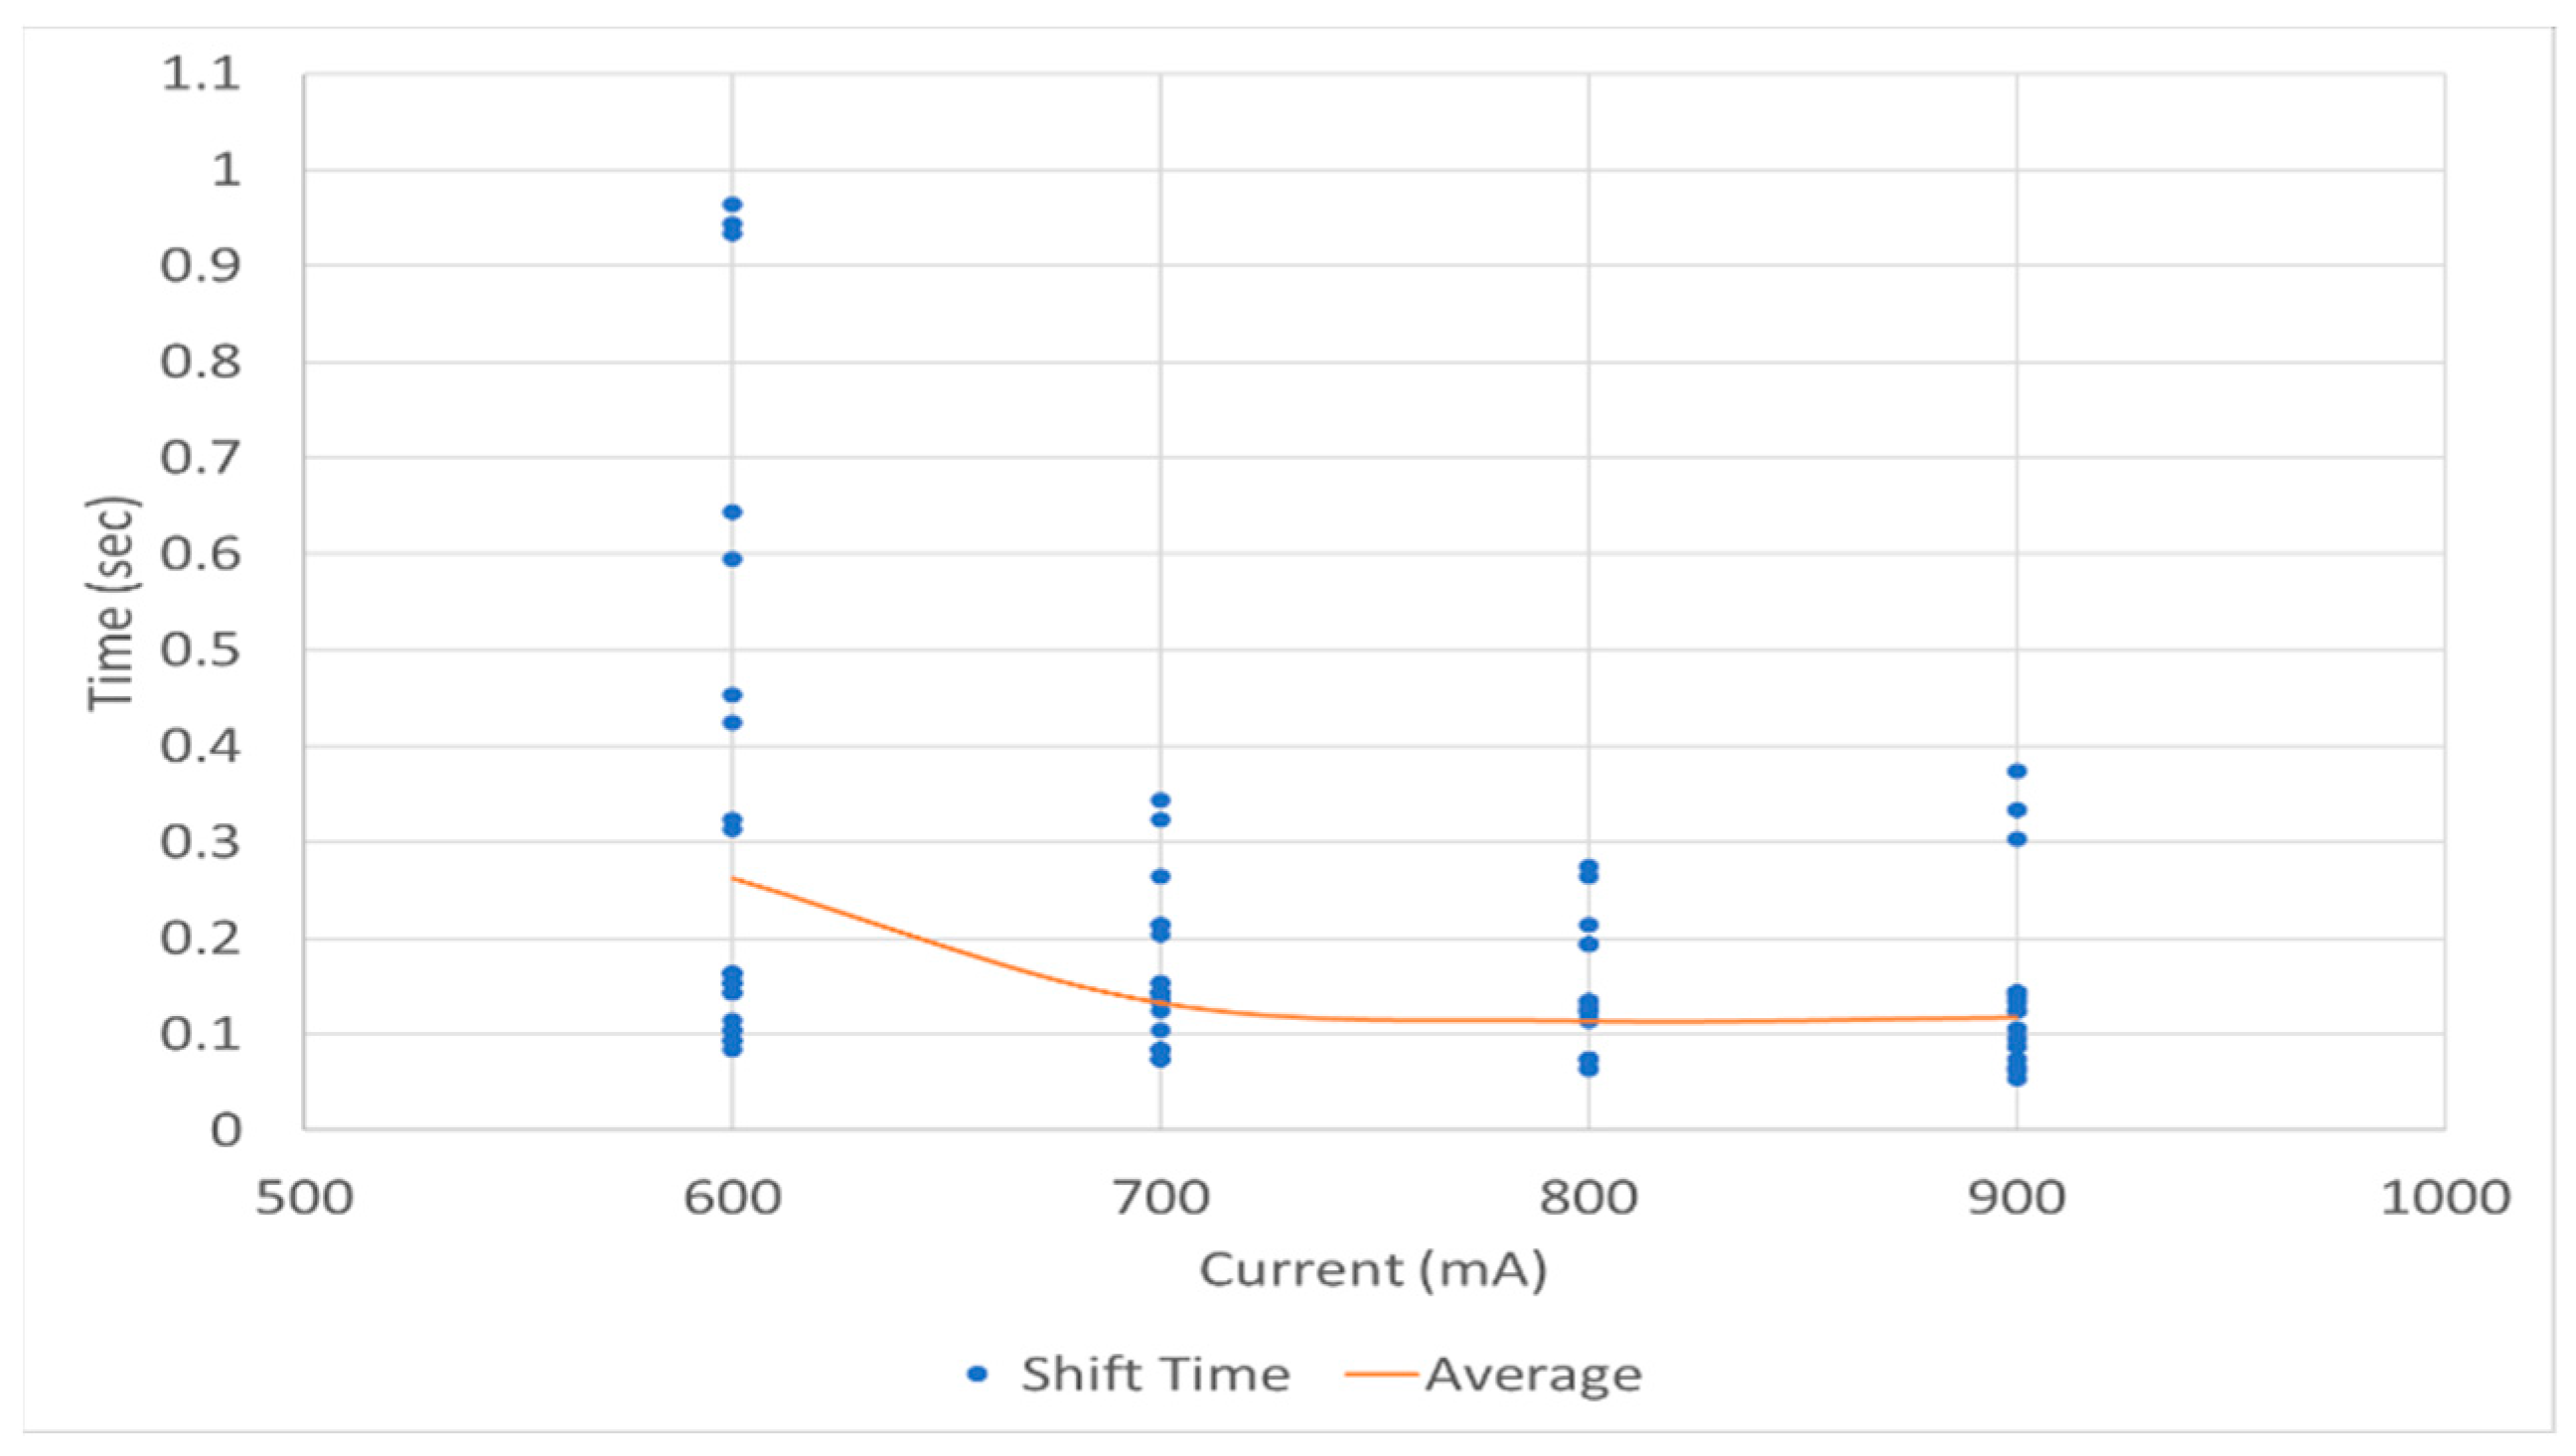
Figure 15 separately illustrates the relationship between shift time and shifting force for Cases 1, 3, 4, 7, 9, 11, 13, and 14, which showed significant differences. At a current of 600 mA, a significantly longer shift time (0.262 s) was shown compared to other independent conditions, and a comparison of shift times at 700 mA (0.133 s), 800 mA (0.114 s), and 900 mA (0.118 s) showed that the condition at 800 mA had the shortest average shift time. In conclusion, the results indicate that in the control of the synchronizer, when a shifting force above a certain range is applied, there is no difference in shift time due to changes in shifting force.
Additionally, the differences in the average shift time according to shift stages within the same shifting force were analyzed as shown in
Table 13. According to the results, all conditions showed
p-values below the significance level of 0.05, indicating statistical significance. This means that there are differences in the average shift time depending on the shift stages. Therefore, shift stages are considered to be a parameter factor affecting shift quality.
A comprehensive analysis reveals that except for Case 11, all conditions resulted in shifting within 0.05 s to 0.2 s. Case 11 showed the highest average shift time at 0.254 s.
The difference in shift quality due to the magnitude of relative speed required for speed synchronization during synchronizer engagement was compared. The relative speeds at both ends of the synchronizer during preselection are as shown in
Table 14, and the highest relative speed difference was observed in
Figure 16, Case 11. Consequently, as shown
Figure 17, the difference in relative speeds at both ends of the synchronizer affects the time it takes to synchronize the synchronizer and the shift shock, with an increase in relative speed leading to longer shift times. Thus, changes in the level of relative speed have been confirmed to influence shift time.
Subsequently, tests were conducted to determine the changes in shifting force and shift time depending on the shift timing at which preselection begins, and input shaft torque peak-to-peak and shift time were analyzed using one-way ANOVA. The average values of input shaft torque peak-to-peak according to the shift timing are shown in
Table 15. Except for Case 1, all shifting processes were not statistically significant as they showed
p-values higher than the significance level of 0.05, confirming that there were no differences in the averages of torque peak-to-peak due to changes in shift timing. In Case 1, the
p-value was lower than the significance level of 0.05, suggesting that there is a significant effect on the average of input shaft torque peak-to-peak according to different shift timings. Therefore, it was determined that changes in the shift timing affect the input shaft torque peak-to-peak only in Case 1, while generally, it does not have an impact.
The shift shock according to shift stages within the same shift timing was analyzed as shown in
Table 16. The results of the one-way ANOVA showed that there are significant differences in the average input shaft torque peak-to-peak according to the shift stages. This suggests that adjusting shift timings according to the characteristics of the shift stages can lead to changes in shift shock.
The results for shift time according to shift timing were analyzed as shown in
Table 17. Except for Case 4, all shifting processes were statistically non-significant as they showed
p-values higher than the significance level of 0.05, confirming that there are no differences in the average shift time due to changes in shift timing. For Case 4, the
p-value was lower than the significance level of 0.05, confirming that there is a difference in the average shift time according to the shift timing. Hence, the results indicate that shift timing affects shift quality only in Case 4.
Additionally, the differences in shift time according to changes in shift stages within the same shift timing were analyzed. The results of the one-way ANOVA shown in
Table 18 and
Figure 18 confirmed that there are differences in the average shift time according to the shift stages. This suggests that shift stages should be considered as a key factor, and control strategies should be established by adjusting shift timings accordingly.
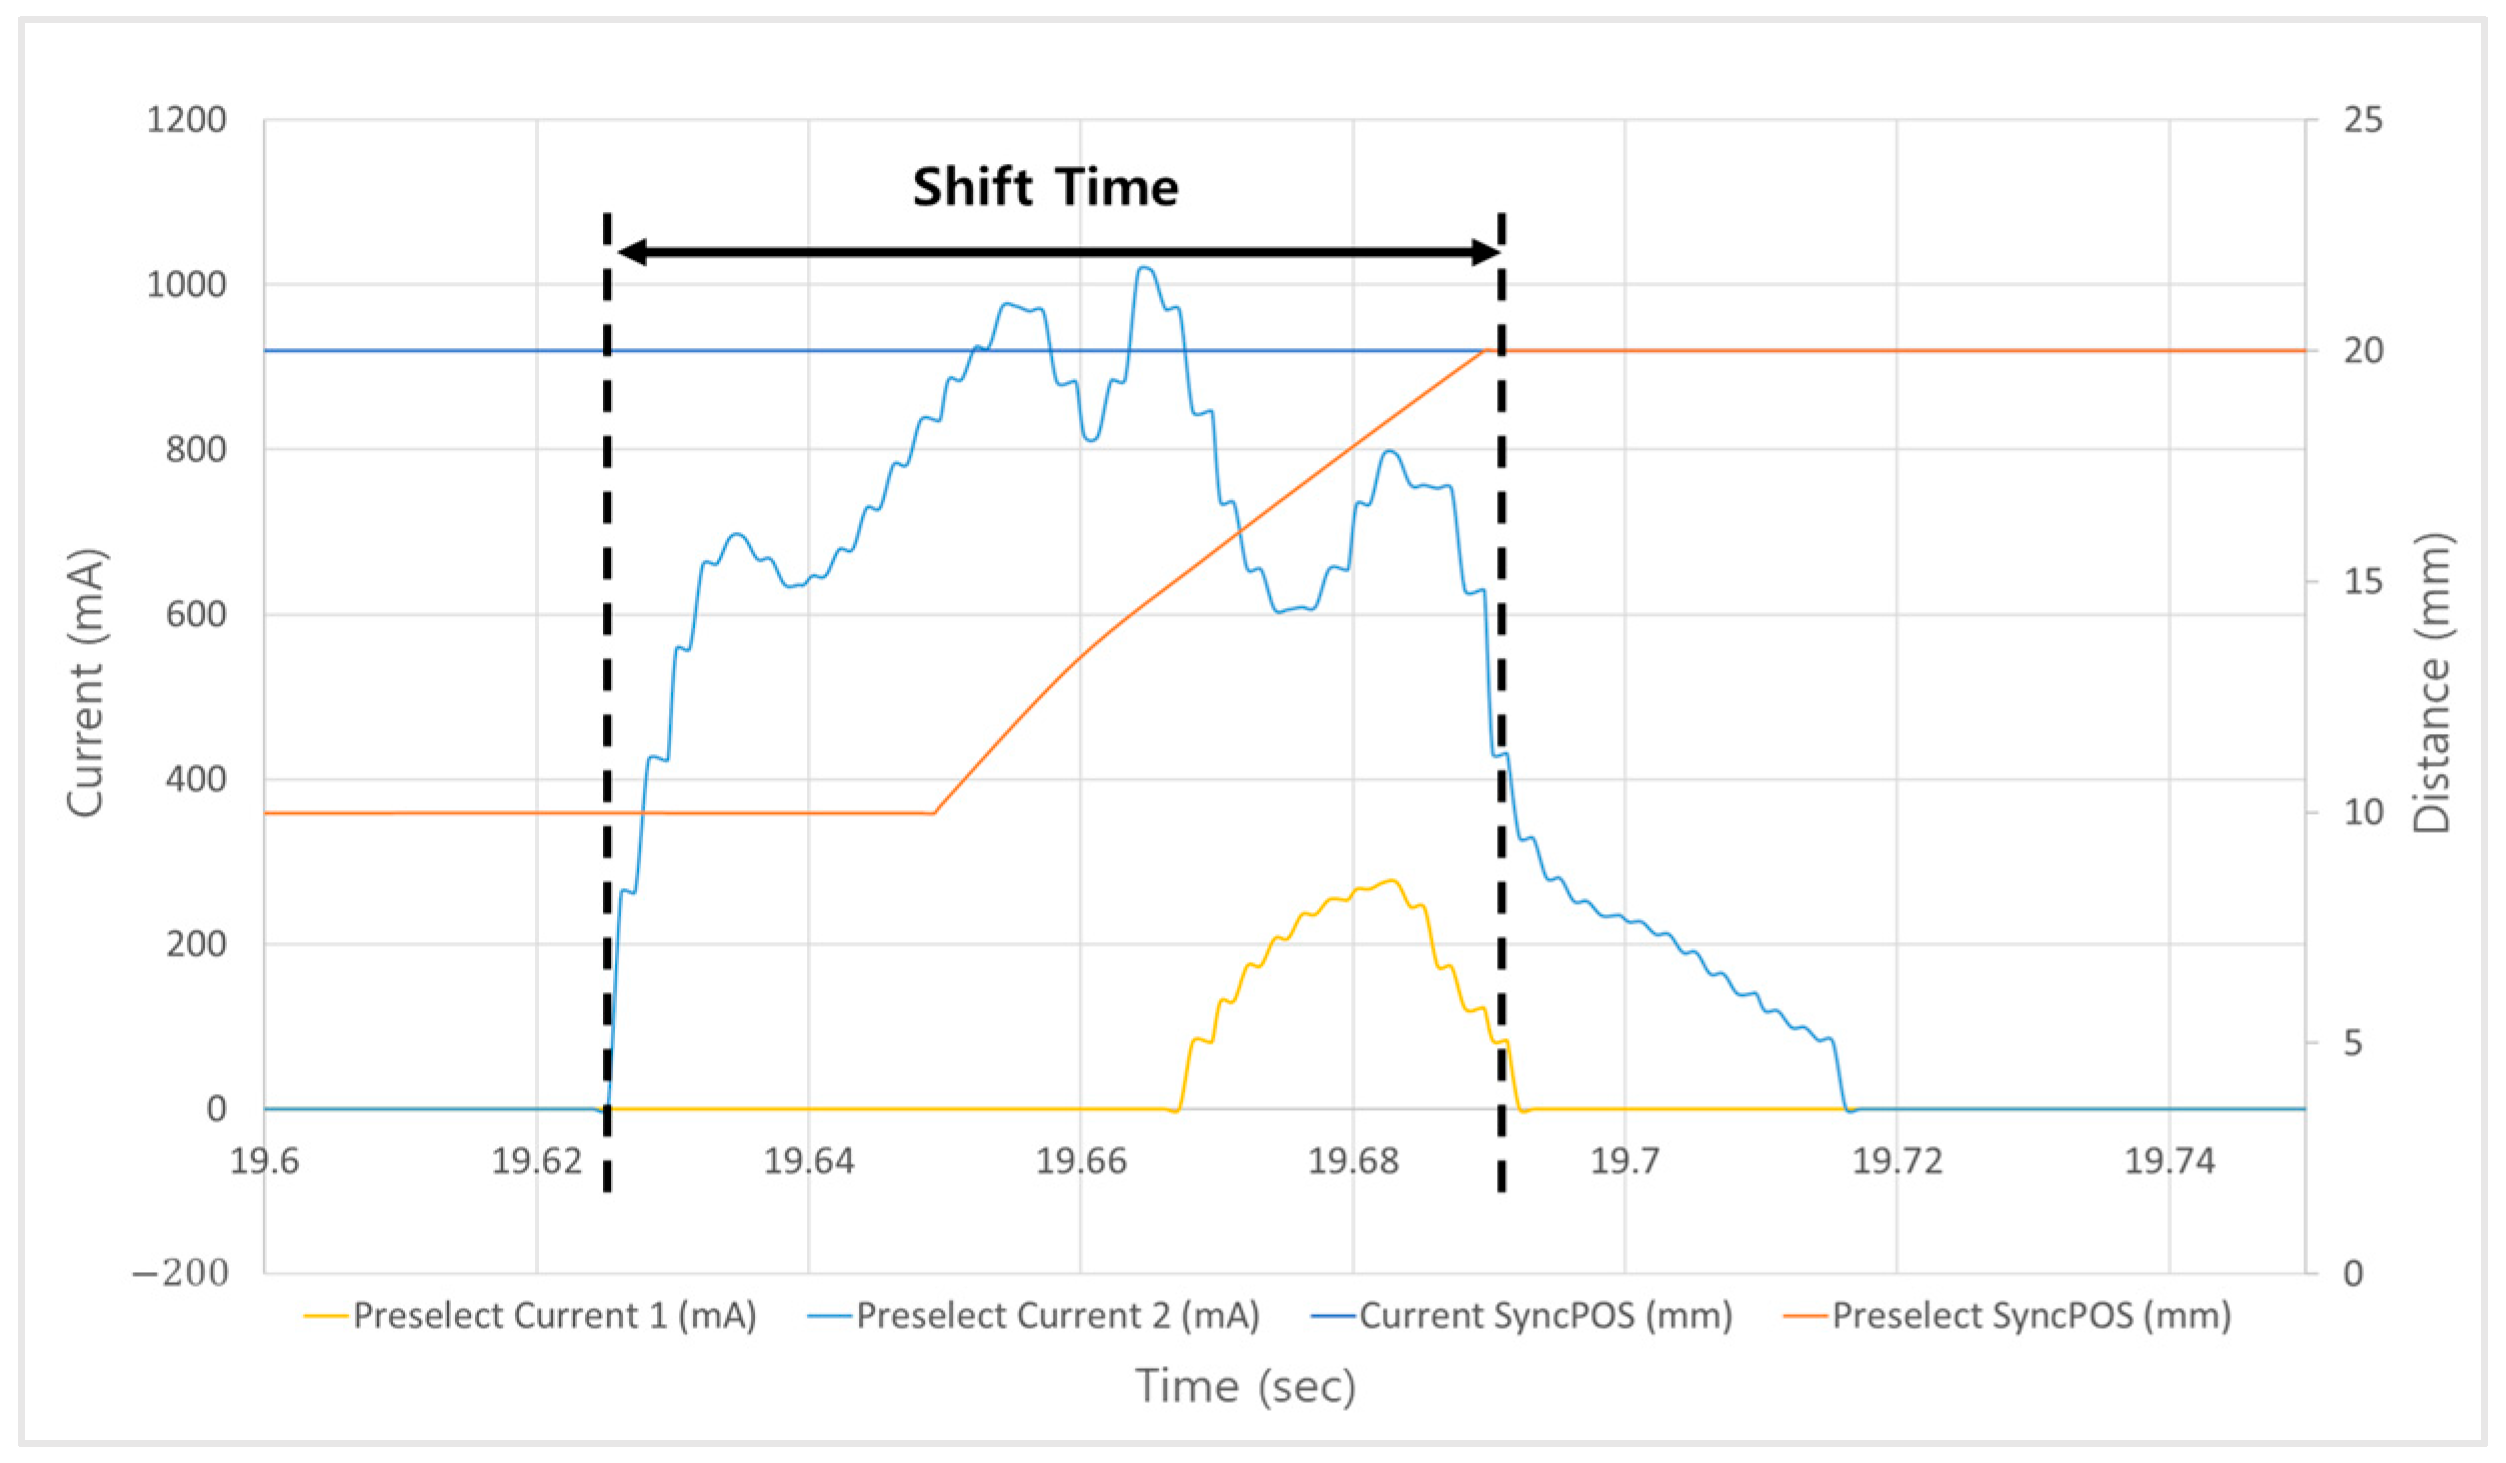
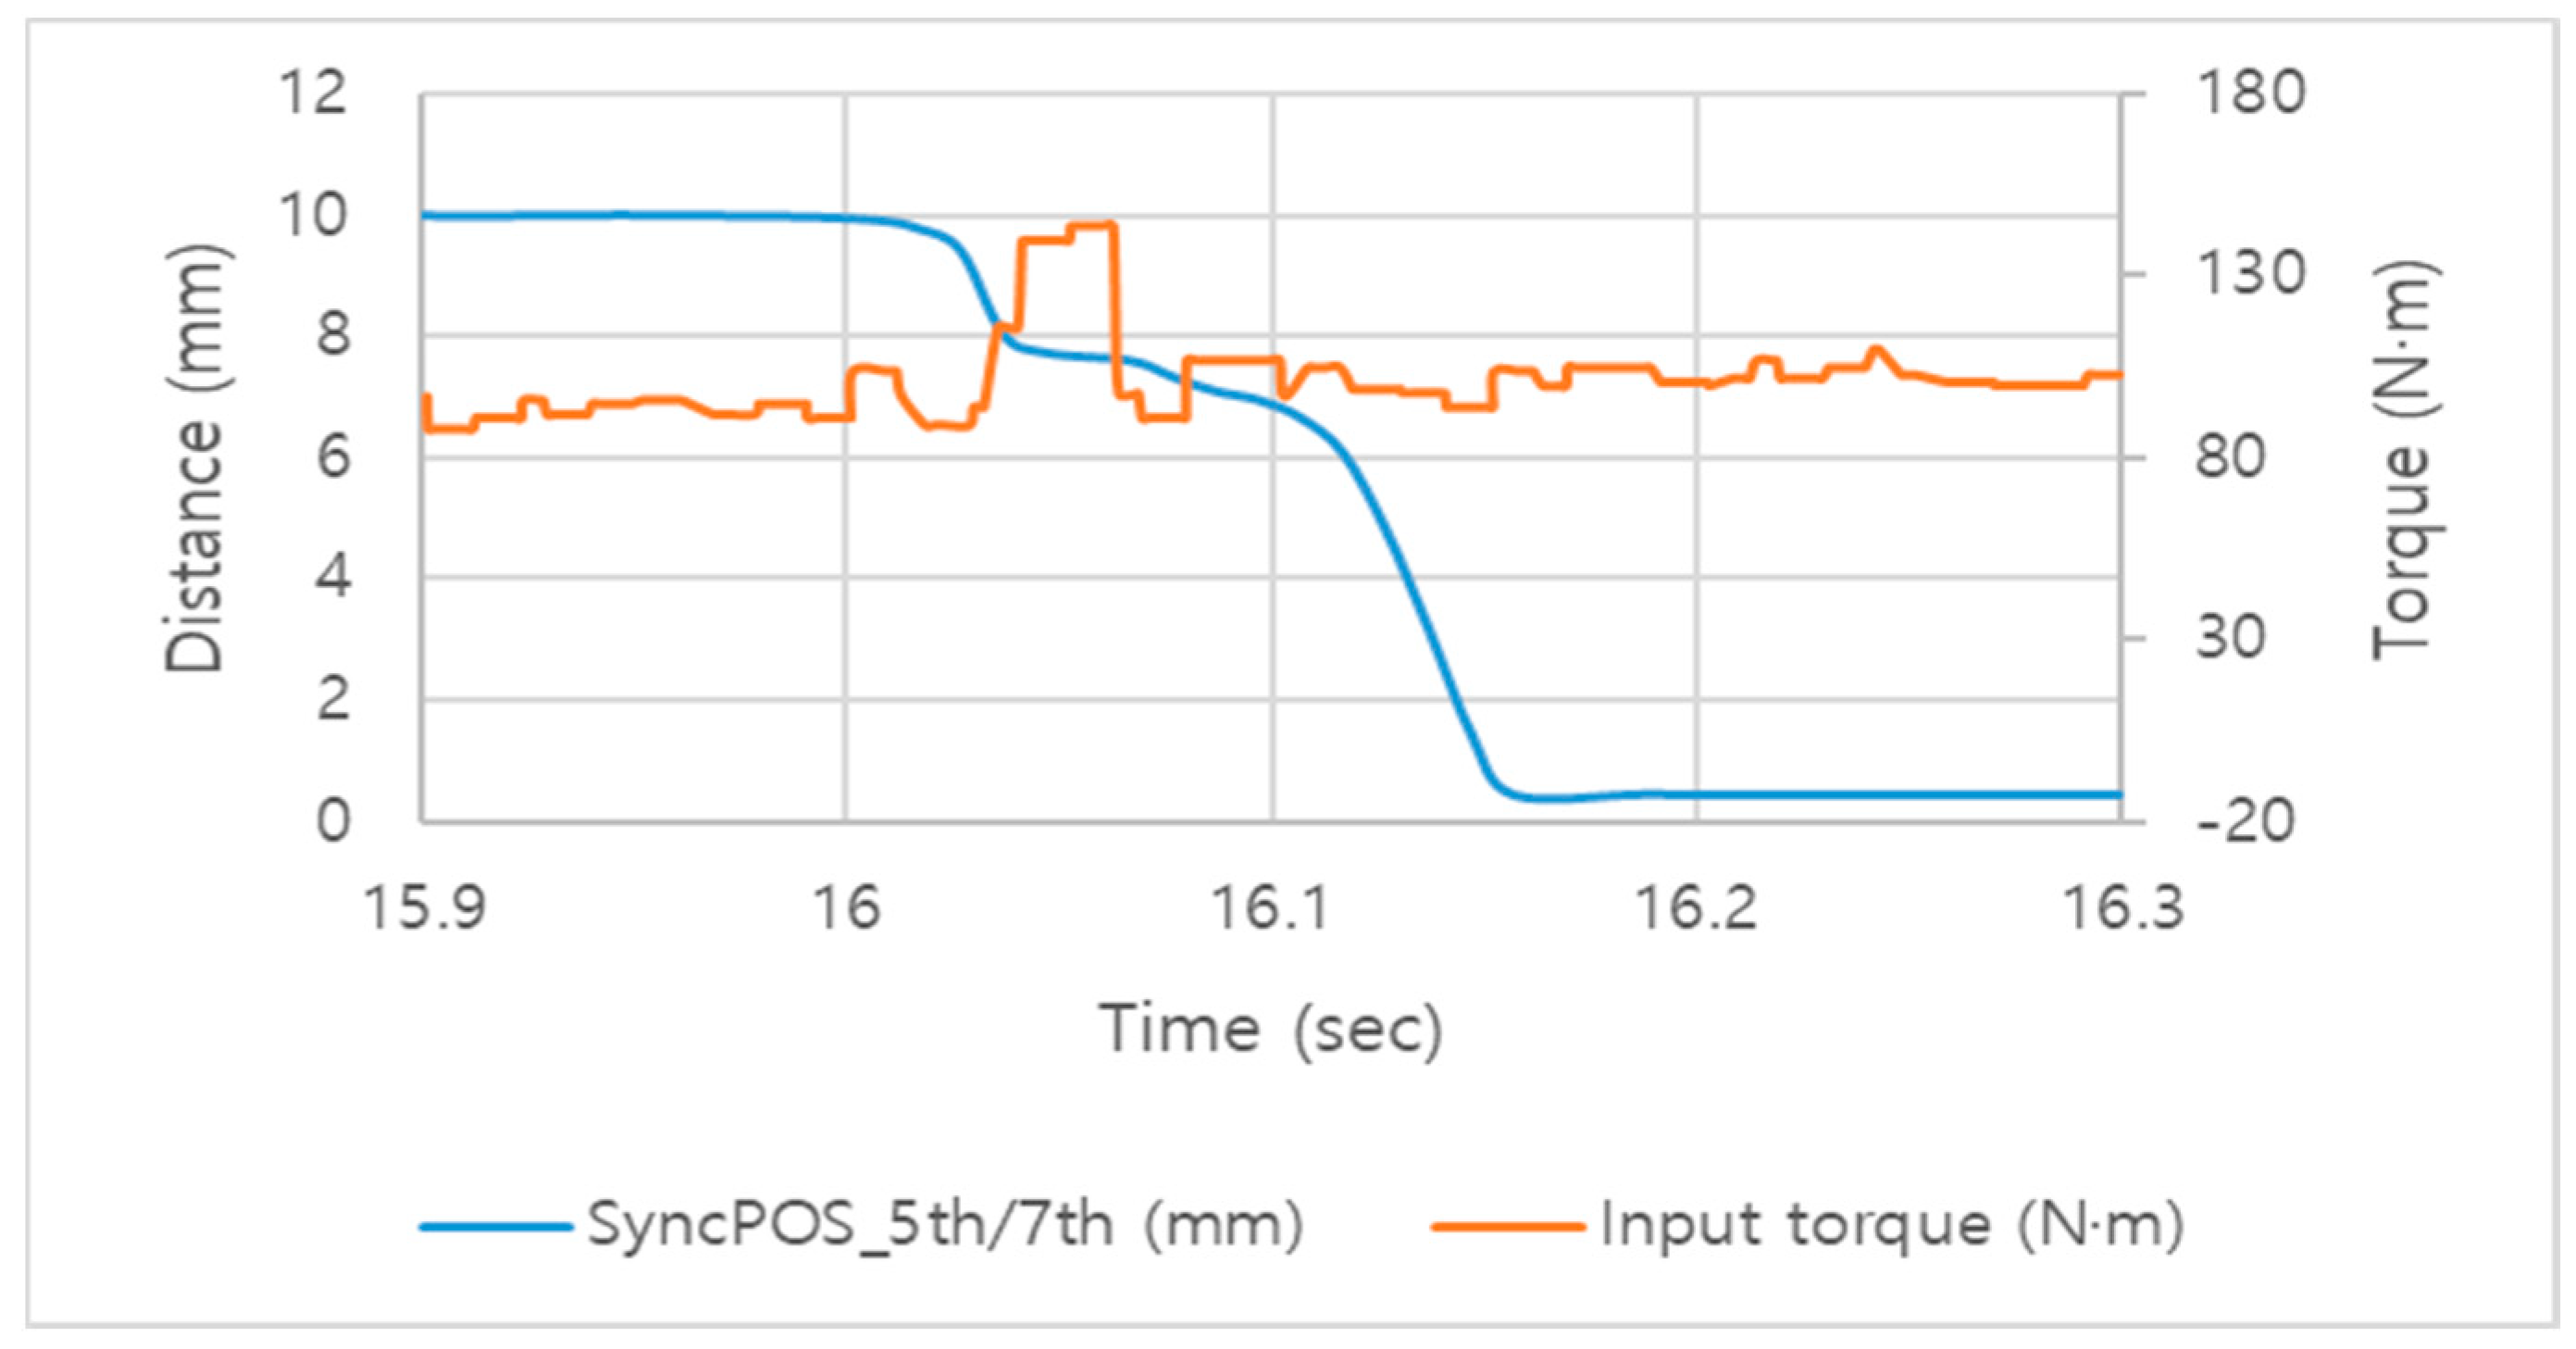
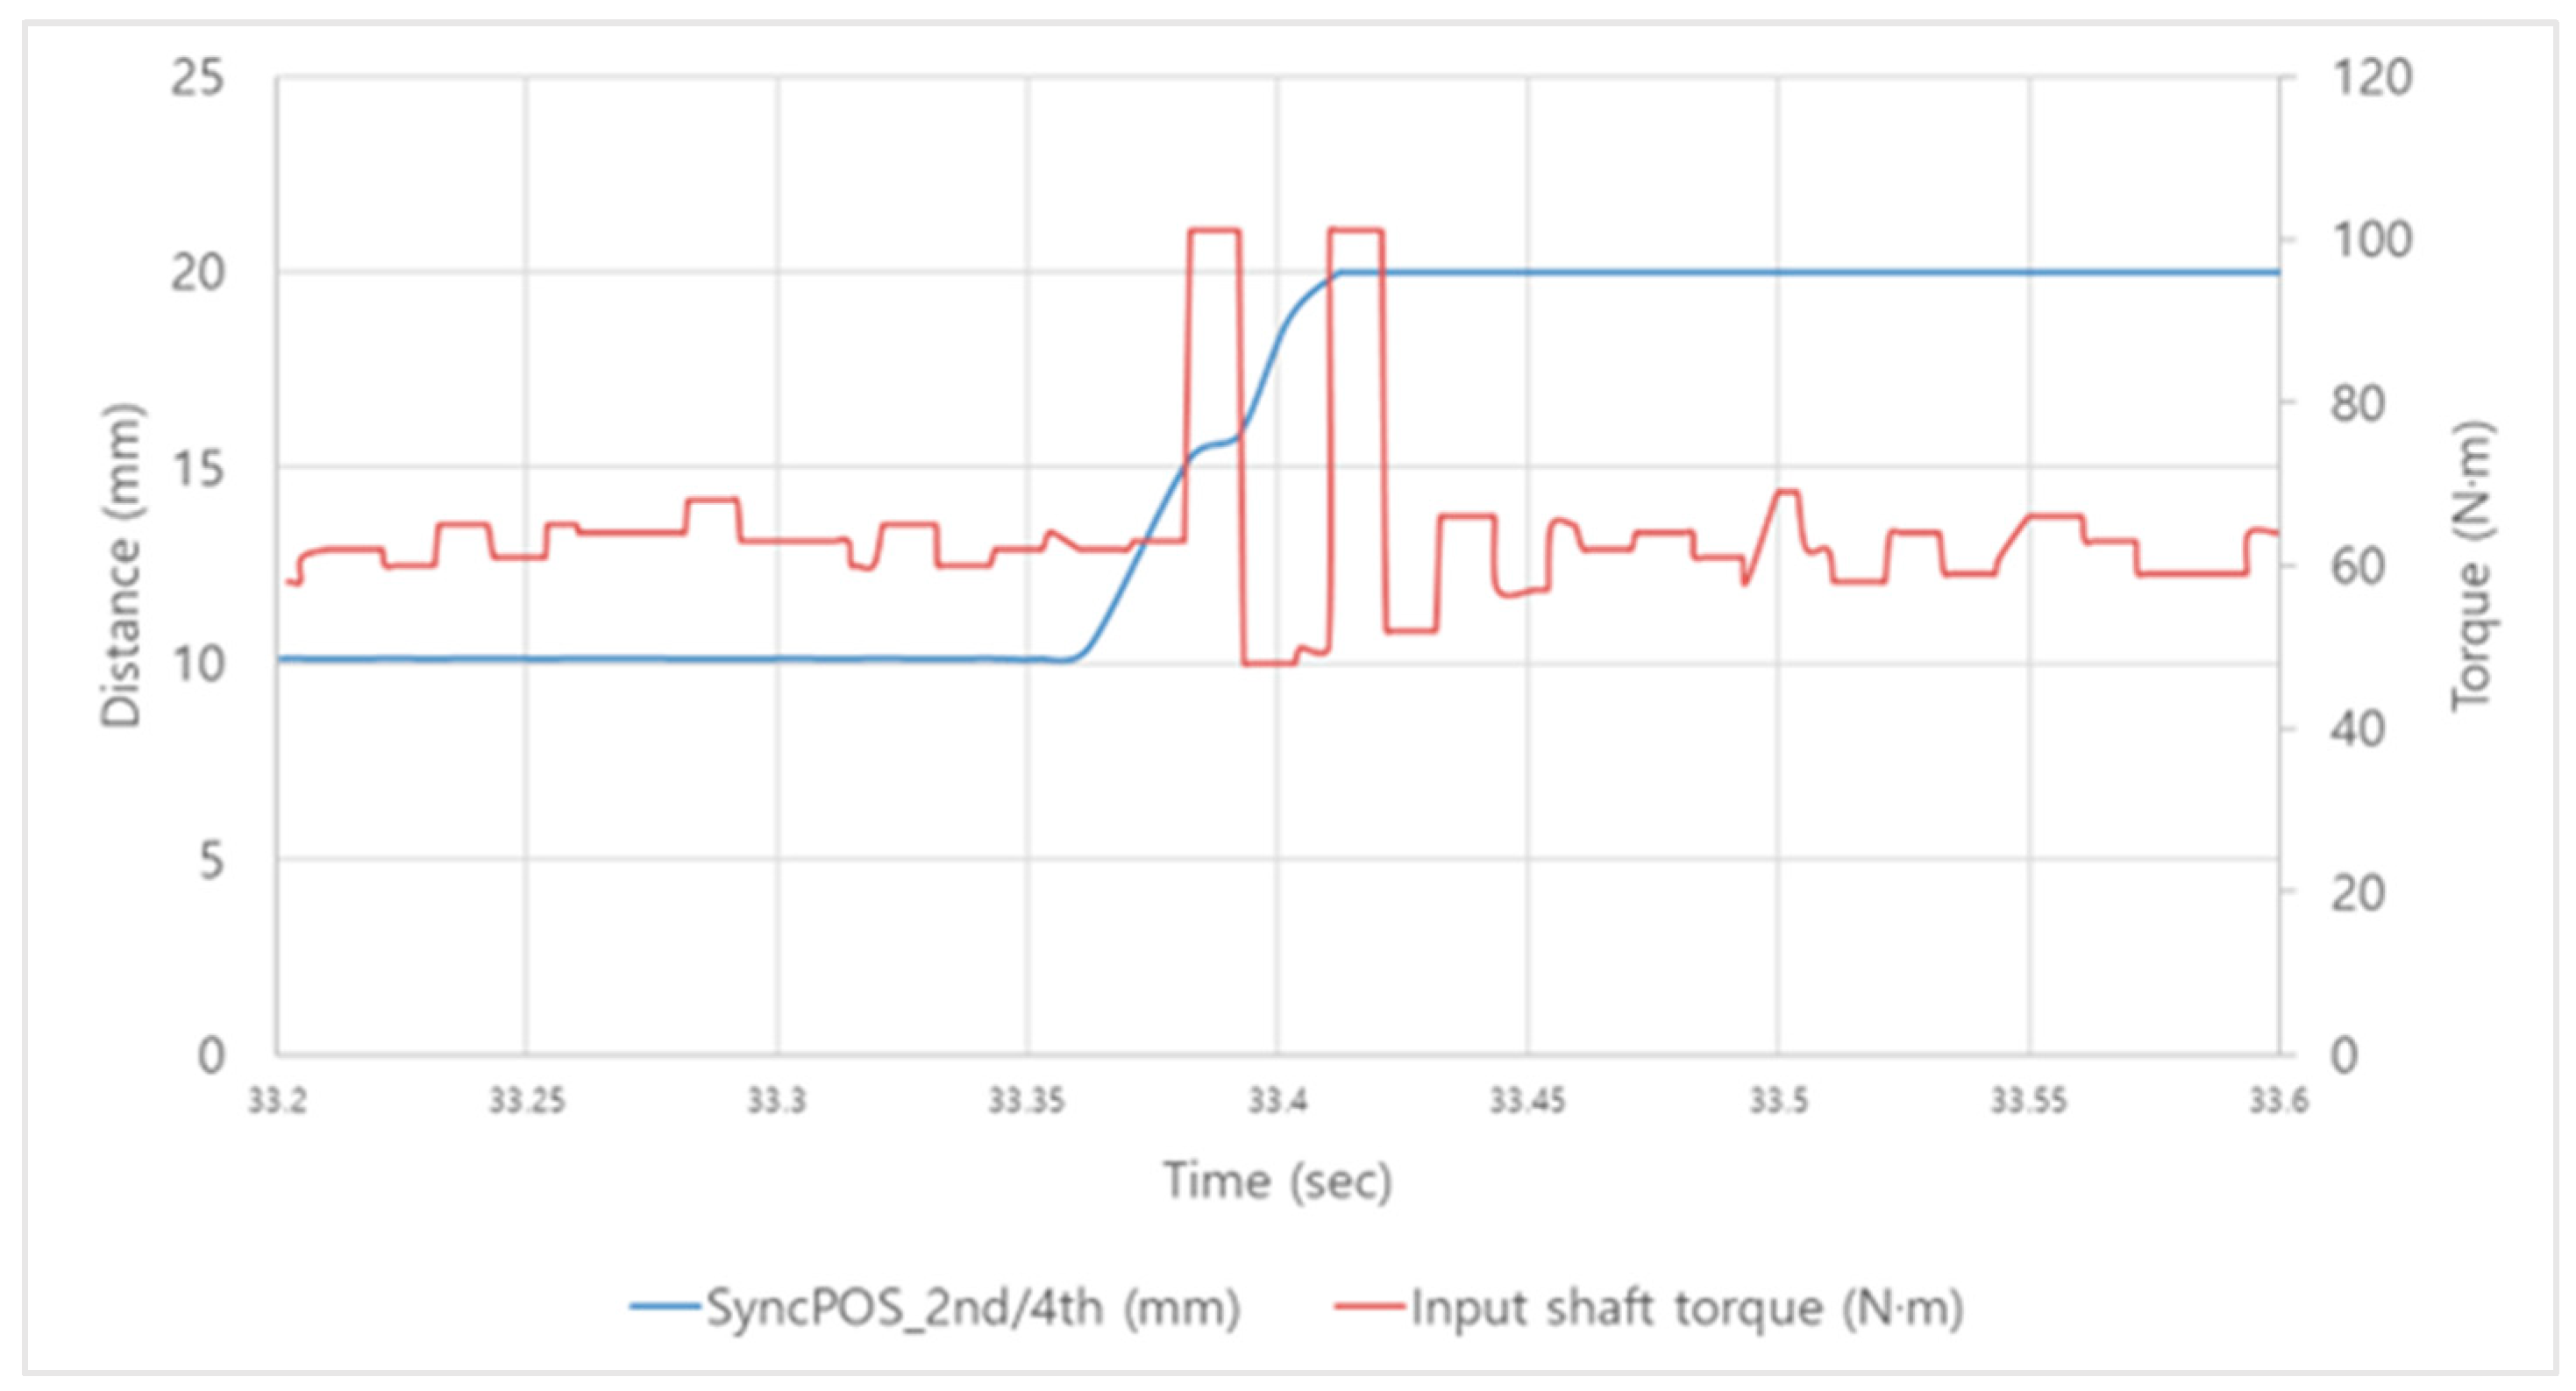
Lastly, the change in input shaft torque peak-to-peak according to the position of the synchronizer sleeve was analyzed as shown in
Table 19 and
Figure 19. The test results showed that in the lowest gear, first gear, the preselection as shown in
Figure 20 did not cause shift shock during the synchronization process as the rate of change in the sleeve position was constant over time, but a peak occurred in the process of engaging the gear after synchronization was completed. For gears other than first gear, significant torque fluctuations occurred both during the synchronization process and the engagement process that follows. The cause of these torque fluctuations can be summarized as follows. Torque fluctuations during synchronization occurred due to attempting to start synchronization with rapid and excessive force, and the torque fluctuations during the engagement process occurred due to excessive force applied, causing a strong collision with the hard object fixing the gear.
In conclusion, factors to improve shift shock and shift time, which are criteria for determining shift quality, were analyzed through preselection action tests for each shift stage according to changes in shifting force and shift timing. As in
Table 20, shifting force and shift timing are factors that can influence shift shock, and they have also been adopted as factors that can affect shift time. However, results that occur only under specific conditions cannot be determined as factors to improve overall shift quality due to a lack of universality. Therefore, this study focused on overall trends, and it is judged that strategies to improve shift quality through separate control techniques should be established for these specific conditions. Additionally, upon analyzing the difference in relative speeds of the synchronizer for each shift stage condition, it was determined that the major input shaft torque fluctuations and shift time are significantly influenced by relative speed, which affects both shift shock and shift time. Hence, relative speed should be considered as a control factor for improving shift quality.
6.2. Preselection Disengagement (Neutral)
Tests for preselection disengagement according to shifting force were conducted using one-way ANOVA to see if there were any differences in the average torque peak-to-peak and shift time due to the current applied to the cylinder. Within the same shift stages, the results for torque peak-to-peak according to shifting force are statistically shown in
Table 21. In Cases 1, 7, 10, 13, and 14, the
p-values were below the significance level of 0.05, indicating statistical significance, confirming that there are differences in the average input shaft torque peak-to-peak according to shifting force. In Cases 2, 3, 4, 5, 6, 8, 9, 11, and 12, the
p-values were above the significance level of 0.05, indicating no statistical significance and therefore no average differences. Consequently, it is determined that the magnitude of the applied pressure due to shifting force influences torque fluctuations only in certain neutral stages.
The differences in the means of input shaft torque peak-to-peak according to shift stages within the same shifting force were analyzed as shown in
Table 22. The results showed statistical significance with
p-values below the significance level of 0.05, confirming that there are differences in the average input shaft torque peak-to-peak according to the shift stages. As shown in
Table 23, these average differences can occur due to the difference in relative speeds, indicating that shift stages considering relative speed are factors that can influence shift quality.
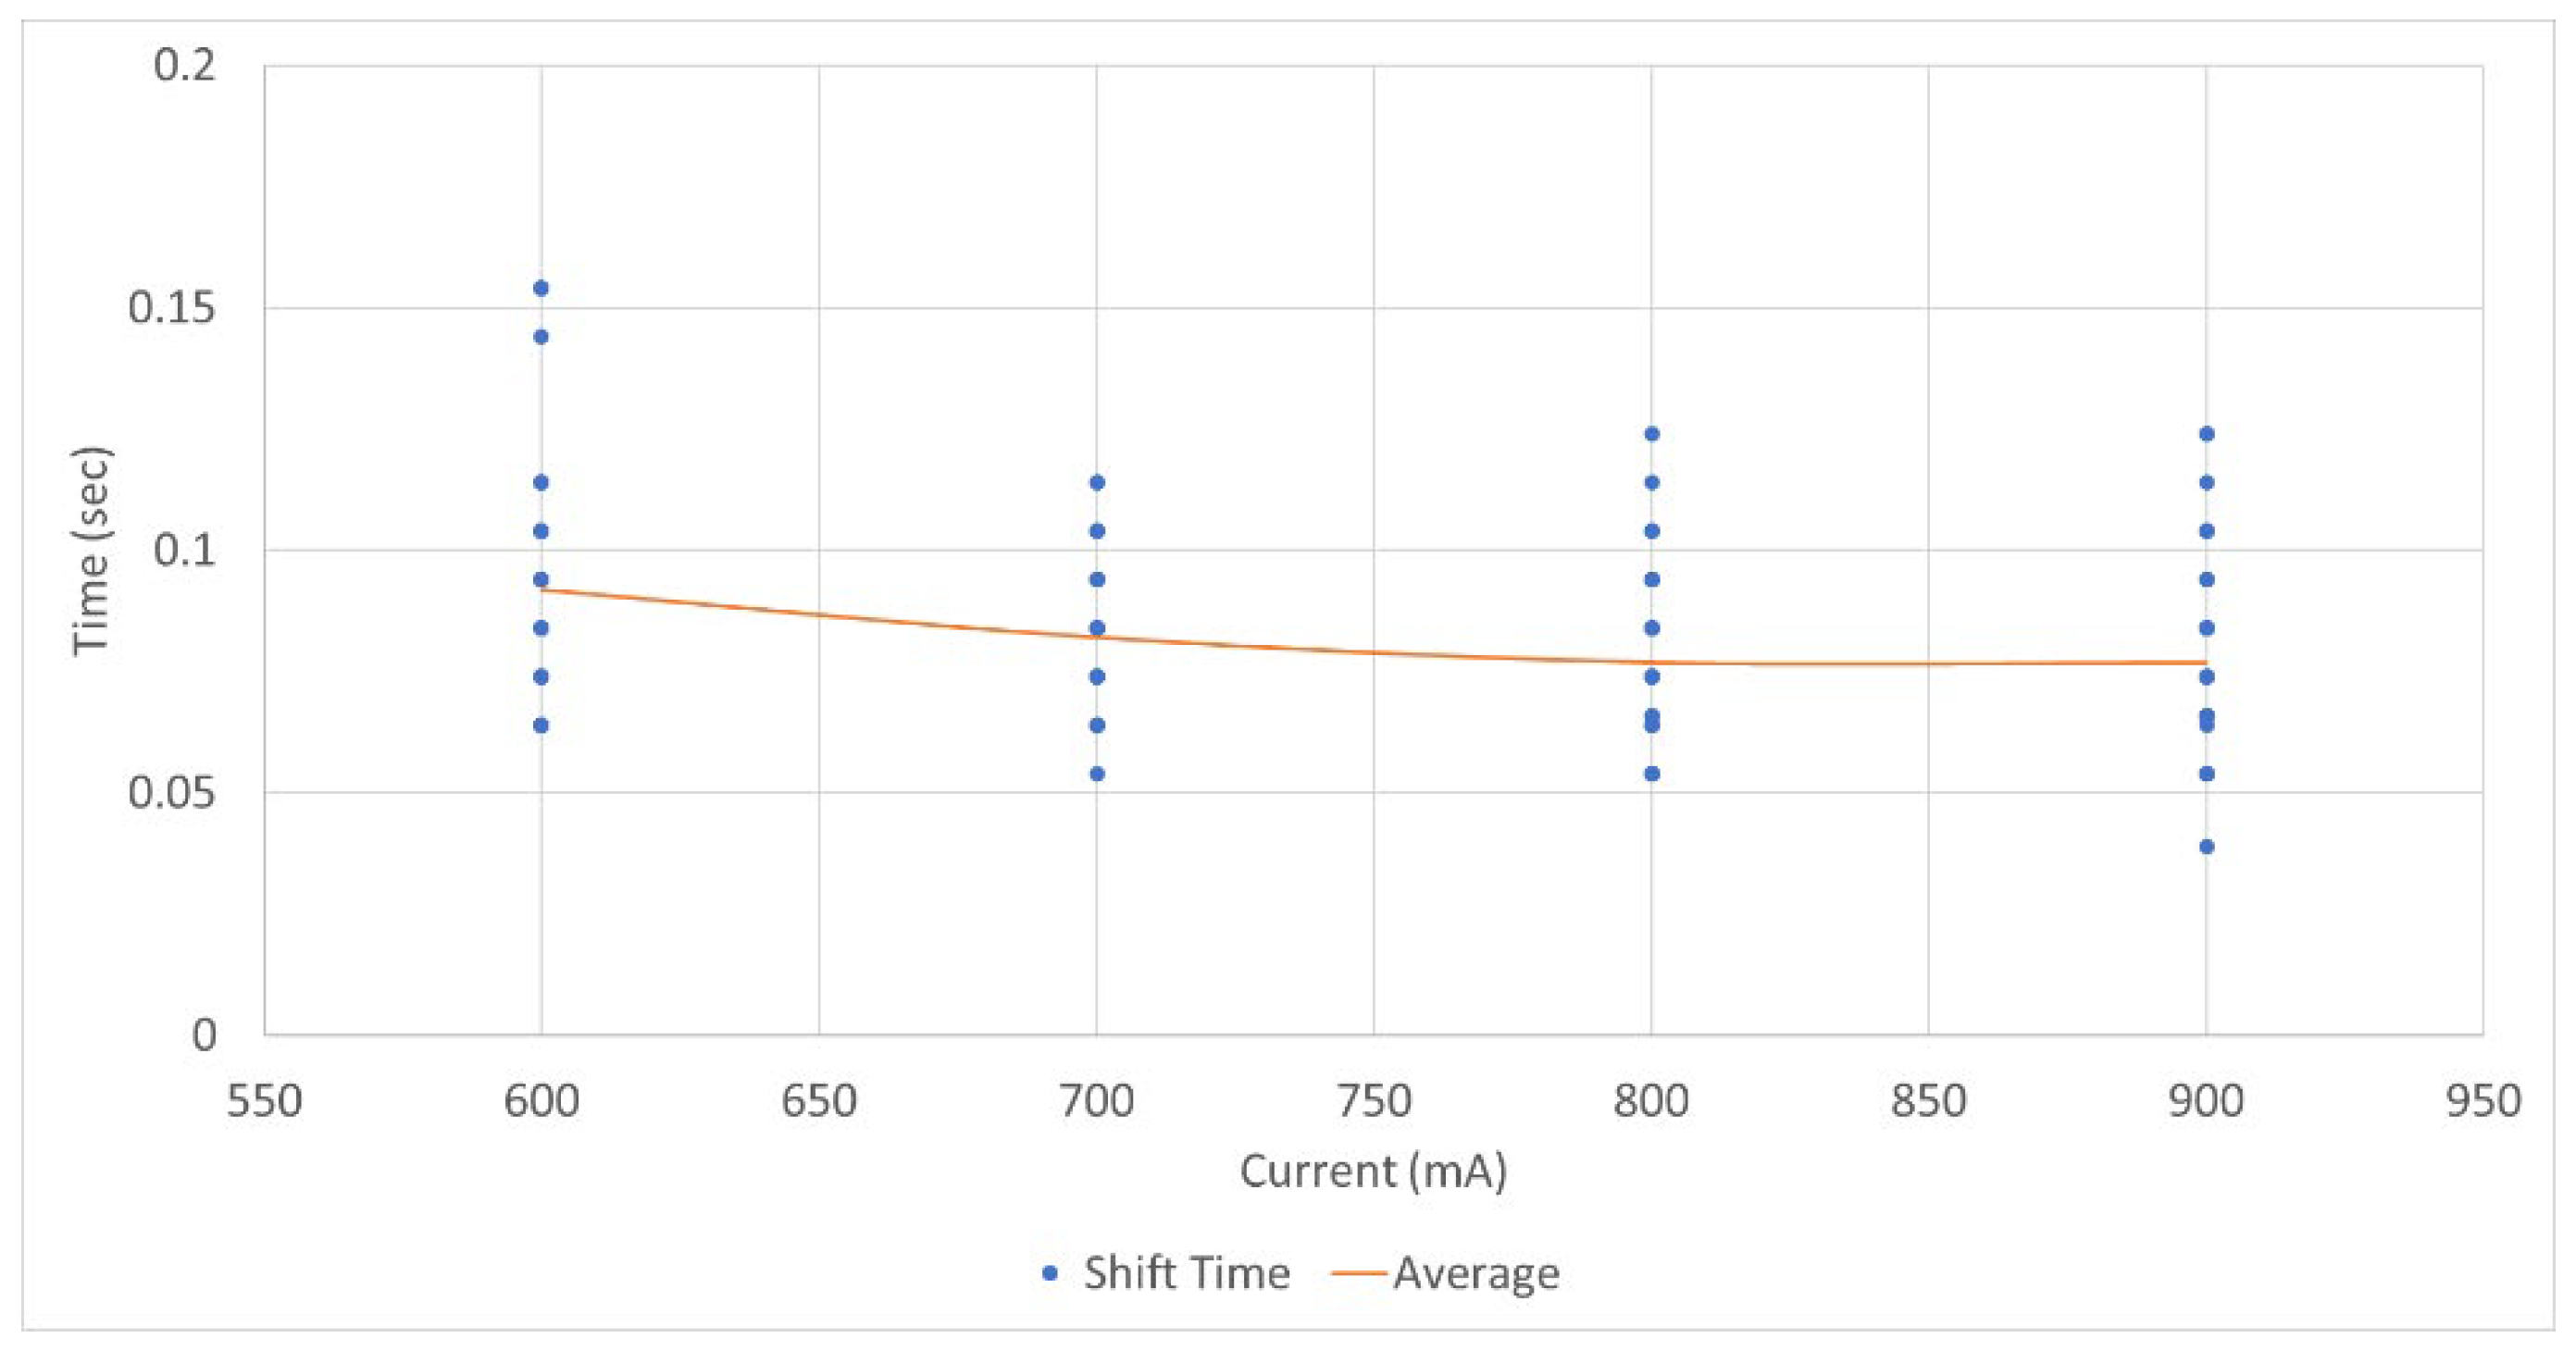
The results showing the change in shift time according to shifting force within the same shift stages are presented in
Table 24. In all cases except for 1, 2, and 4, the
p-values were higher than the significance level of 0.05, indicating that there is no average difference in shift time according to shifting force. Therefore, changes in shift time according to shifting force were observed only in some shift stages. As shown in
Figure 21, a comprehensive analysis of all data showed that as the shifting force increased from 600 mA (0.0919 s) to 700 mA (0.0821 s) to 800 mA (0.077 s) to 900 mA (0.0769 s), there was a tendency for the average shift time to decrease.
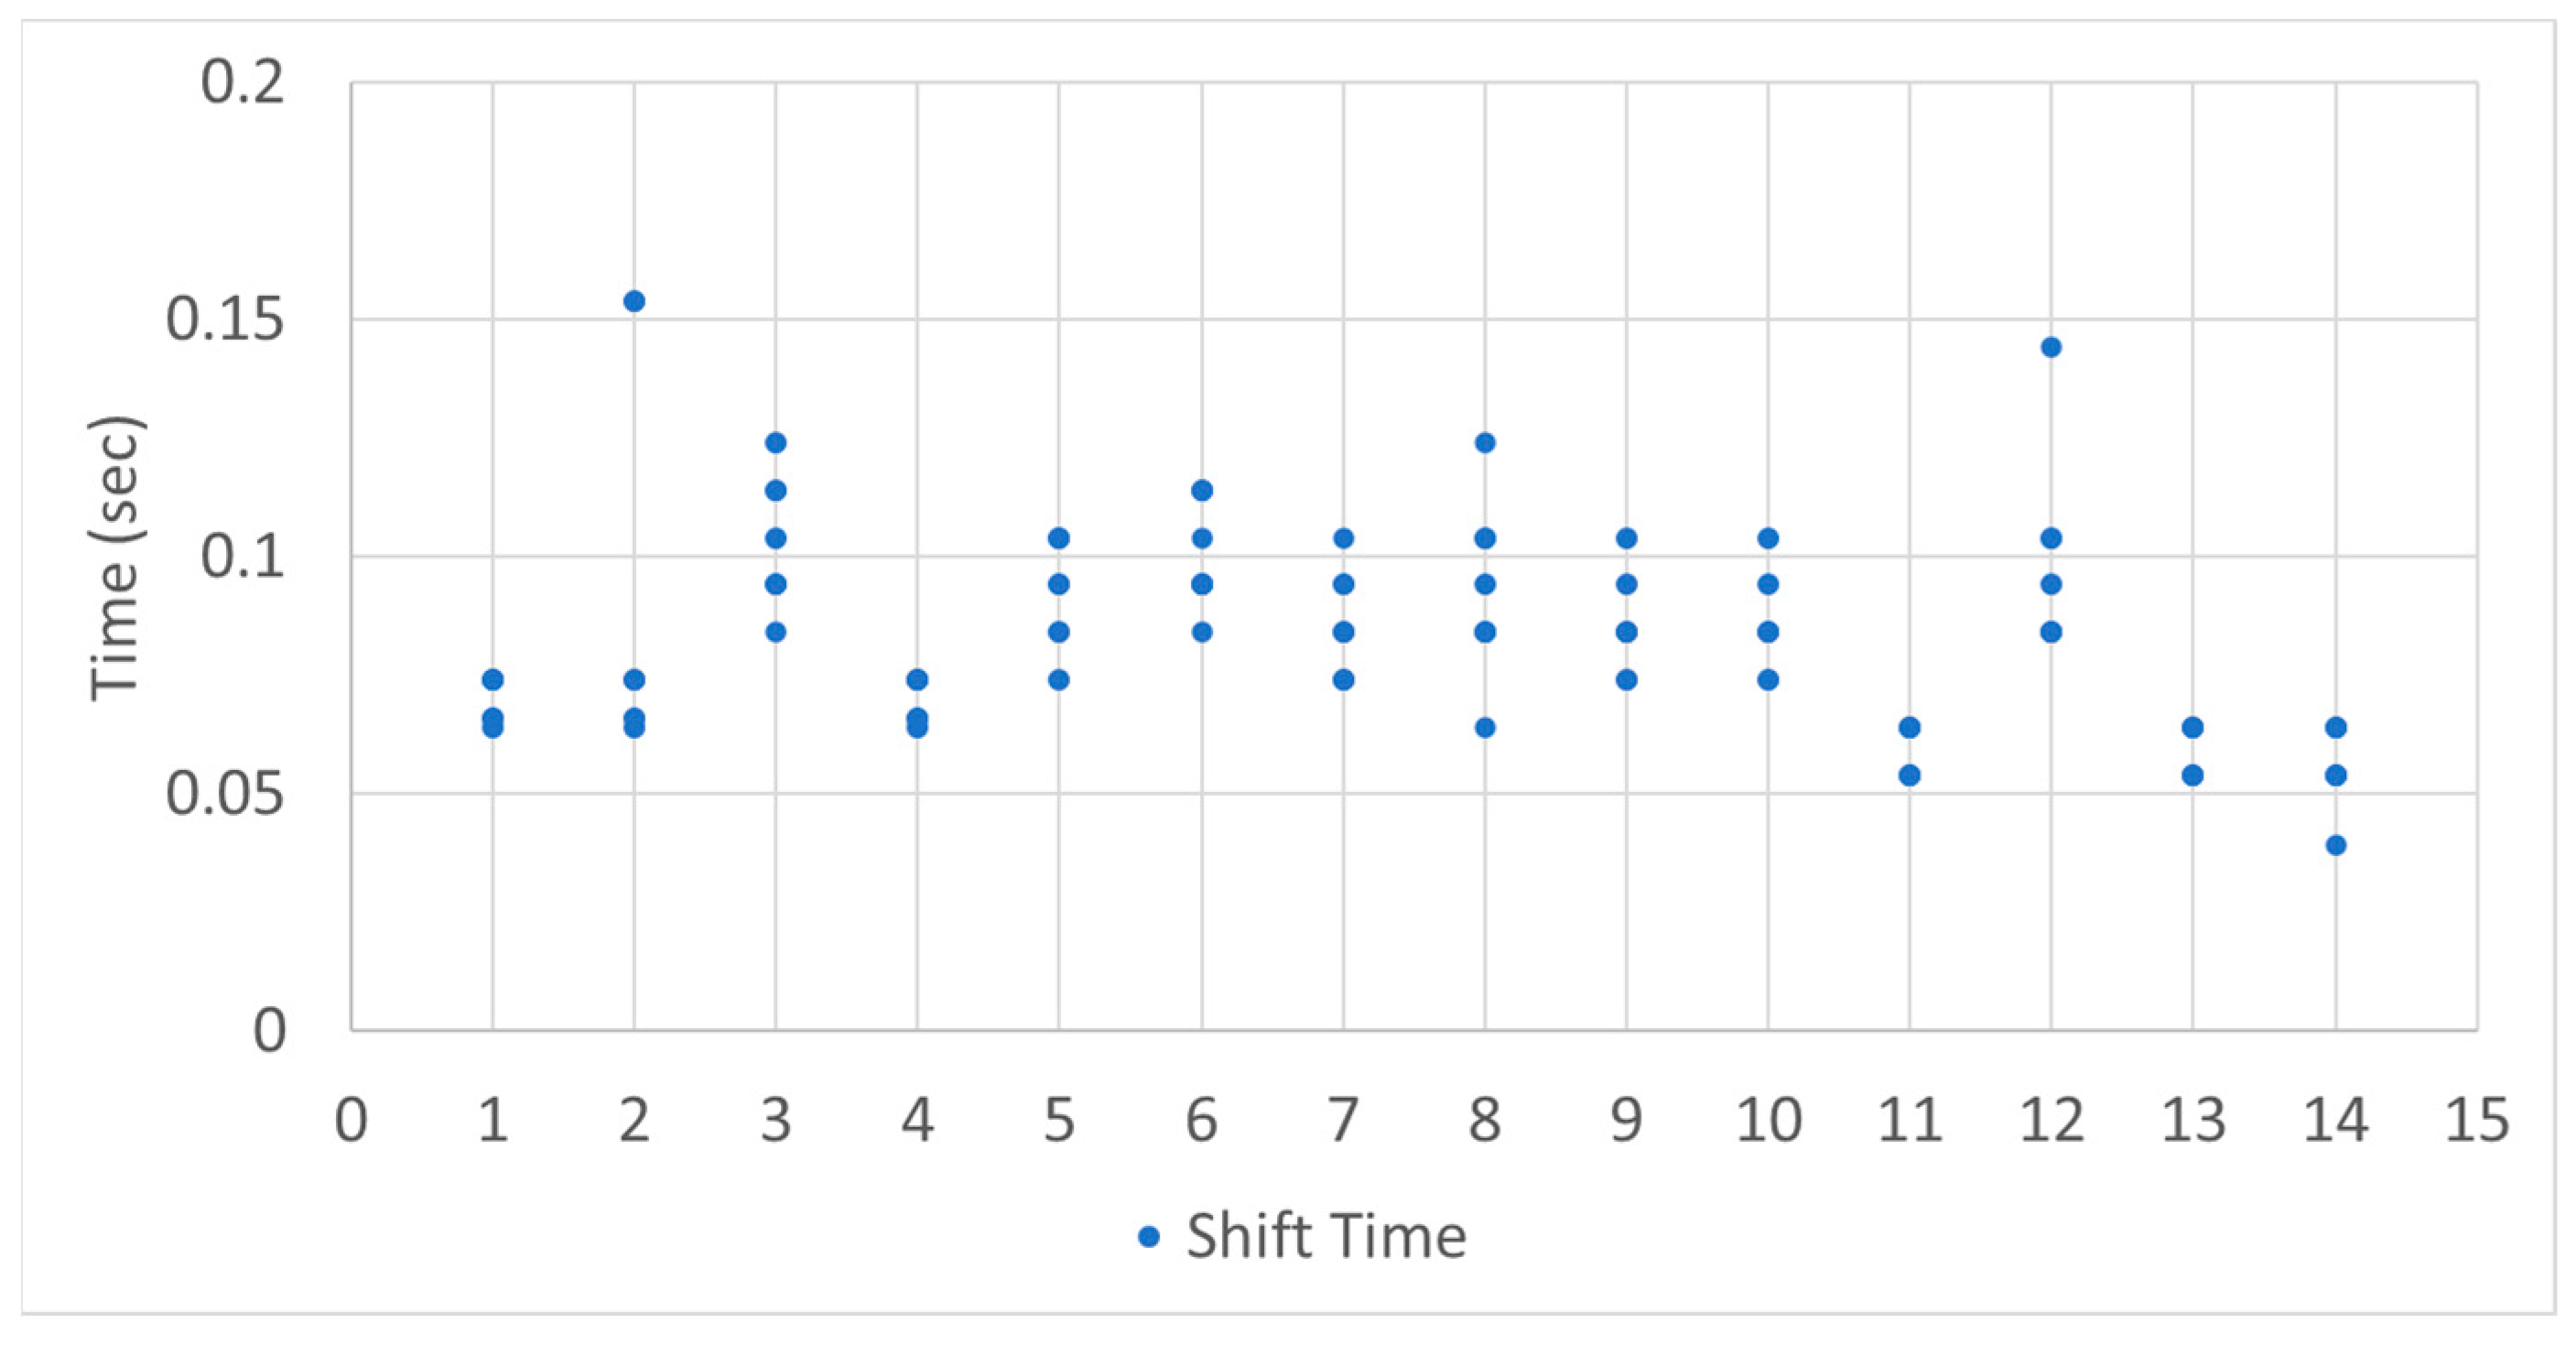
The differences in the average shift time according to shift stages within the same shifting force were analyzed as shown in
Table 25. The results showed that all conditions were statistically significant with
p-values below the significance level of 0.05. This means that there are differences in the average shift time according to the shift stages. However, a comprehensive analysis as shown in
Figure 22 reveals that all gears show a shift time within 0.06 s to 0.012 s. Therefore, since no significant differences in shift time were observed across different shift stages, it is determined that shift stages are not a factor affecting shift time.
Subsequent tests for preselection disengagement according to shift timing were conducted, and input shaft torque peak-to-peak and shift time were analyzed using one-way ANOVA. The differences in the average values of input shaft torque peak-to-peak according to shift timing are as shown in
Table 26. In Cases 3, 4, 5, 6, 12, and 14, the
p-values were below the significance level of 0.05, confirming that there are differences in the average shift time according to shift timing. In Cases 1, 2, 7, 8, 9, 10, 11, and 13, no differences were found in the average input shaft torque peak-to-peak according to shift timing. Analyzing the cases with
p-values below the significance level of 0.05, it was confirmed that the highest values of input shaft torque peak-to-peak occur immediately after preselection when the current gear is shifted to neutral. Therefore, it is determined that shift timing is a factor that can influence shift quality.
Additionally, the input shaft torque peak-to-peak according to shift stages within the same shift timing was analyzed as shown in
Table 27 and
Figure 23. The results confirmed that there are differences in the average input shaft torque peak-to-peak for each shift stage. This suggests that shift stages can be a factor affecting shift quality. Among them, Case 11 showed a higher torque fluctuation compared to other gears before and after.
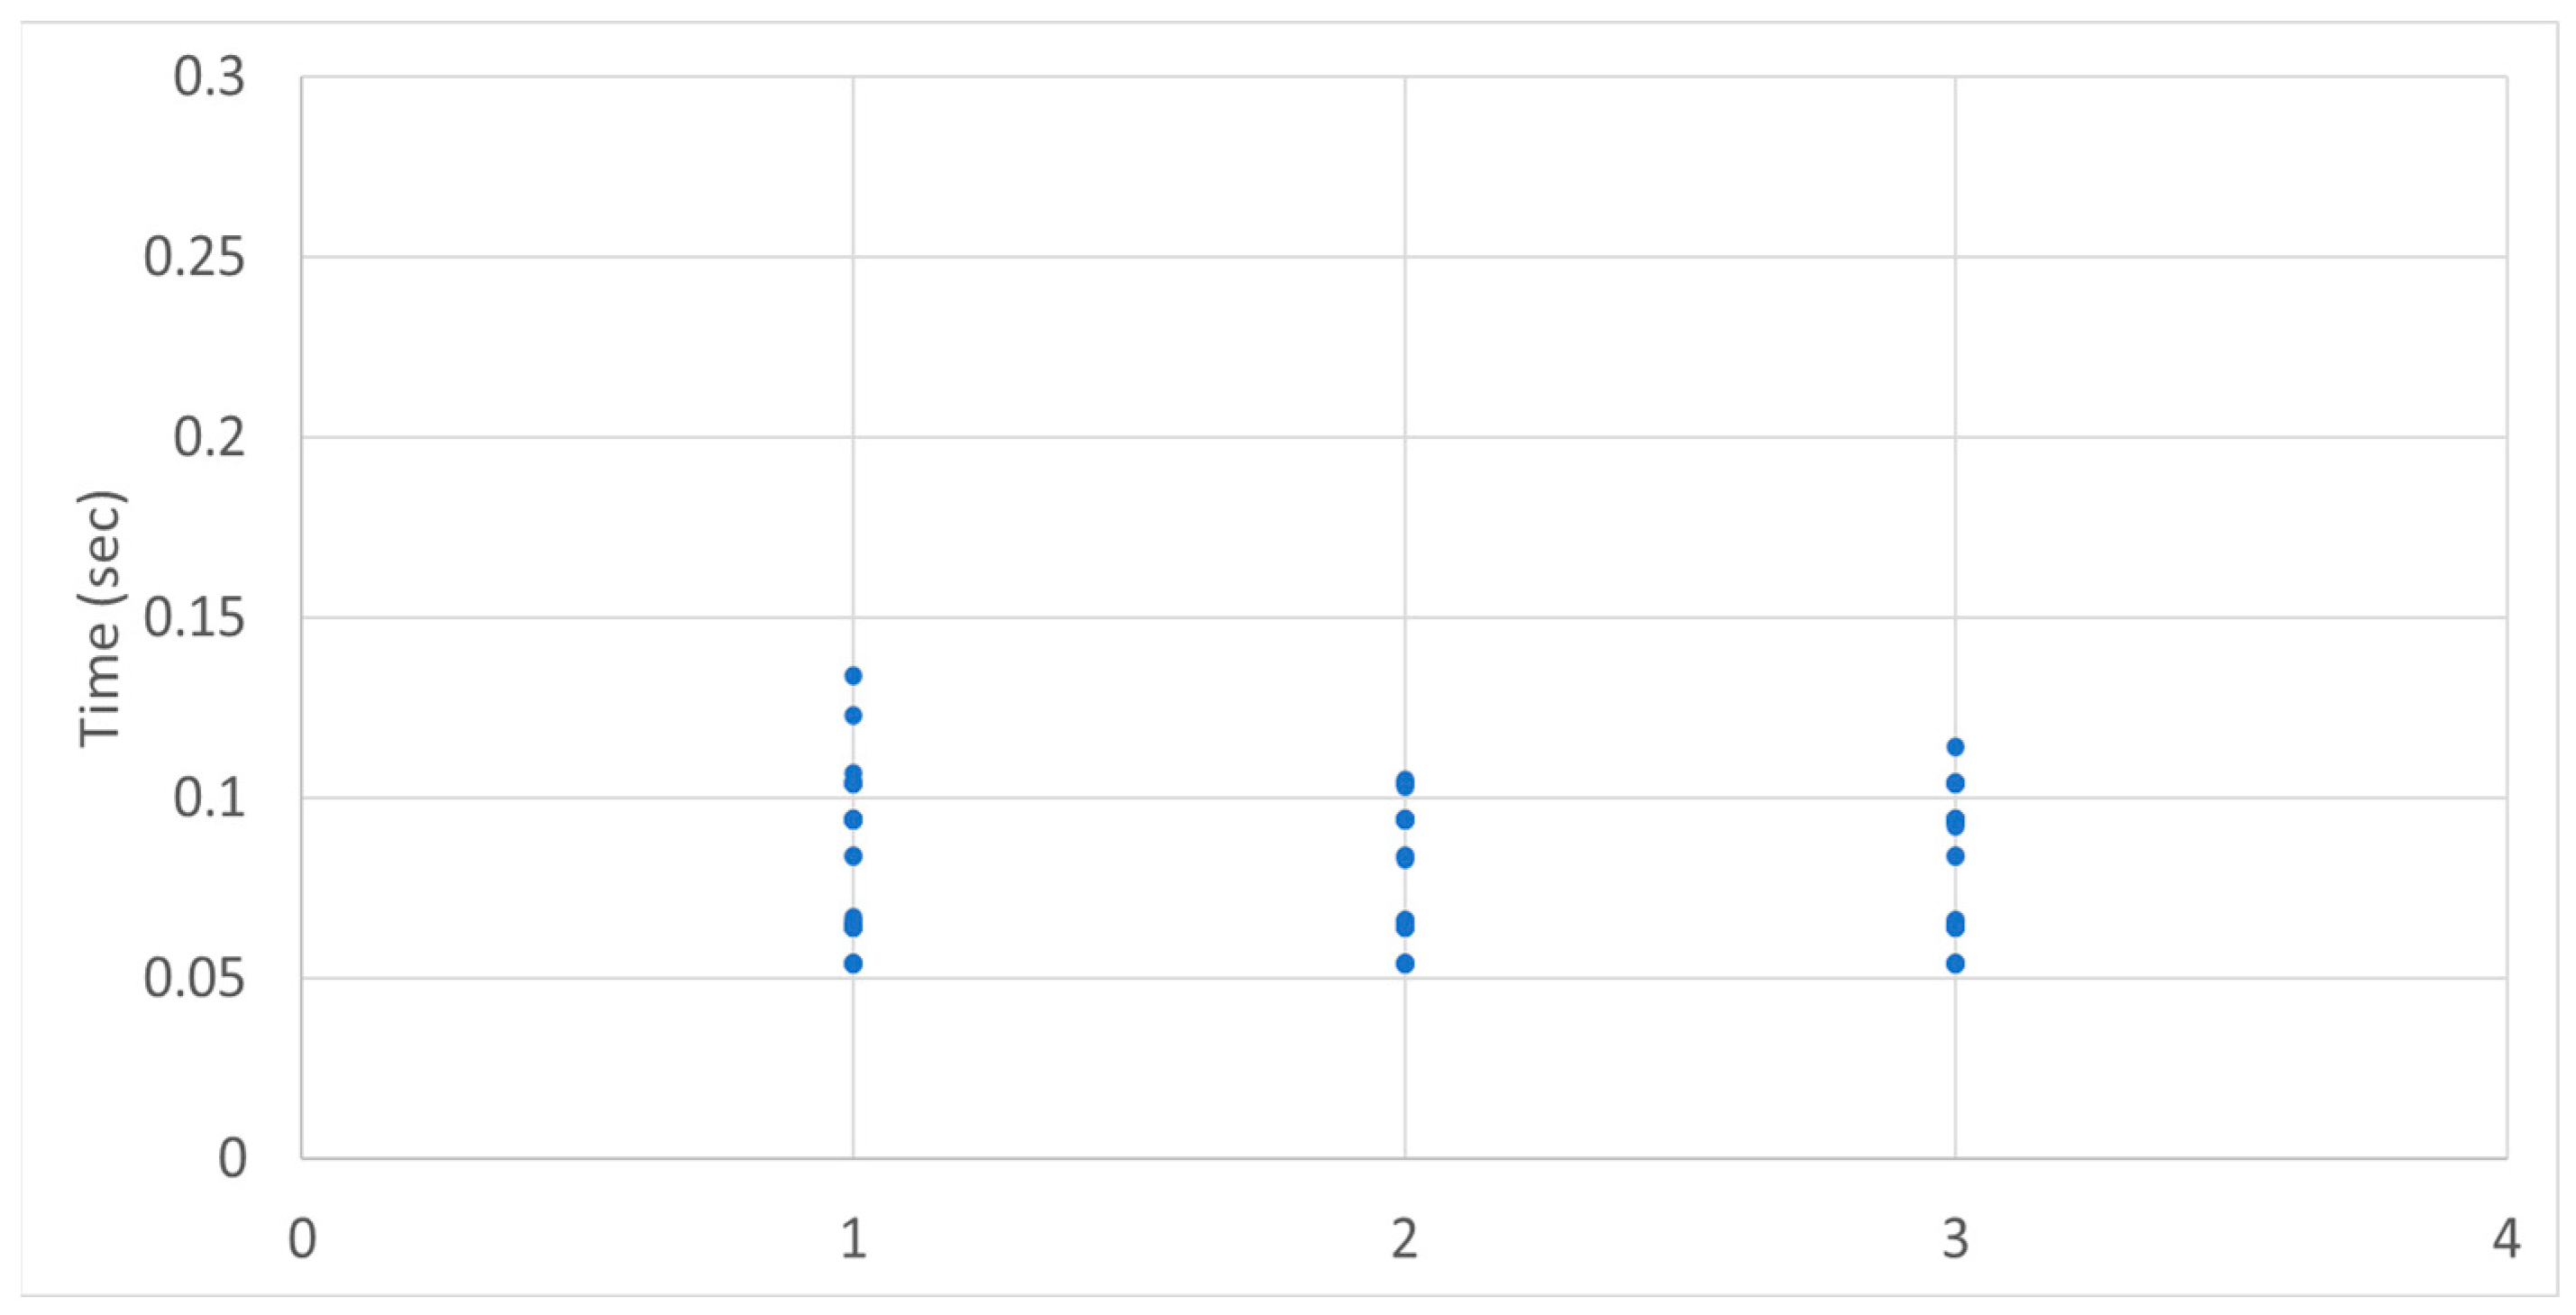
The results for shift time according to shift timing were analyzed as shown in
Figure 24. After preselection, the average shift time for neutral immediately following the shift (1) was 0.082 s, during driving at the preselected gear (2) was 0.082 s, and just before shifting from the preselected gear (3) was 0.081 s, showing no significant difference in average shift time according to shift timing. Also, as shown in
Figure 25, no correlation was found between shift stages and shift time. Therefore, it was determined that shift timing does not influence shift time.
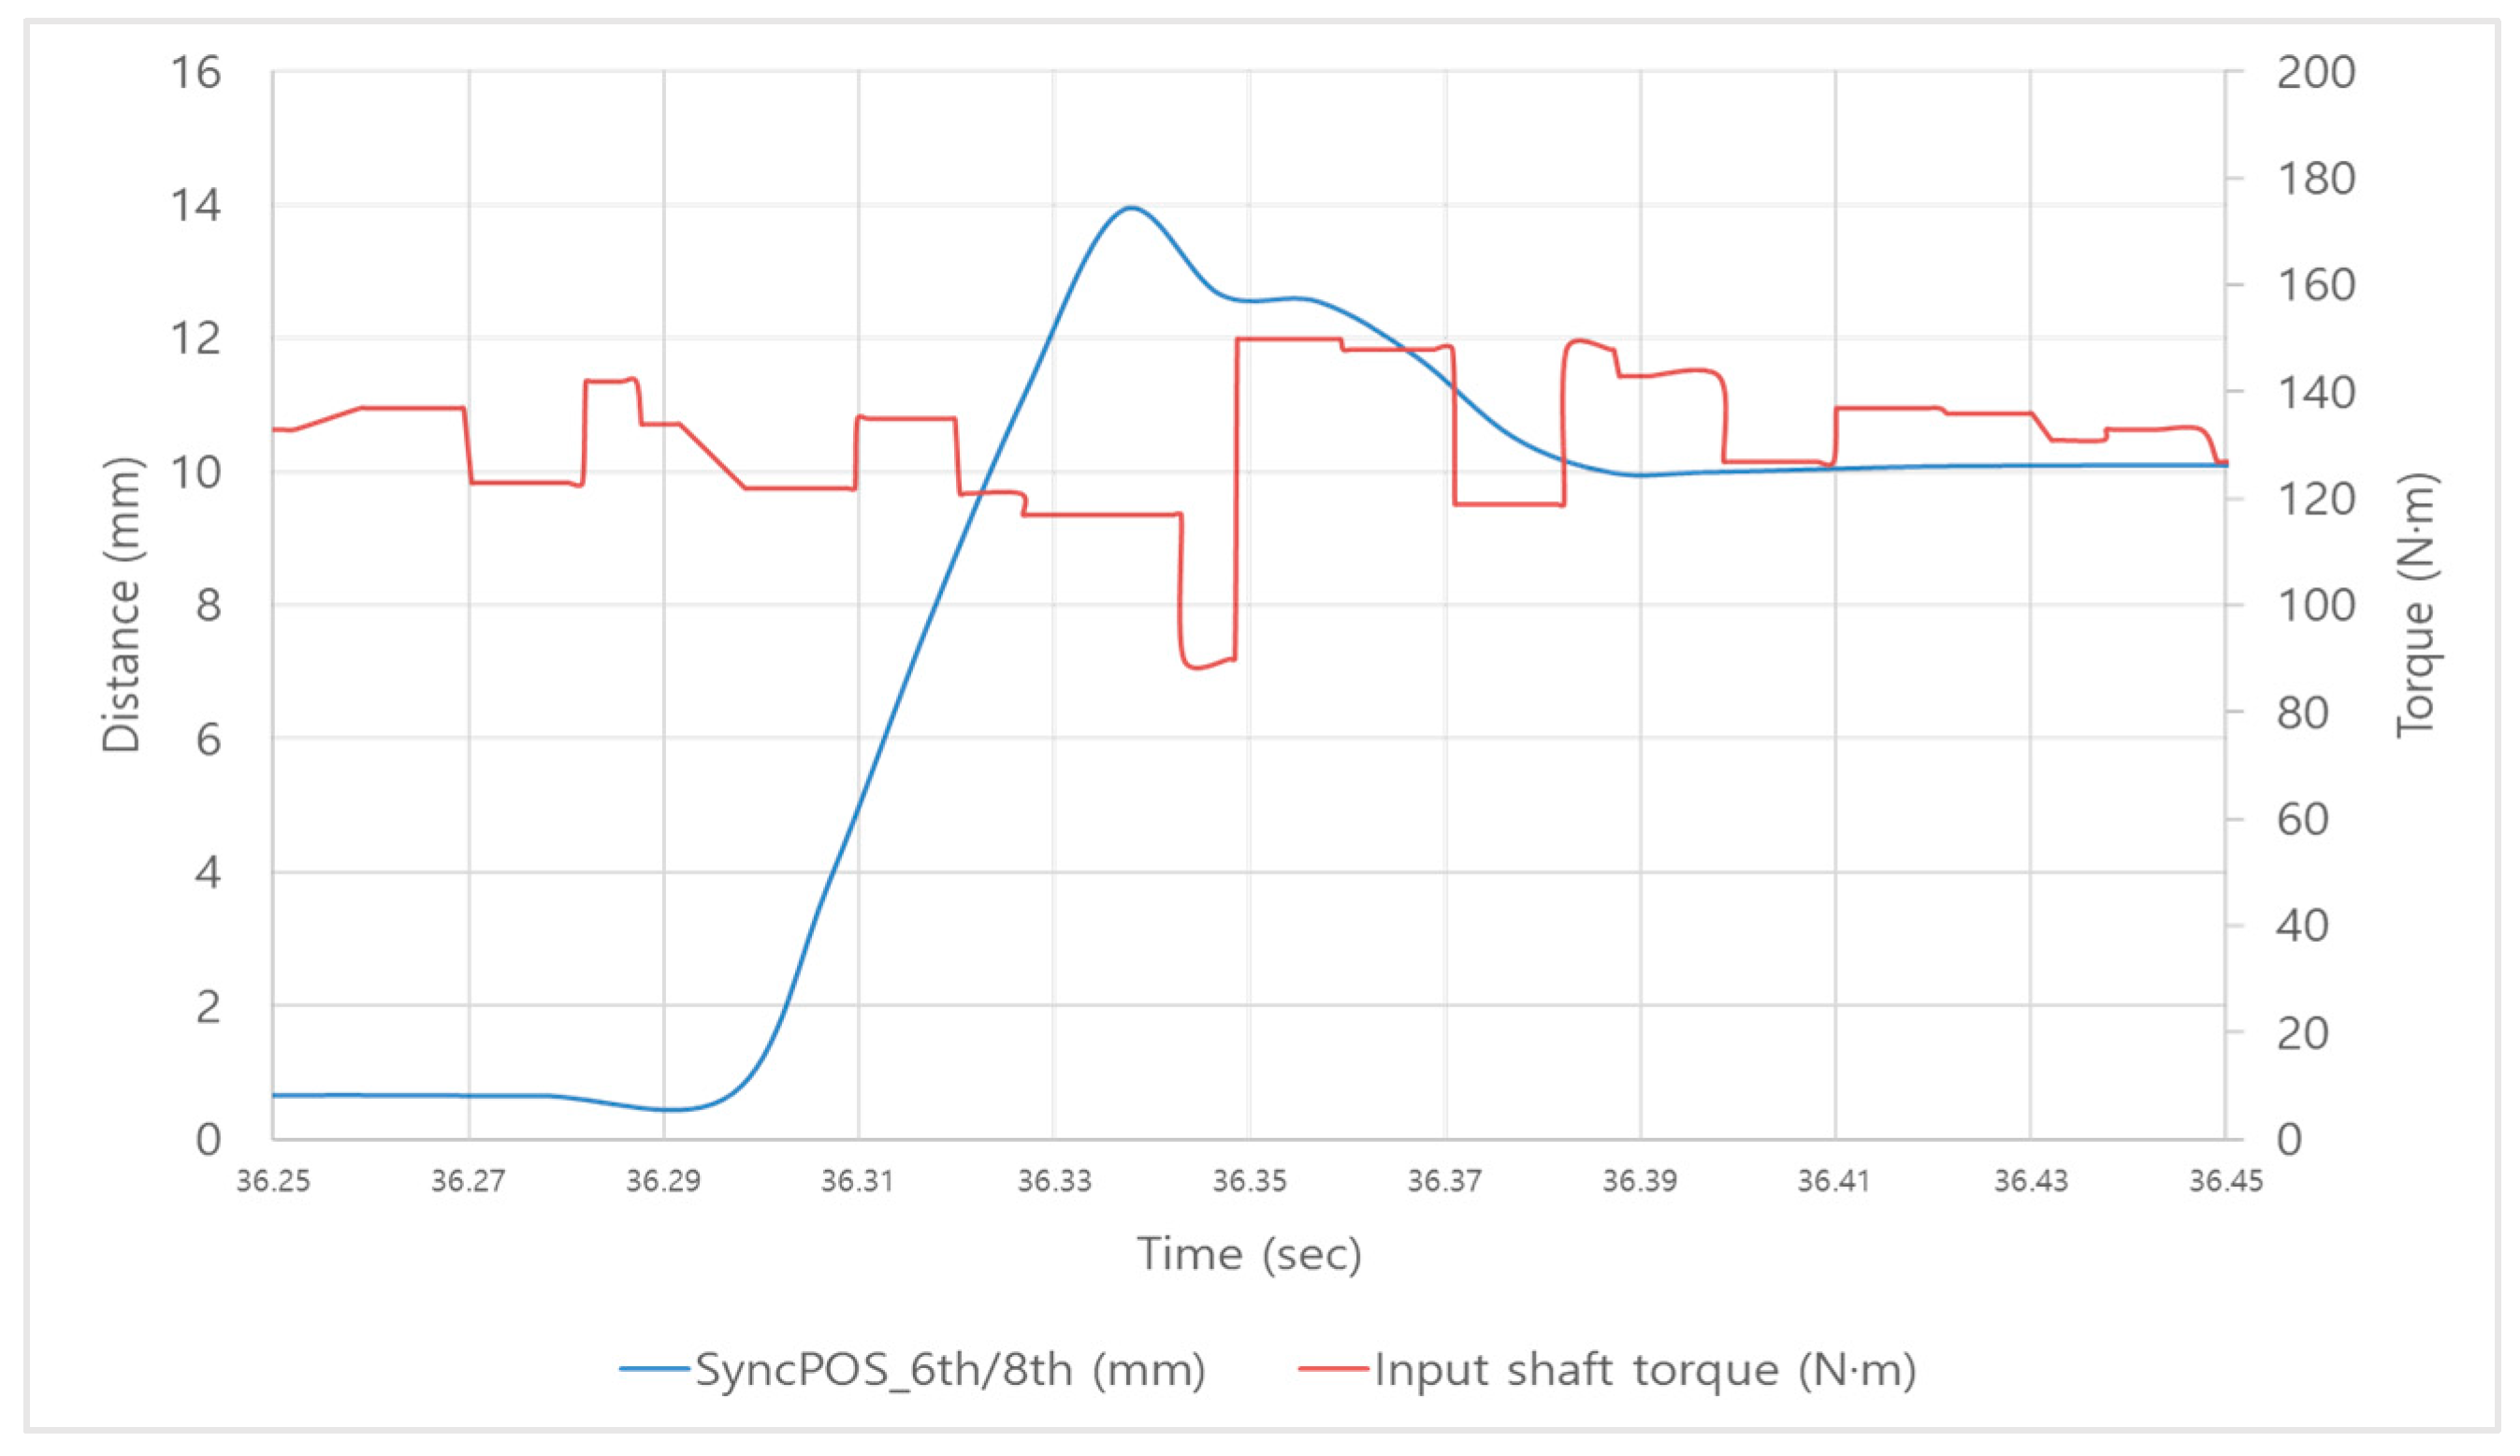
Lastly, the change in input shaft torque peak-to-peak according to the position of the synchronizer sleeve was analyzed as shown in
Figure 26 and
Table 28. Analysis of the data showed torque peak-to-peak after disengagement in all shifting processes. These fluctuations are likely caused by disengaging the gear in a short time with excessive force, leading to the gear leaving its engagement point, and the subsequent additional position control for reaching the final location causes sudden changes in the synchronizer sleeve’s position, resulting in inertia changes that cause shift shock.
In conclusion, factors to improve shift shock and shift time, which are criteria for determining shift quality, were analyzed through preselection action tests for each shift stage according to changes in shifting force and shift timing. As in
Table 29, shifting force and shift timing were adopted as factors that could influence shift shock. Shifting force was adopted as a factor that could influence shift time. However, results that occur only under specific conditions cannot be determined as factors to improve overall shift quality due to a lack of universality. Therefore, this study focused on overall trends, and it is judged that specific conditions require separate control techniques. Furthermore, an analysis based on shift stages indicated that shift stages are appropriate factors for improving shift quality as they influence both shift shock and shift time.


 ,
, 


